WRIT Monthly Time-series: Wavelets
What are wavelets
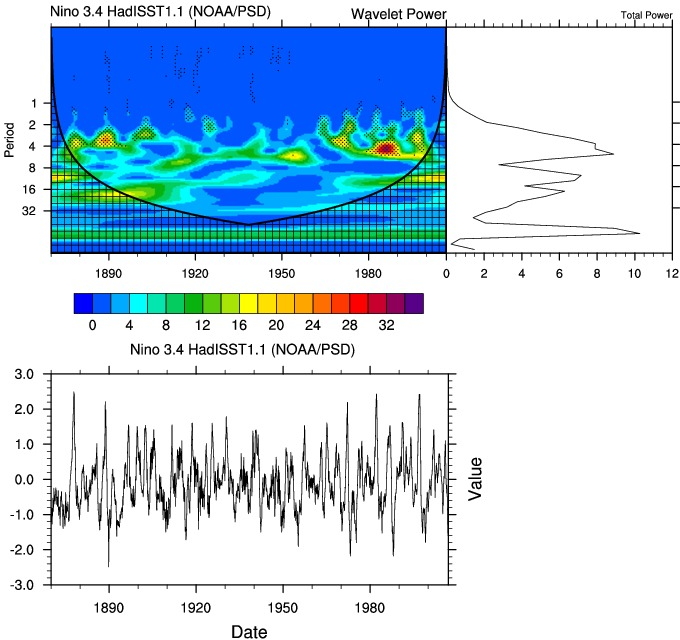
A good introduction to wavelets as used in meteorology is the CU Web-page A Practical Guide to Wavelet Analysis and the associated publication "A Practical Guide to Wavelet Analysis". Basically, wavelet analysis is a mathematical technique that can decomposes a time-series into time/frequency space simultaneously. In the plot below that analyzes the Nino 3.4 timeseries, one can see the 2-7 year ENSO period but there is also evident power at other frequencies. Note the cross-hatched U shaped curve at the bottom of the plot. This area is in the COI or Cone of Influence where values are impacted by the frequency being too short (period too long) to sample correctly over parts of the time series. As the period gets longer, the COI becomes larger. Significance (shaded) is shown for each at a time/frequency point where the normalized power is greater than 1. The time-series is lined up with the power plot on the left. The page can return the same plot but not show/use values from within the COI. note in this case the total variance is not explained by the wavelet.
Wavelet calculation
We used a NCAR NCL routine to generate the wavelet values. Of the several types of wavelet basis functions, we chose the Morlet base. Parameter used for the Morlet base are:- dt=1: The amount of time between each y value; i.e. the sampling time.
- param=6: For 'Morlet' this is k0 (wavenumber), default is 6.
- s0=6: The smallest scale of the wavelet, which is typically is equal to 2*dt. Note: for accurate reconstruction and variance computation, set s0 = dt for Morlet.
- dj=0.25: The spacing between discrete scales, which is typically equal to 0.25. A smaller value will give better scale resolution, but will be slower.
- jtot=1 + floattointeger(((log10(N*dt/s0))/dj)/log10(2.)): The integer number of scales. Scales range from s0 up to s0*2^[(jtot-1)*dj]. Most commonly, jtot is equal to: 1 + floattointeger(((log10(N*dt/s0))/dj)/log10(2.))
- npad=N The total number of points (including padding) to use for the wavelet transform. Typically, this is some power of 2. It must be greater or equal to N. If npad > N, then zeroes are padded onto the end of the time series. (Most commonly, npad = N [i.e. no padding].)
- noise=1 A value of 0 means use a white noise background for significance testing. A value of 1 means use a red noise background for significance testing. (Most commonly, noise = 1.)
Wavelet options
Currently, users can use monthly time-series (either mean or anomaly). Seasonal values are not yet available. No values can be missing for the FFT calculation. So users need to choose full years of data.
Citations
- Torrence, C., and G. P. Compo, 1998: A practical guide to wavelet analysis. Bull. Amer. Meteor. Soc., 79, 61–78.
- Software: we suggest that people put the following into their acknowledgements: "Wavelet software was provided by C. Torrence and G. Compo, and is available at URL: http://atoc.colorado.edu/research/wavelets/".
- Image: "Image provided by the NOAA/ESRL Physical Sciences Laboratory, Boulder Colorado from their web site at https://psl.noaa.gov/".
- Also cite the dataset or the time-series used.