![Modal Image]()
Methods:
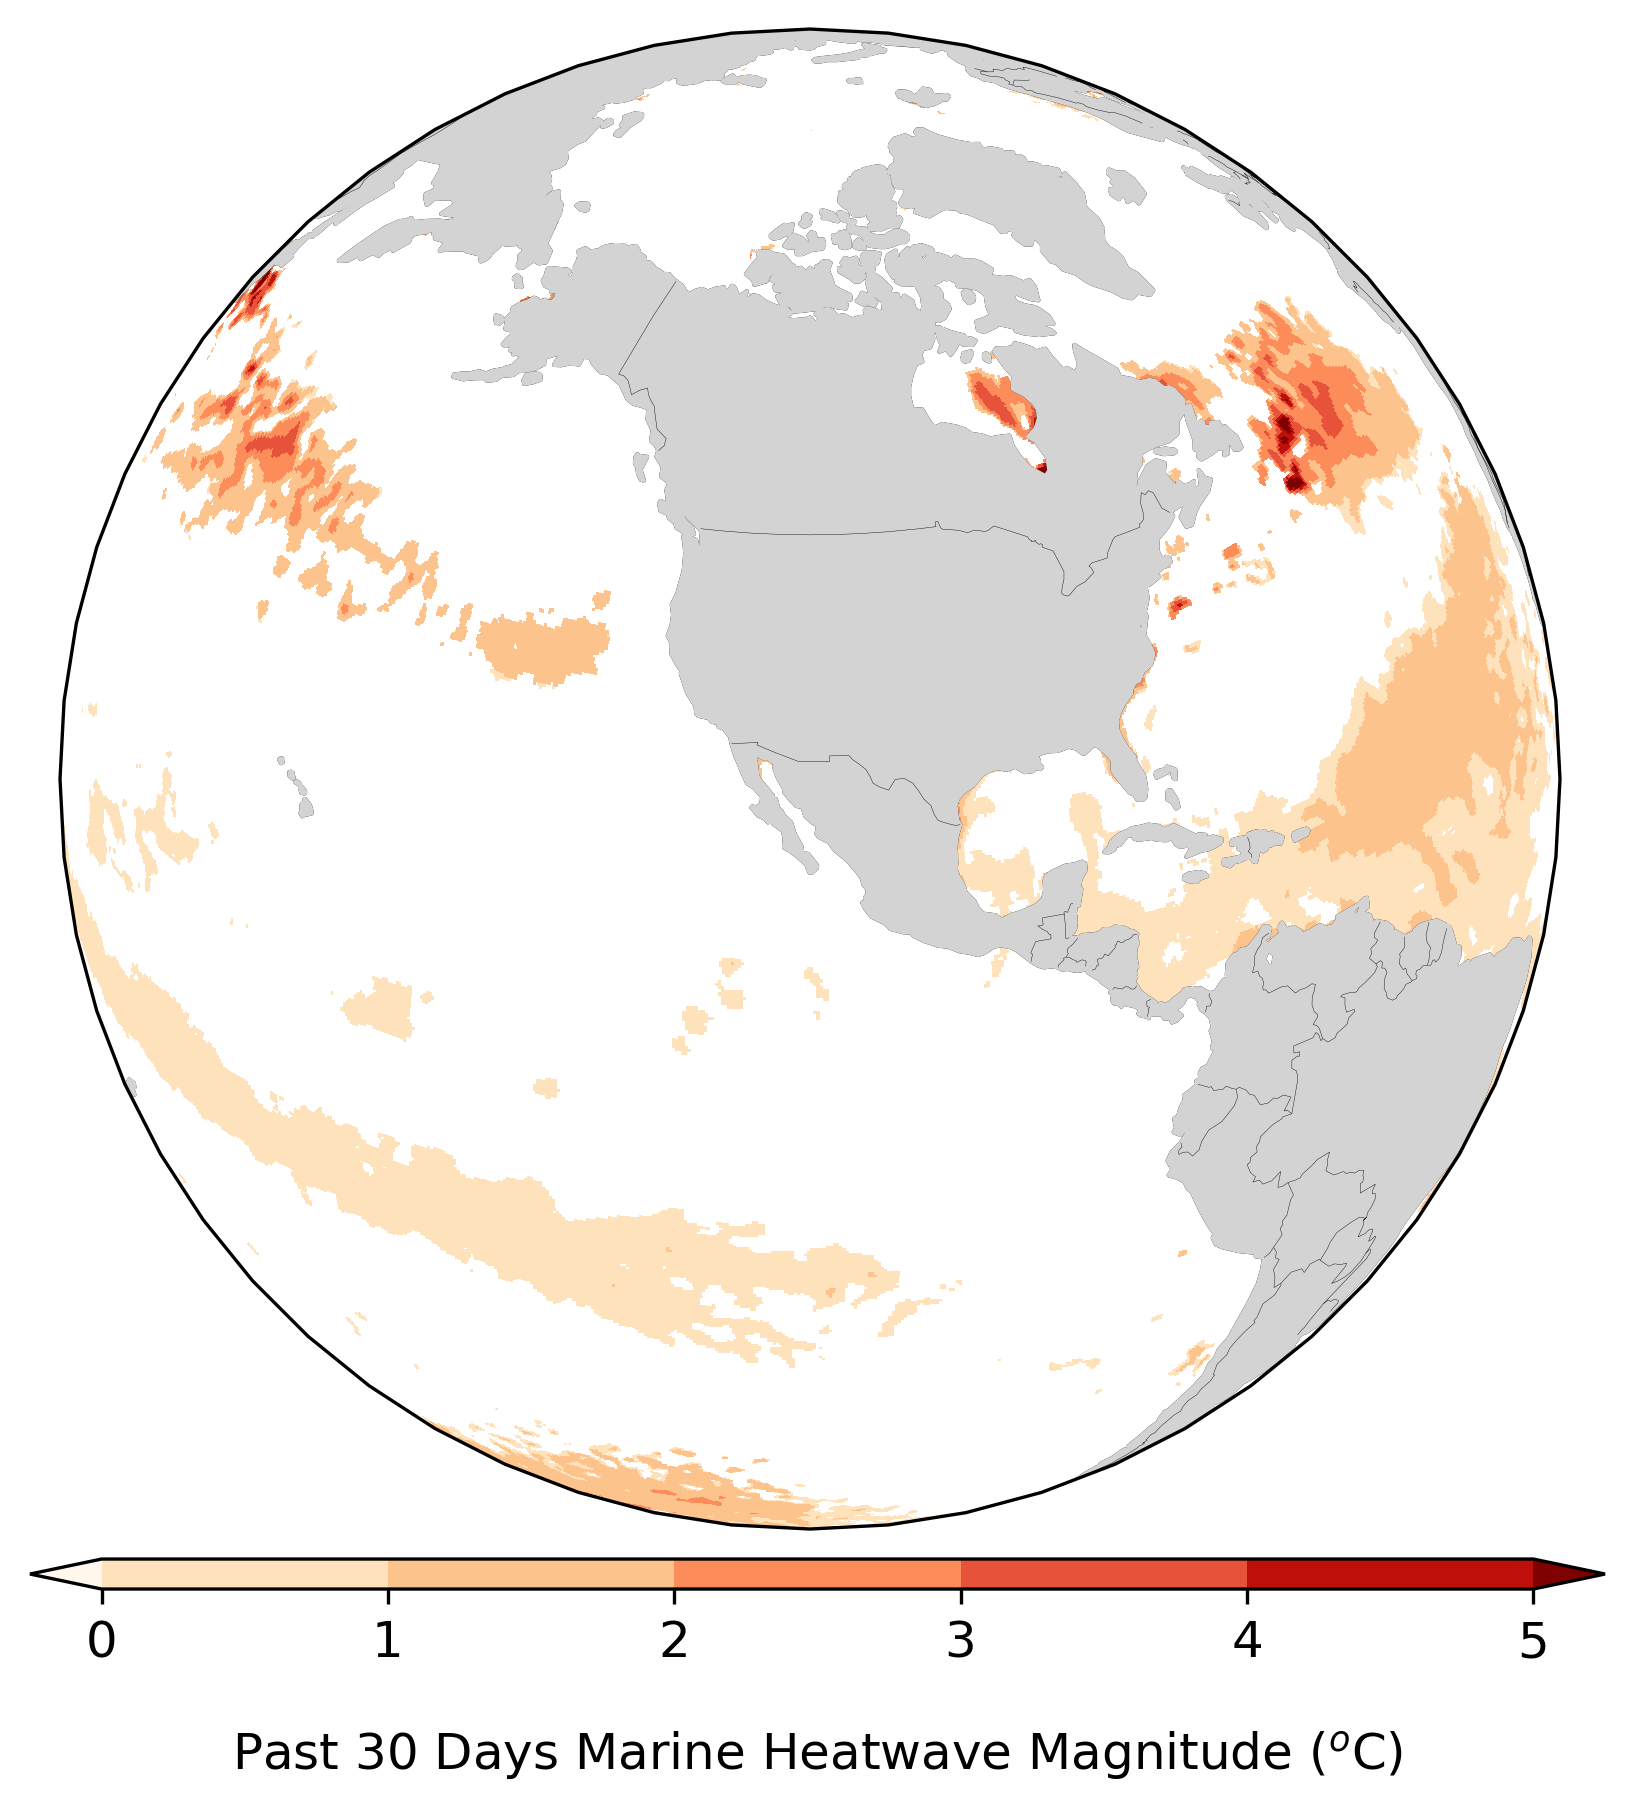
The magnitude of marine heatwaves (MHW) in the past 30 days is calculated using the daily OISSTv2 high-resolution sea surface temperature (SST) dataset hosted at PSL.
You can access the dataset at PSL data server.
The magnitude represents the 30-day mean of the daily SST anomaly.
The daily climatology and linear trend is based on the period of 1991-2020.
To establish the threshold for identifying MHW events, we adopt a method inspired by the 3-month window approach described in the study by
Jacox et al..
As the "past 30 days" might not fall within the same month, we employ a compromise by using a 90-day window instead.
For each year going back to 1991, we calculate three consecutive 30-day means within this 90-day window.
The resulting 30-day means are then utilized to determine the MHW threshold, which corresponds to the 90th percentile.
For example, on June 30, 2023, the past 30-day mean will encompass the period from June 1, 2023, to June 30, 2023.
For each previous year, the 90-day window will consist of three consecutive 30-day means spanning from May 2 to May 31, June 1 to June 30, and July 1 to July 30.
Based on the threshold determined using the 90-day window approach, all 30-day mean SST anomalies that are higher than the threshold are shown on the map,
indicating the areas experiencing marine heatwaves and the corresponding magnitudes.