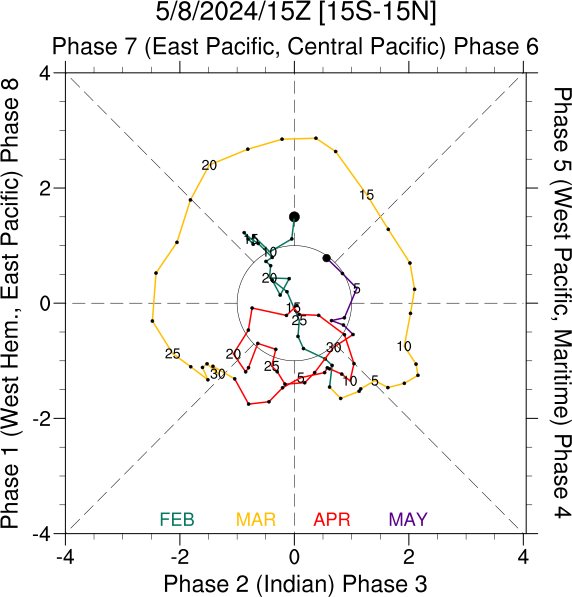
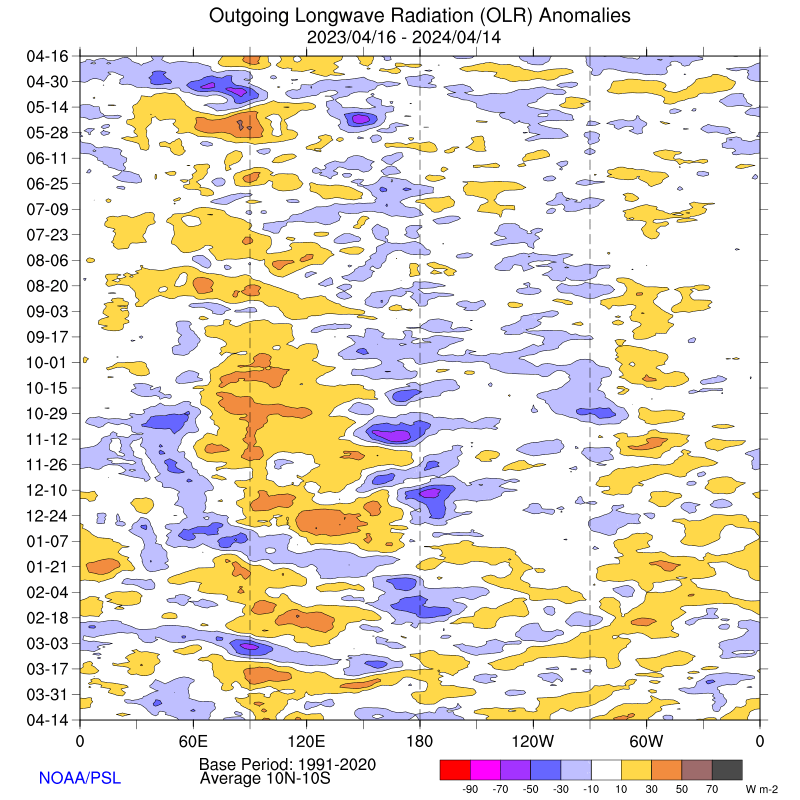
ROMI phase diagram for the latest 90 days
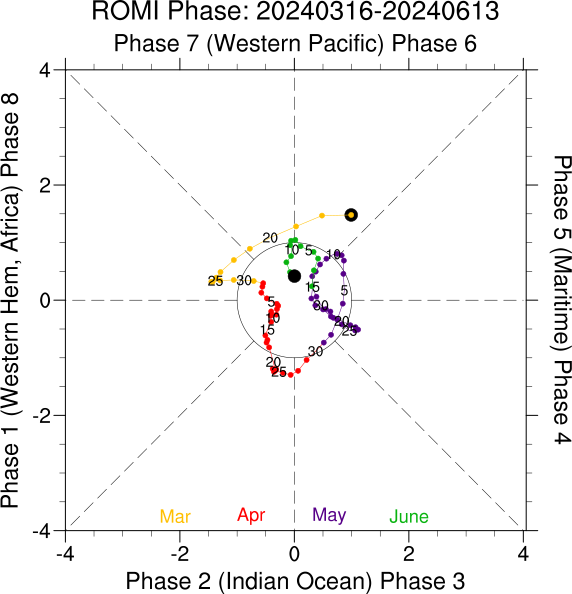
ROMI is computed using OLR only and as such is a purely
convective index of the MJO. The EOFs depend on the day of year, latitude and longitude. To plot the diagram in
the same phase space as the Wheeler-Hendon RMM index, the sign of ROMI PC1 is reversed and the PC ordering is
switched, so that ROMI(PC2) is analogous to RMM(PC1) and -ROMI(PC1) is analogous to RMM(PC2).
RMM phase diagram for the latest 90 days
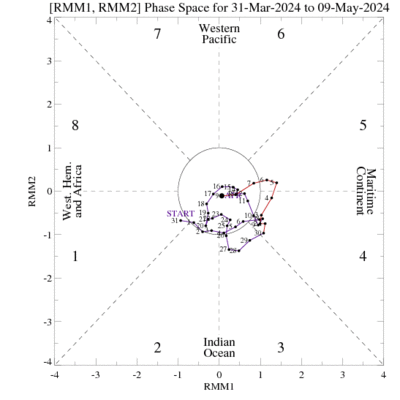
The RMM is provided by the Bureau of
Meteorology Australia. RMM is computed using
interpolated OLR from
PSL and 850hPa and 200hPa zonal winds from the NCEP reanalysis.
The EOFs only depend on longitude.