Lesley L. Smith – US Extreme Precipitation and Temperature
All plots preliminary. Older plots here.
Season or day of year for wettest day analyses here. Precipitable Water Analysis here
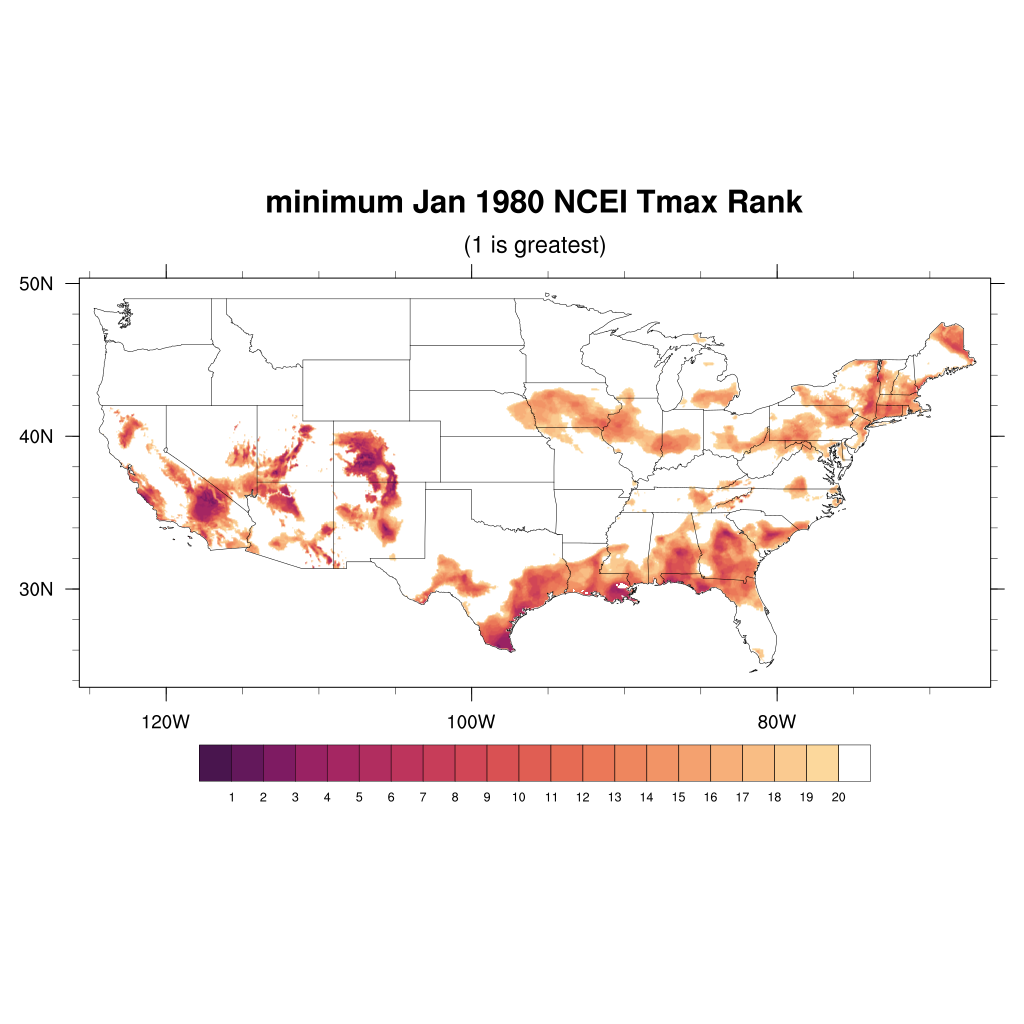
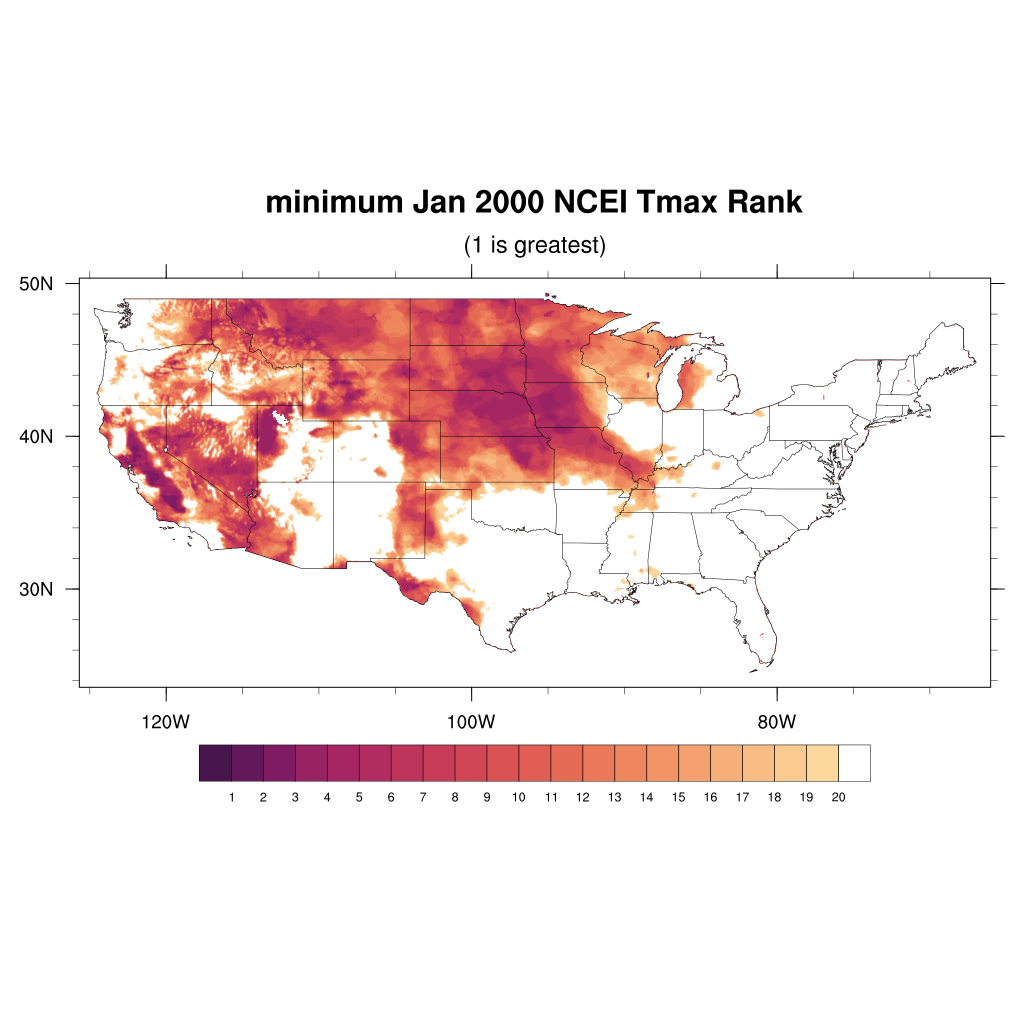
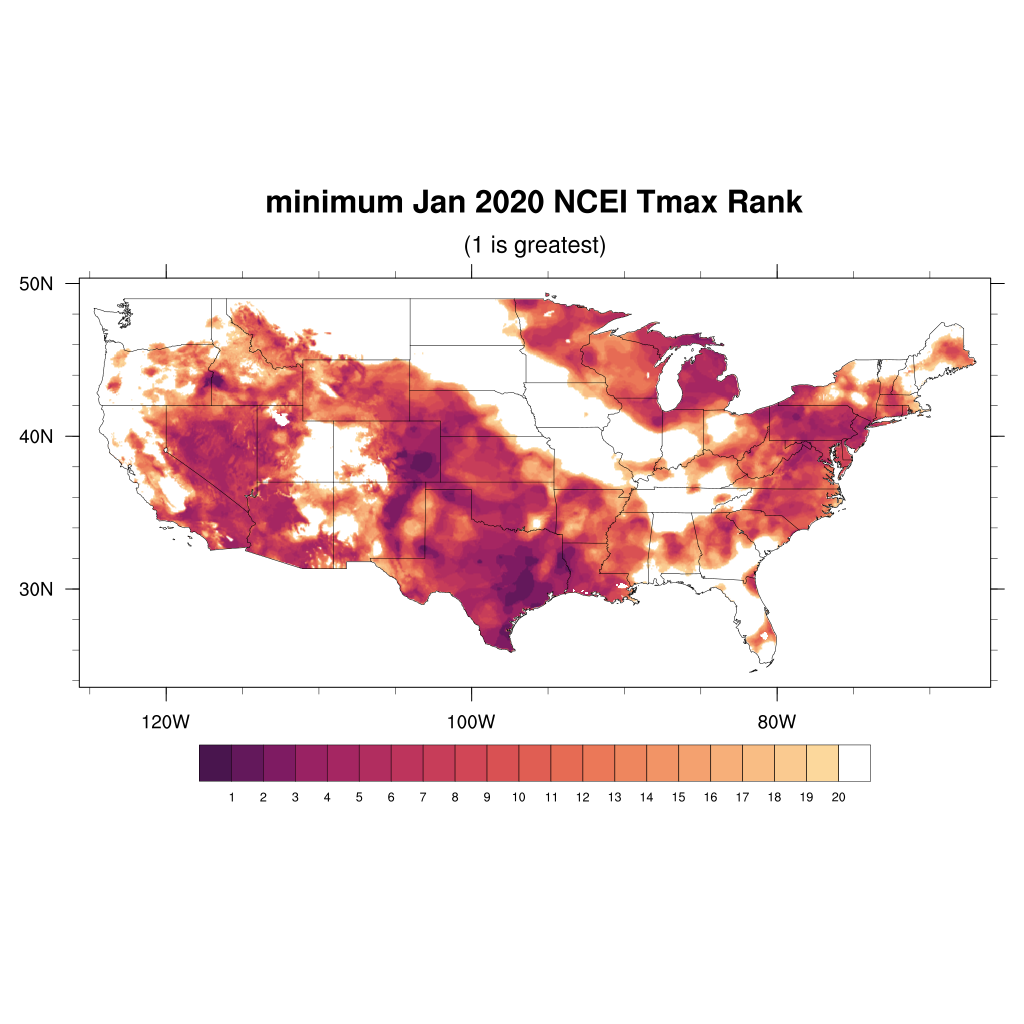
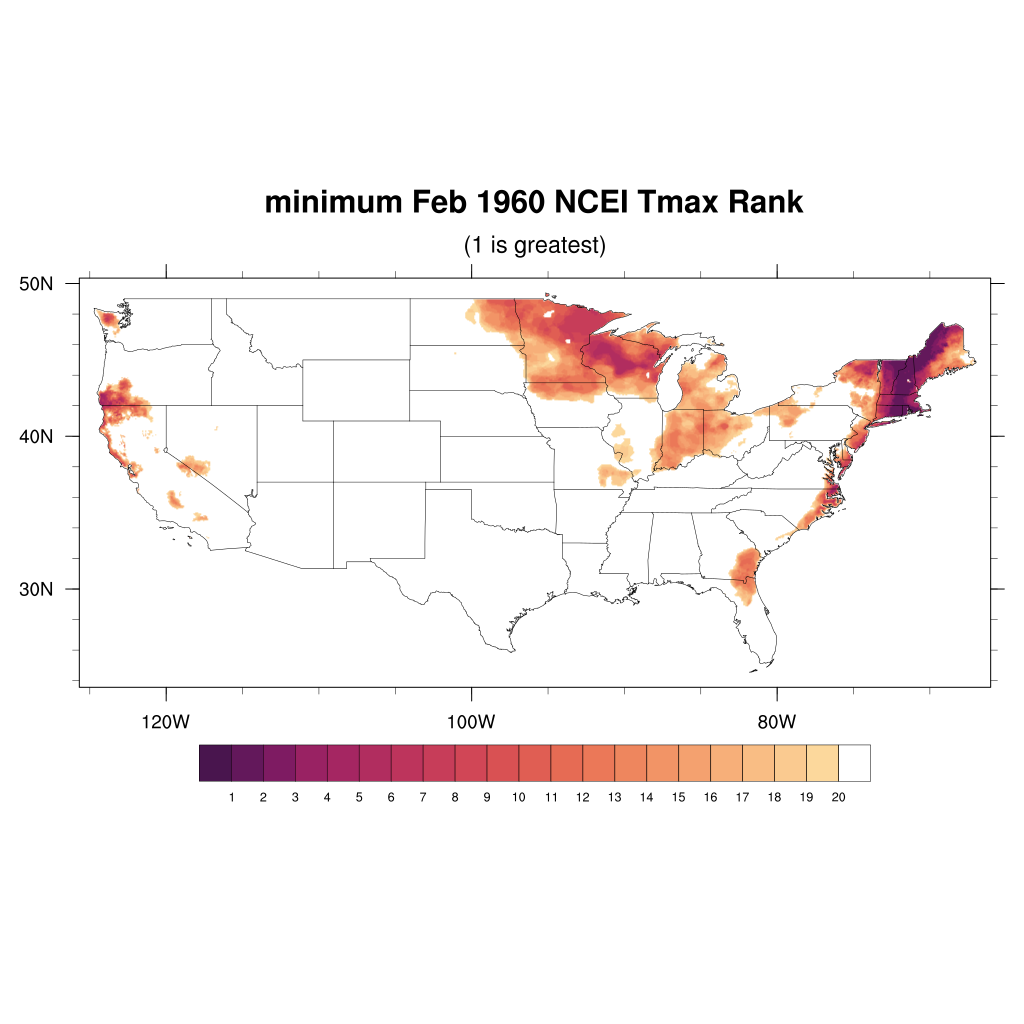
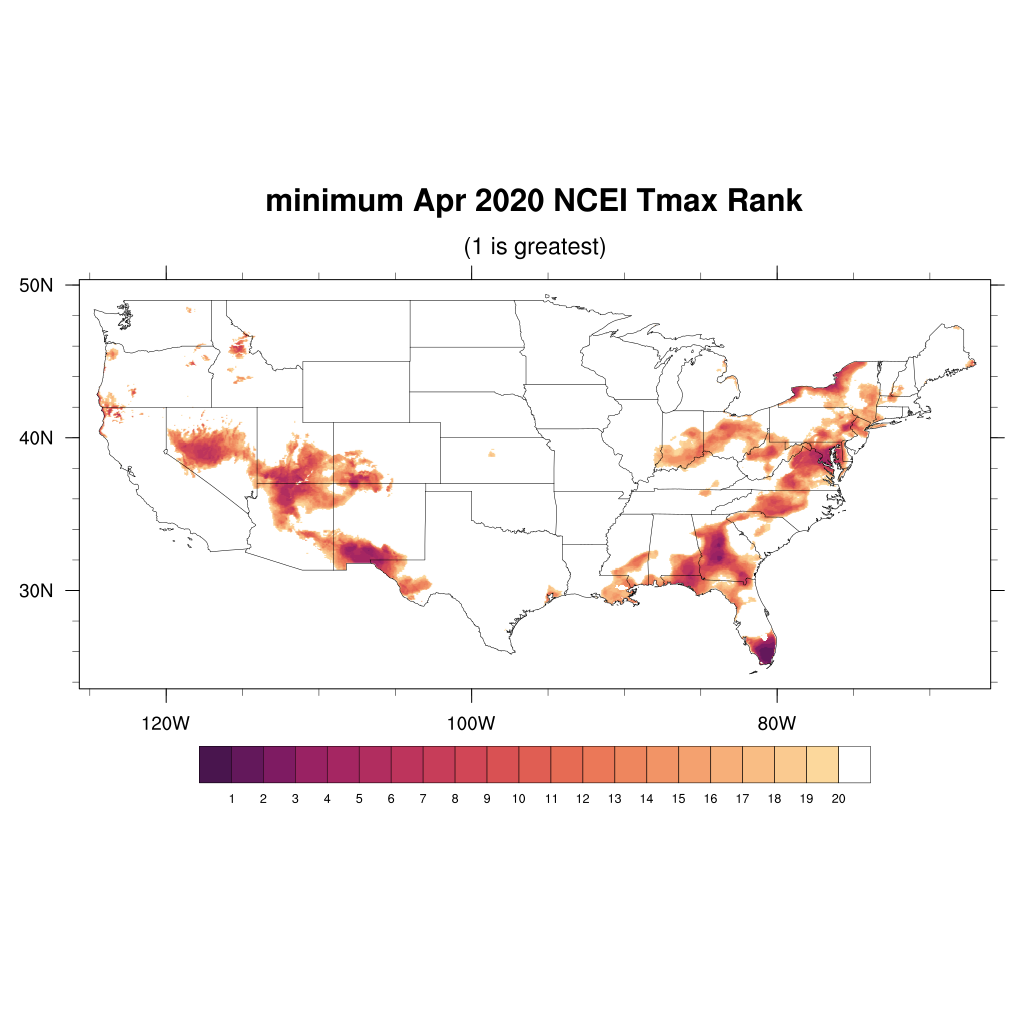
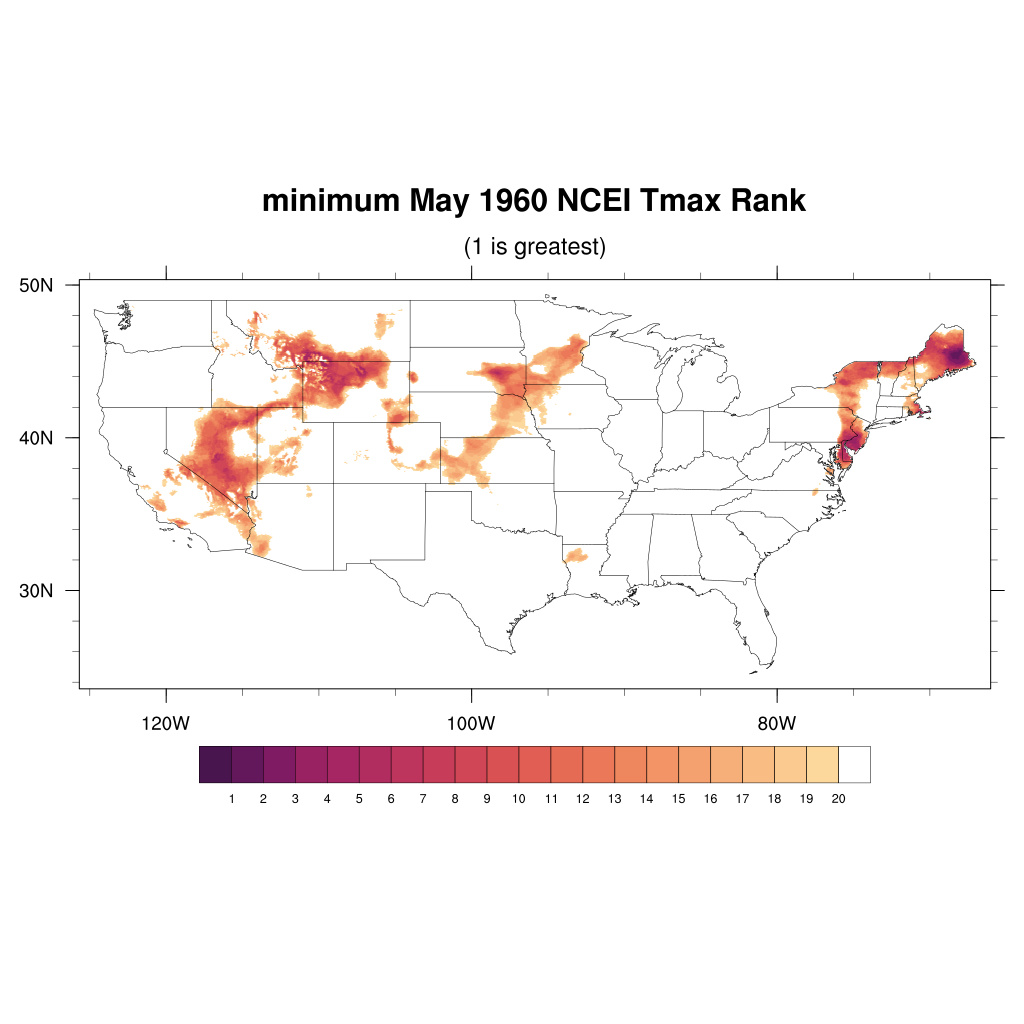
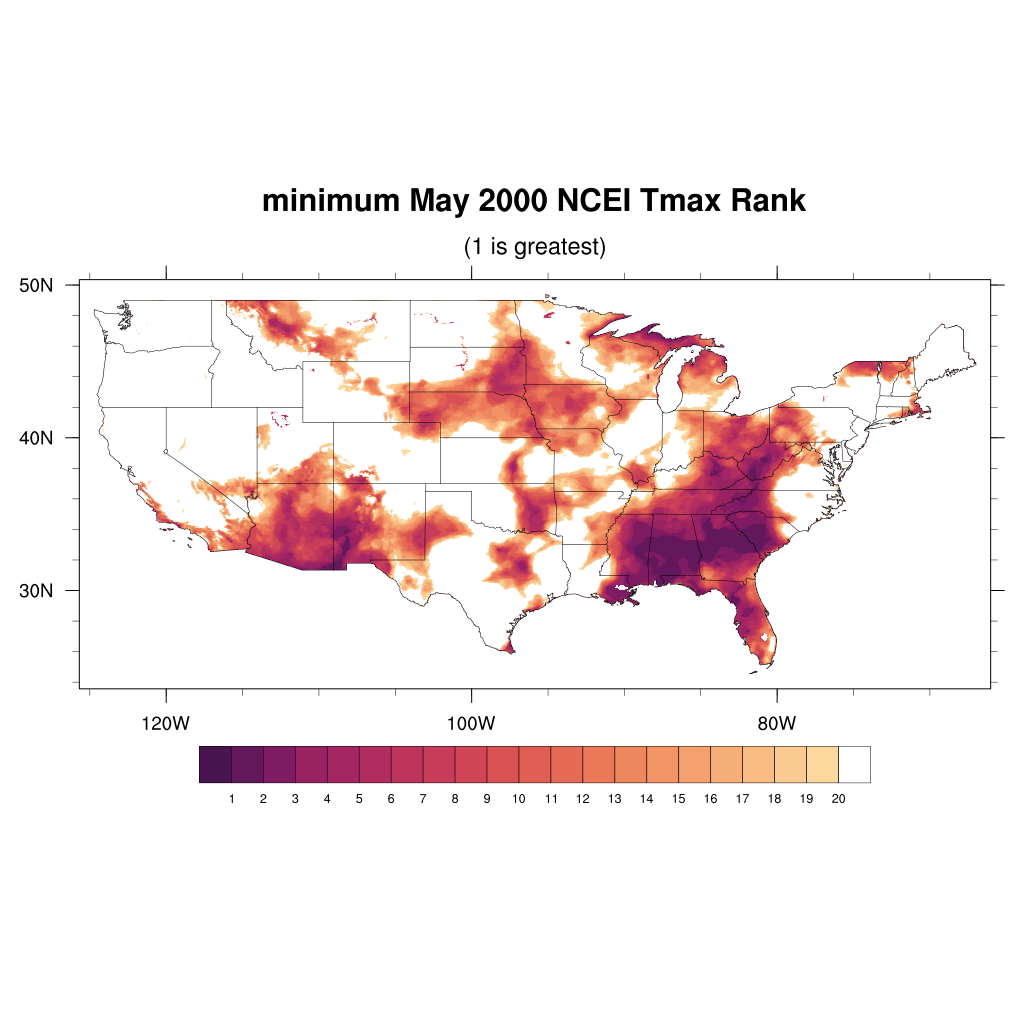
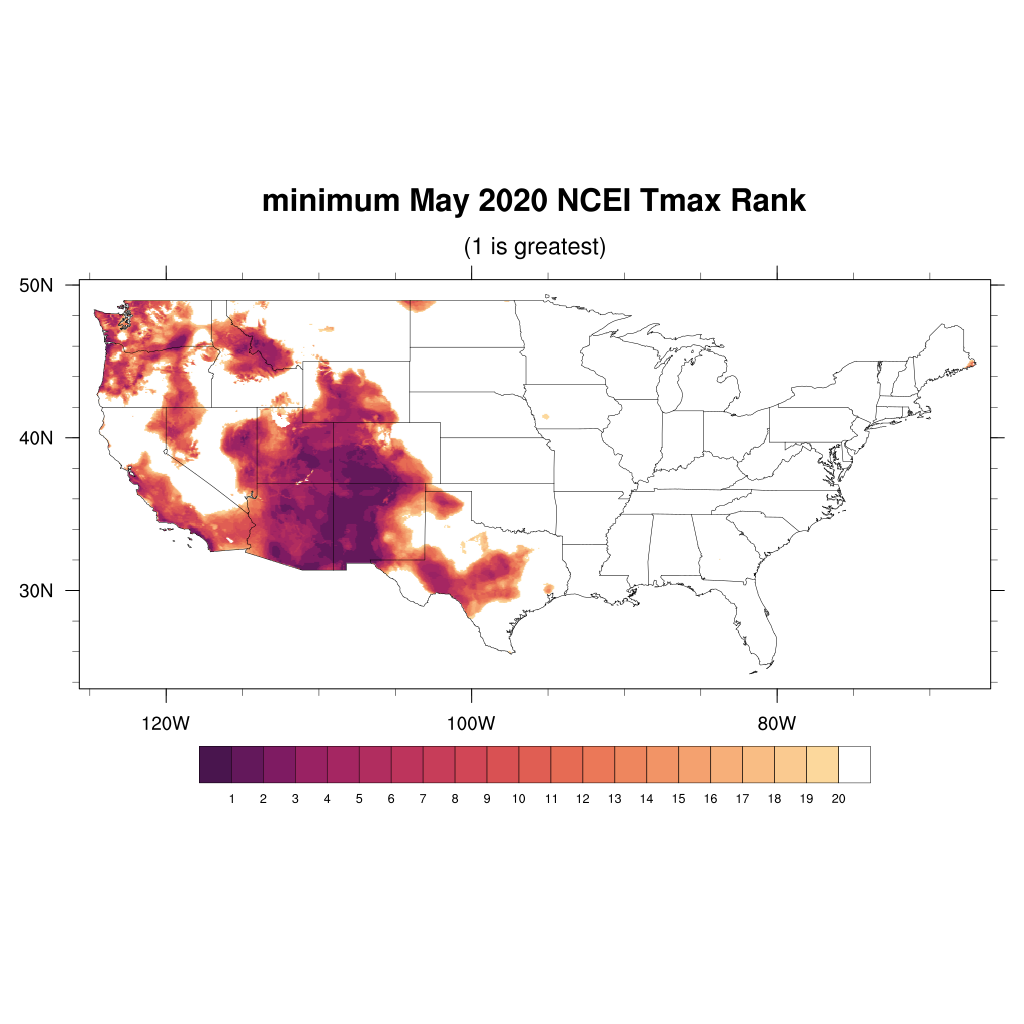
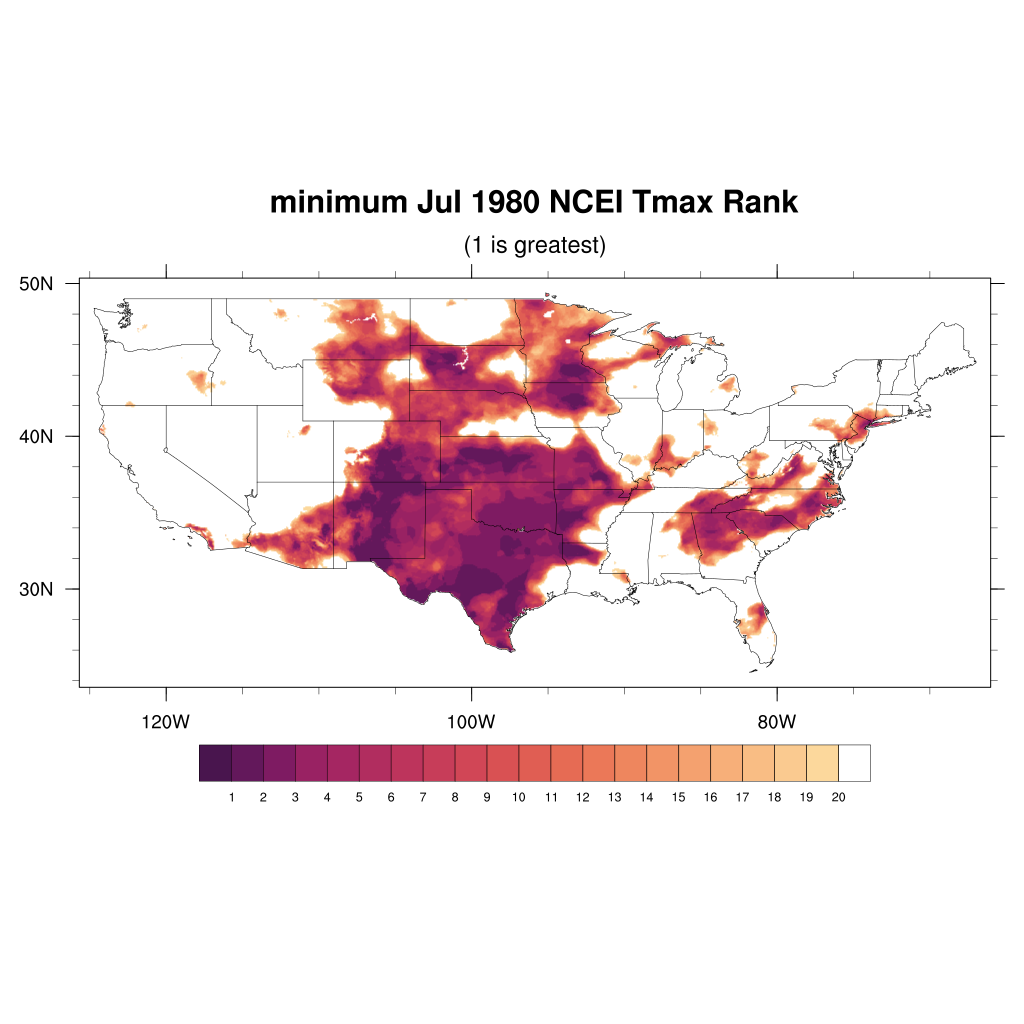
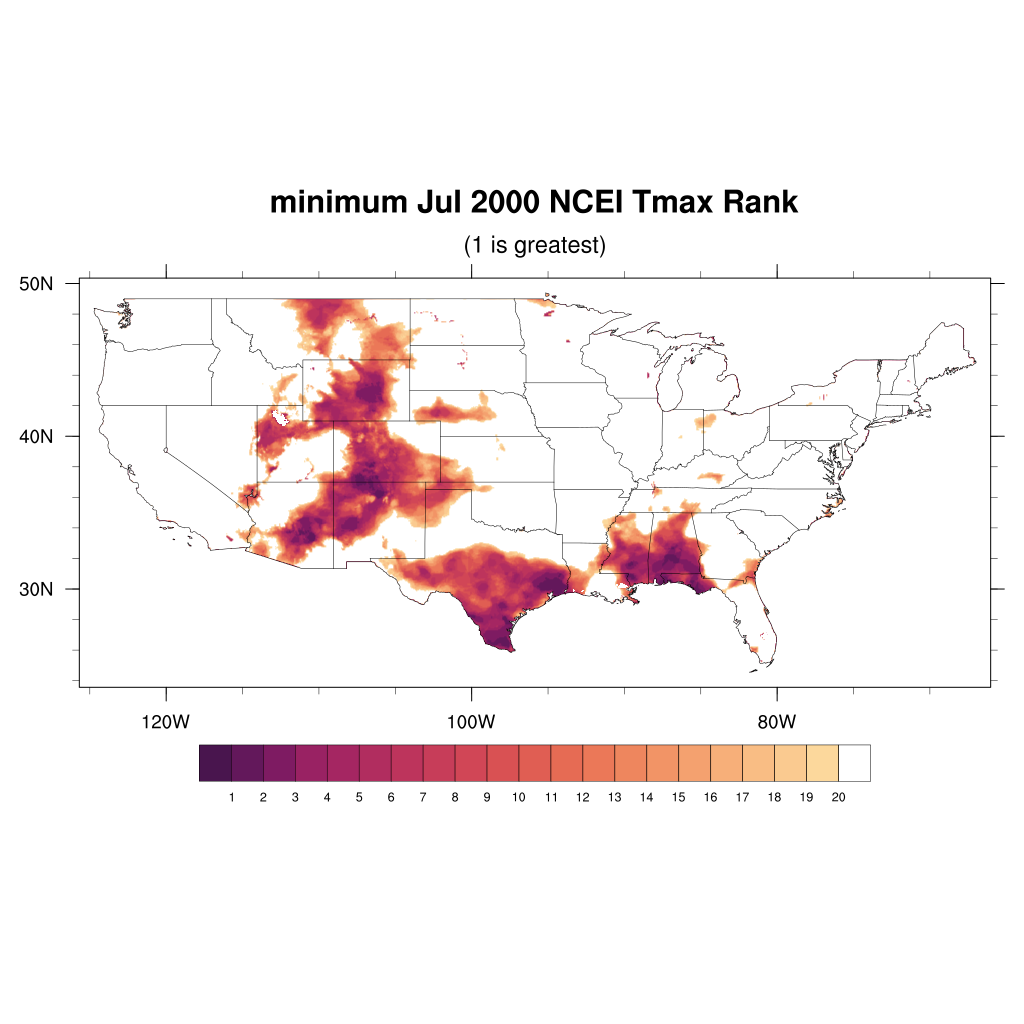
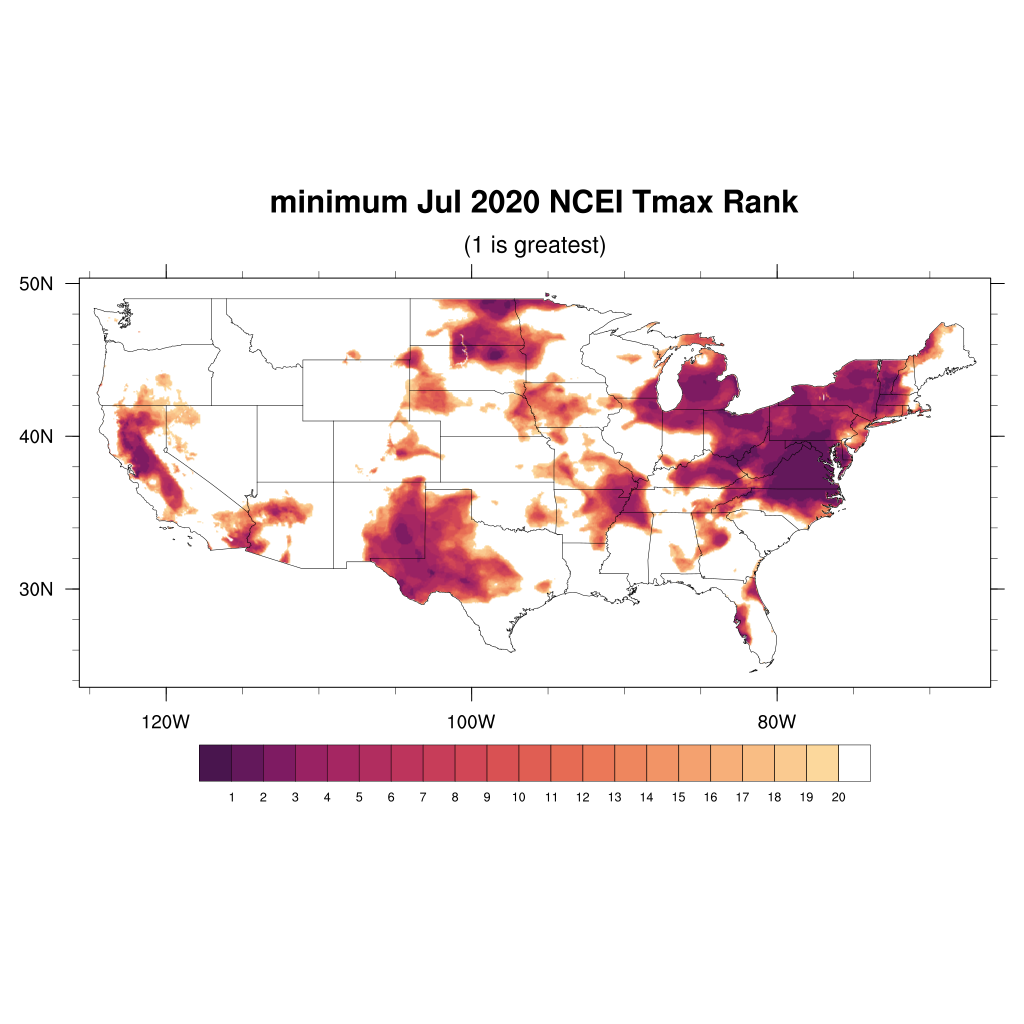
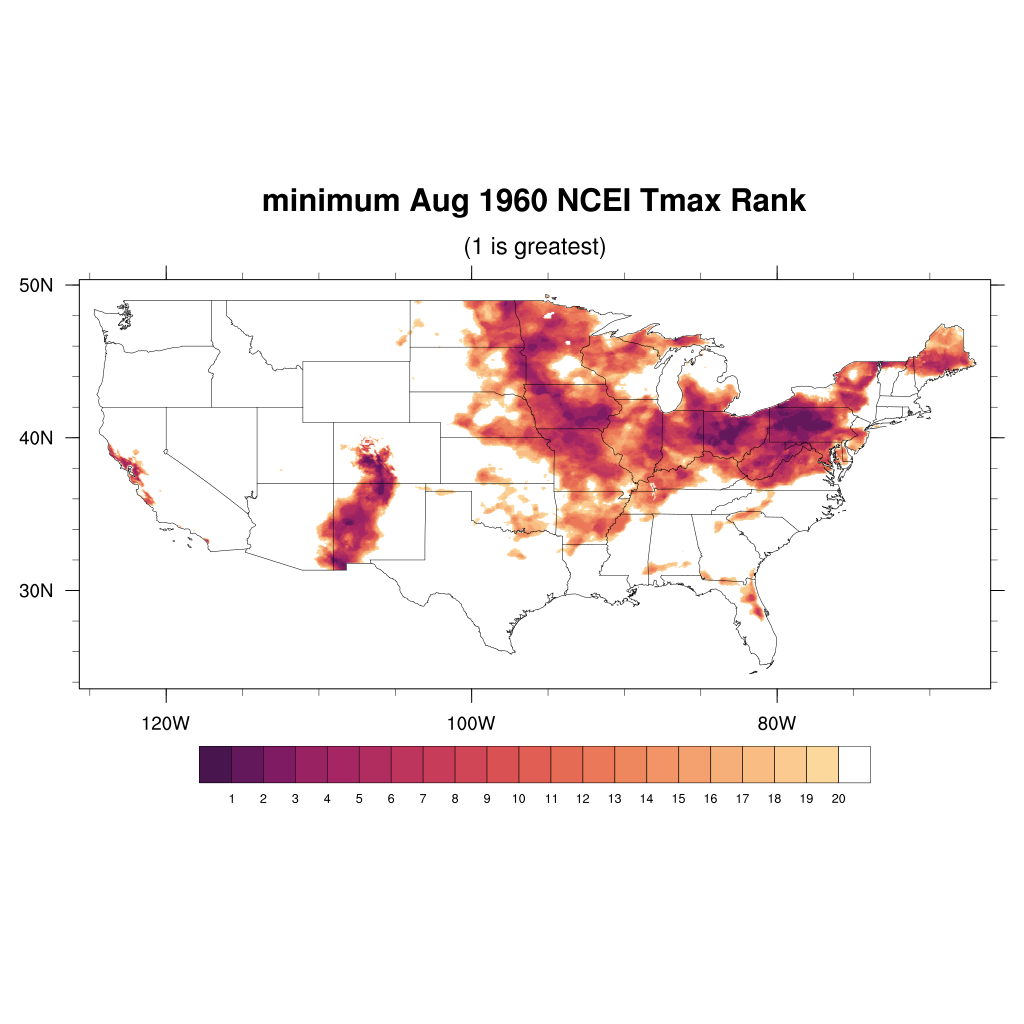
NCEI Extreme Temperature
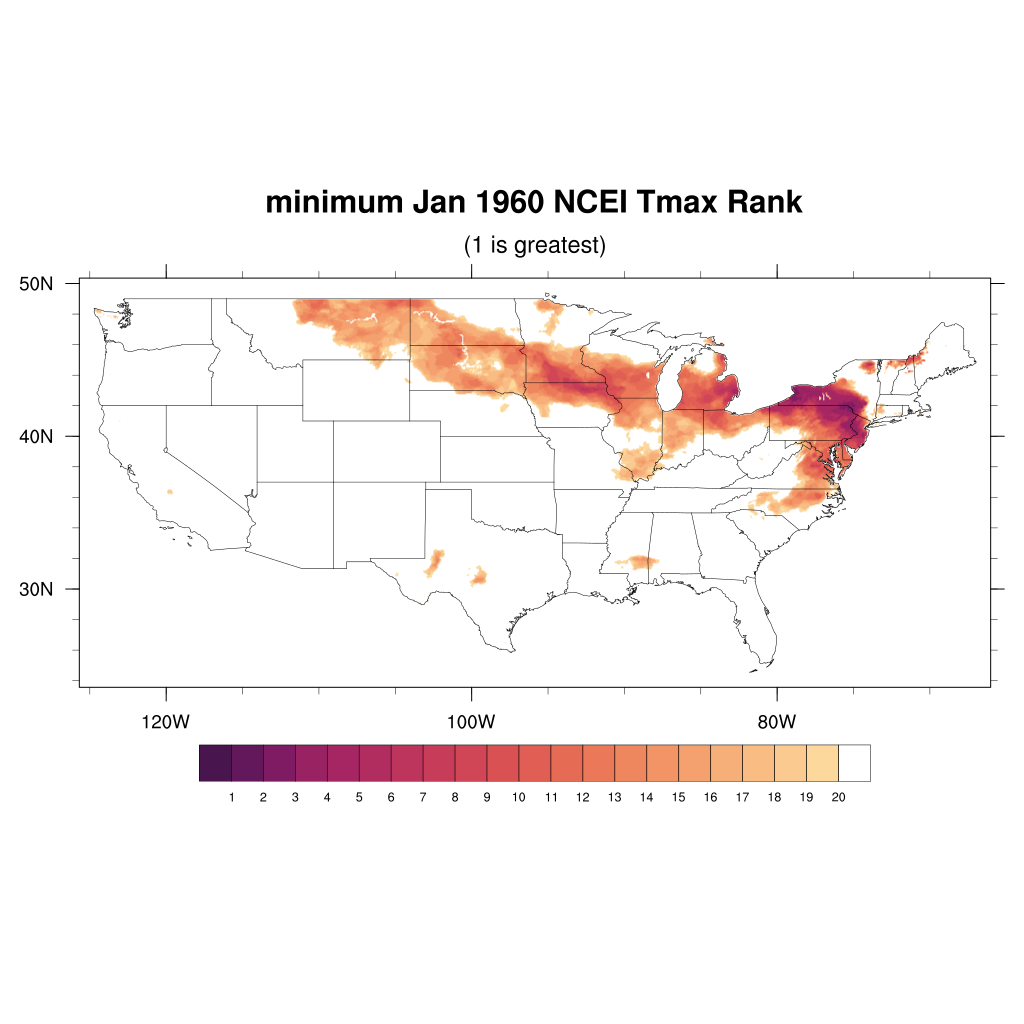
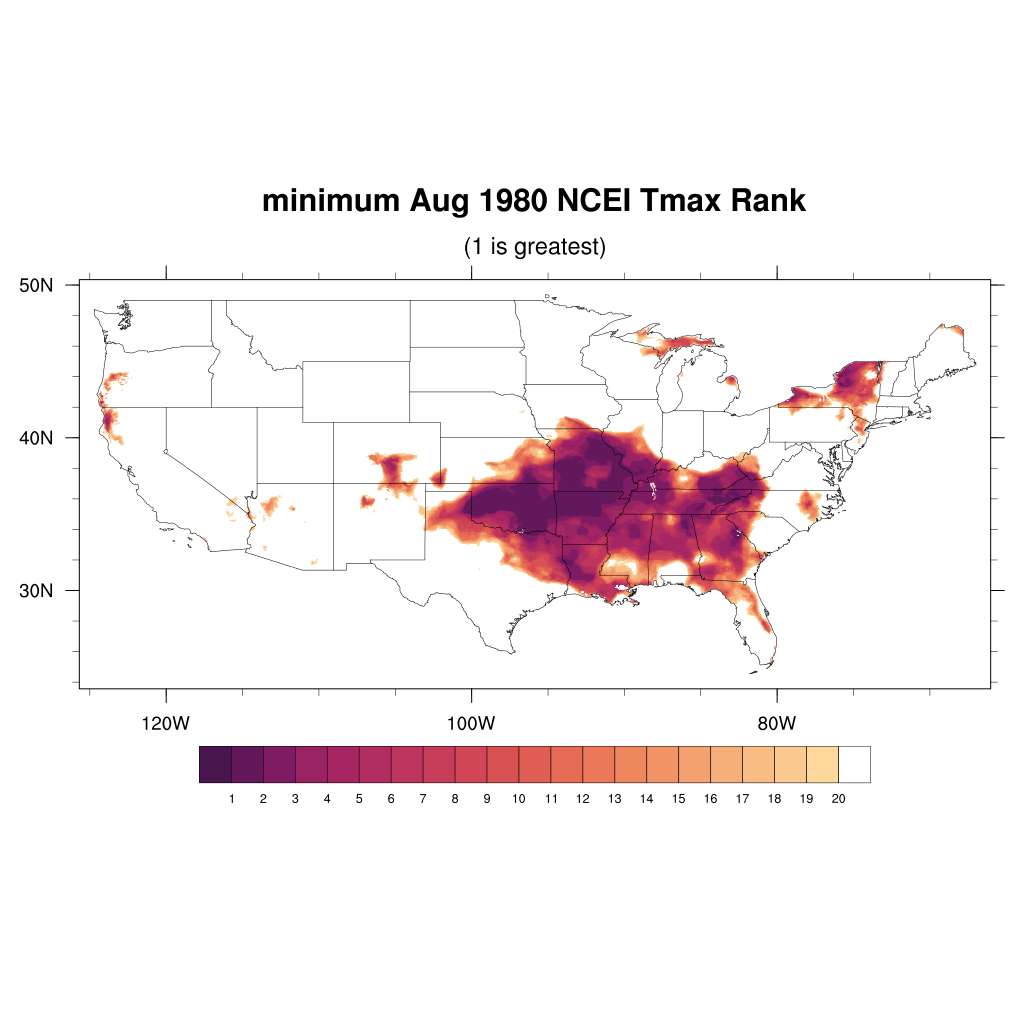
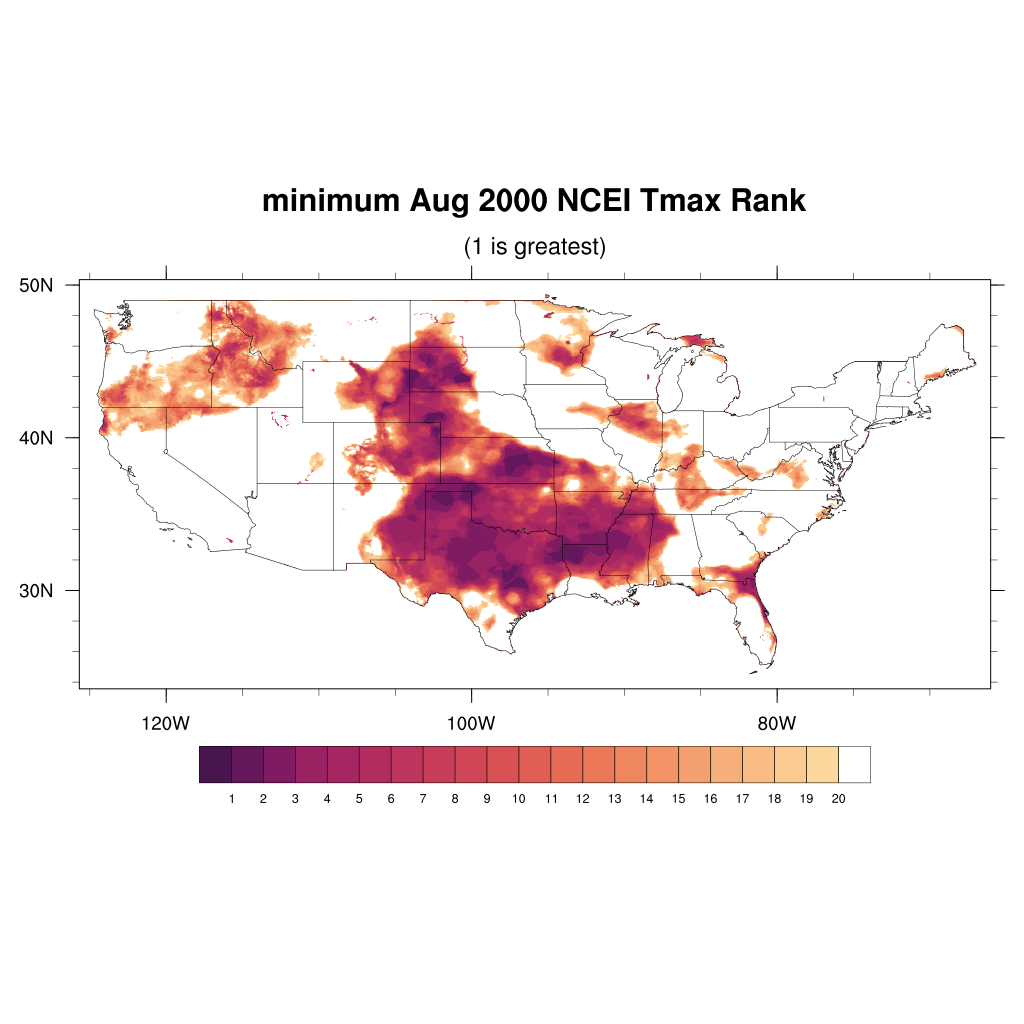
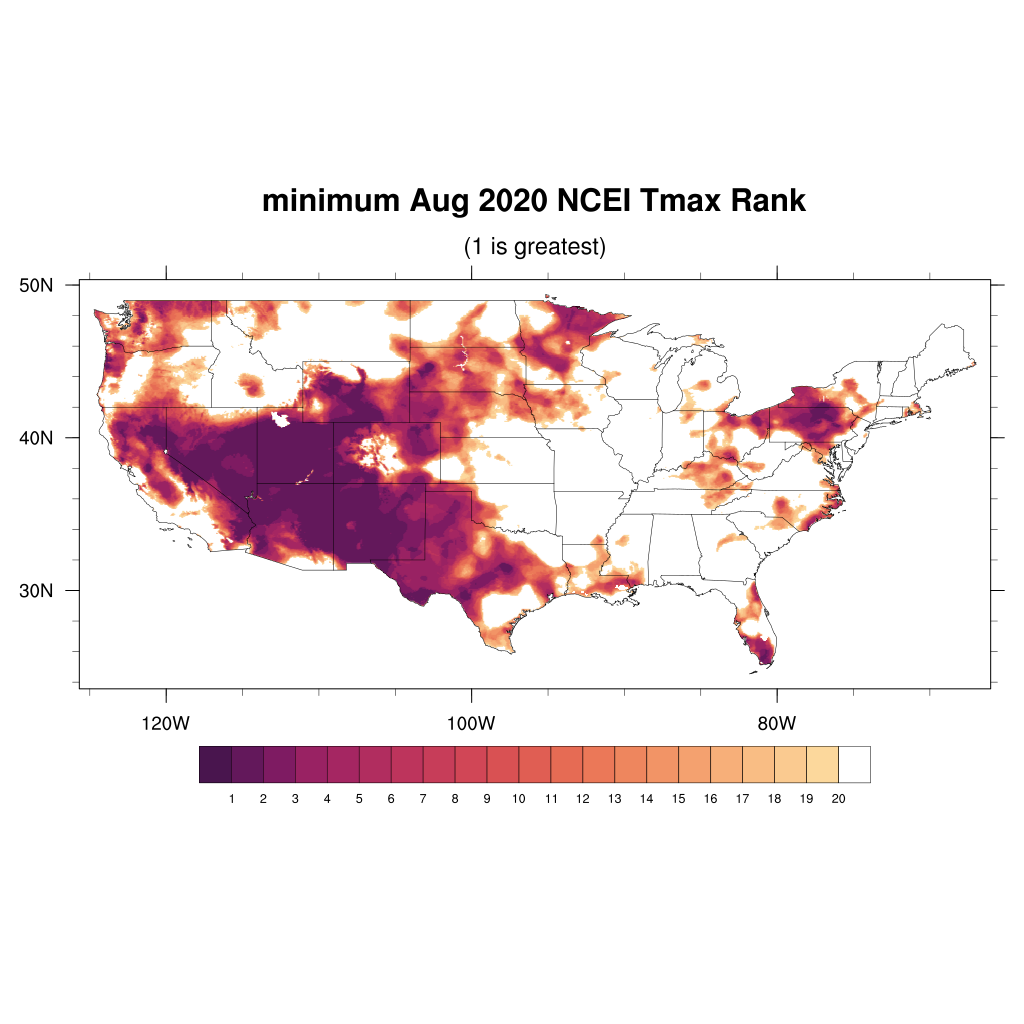
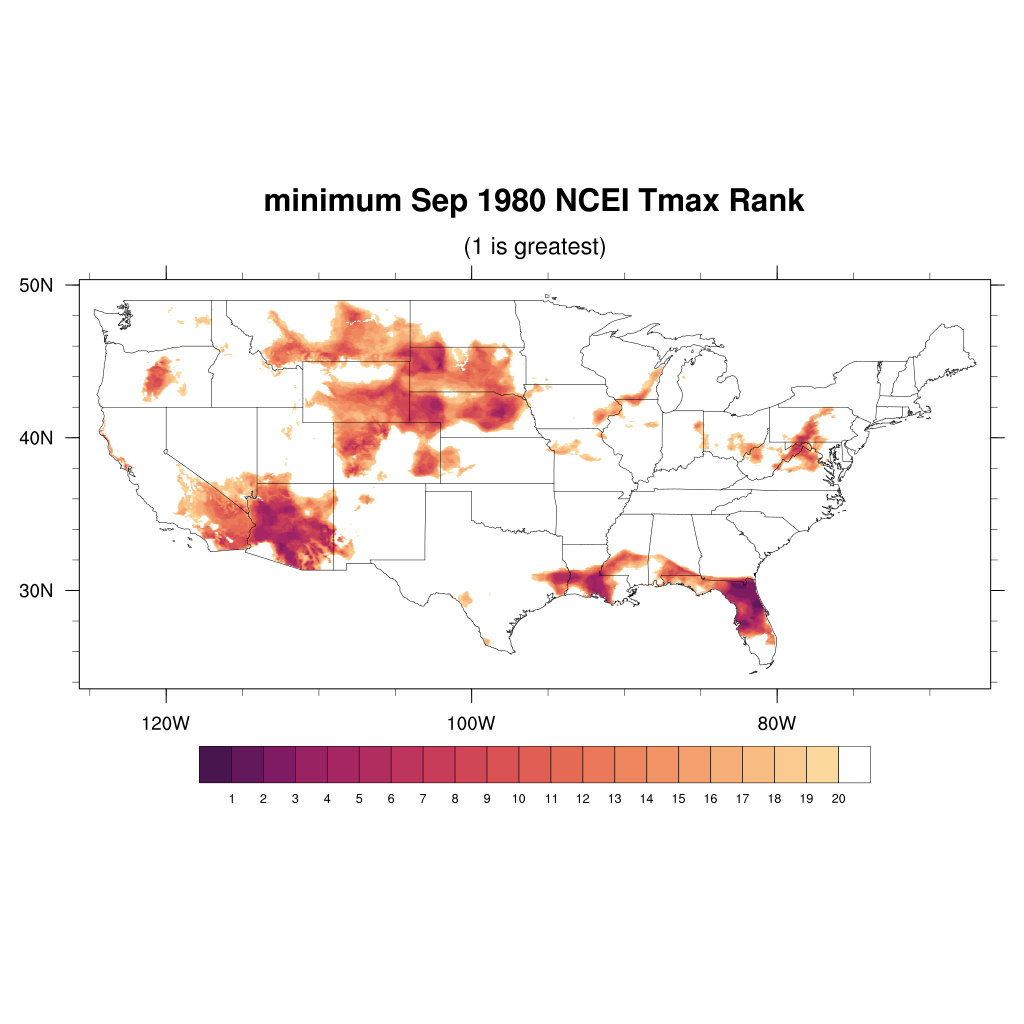
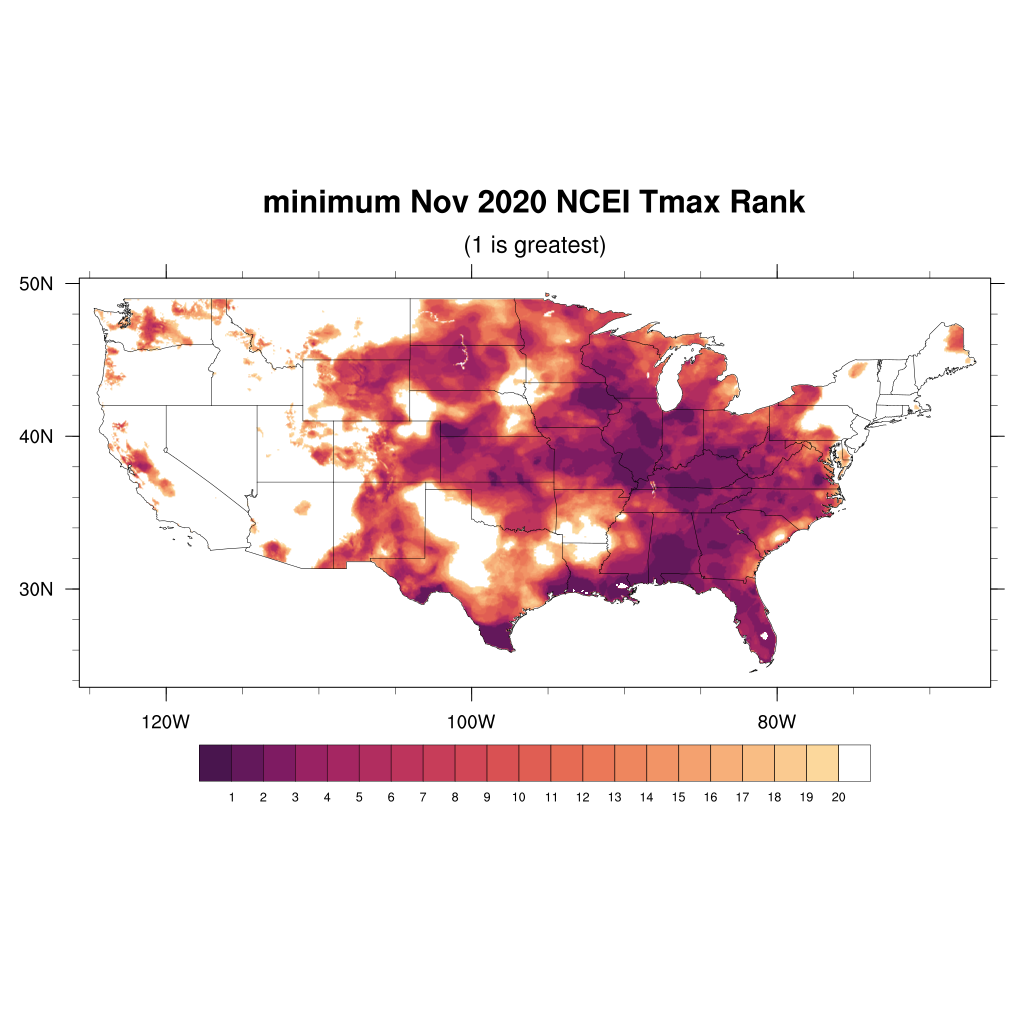
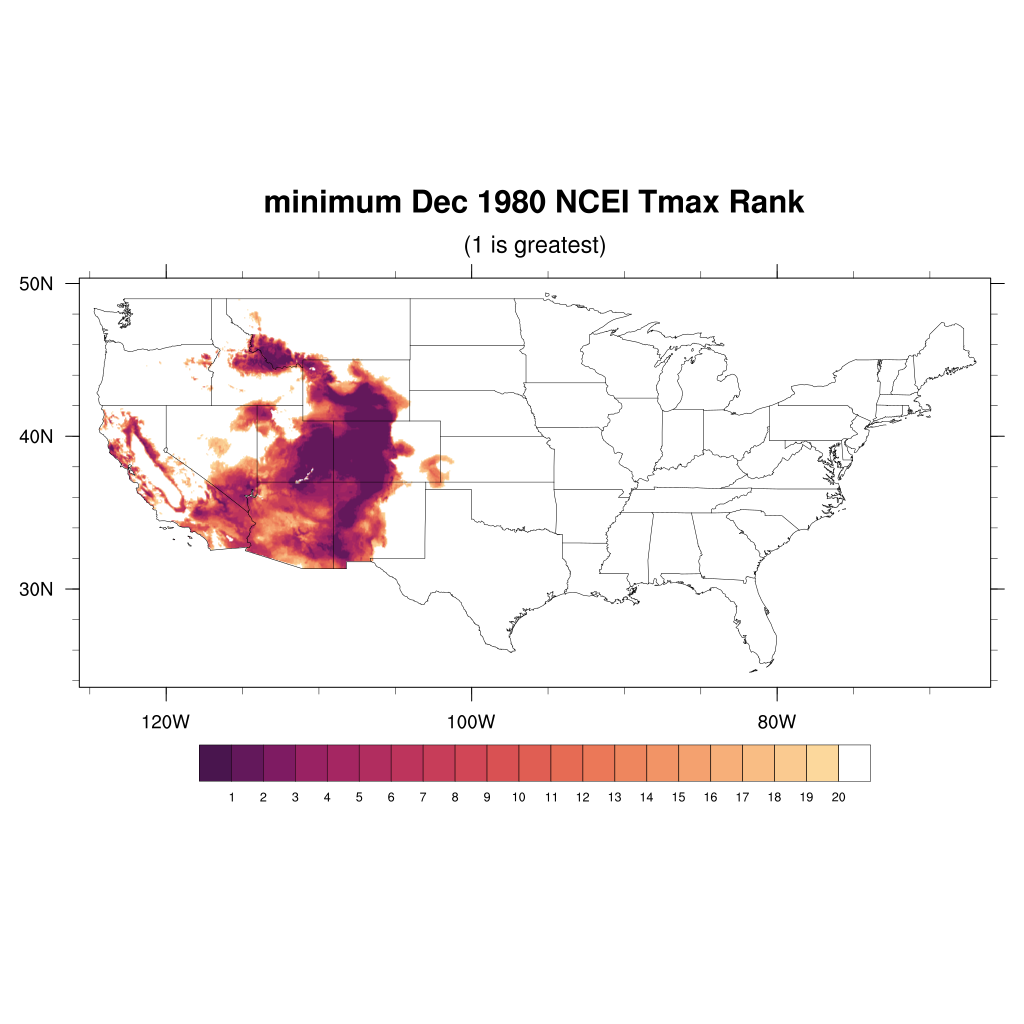
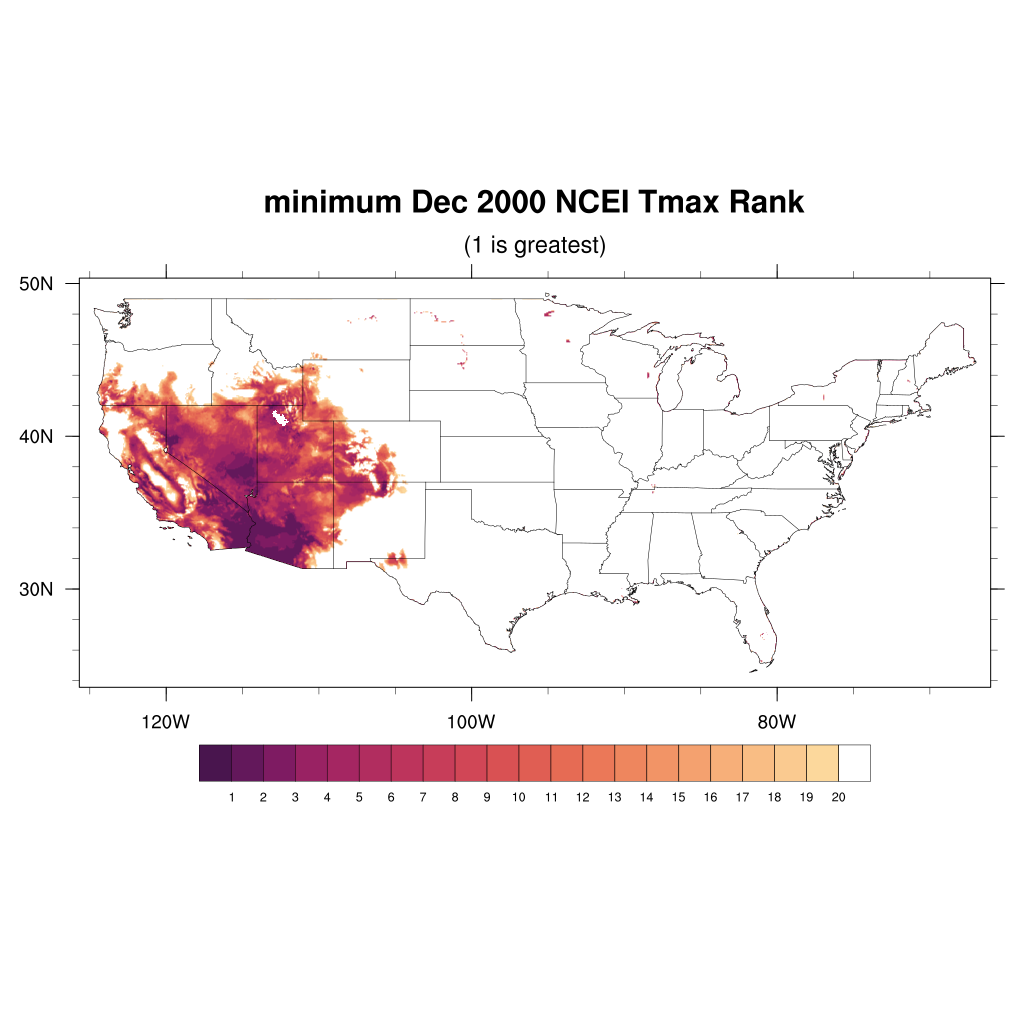
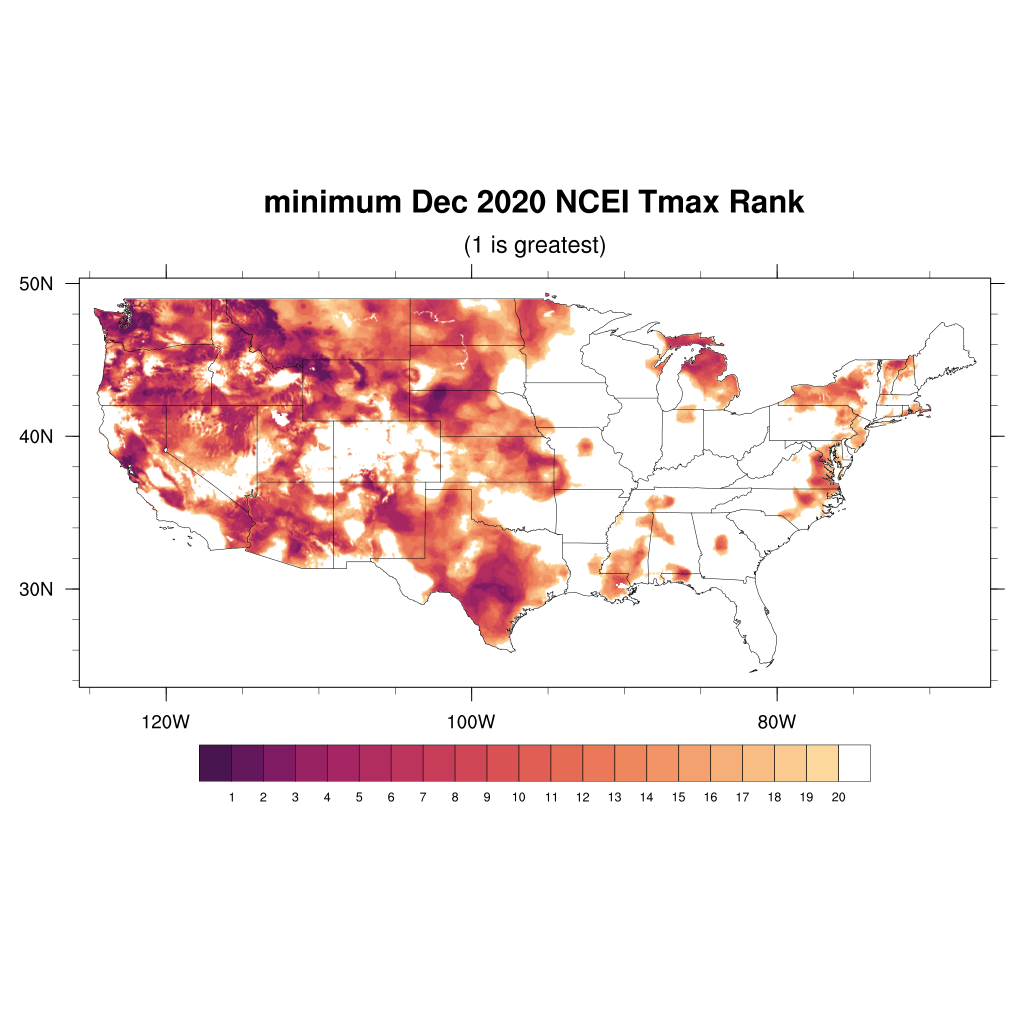
TMAX
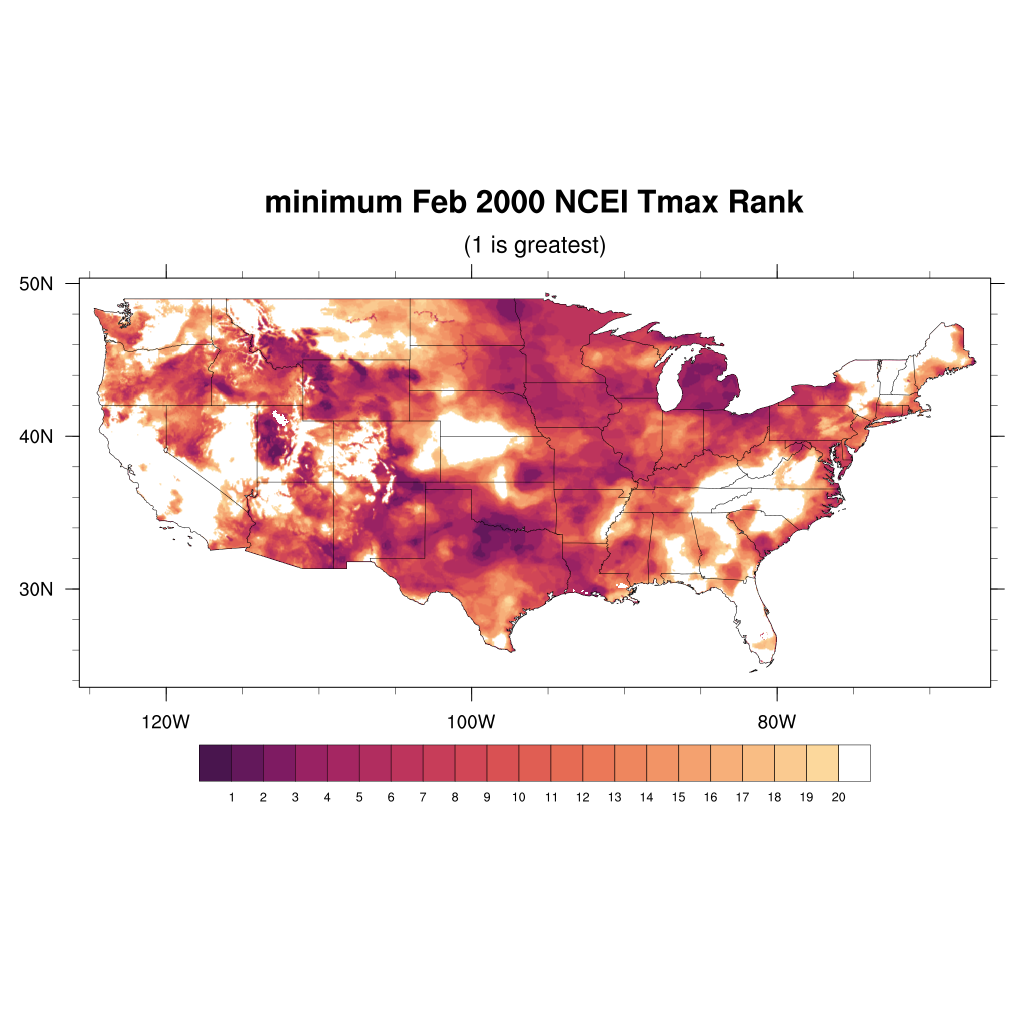
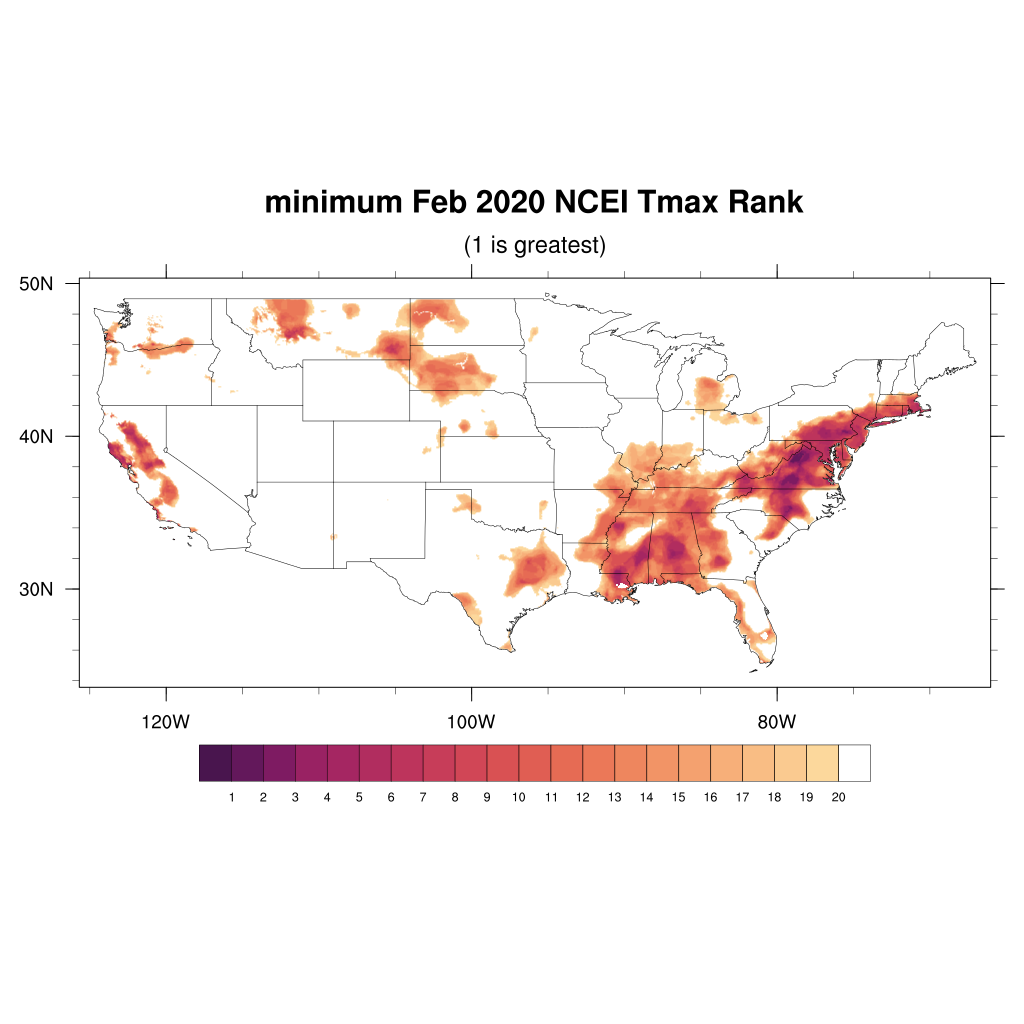
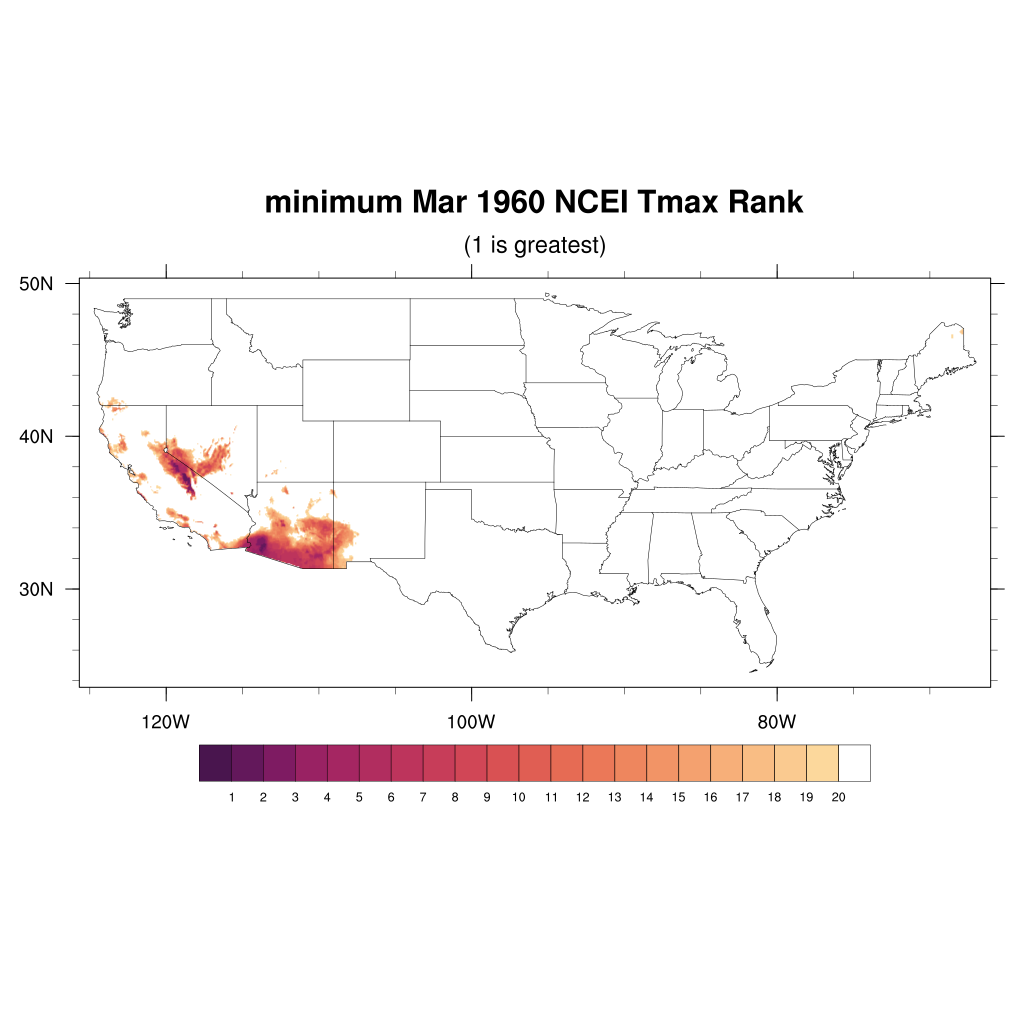
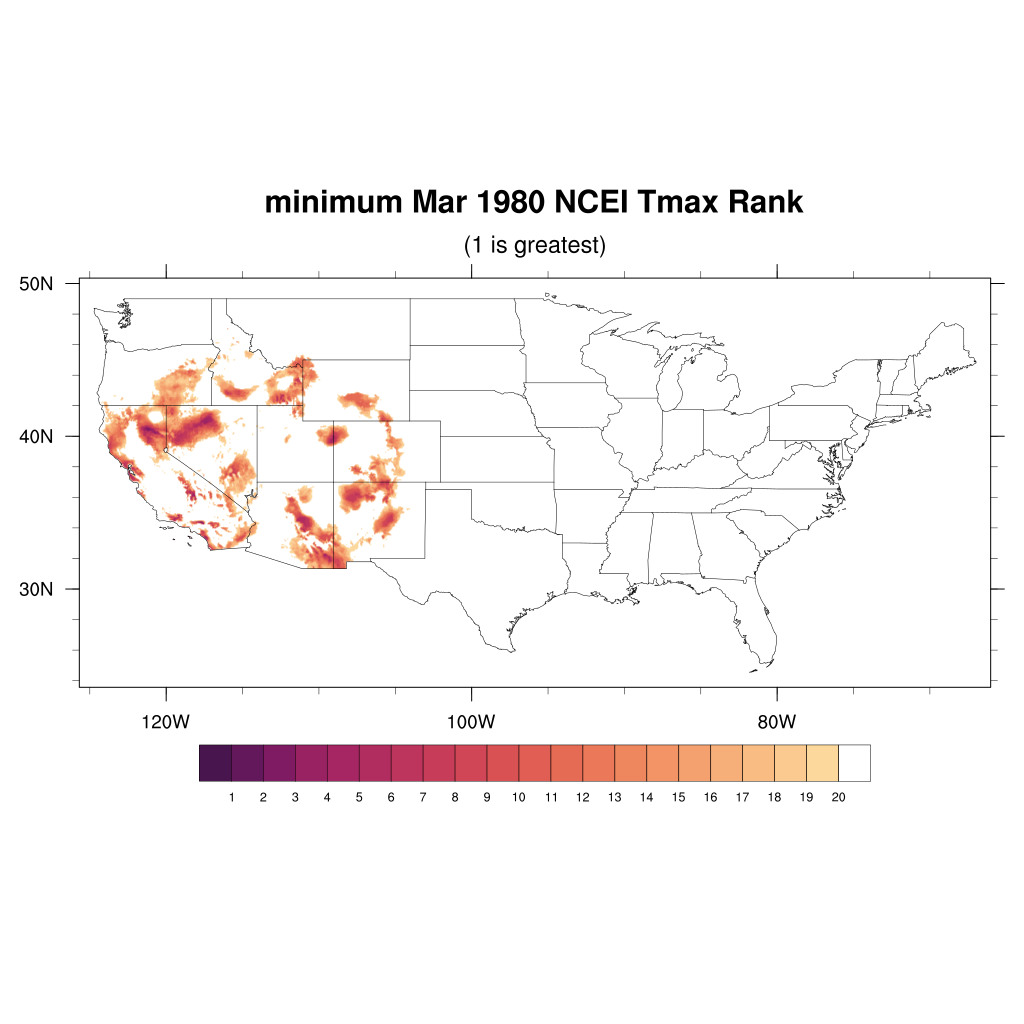
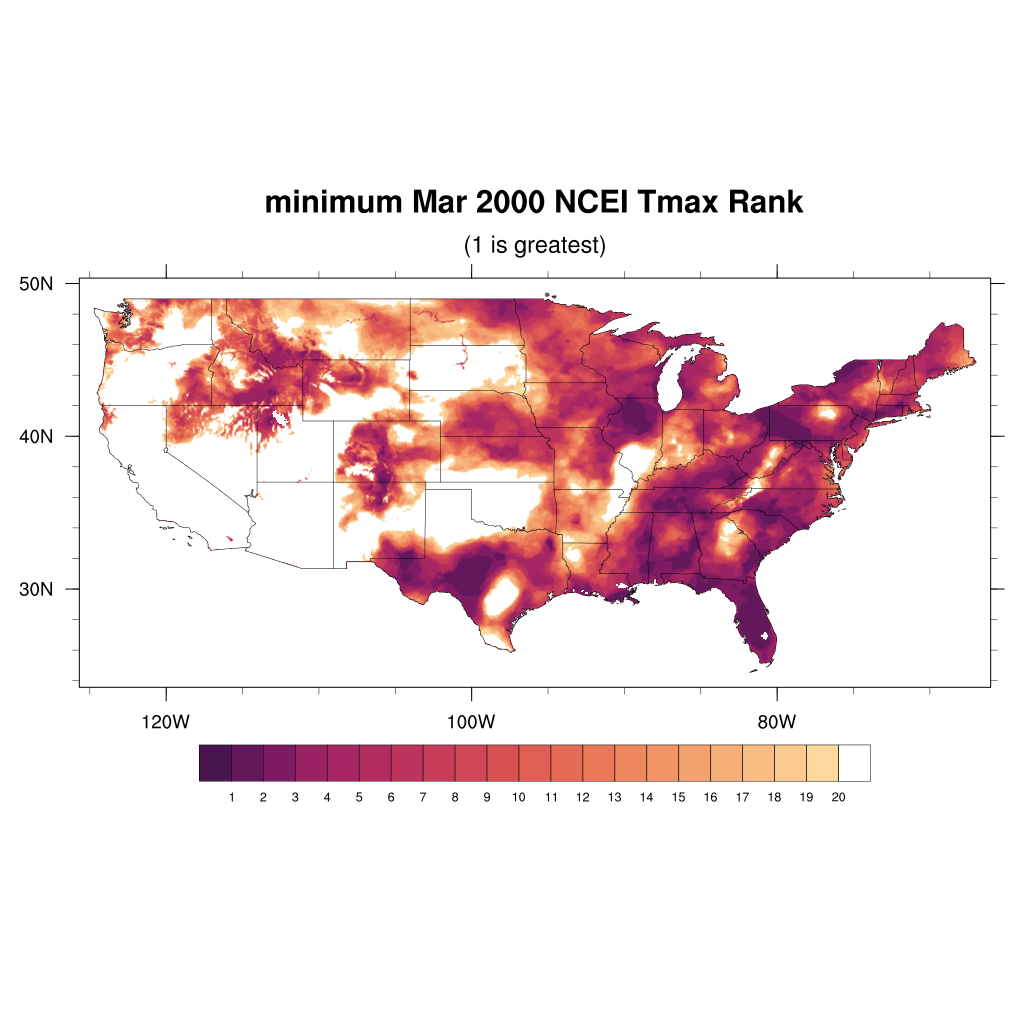
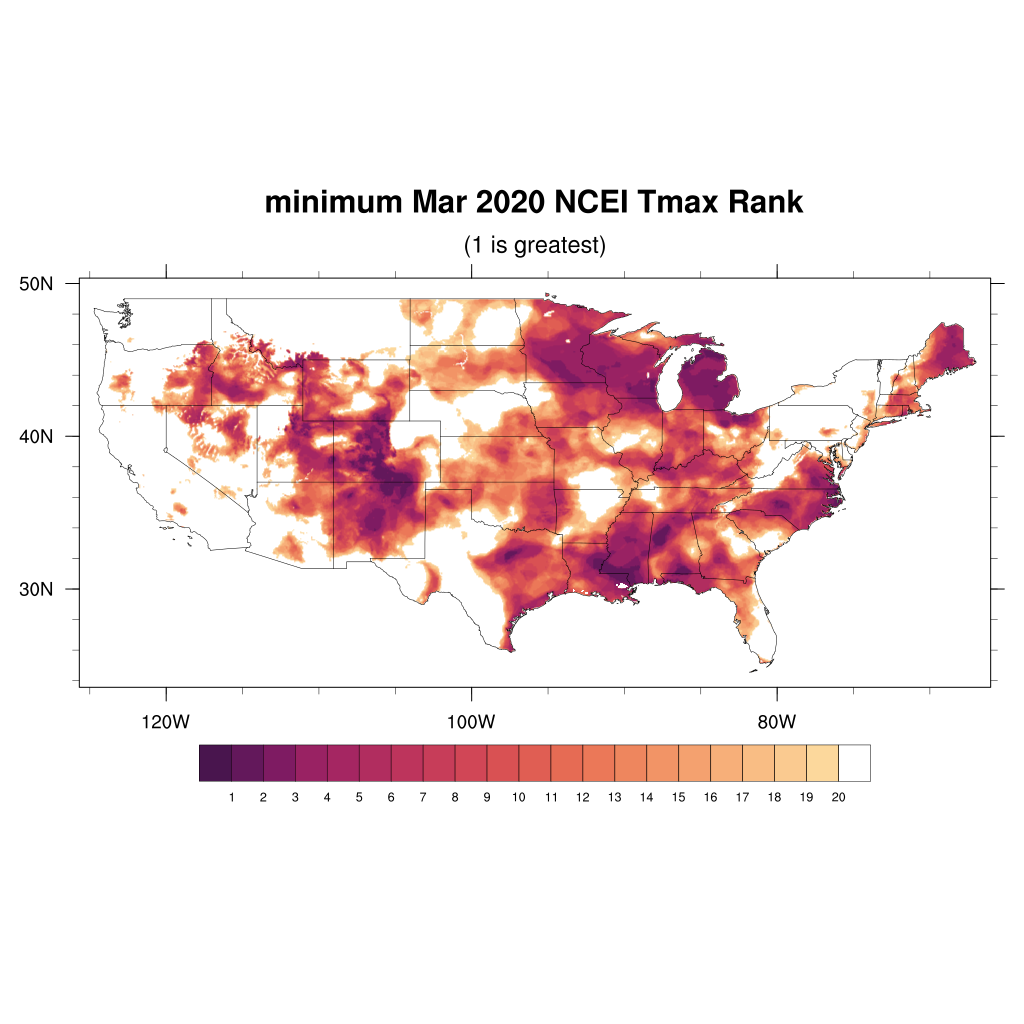
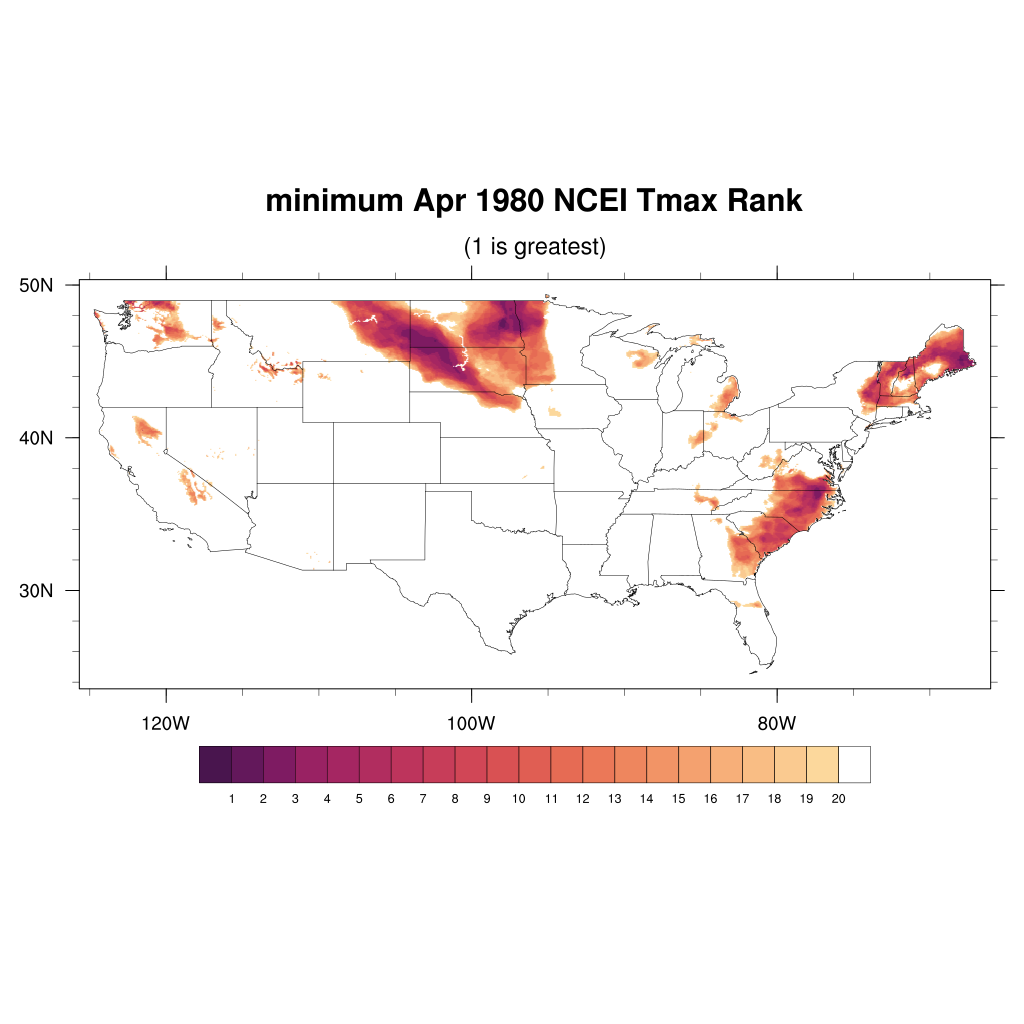
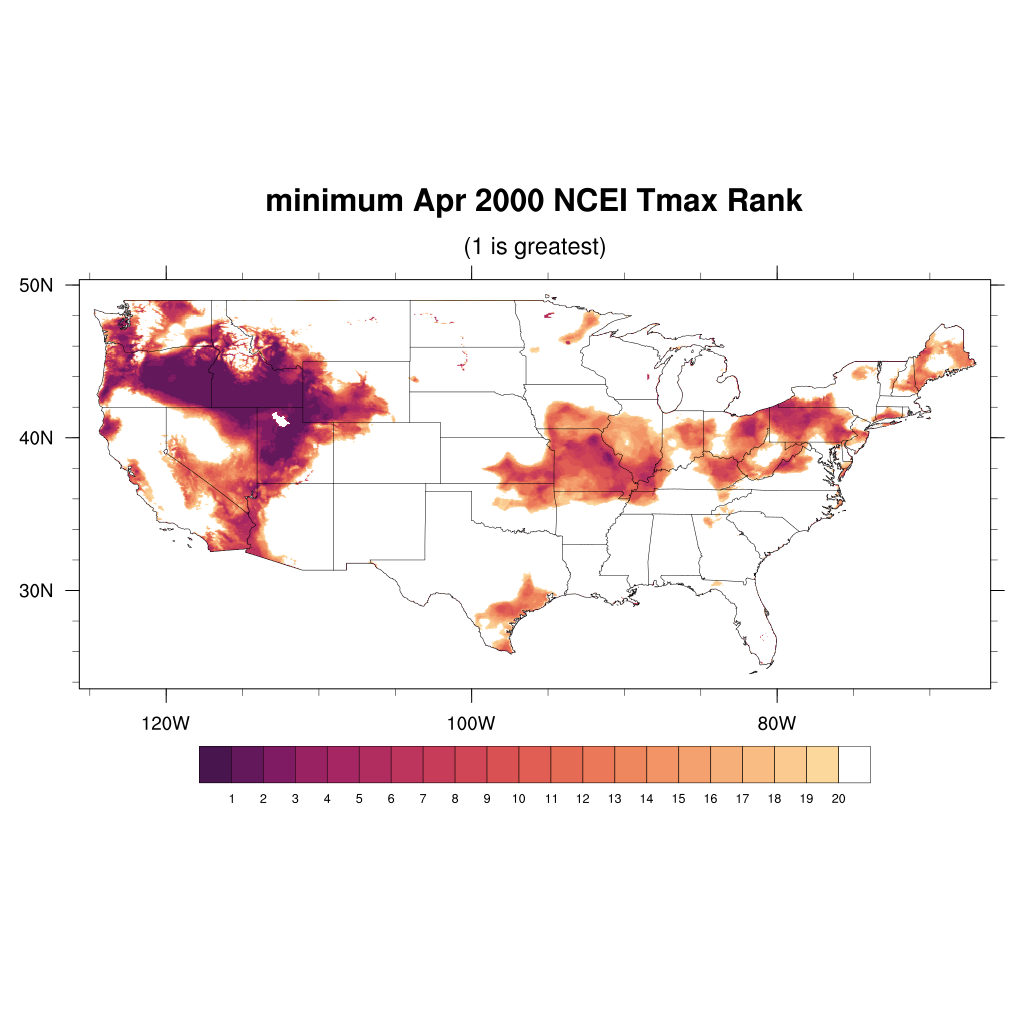
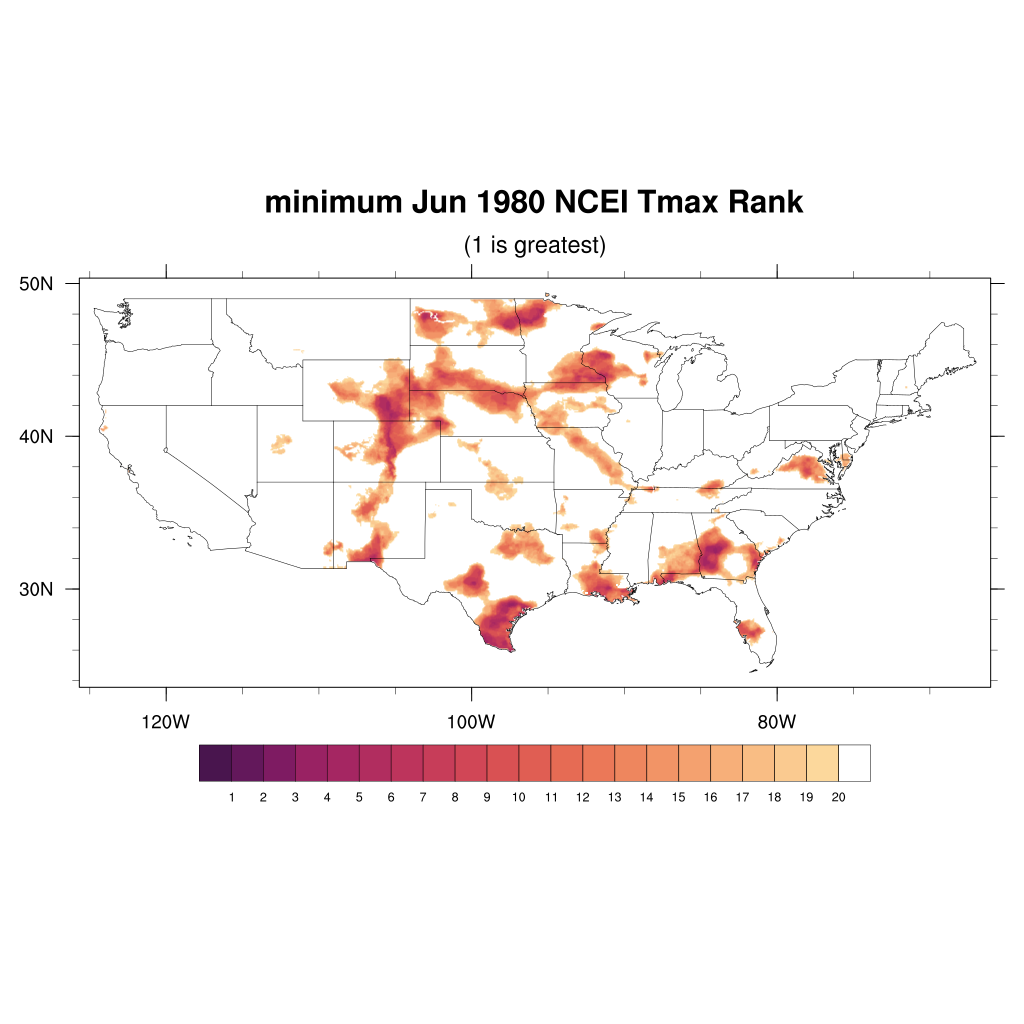
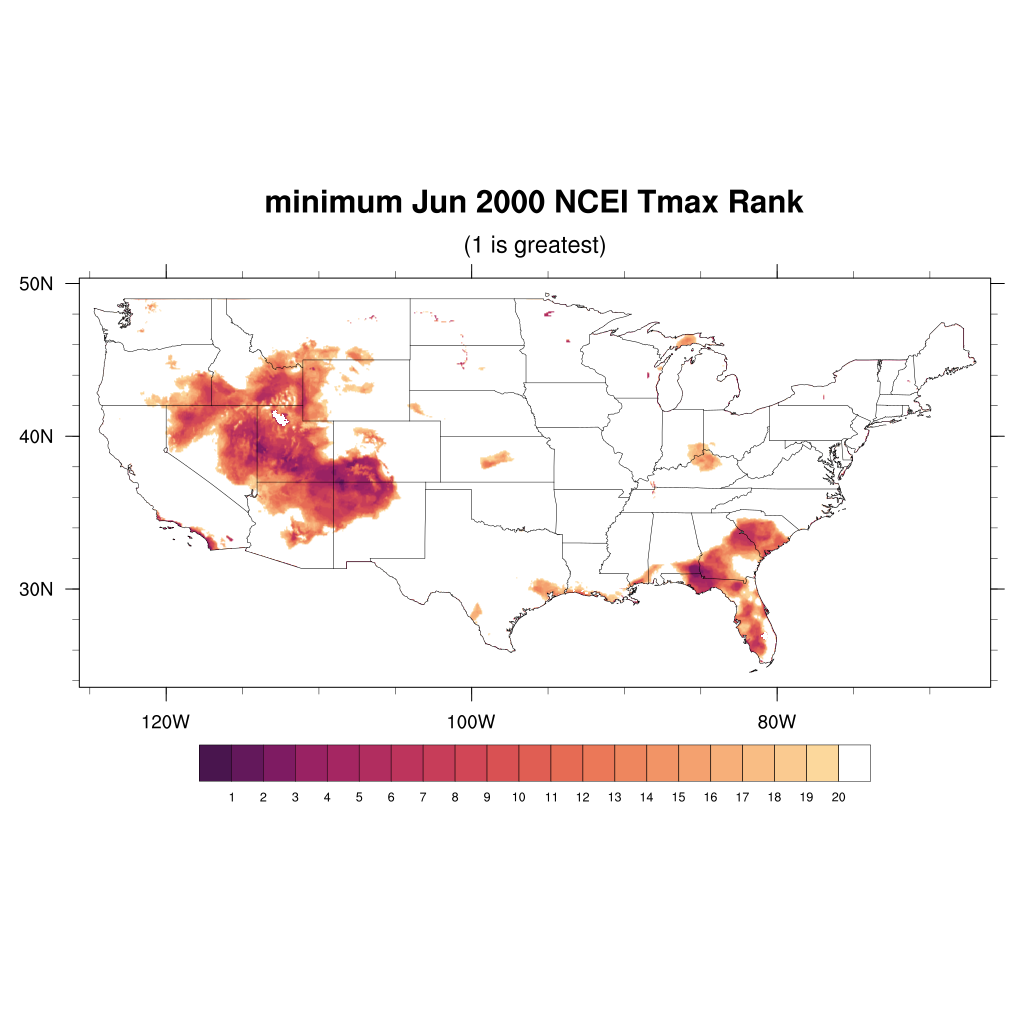
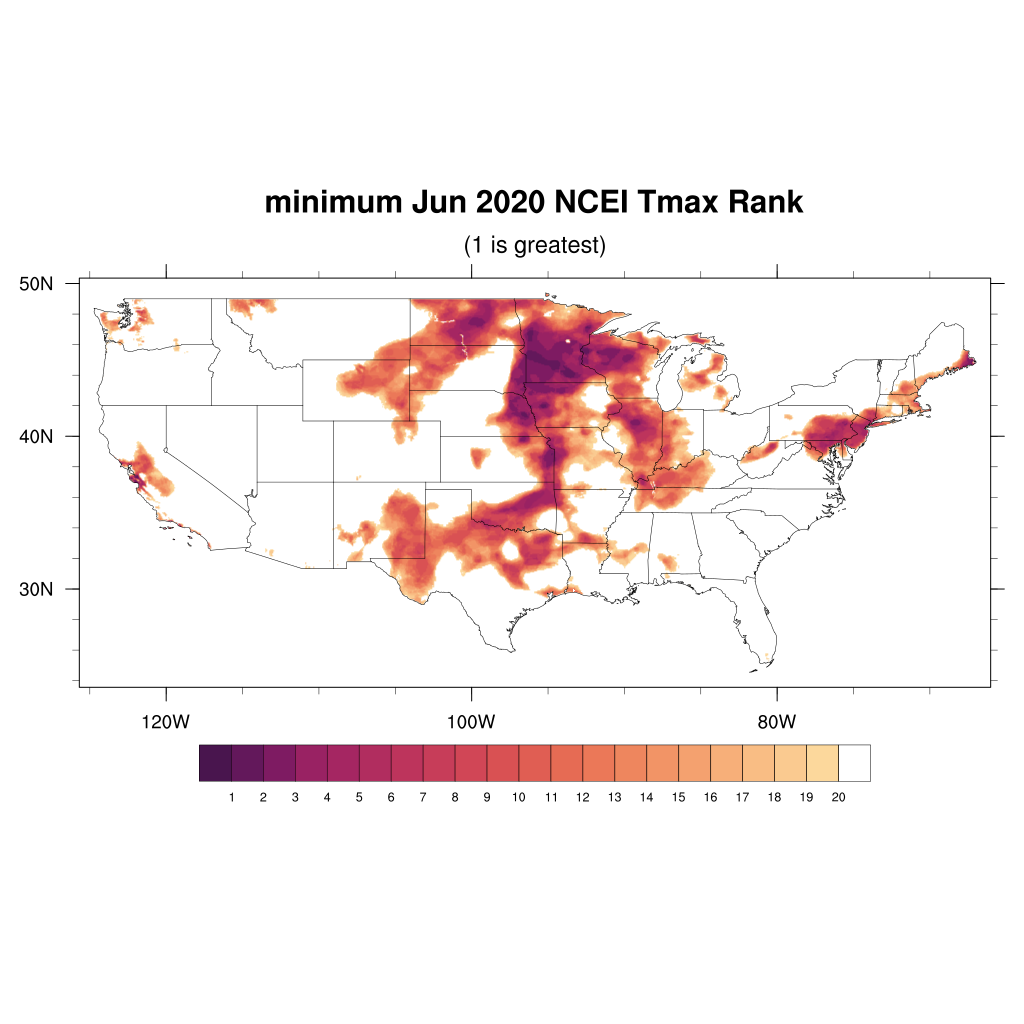
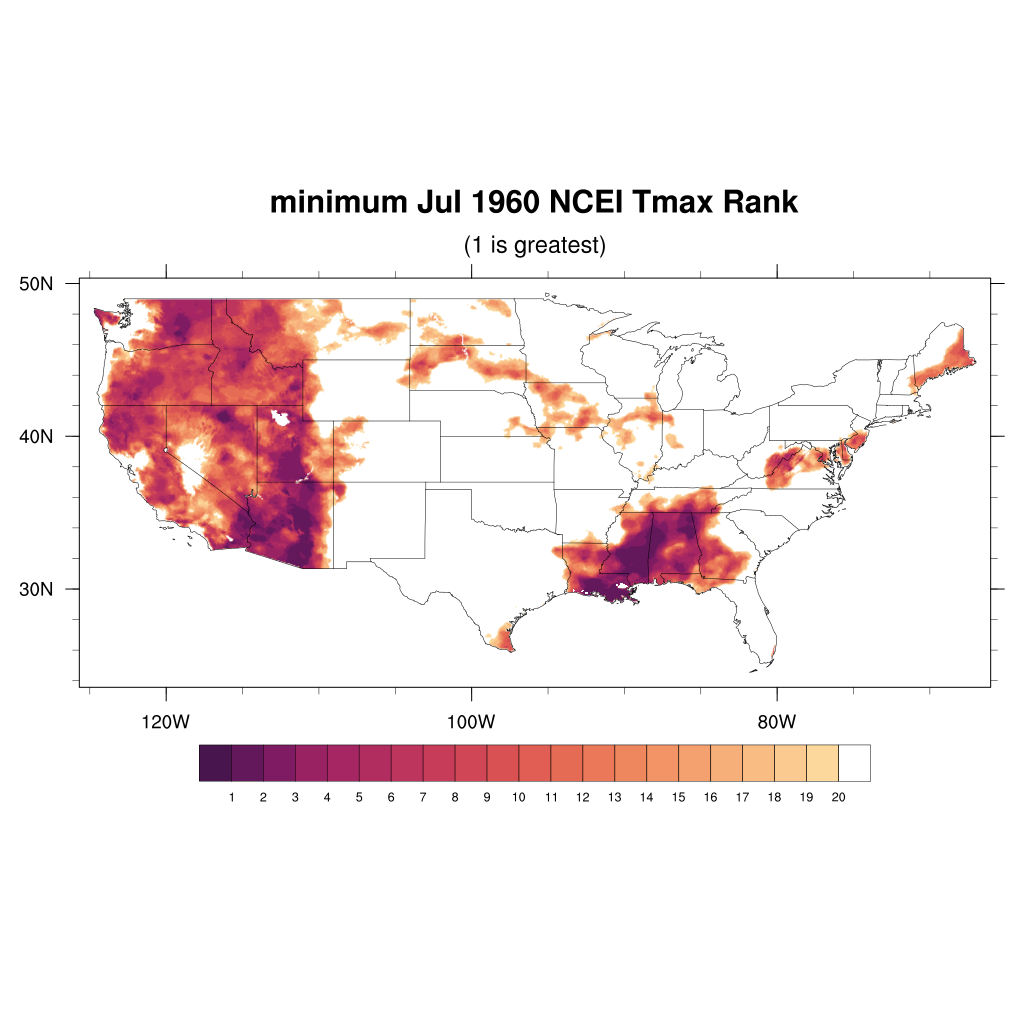
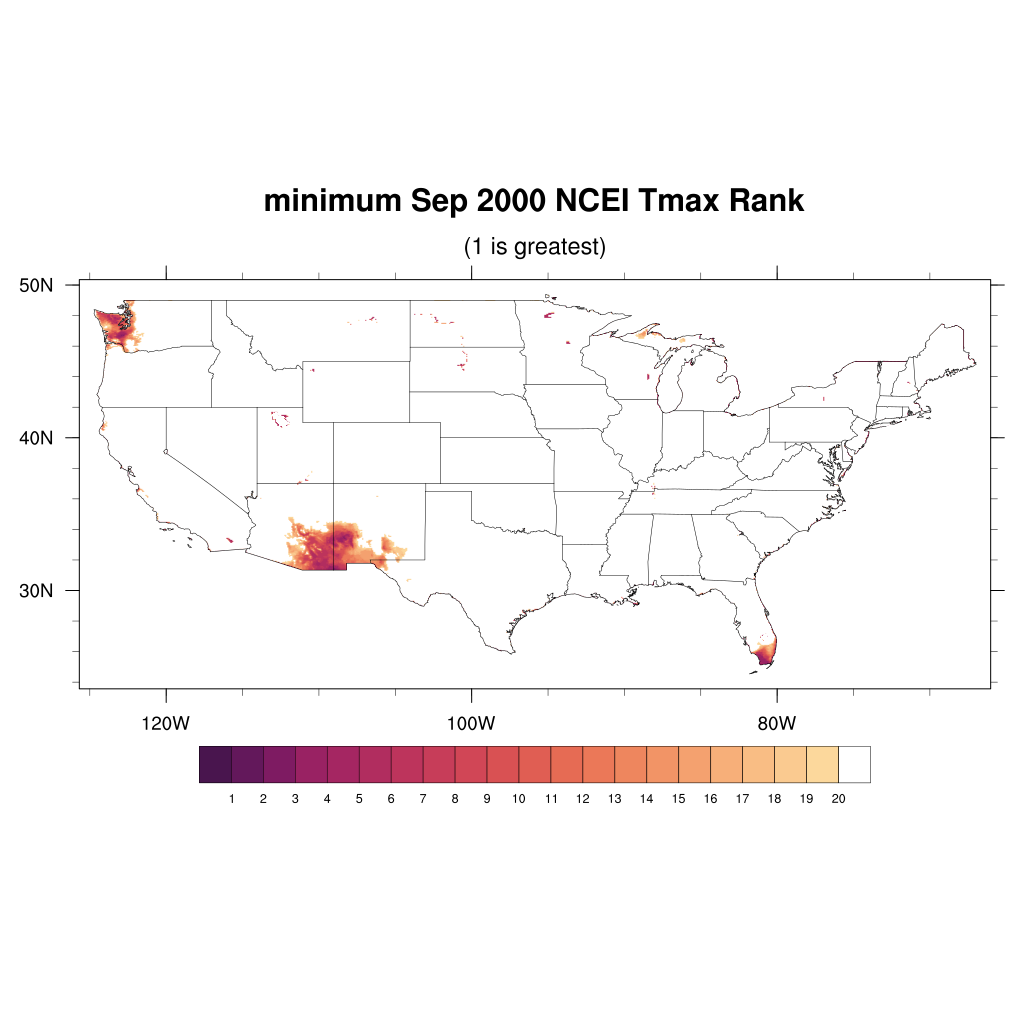
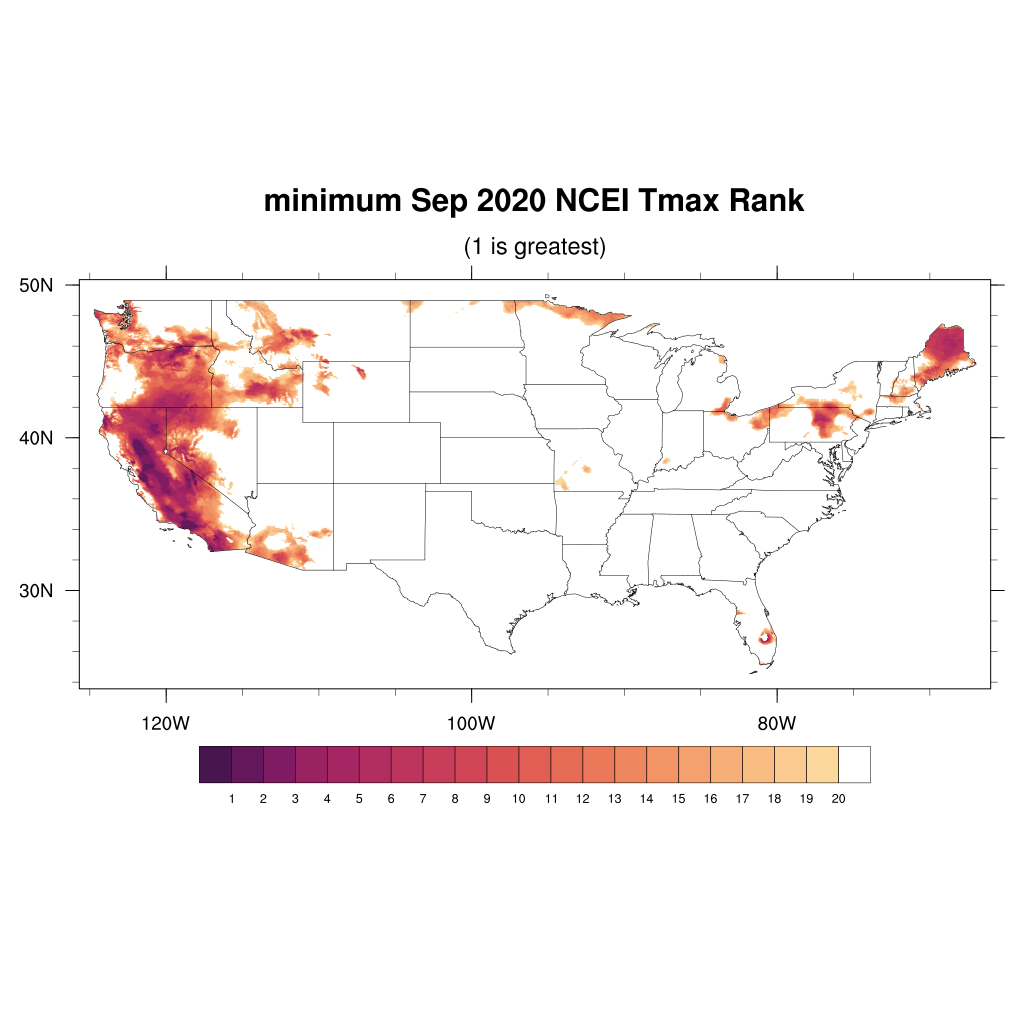
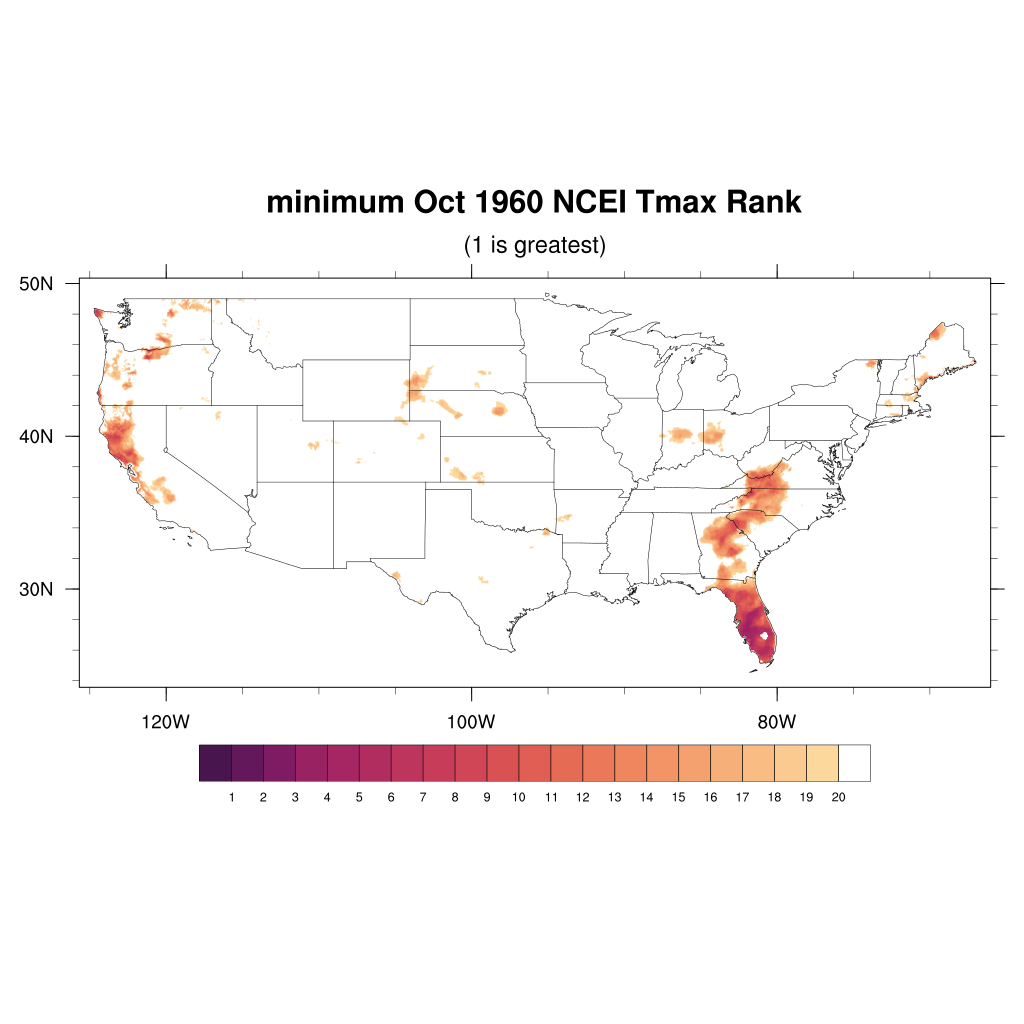
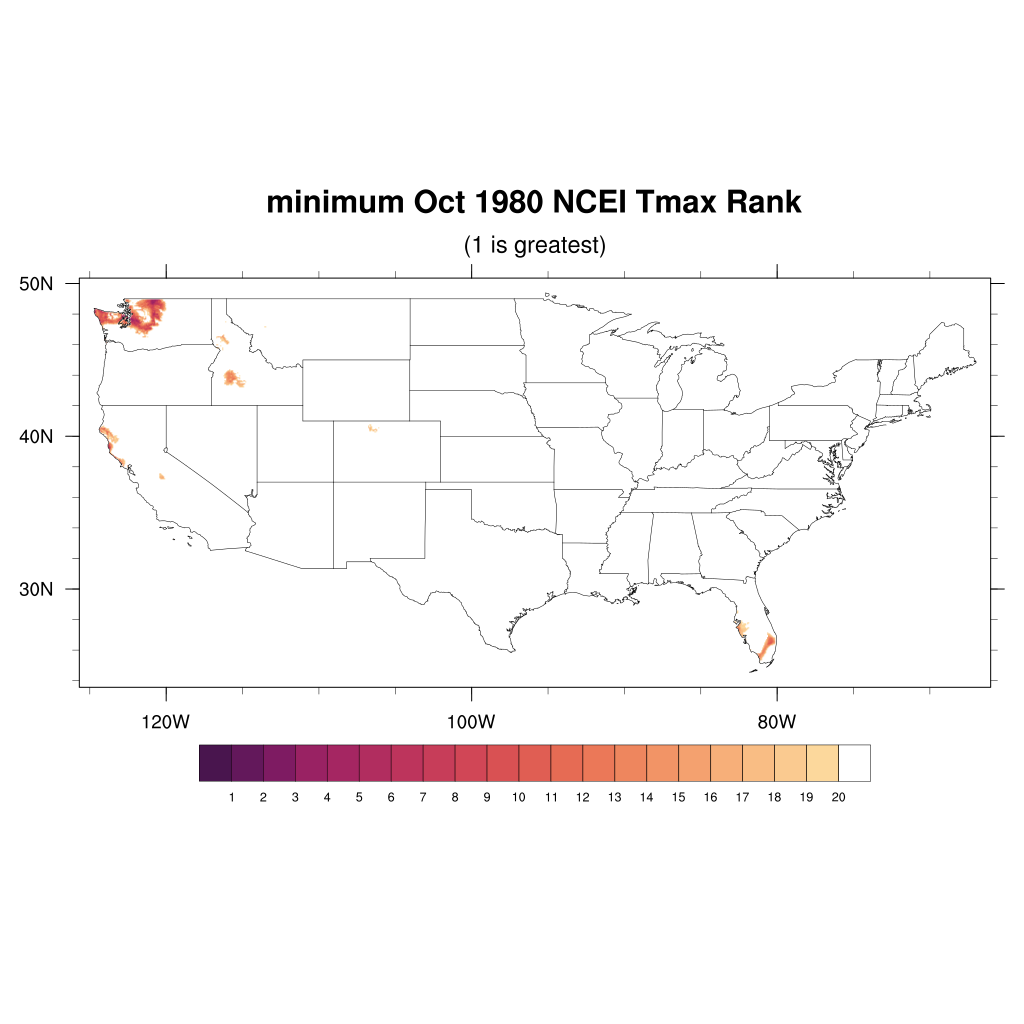
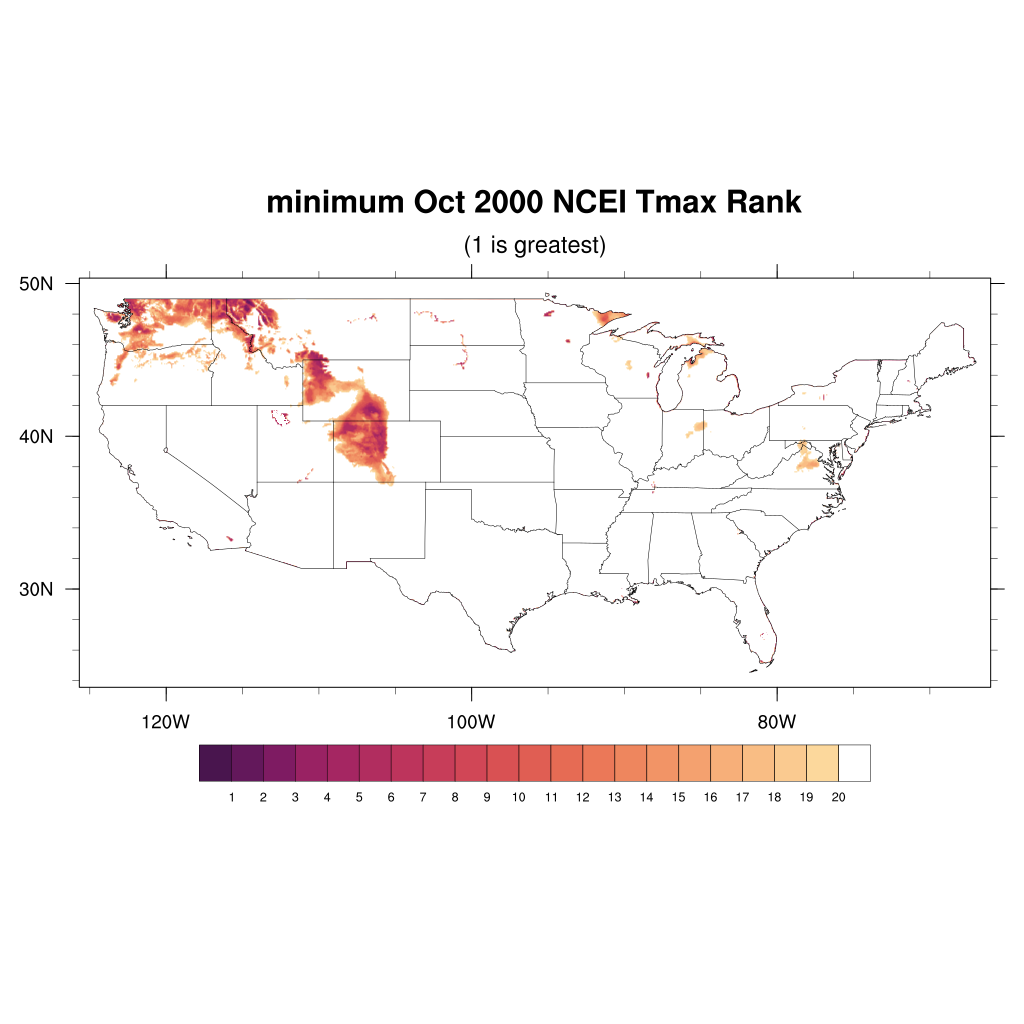
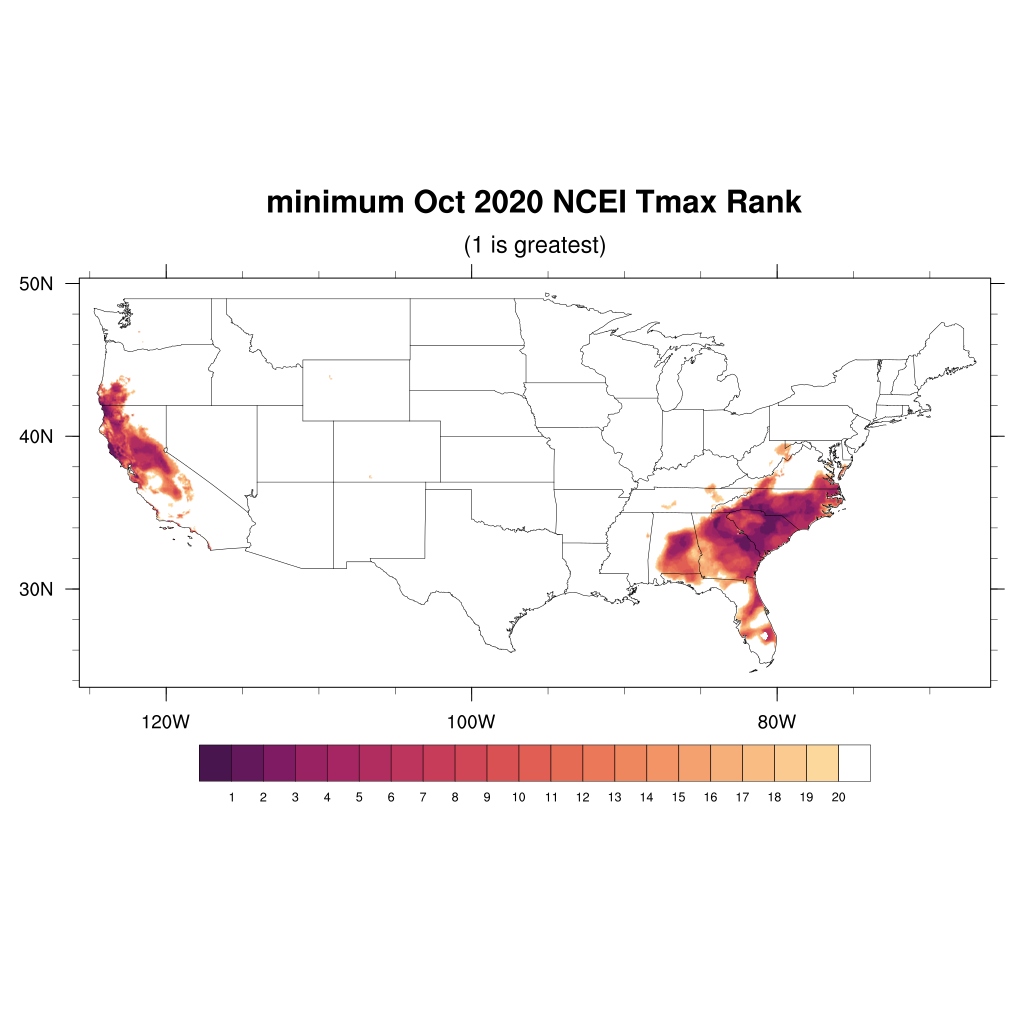
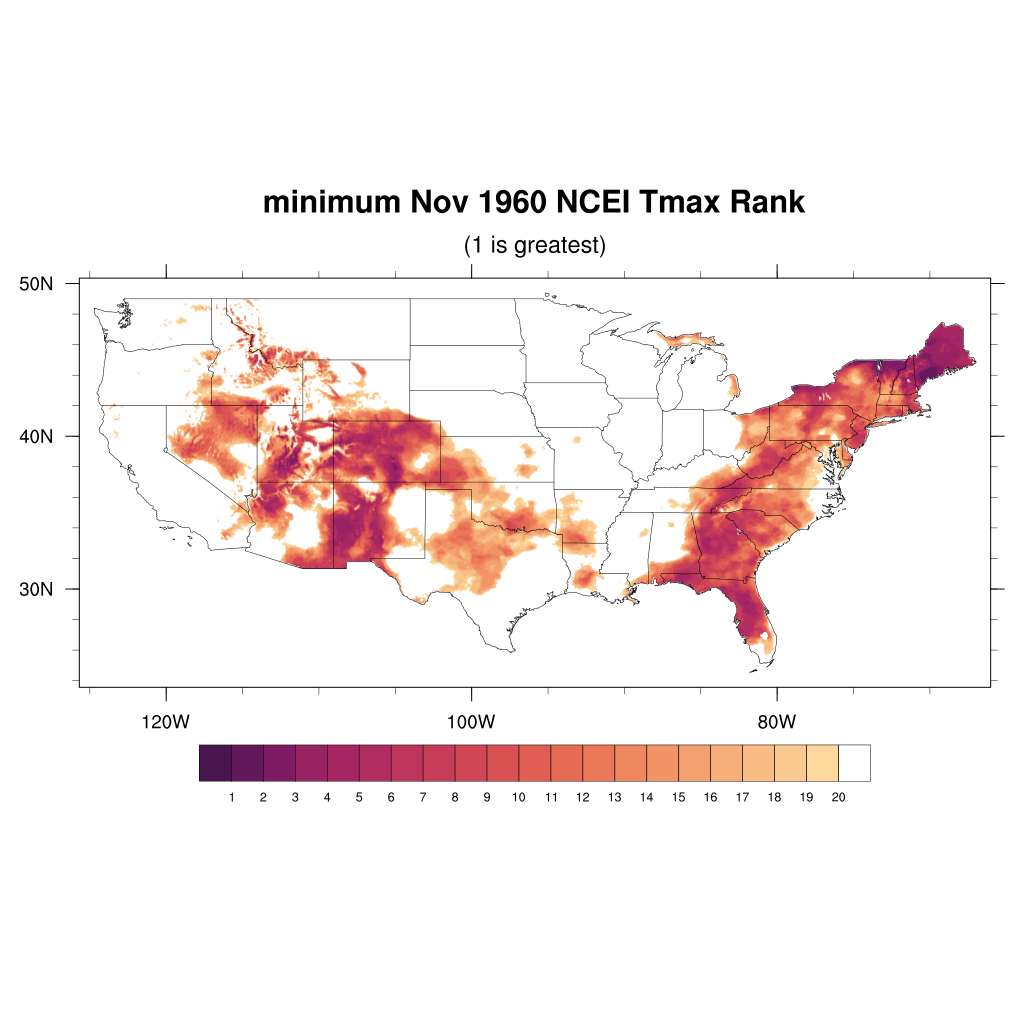
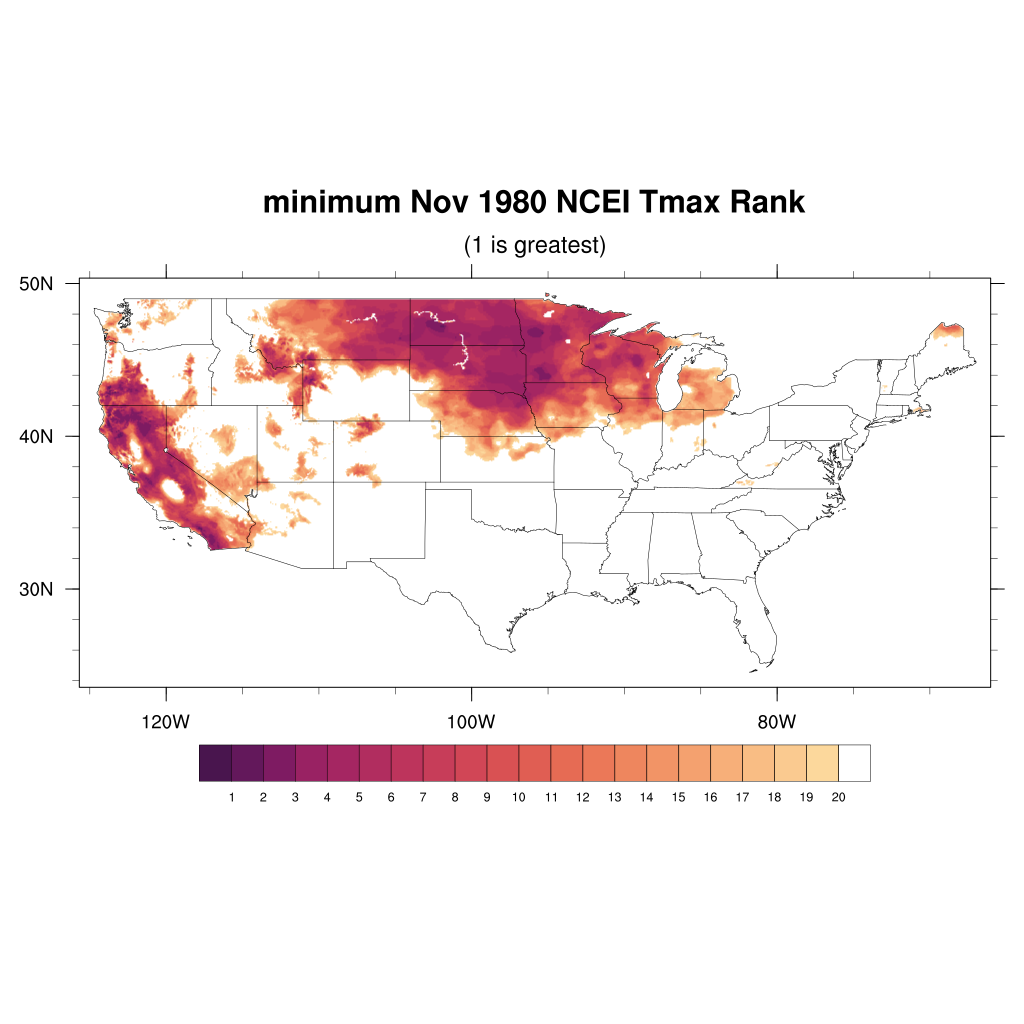
Below analyses done using monthly minimum Tmax per grid point
Rank of monthly (1-day) max Tmax per grid point -- showing sample years
ranks computed with all available data (Jan 1951 - Dec 2021)


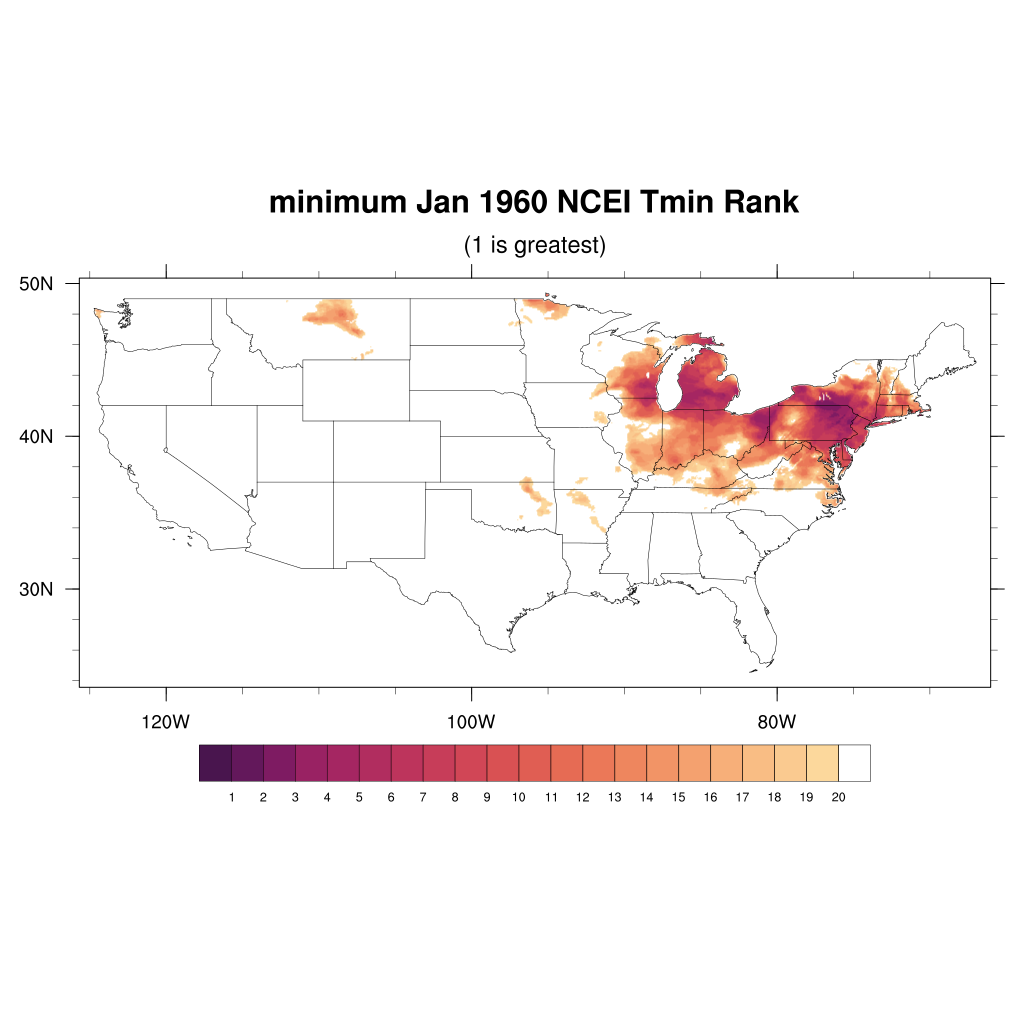
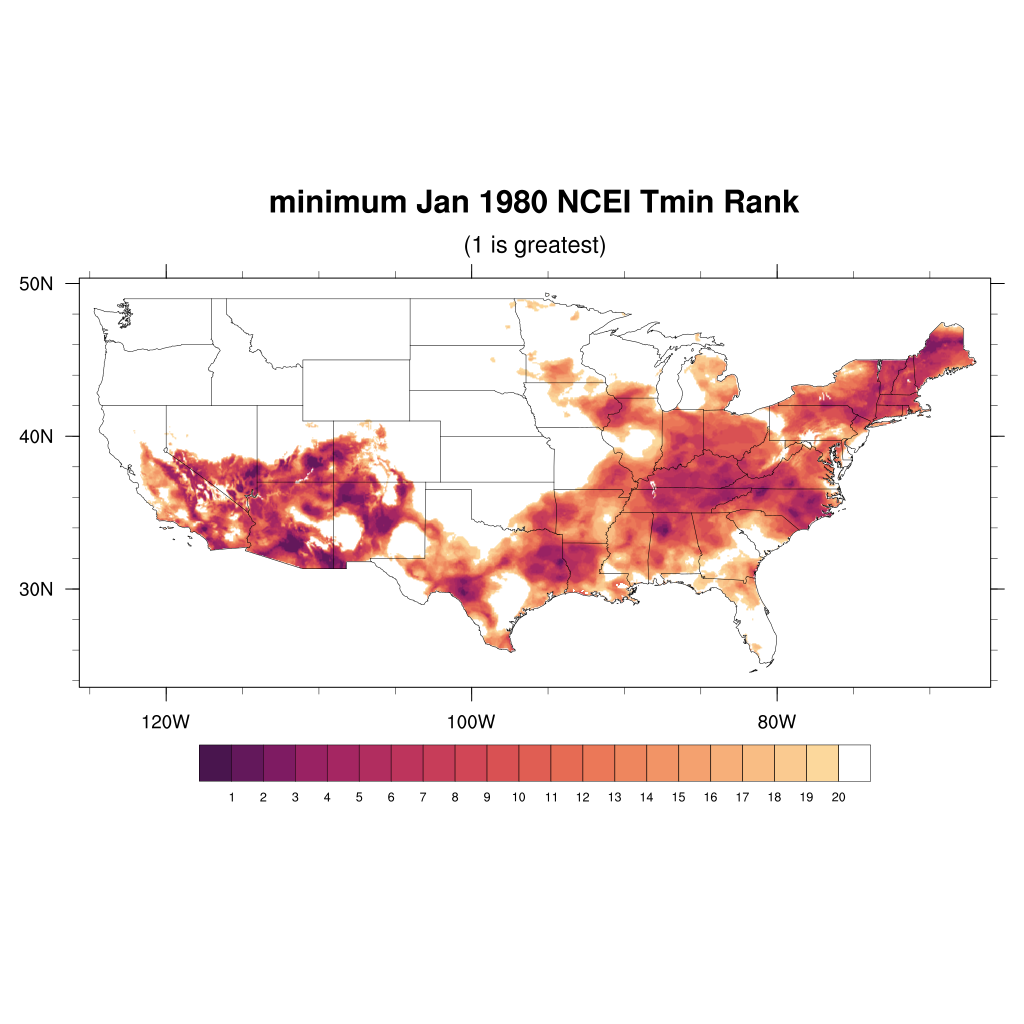
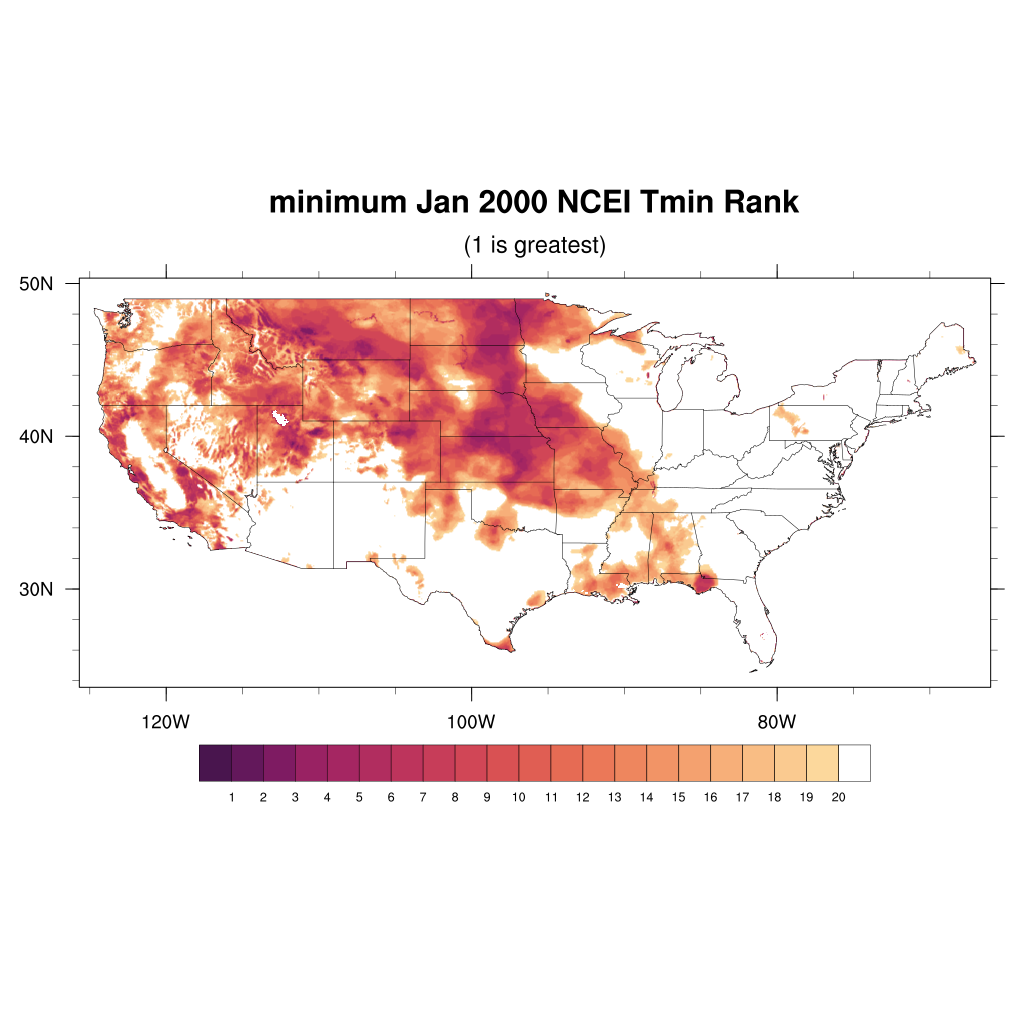
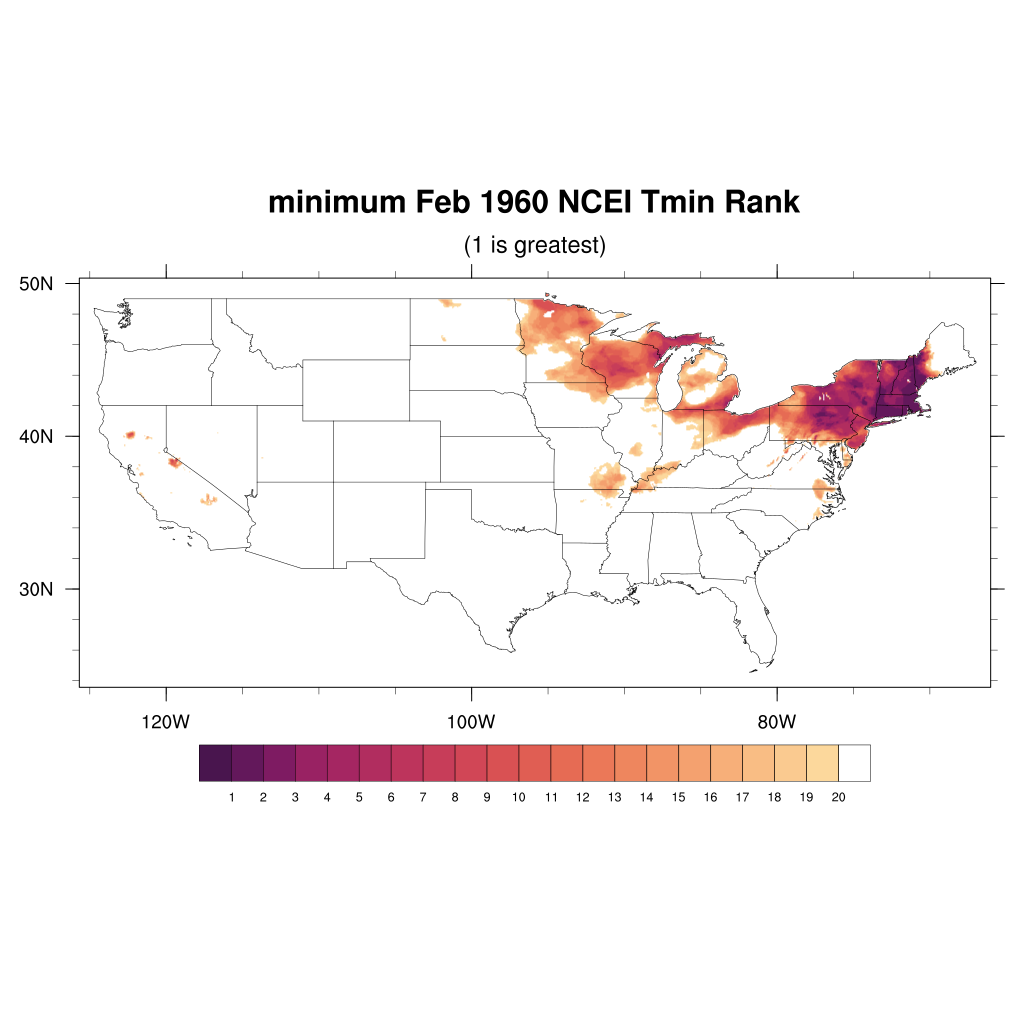
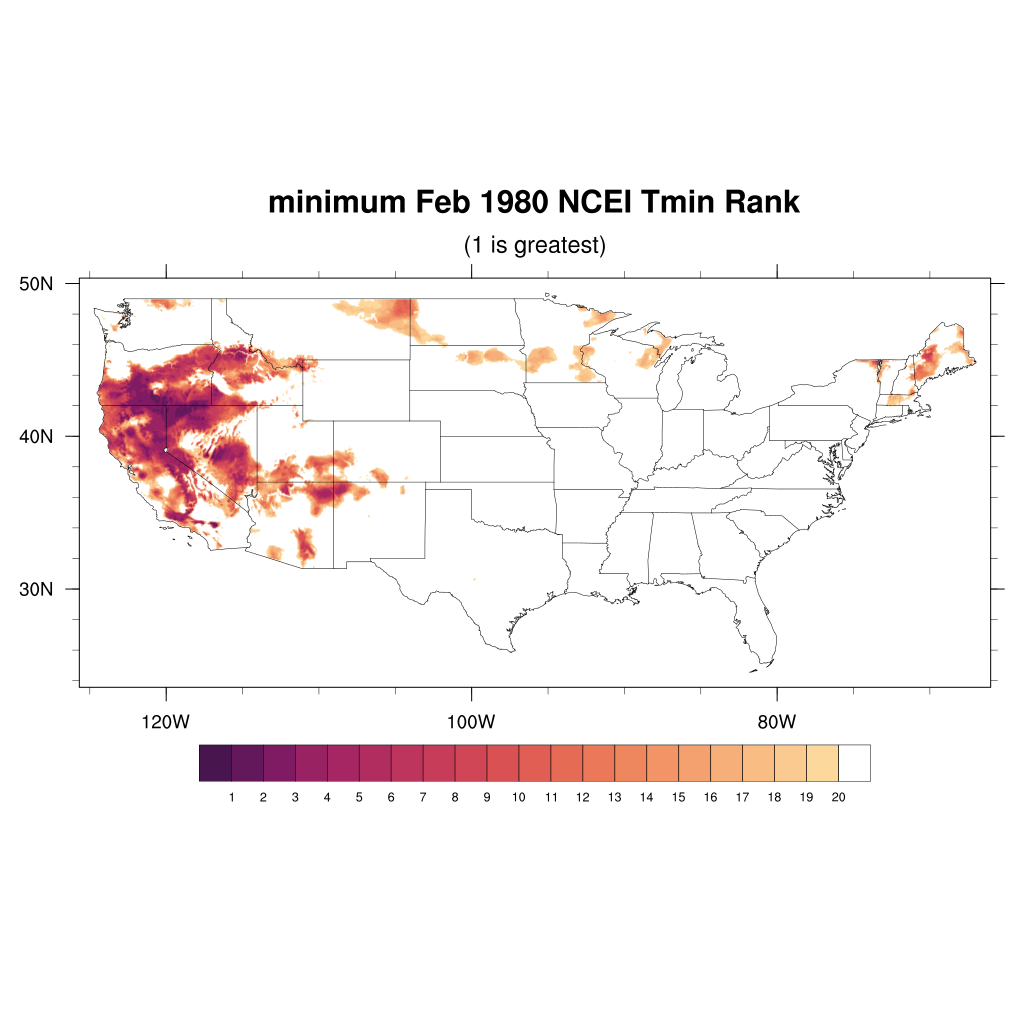
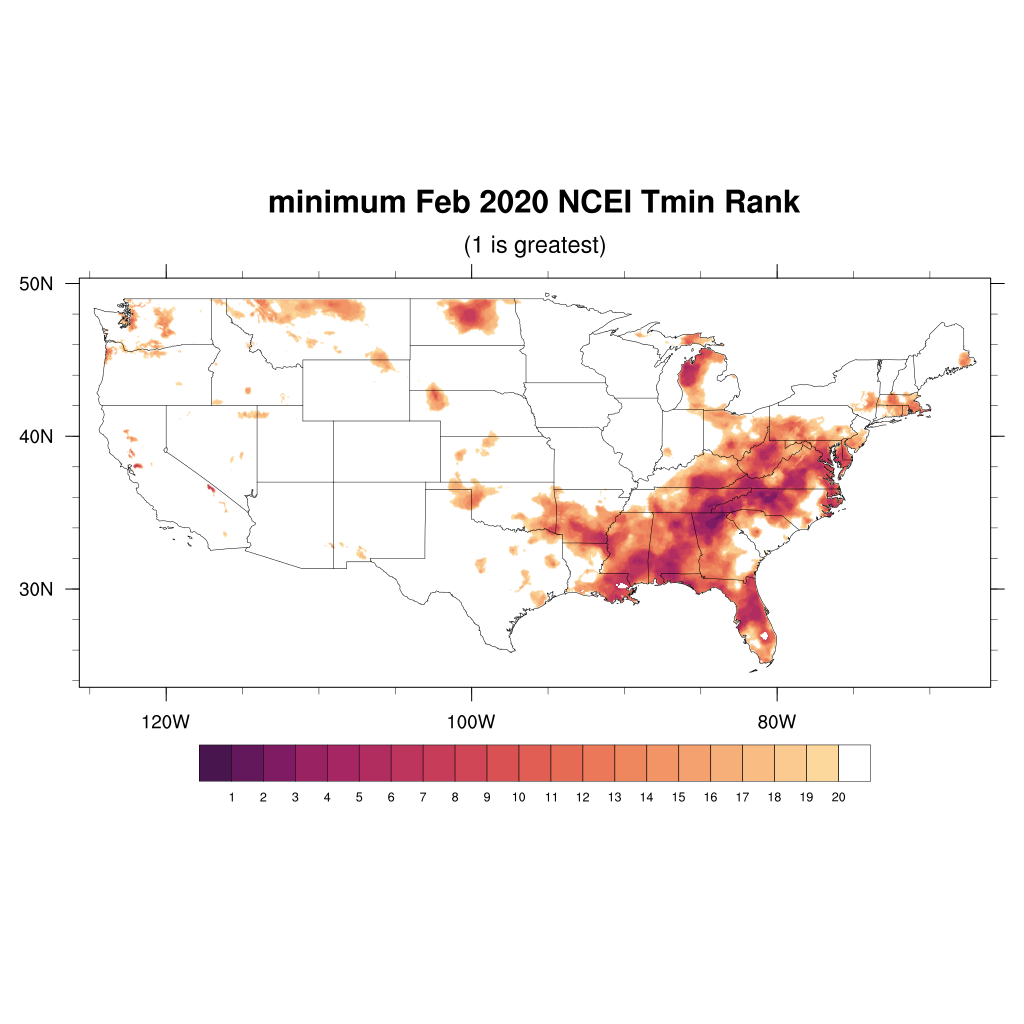
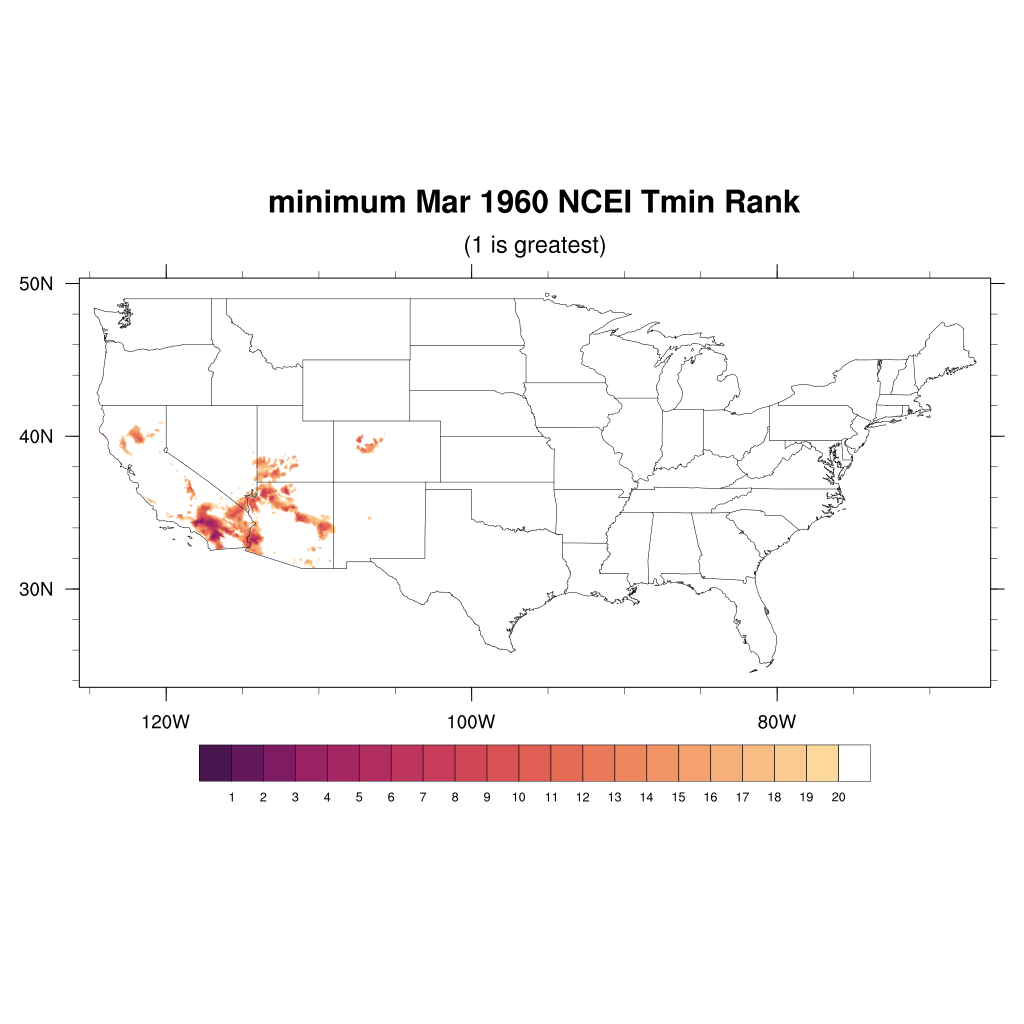
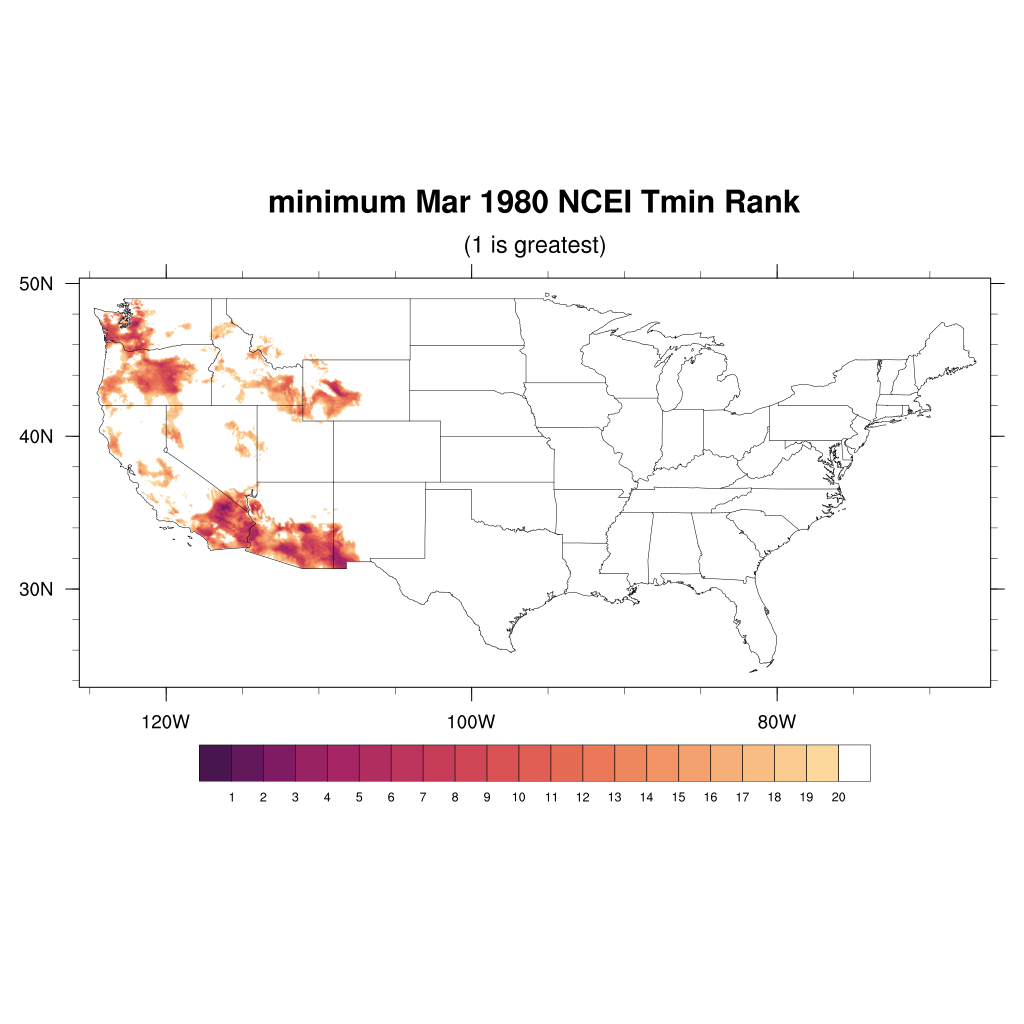
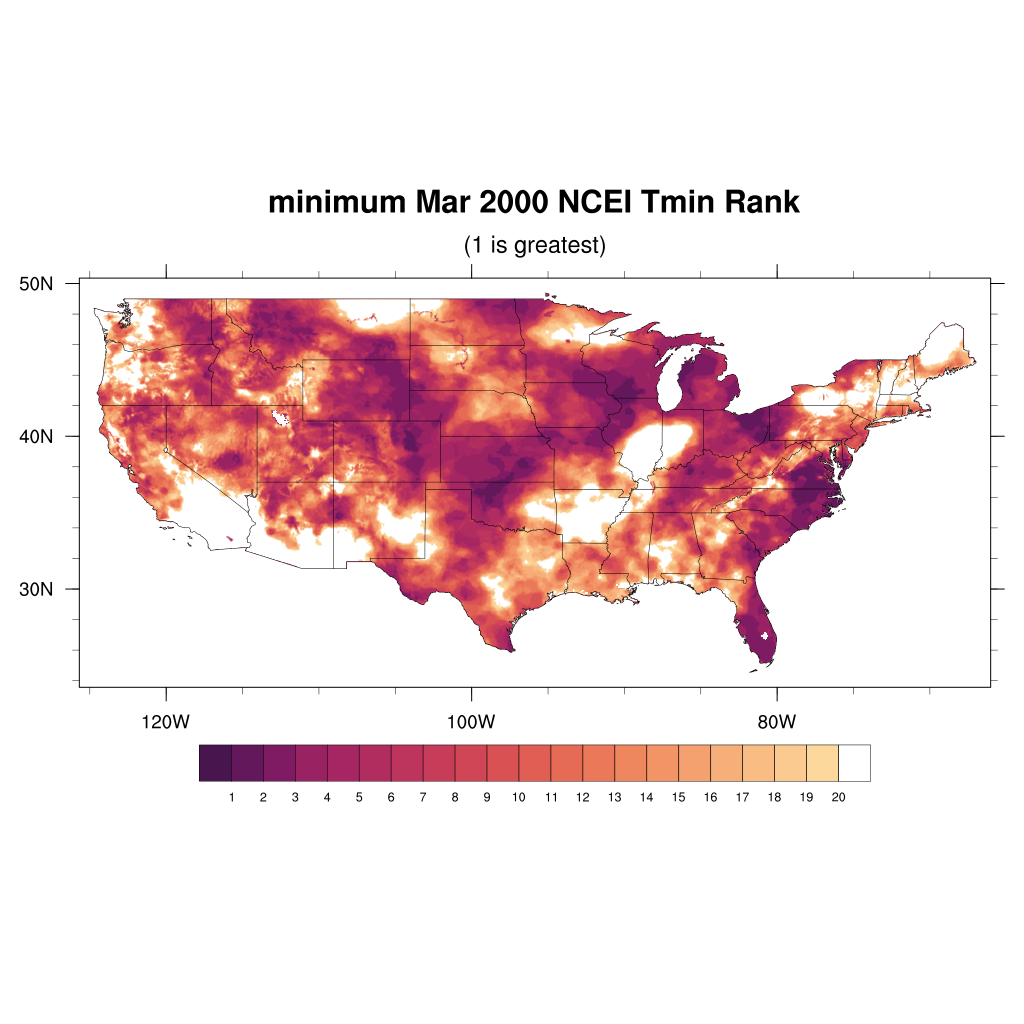
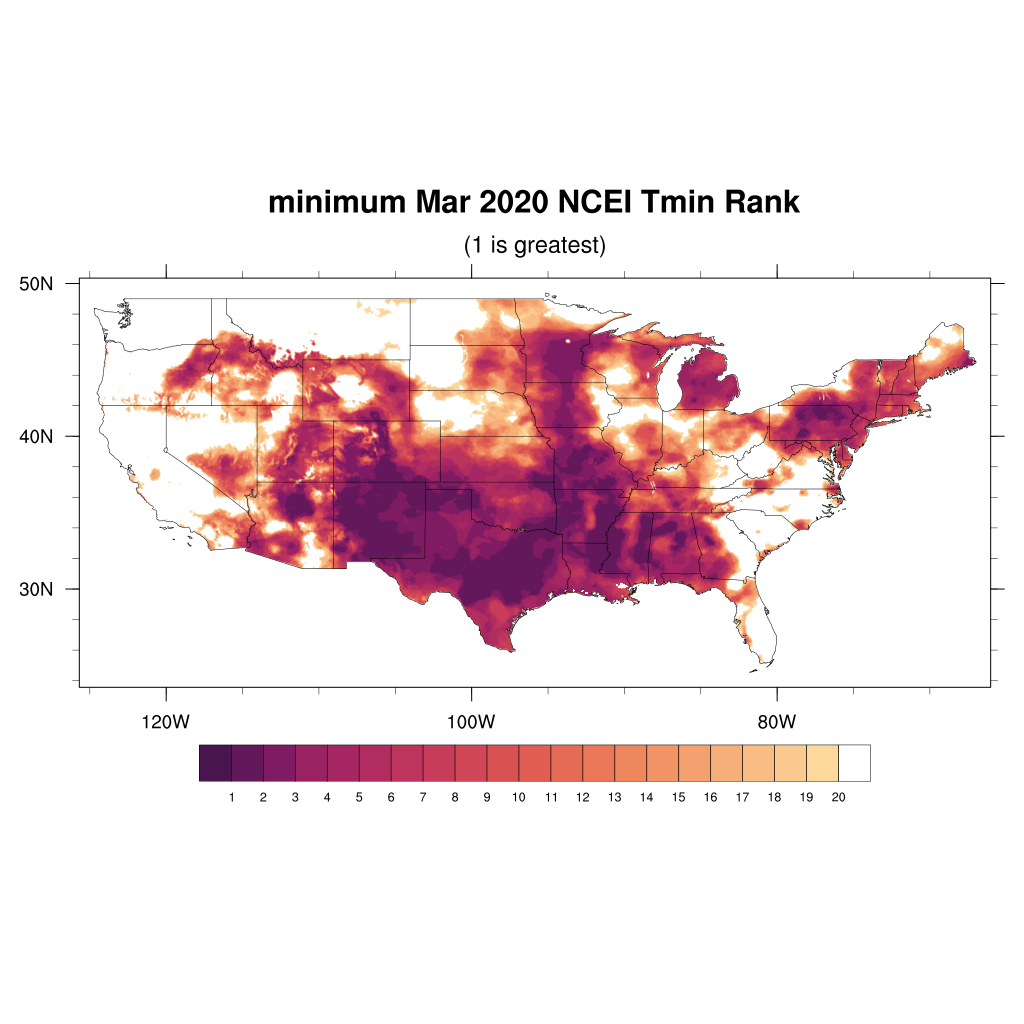
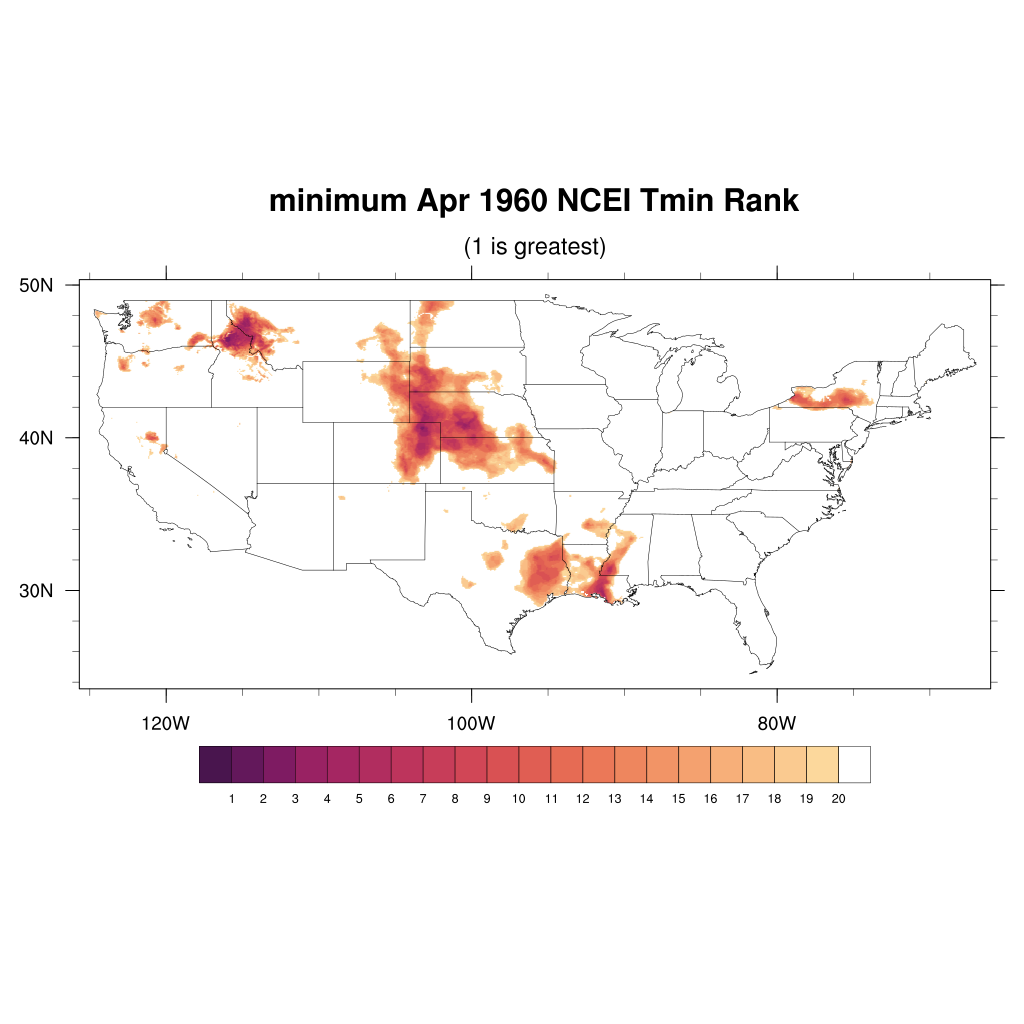
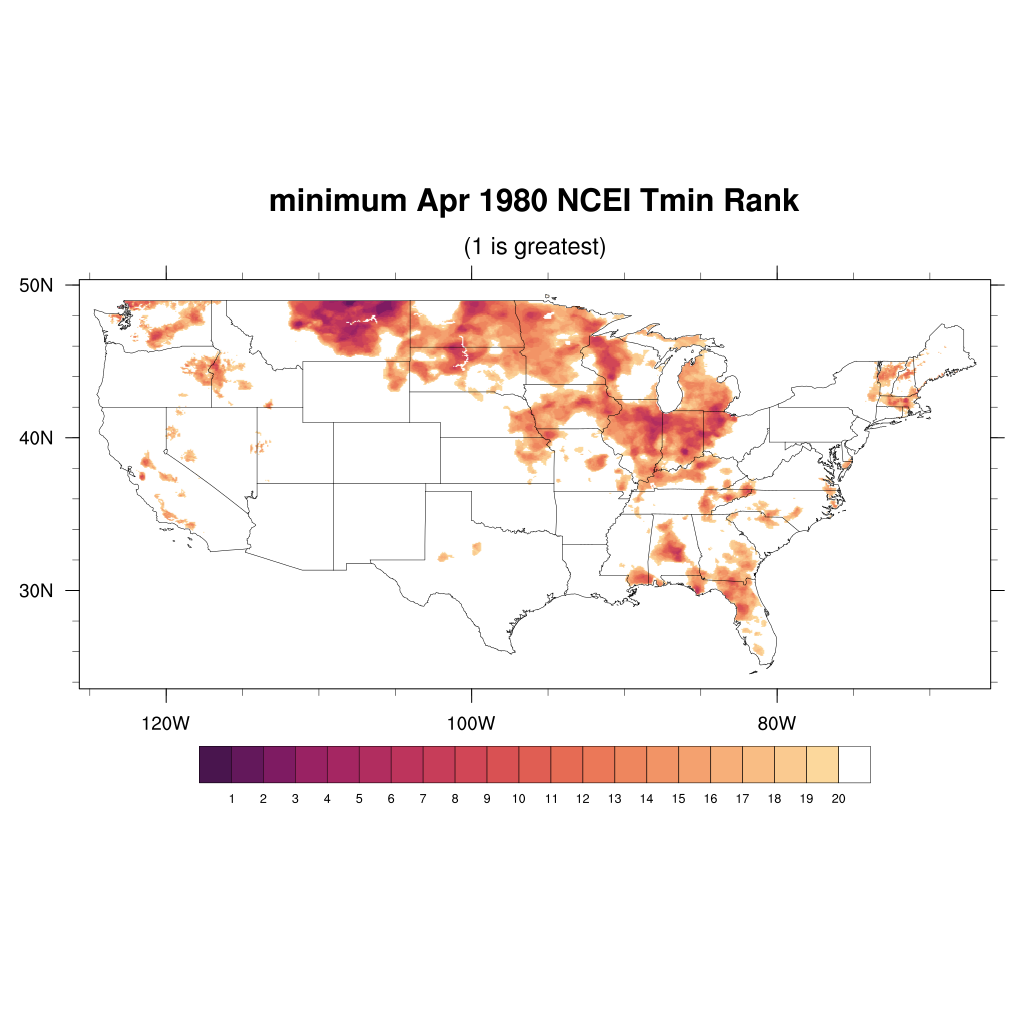
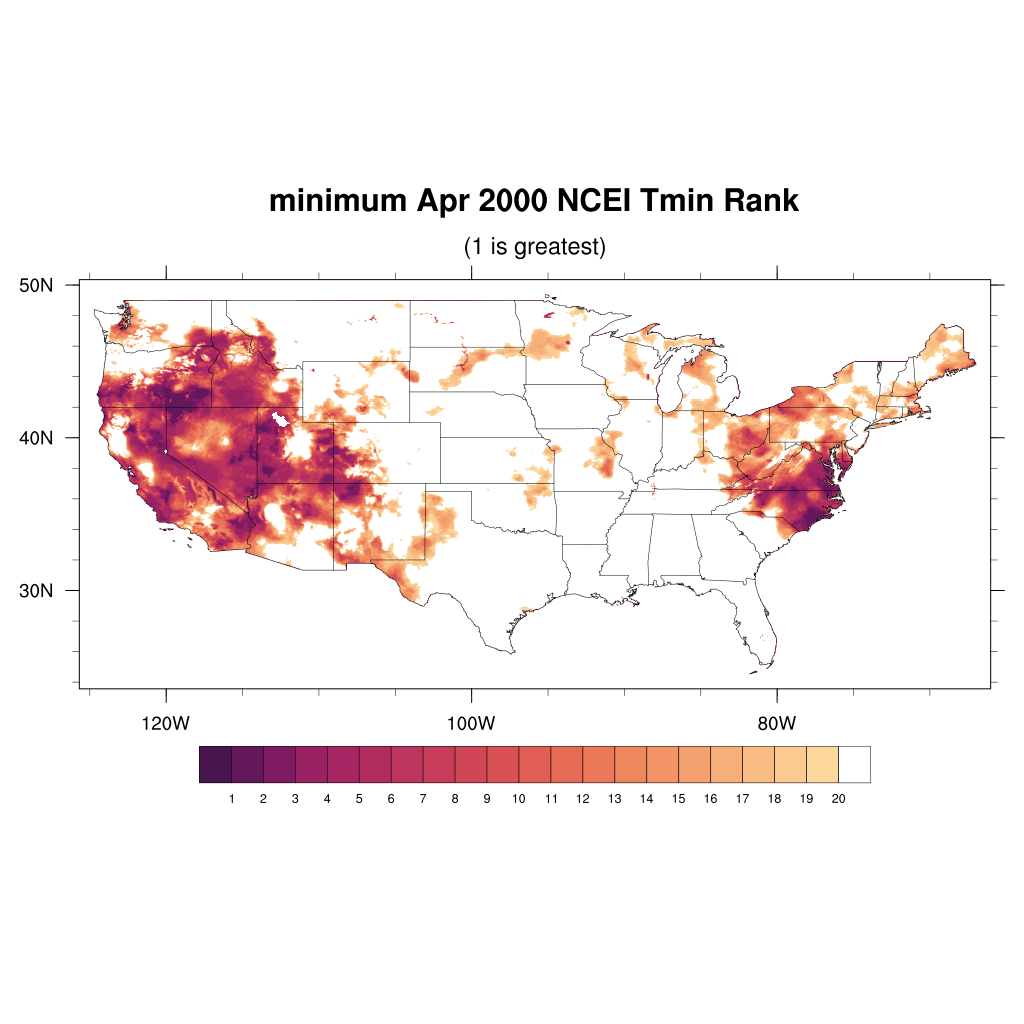
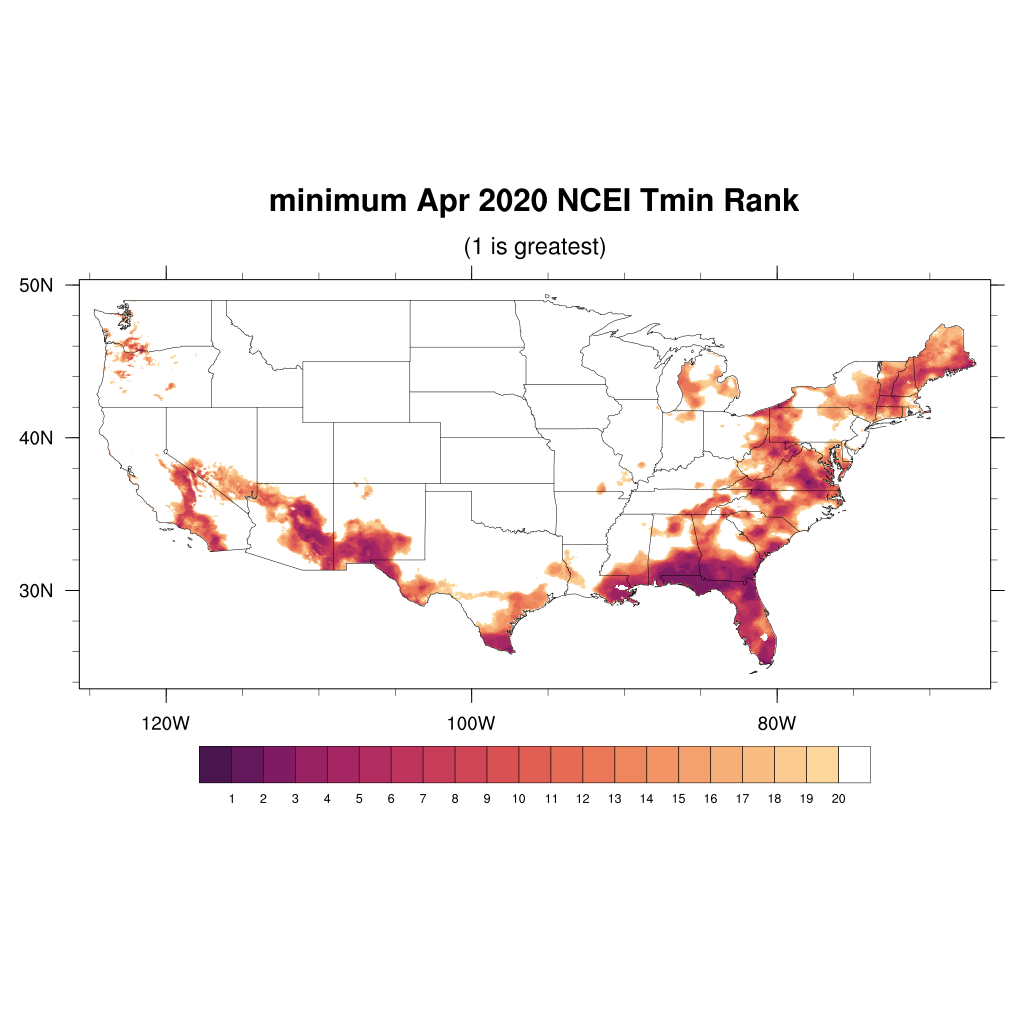
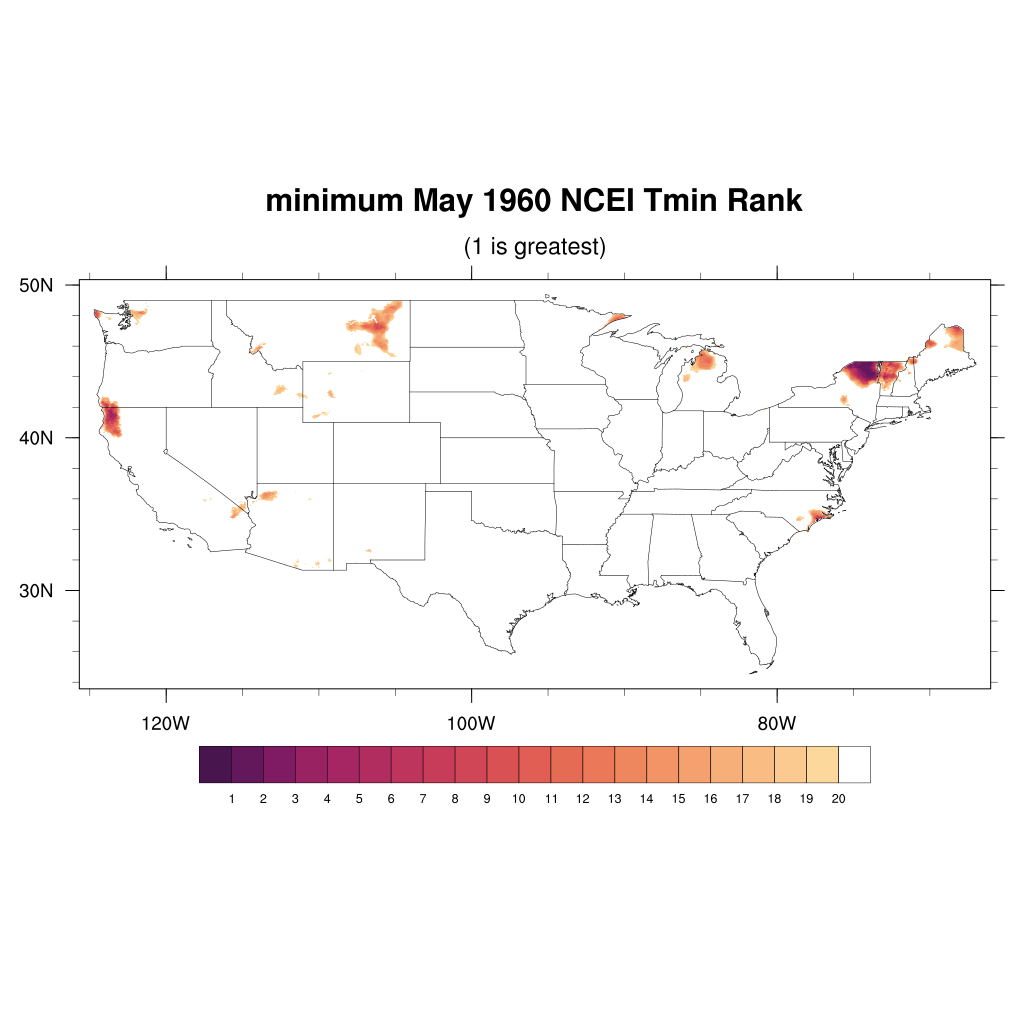
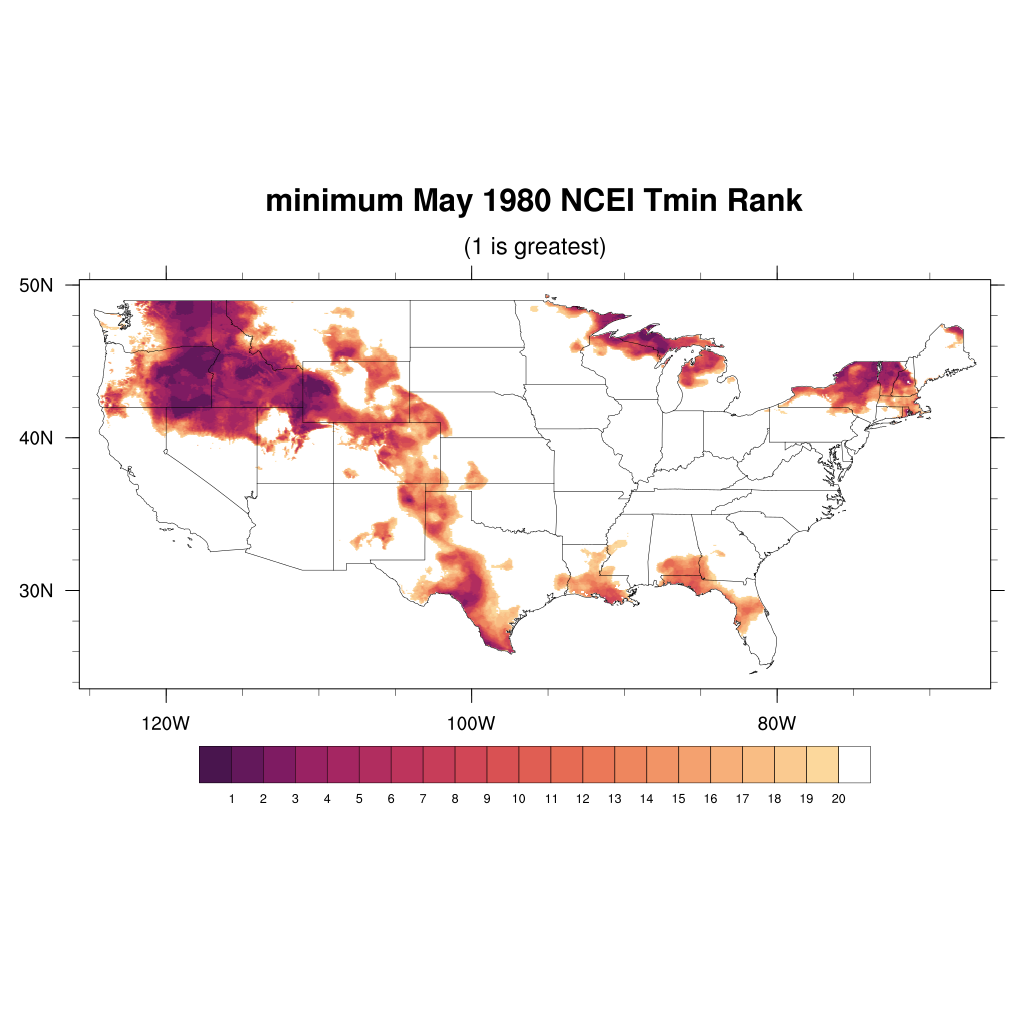
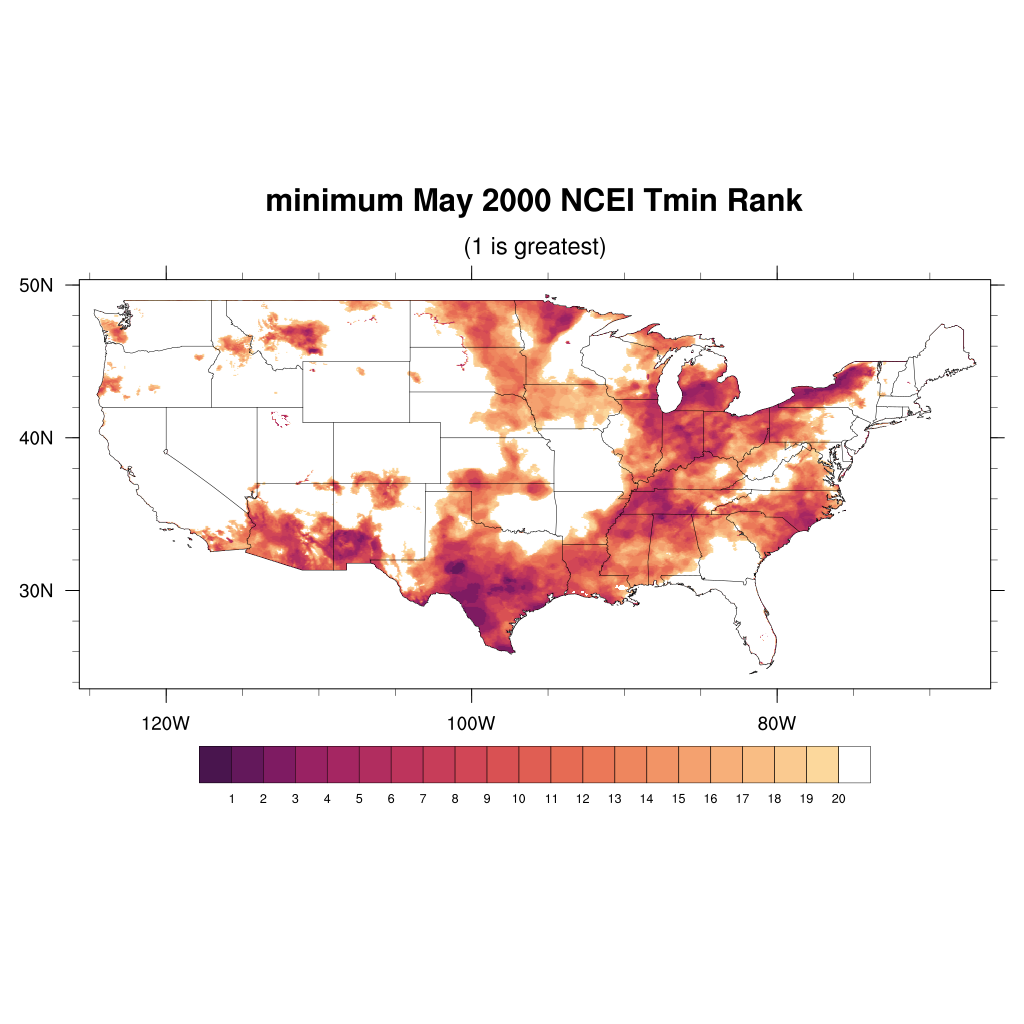
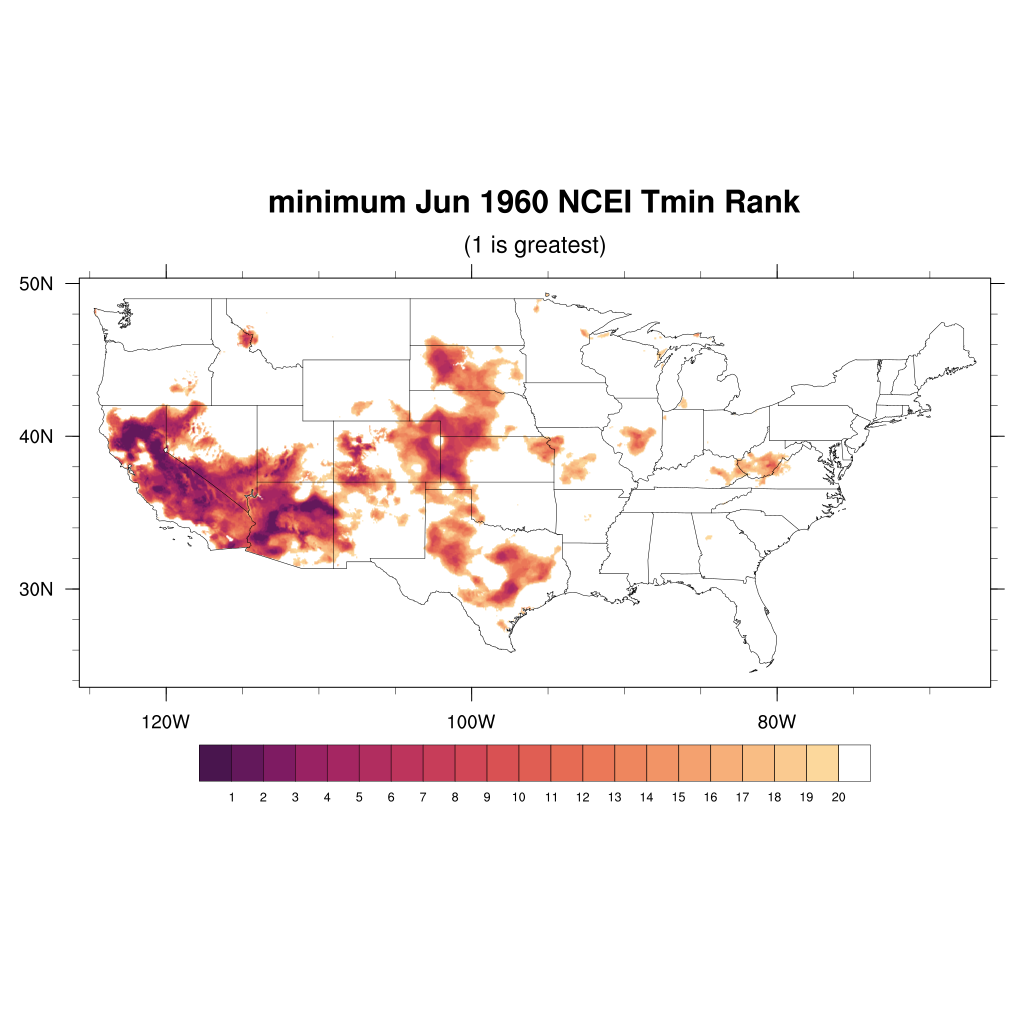
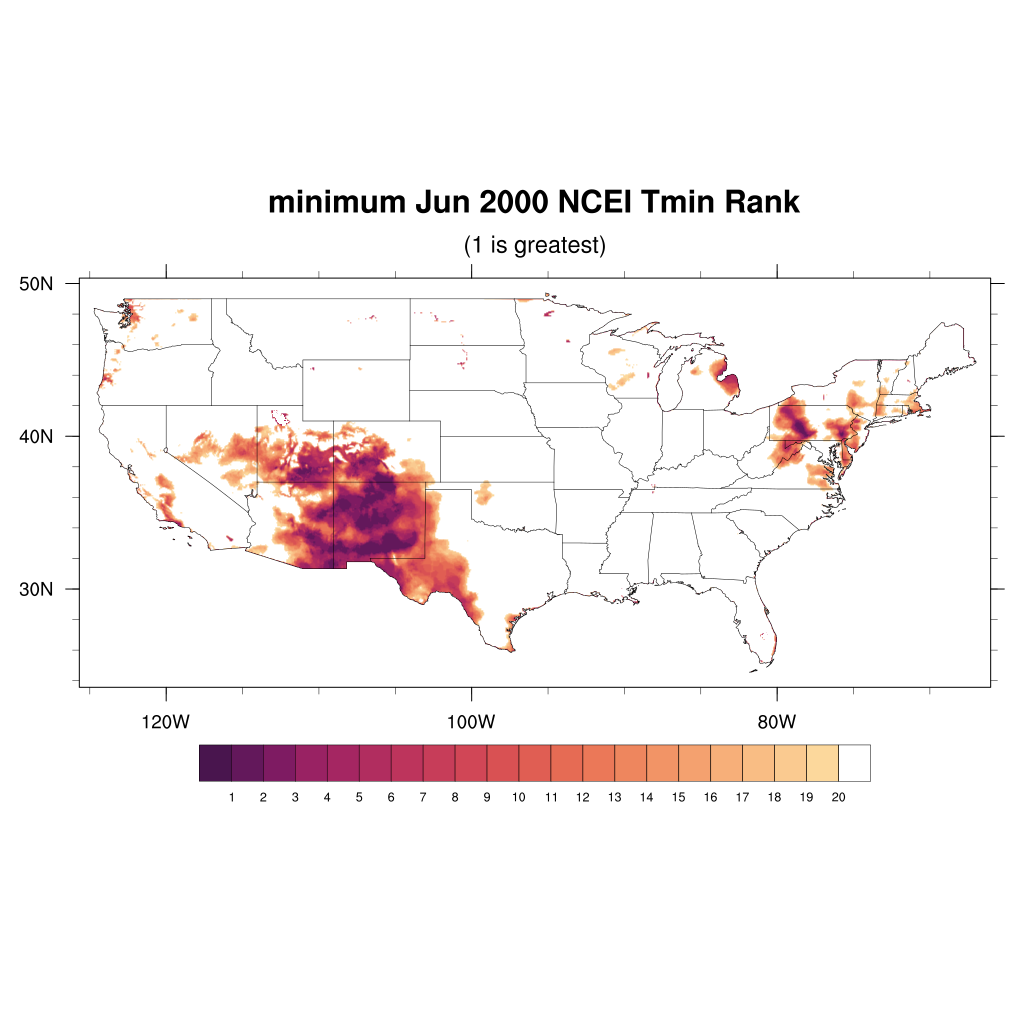
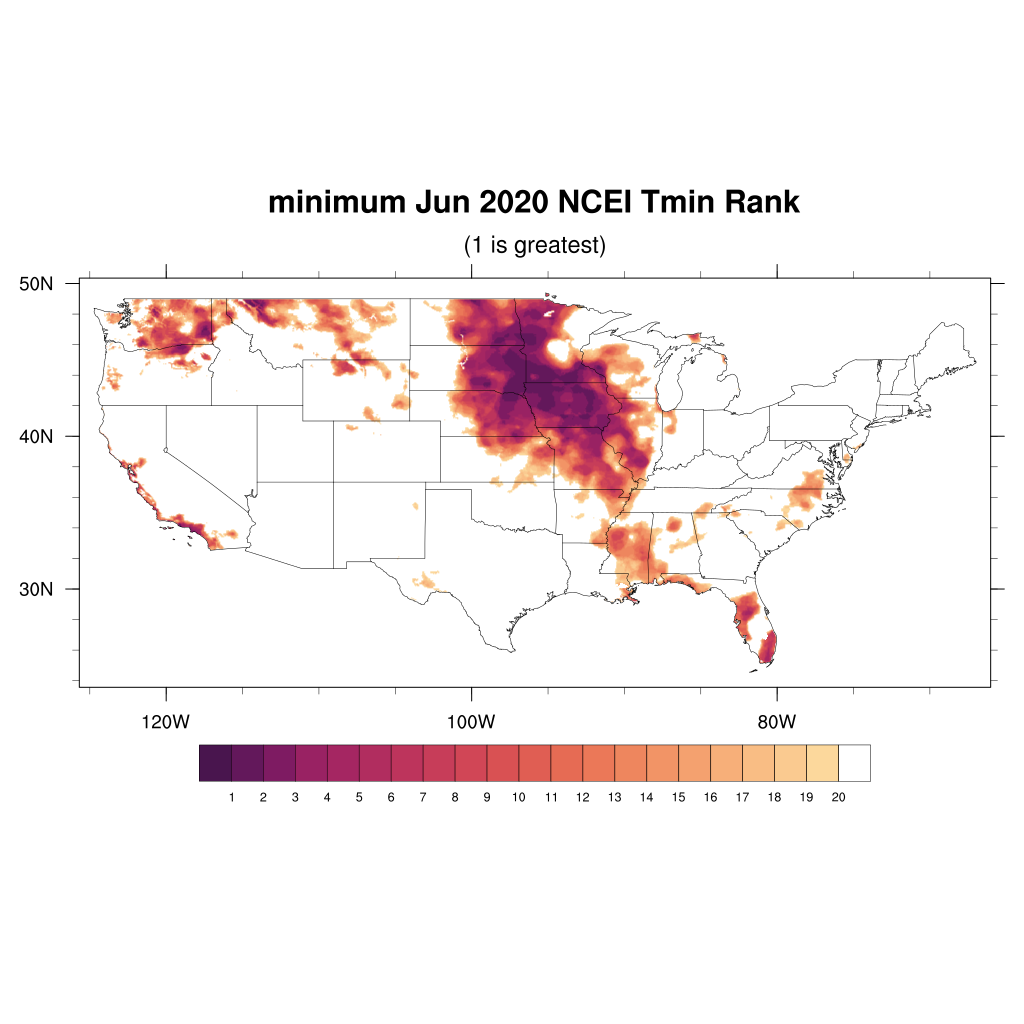
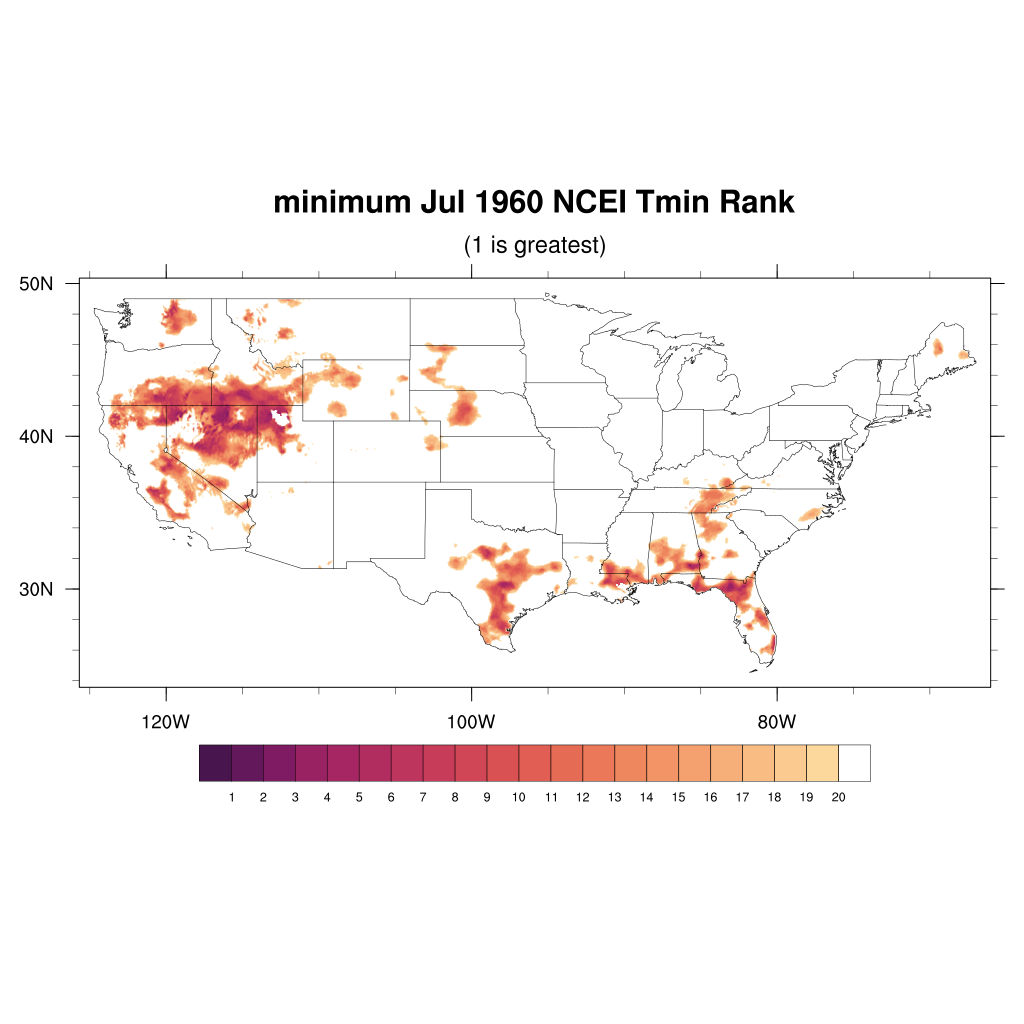
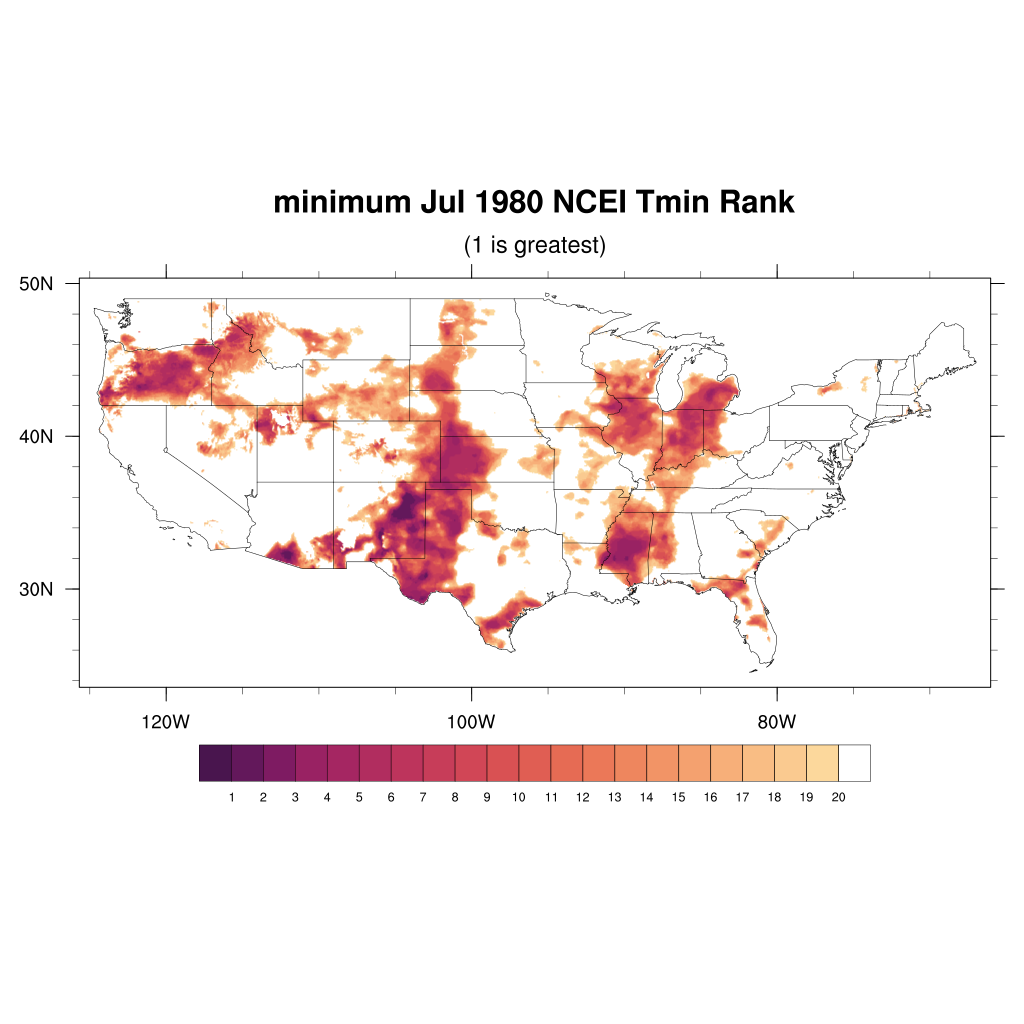
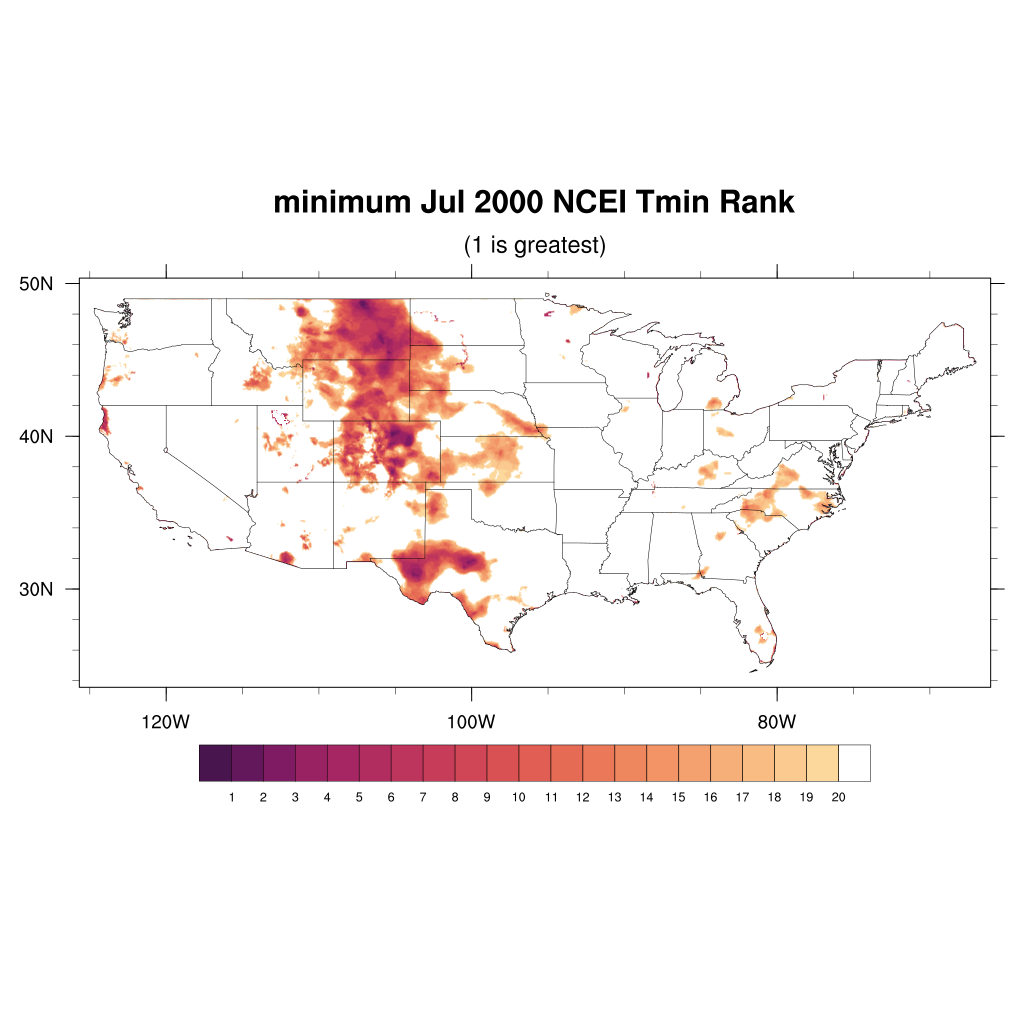
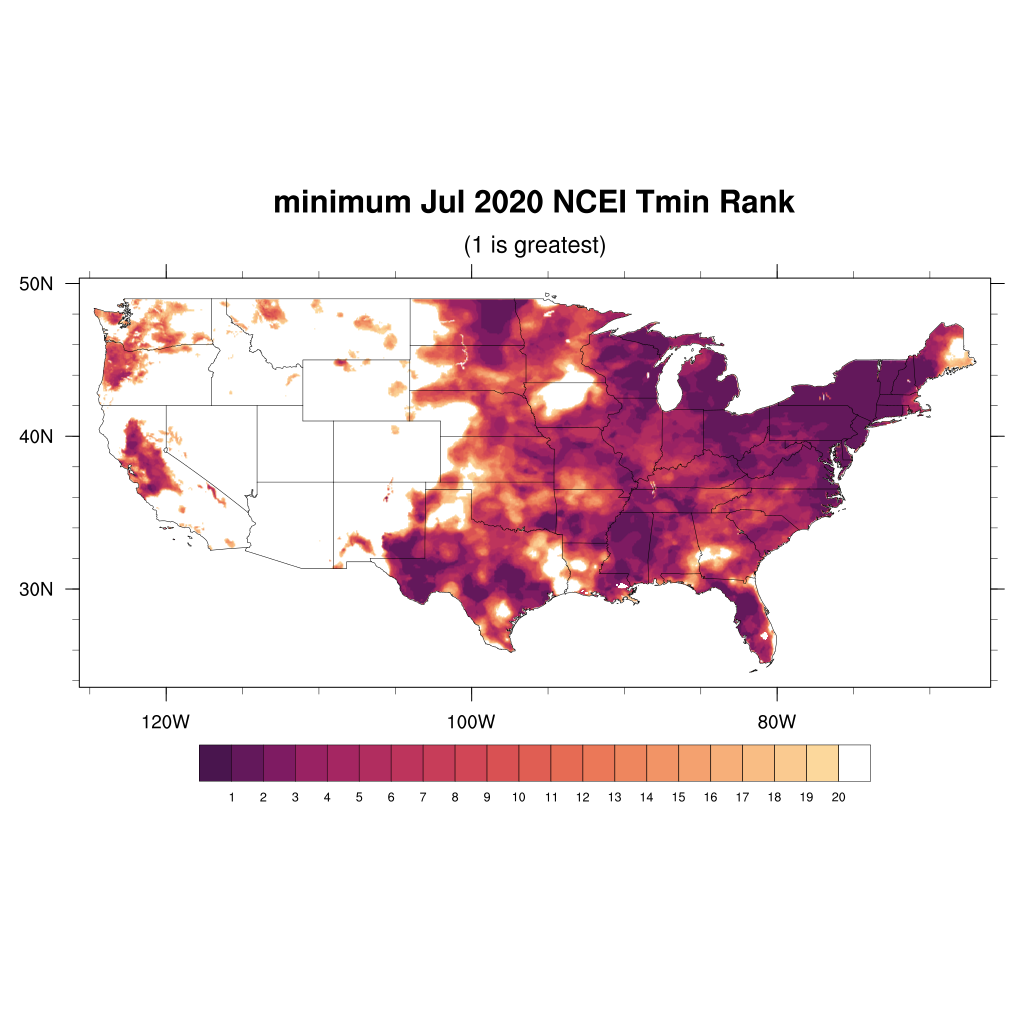
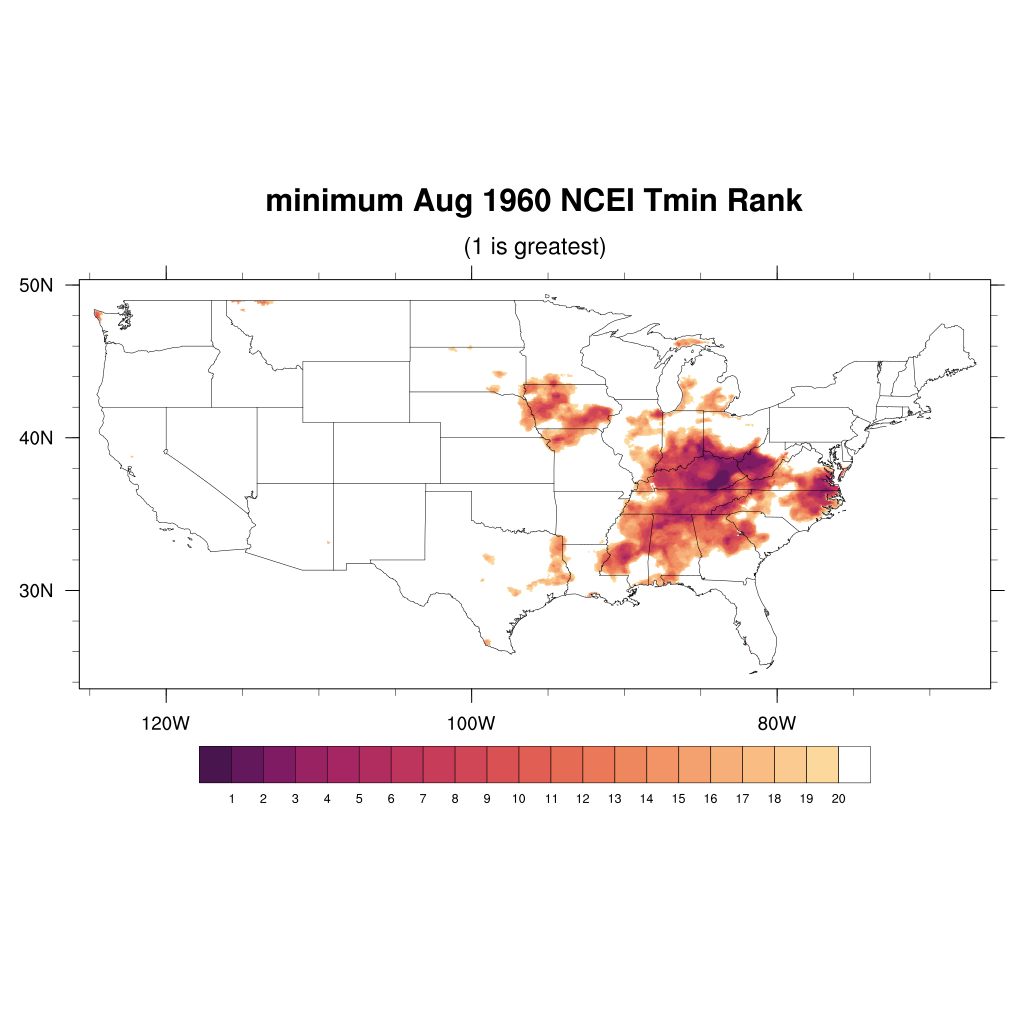
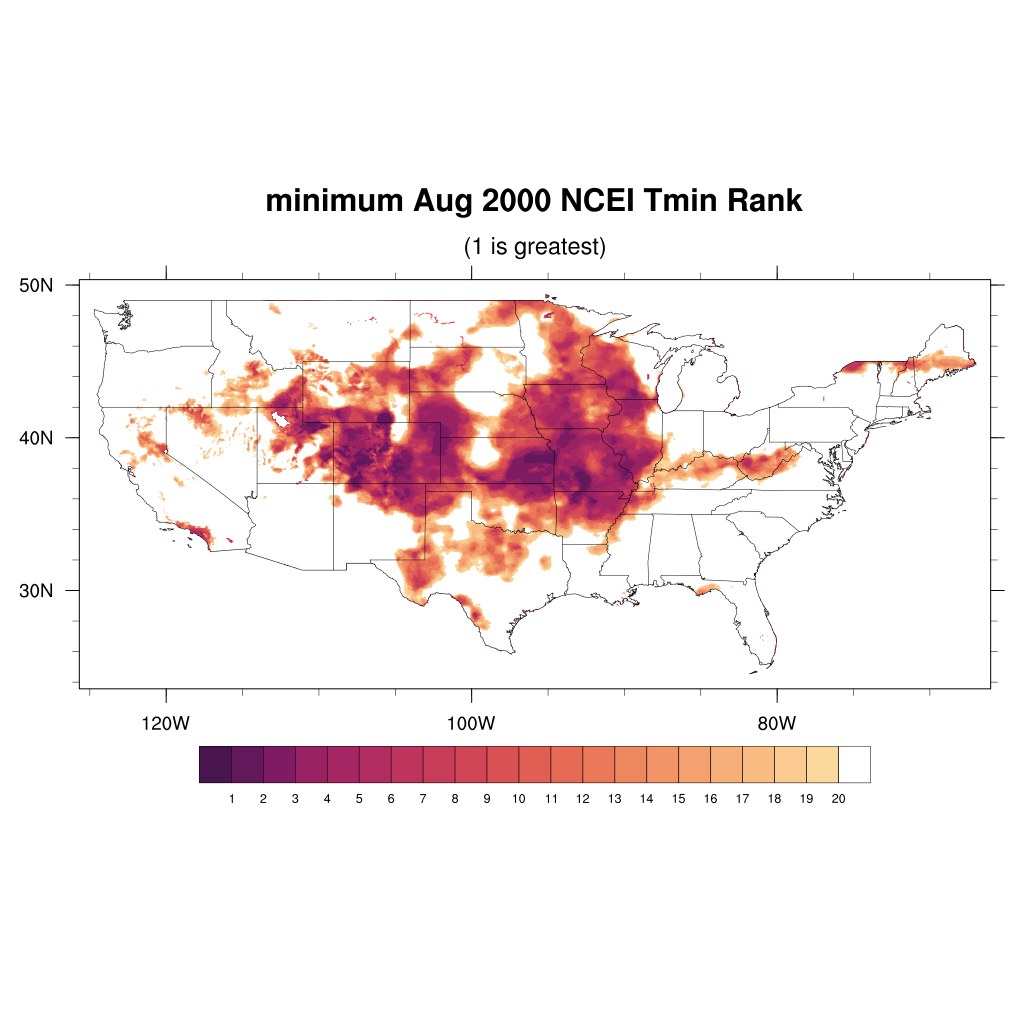
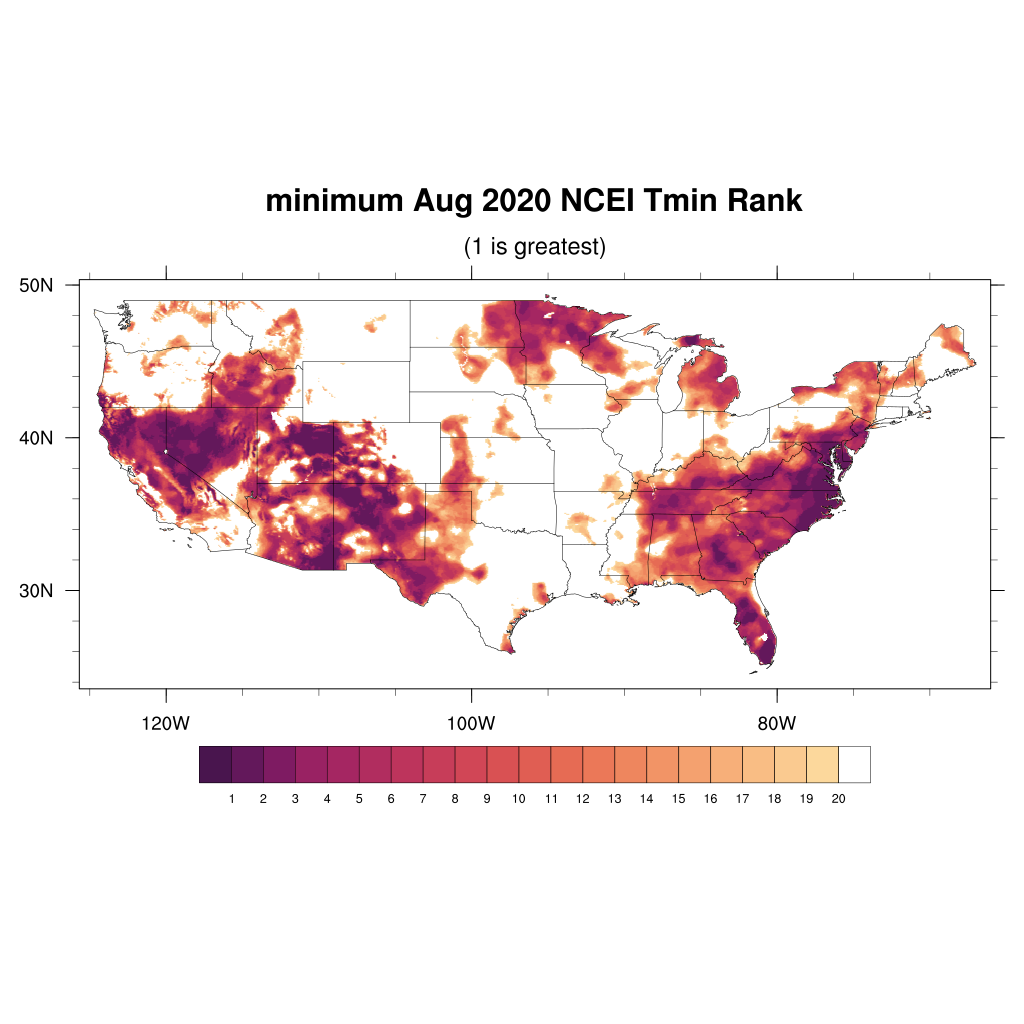
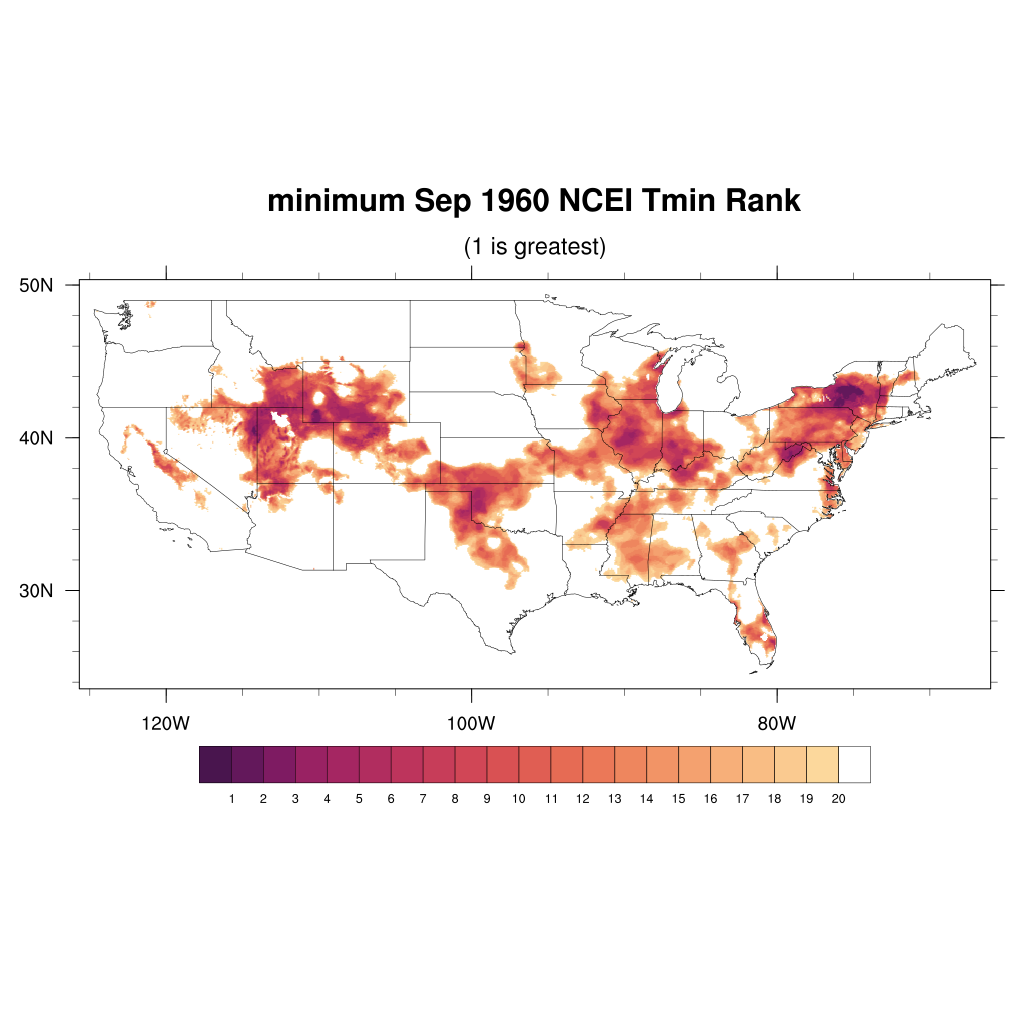
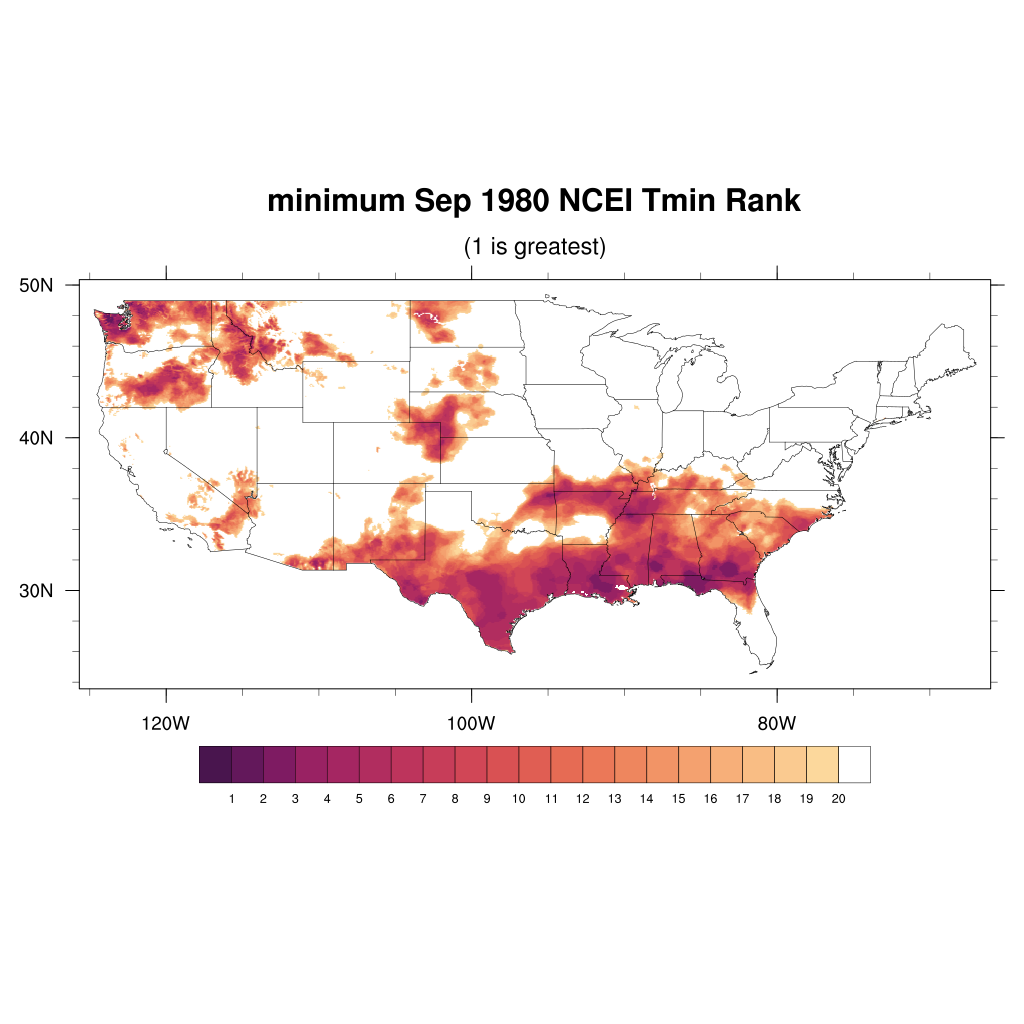
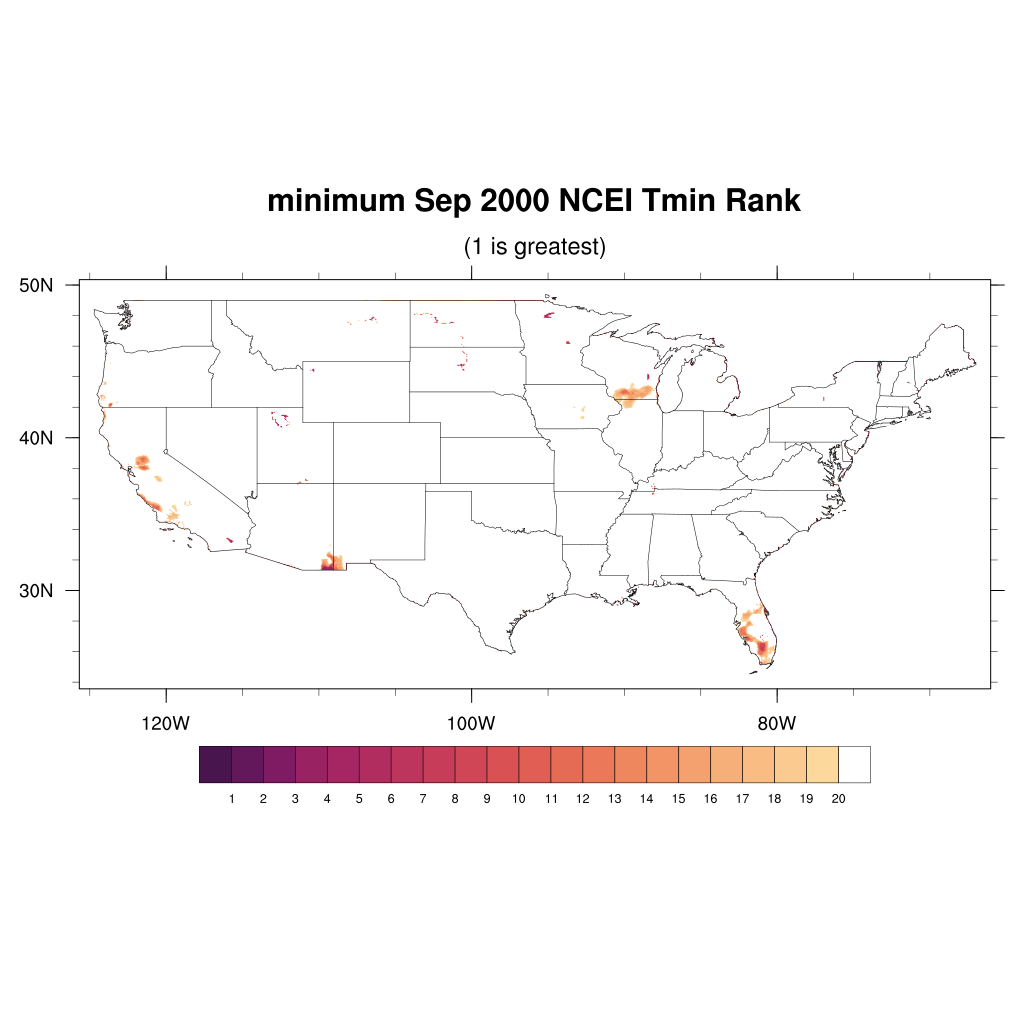
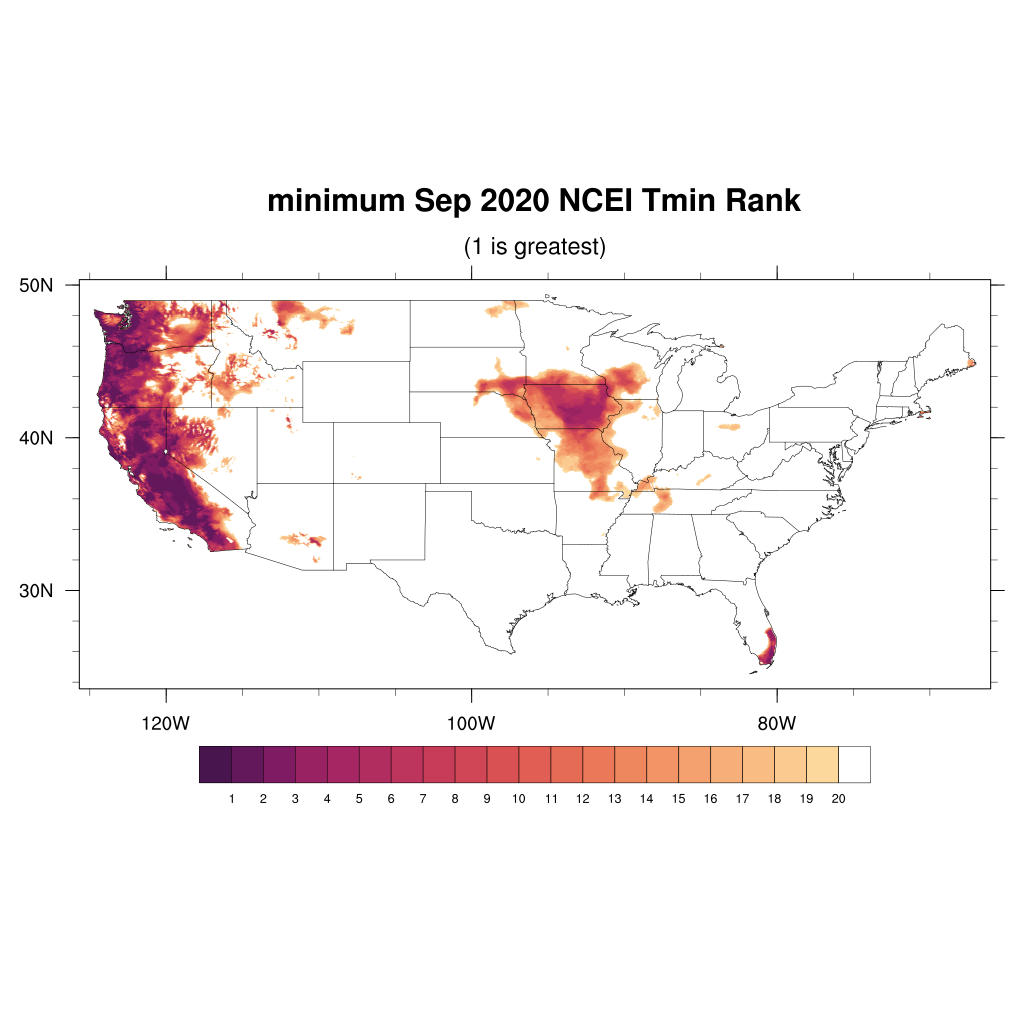
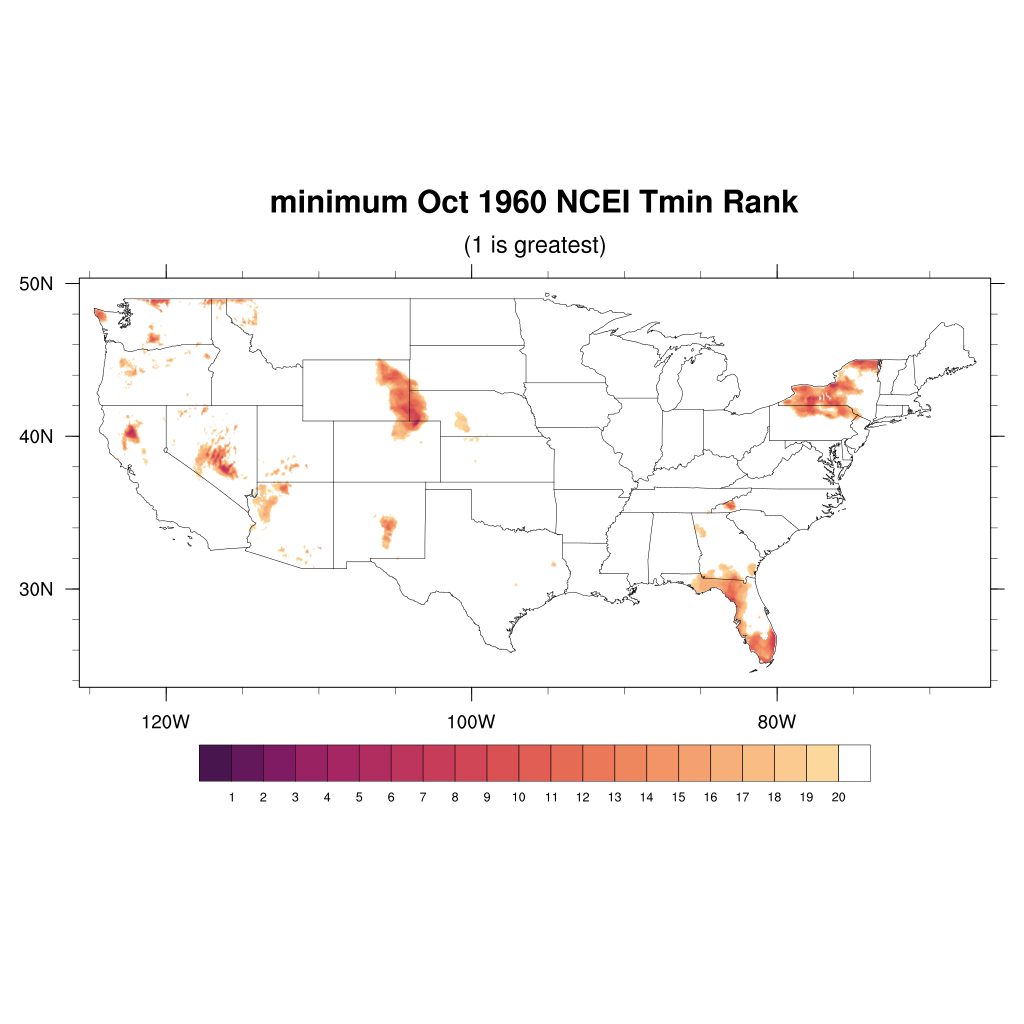
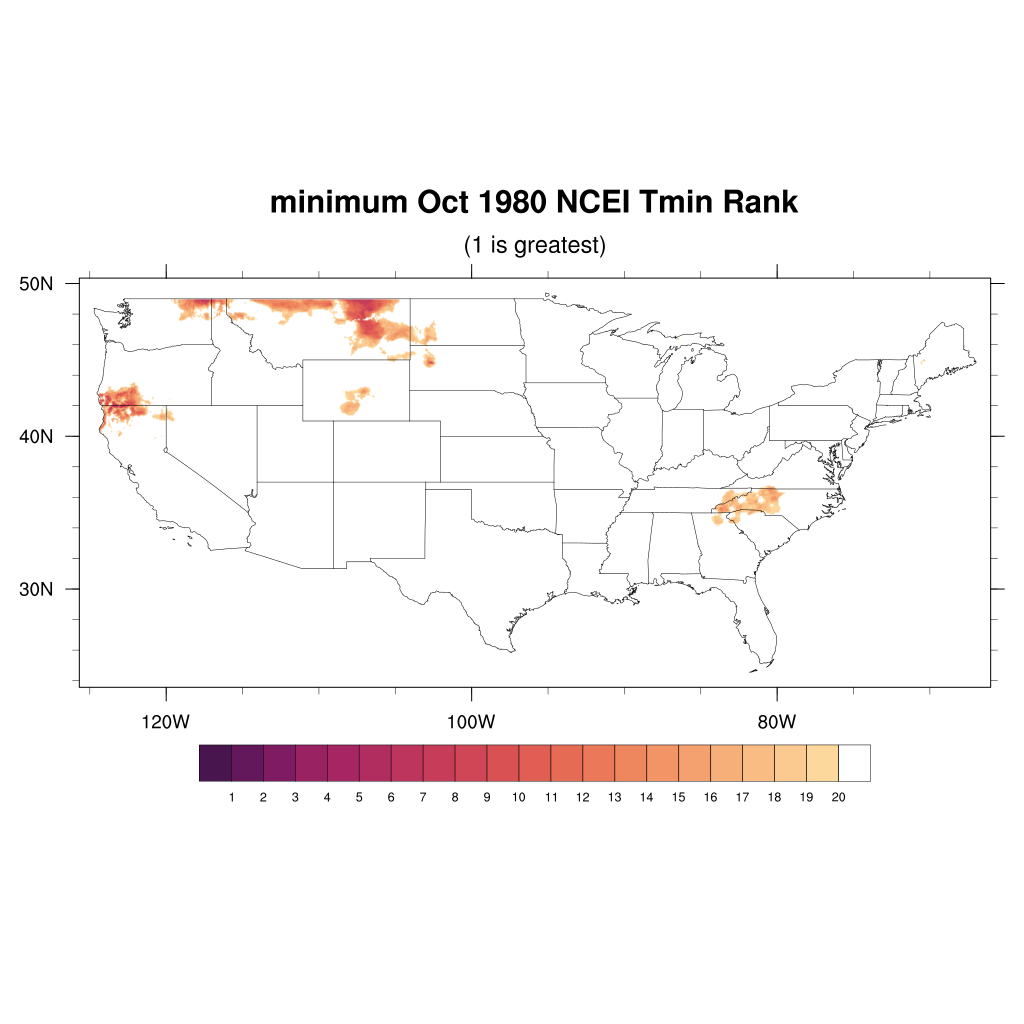
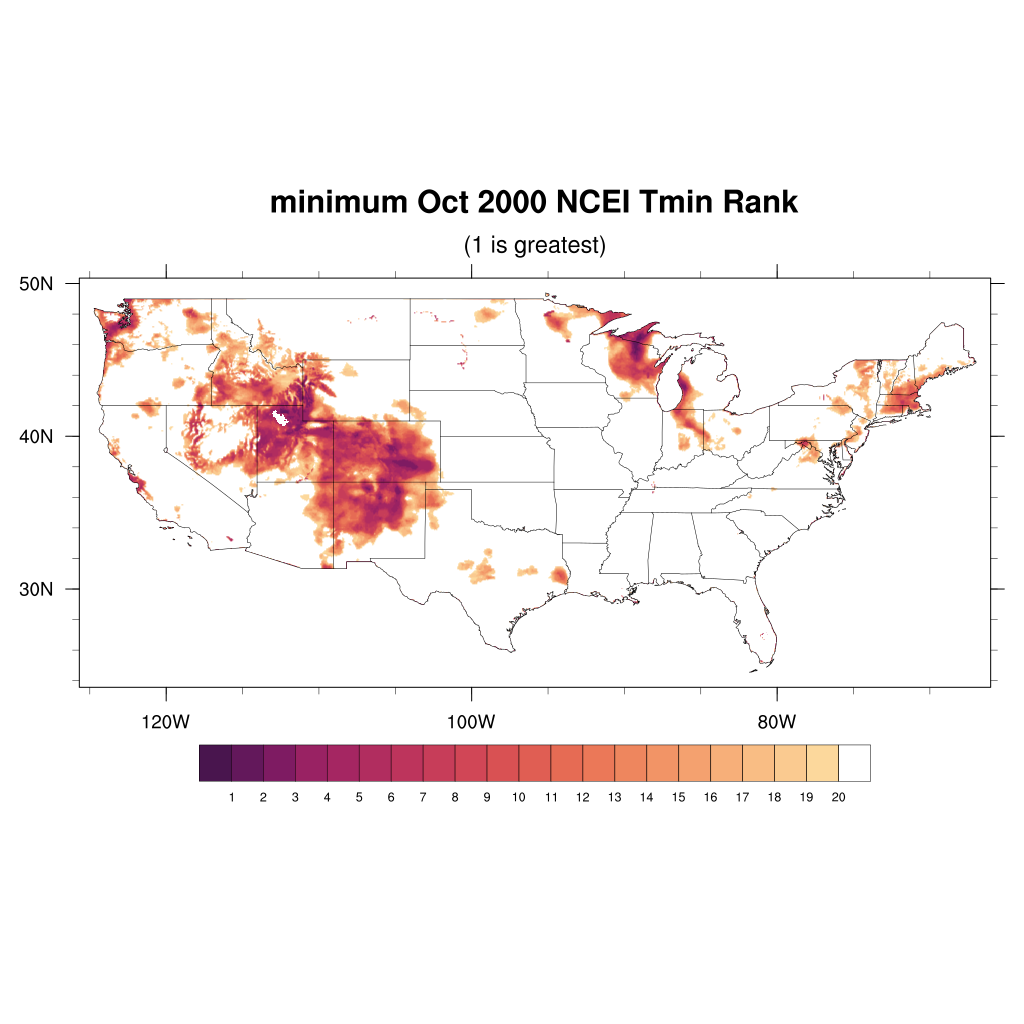
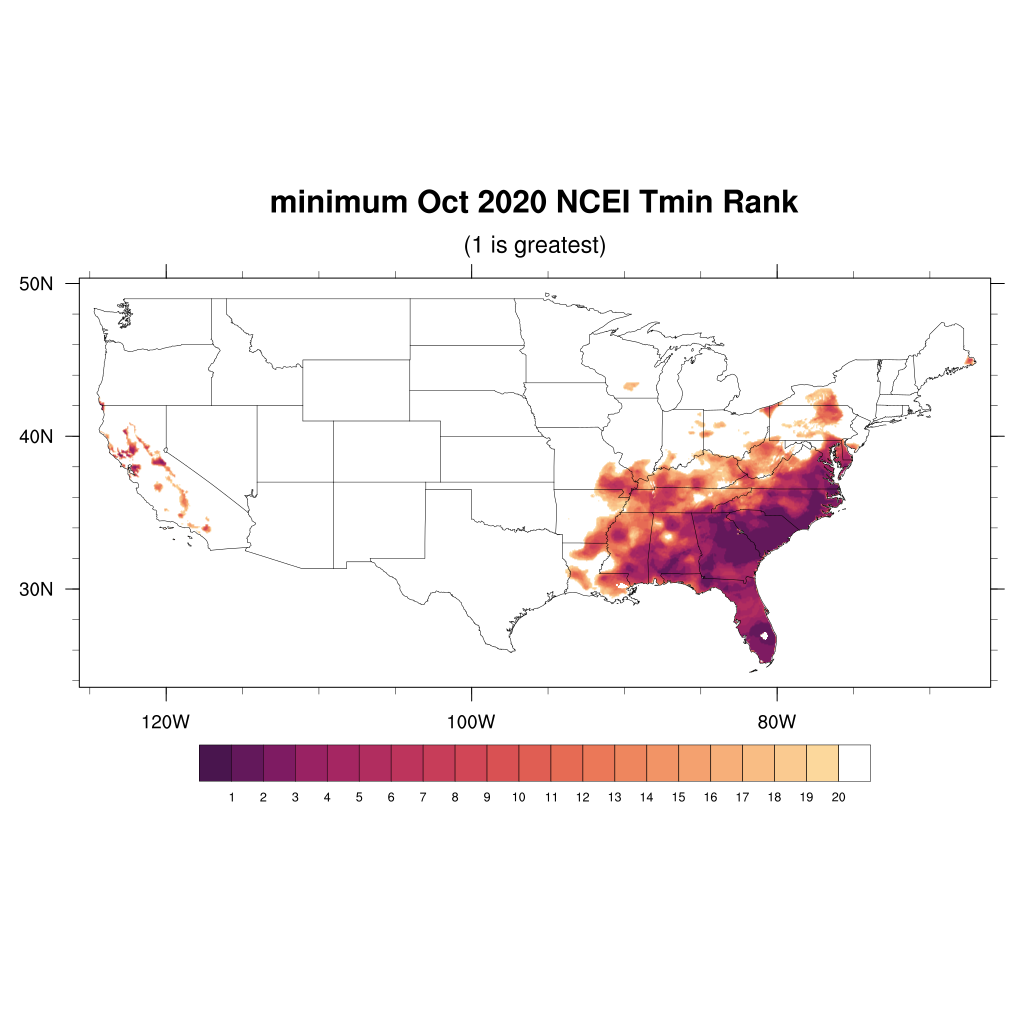
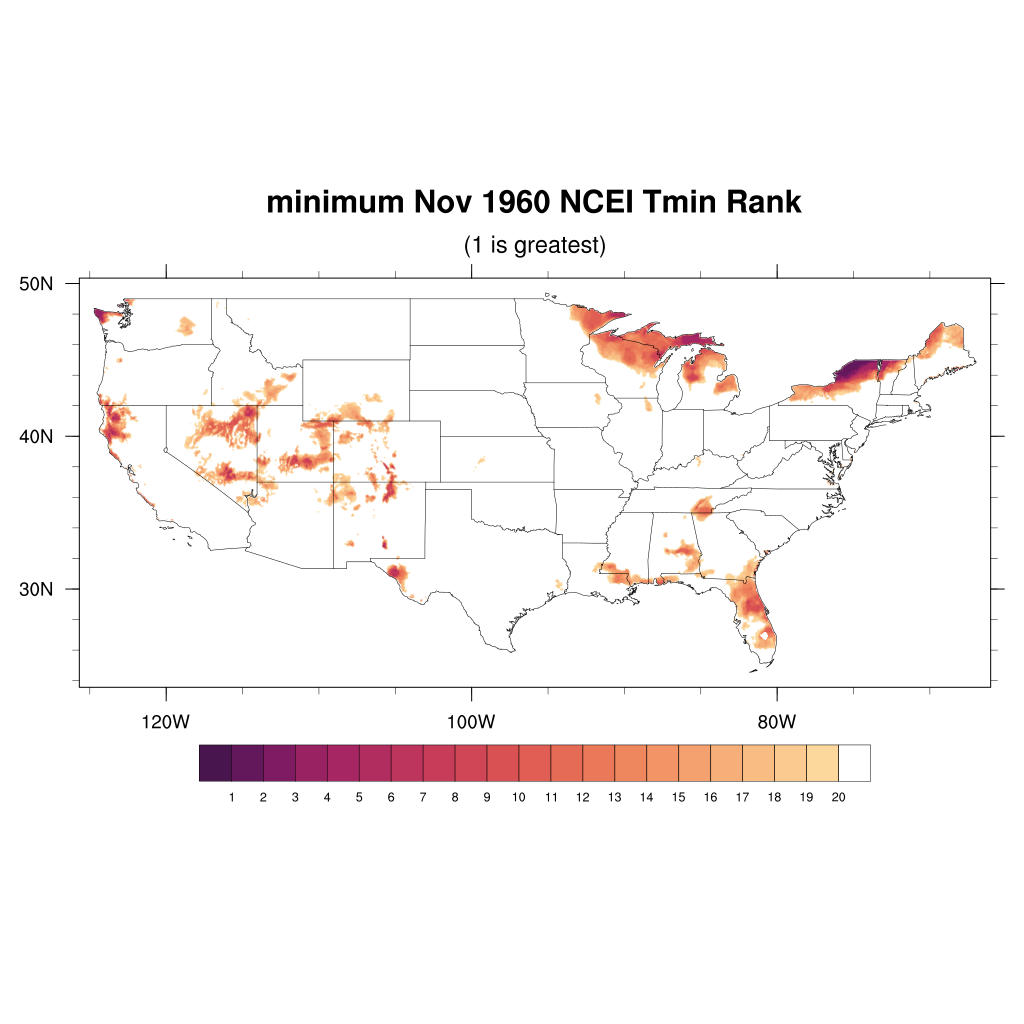
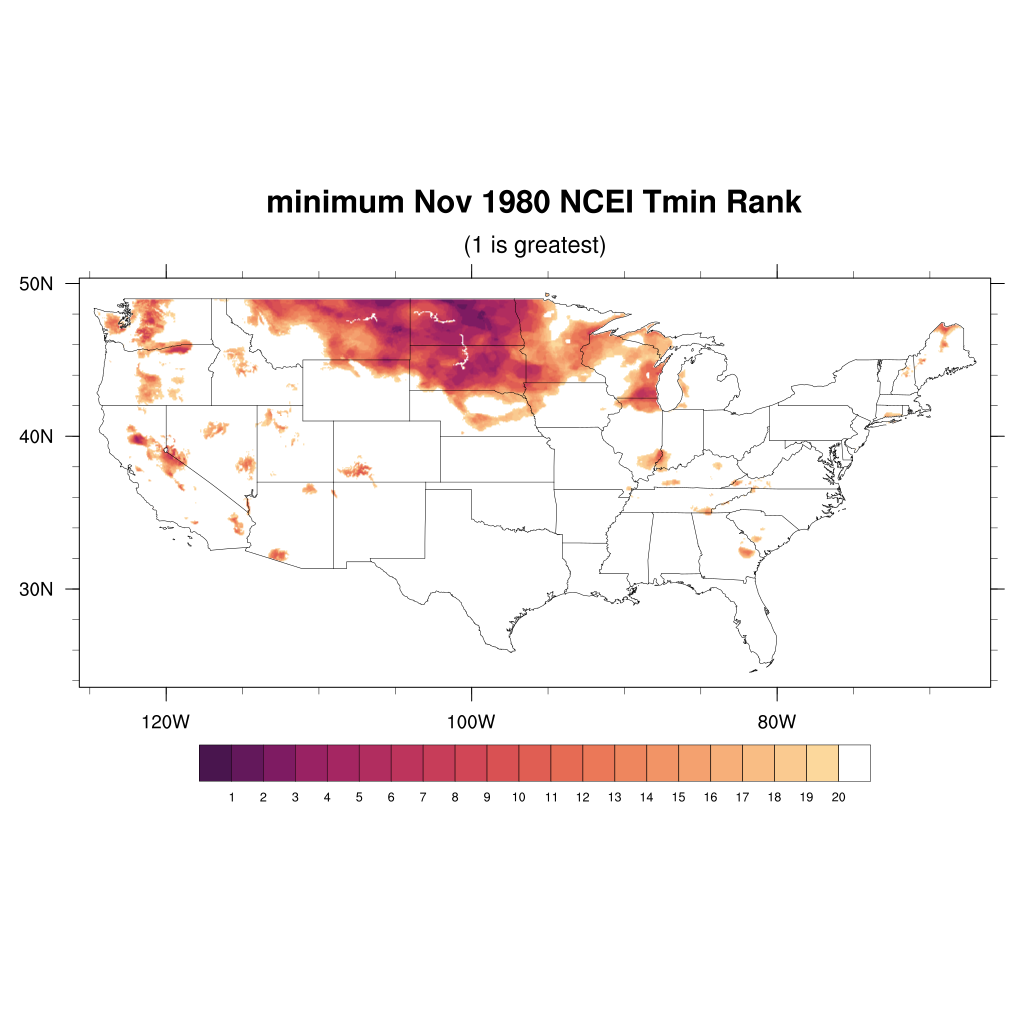
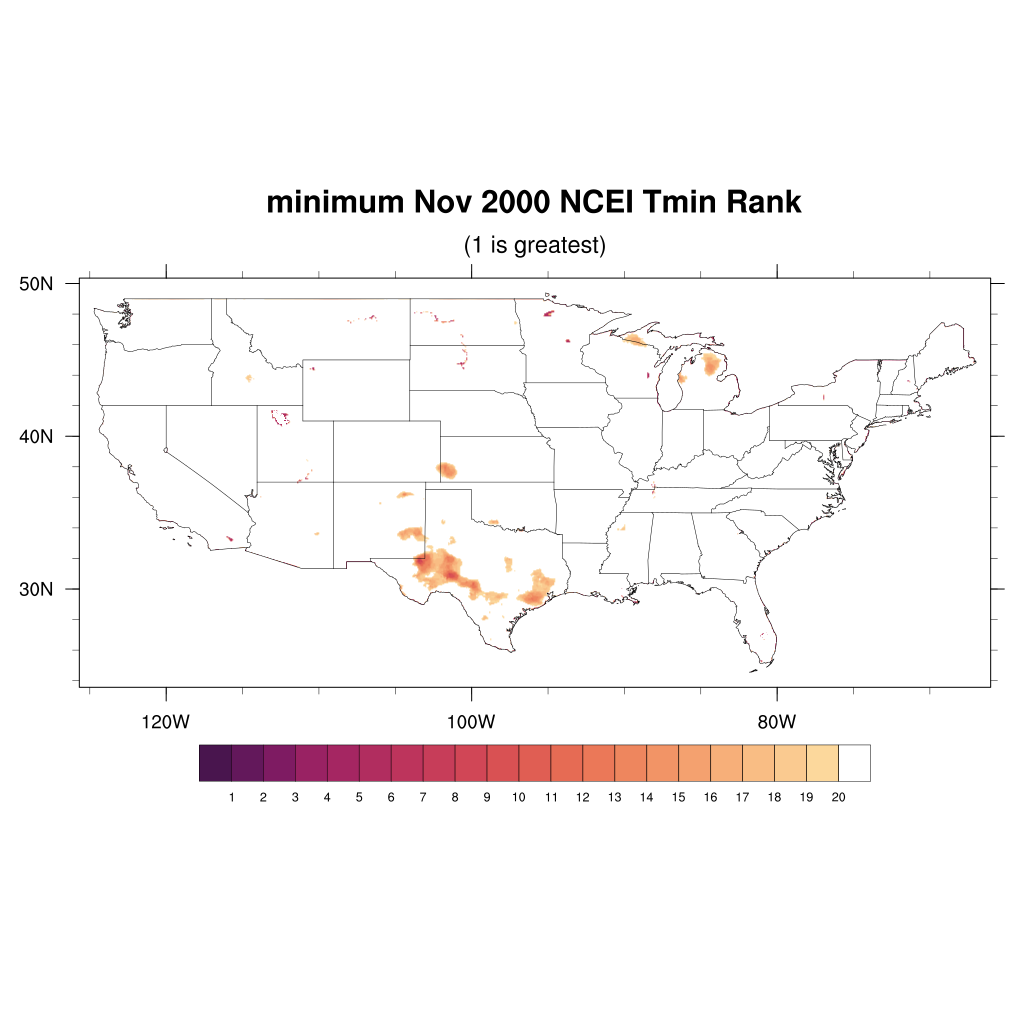
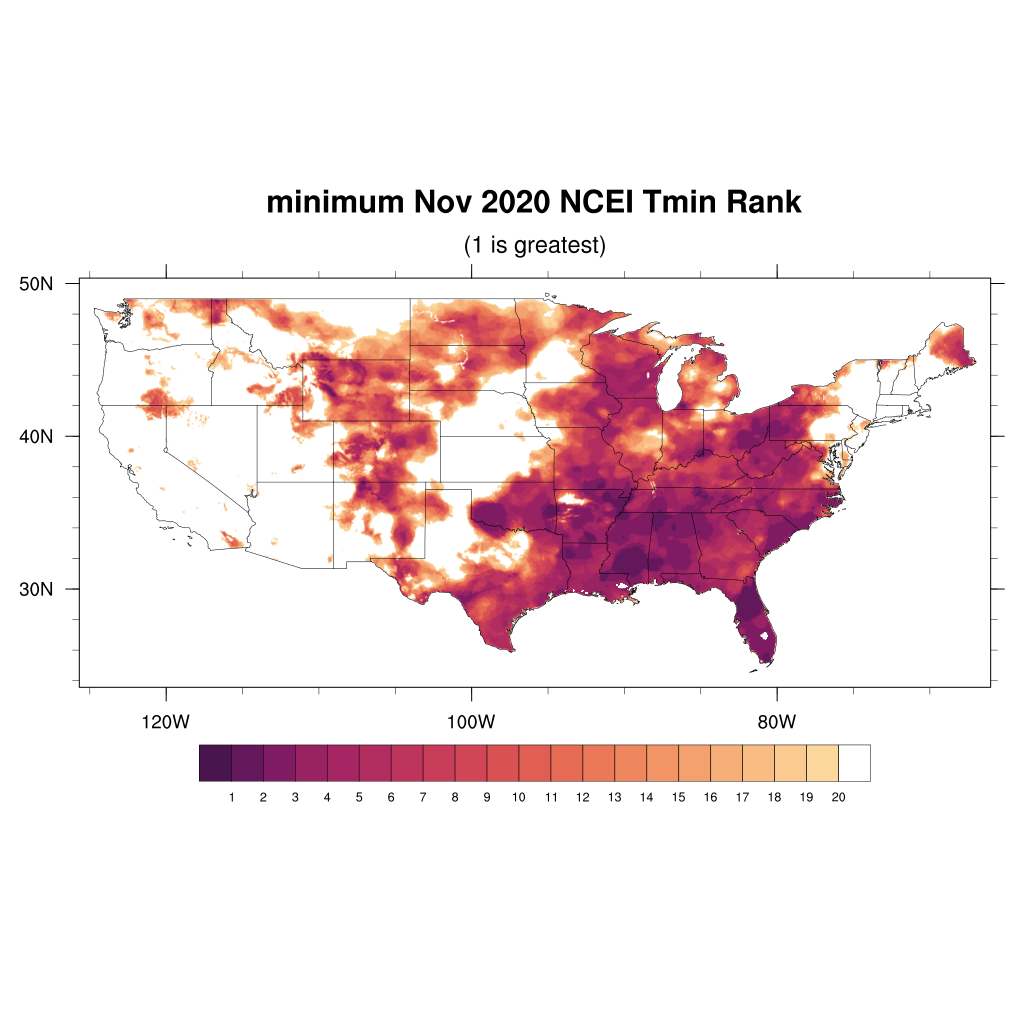
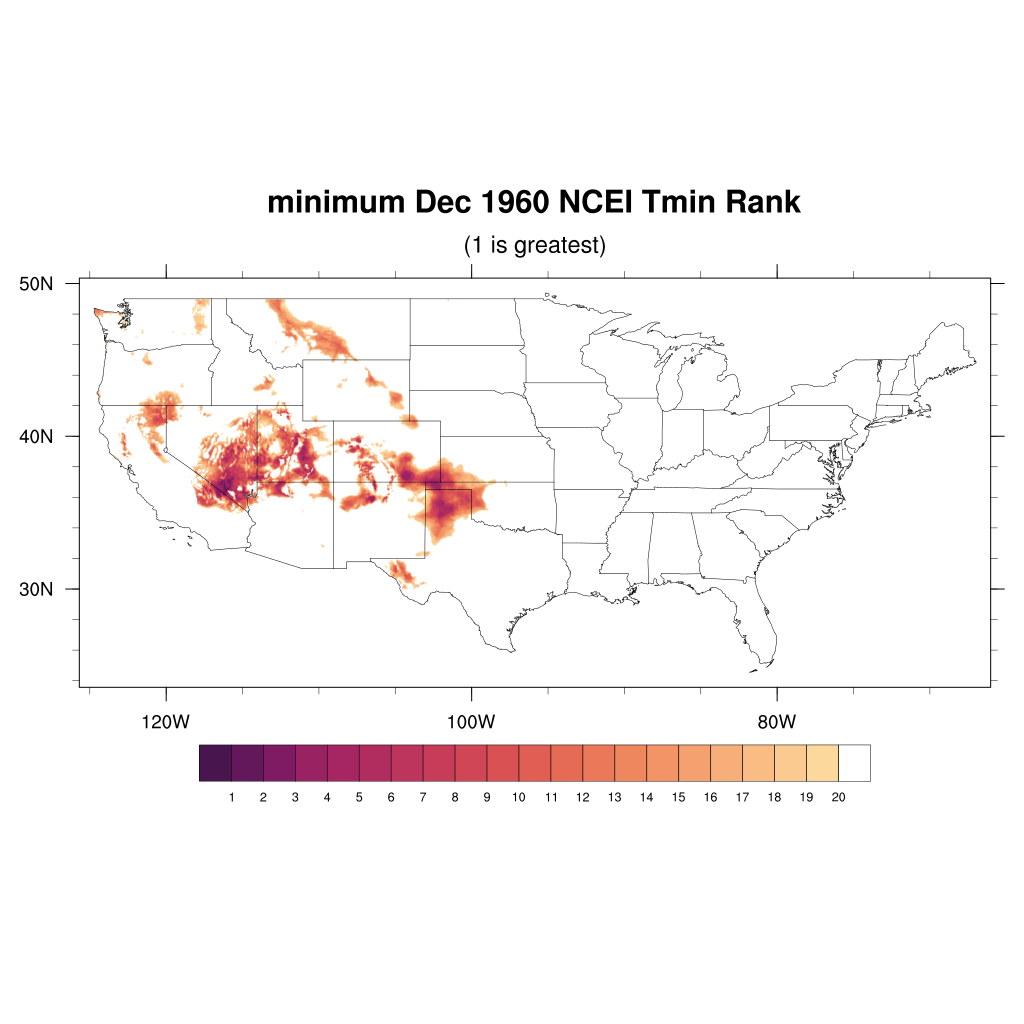
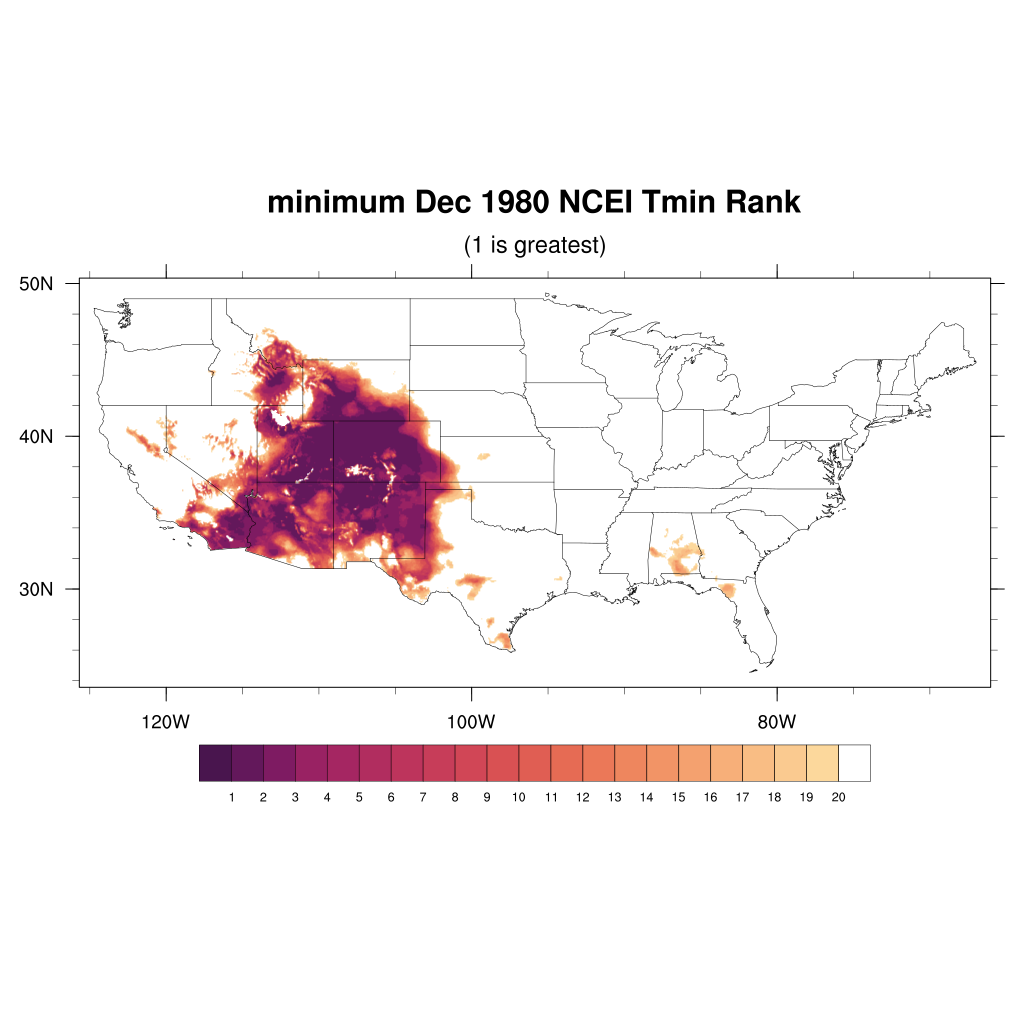
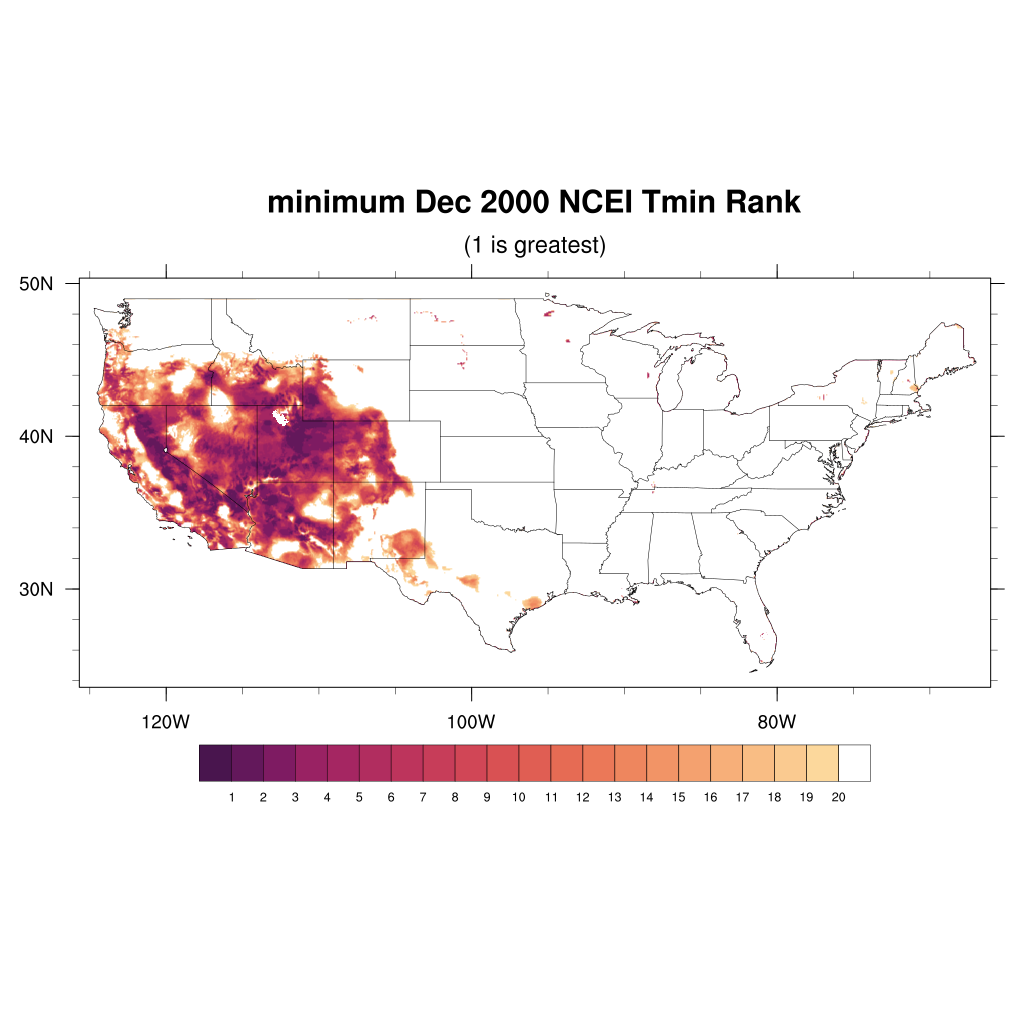
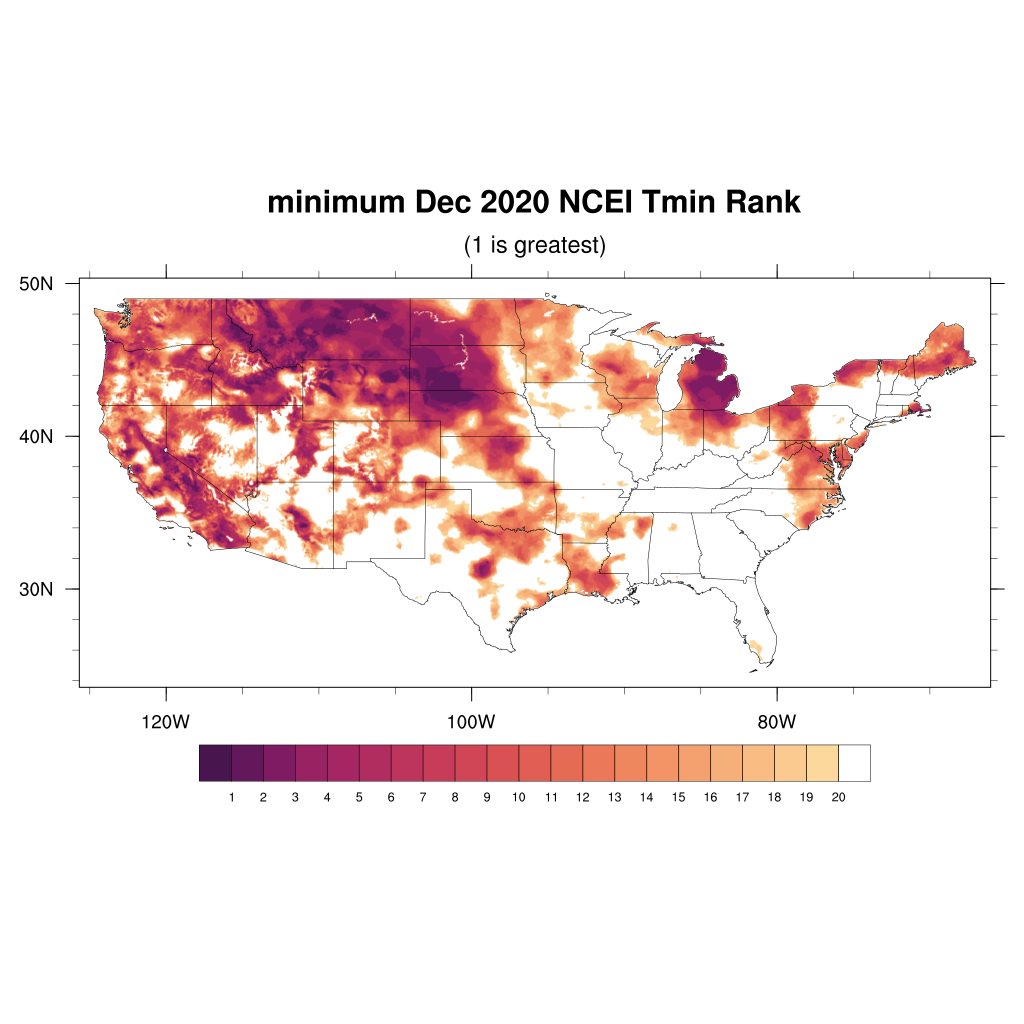
TMIN
Below analyses done using monthly minimum Tmin per grid point
Rank of monthly (1-day) max Tmin per grid point -- showing sample years
ranks computed with all available data (Jan 1951 - Dec 2021)