Lesley L. Smith – US Extreme Precipitation
All plots preliminary.
Right click to see bigger versions.
New Most recent plots first.
Back to newer plots here.
All Station Data plots moved here
--------------------------------------------------------------------------------------------------------------
Cut-Point Analyses here.
Time Series Analyses here.
--------------------------------------------------------------------------------------------------------------
1-IN-5-YEAR CASES BELOW
1-IN-10-YEAR CASES BELOW
Revised ECHAM Multi-year Analysis
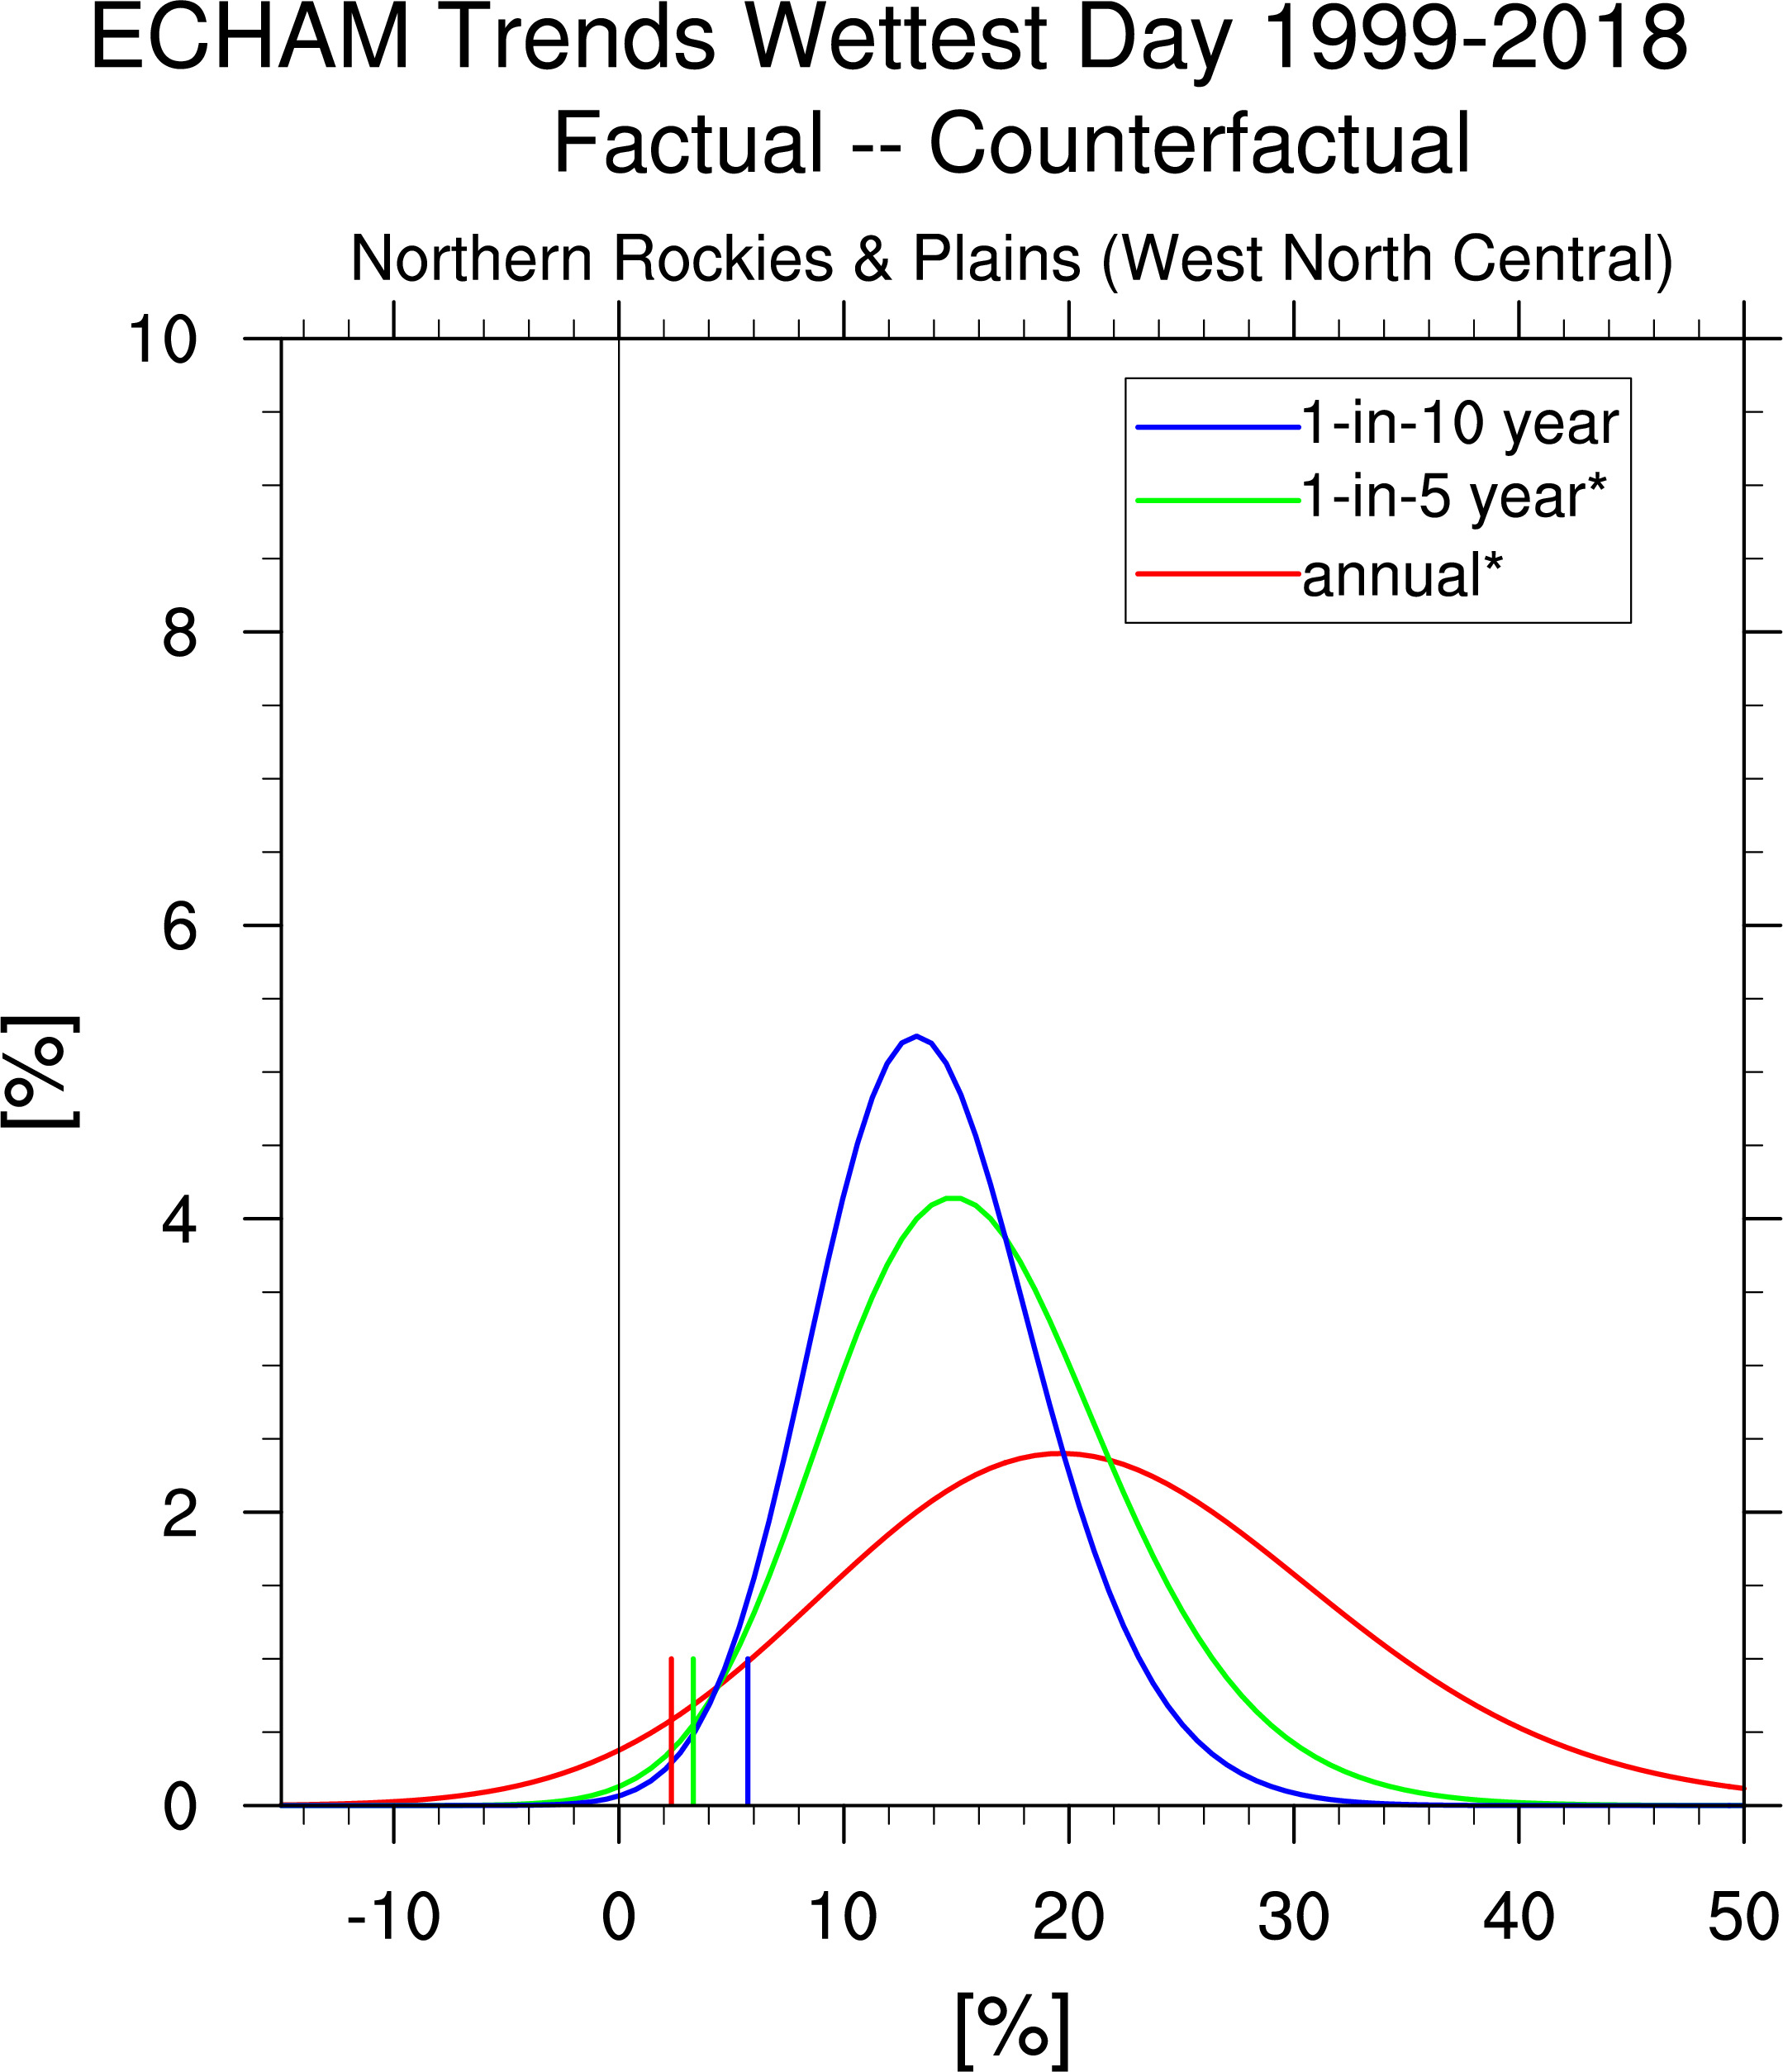
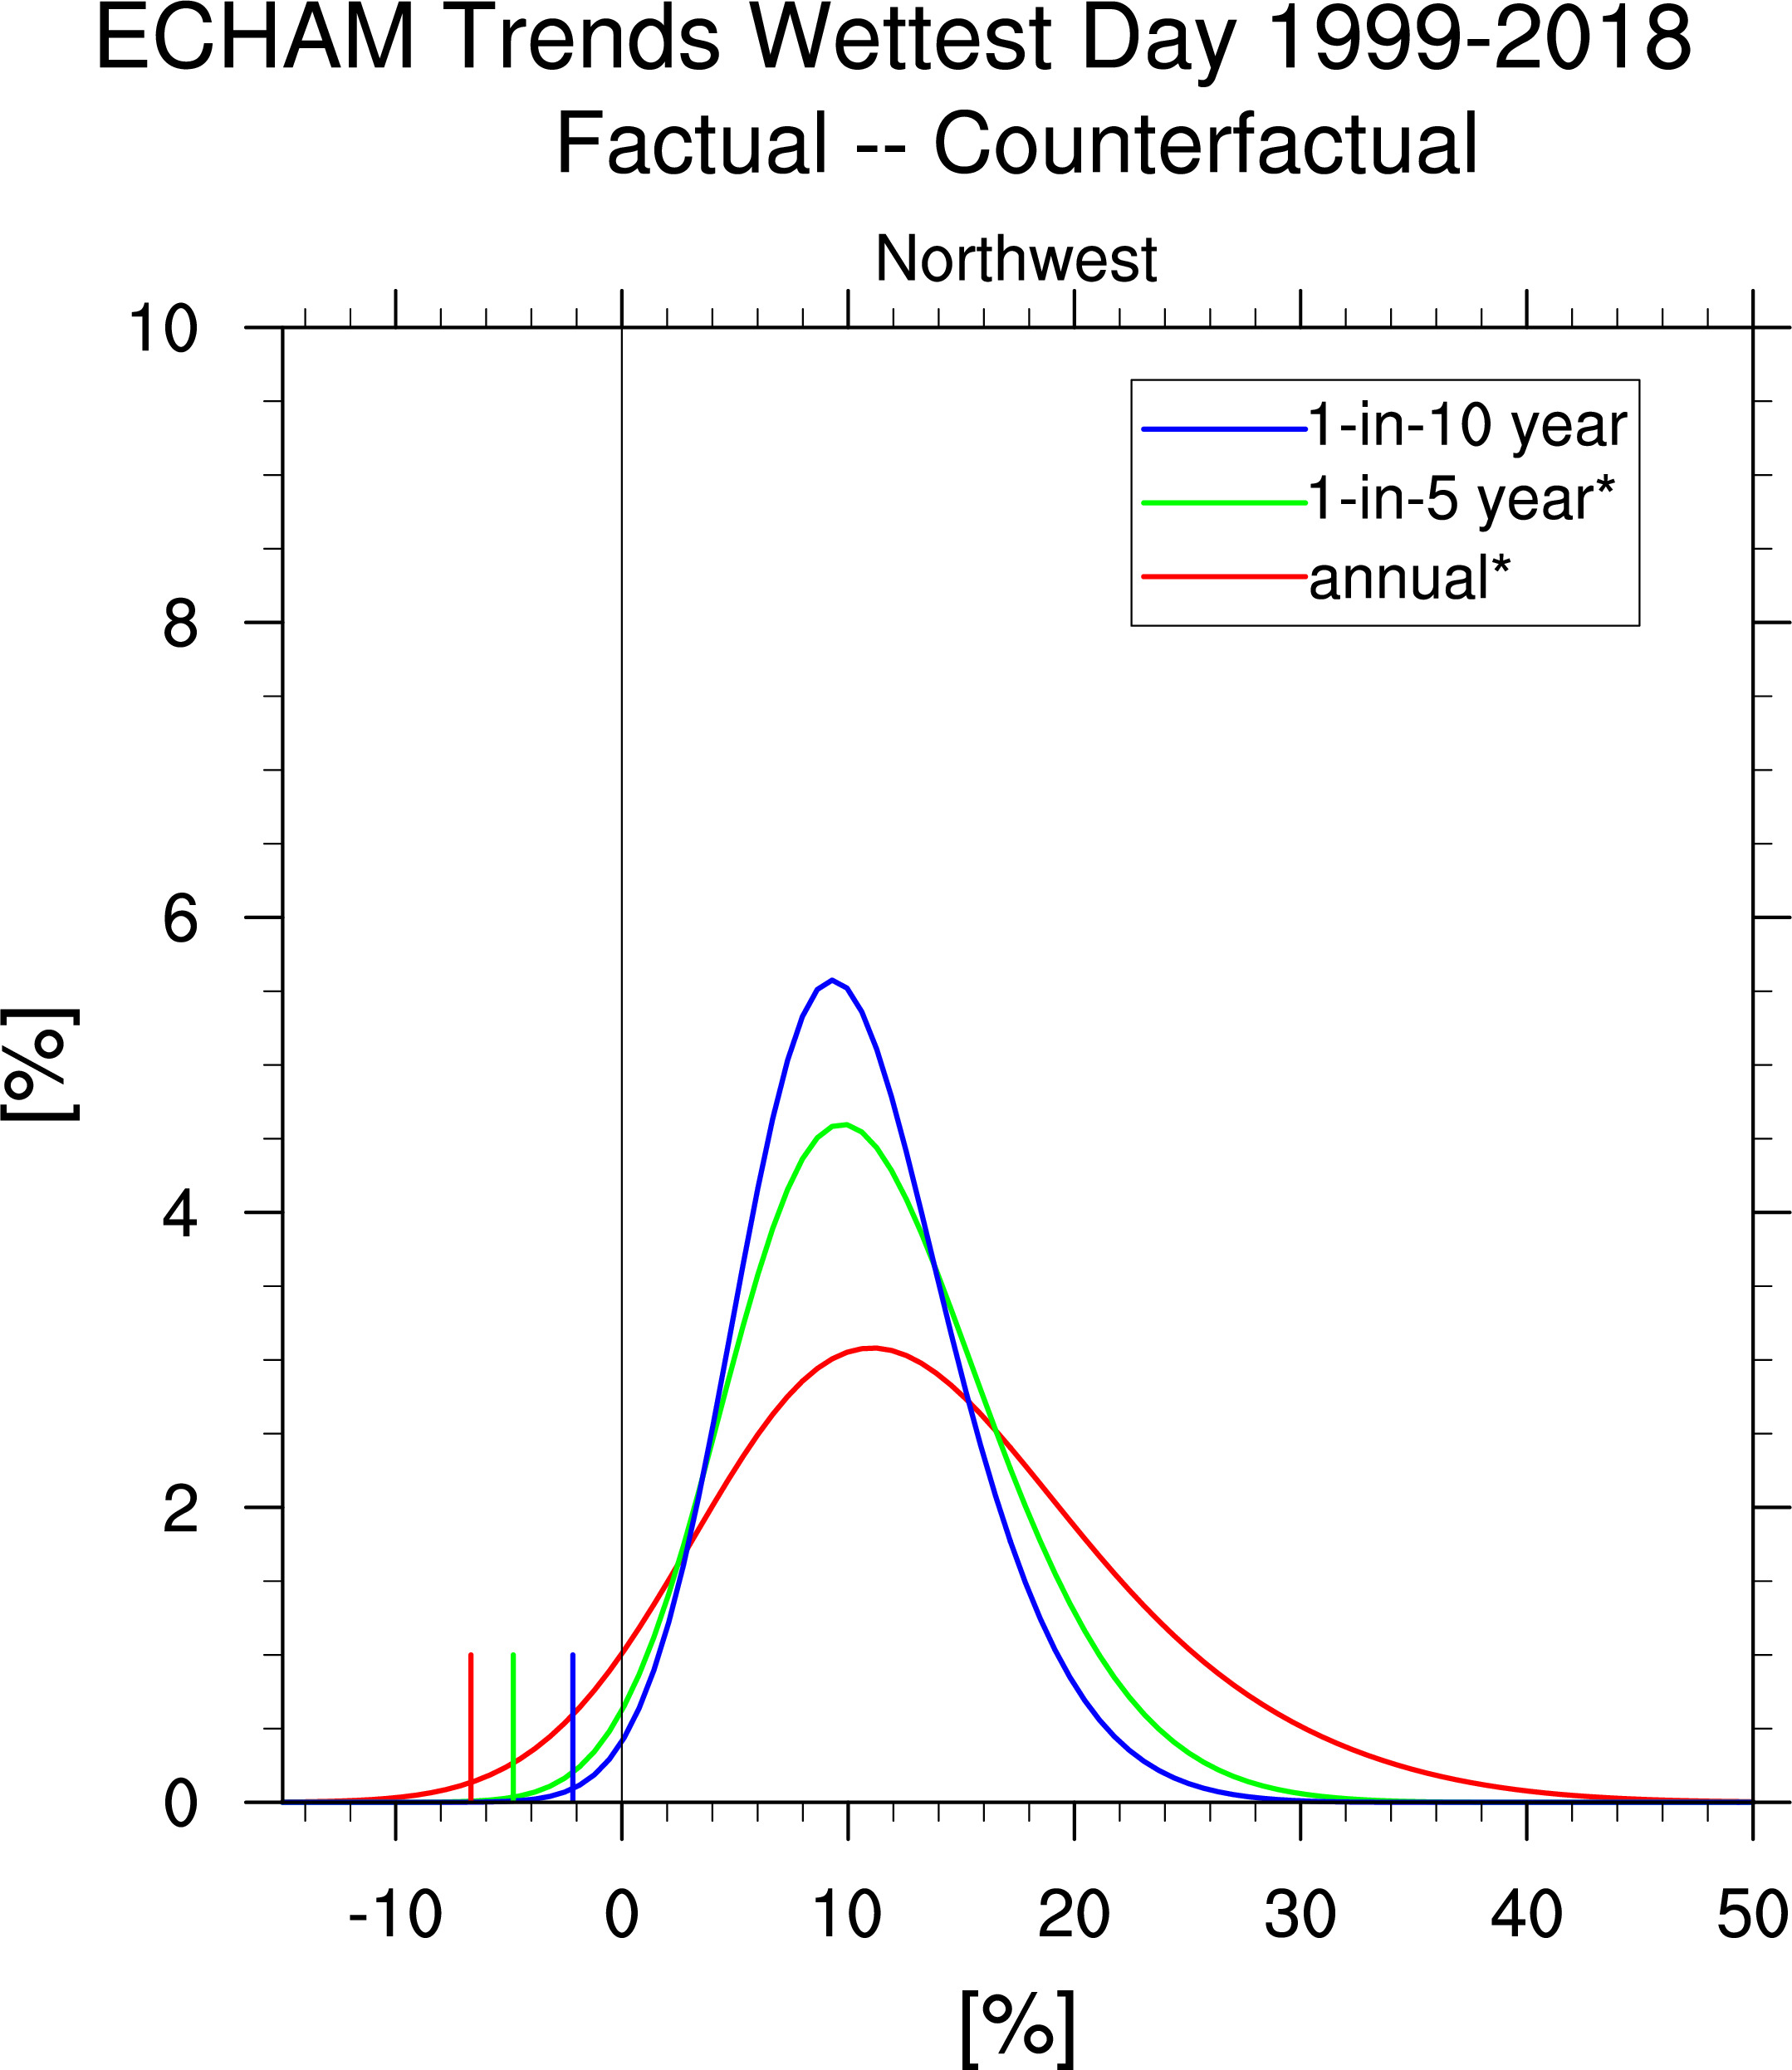
* 1-in-5-year analysis for 2009-2018, annual analysis for 2017-2018
ECHAM Multi-year Analysis
----------------------------------------------------------------------------------------------------------------------------------------------------------------------------------
Climatology & Trend (from slope of best-fit line) heaviest precip 1948-2018
CPC


------------------------------------------------------------------------------------------------------------------------------
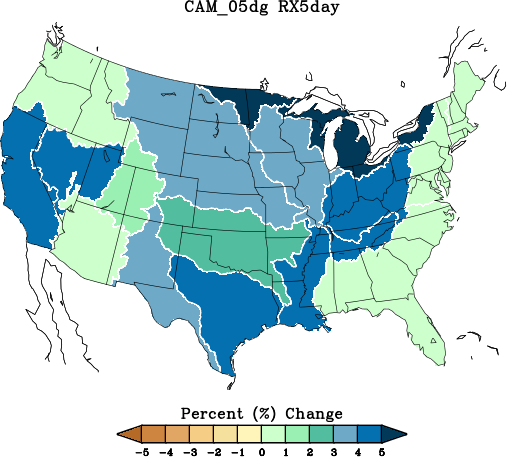
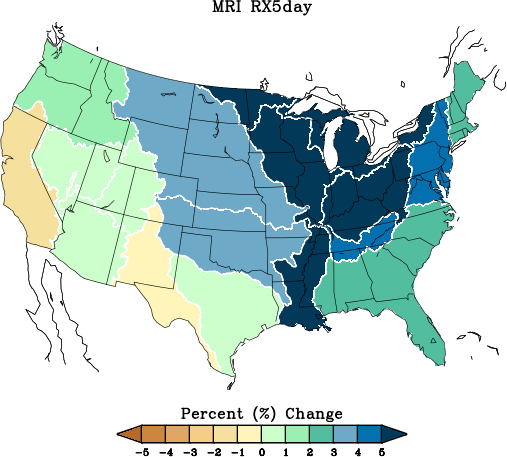
Trends (from slope of best-fit line) in heaviest precipitation
1948-2018 APA CAM5
Sample plots
![]()
![]()
Trend maps for all runs here.
Average over all runs & wettest day climo
![]()
![]()
1901-2018 APA CAM5
Sample plots
![]()
![]()
Trend maps for all runs here.
Average over all runs & wettest day climo
![]()
![]()
1948-2018 NCAR Large Ensemble (LENS)
Sample plots


Trend maps for all runs here.
Average over all runs & wettest day climo


1920-2018 NCAR Large Ensemble (LENS)
Sample plots
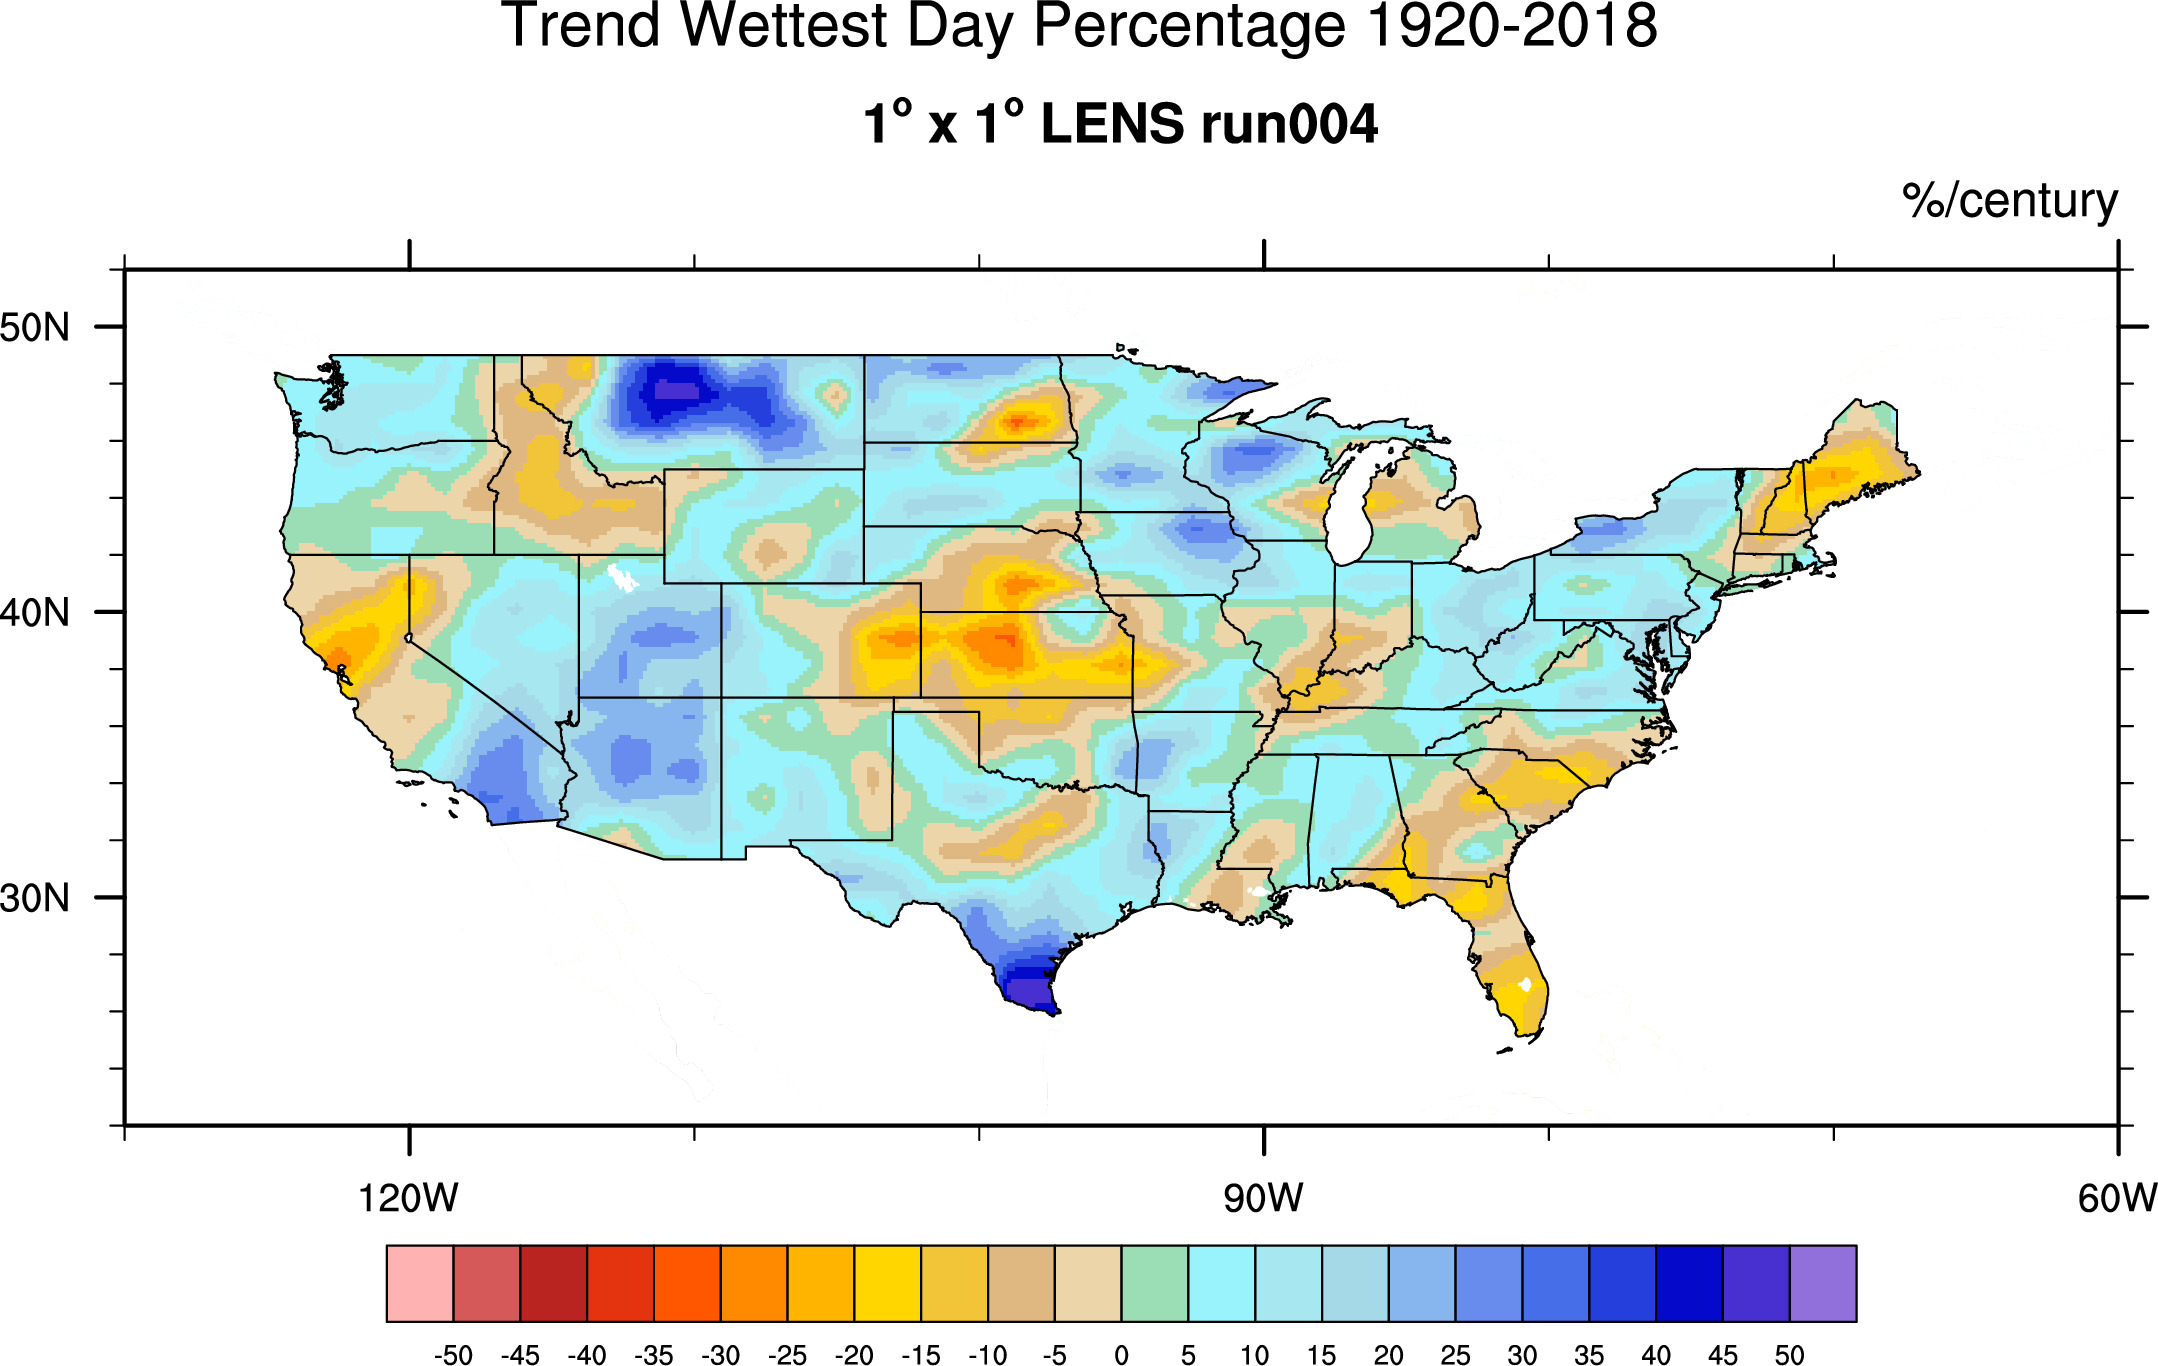
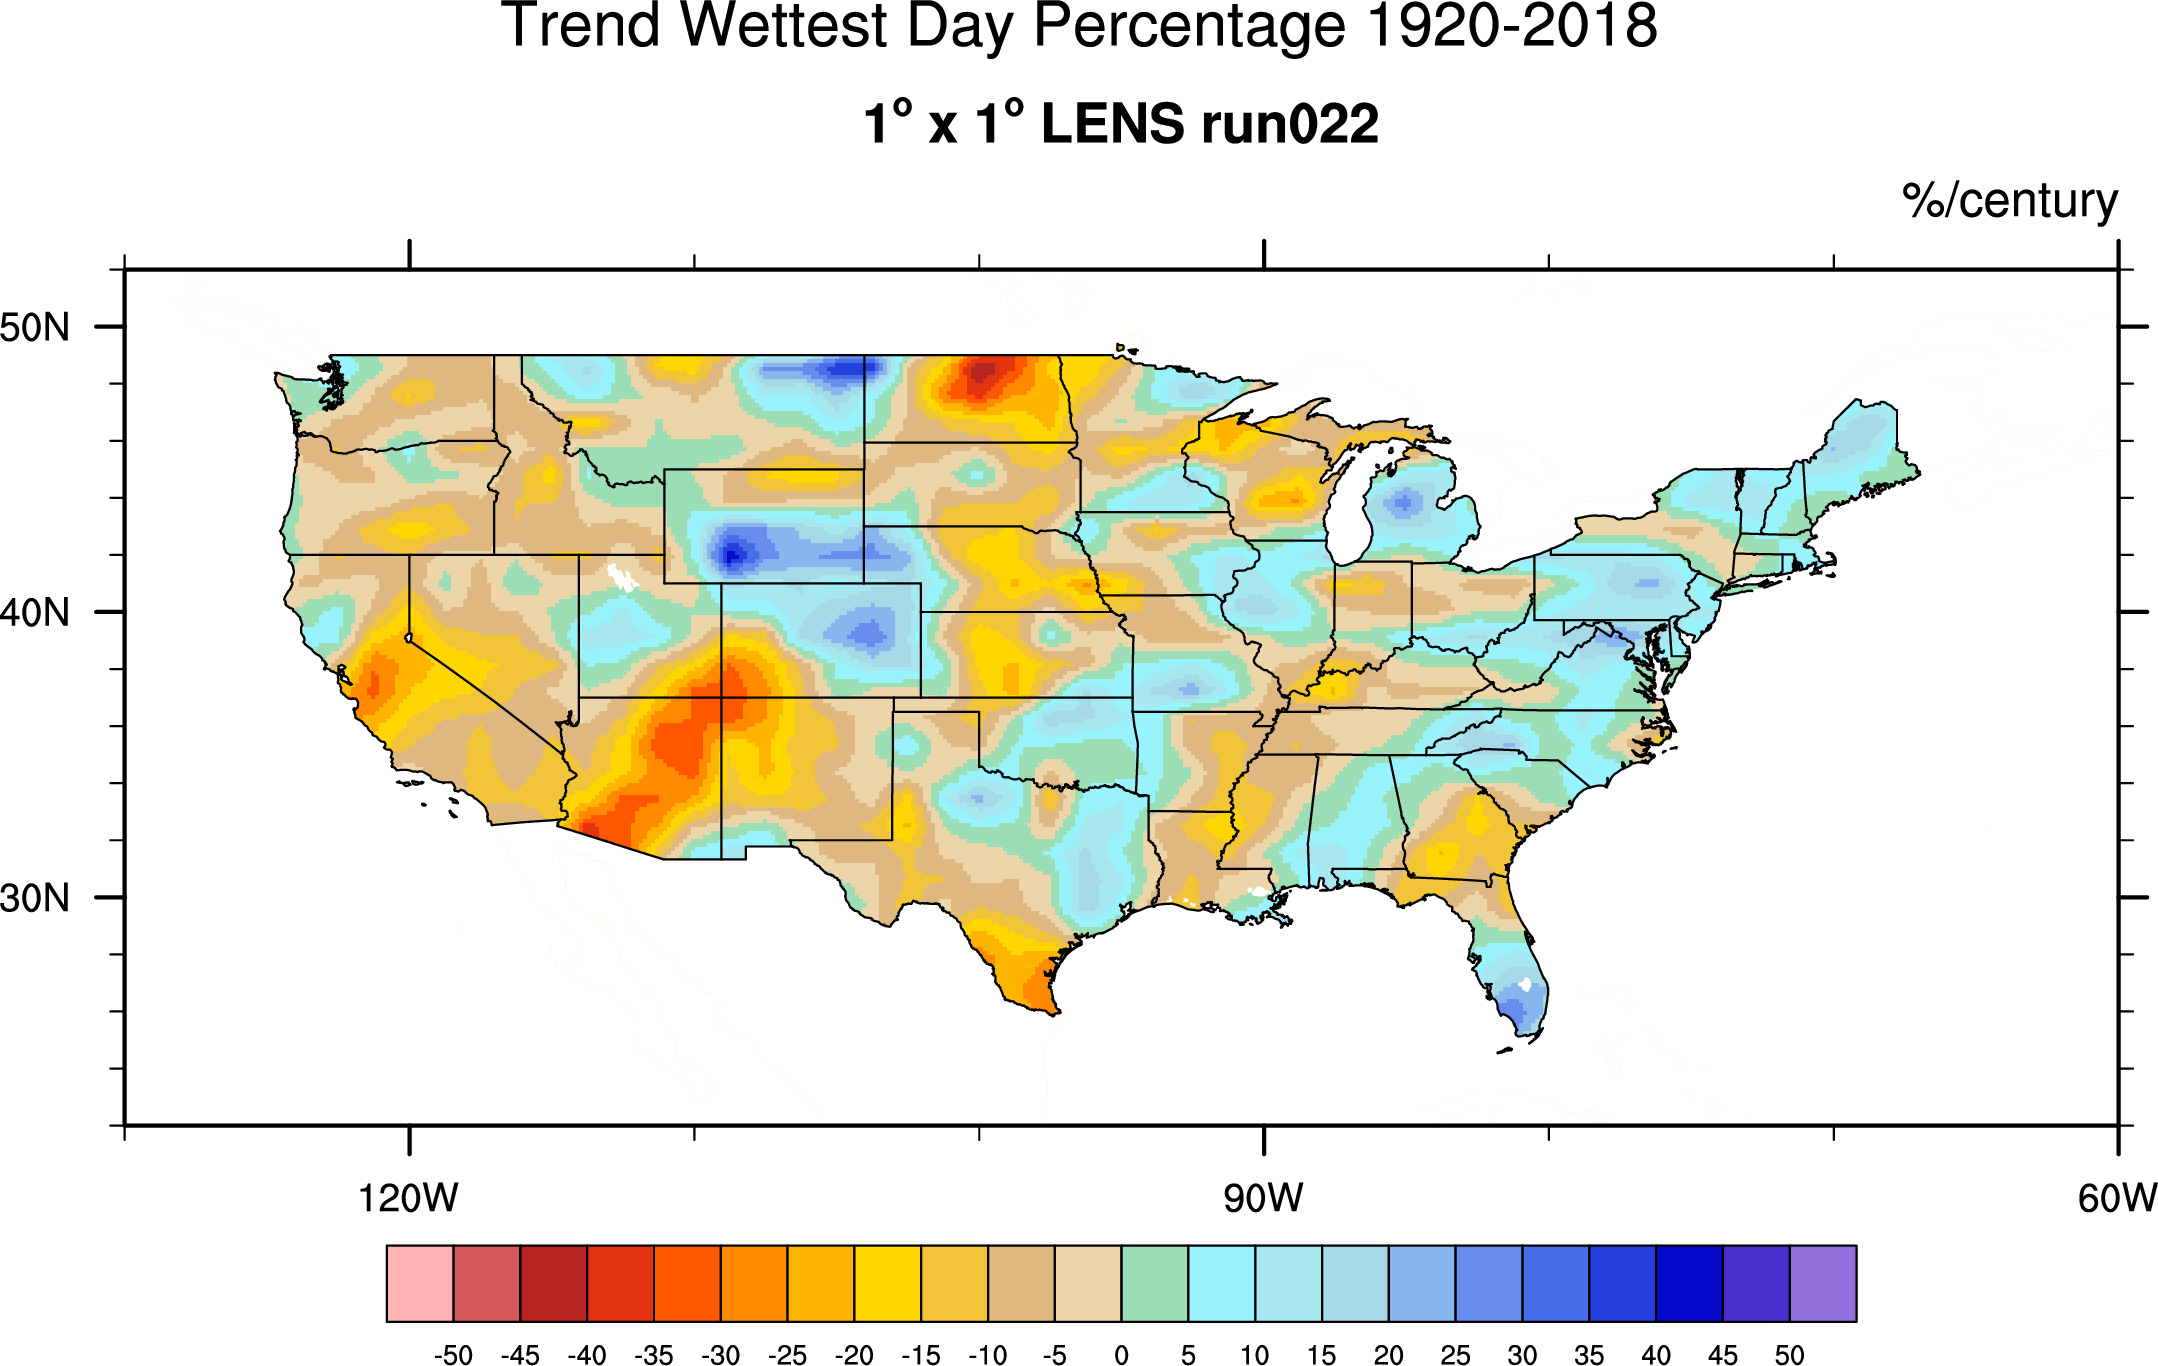
Trend maps for all runs here.
Average over all runs & wettest day climo


--------------------------------------------------------------------------------------------------------------
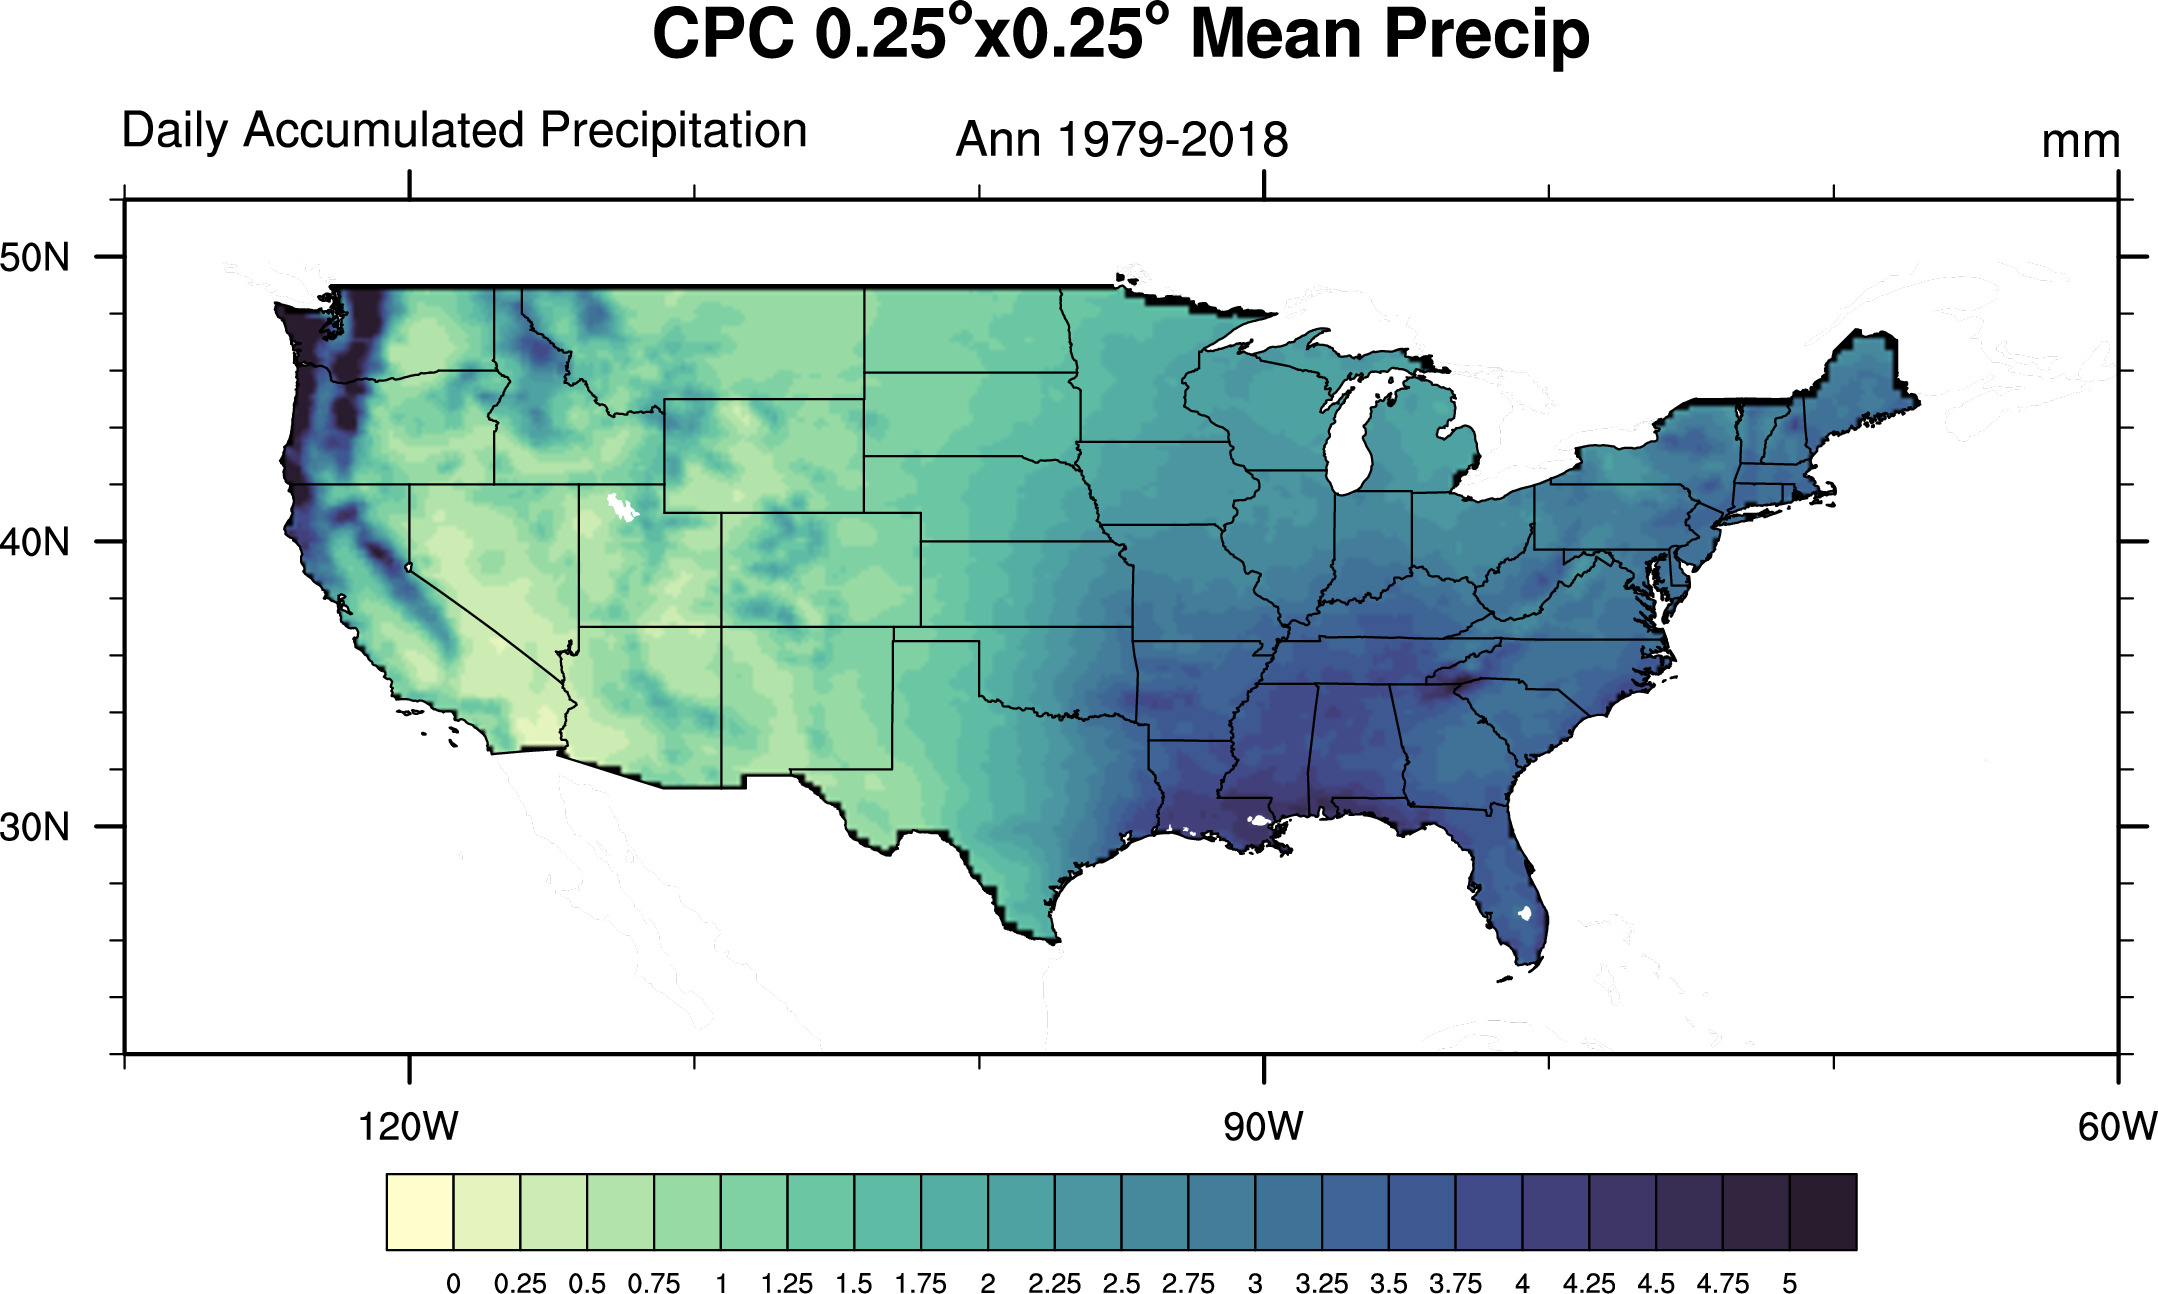
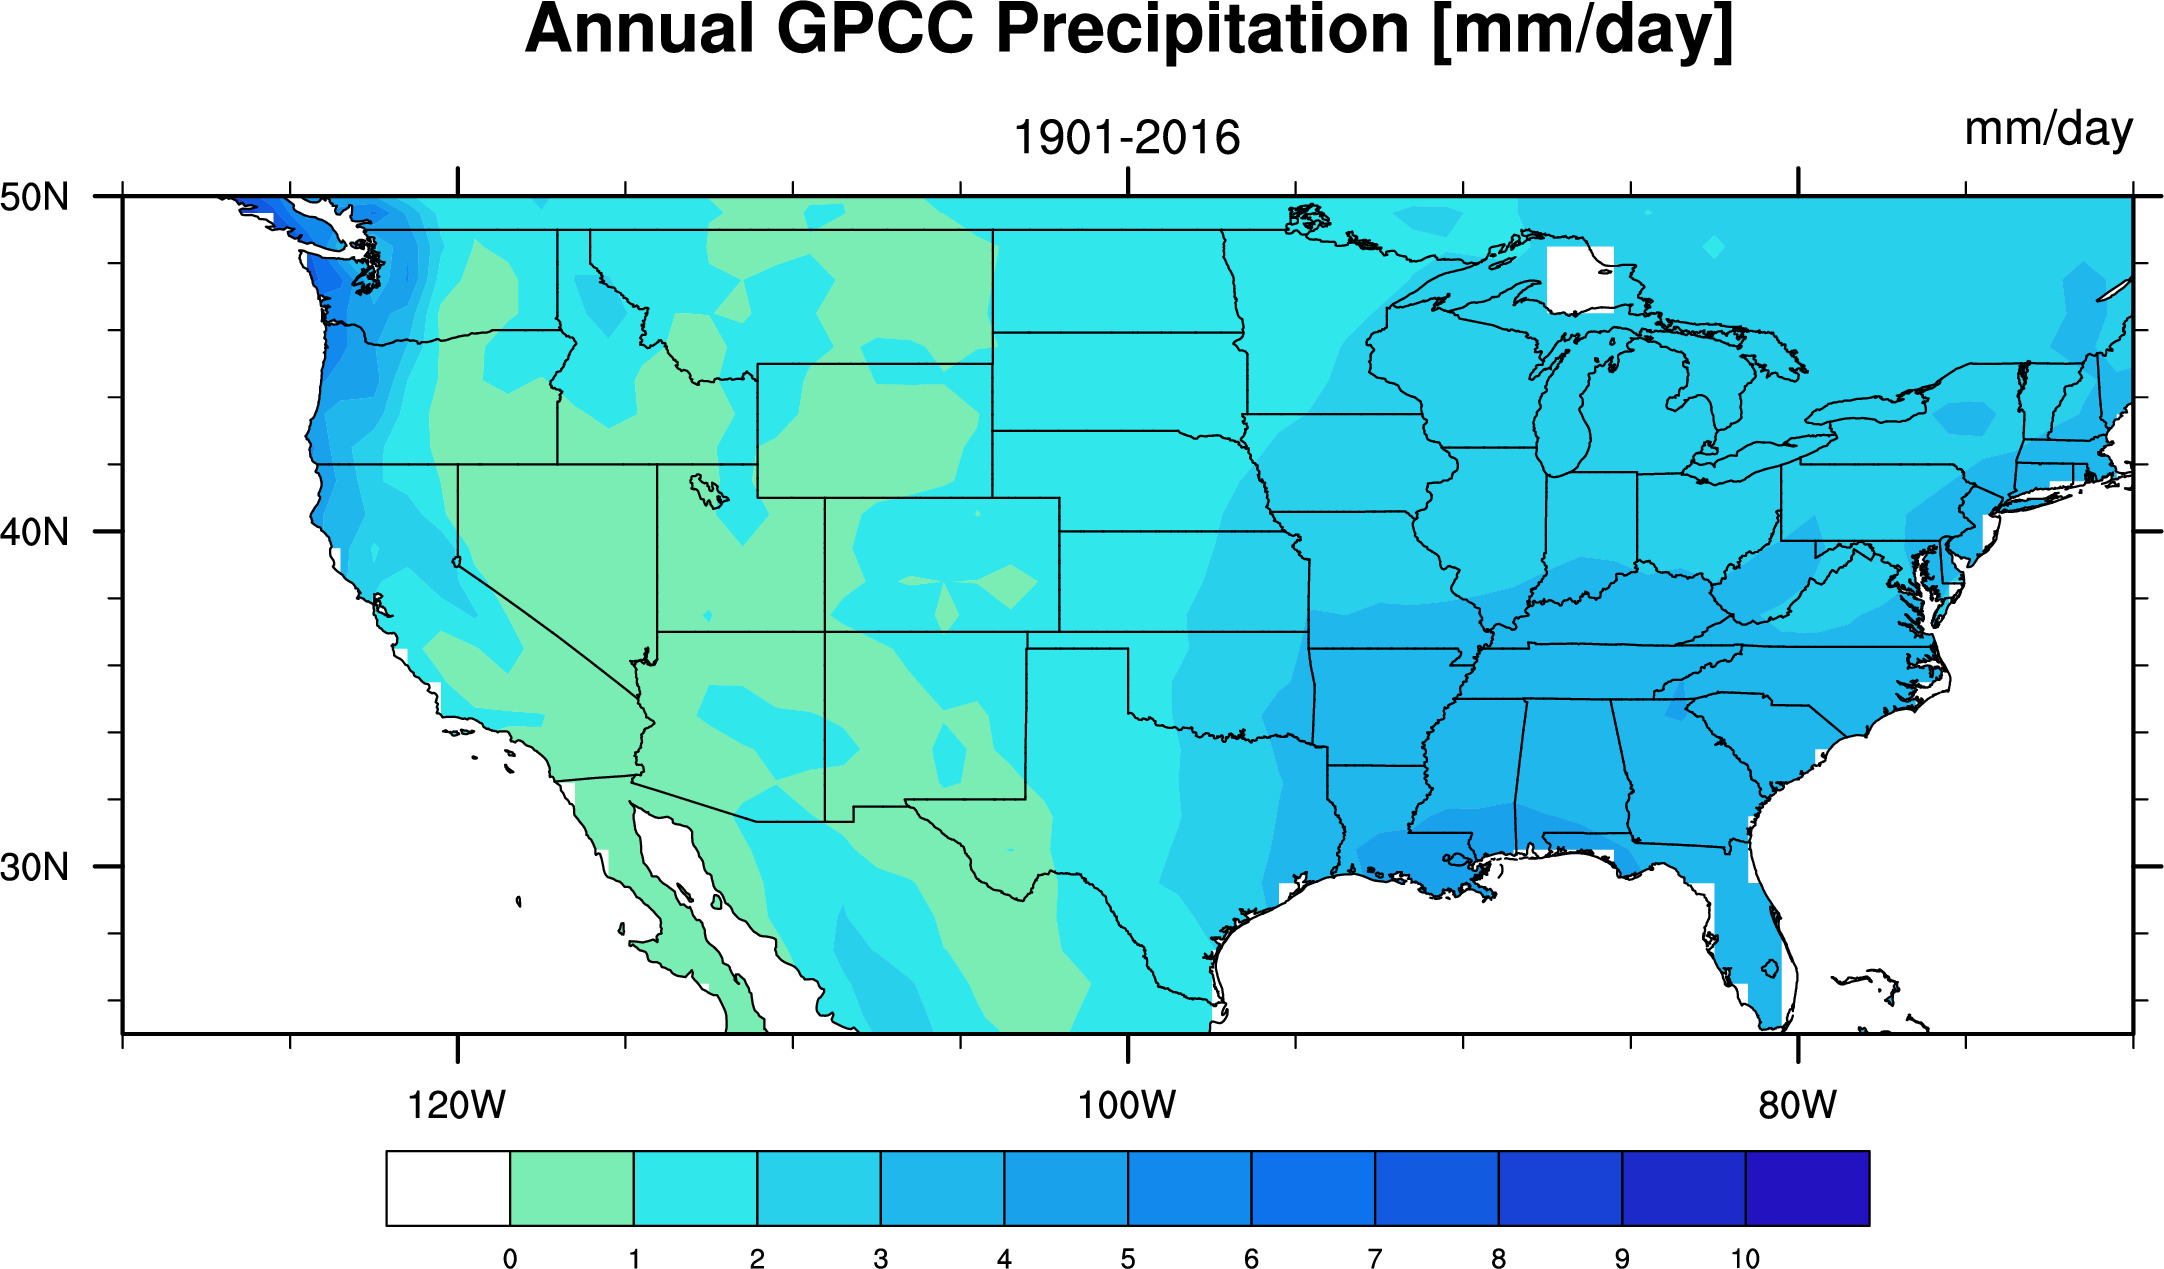
For reference, some annual mean precipitations:
![]()
![]()
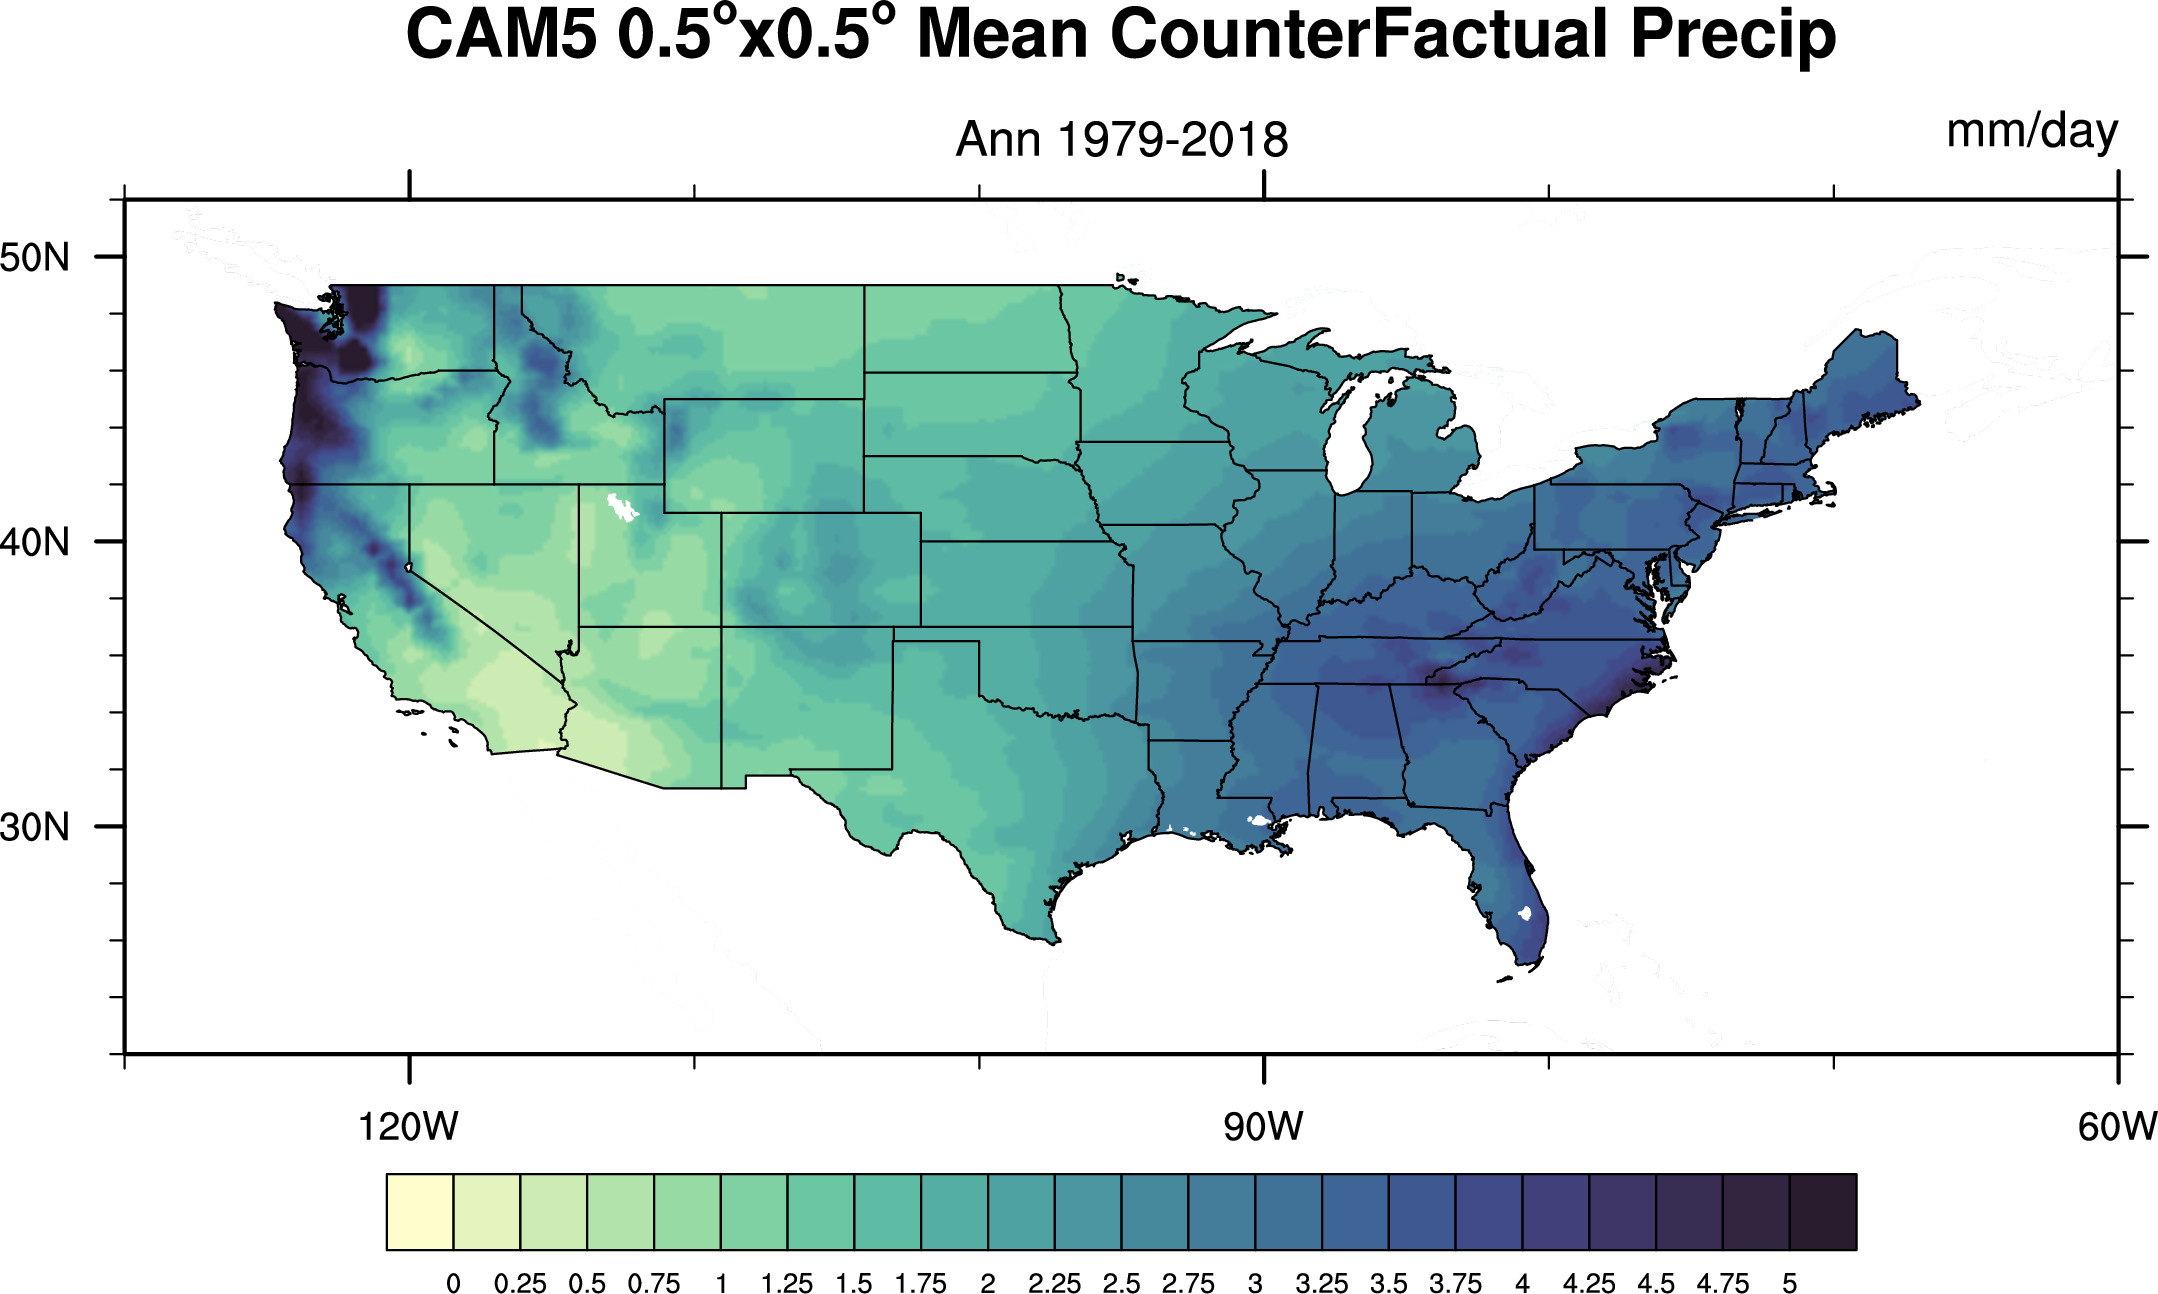
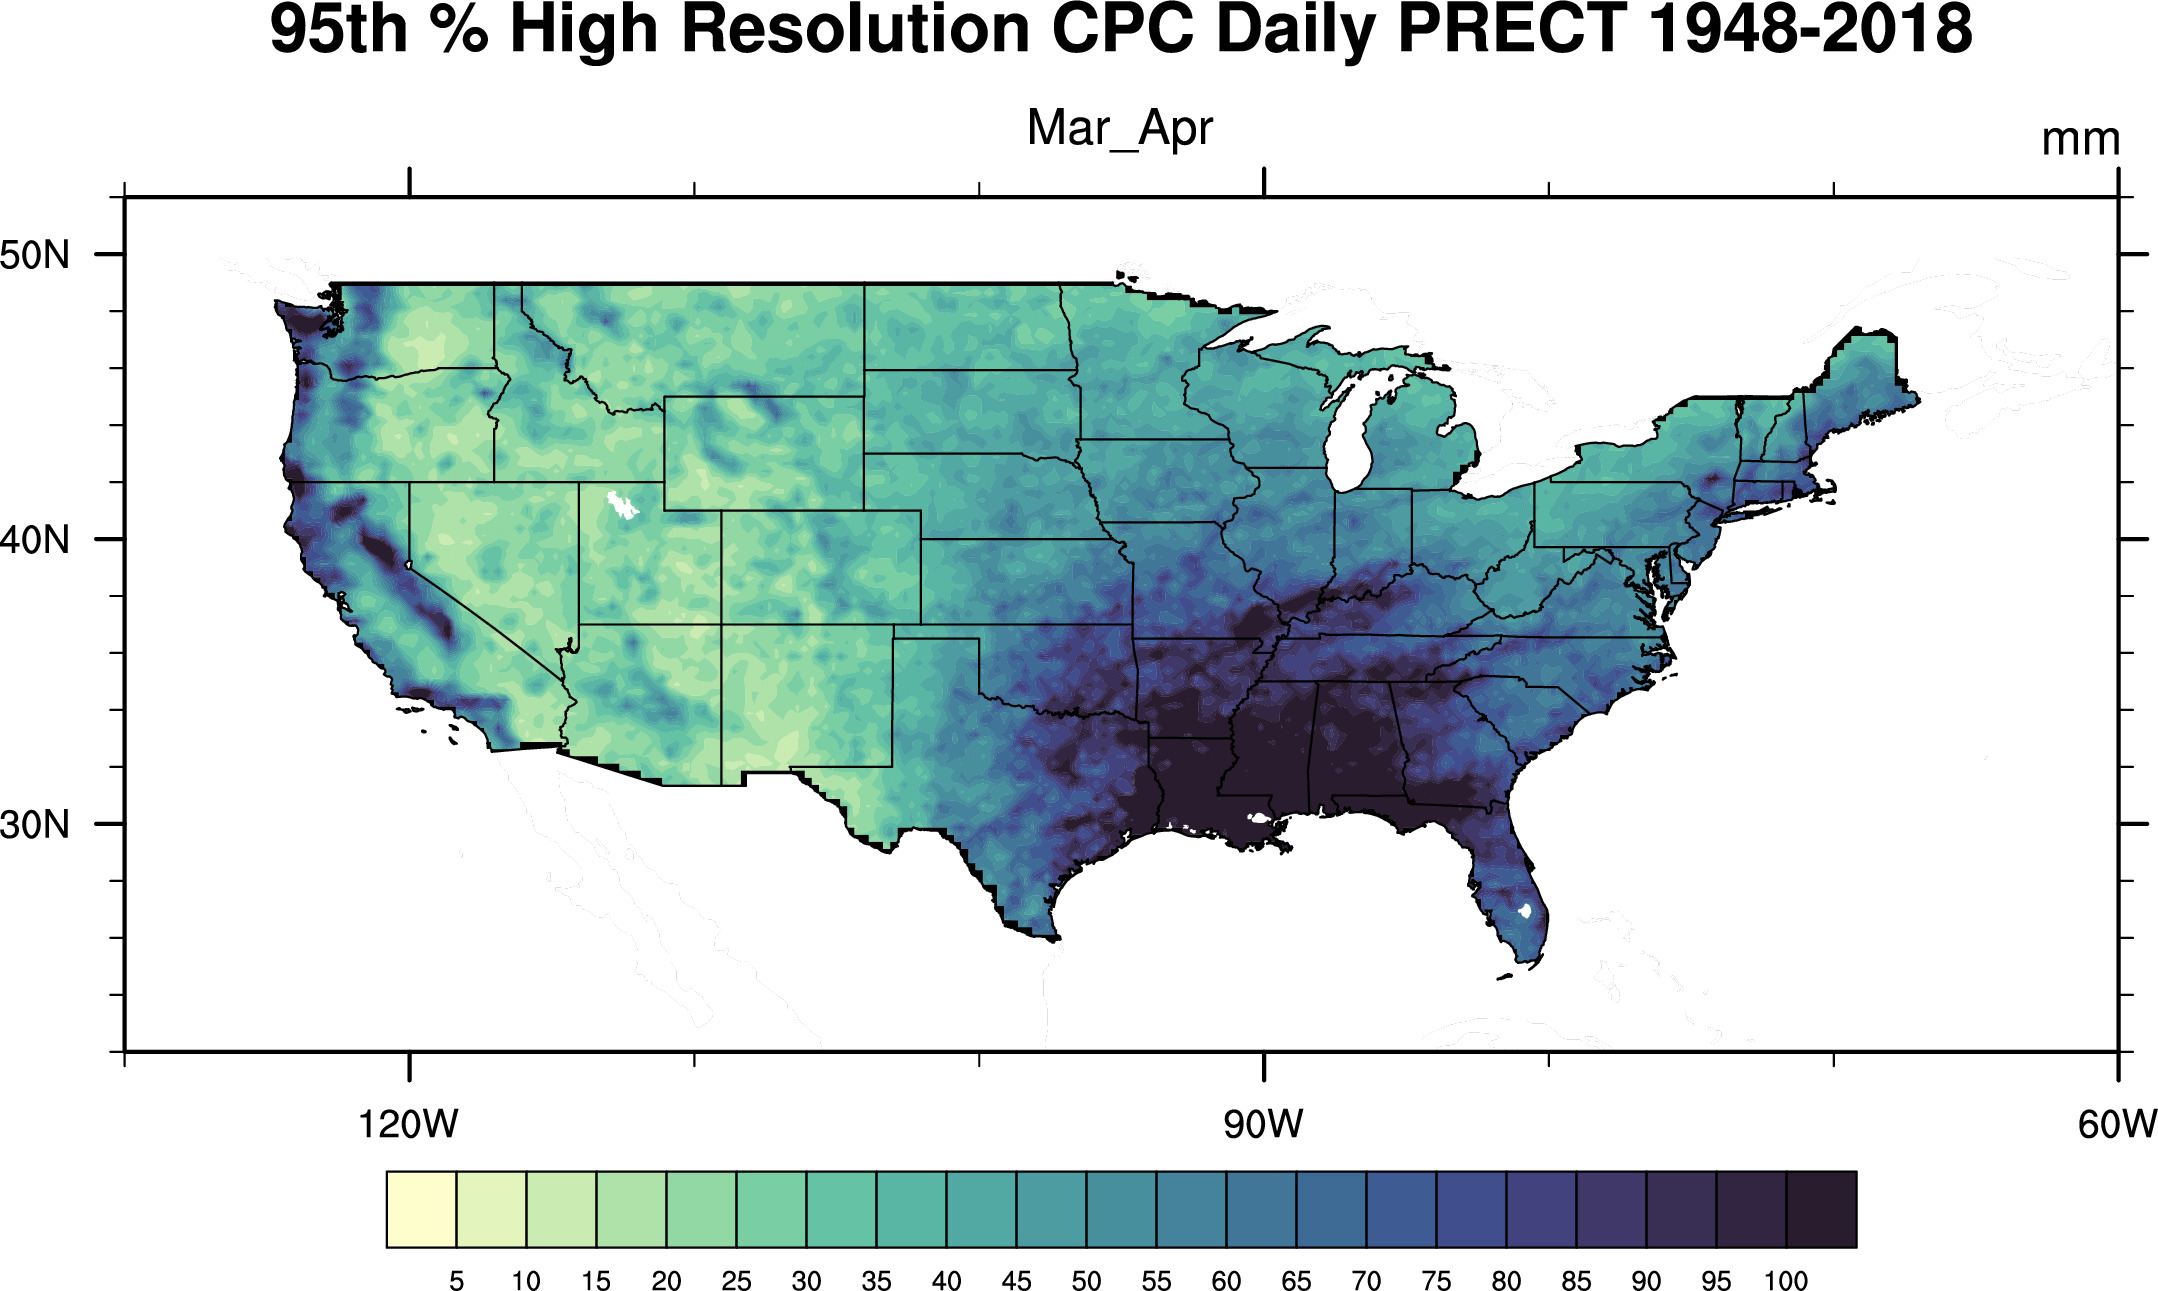
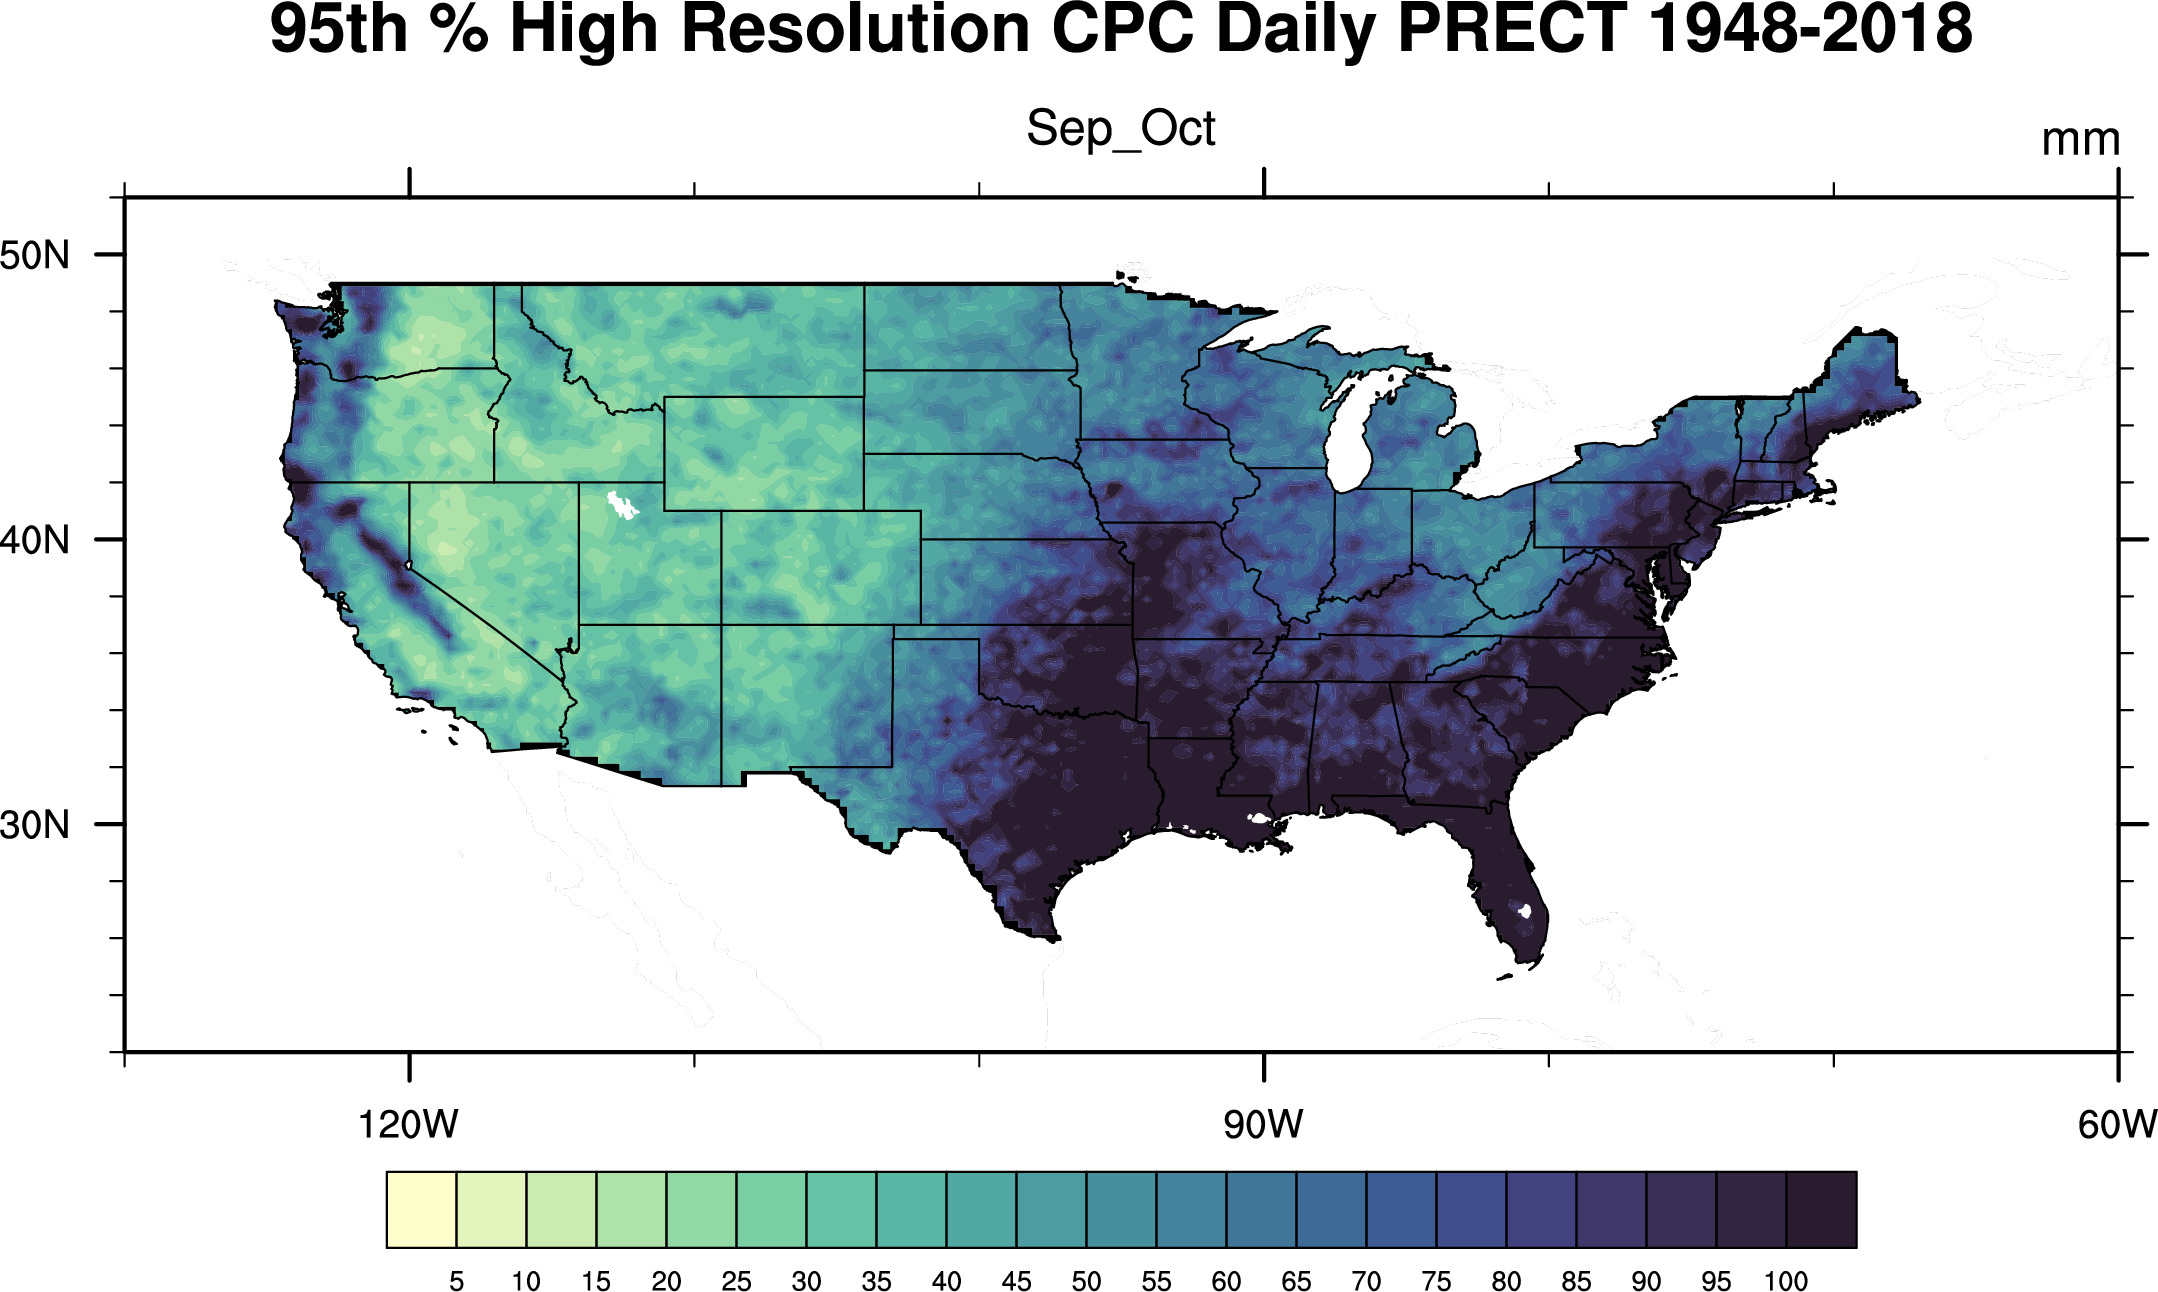
CPC Daily Precipitation High Resolution (0.25ox0.25o)
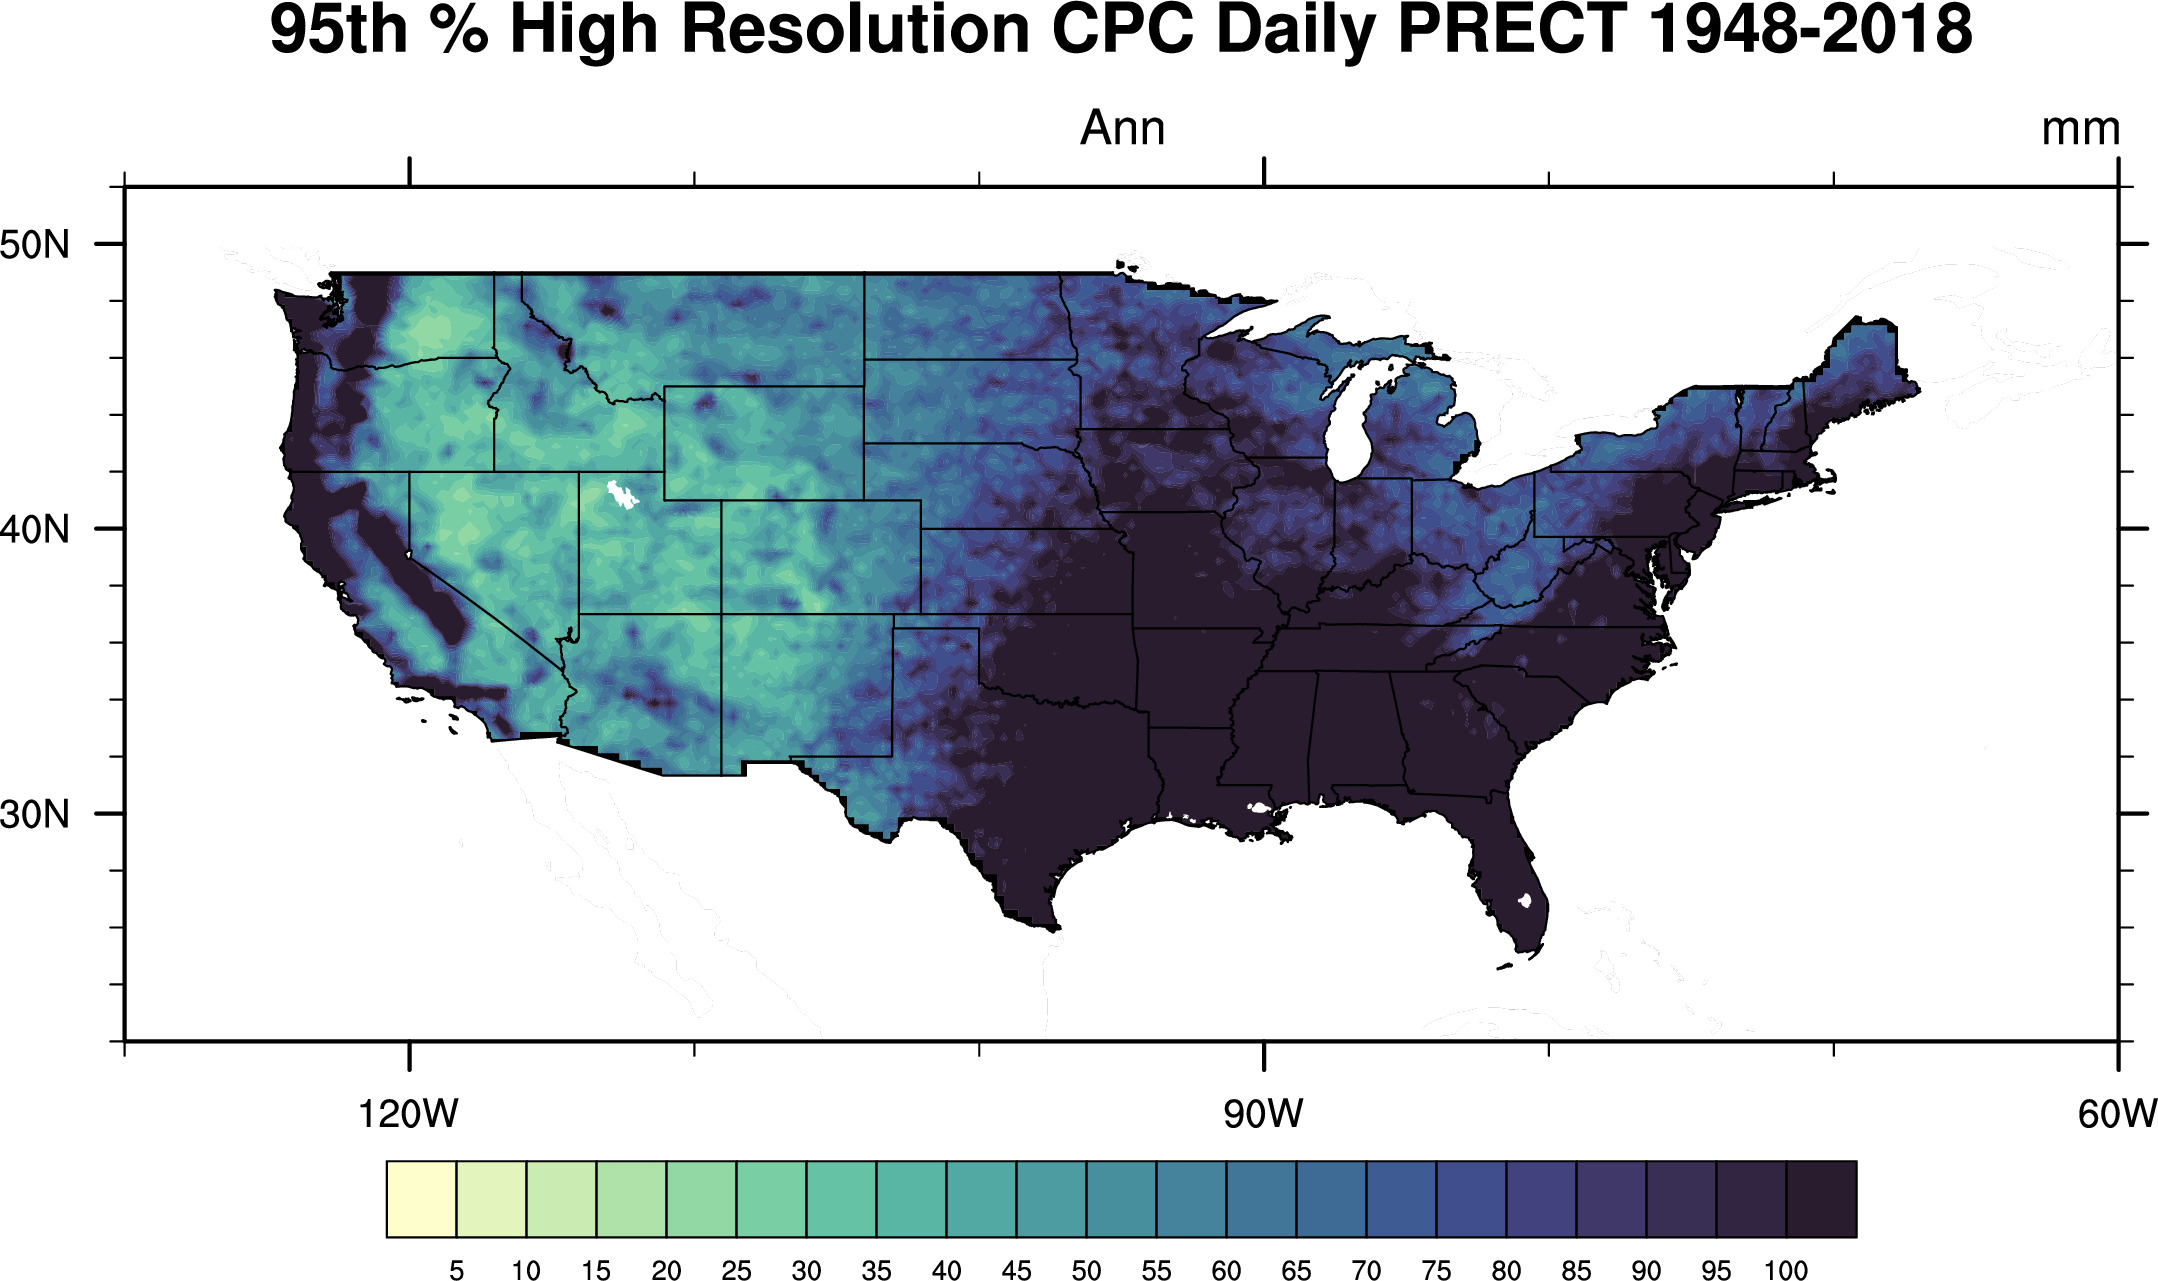
CPC 95th-percentiles
1948-2018 95th-percentiles


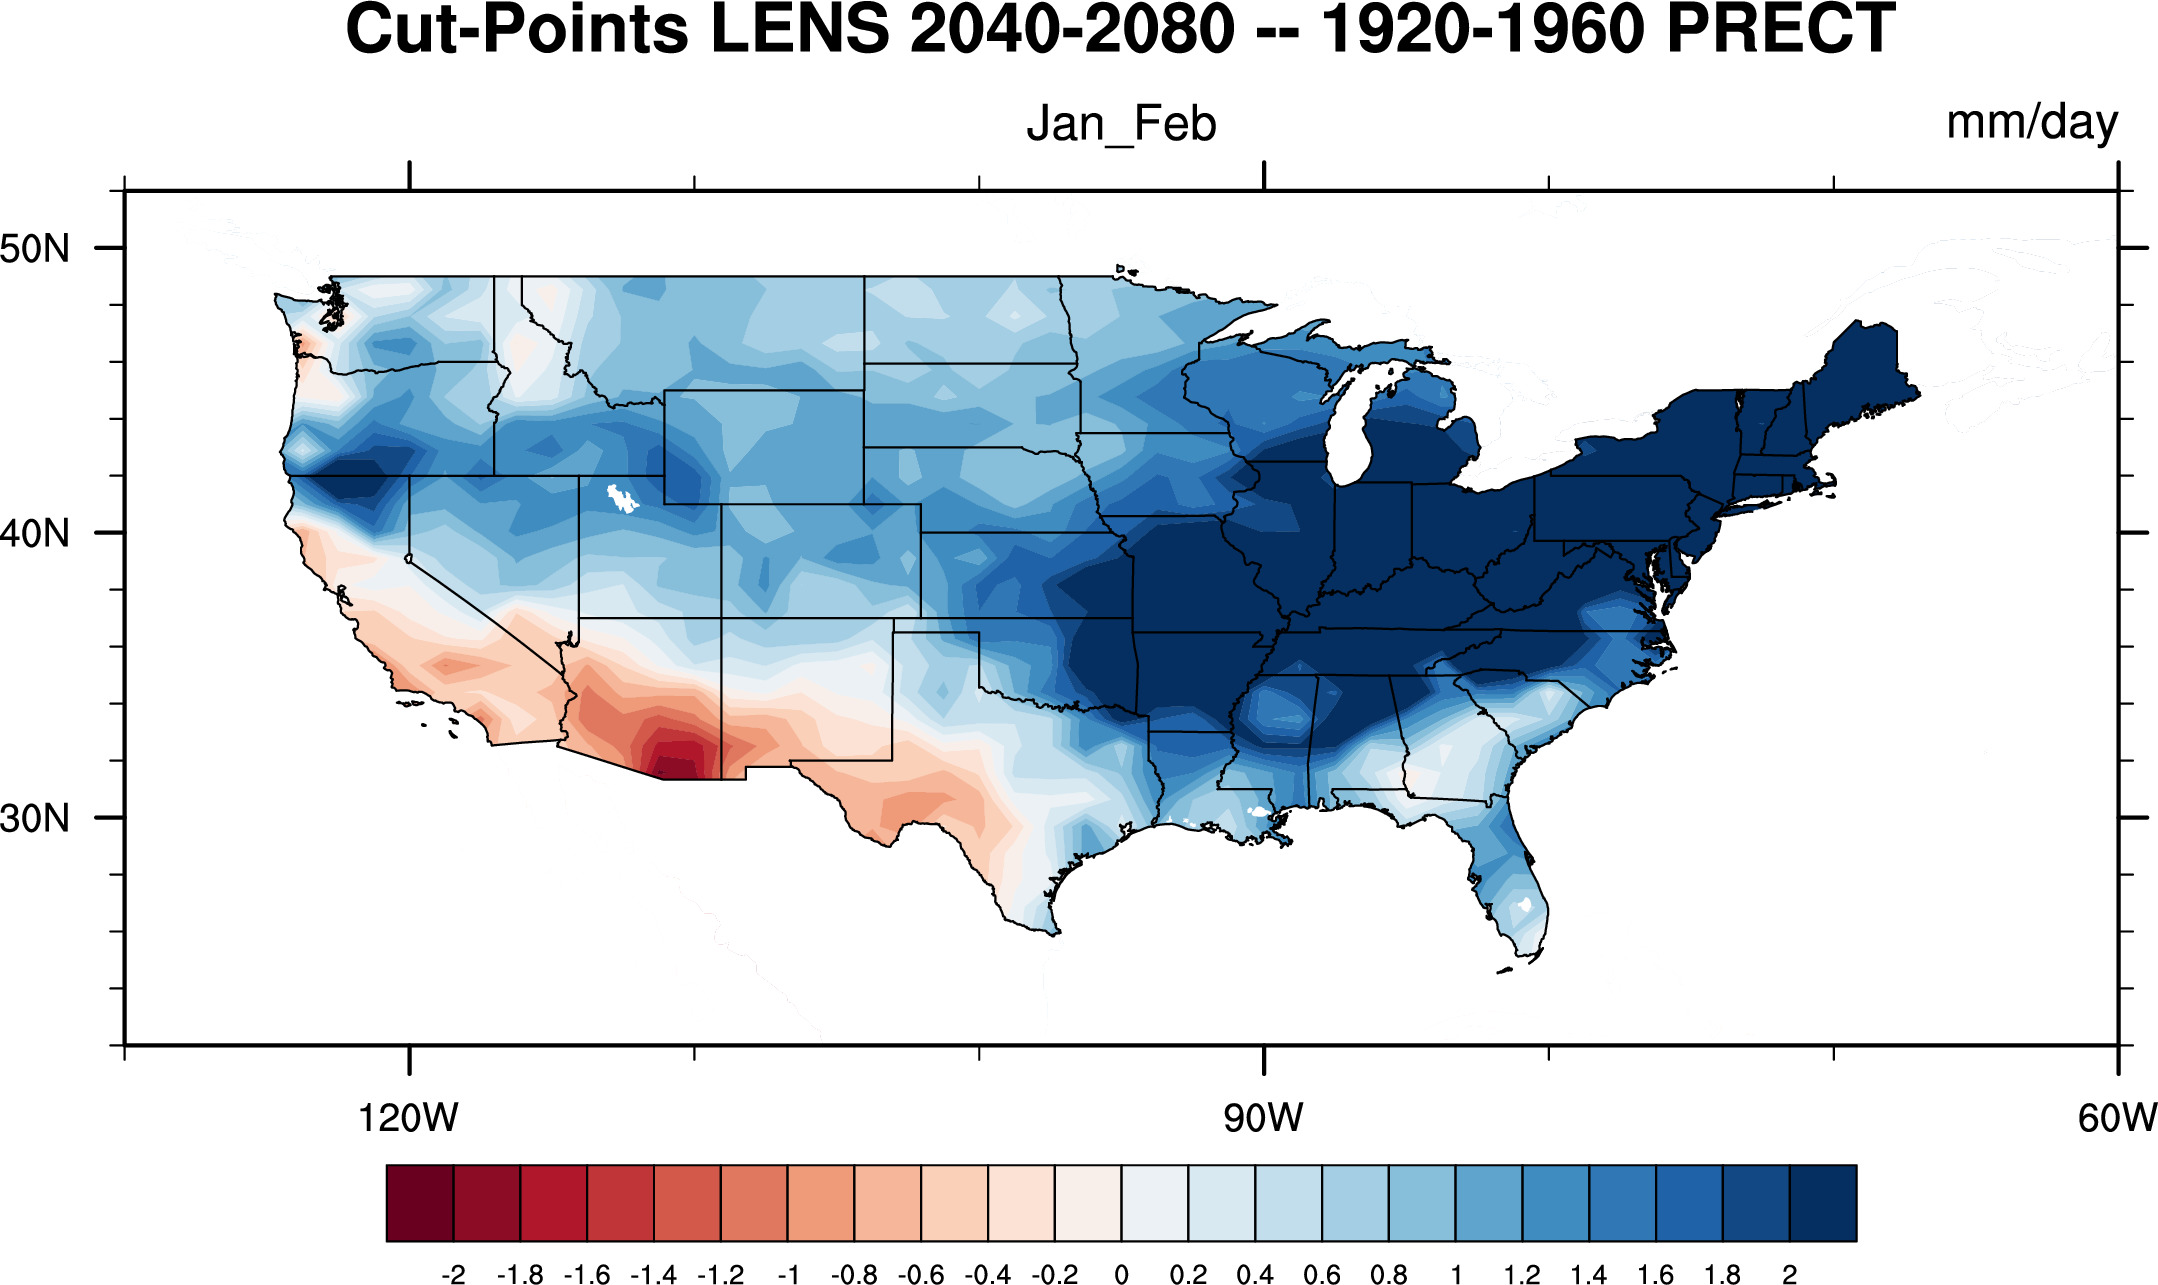
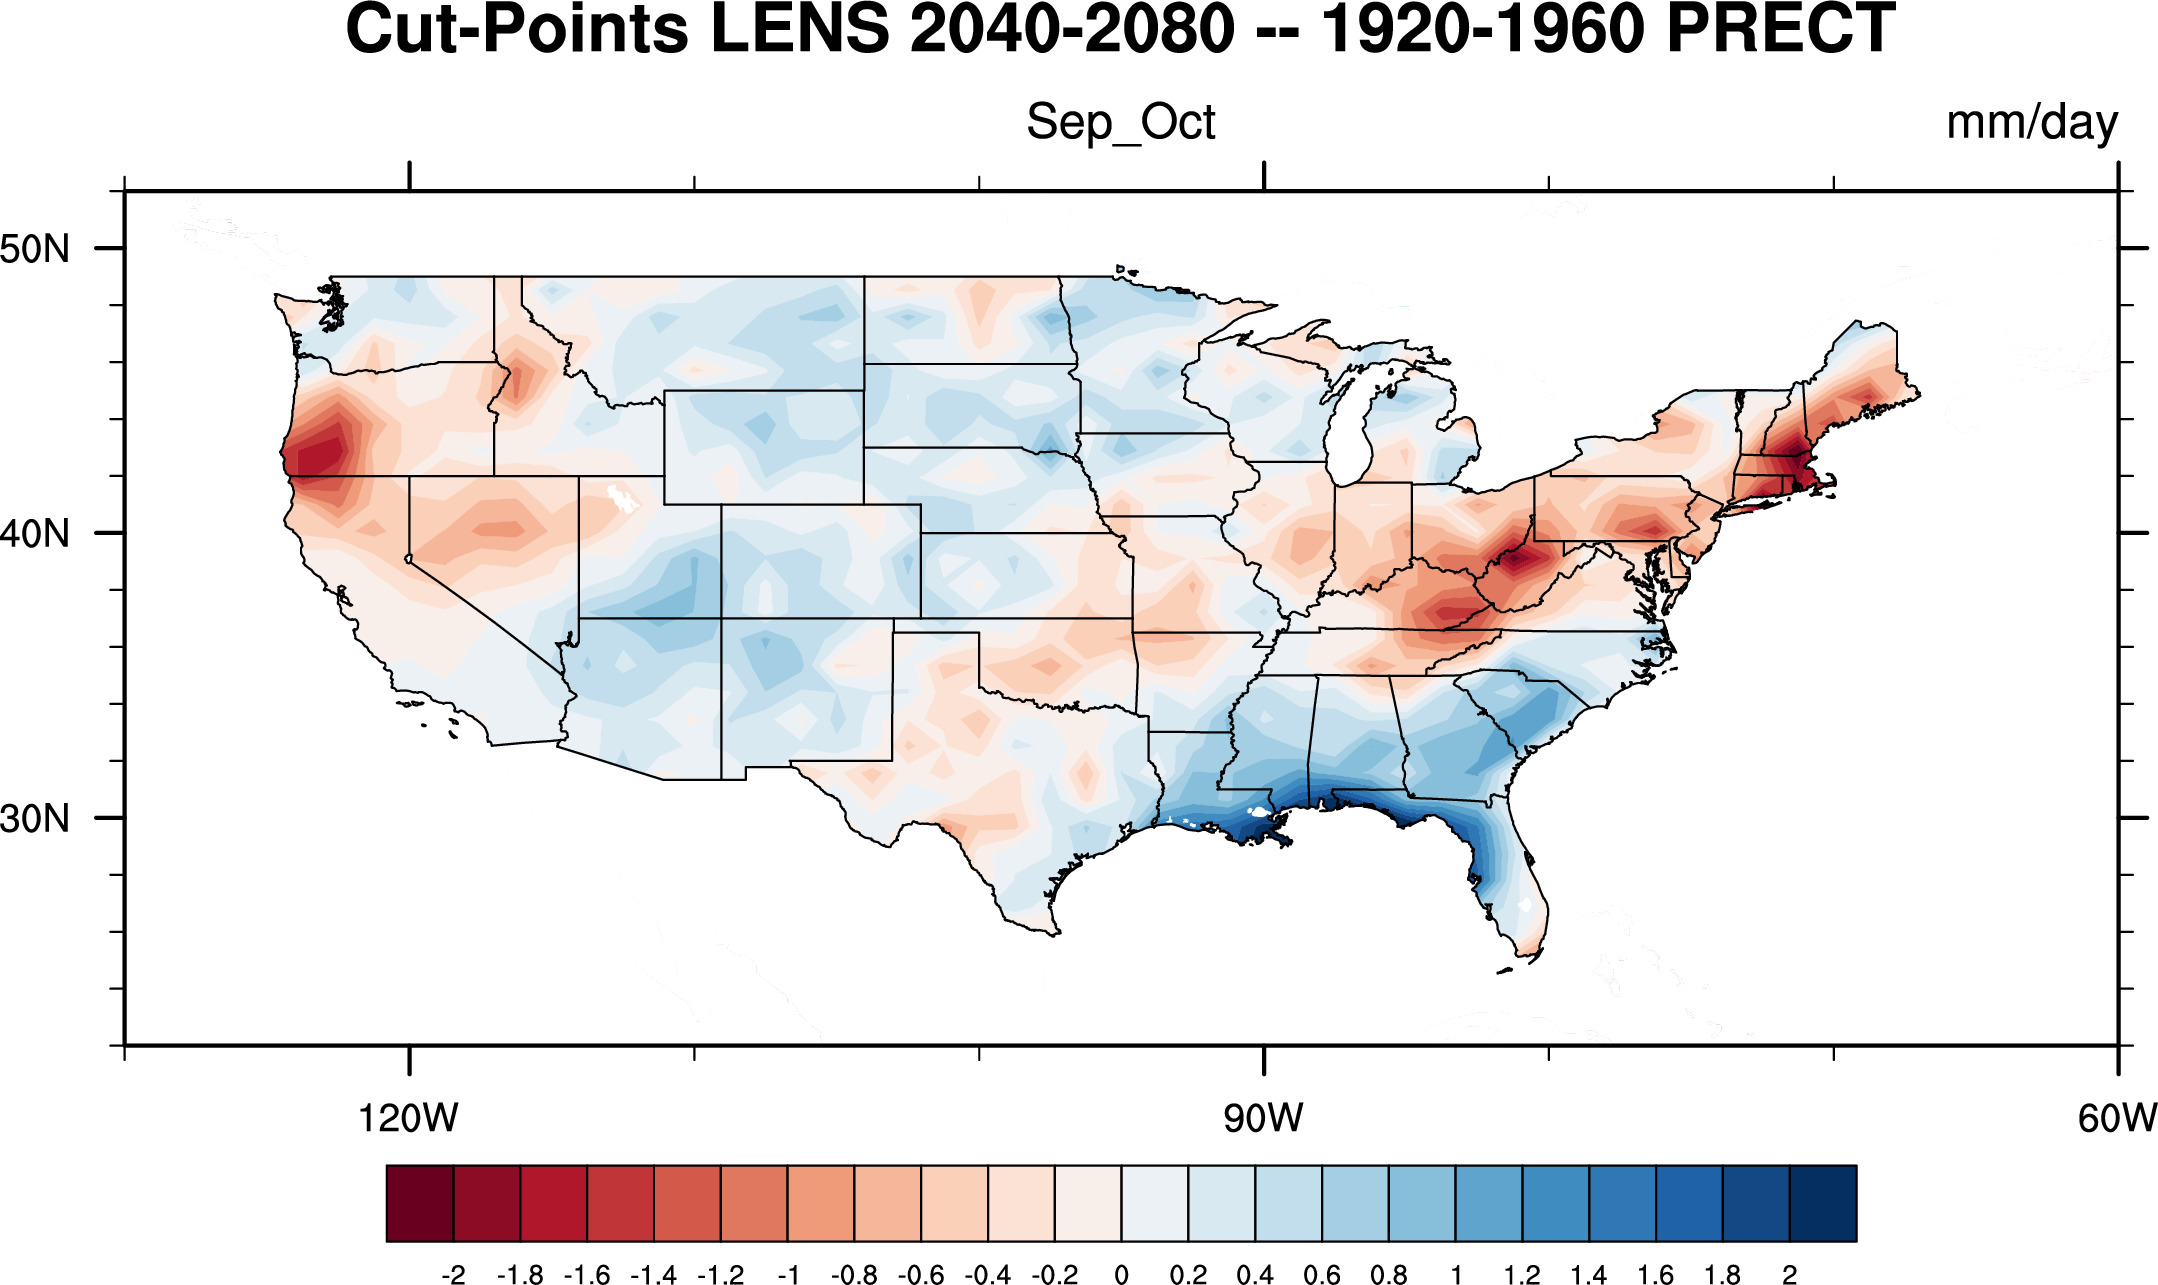
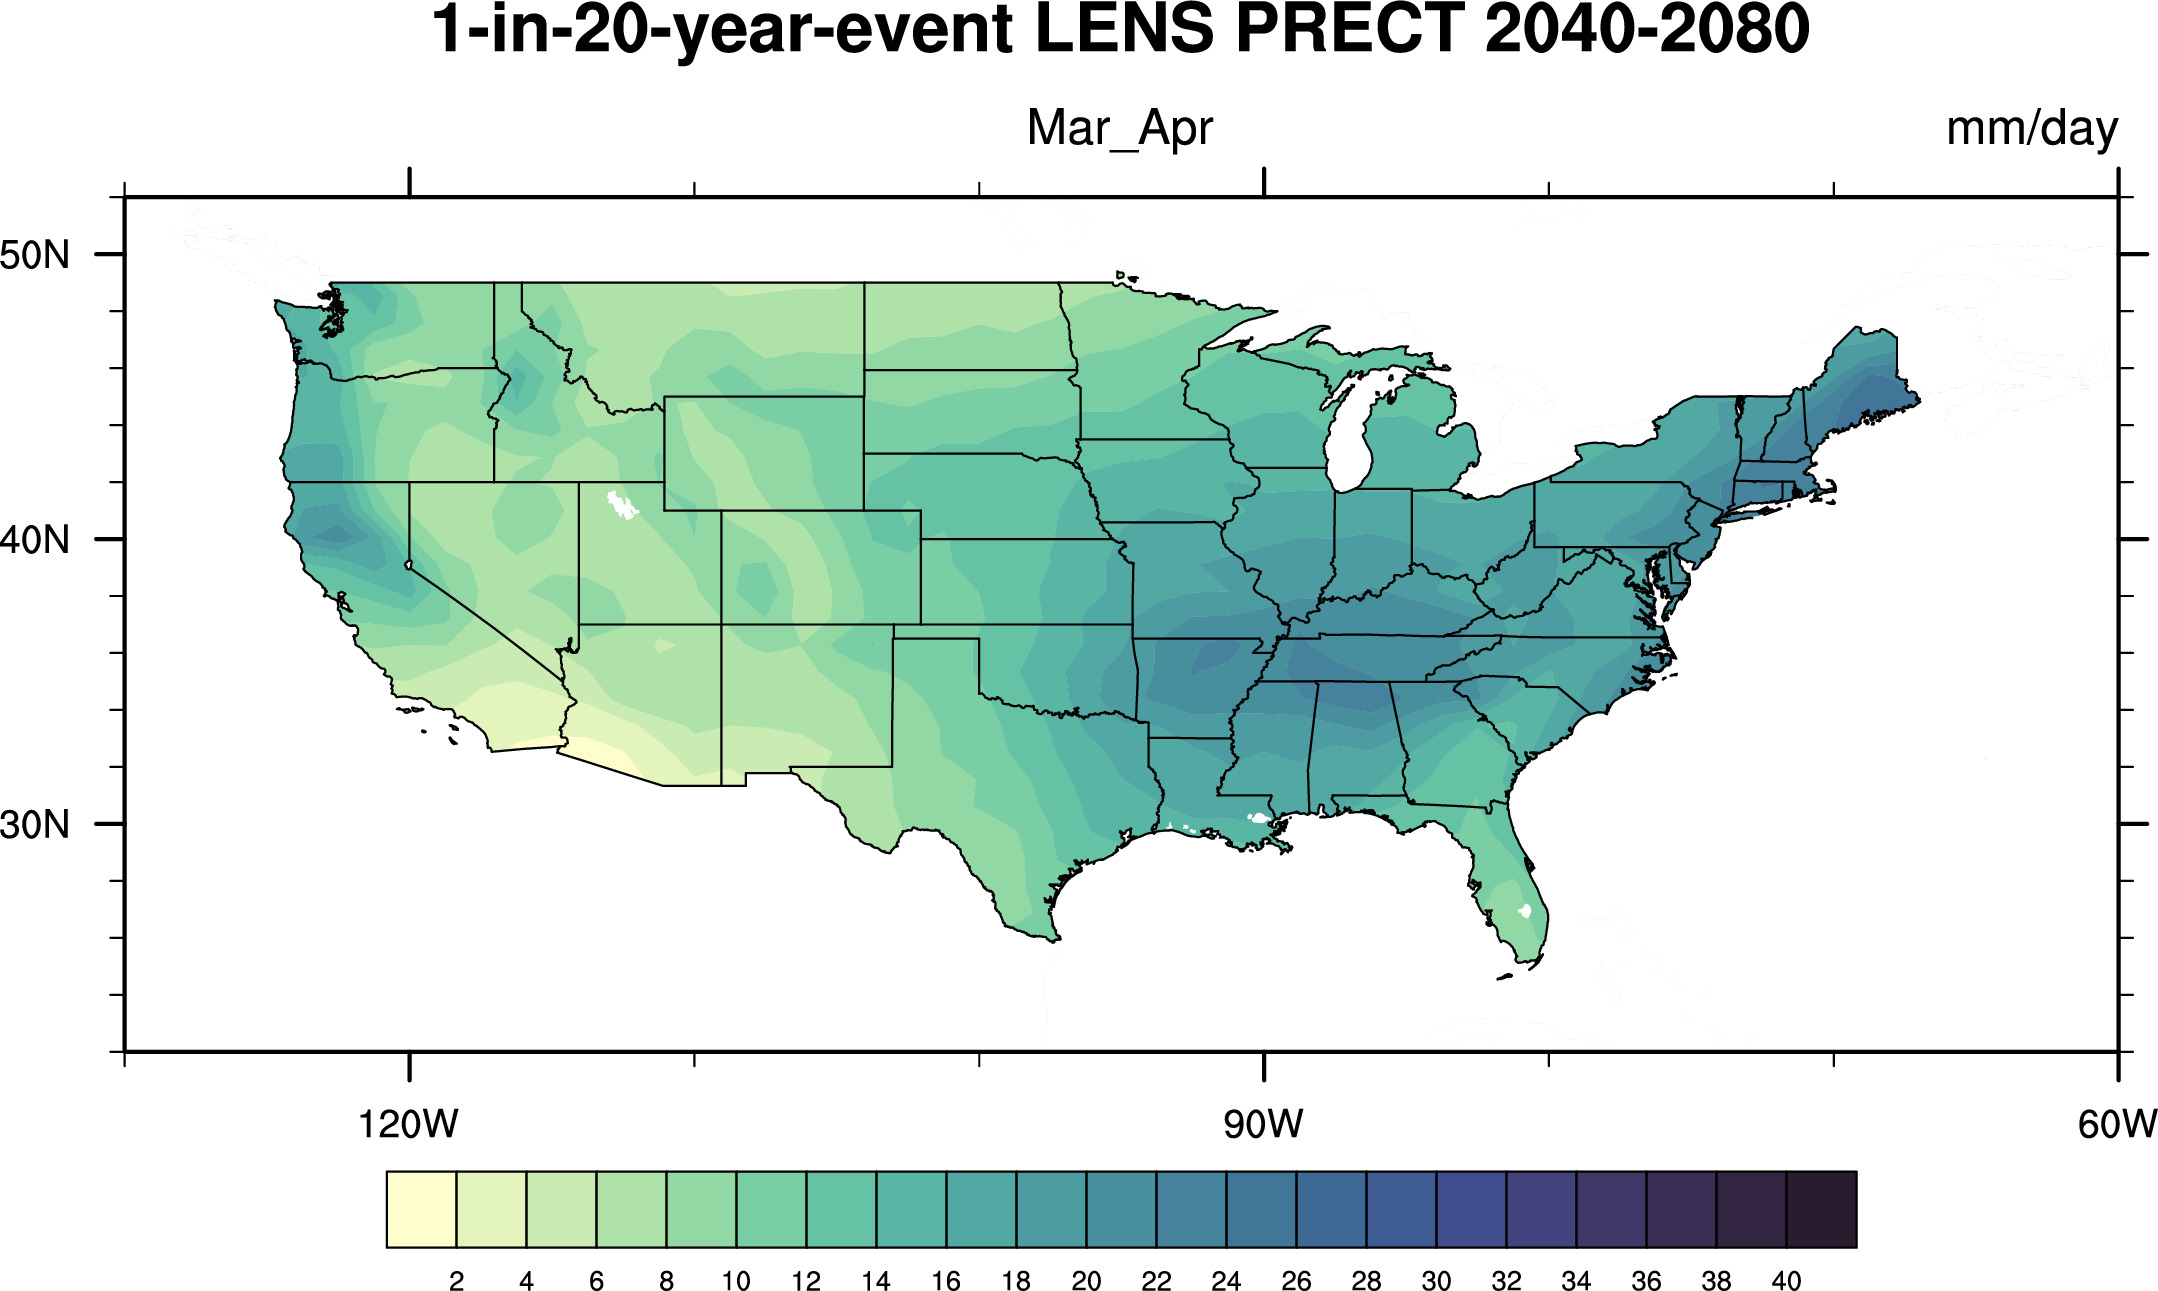
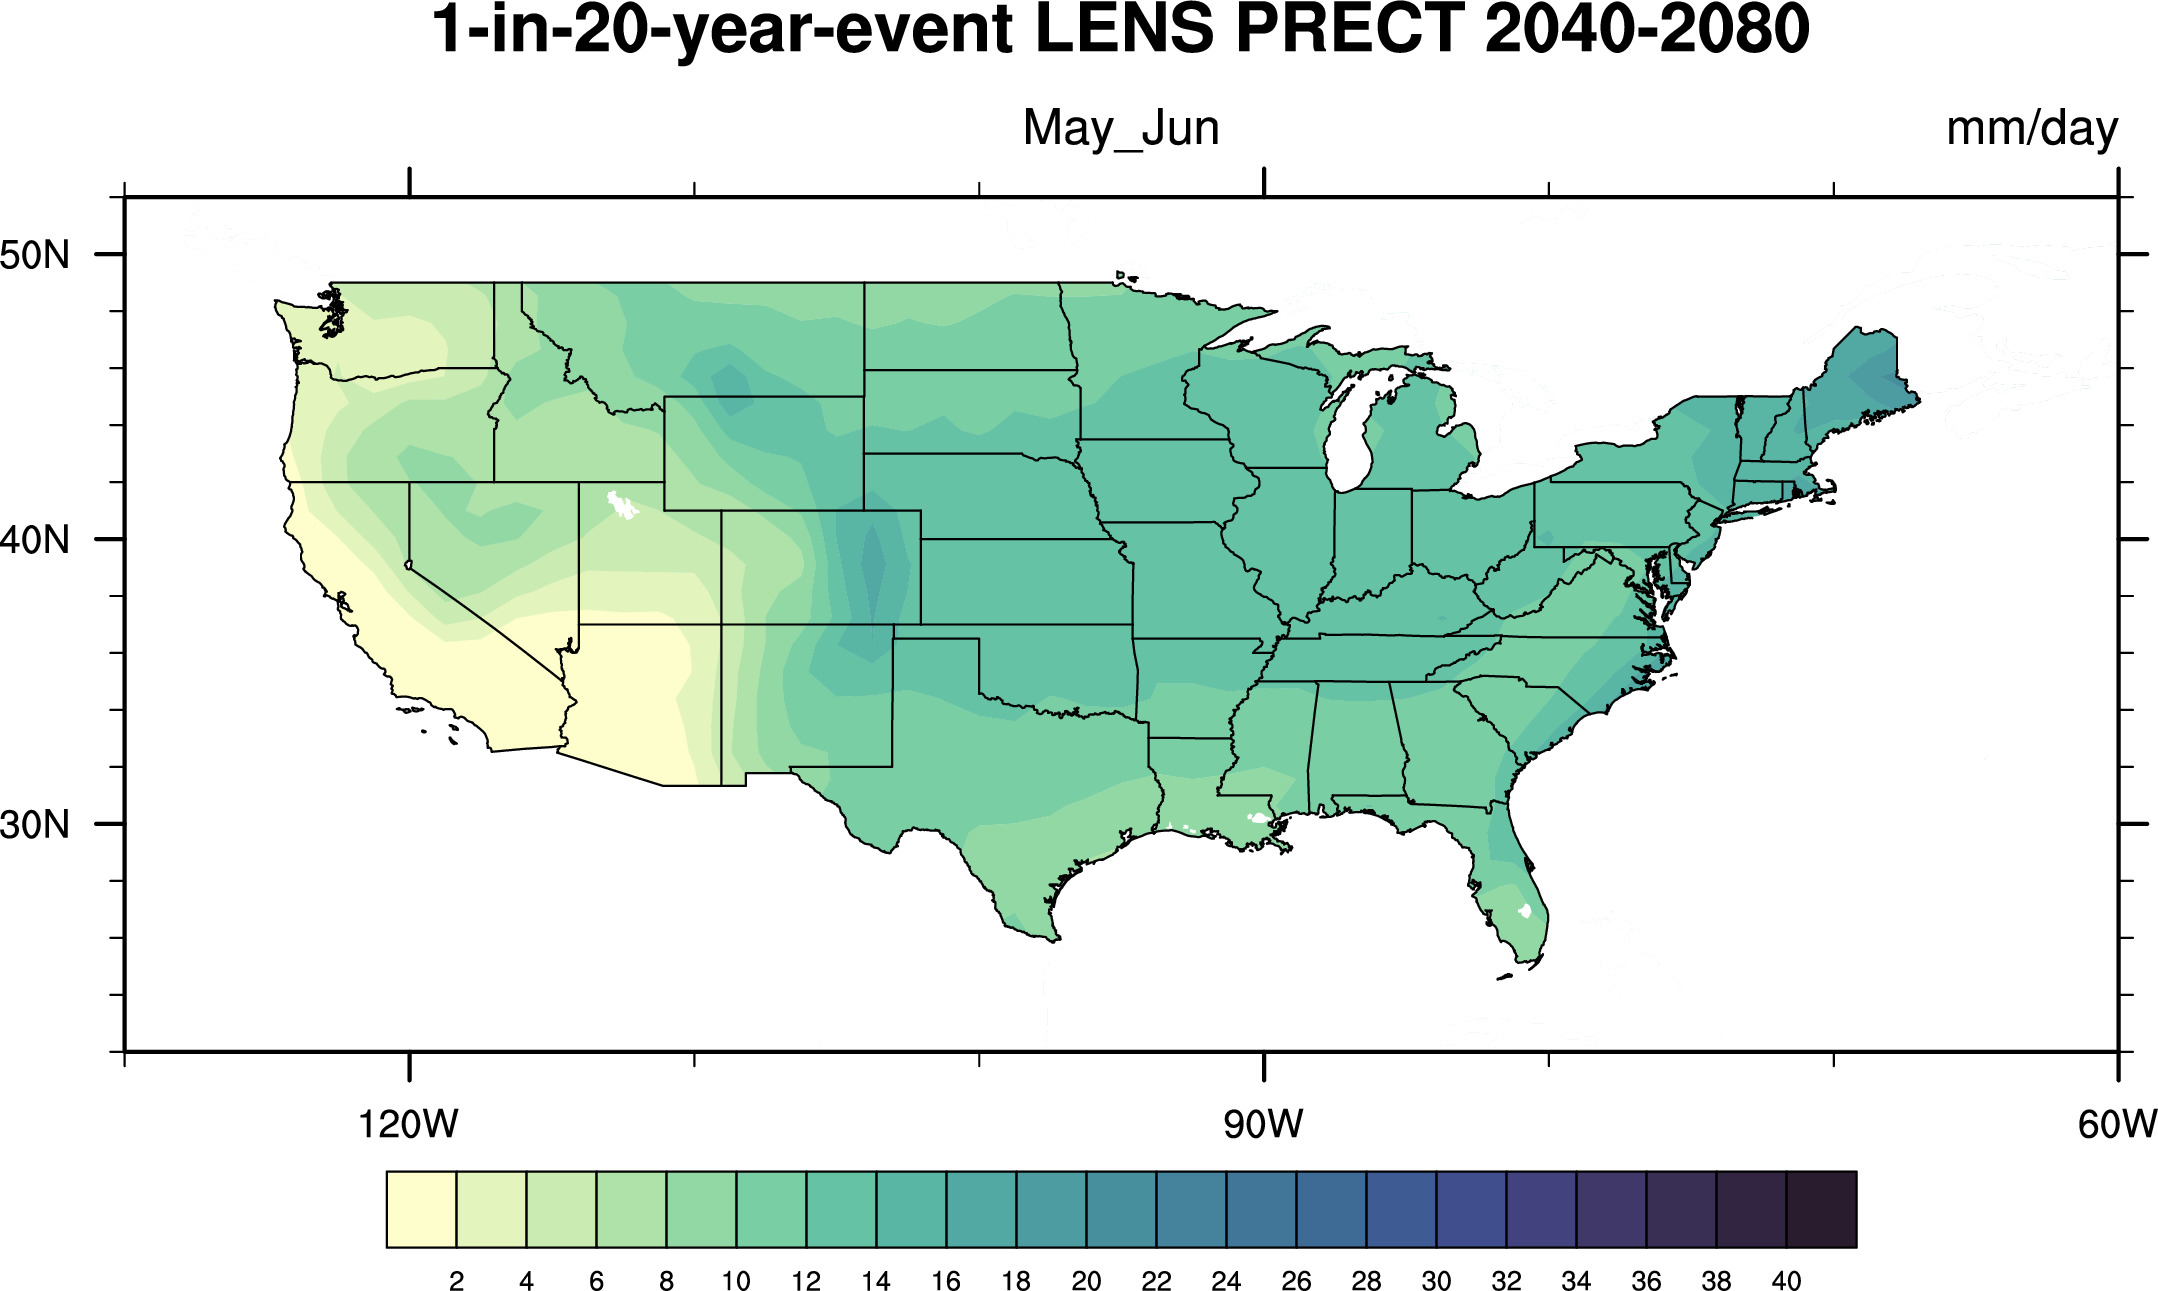
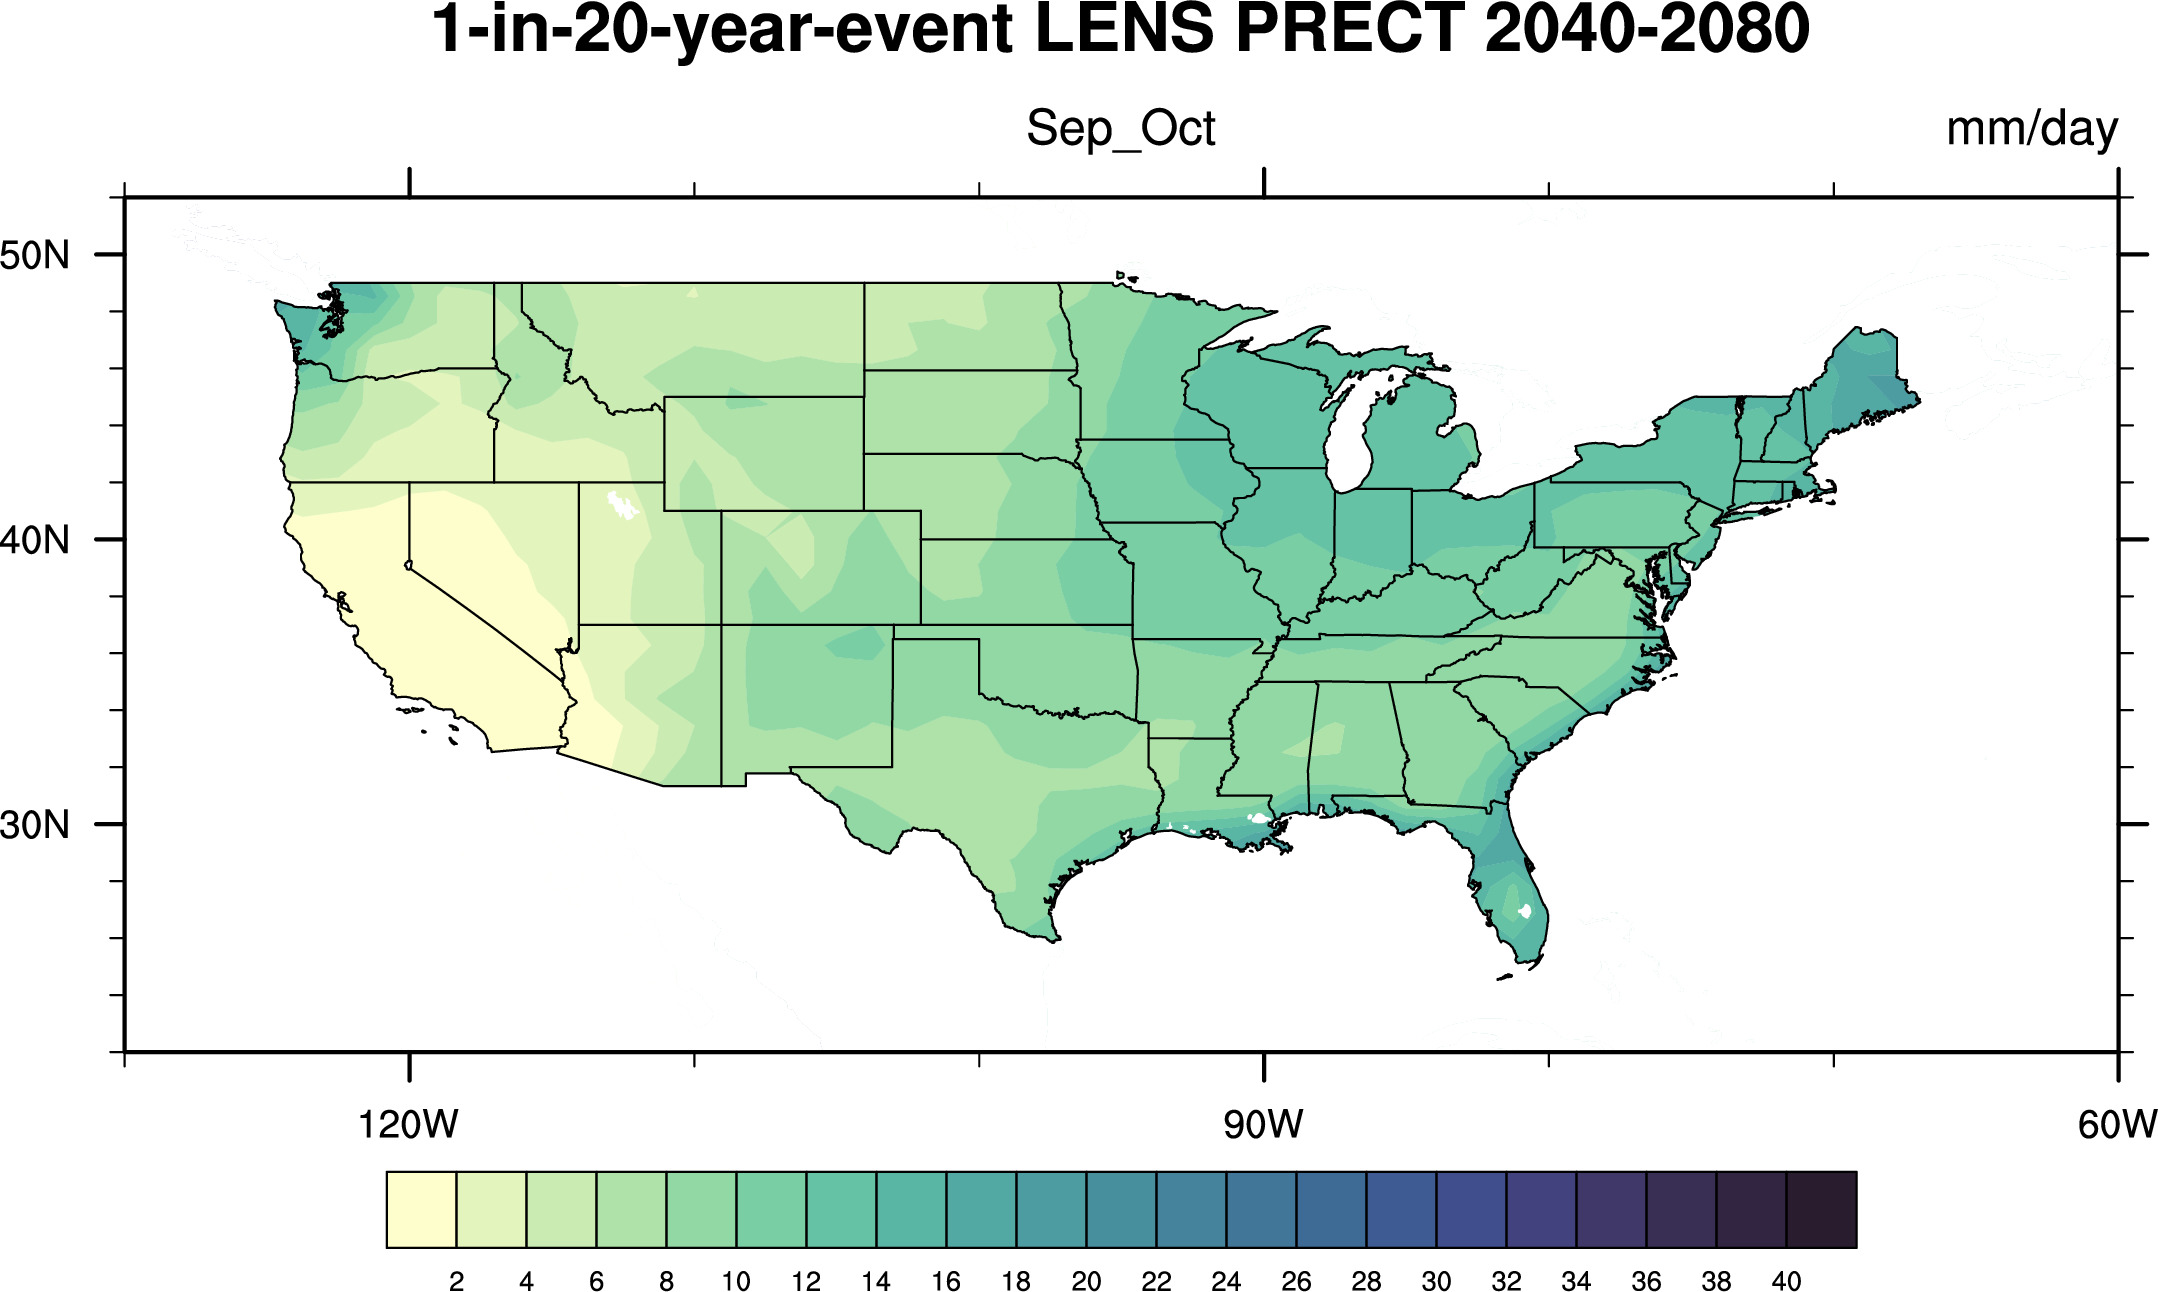
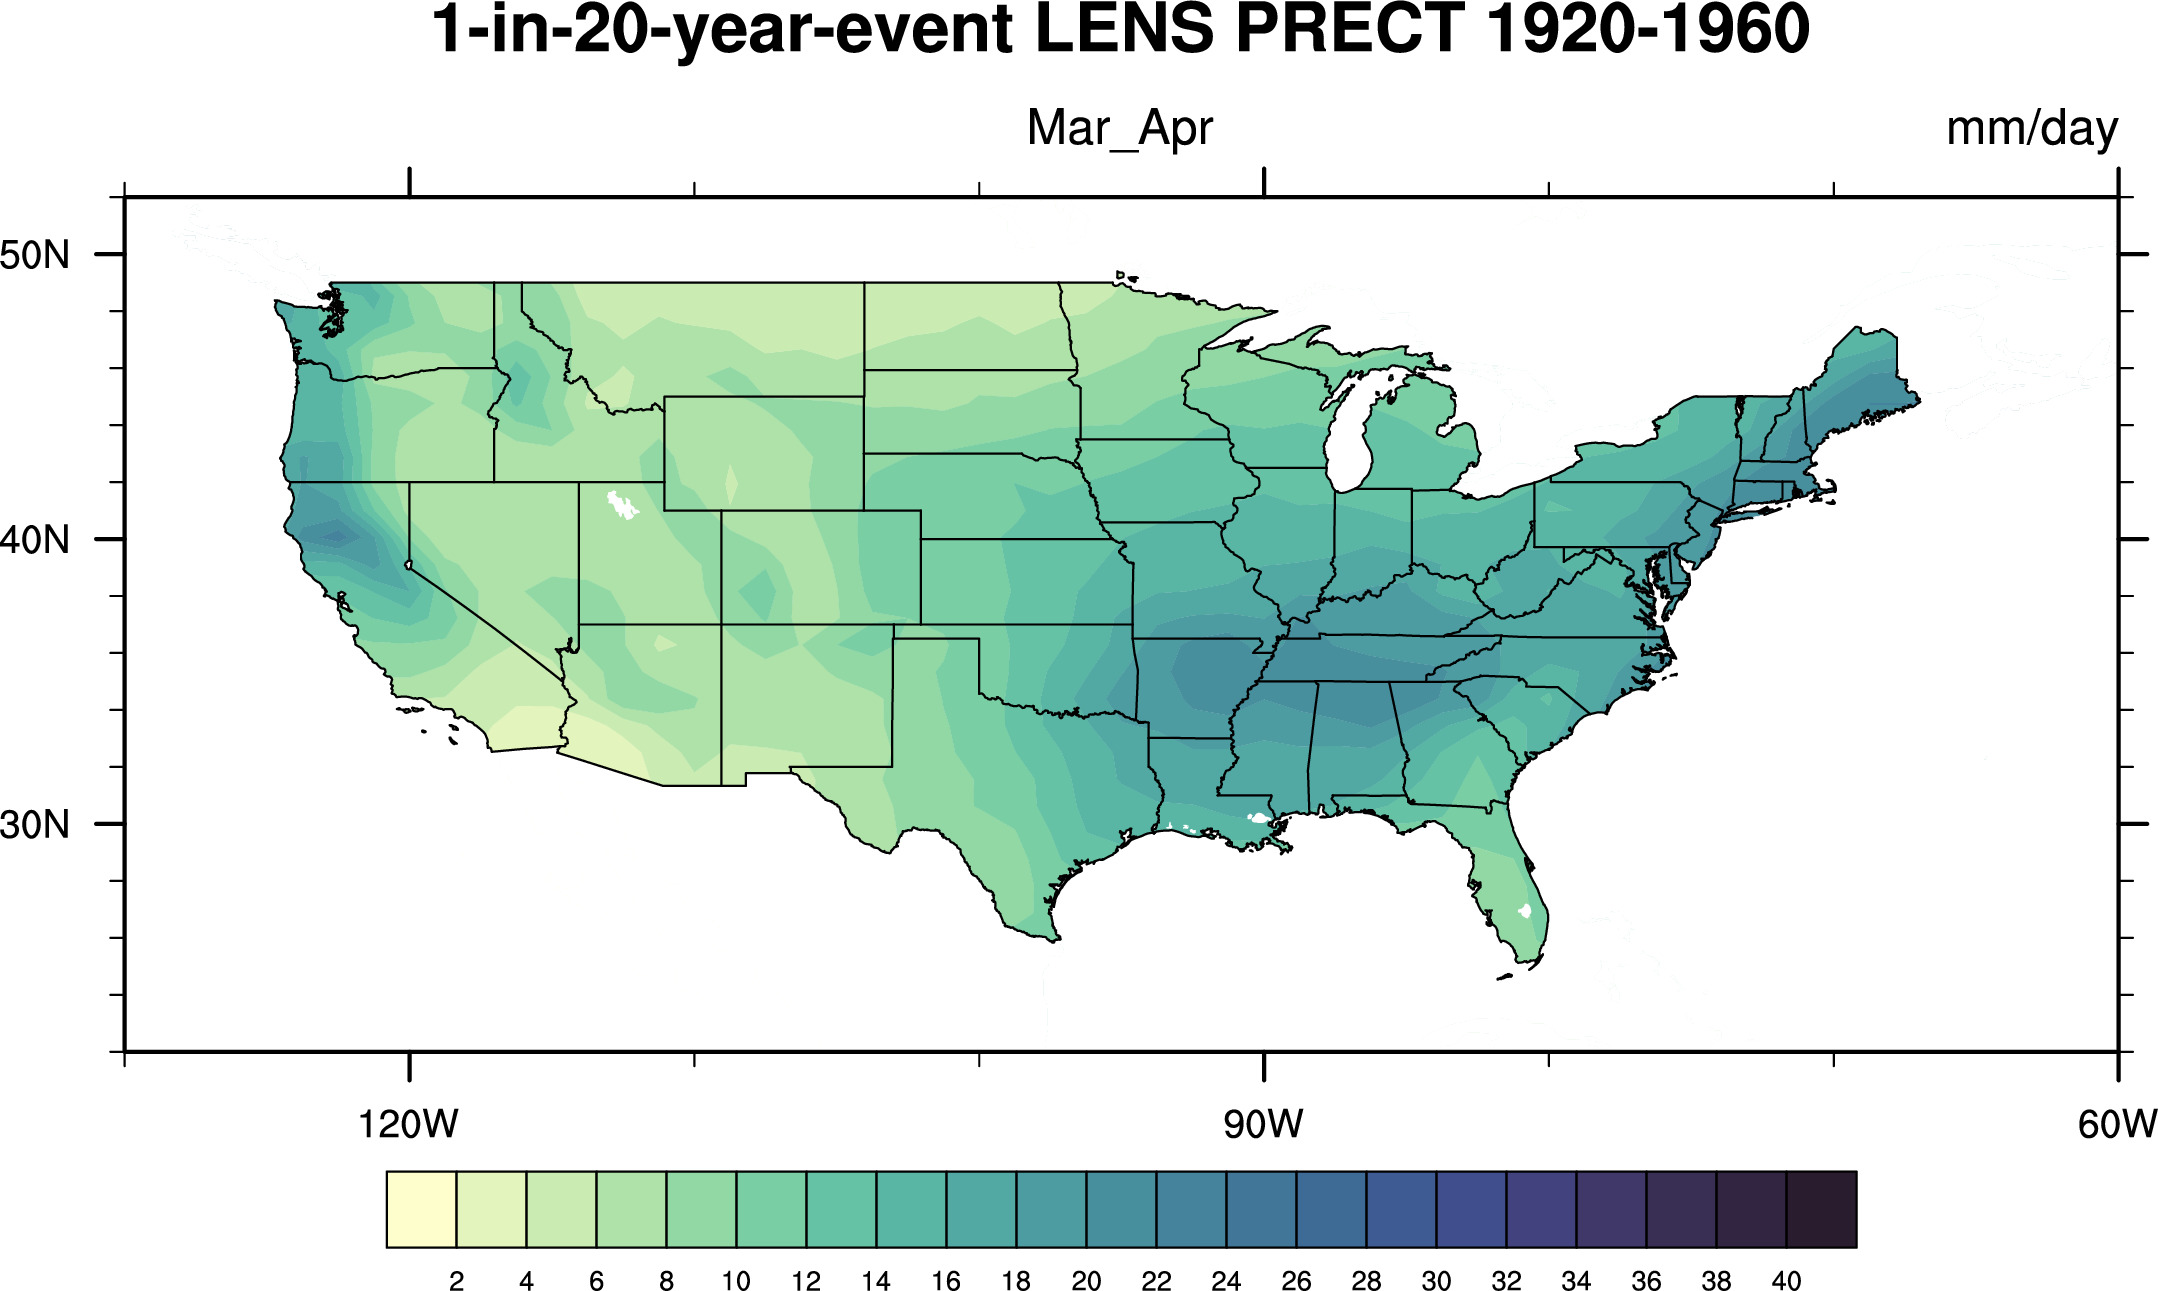
Large Ensemble (LENS) from NCAR
Difference of LENS 2040-2080 and LENS 1920-1960 (1o x 1o lat-lon grid) Cut-points:


'Cut-points' from 40 LENS (1o x 1o lat-lon grid) runs 2040-2080


'Cut-points' from 40 LENS (1o x 1o lat-lon grid) runs 1920-1960


-----------------------------------
CAM5
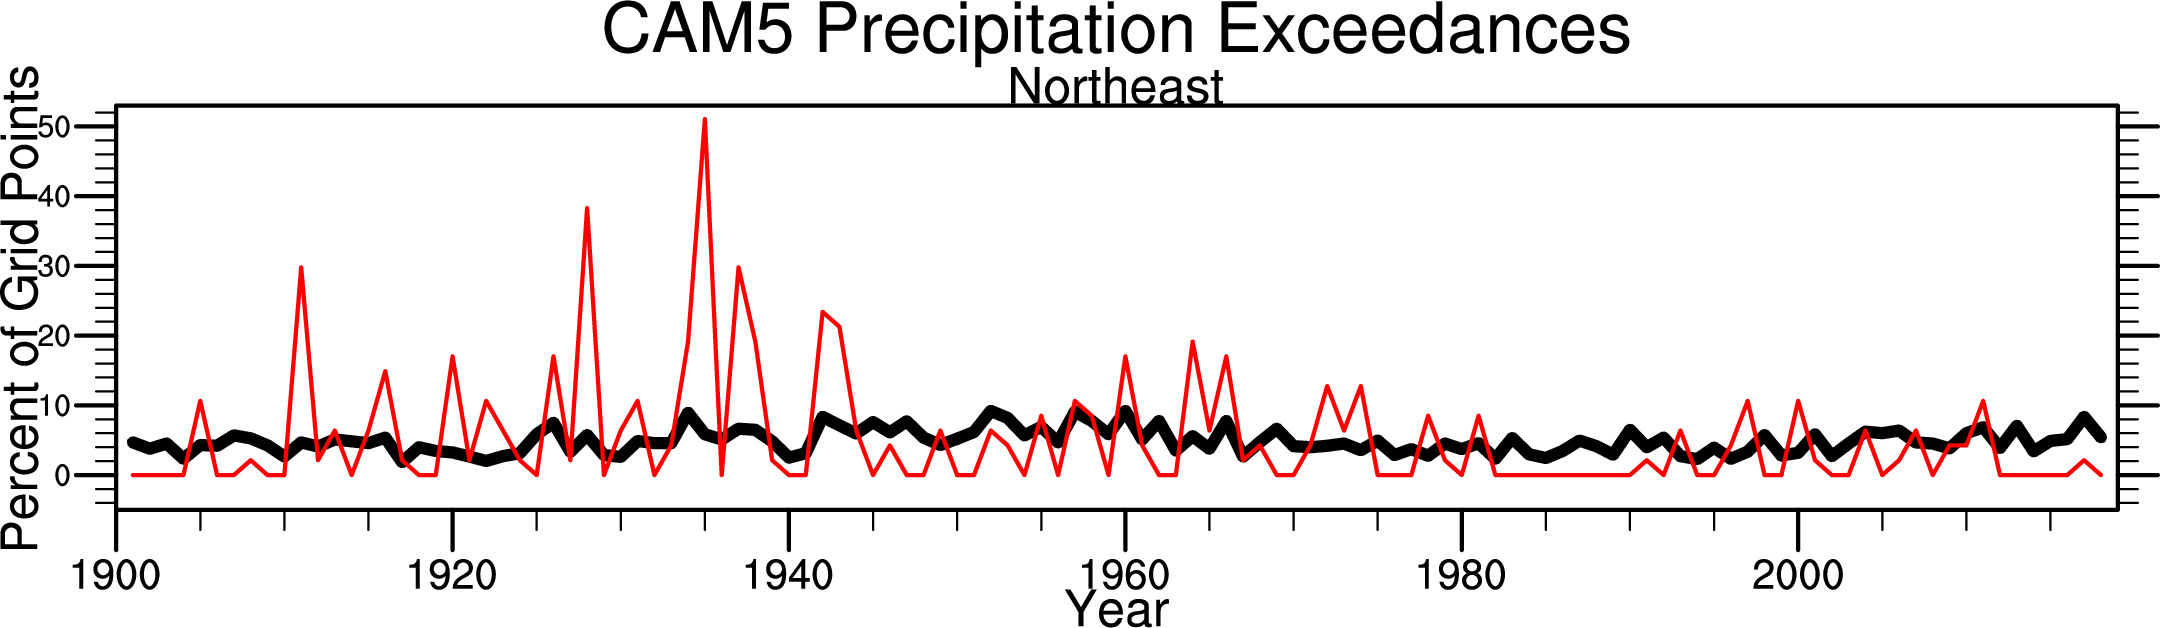
CAM5 Factual Sample runs (1o x 1o lat-lon grid) region9 with mean (heavy black line)


1948-2018 US CPC Daily precip
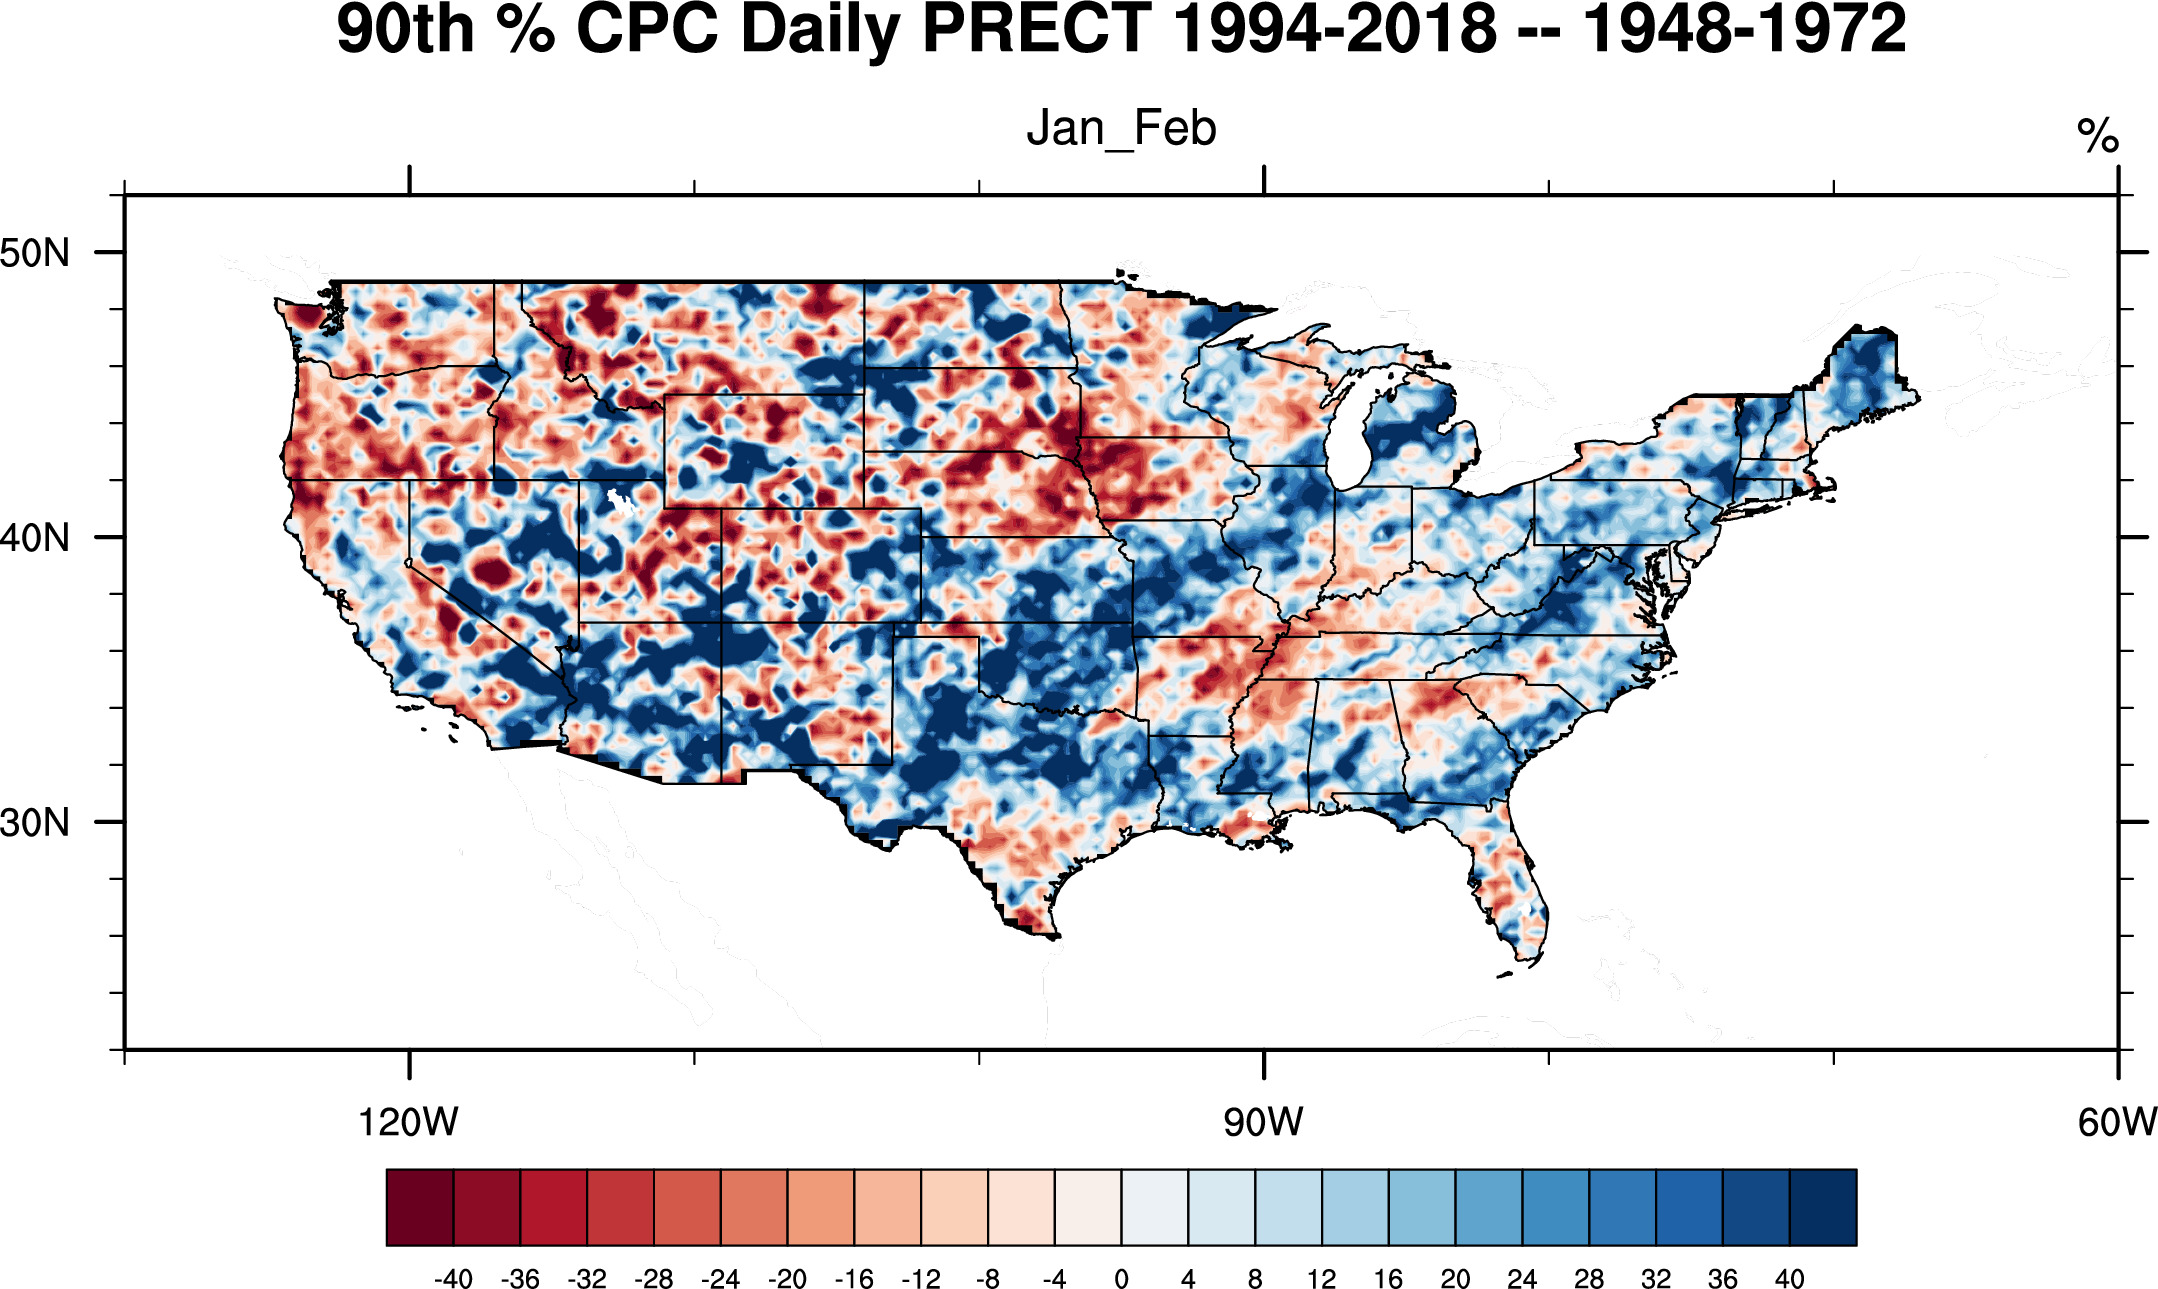
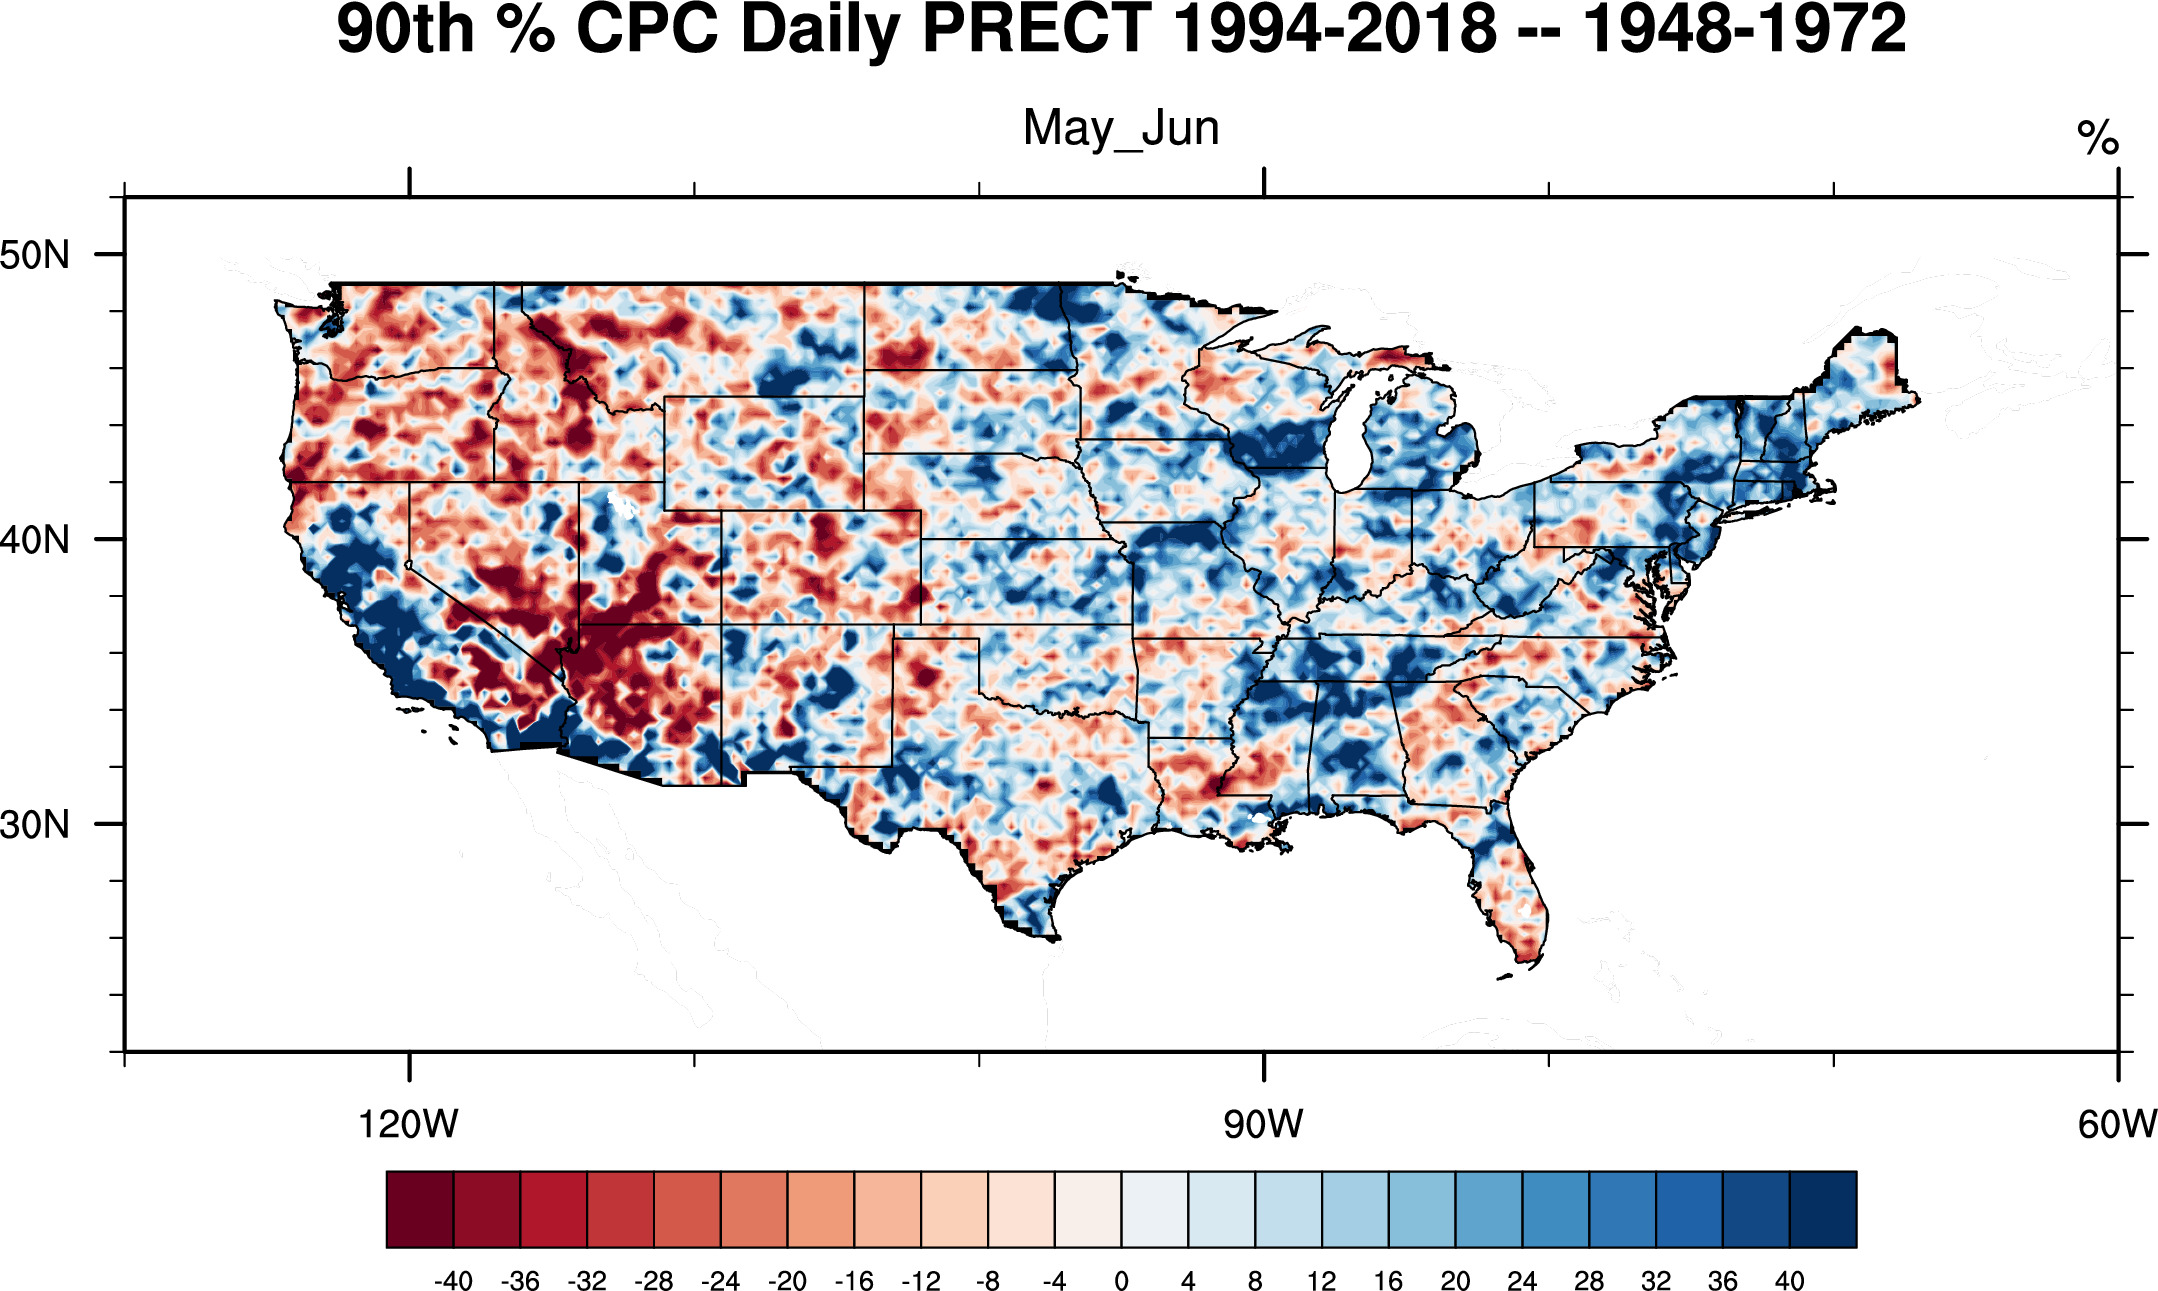
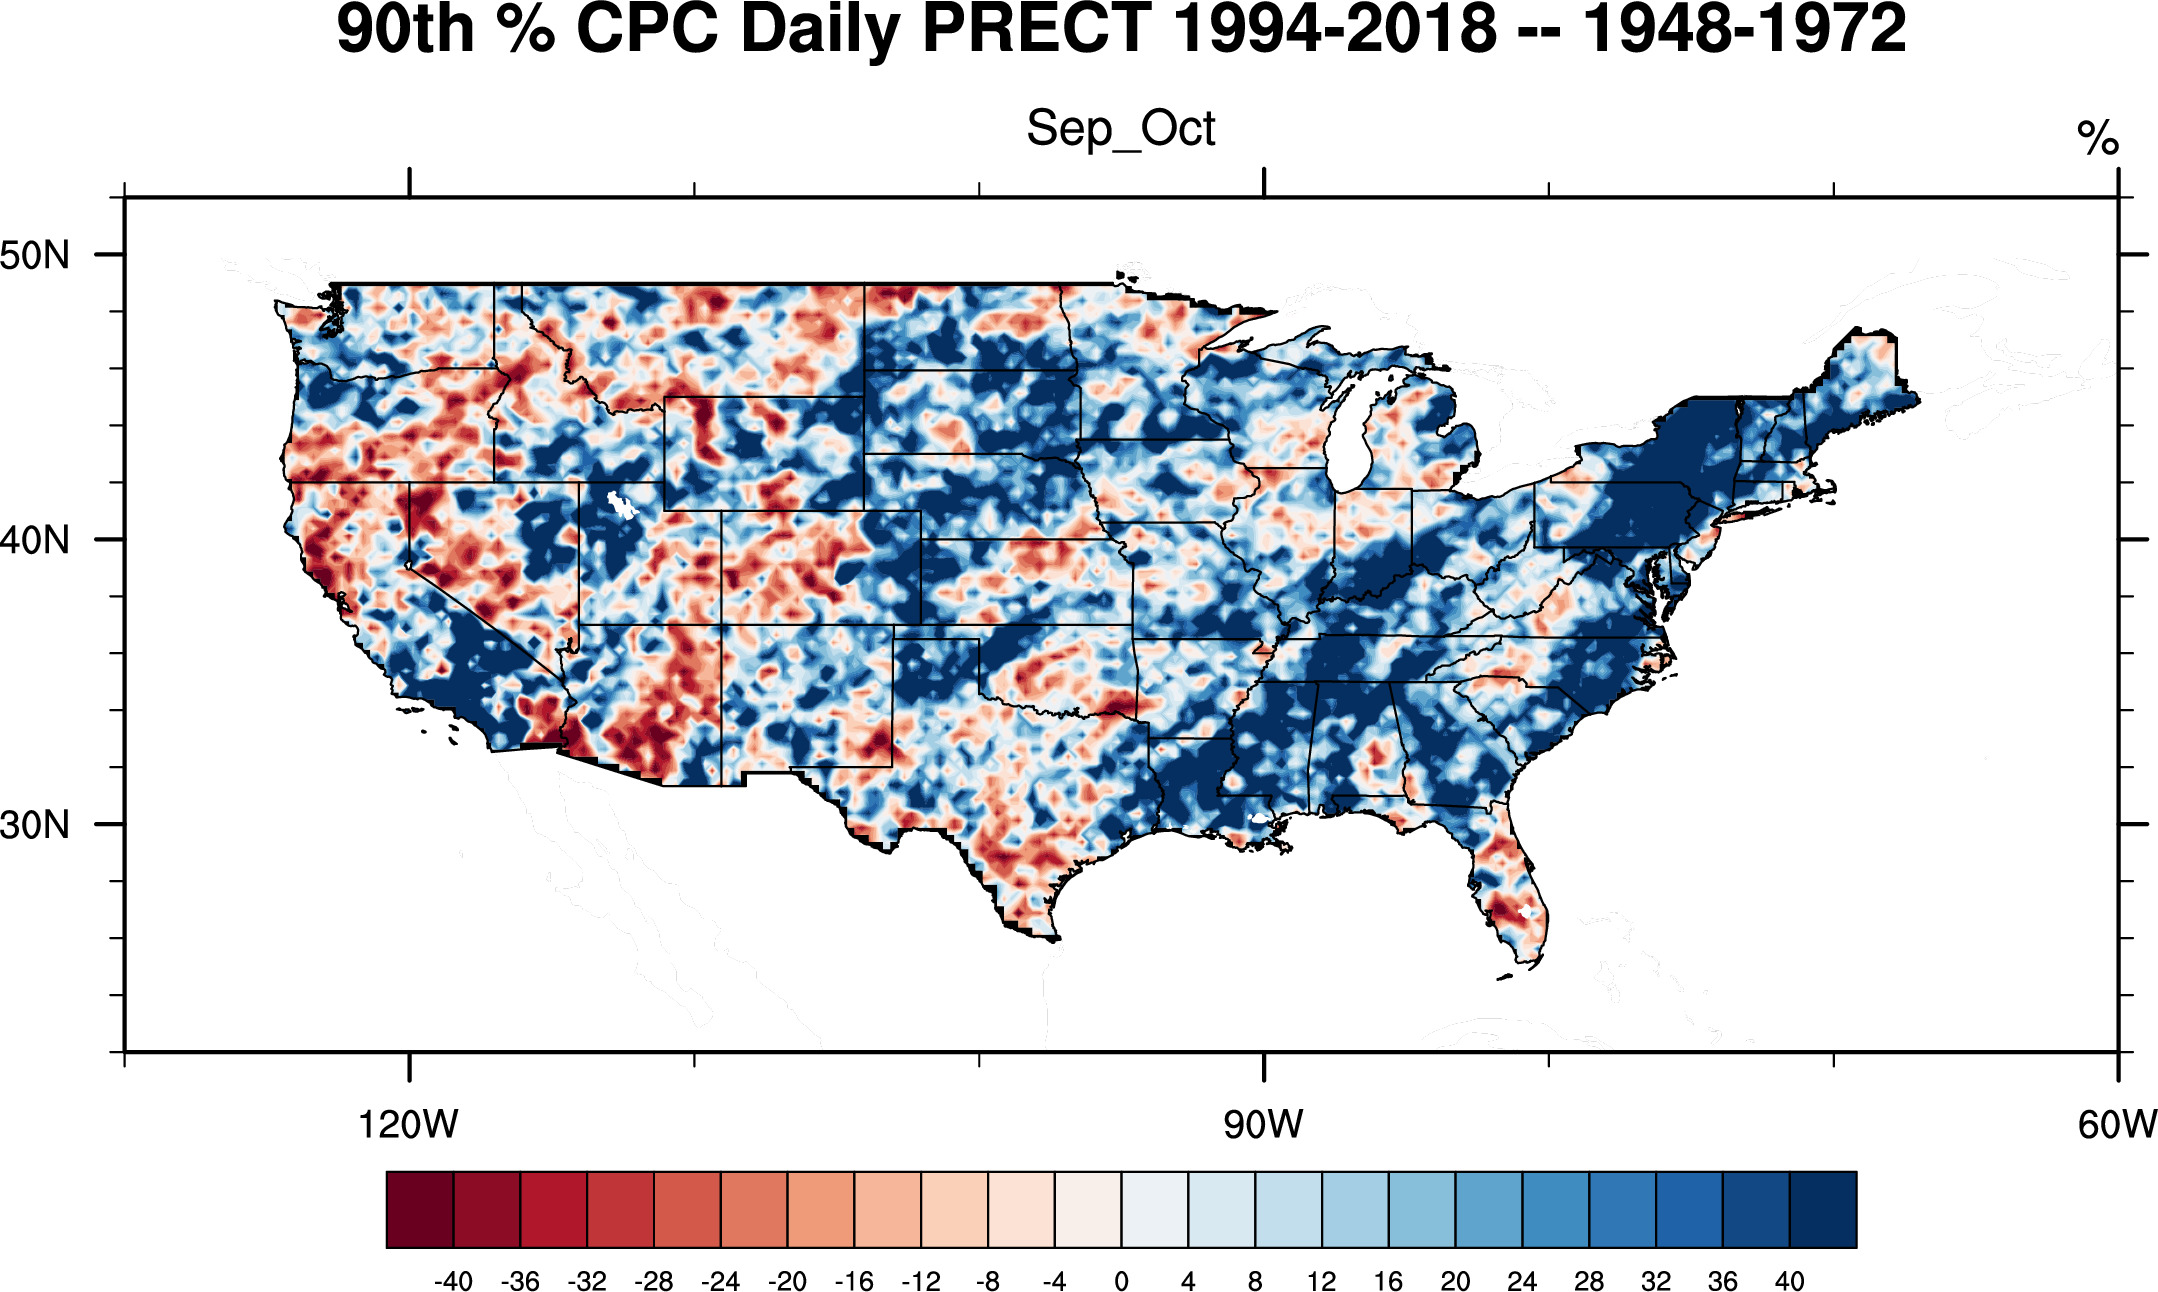
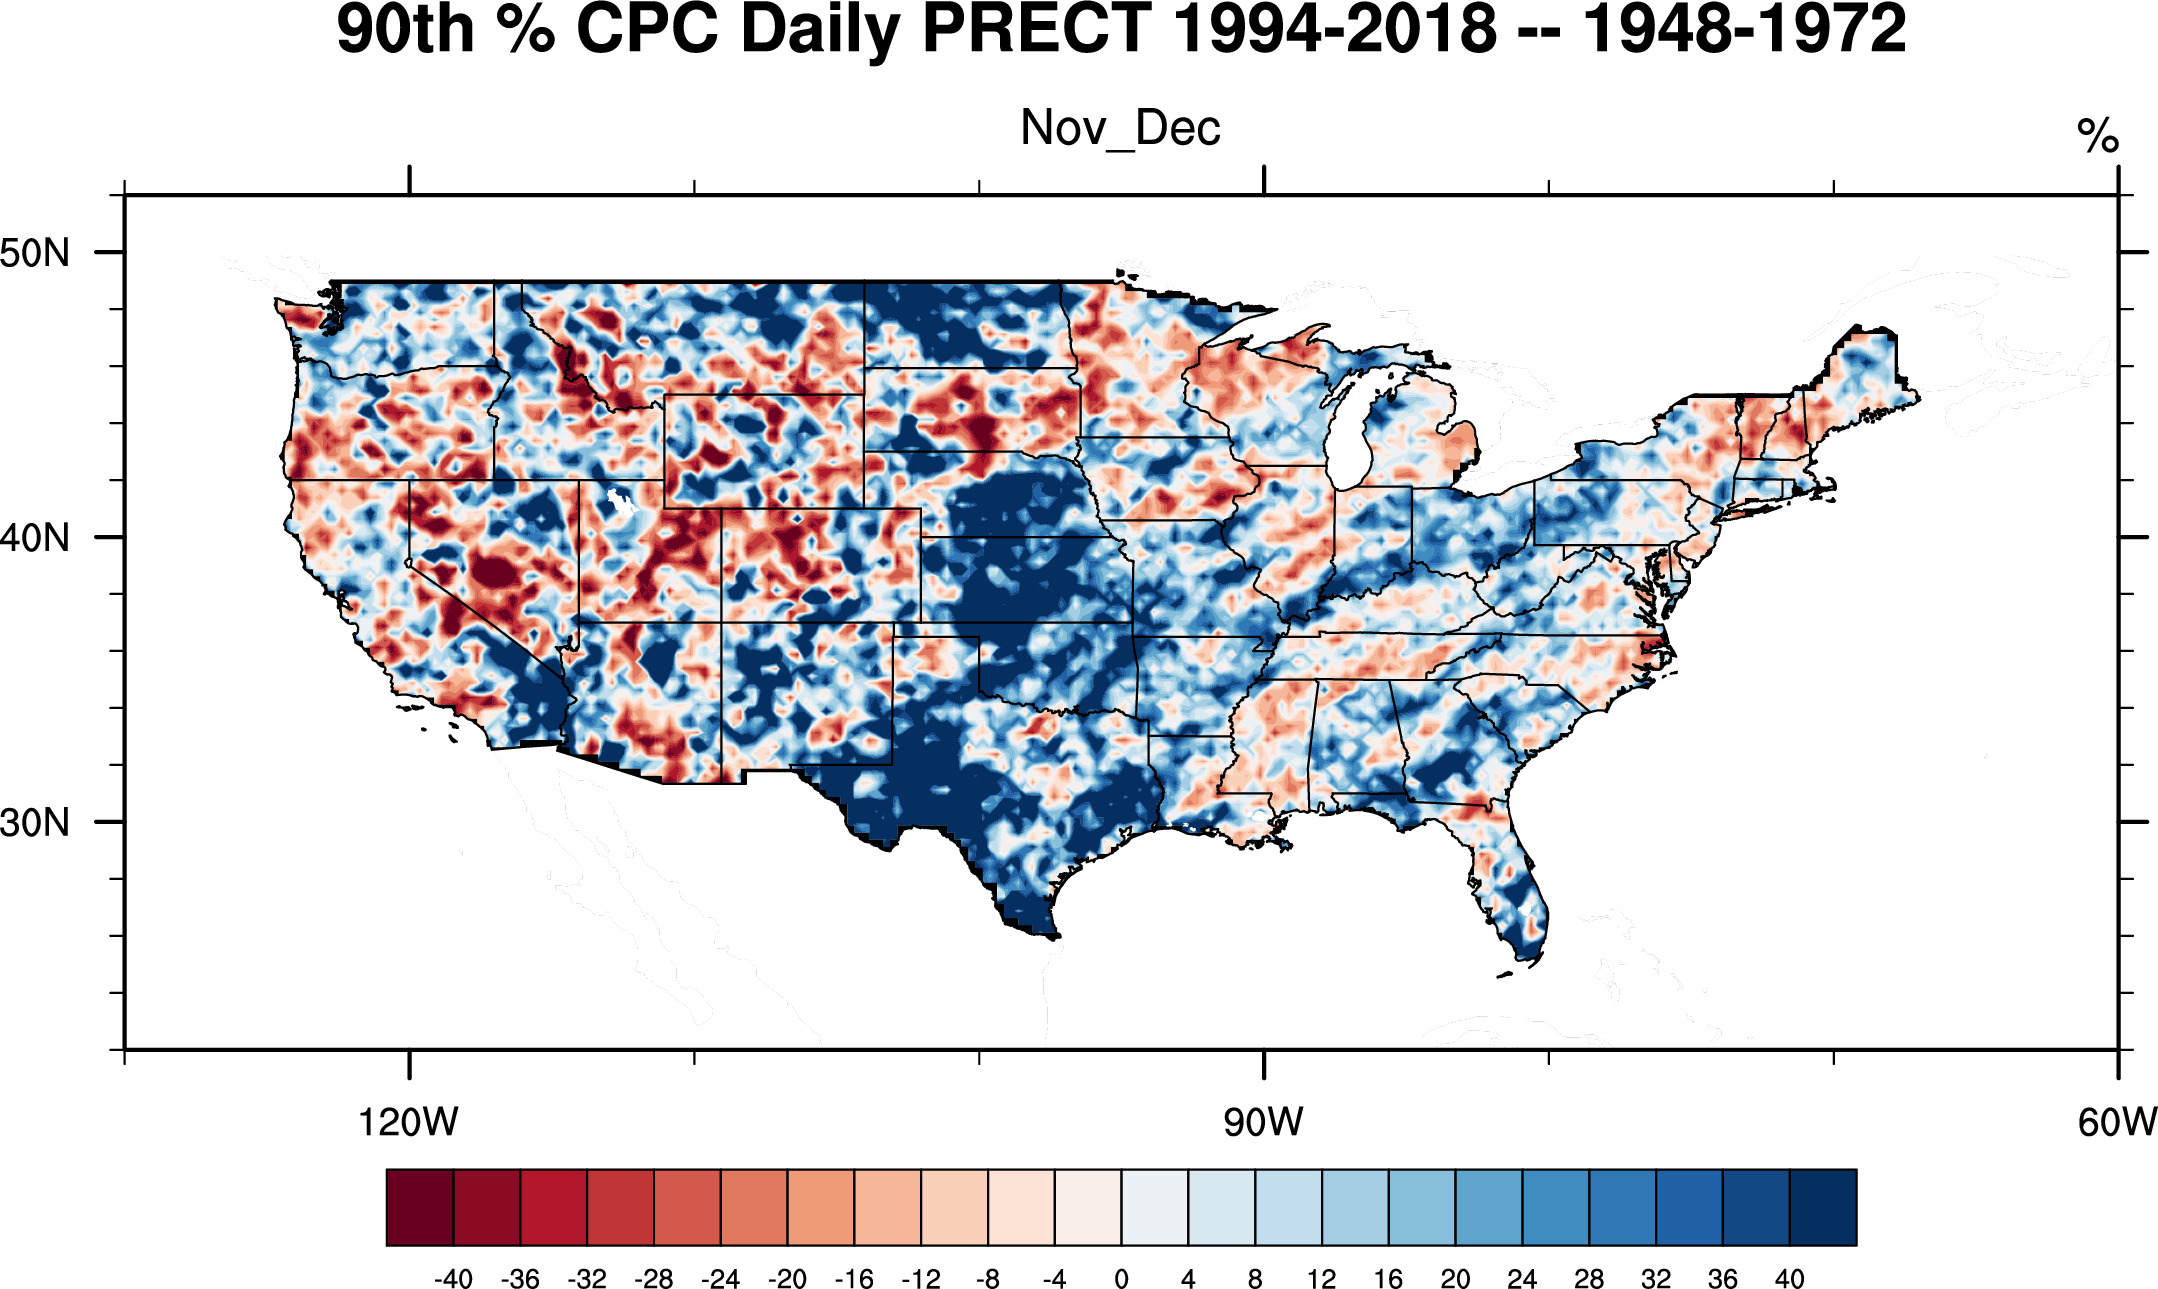
Re. 1994-2018 & 1948-1972 95th-percentiles Cut-points:
in %

in mm/day


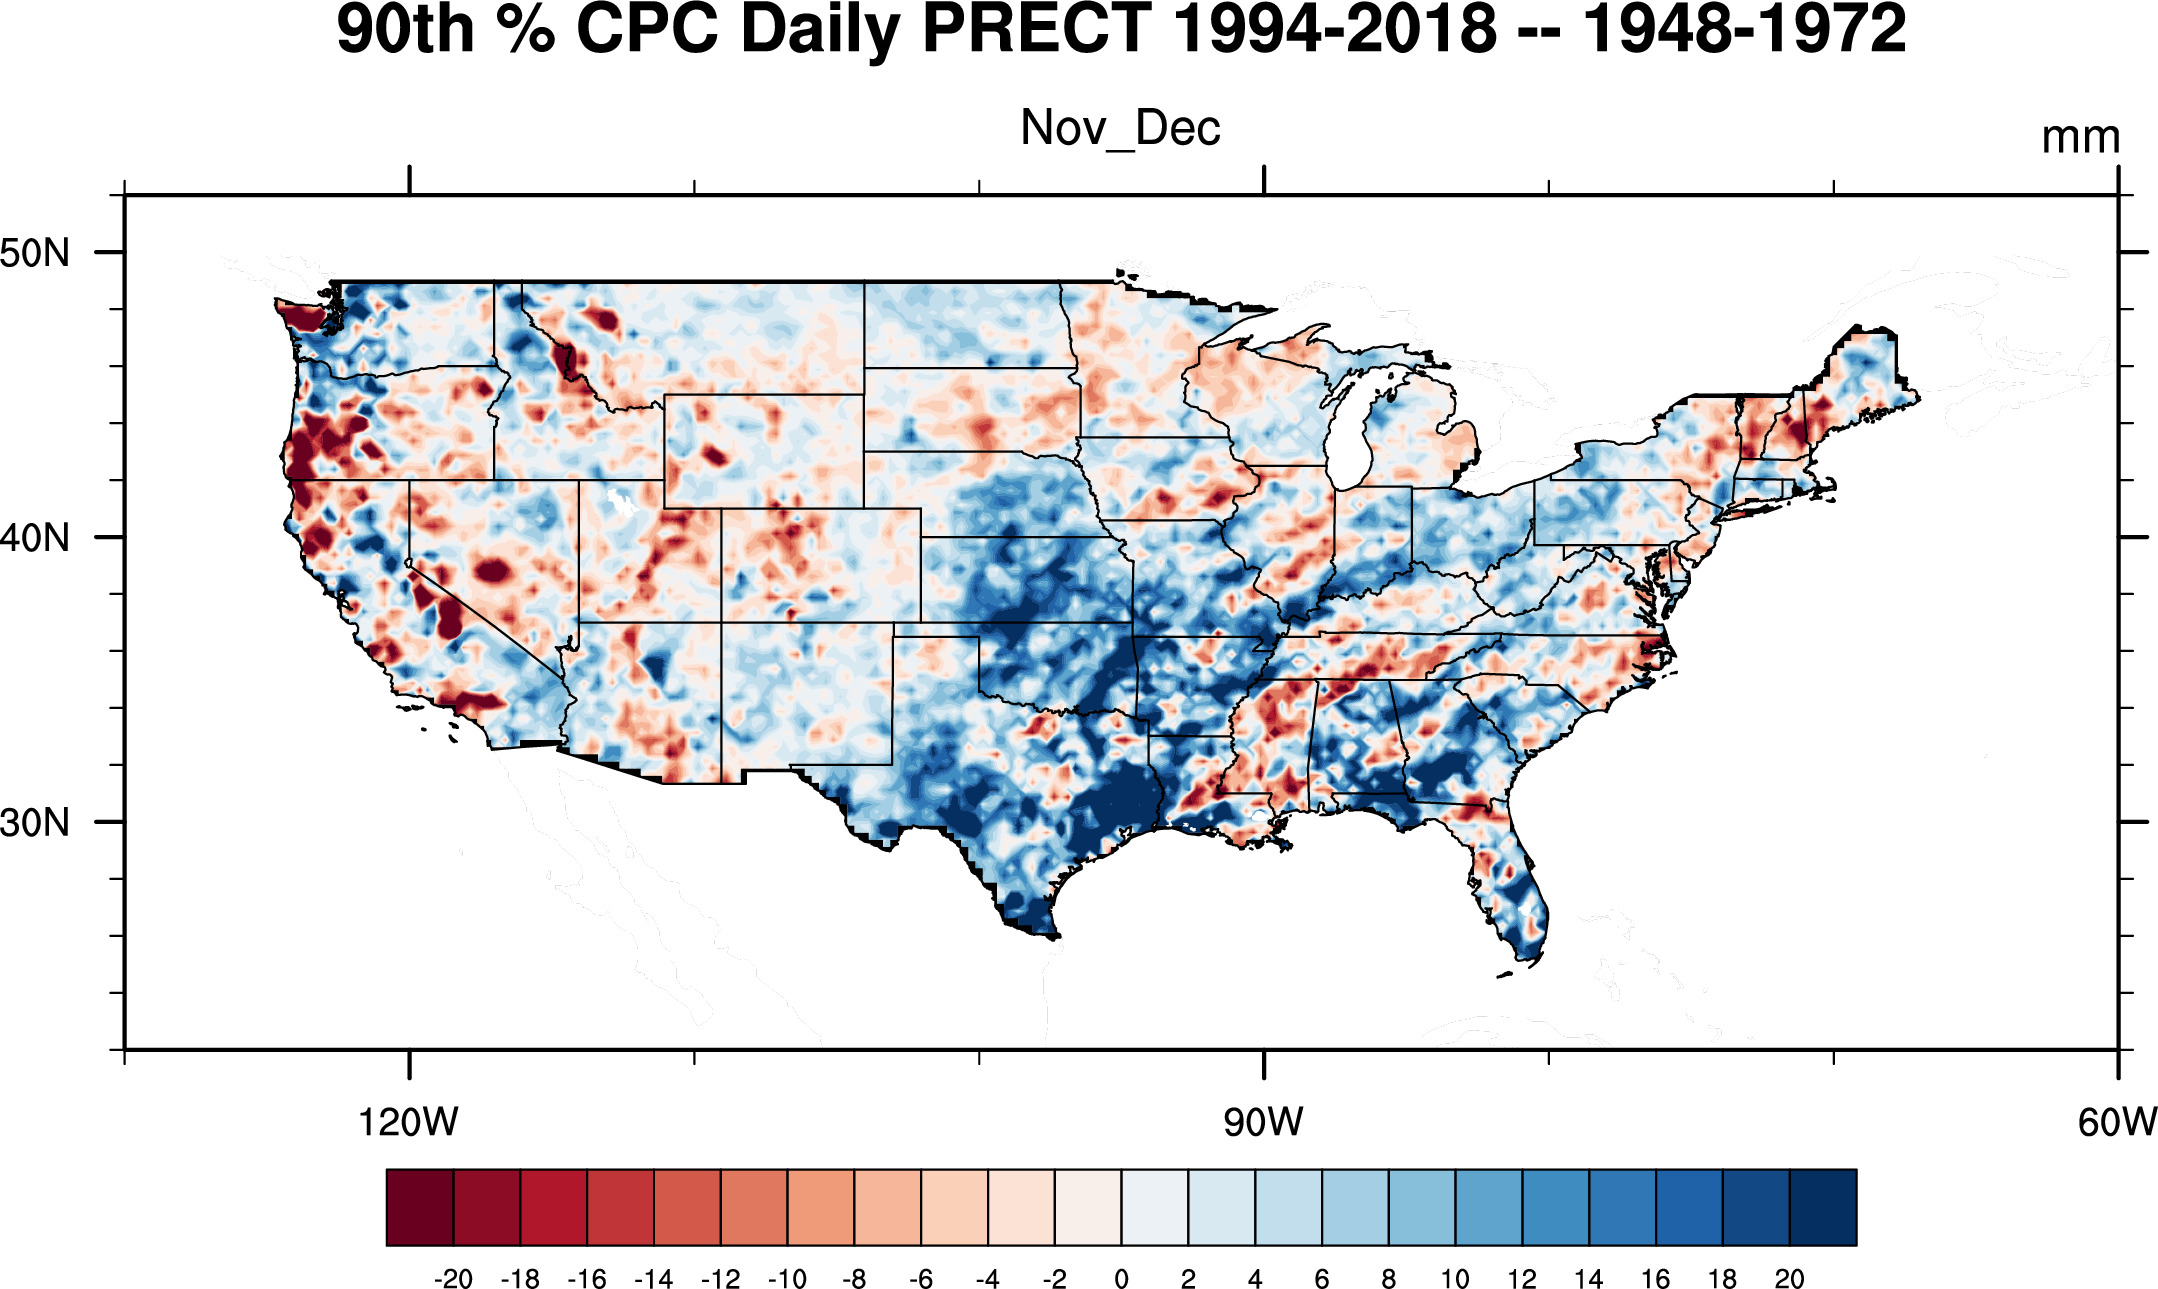
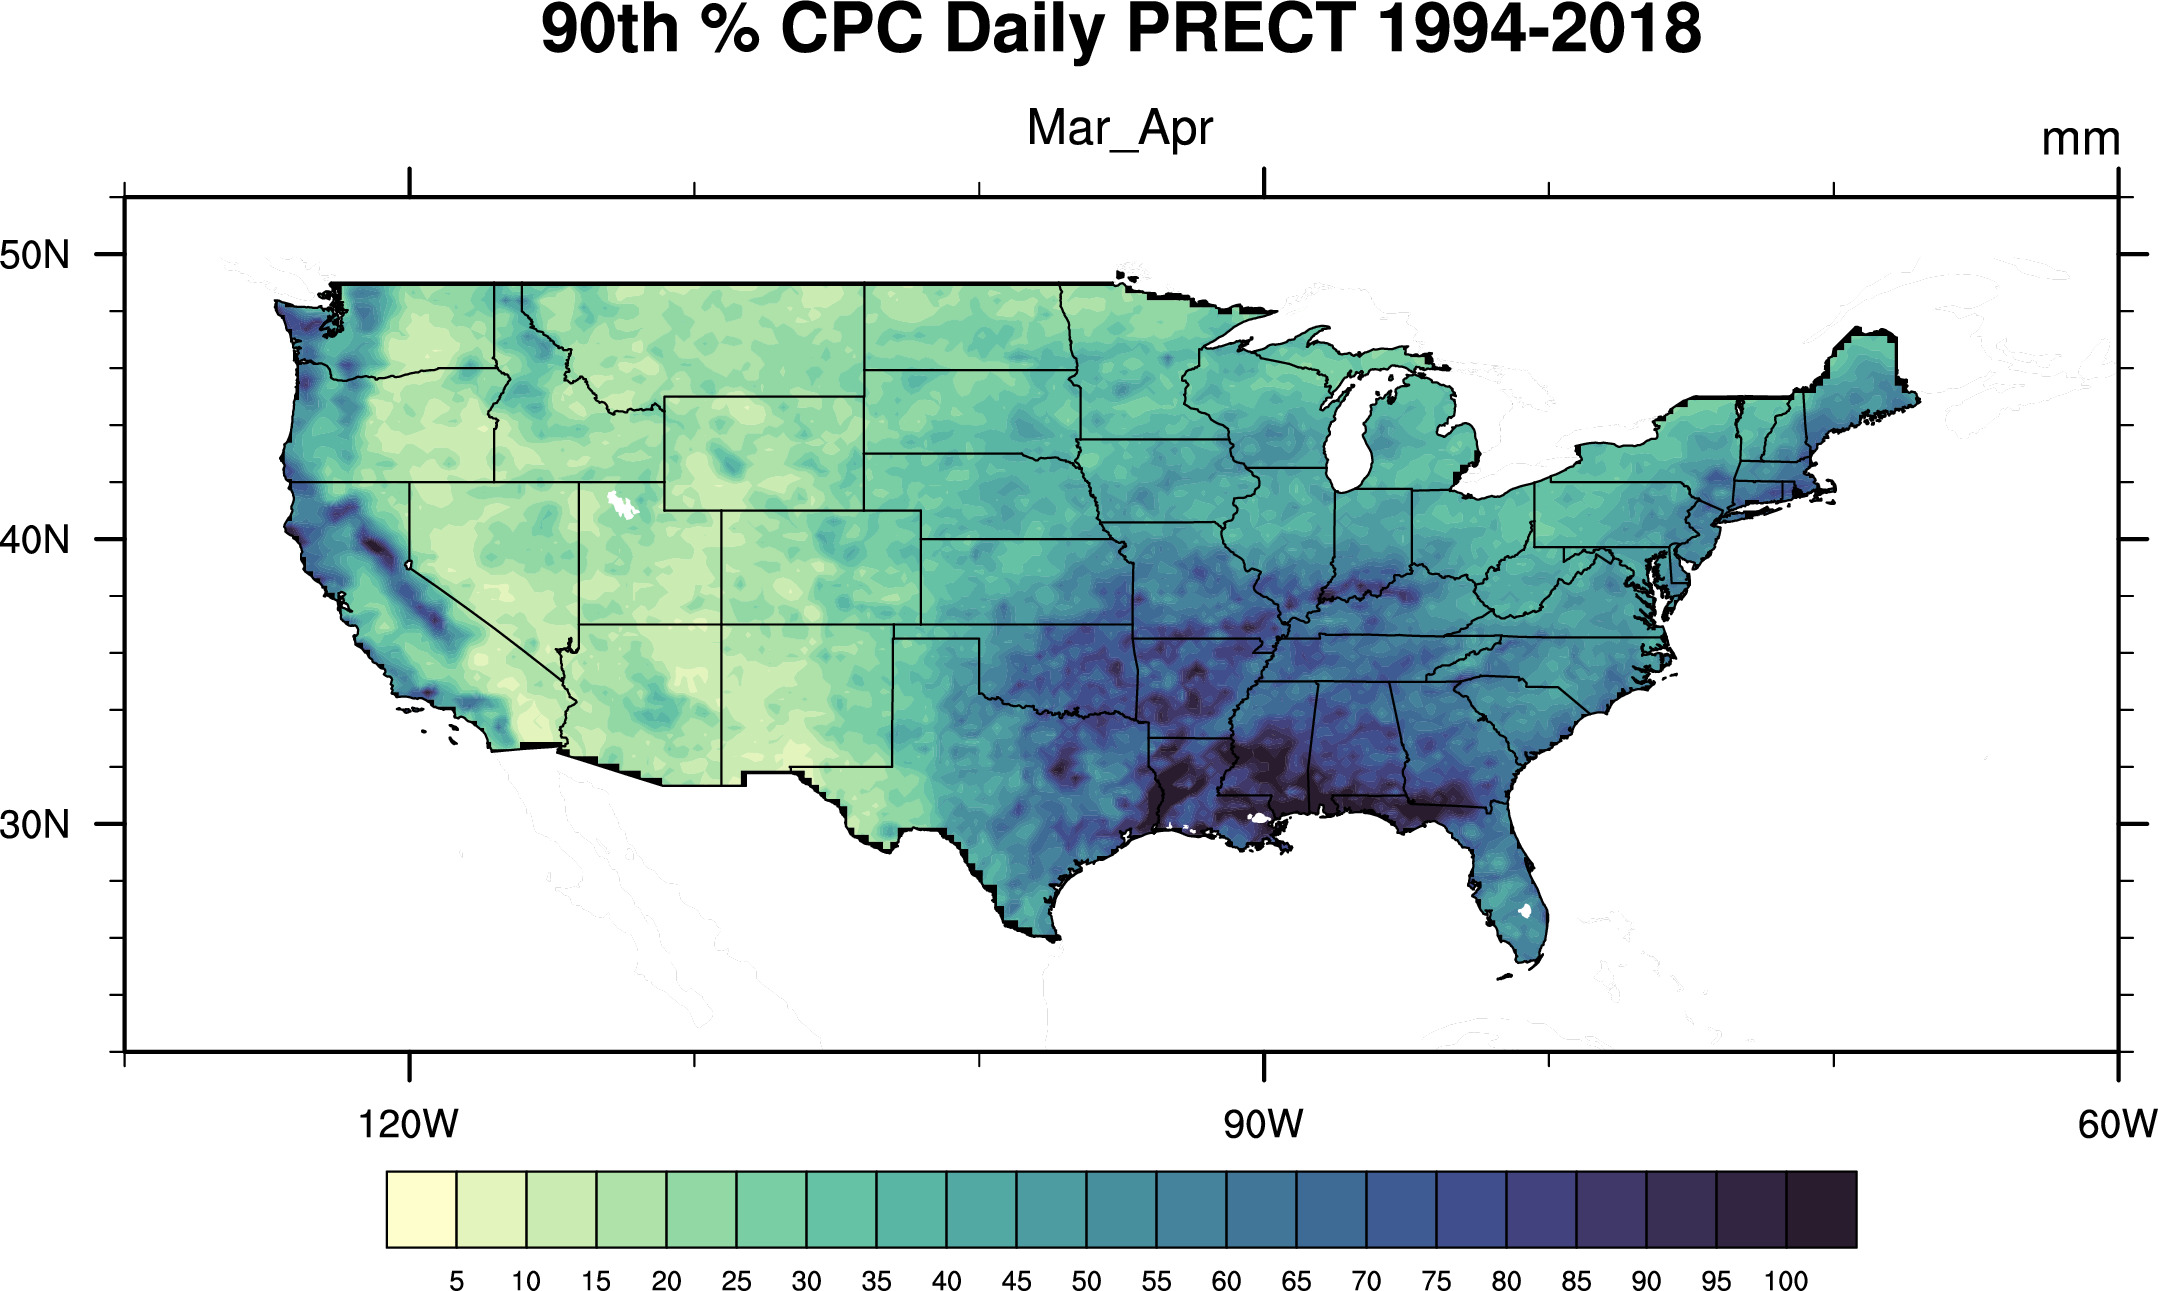
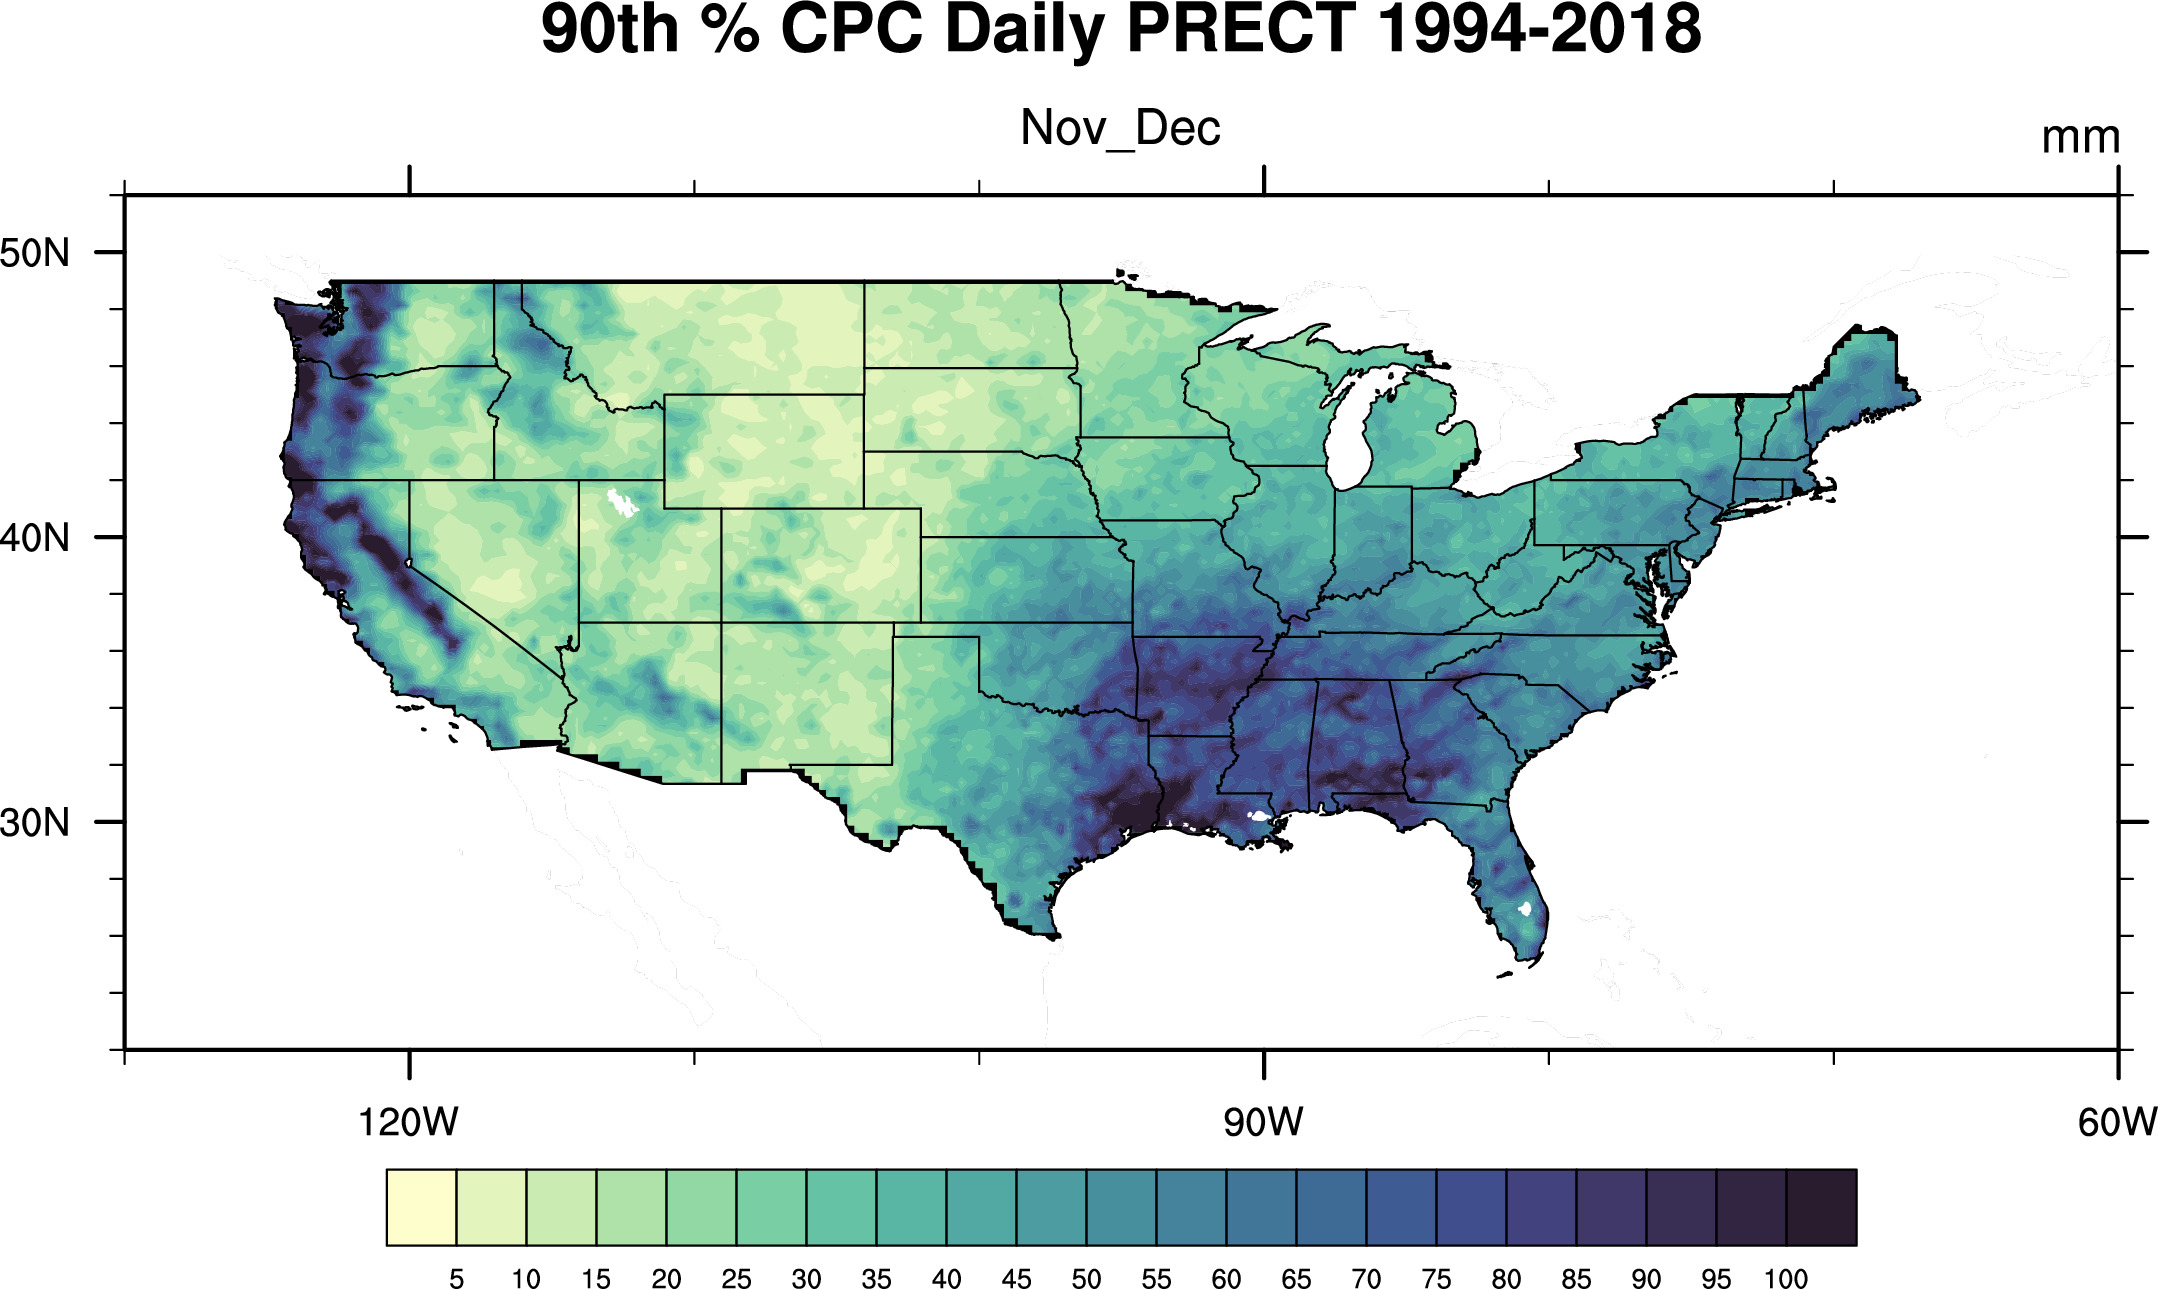
90th-percentiles
Difference of 1994-2018 -- 1948-1972 90th-percentiles Cut-points:
In % (as compared to 1948 era)


In mm/day


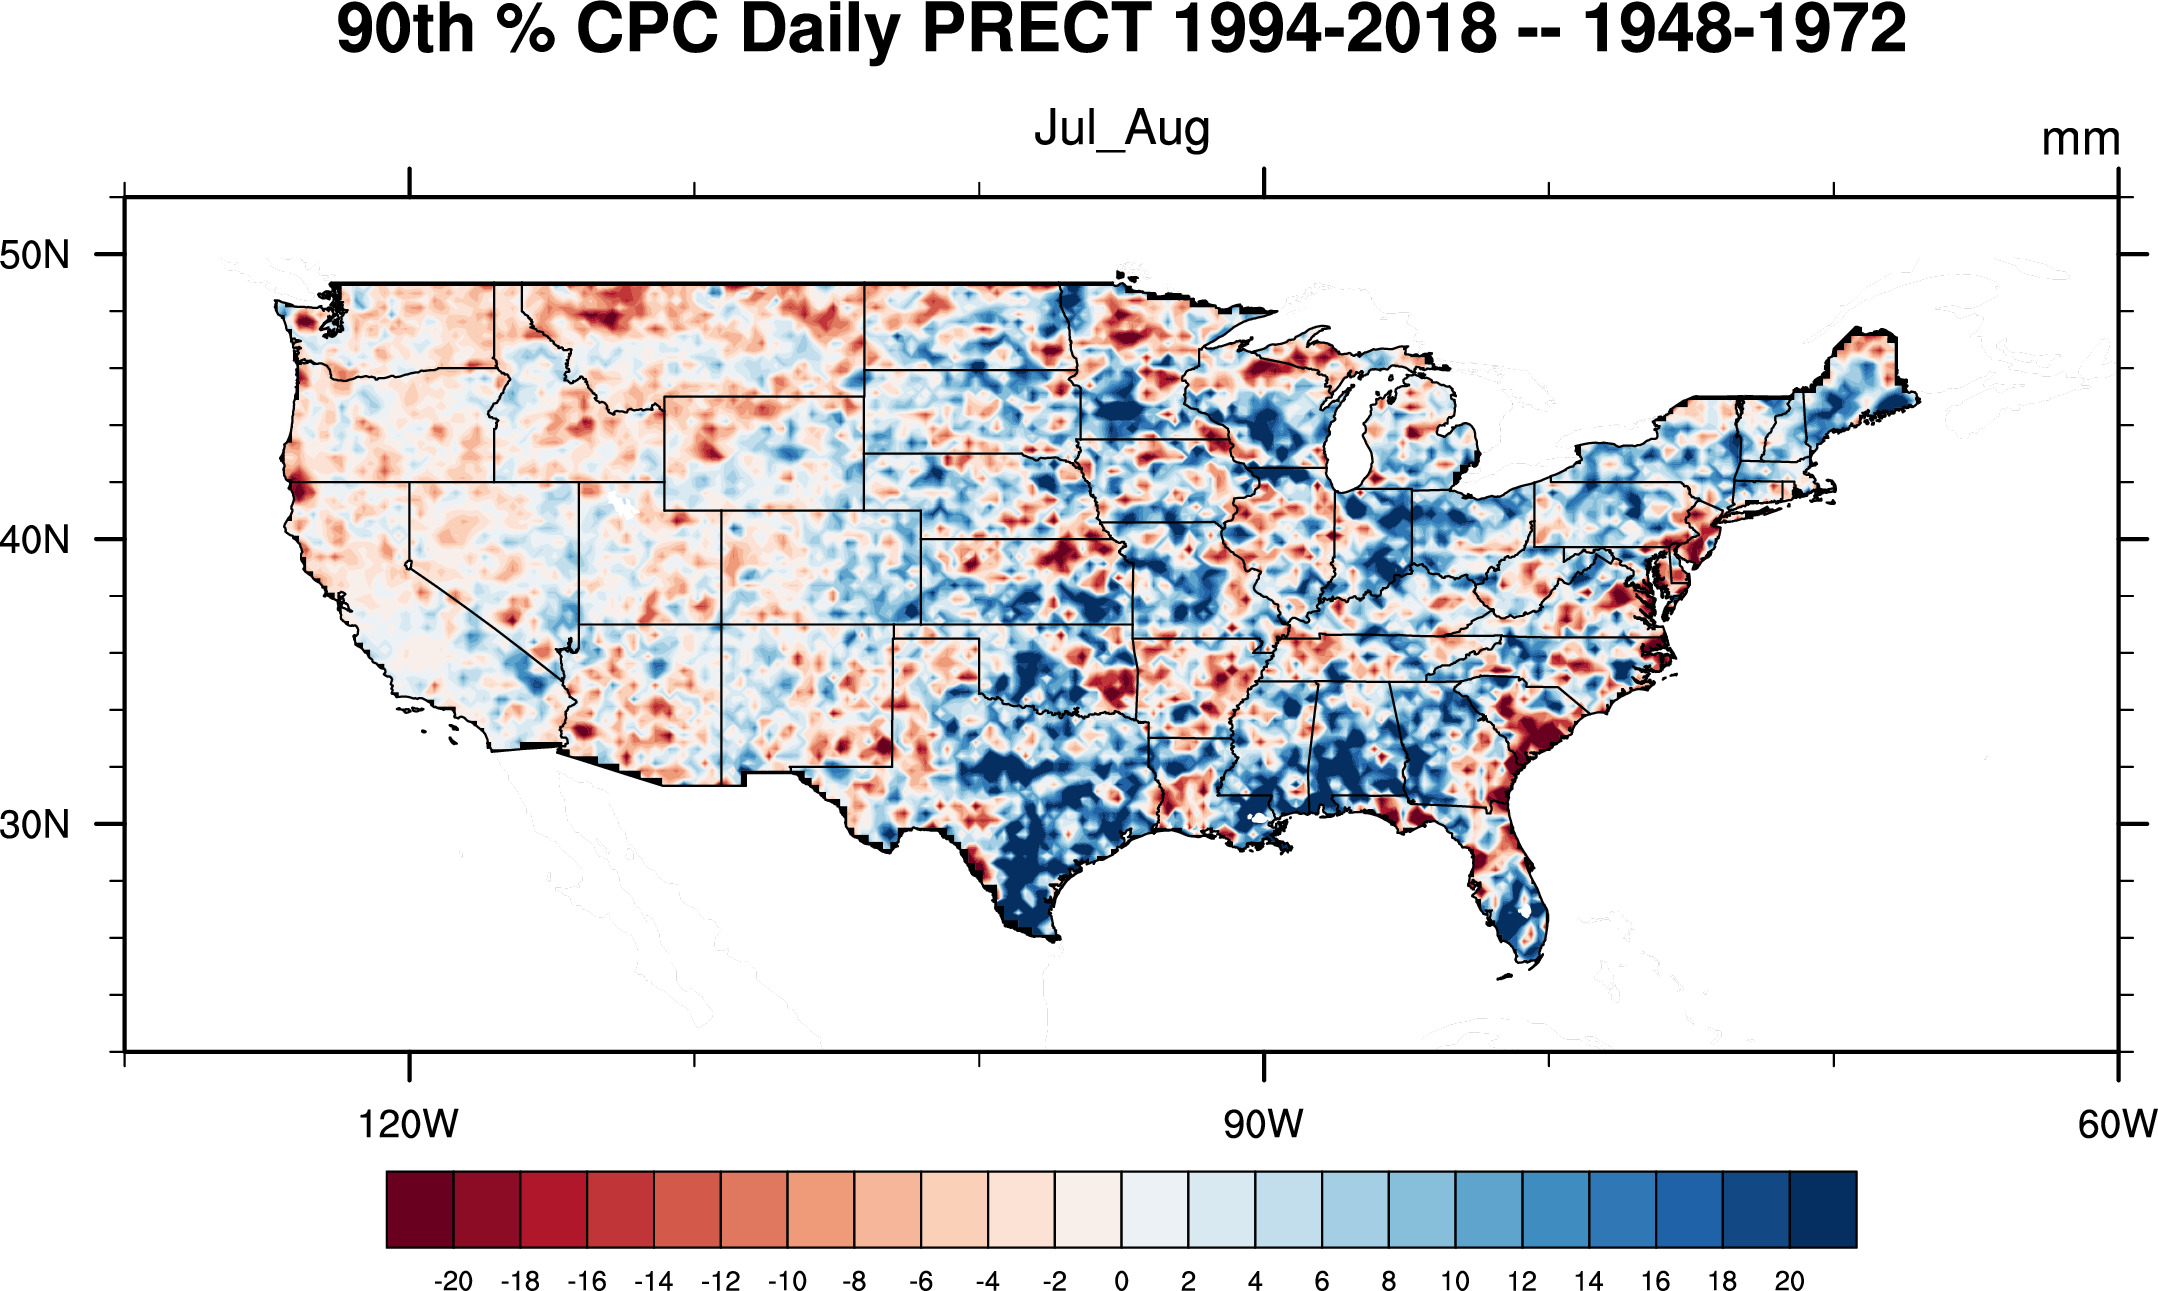

CPC Daily Precip 1994-2018 90th-percentiles Cut-points:


CPC Daily Precip 1948-1972 90th-percentiles Cut-points:


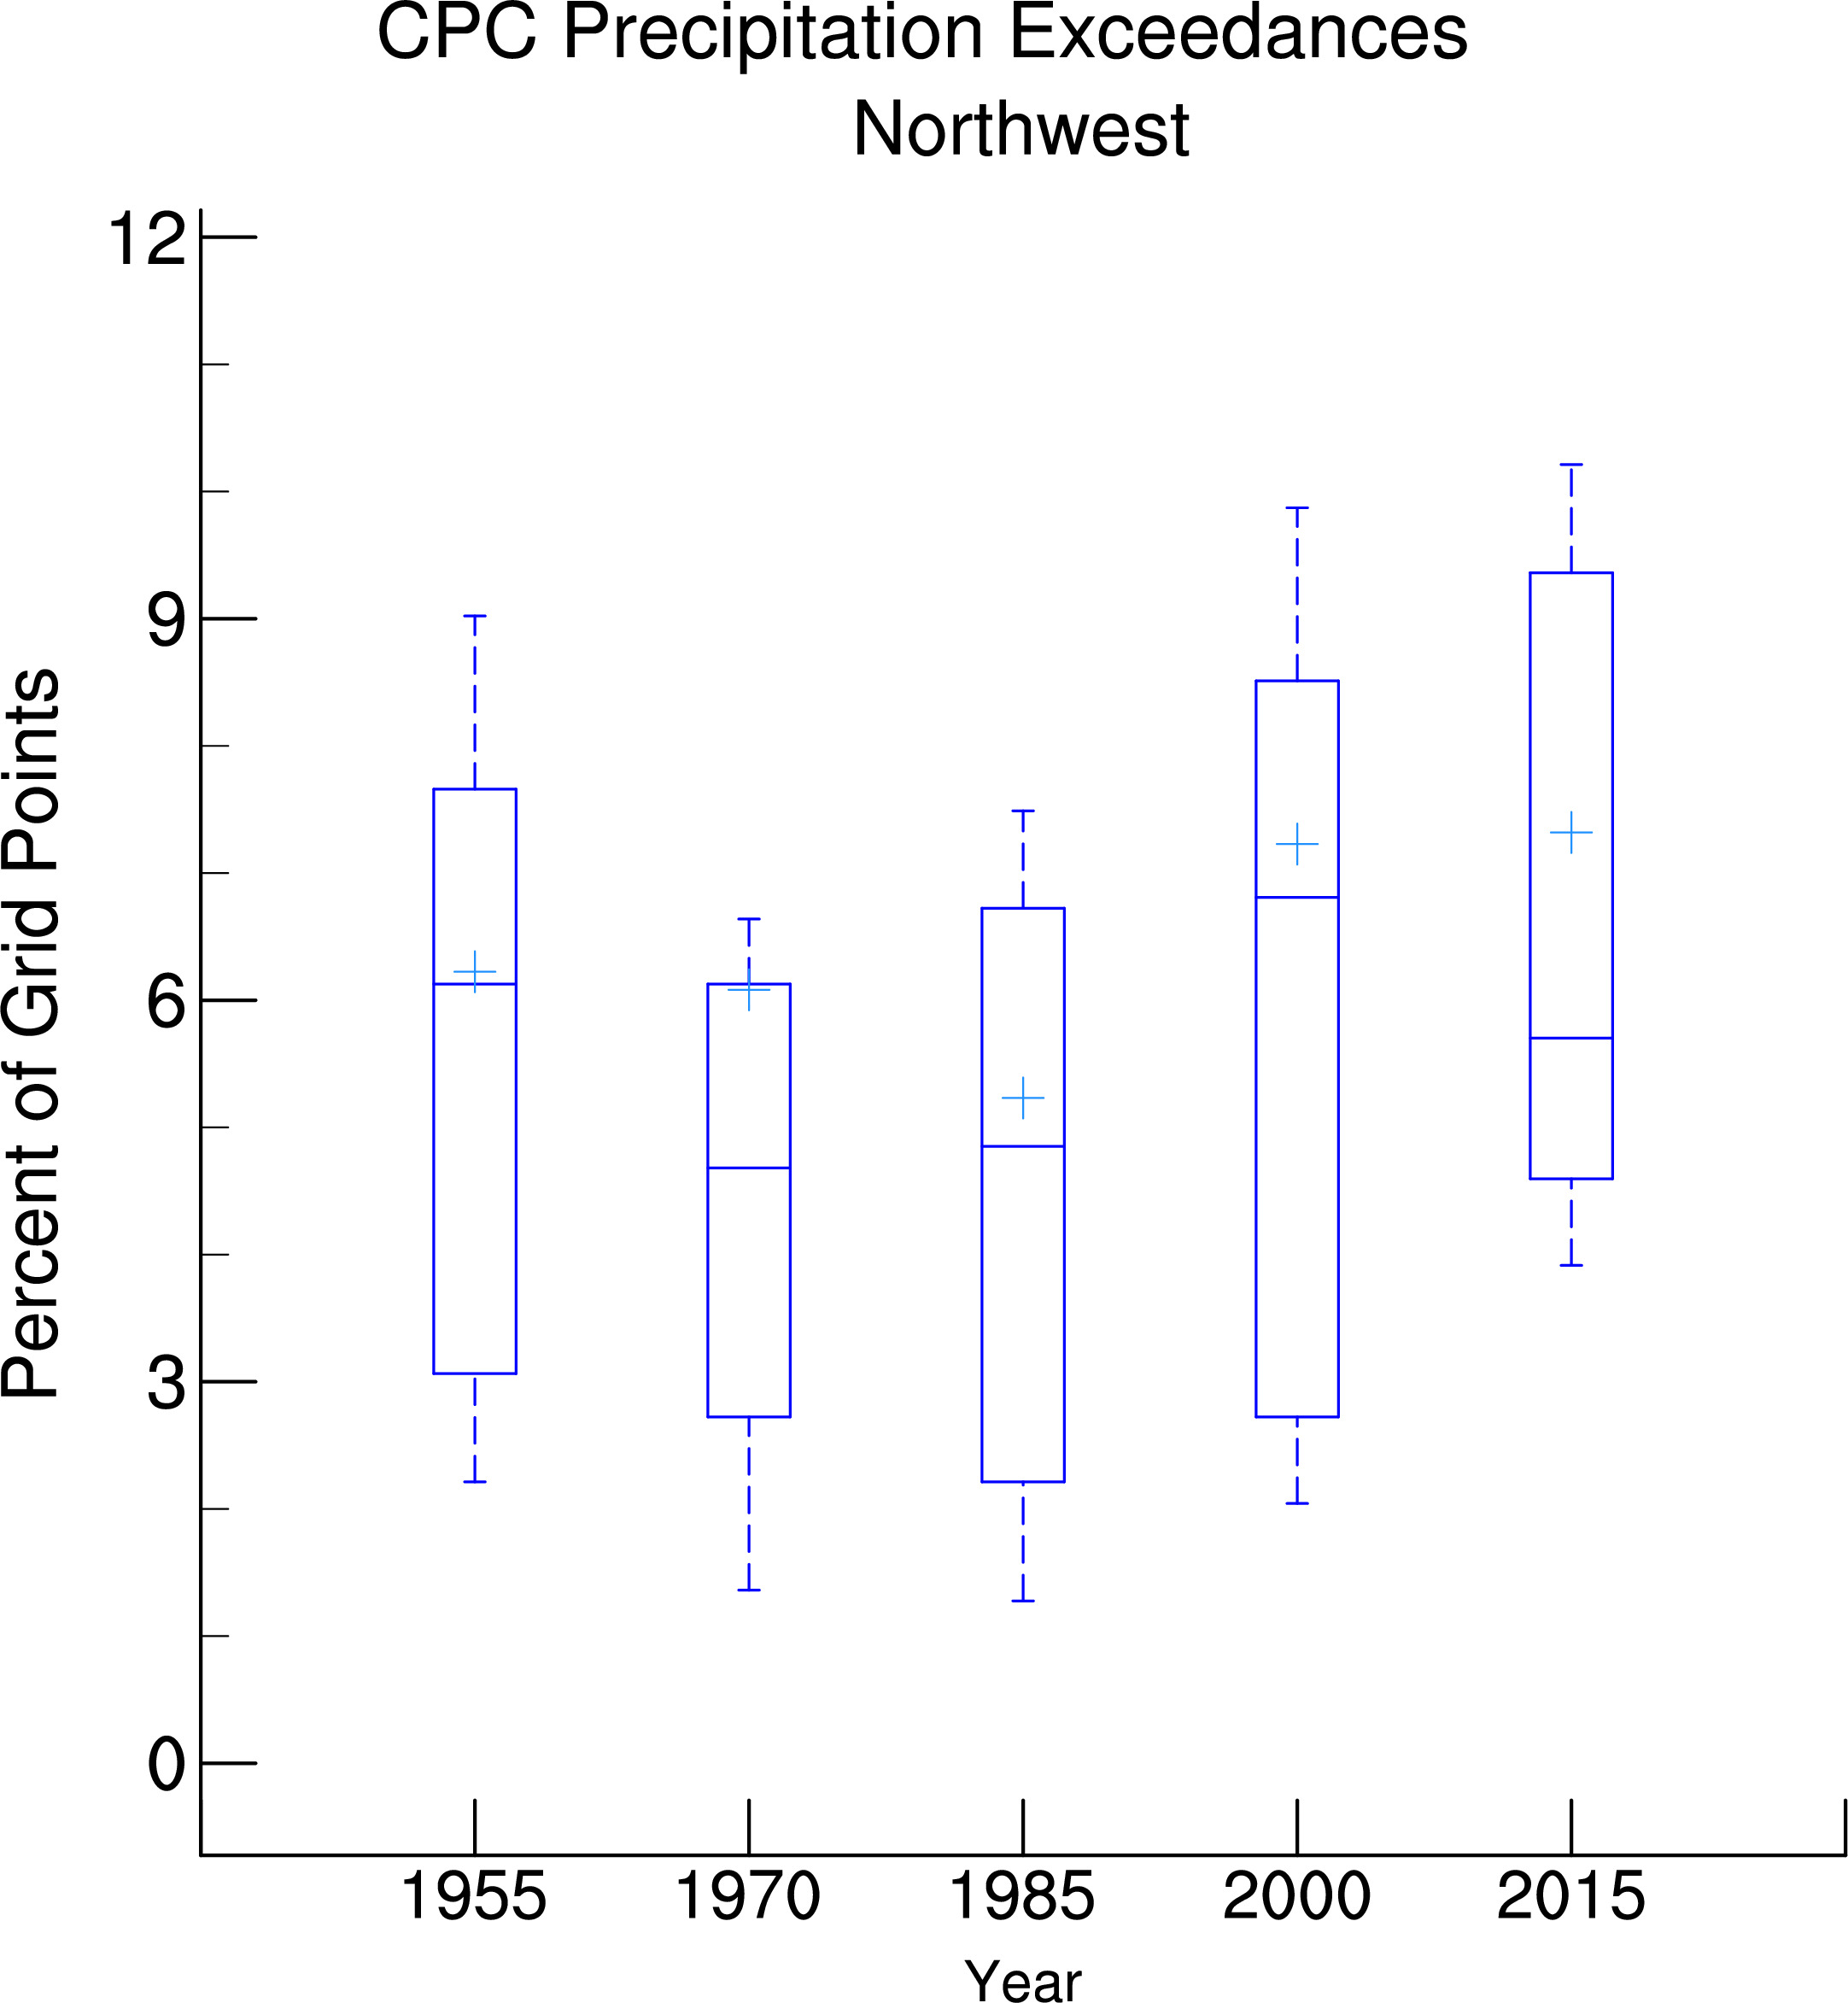
CPC
box/whisker plots calculated for 15-year periods
hi decile, hi quartile, median, lo quartile, lo decile, with plus-sign indicating mean


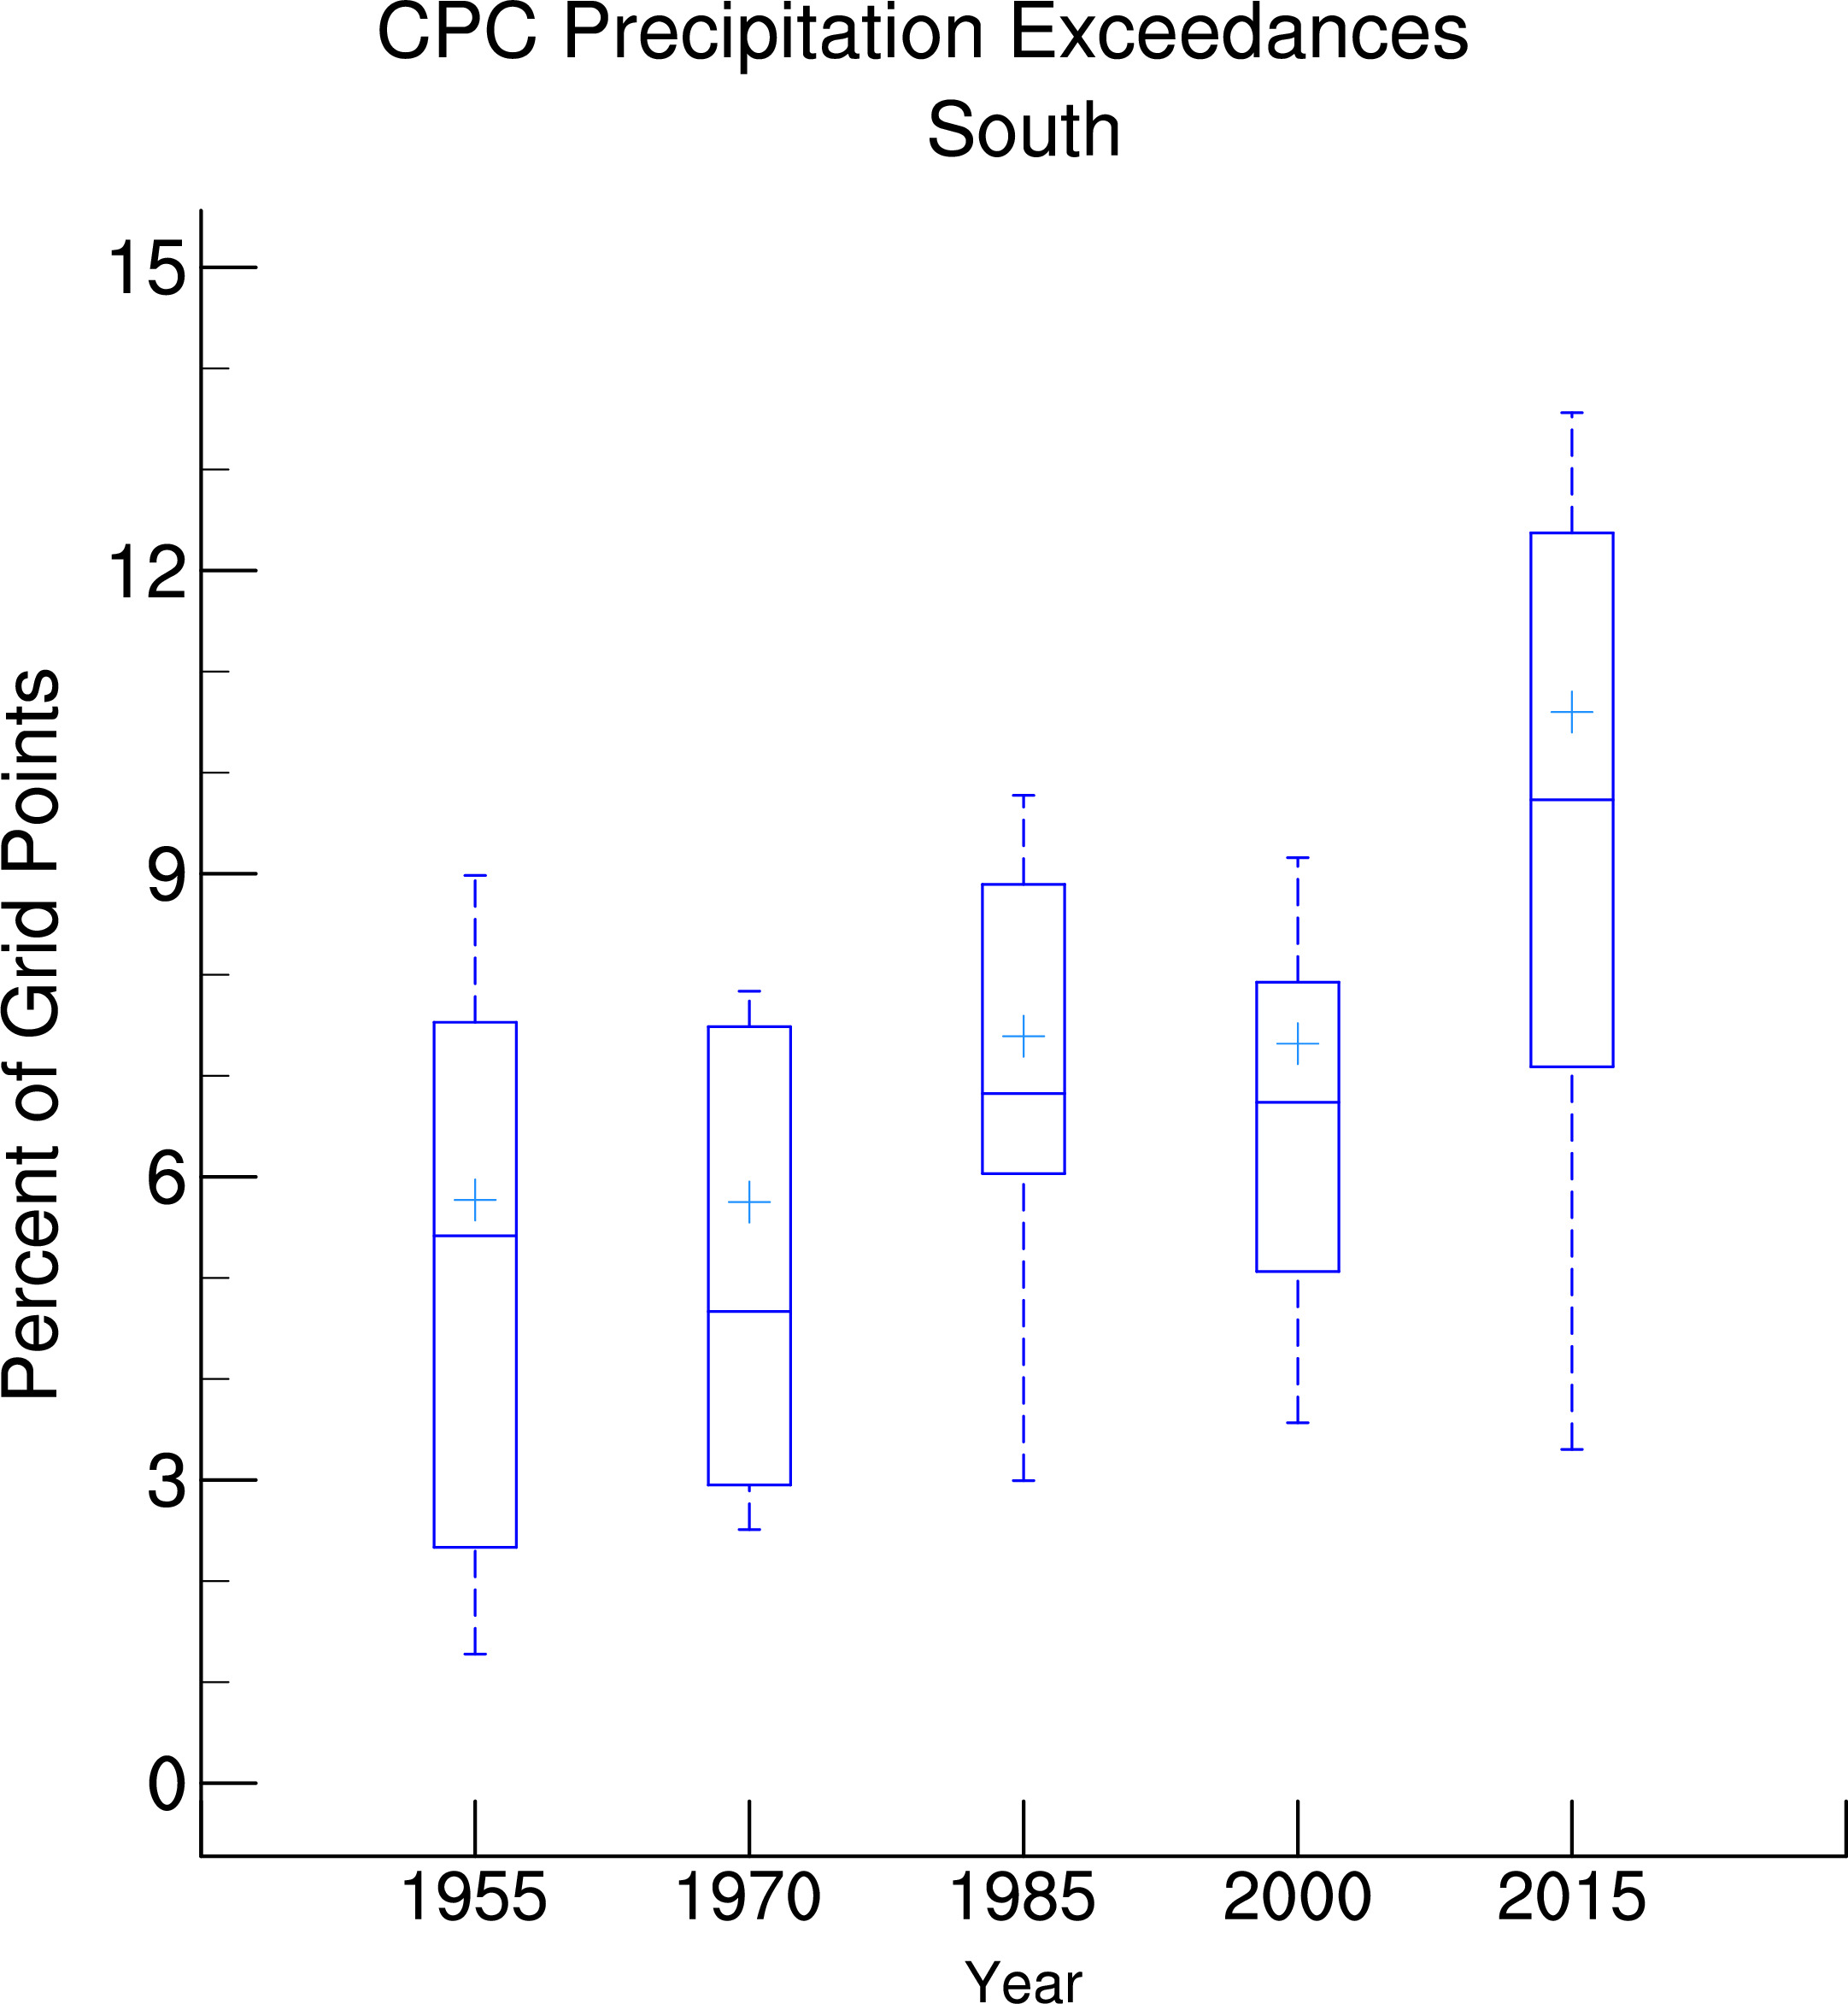
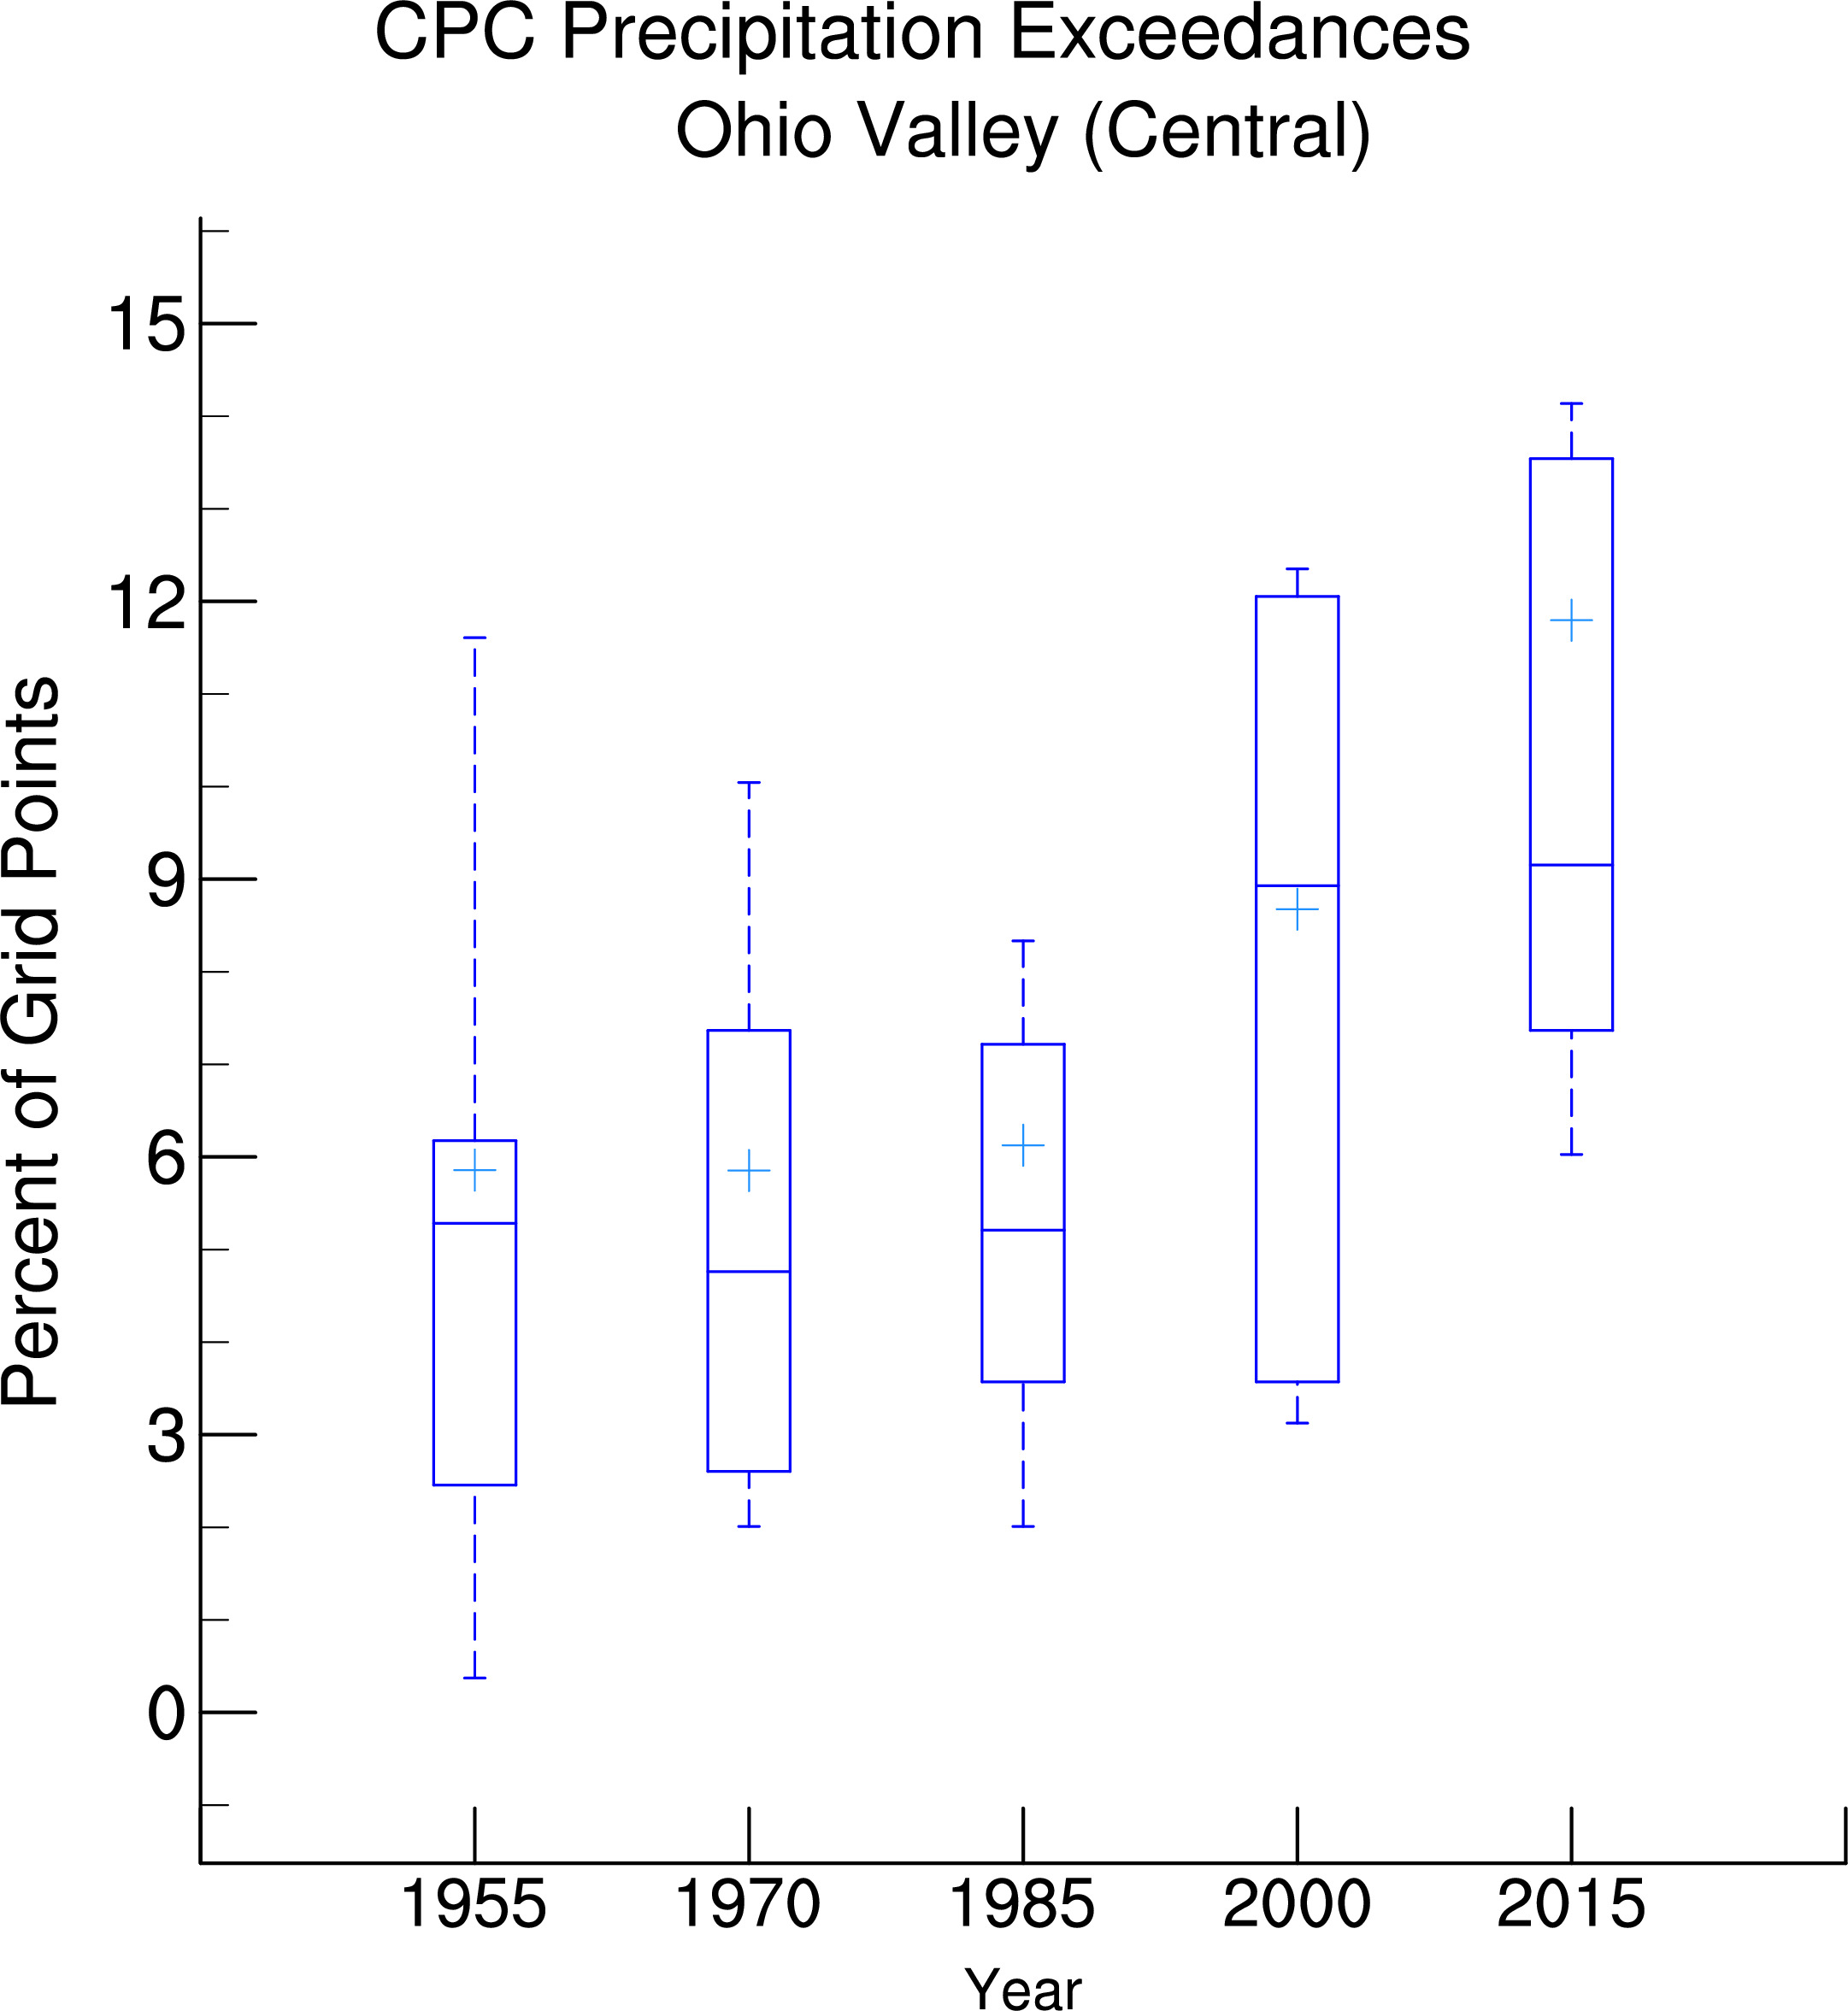


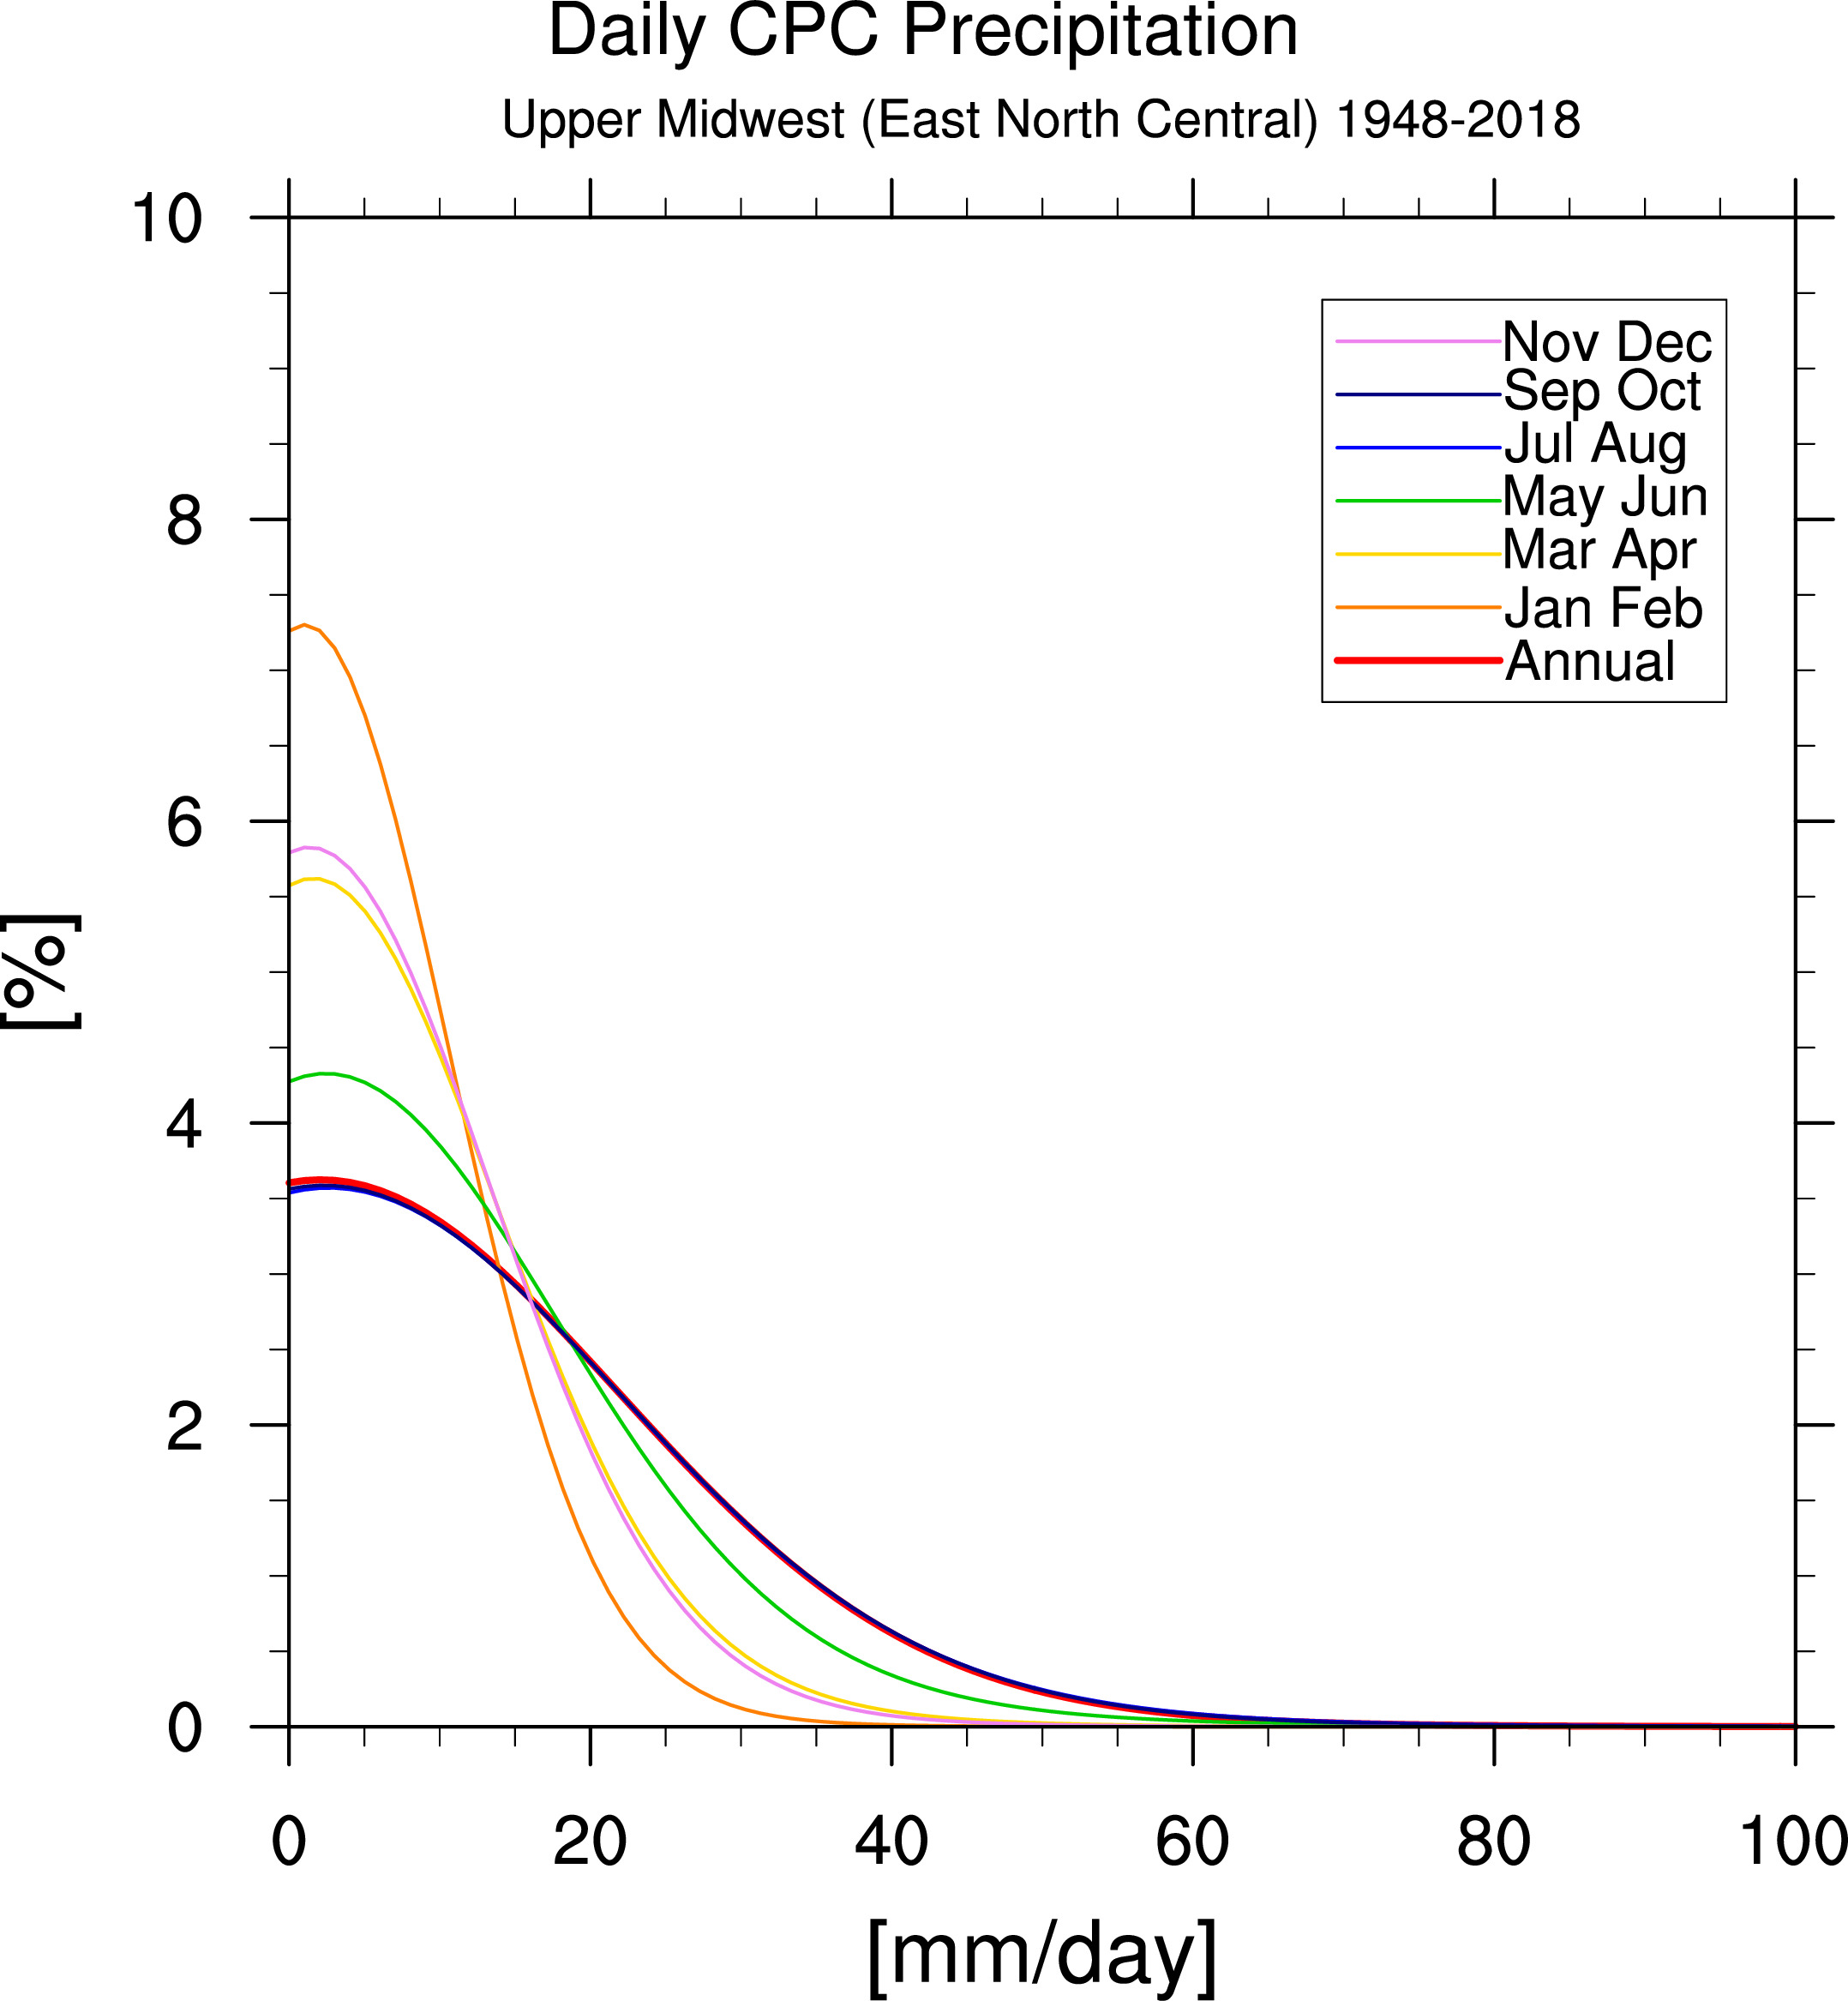
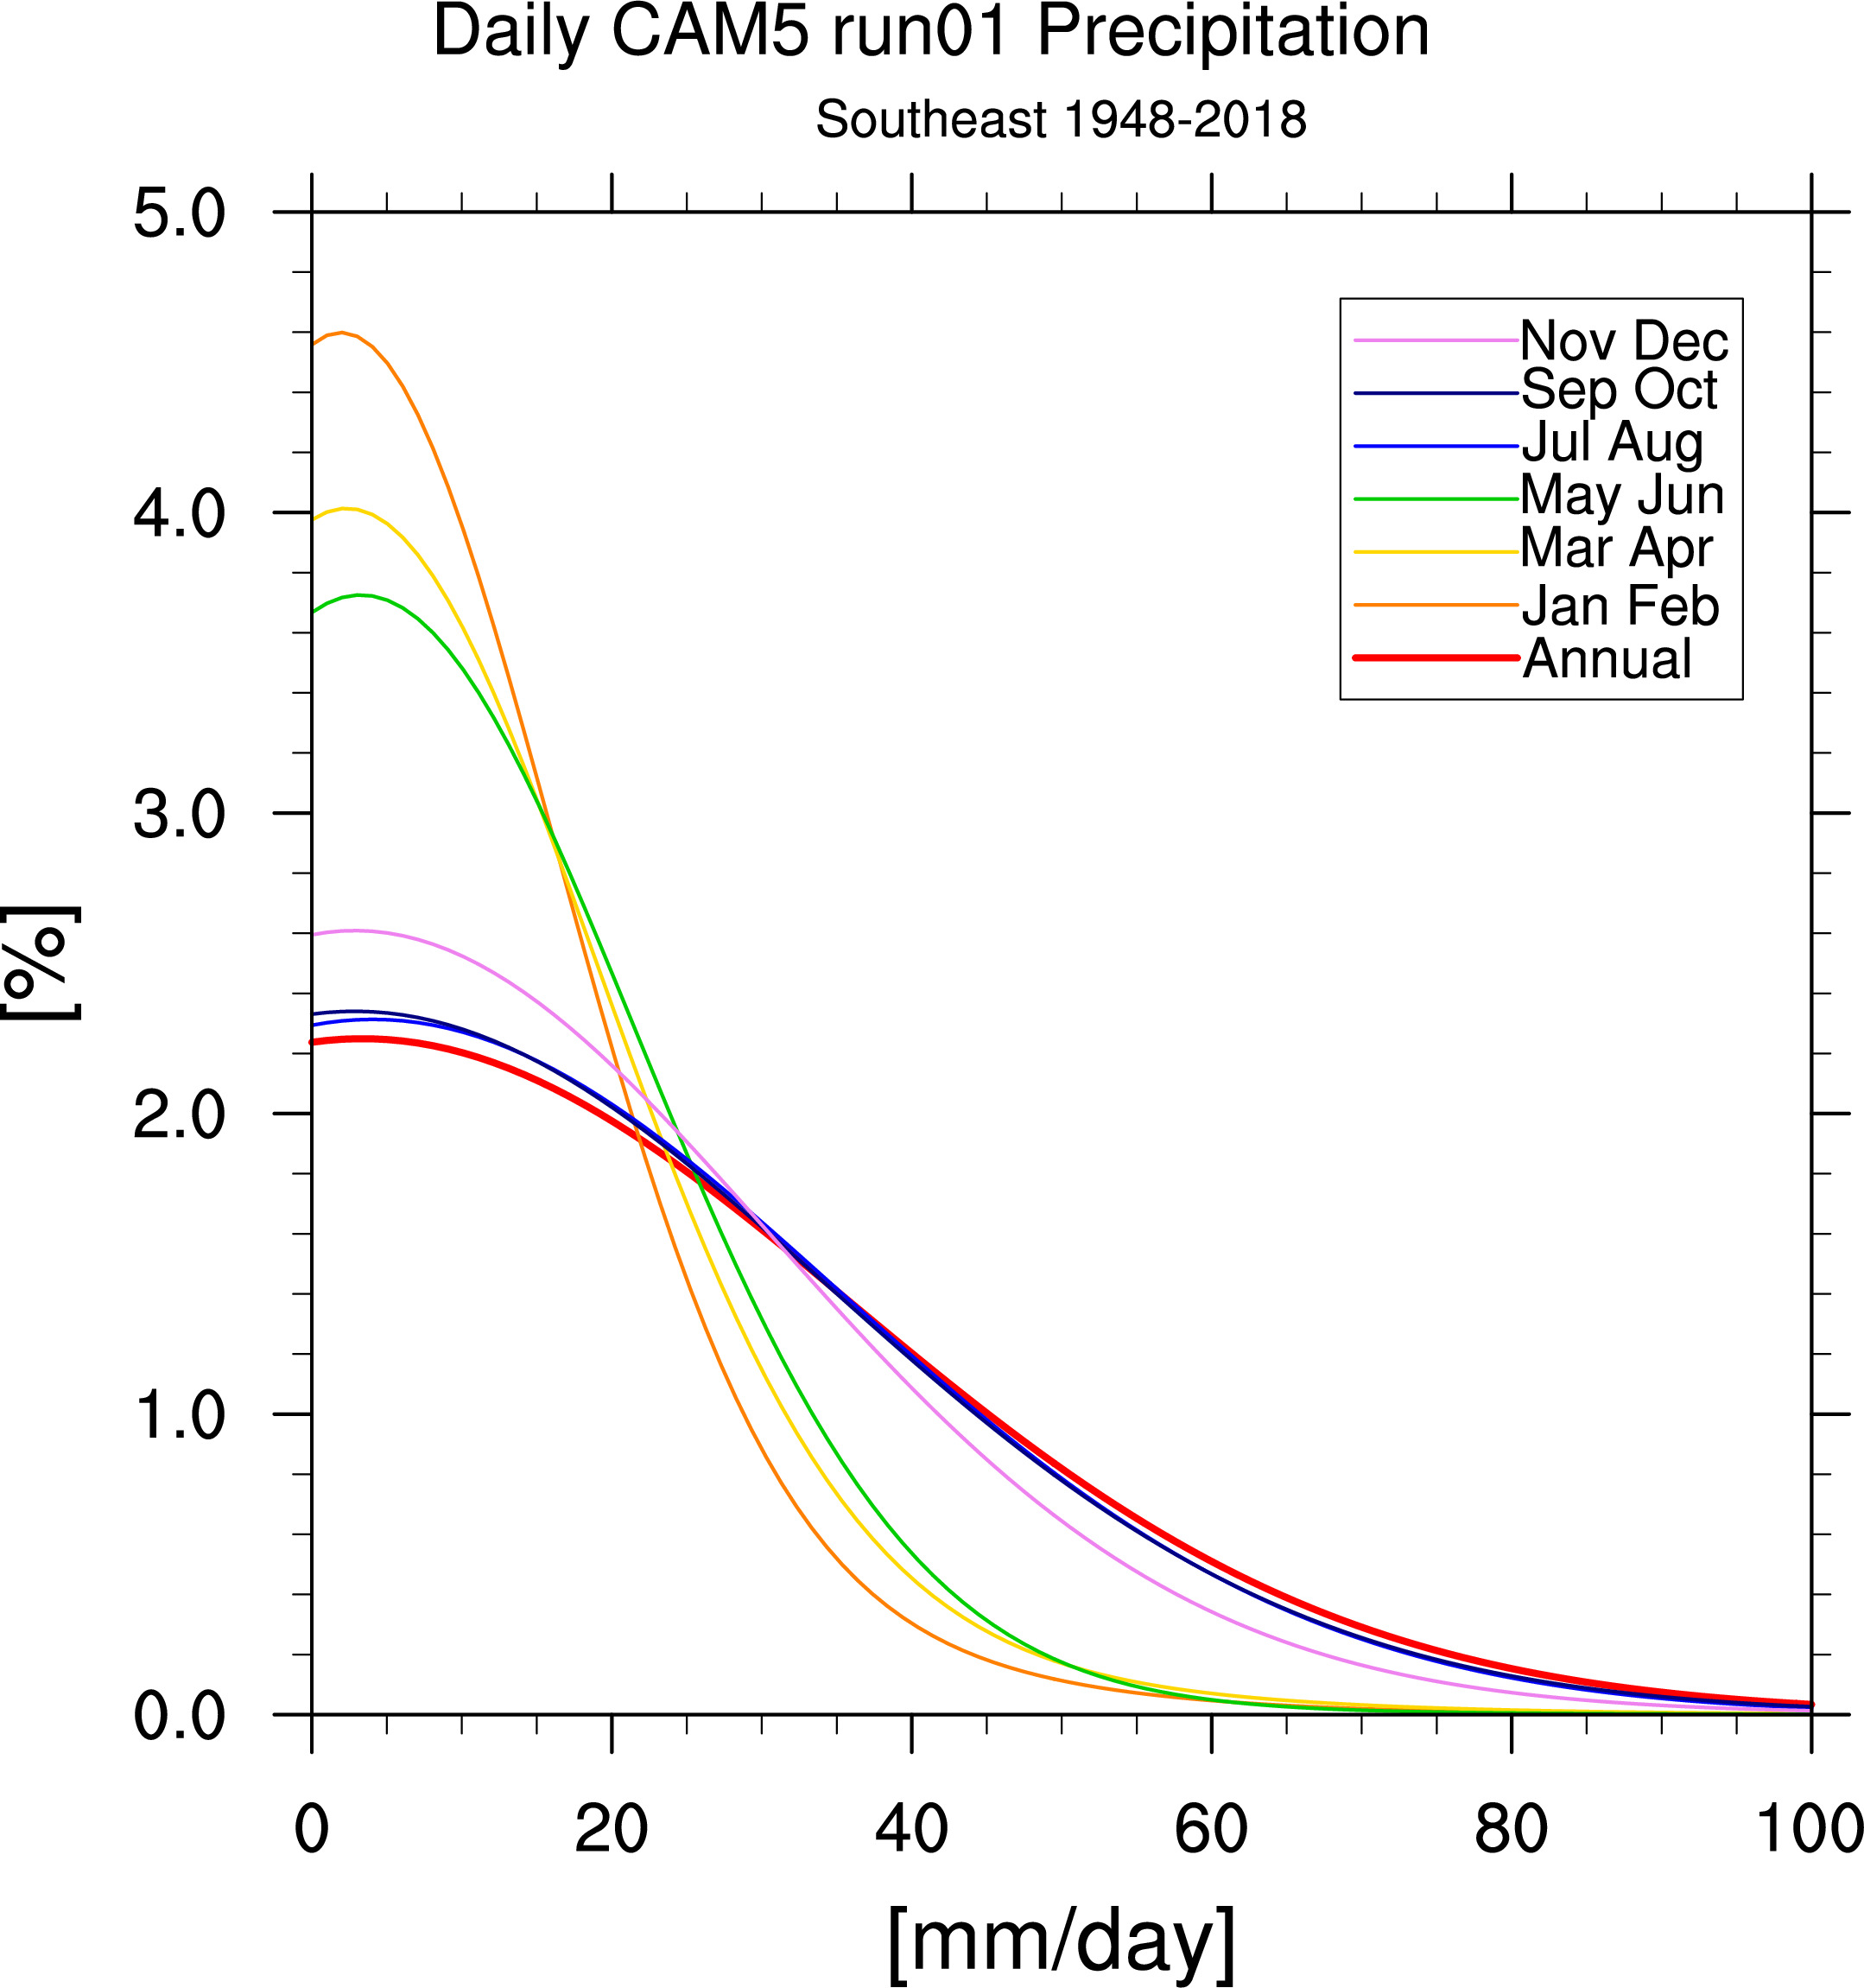
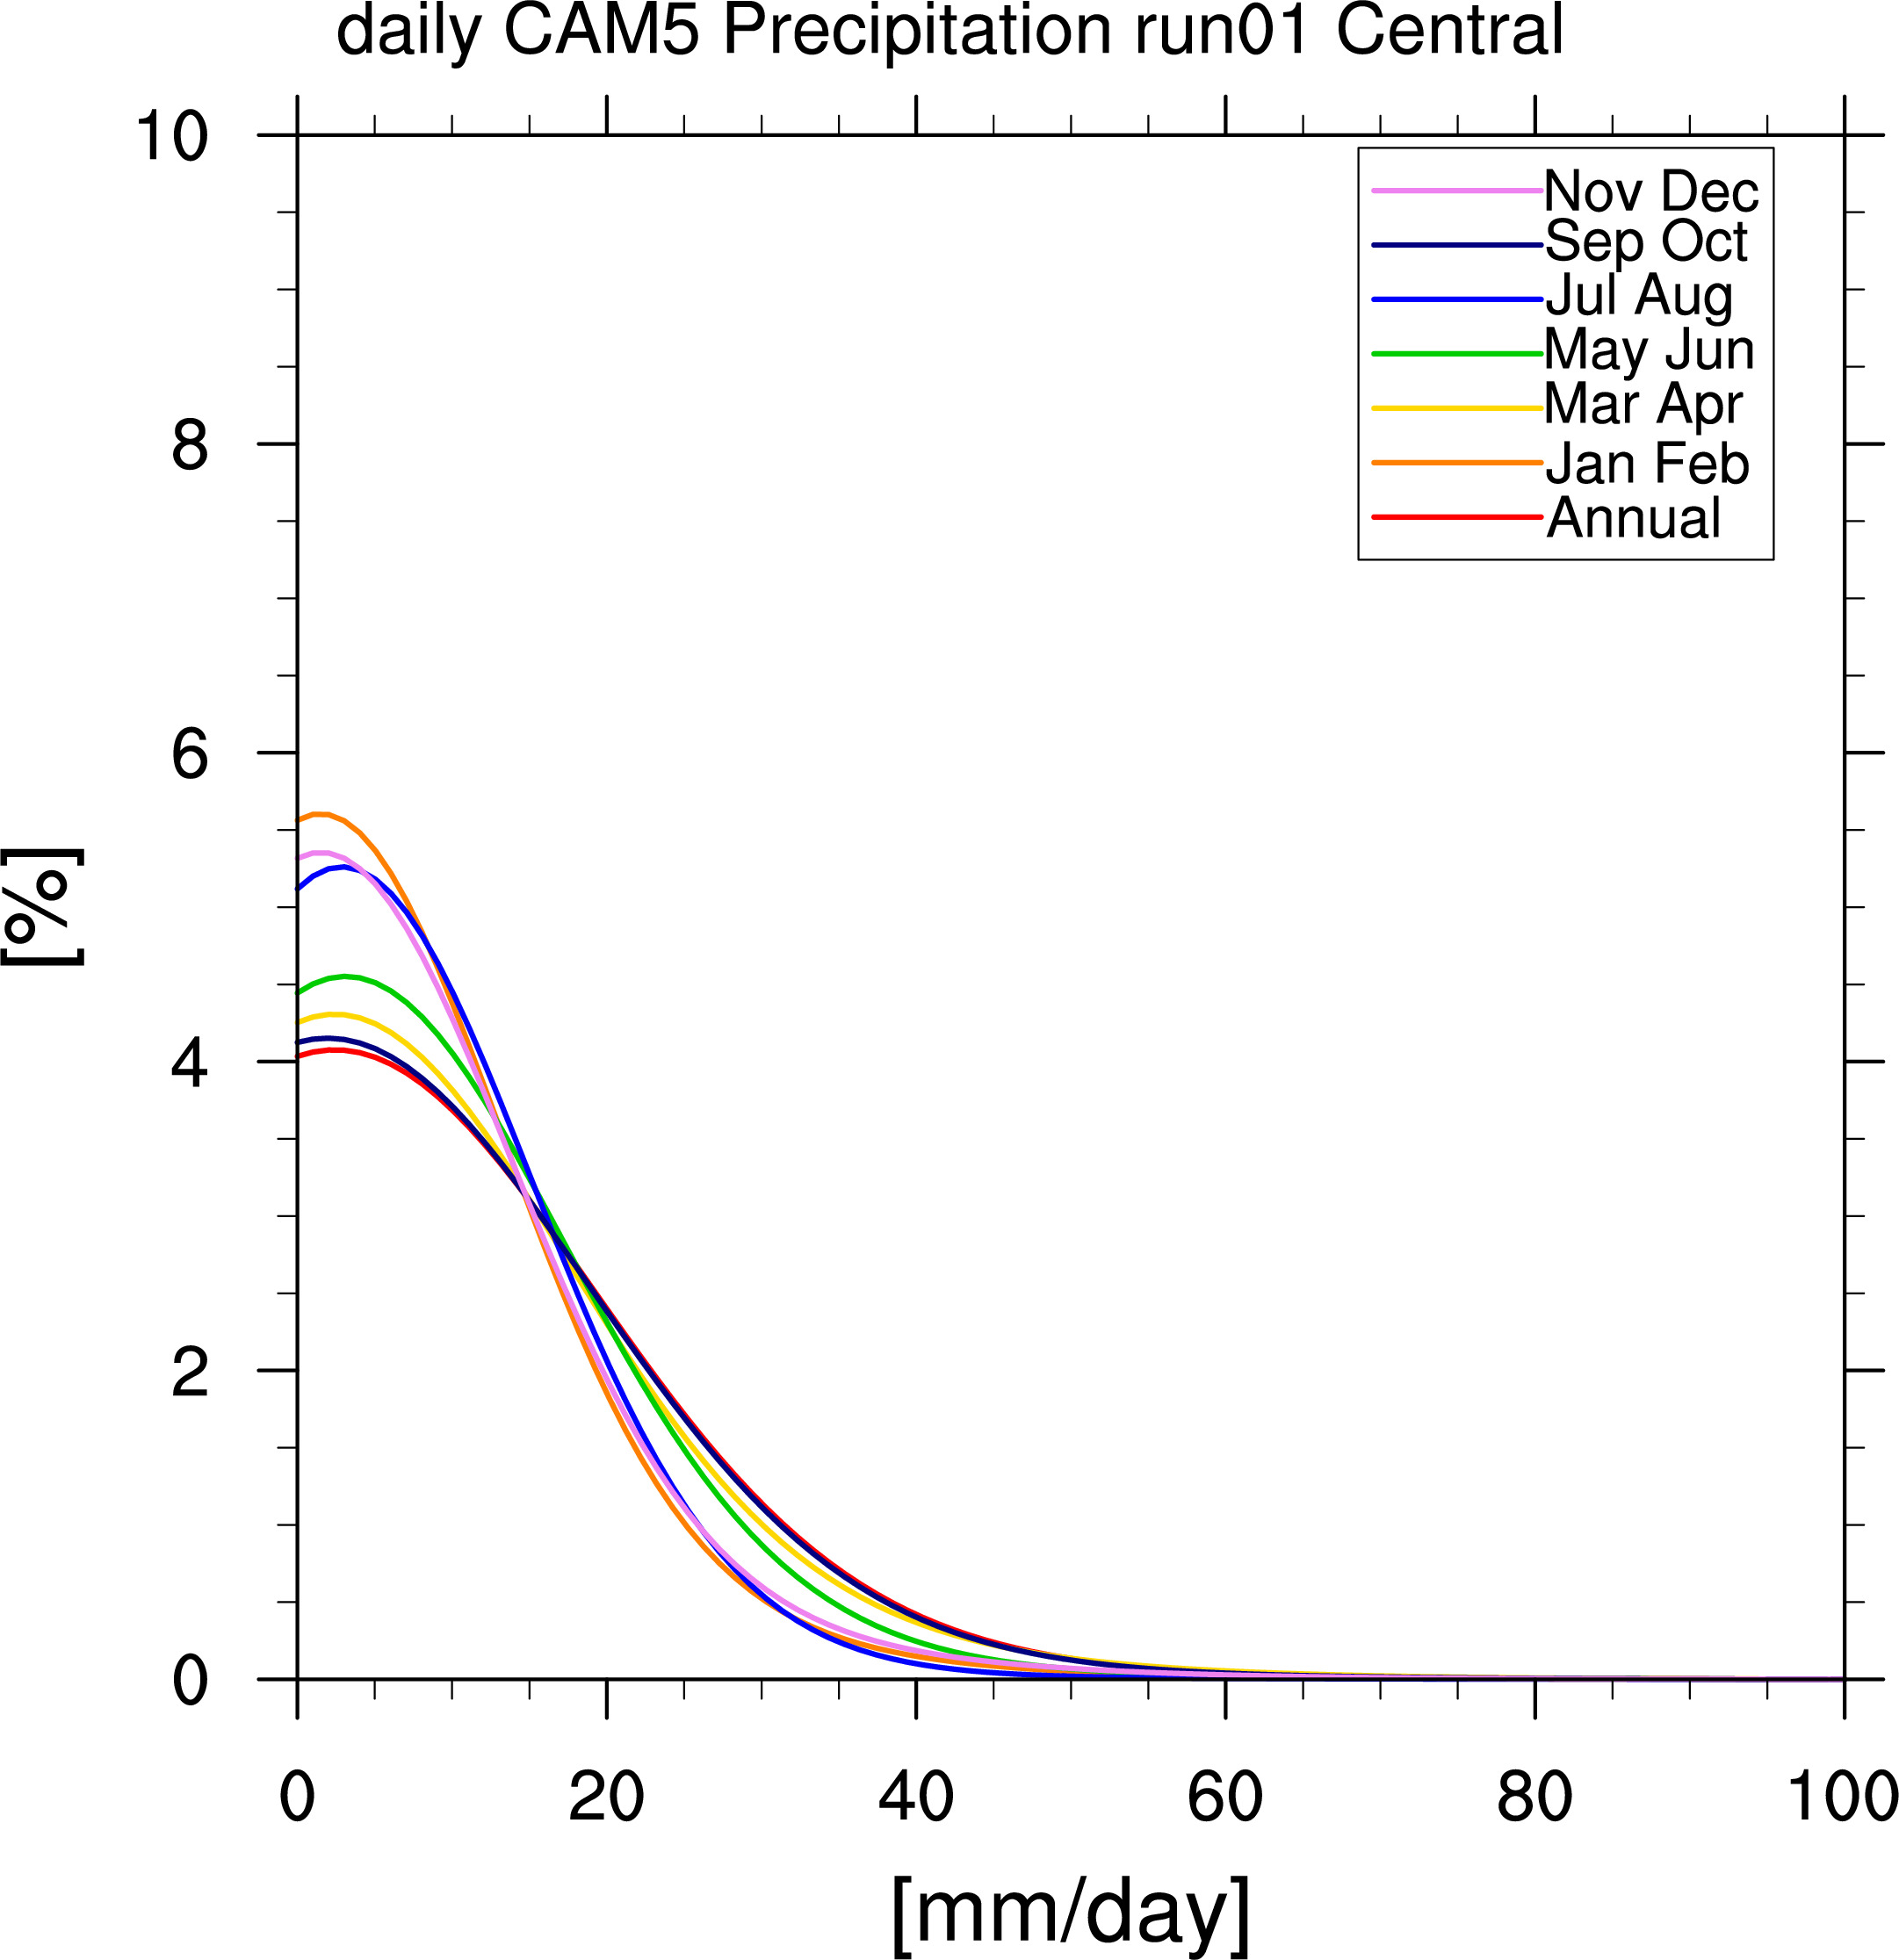
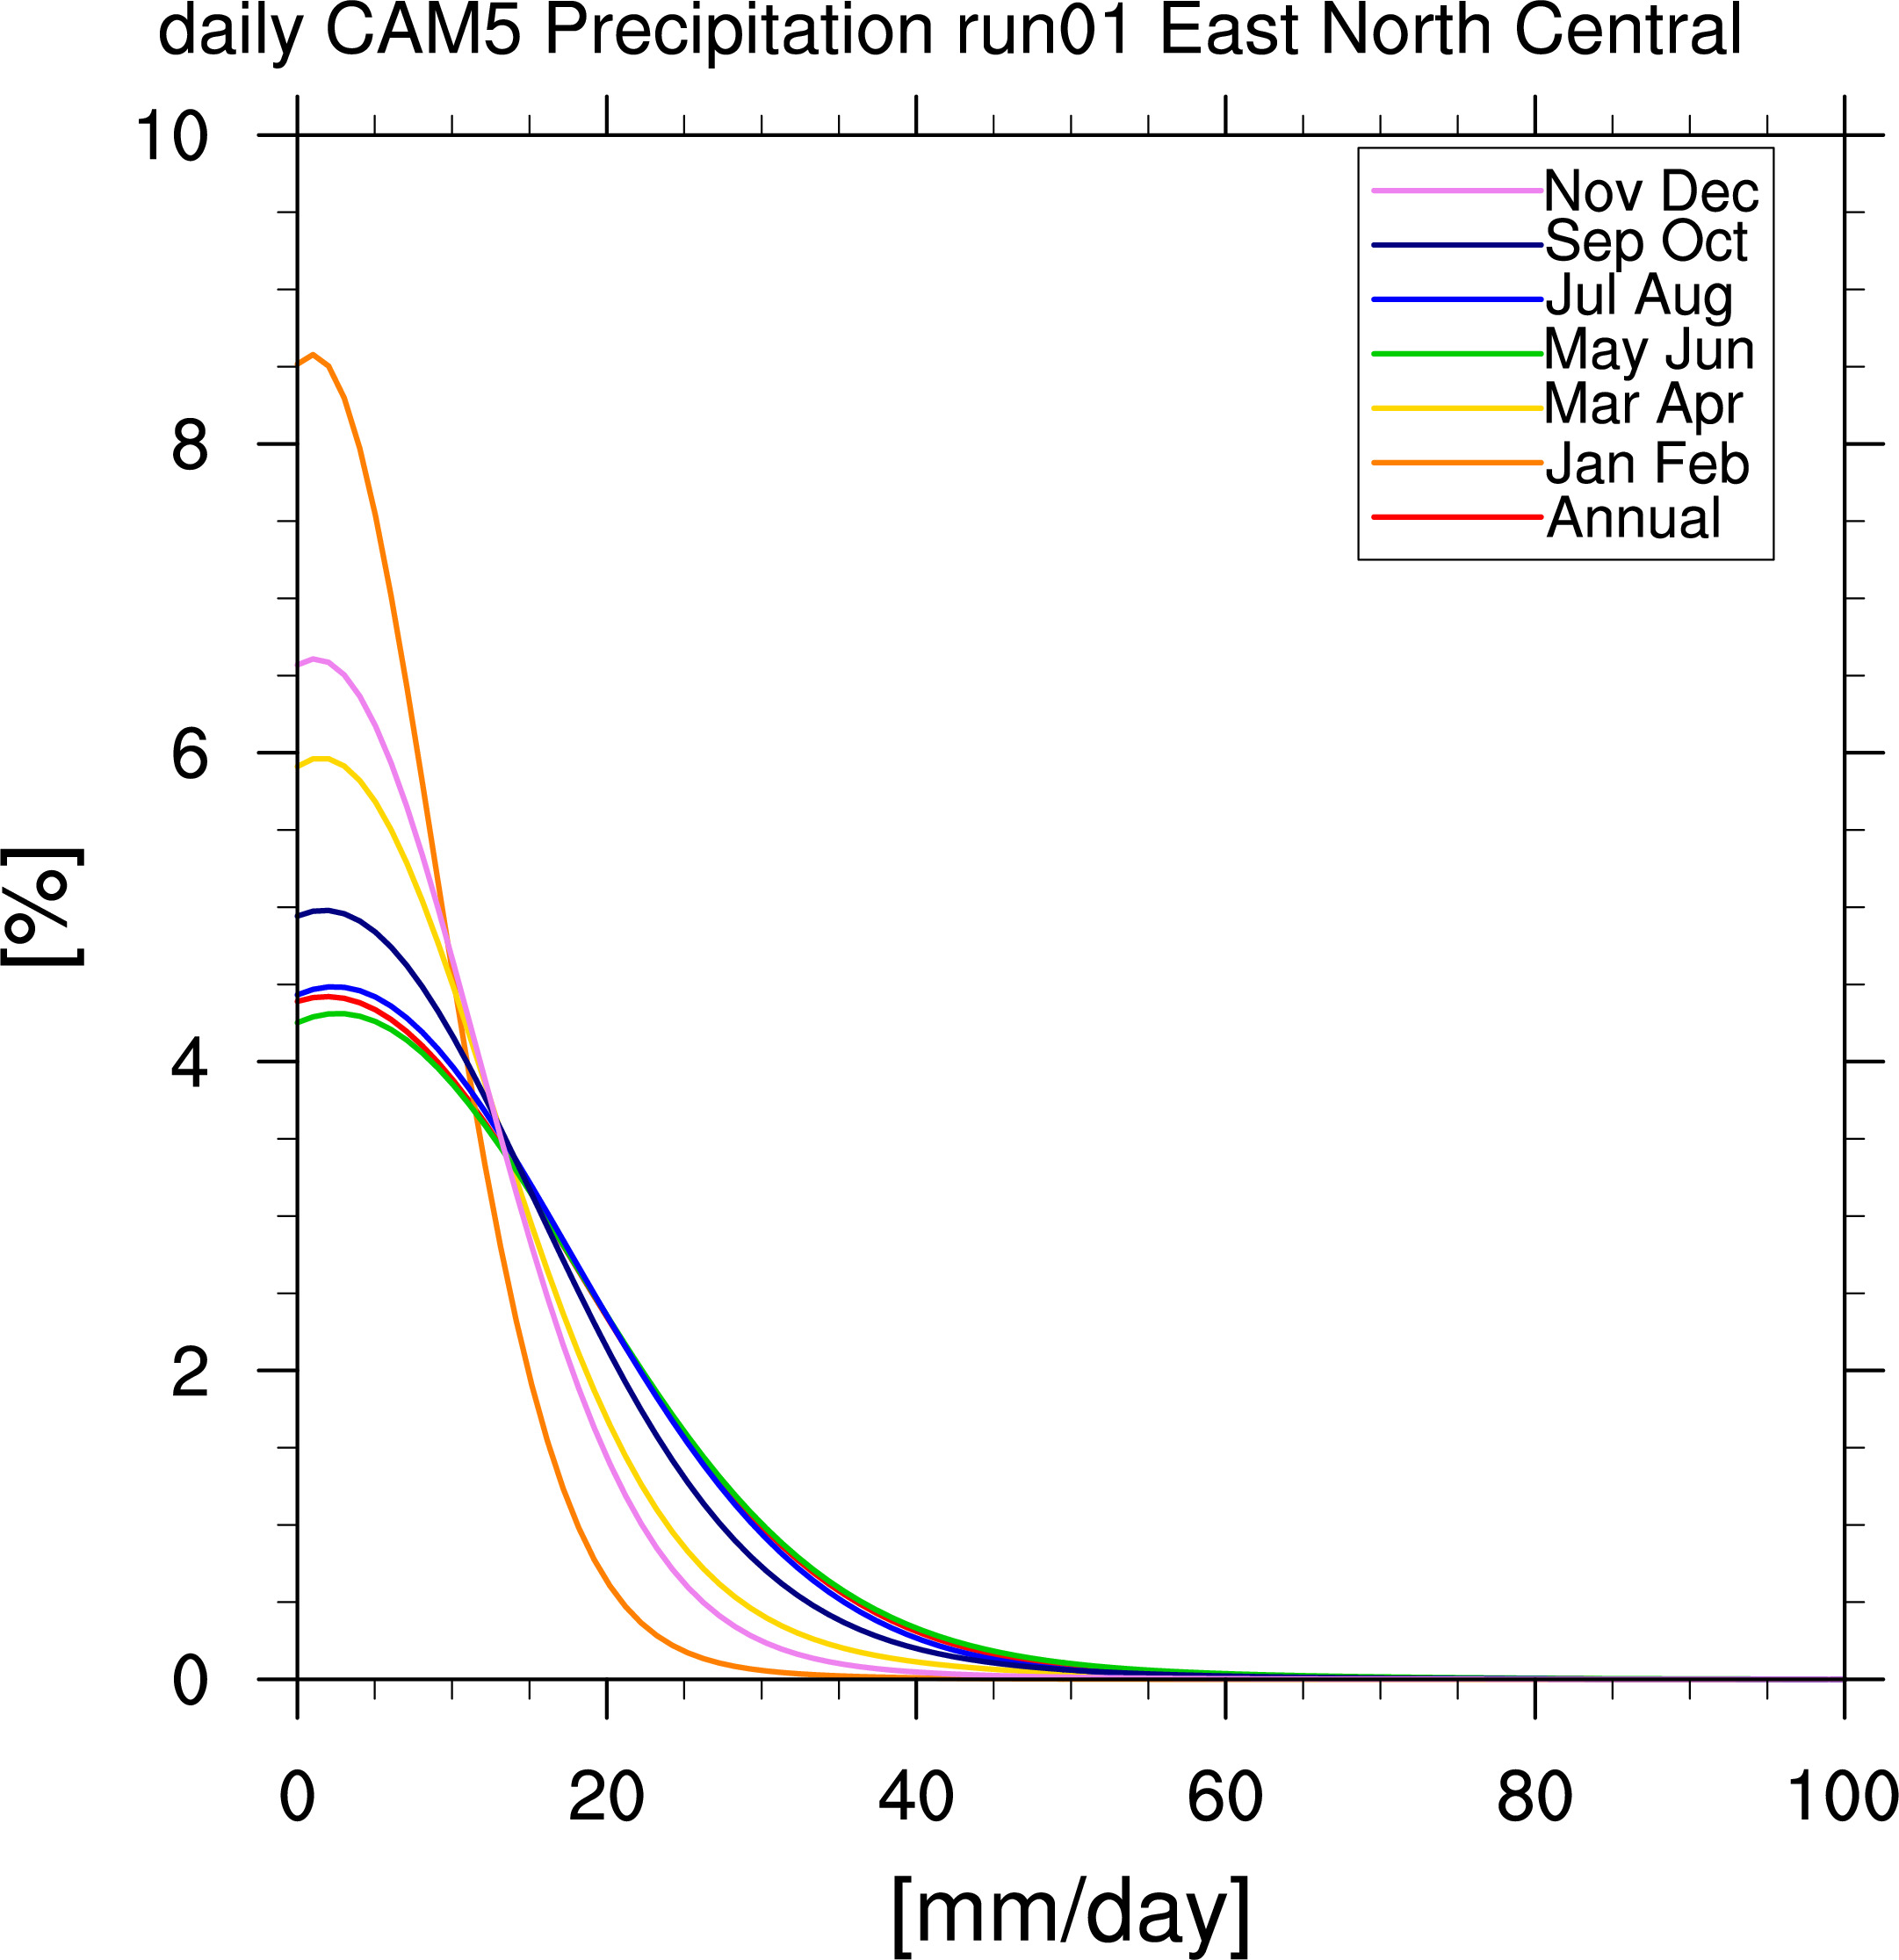
1948-2018 comparison US CPC Daily precip (left) and US CAM5 run01 Daily precip (right)


CAM5 Daily Precipitation 1901-2016 40-run ensemble
~1 degree gridone run per row, 10 regions per row
right click to see bigger images


GPCC Precipitation 1901-2016
~1 degree gridClimatologies
6 seasons plus annual case per row
right click to see bigger images


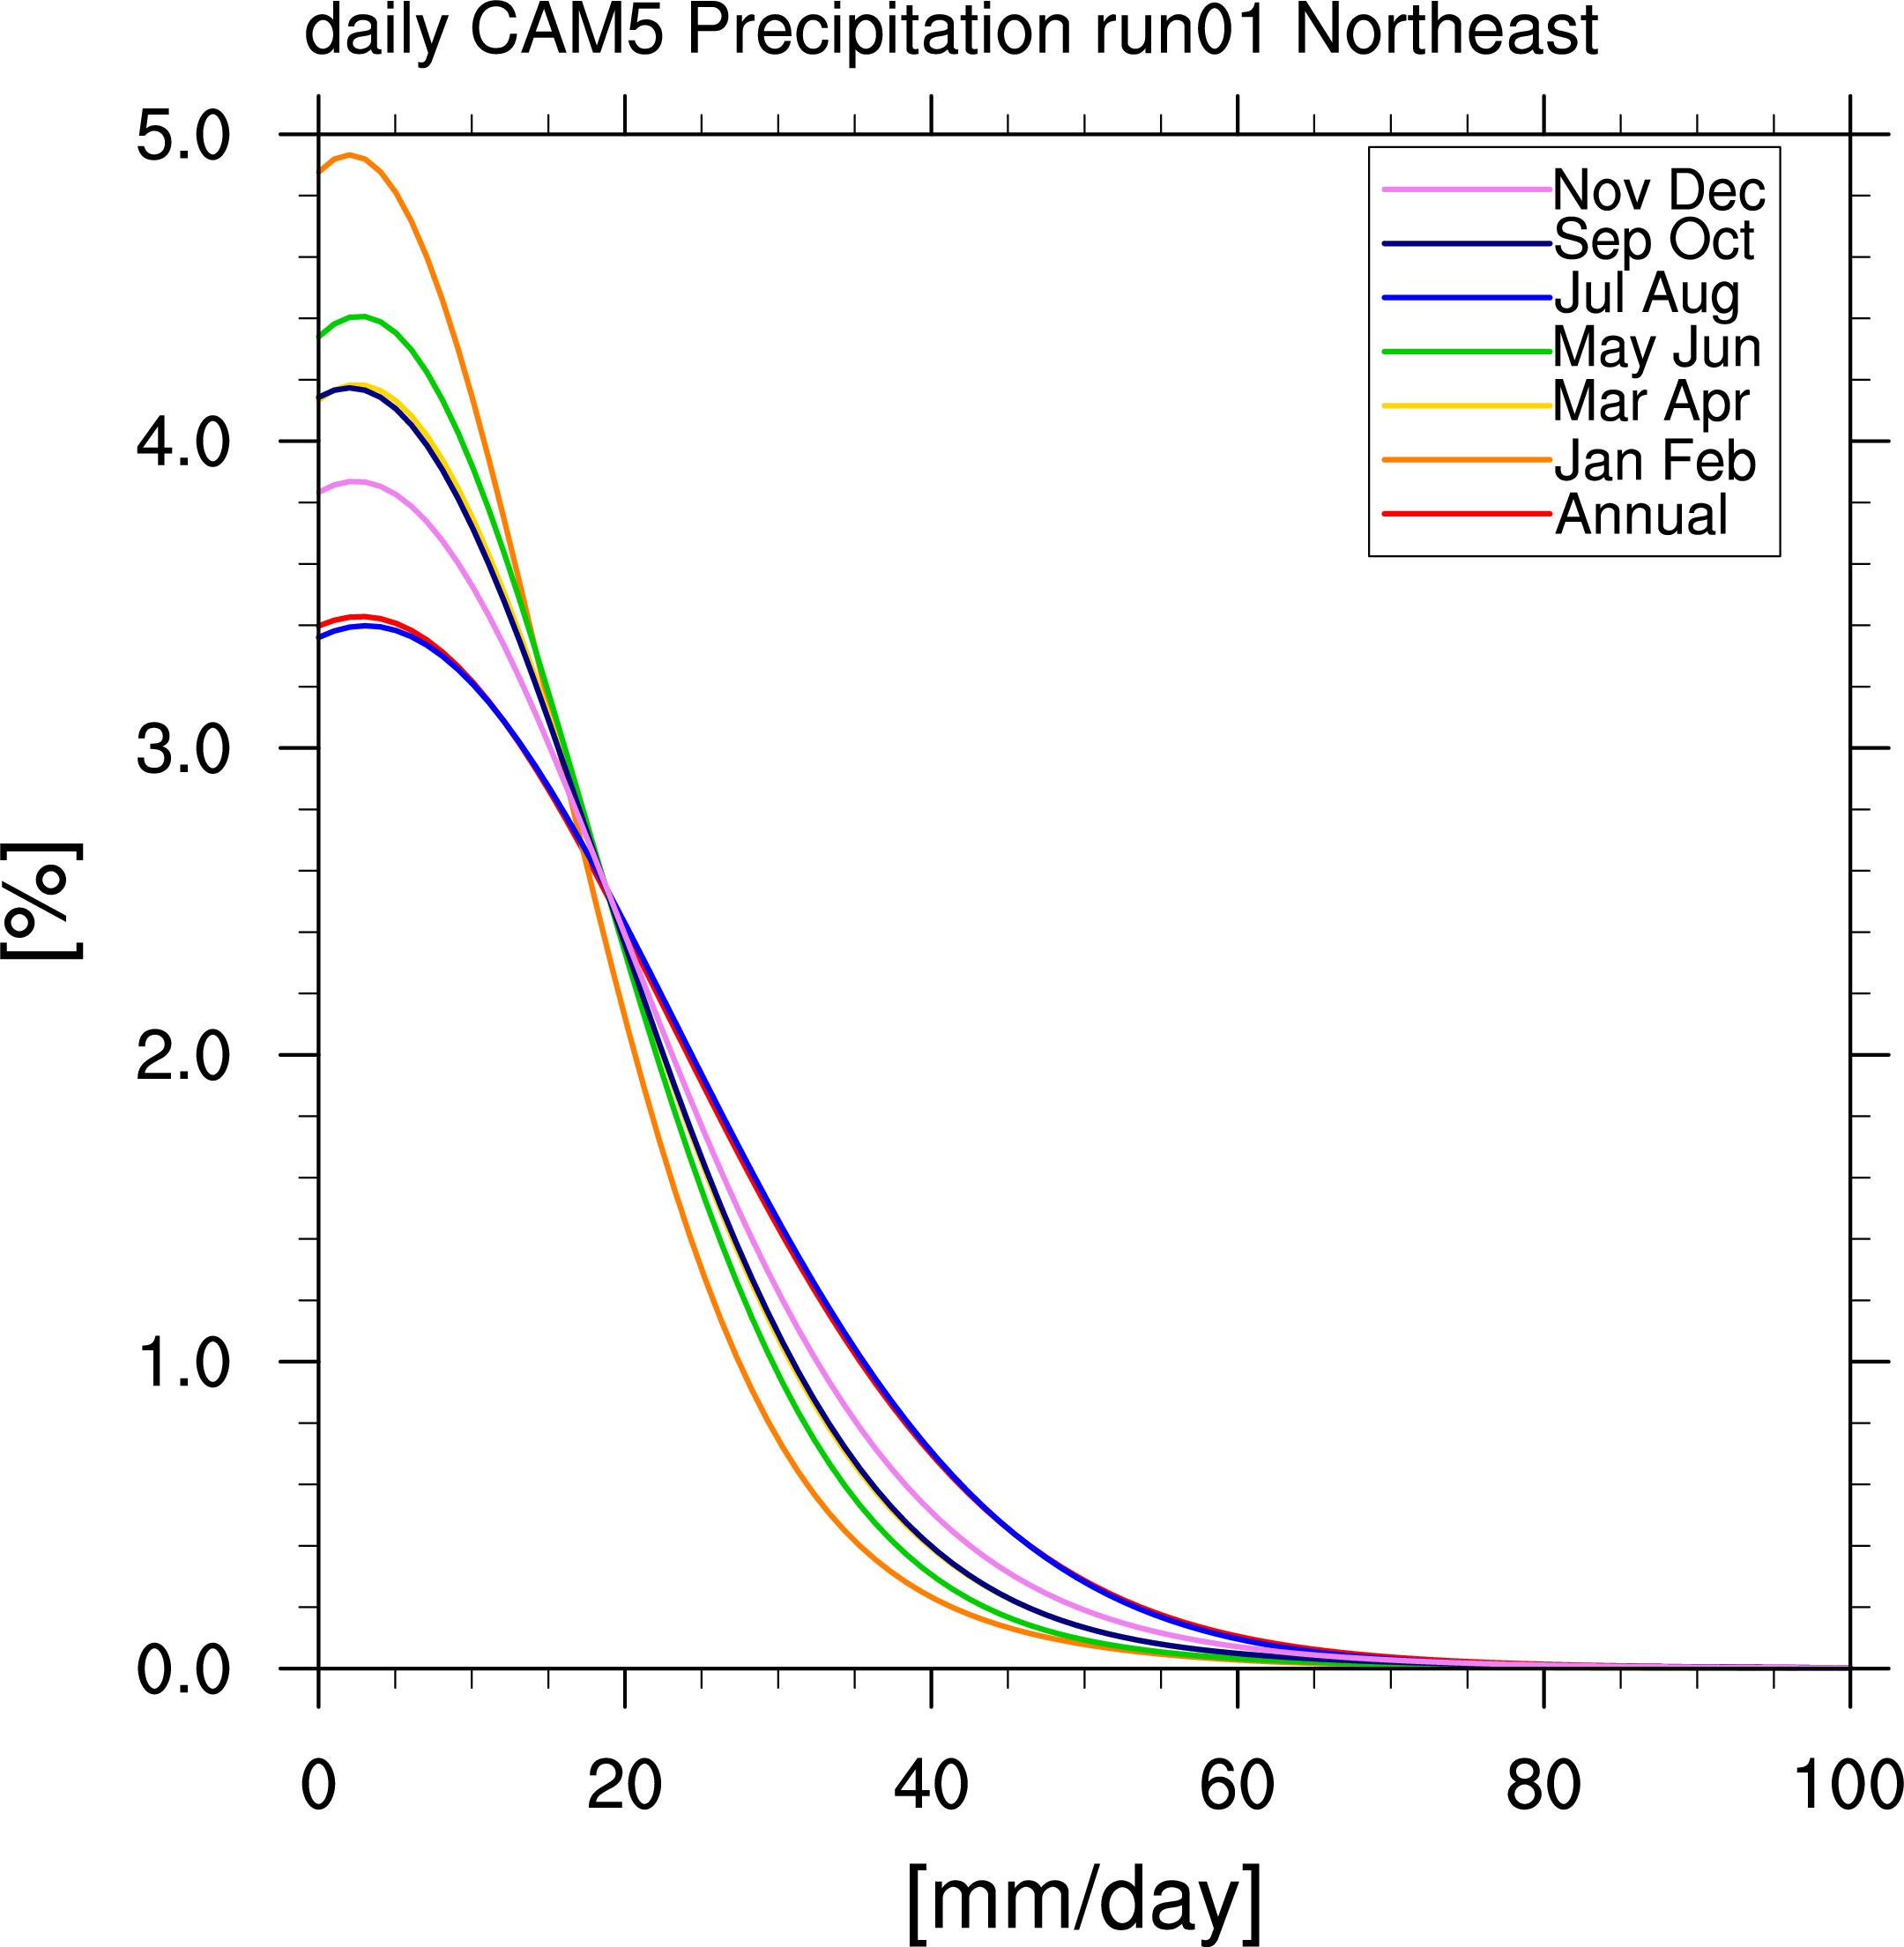
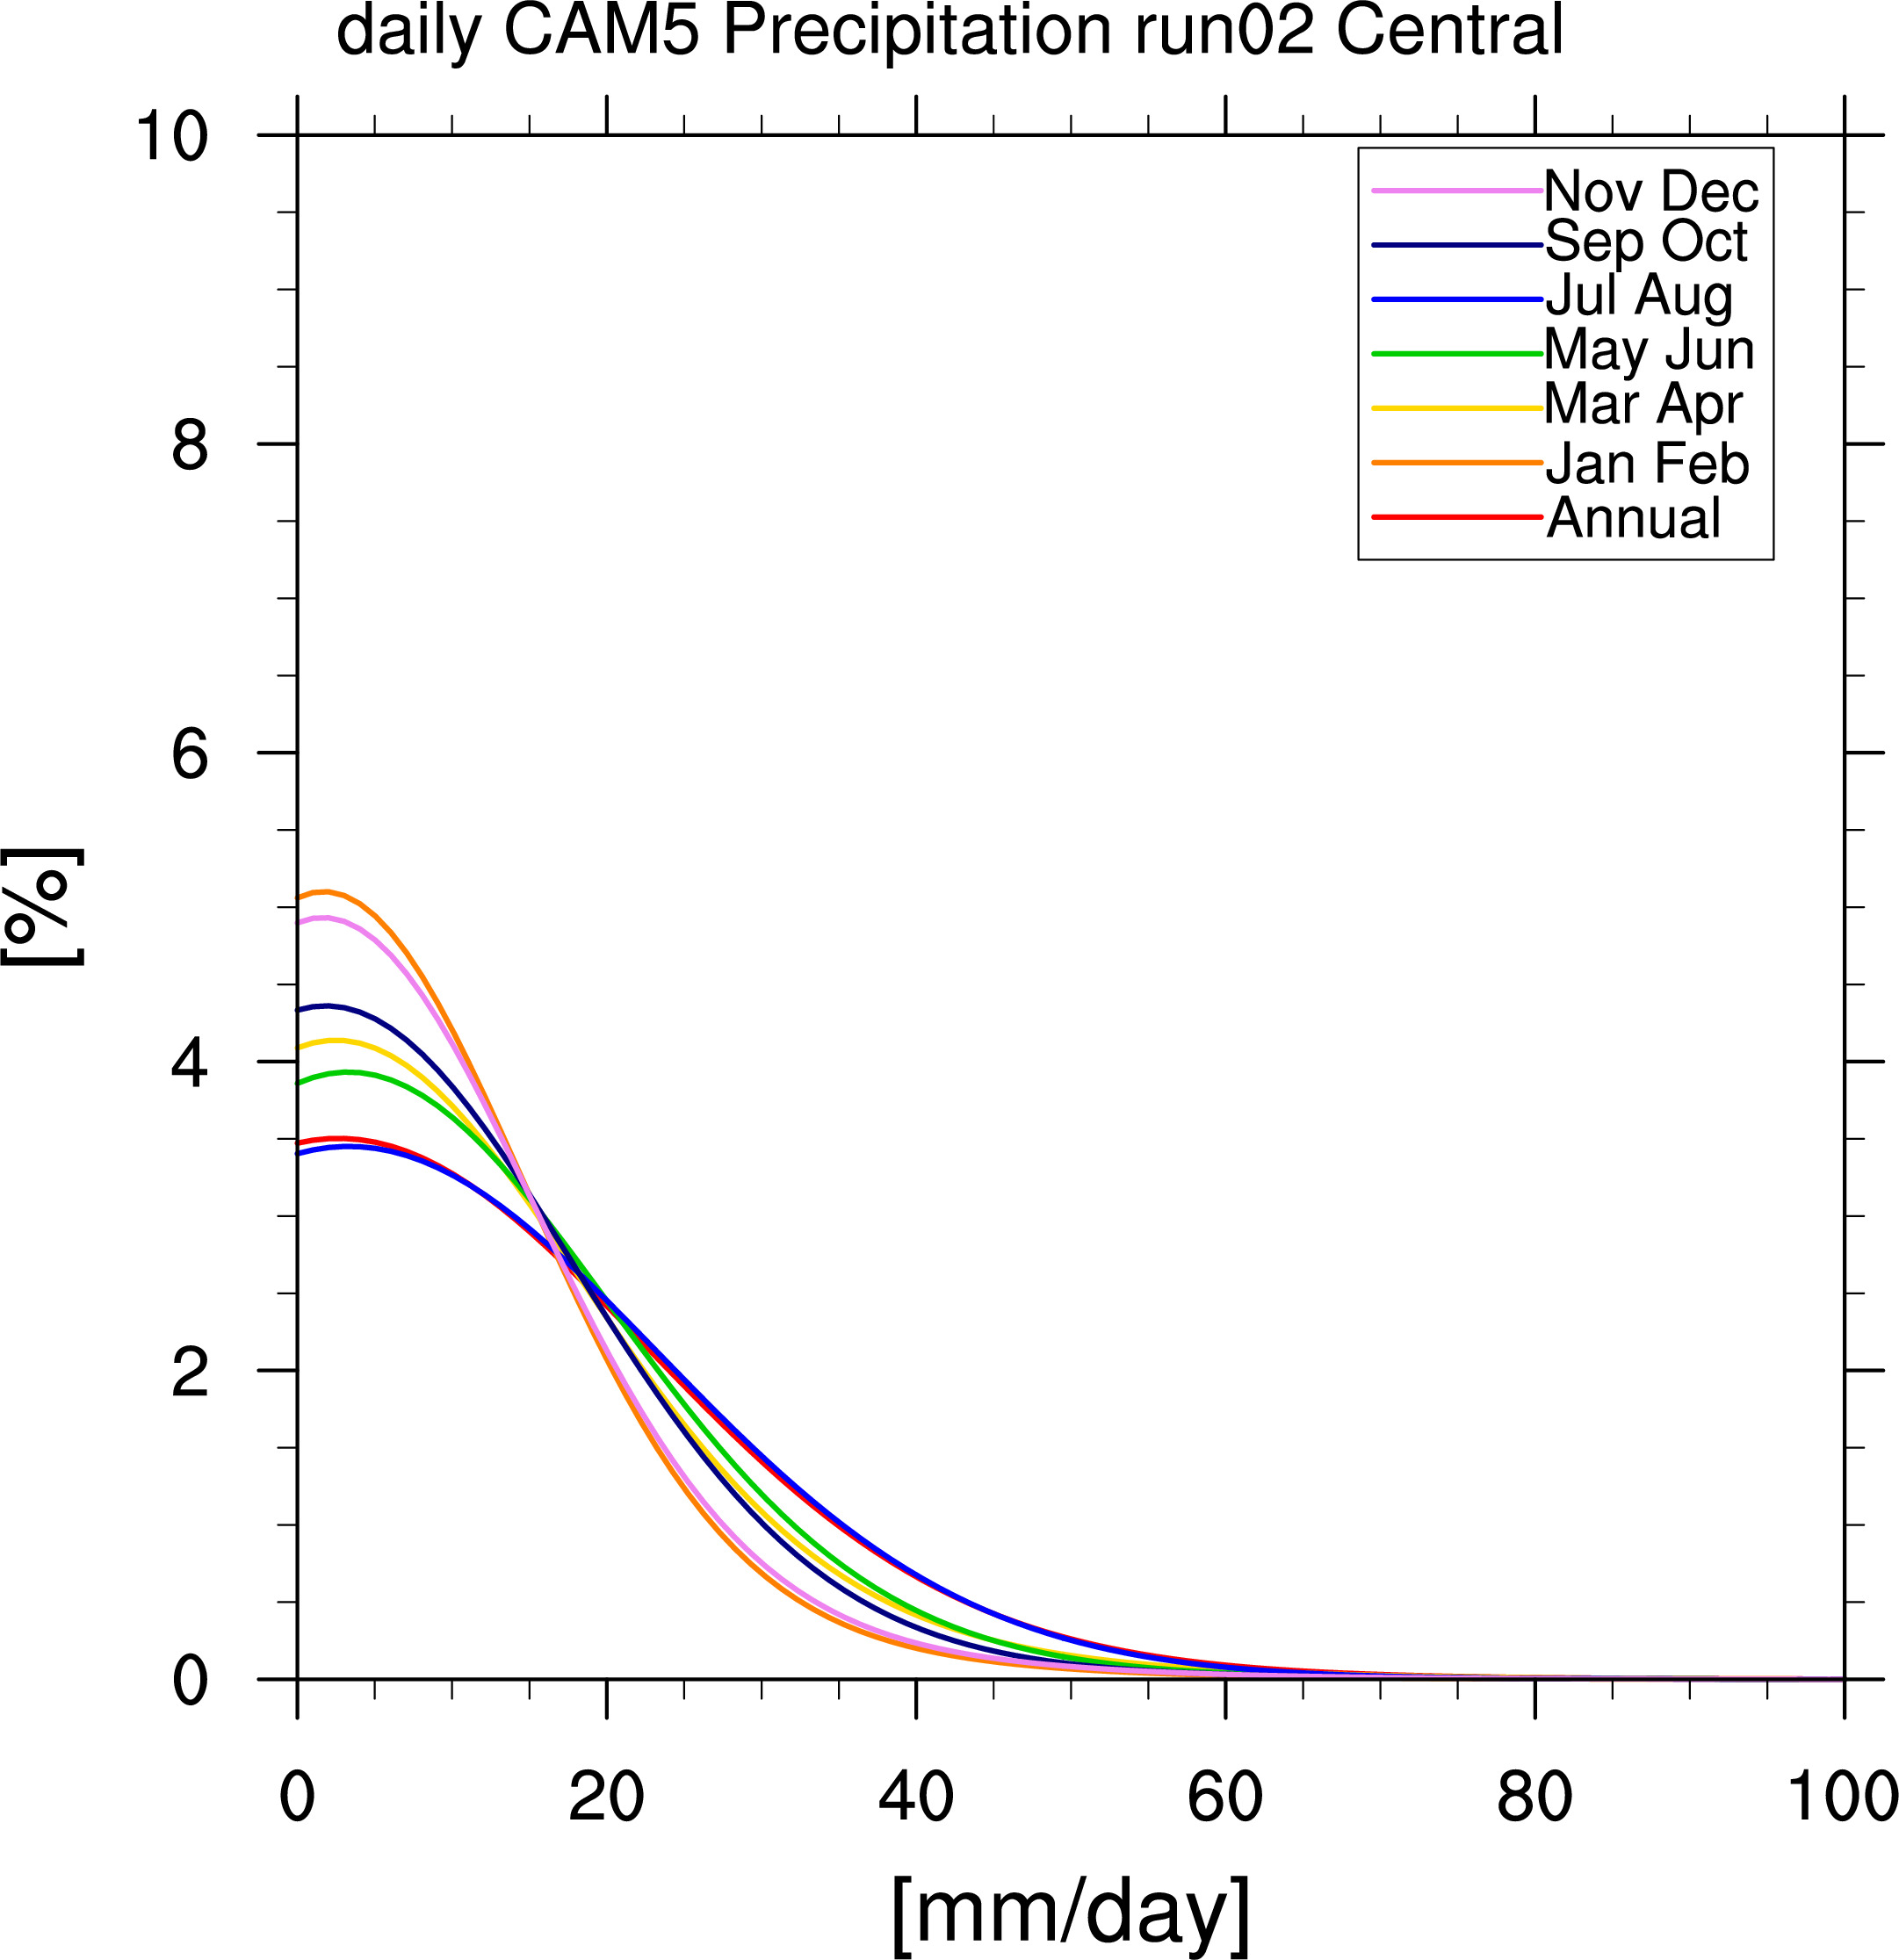
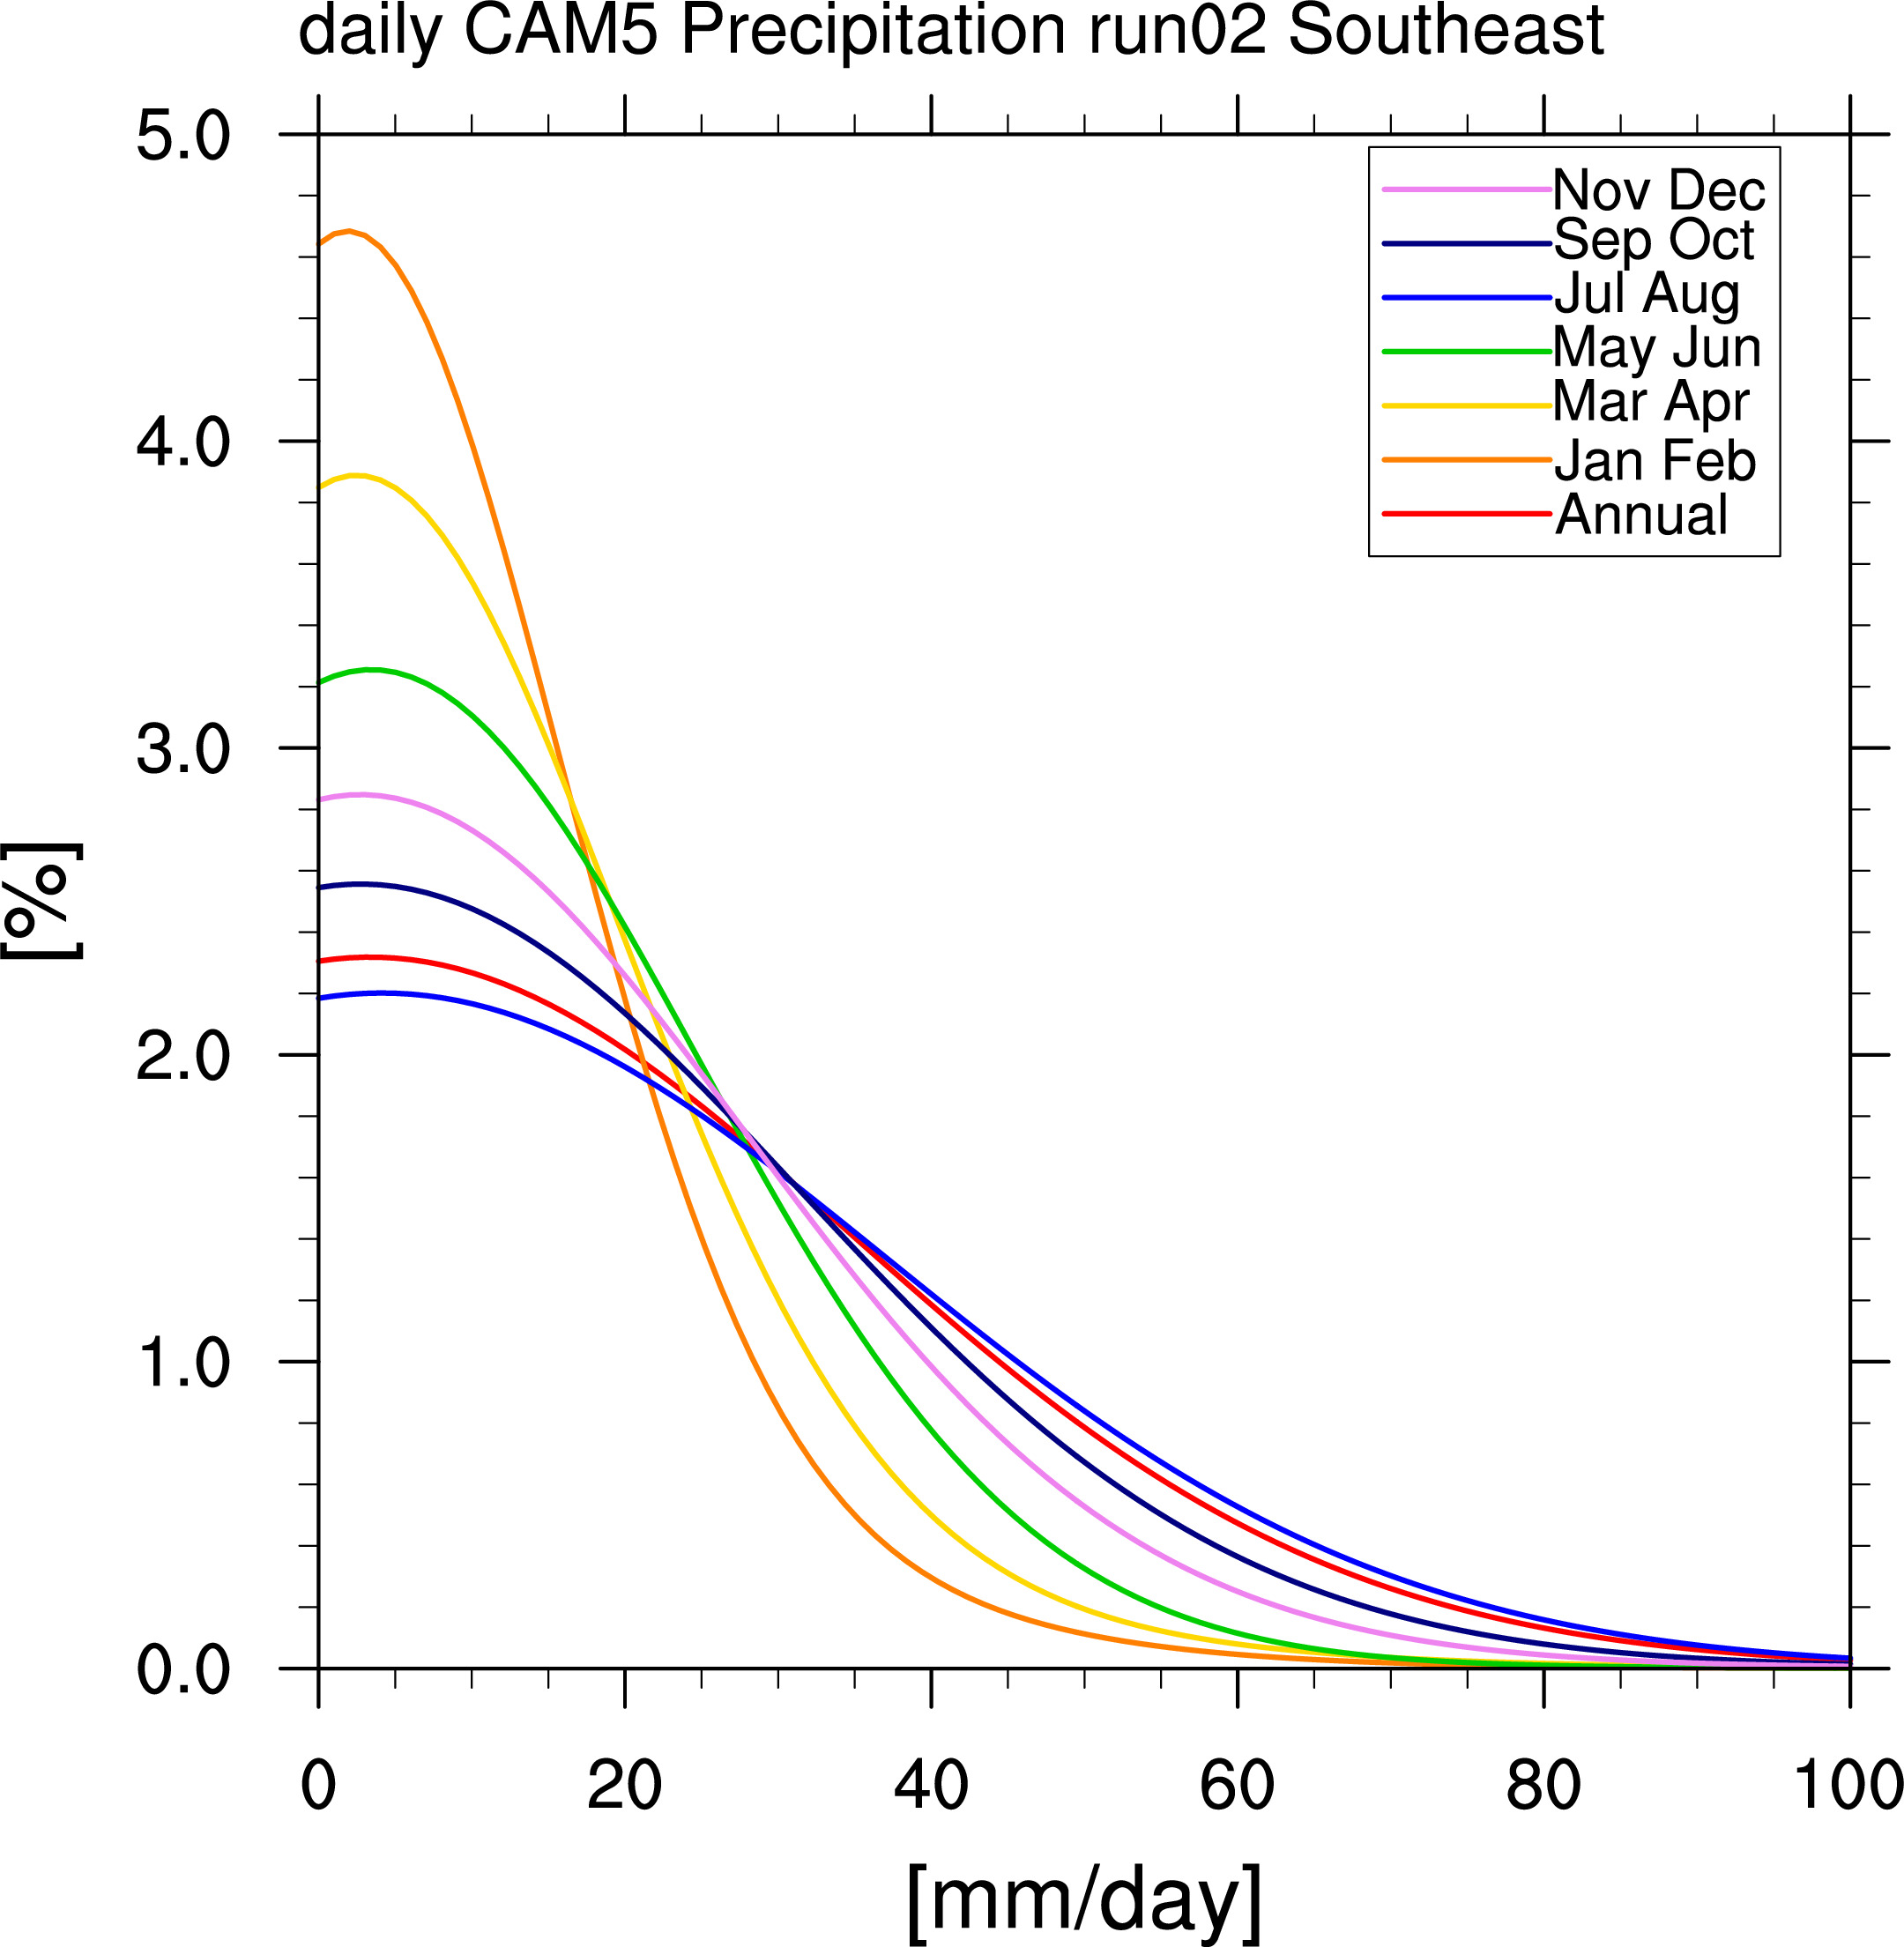
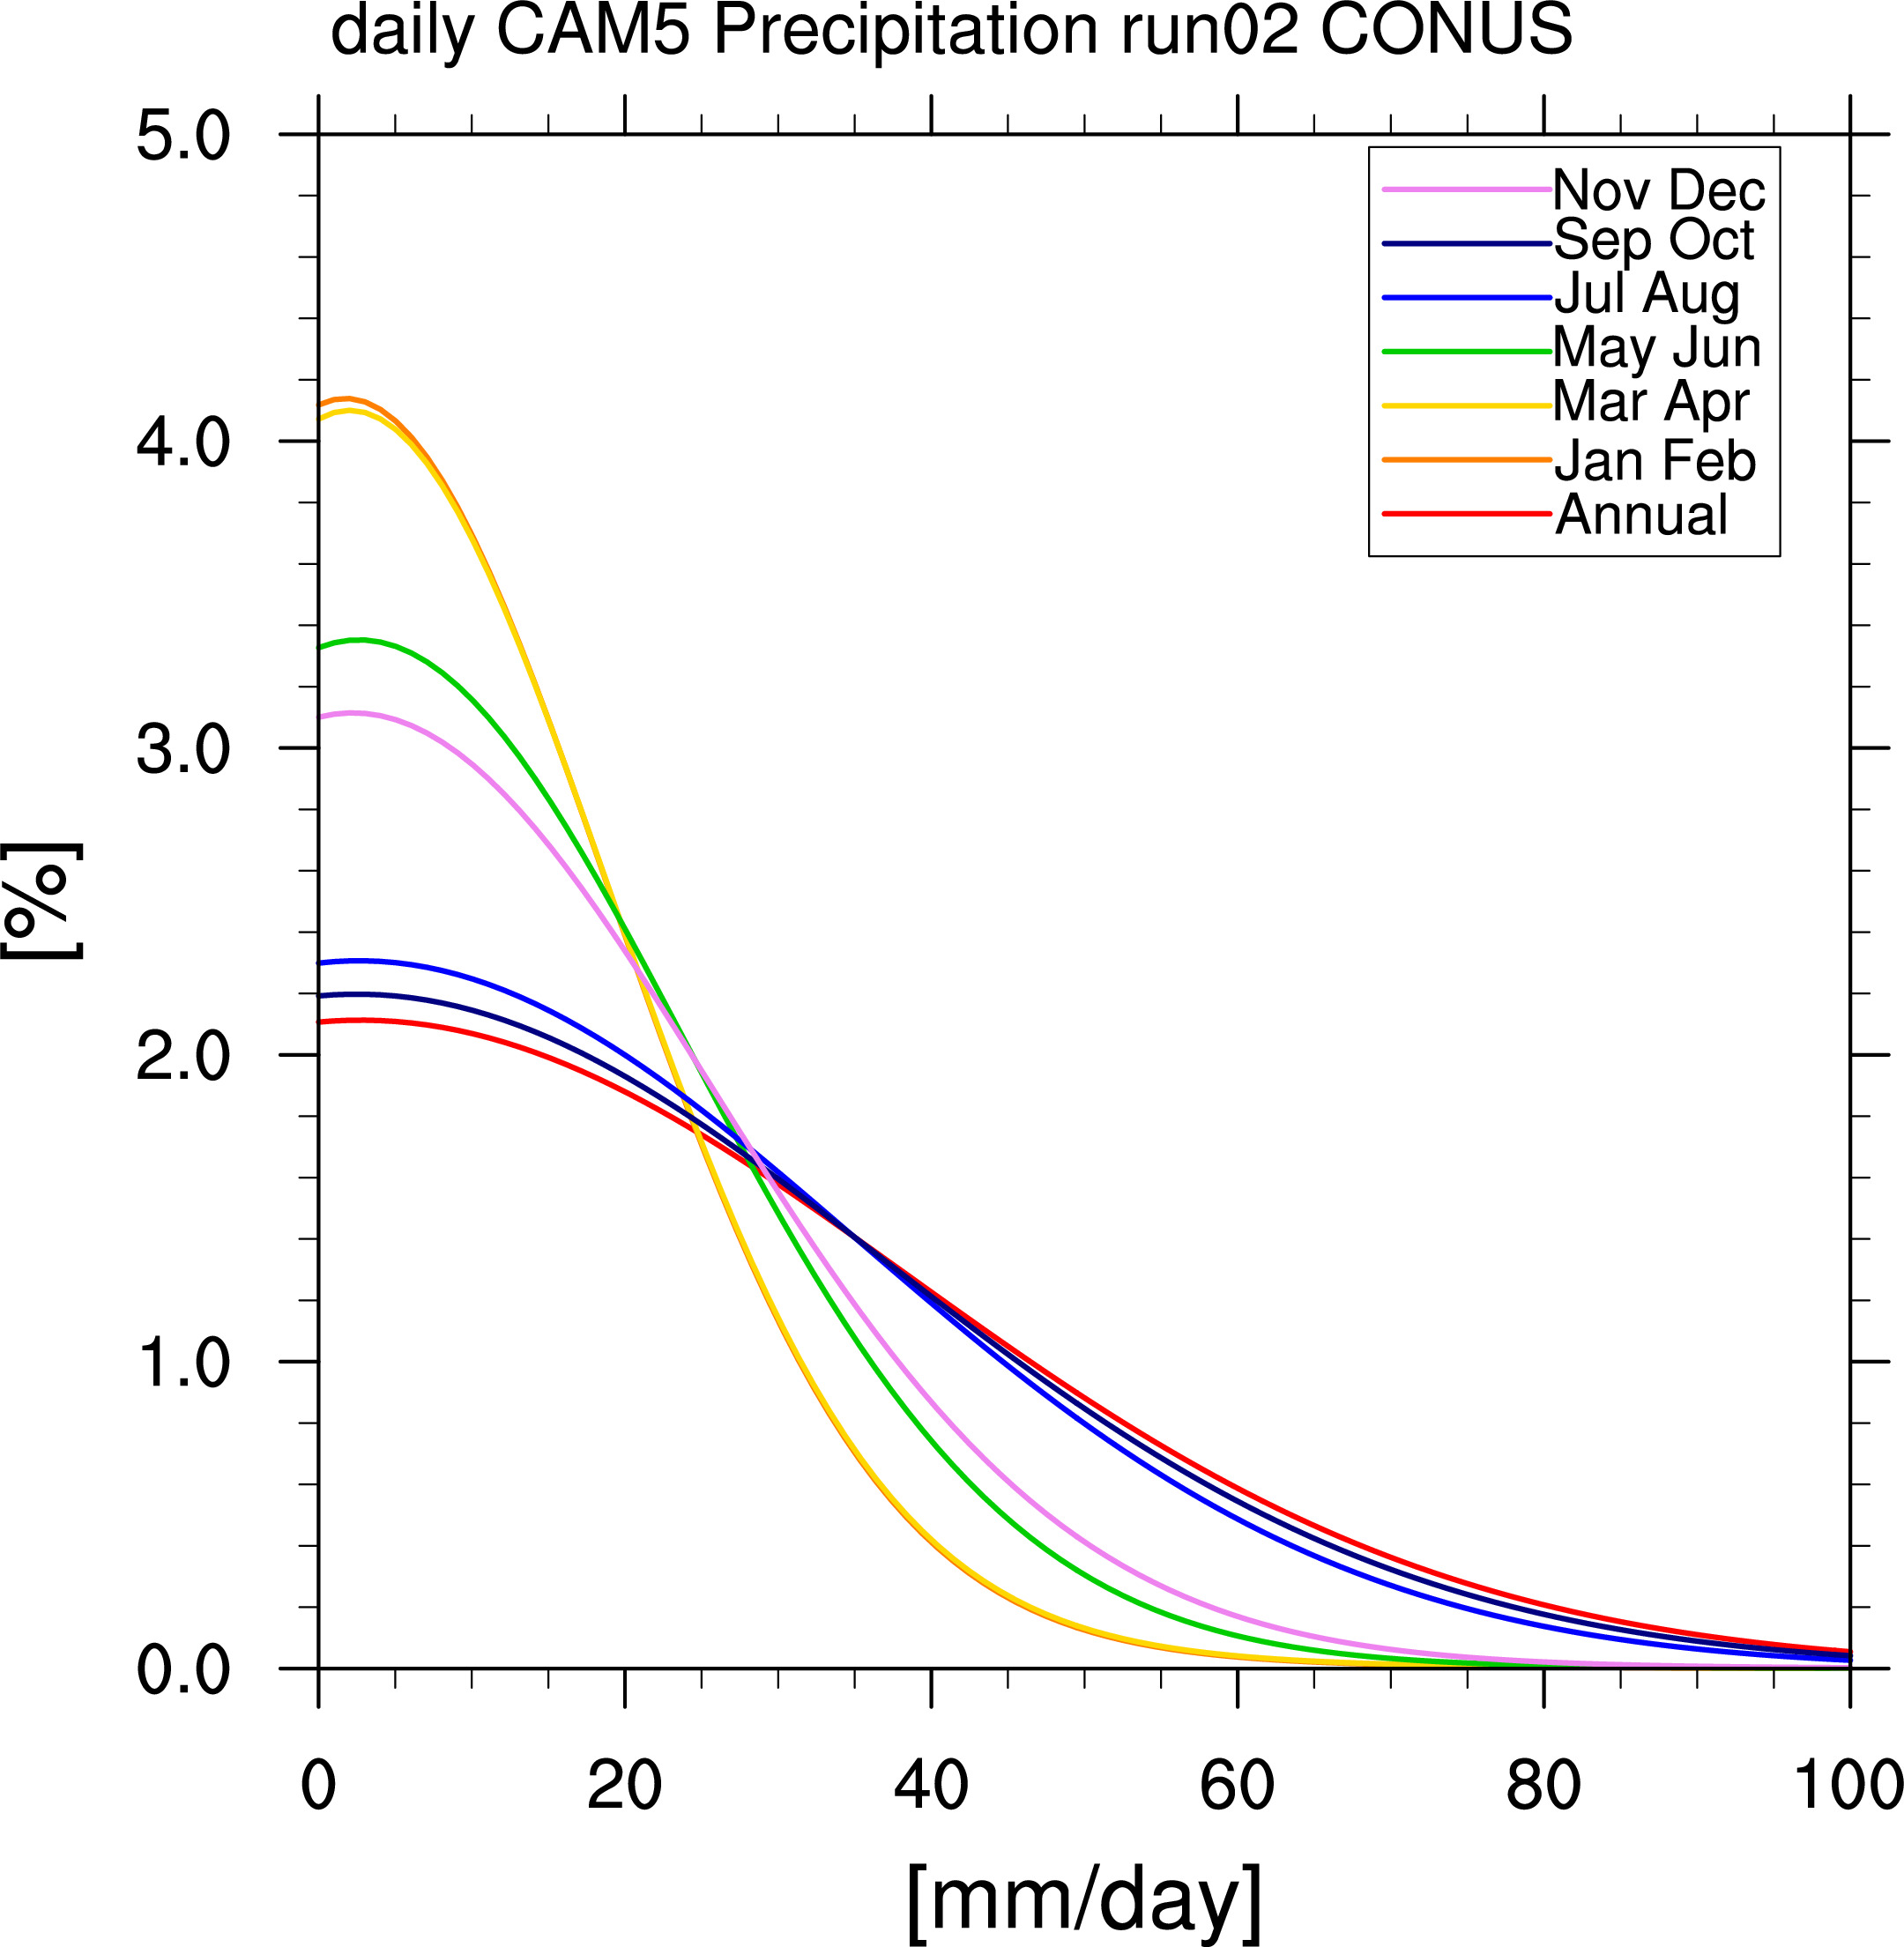
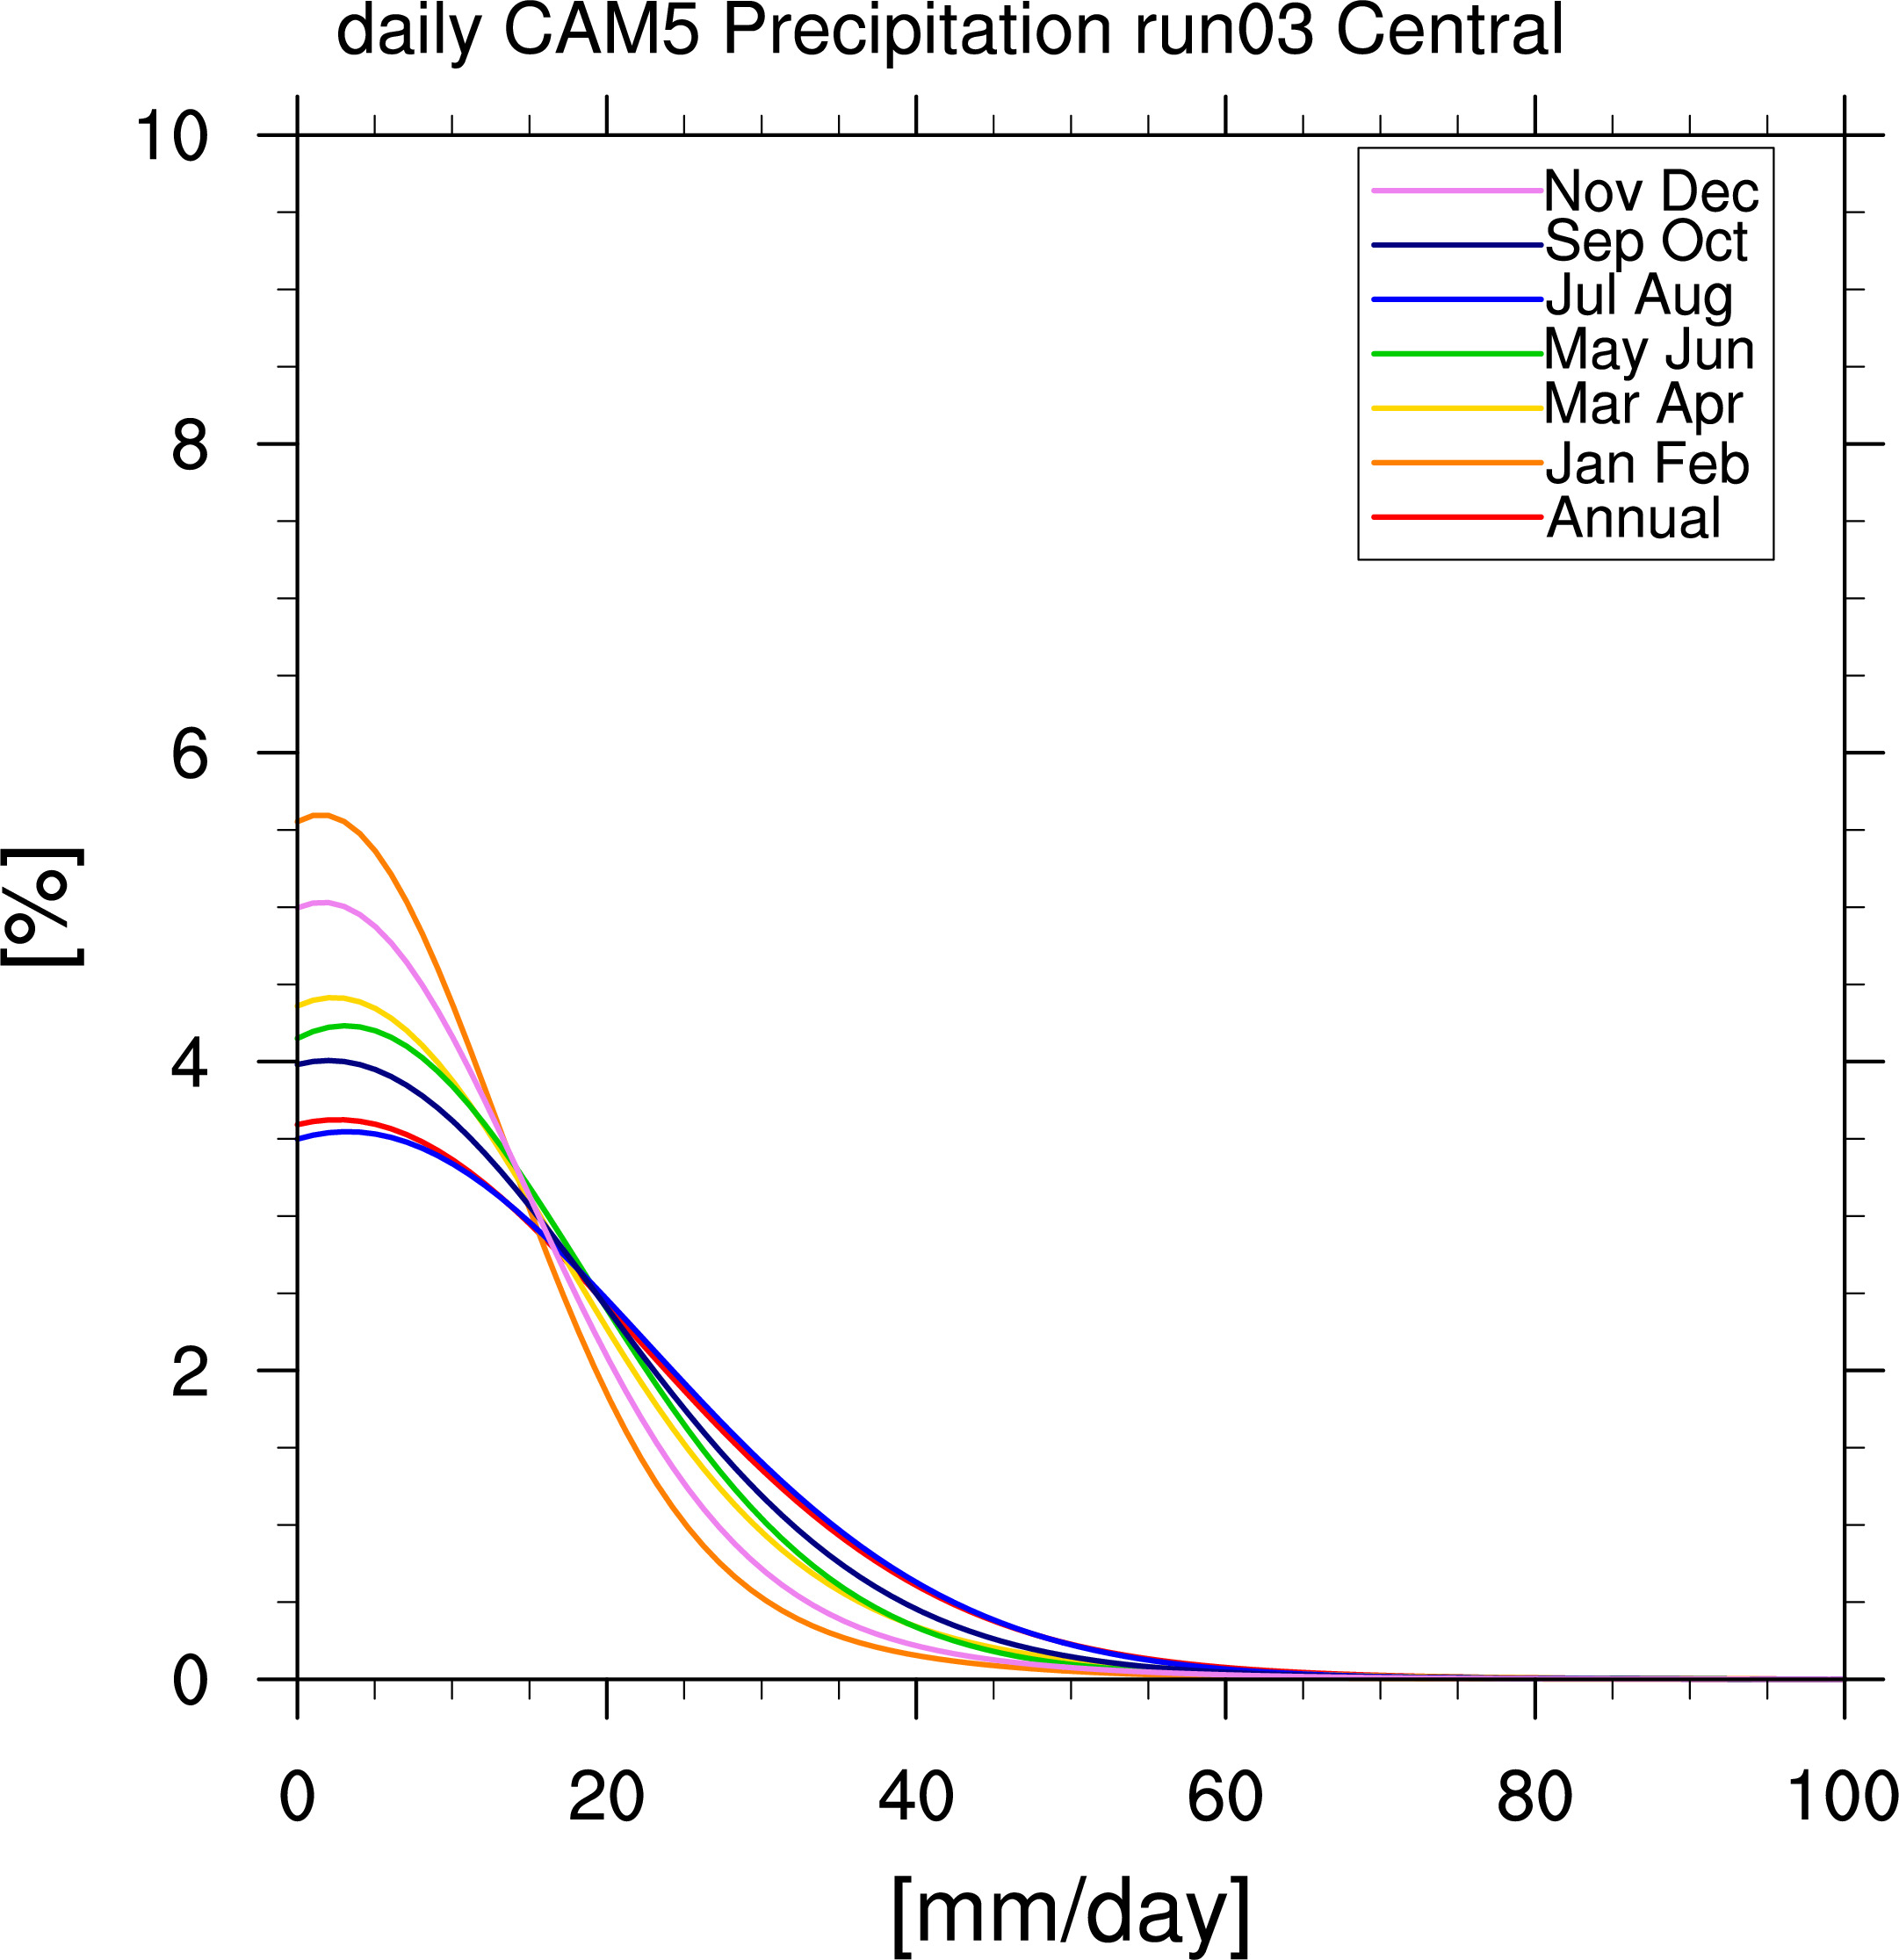
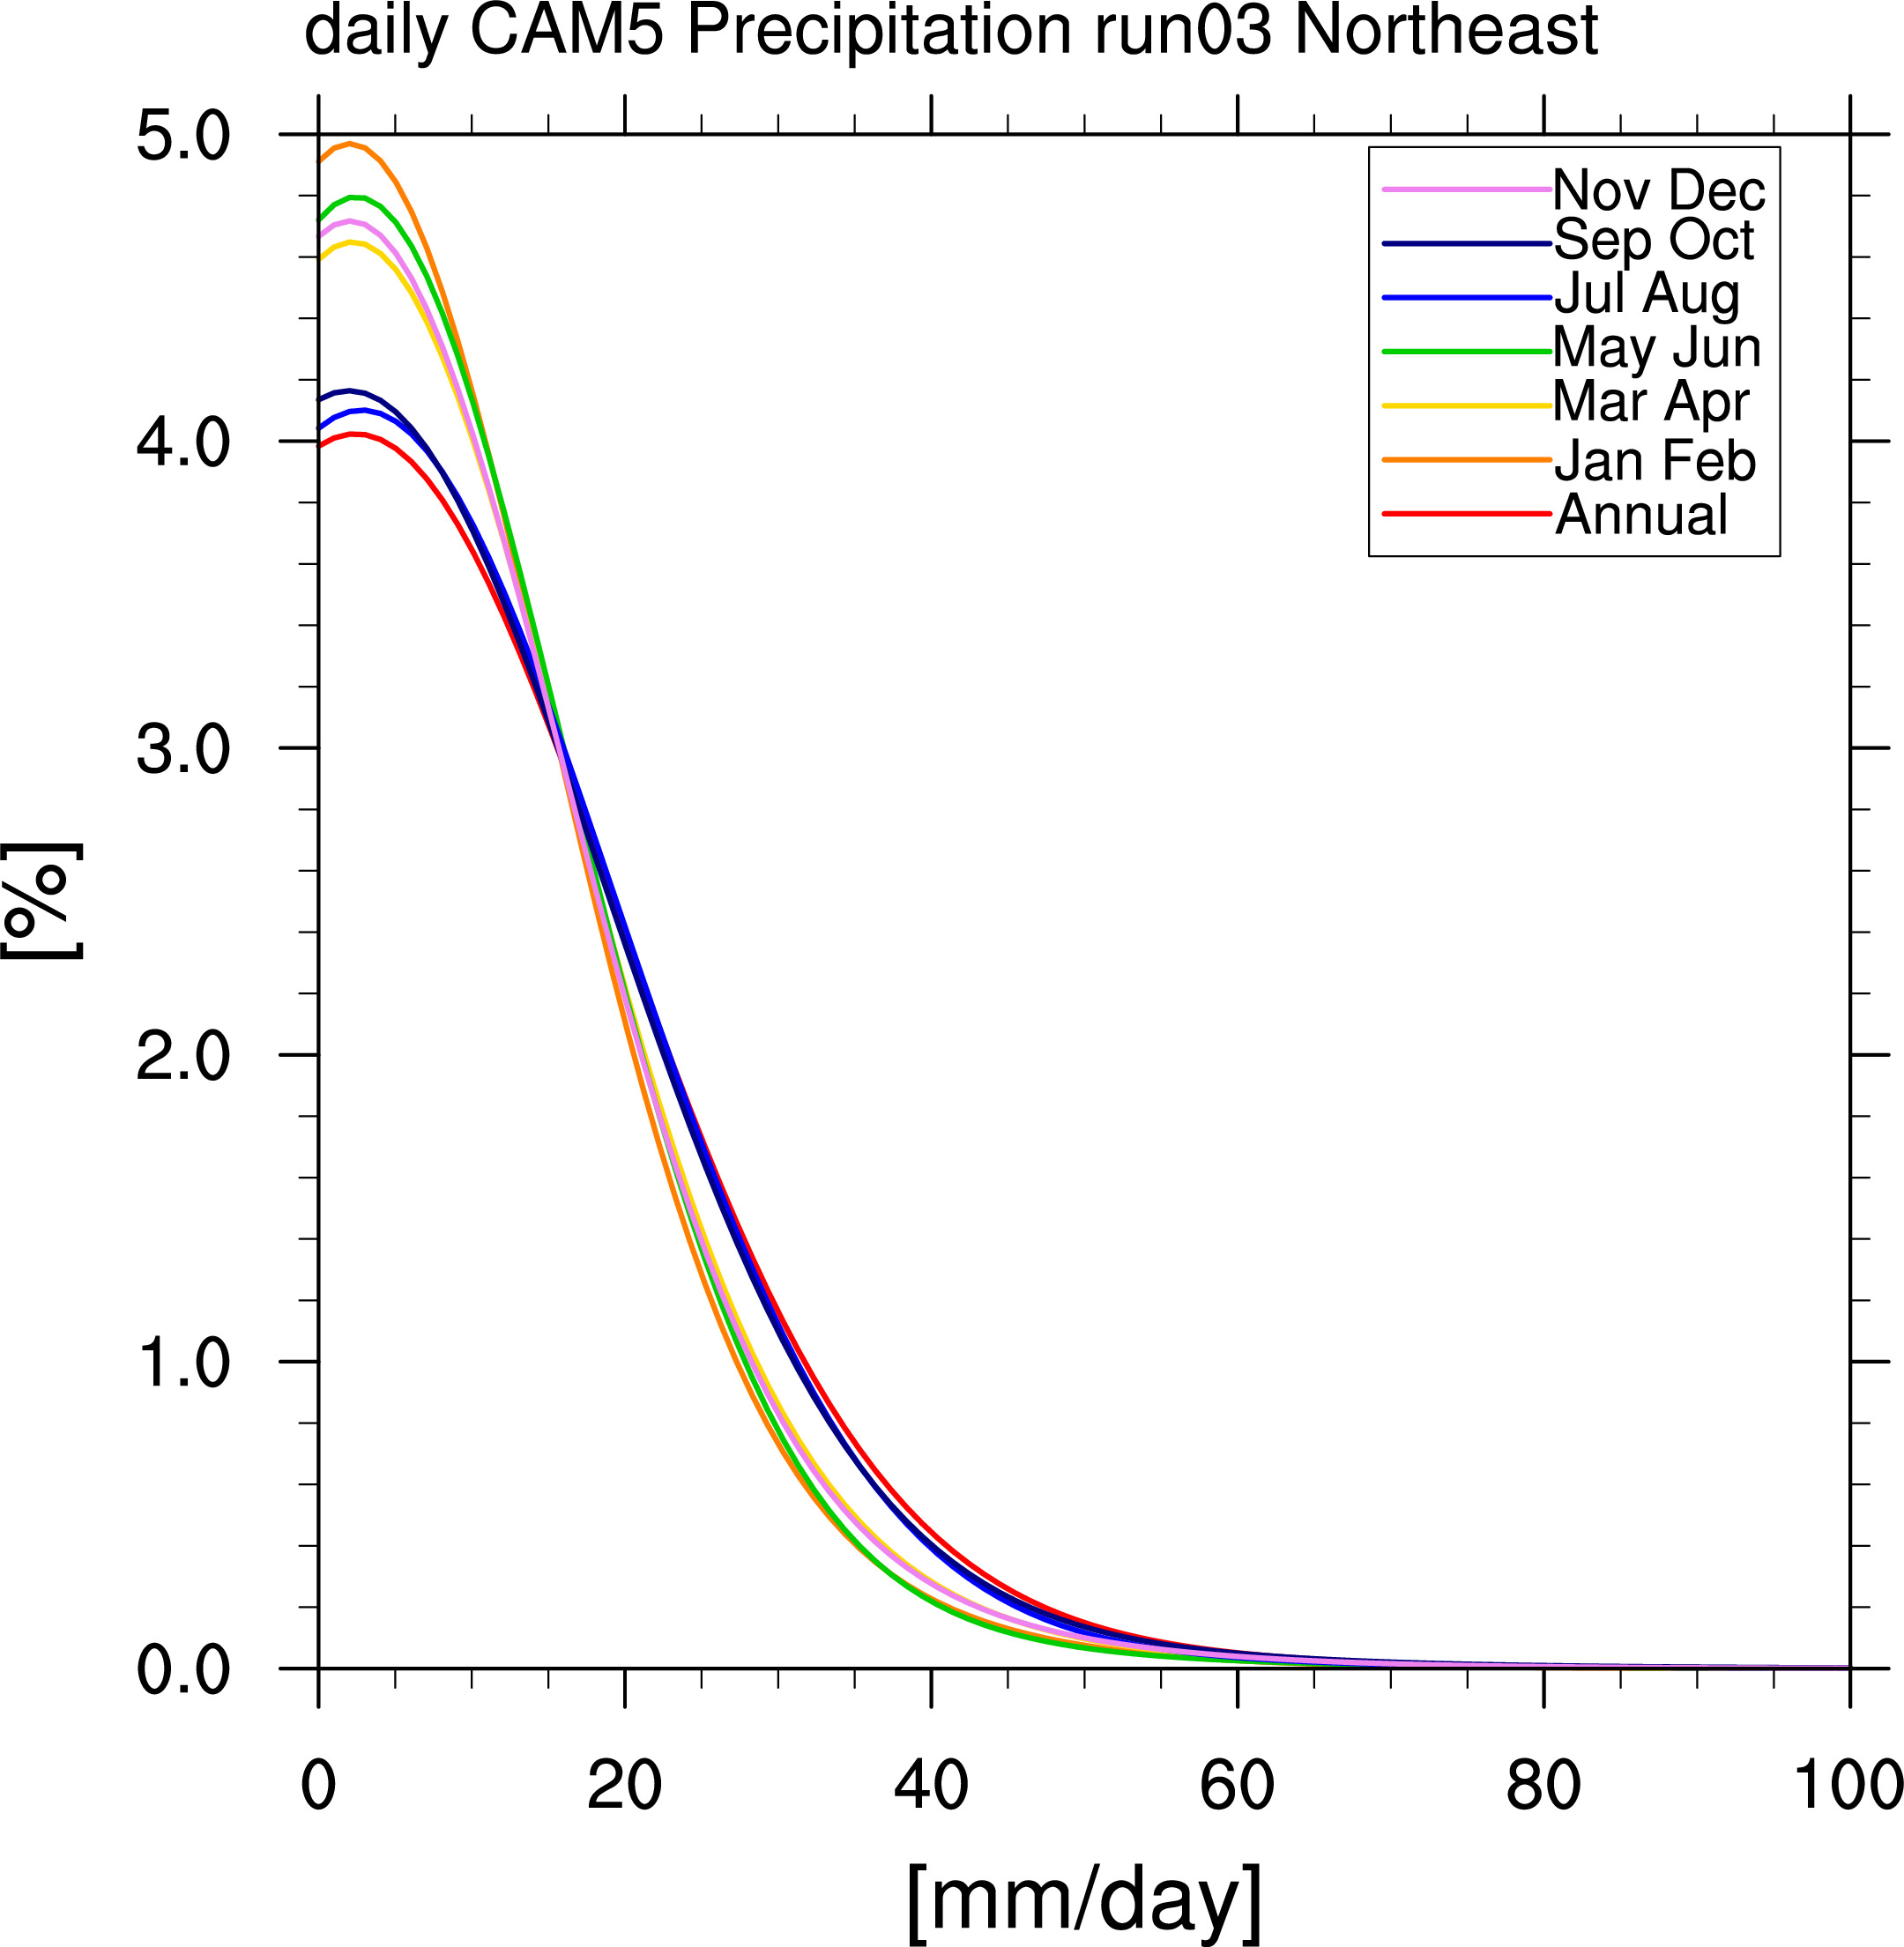
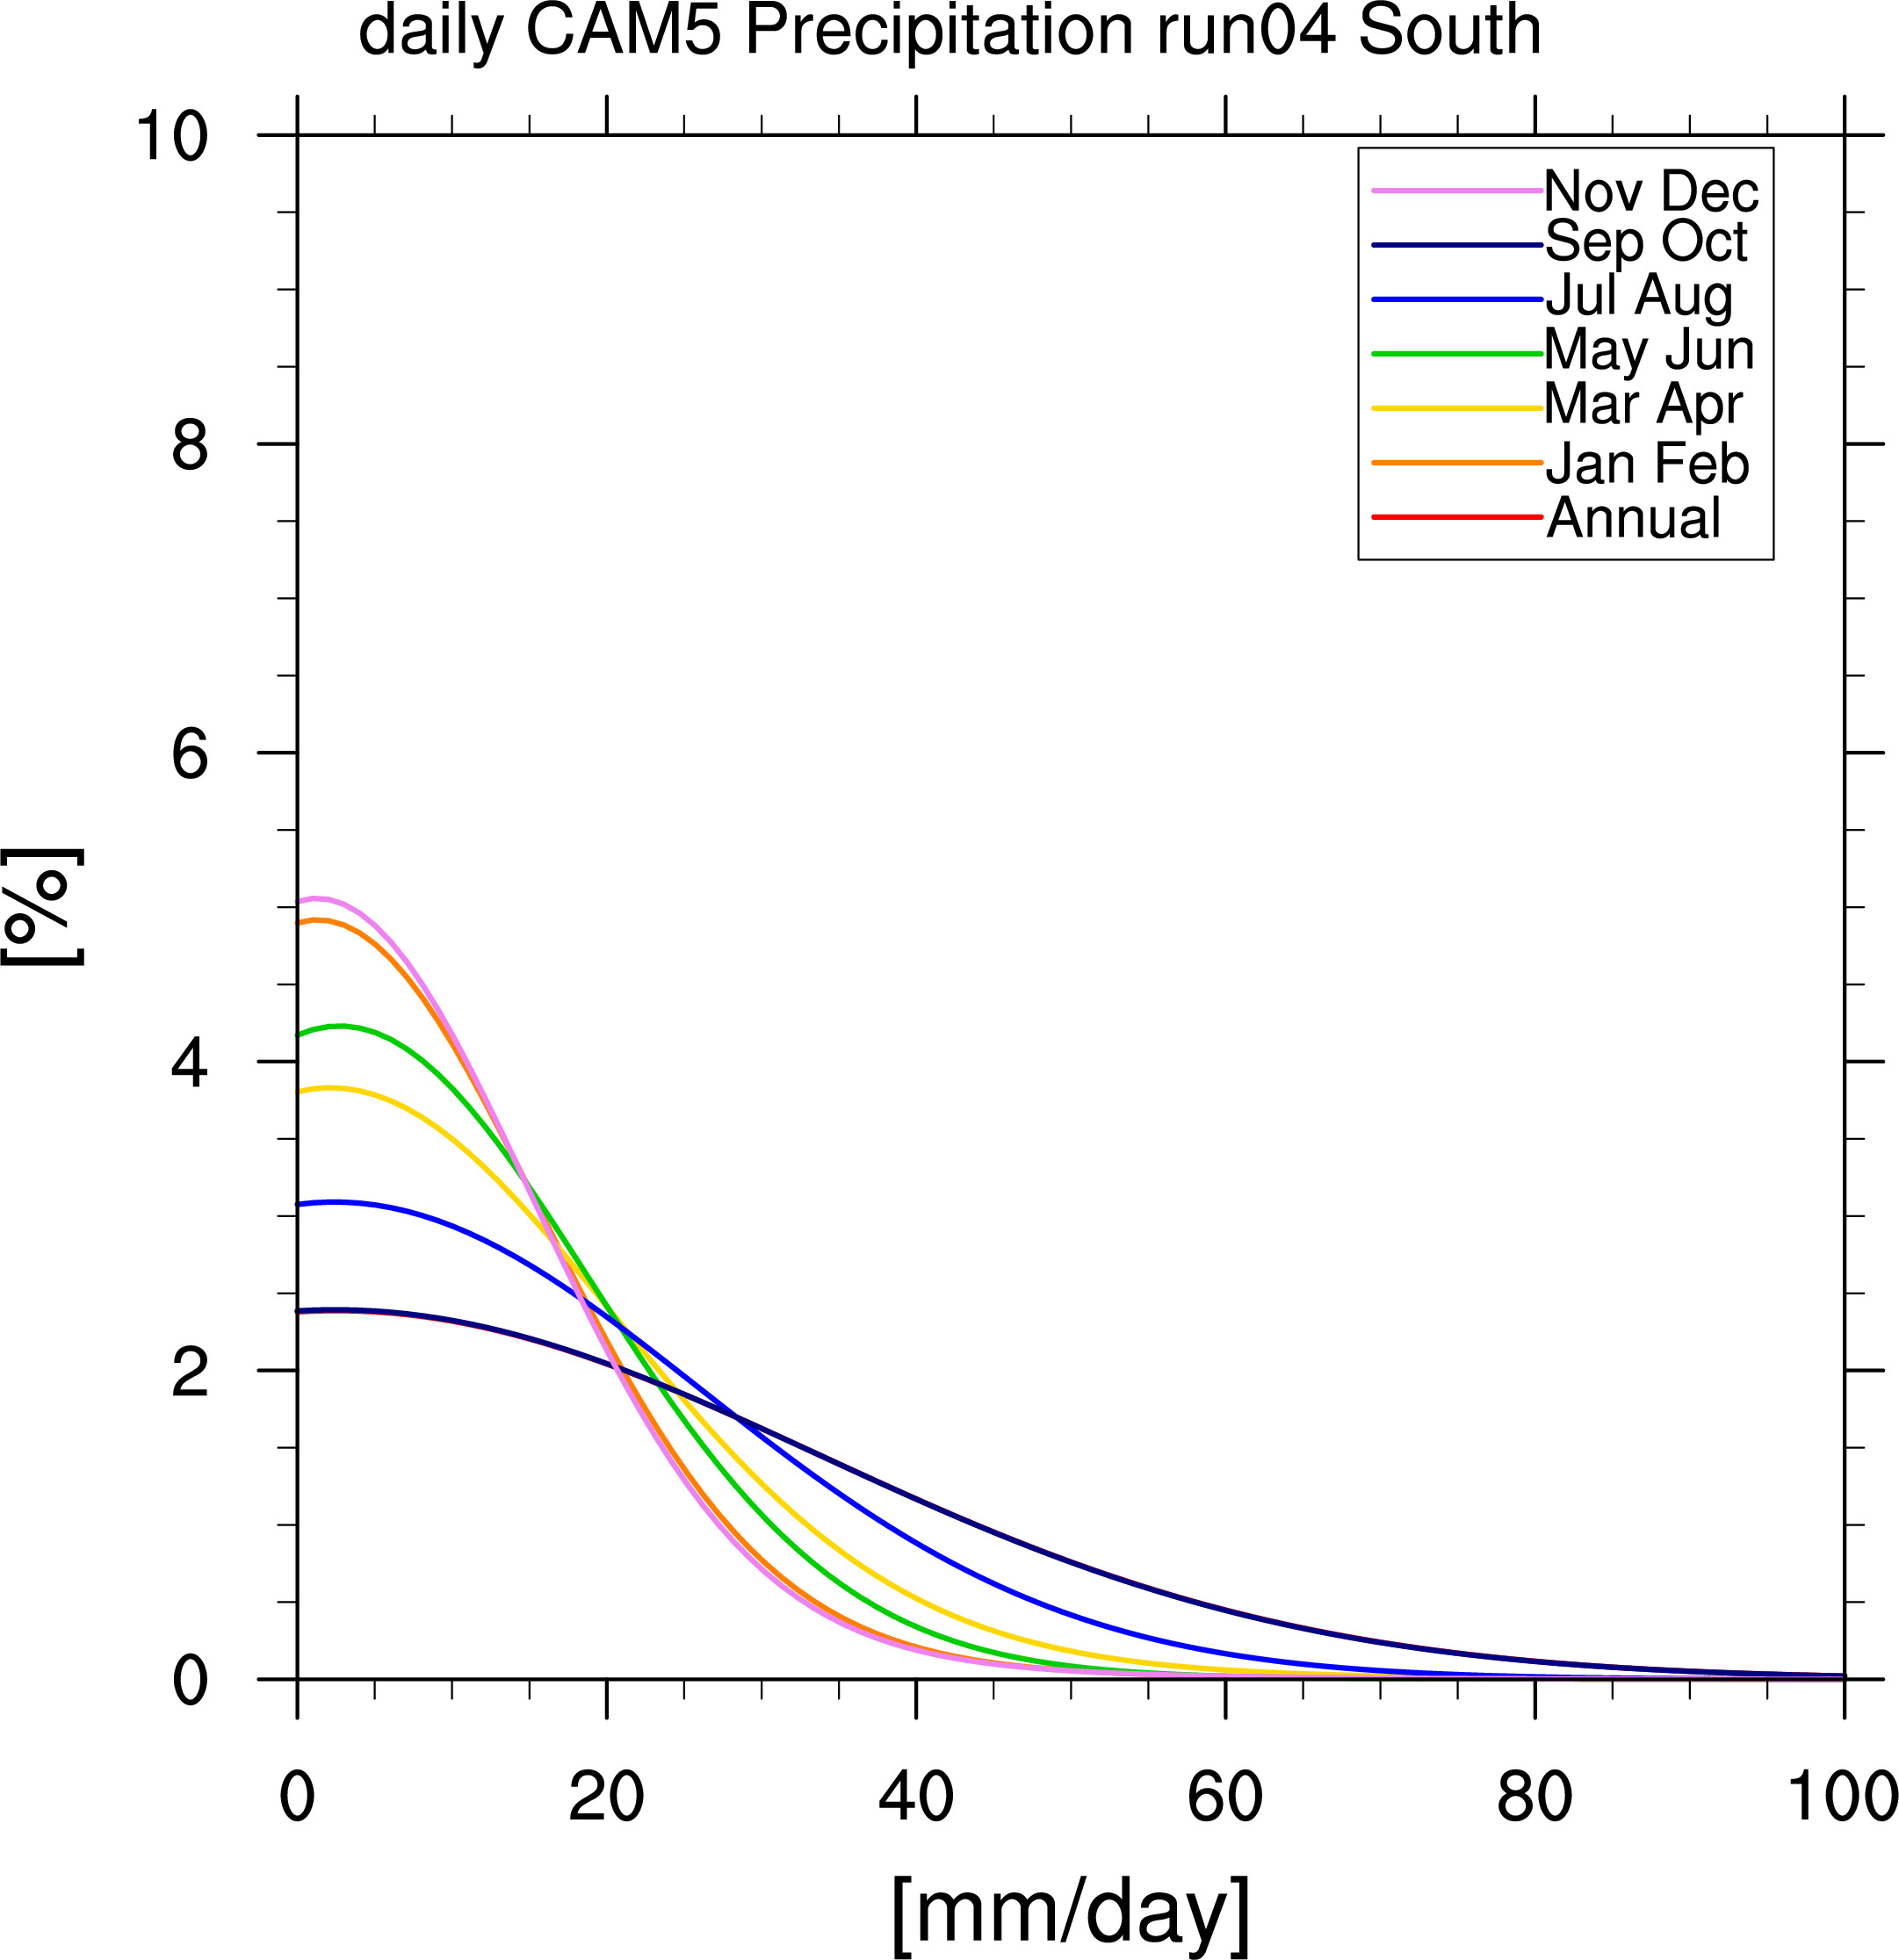
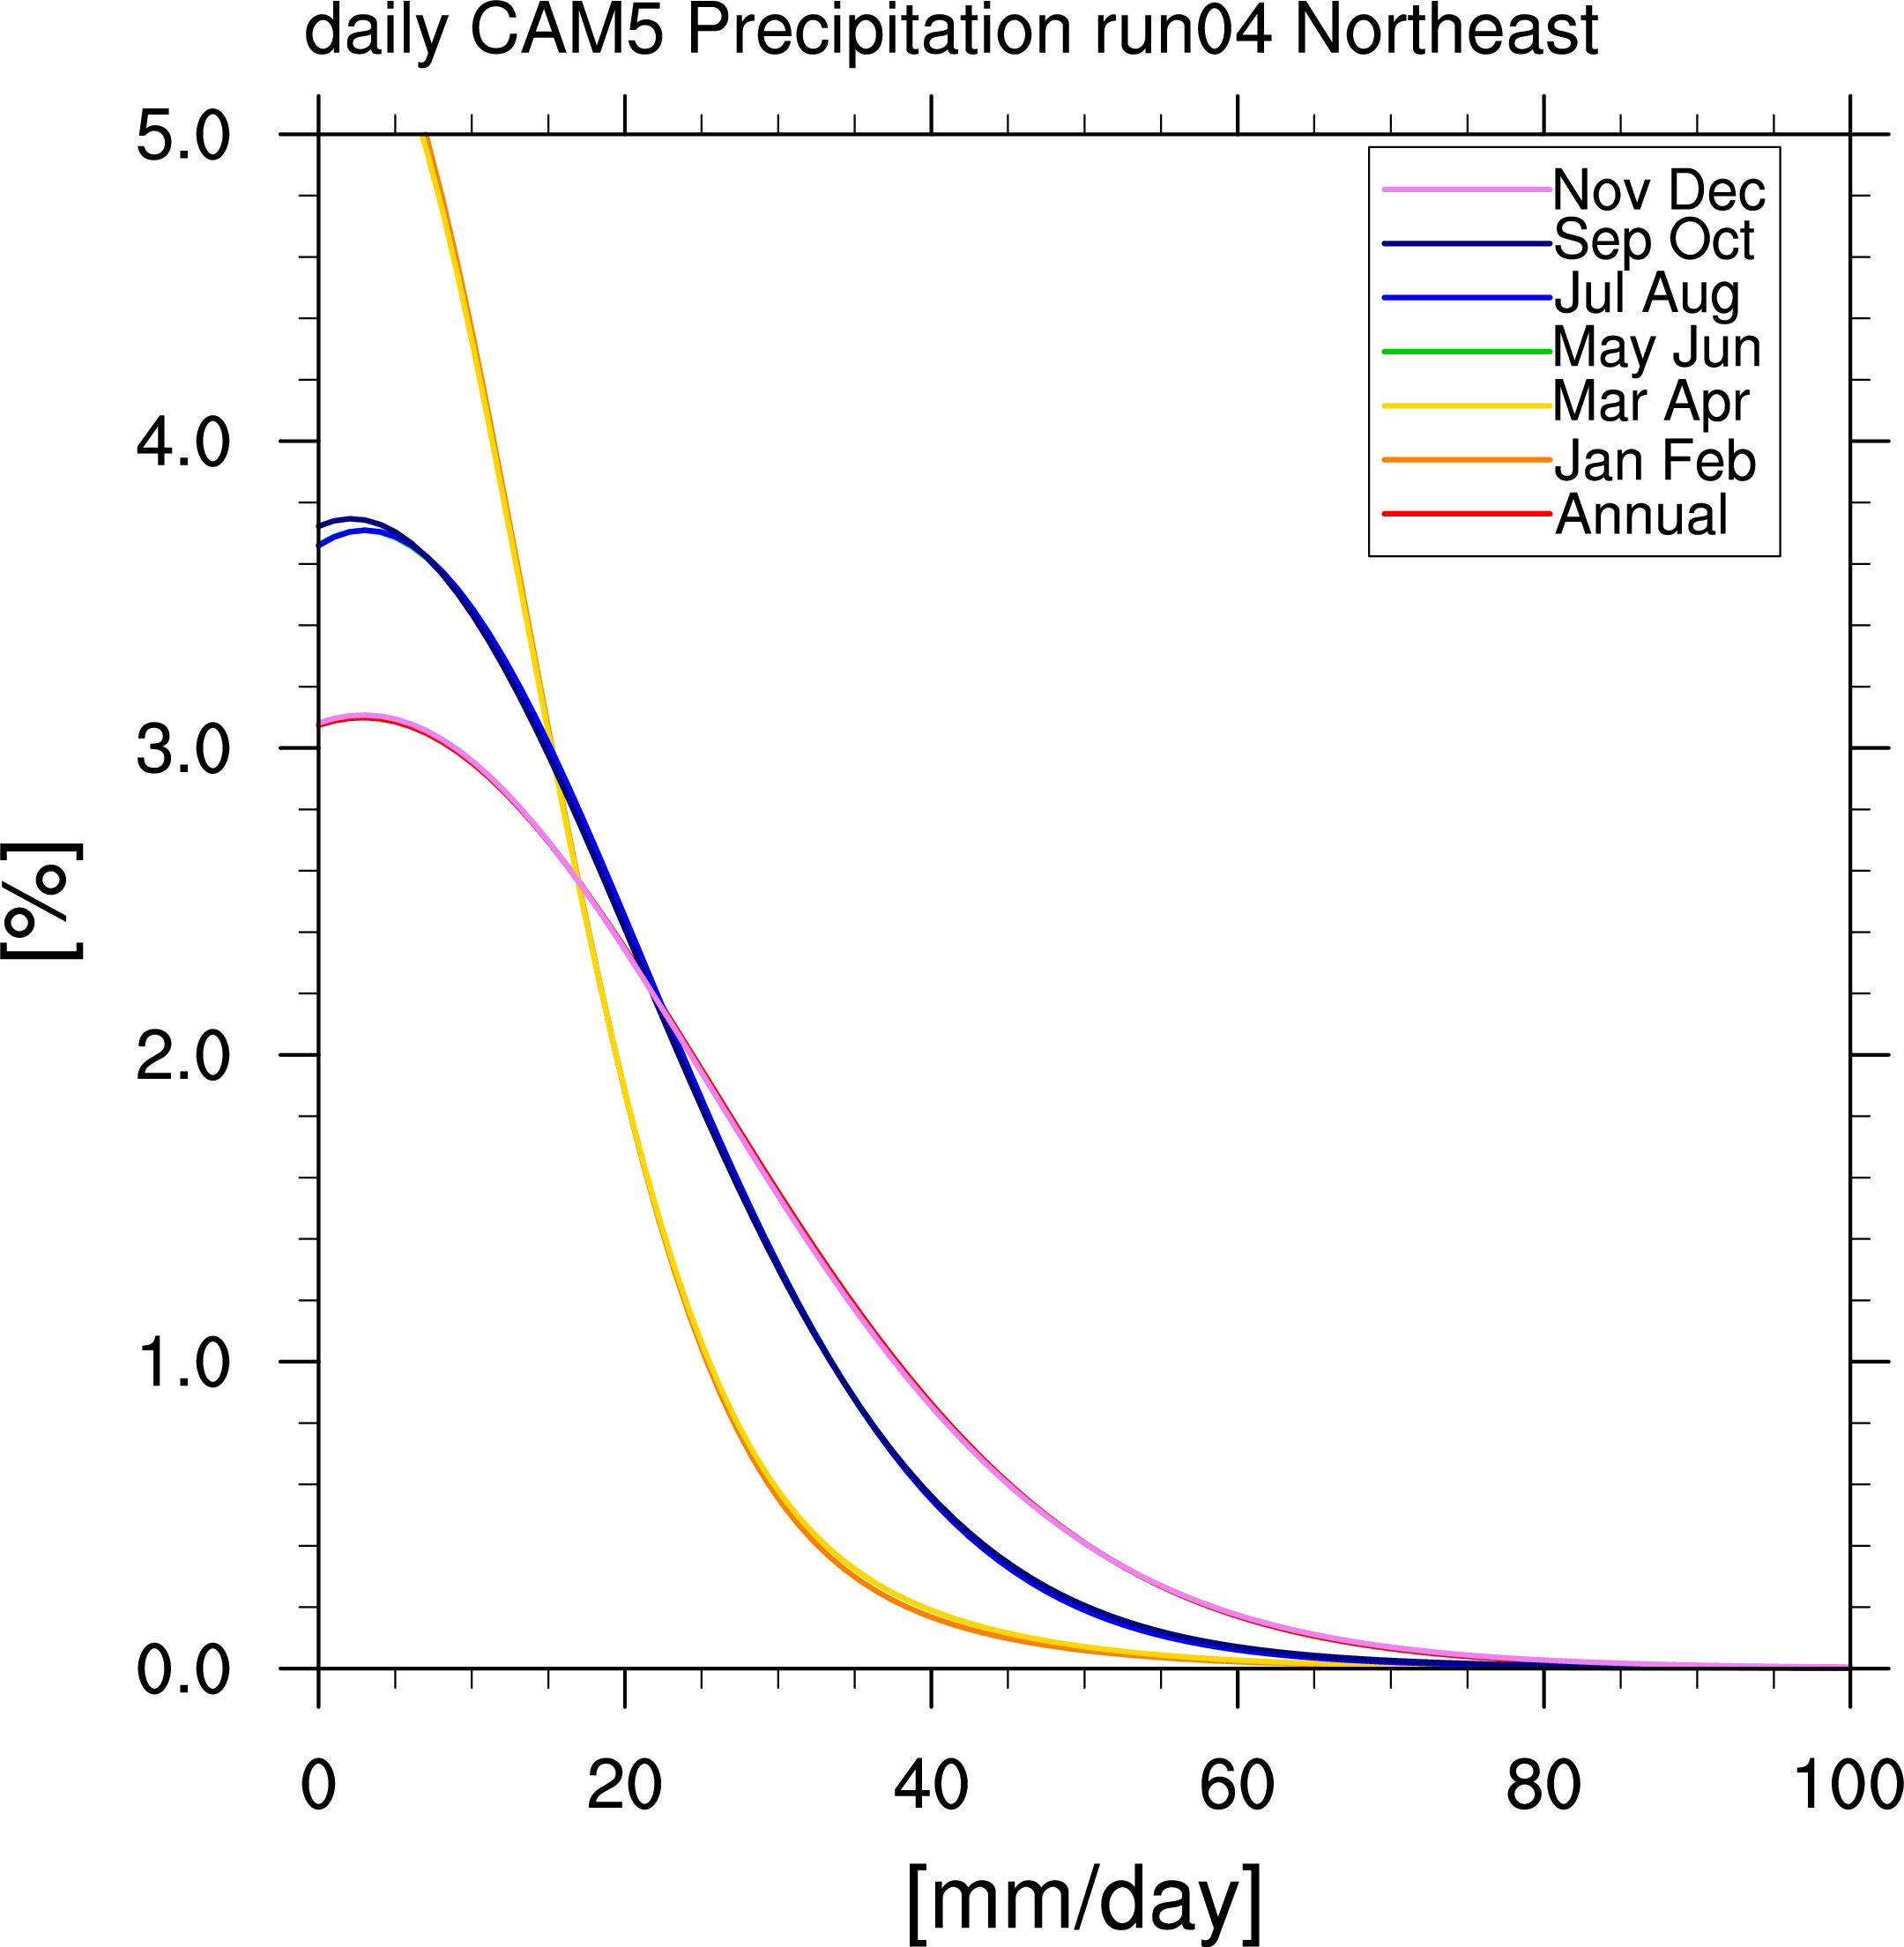
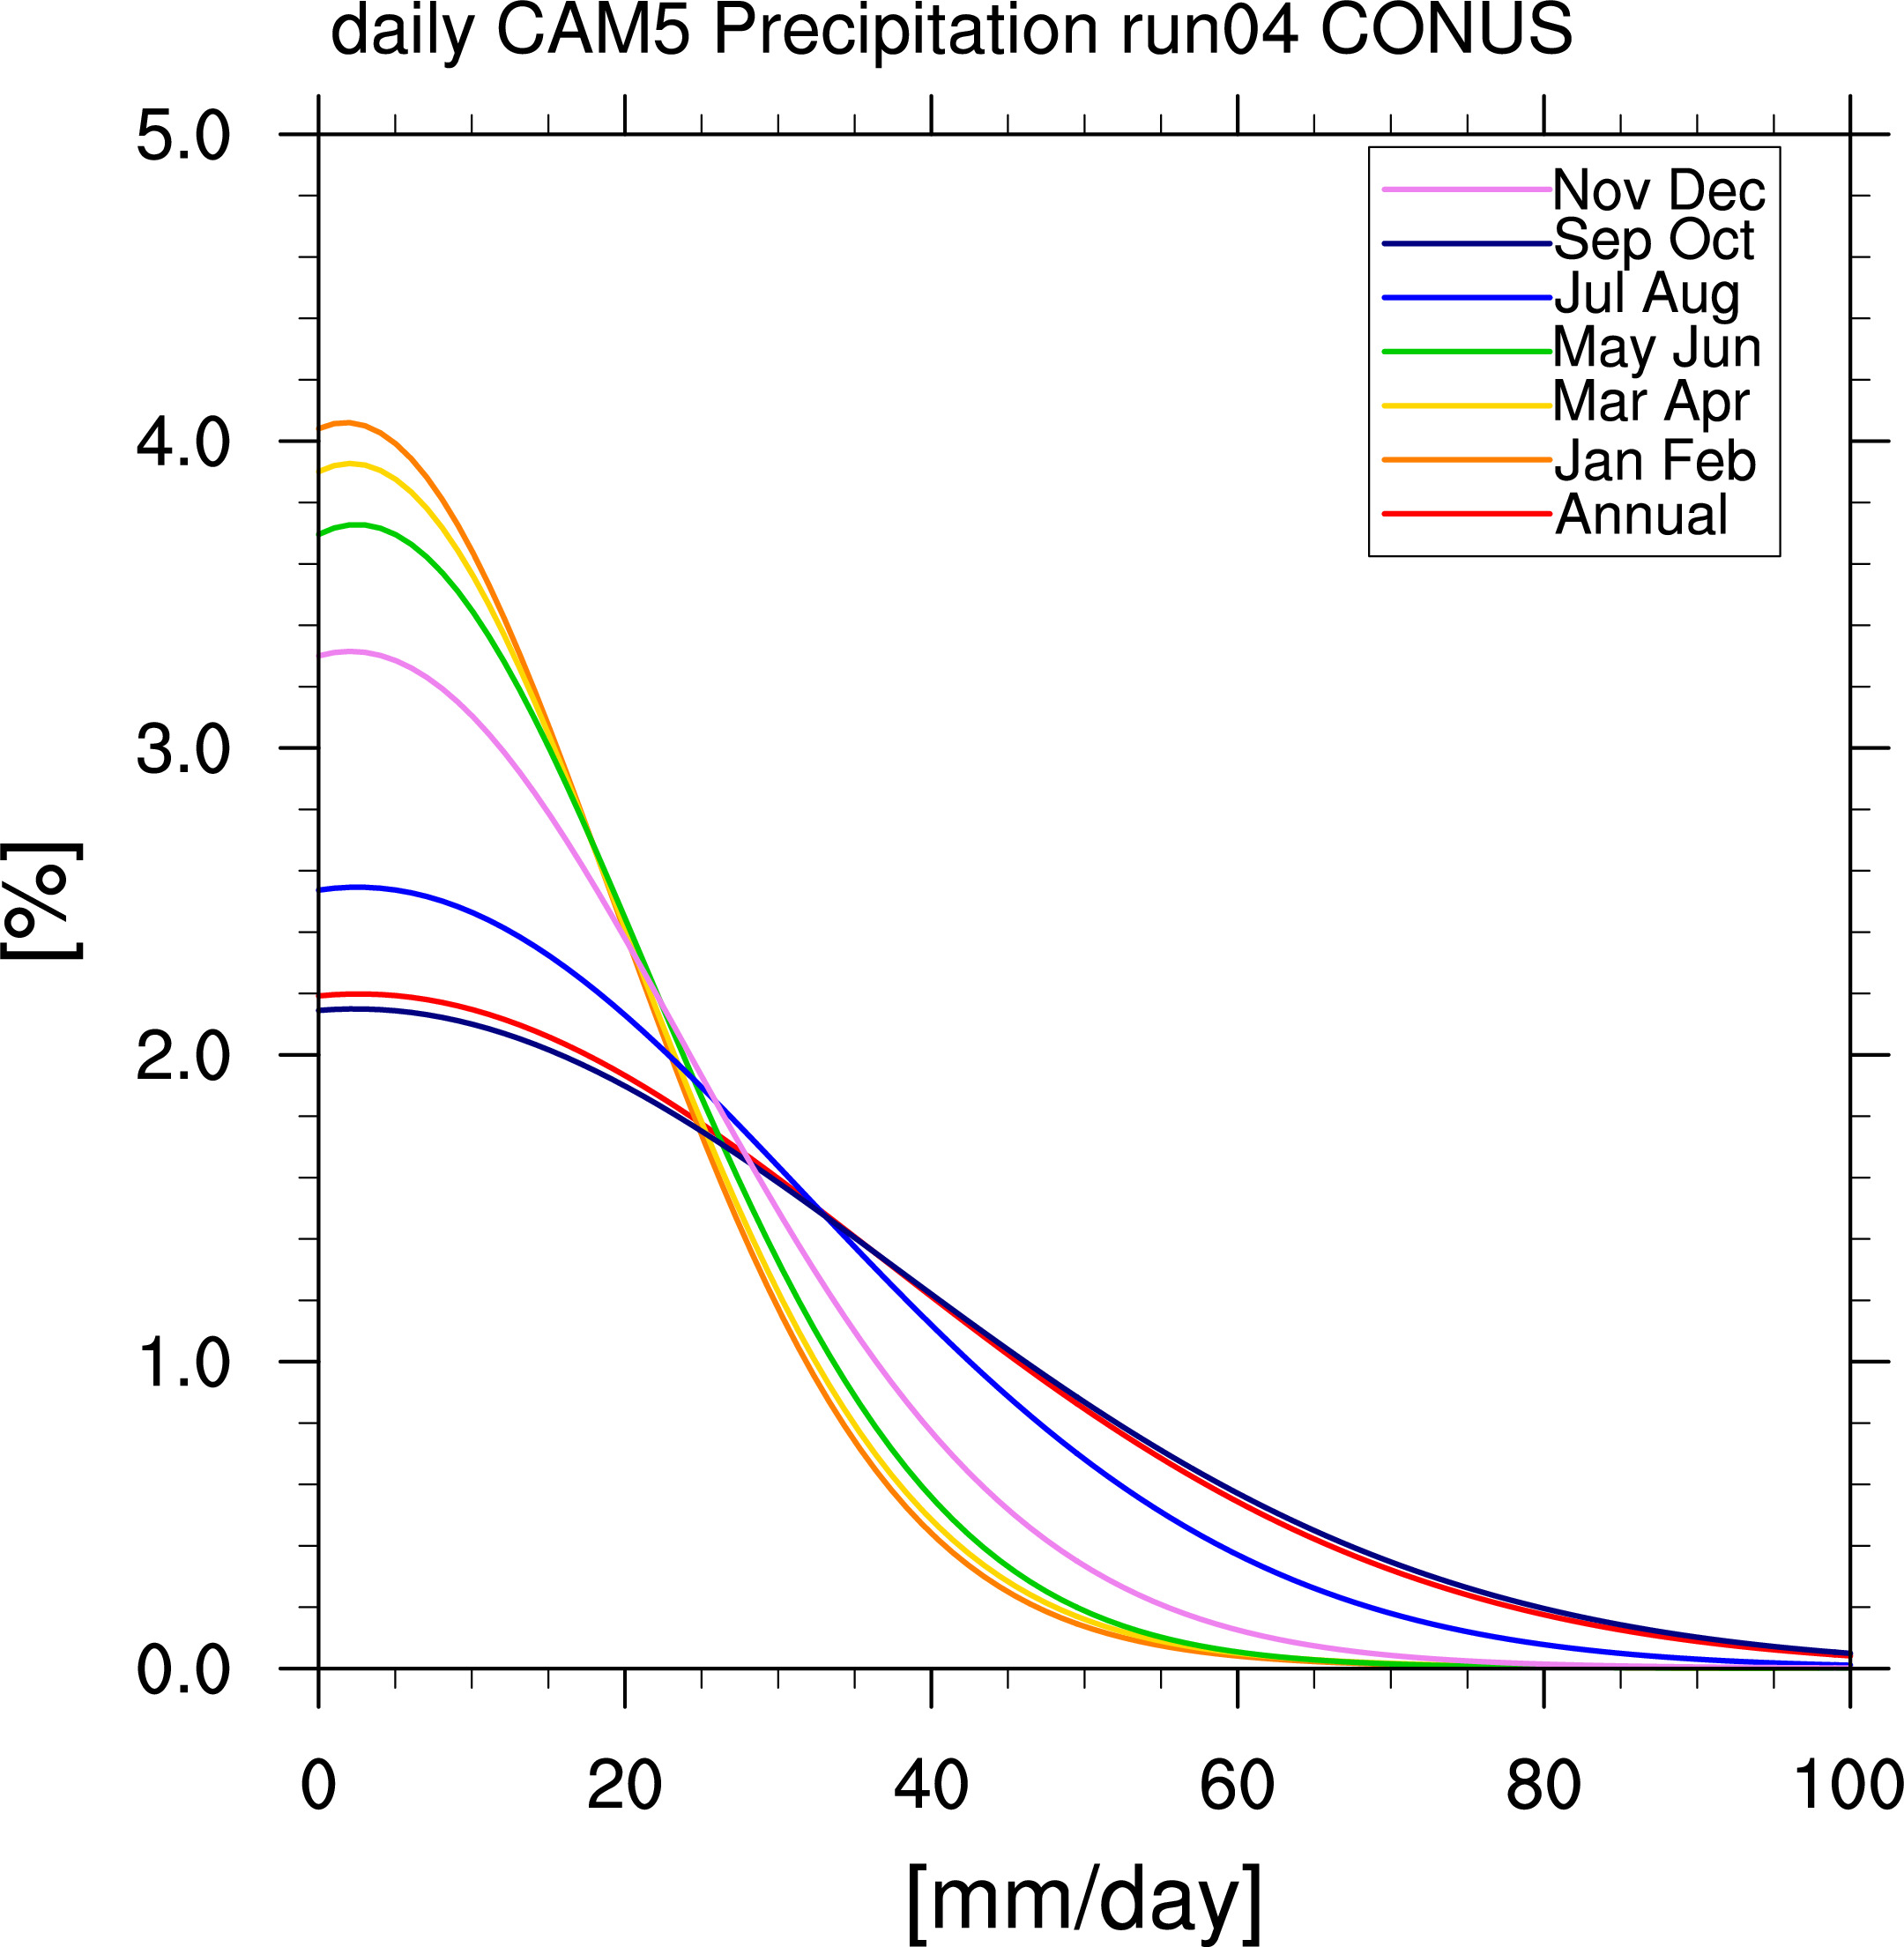
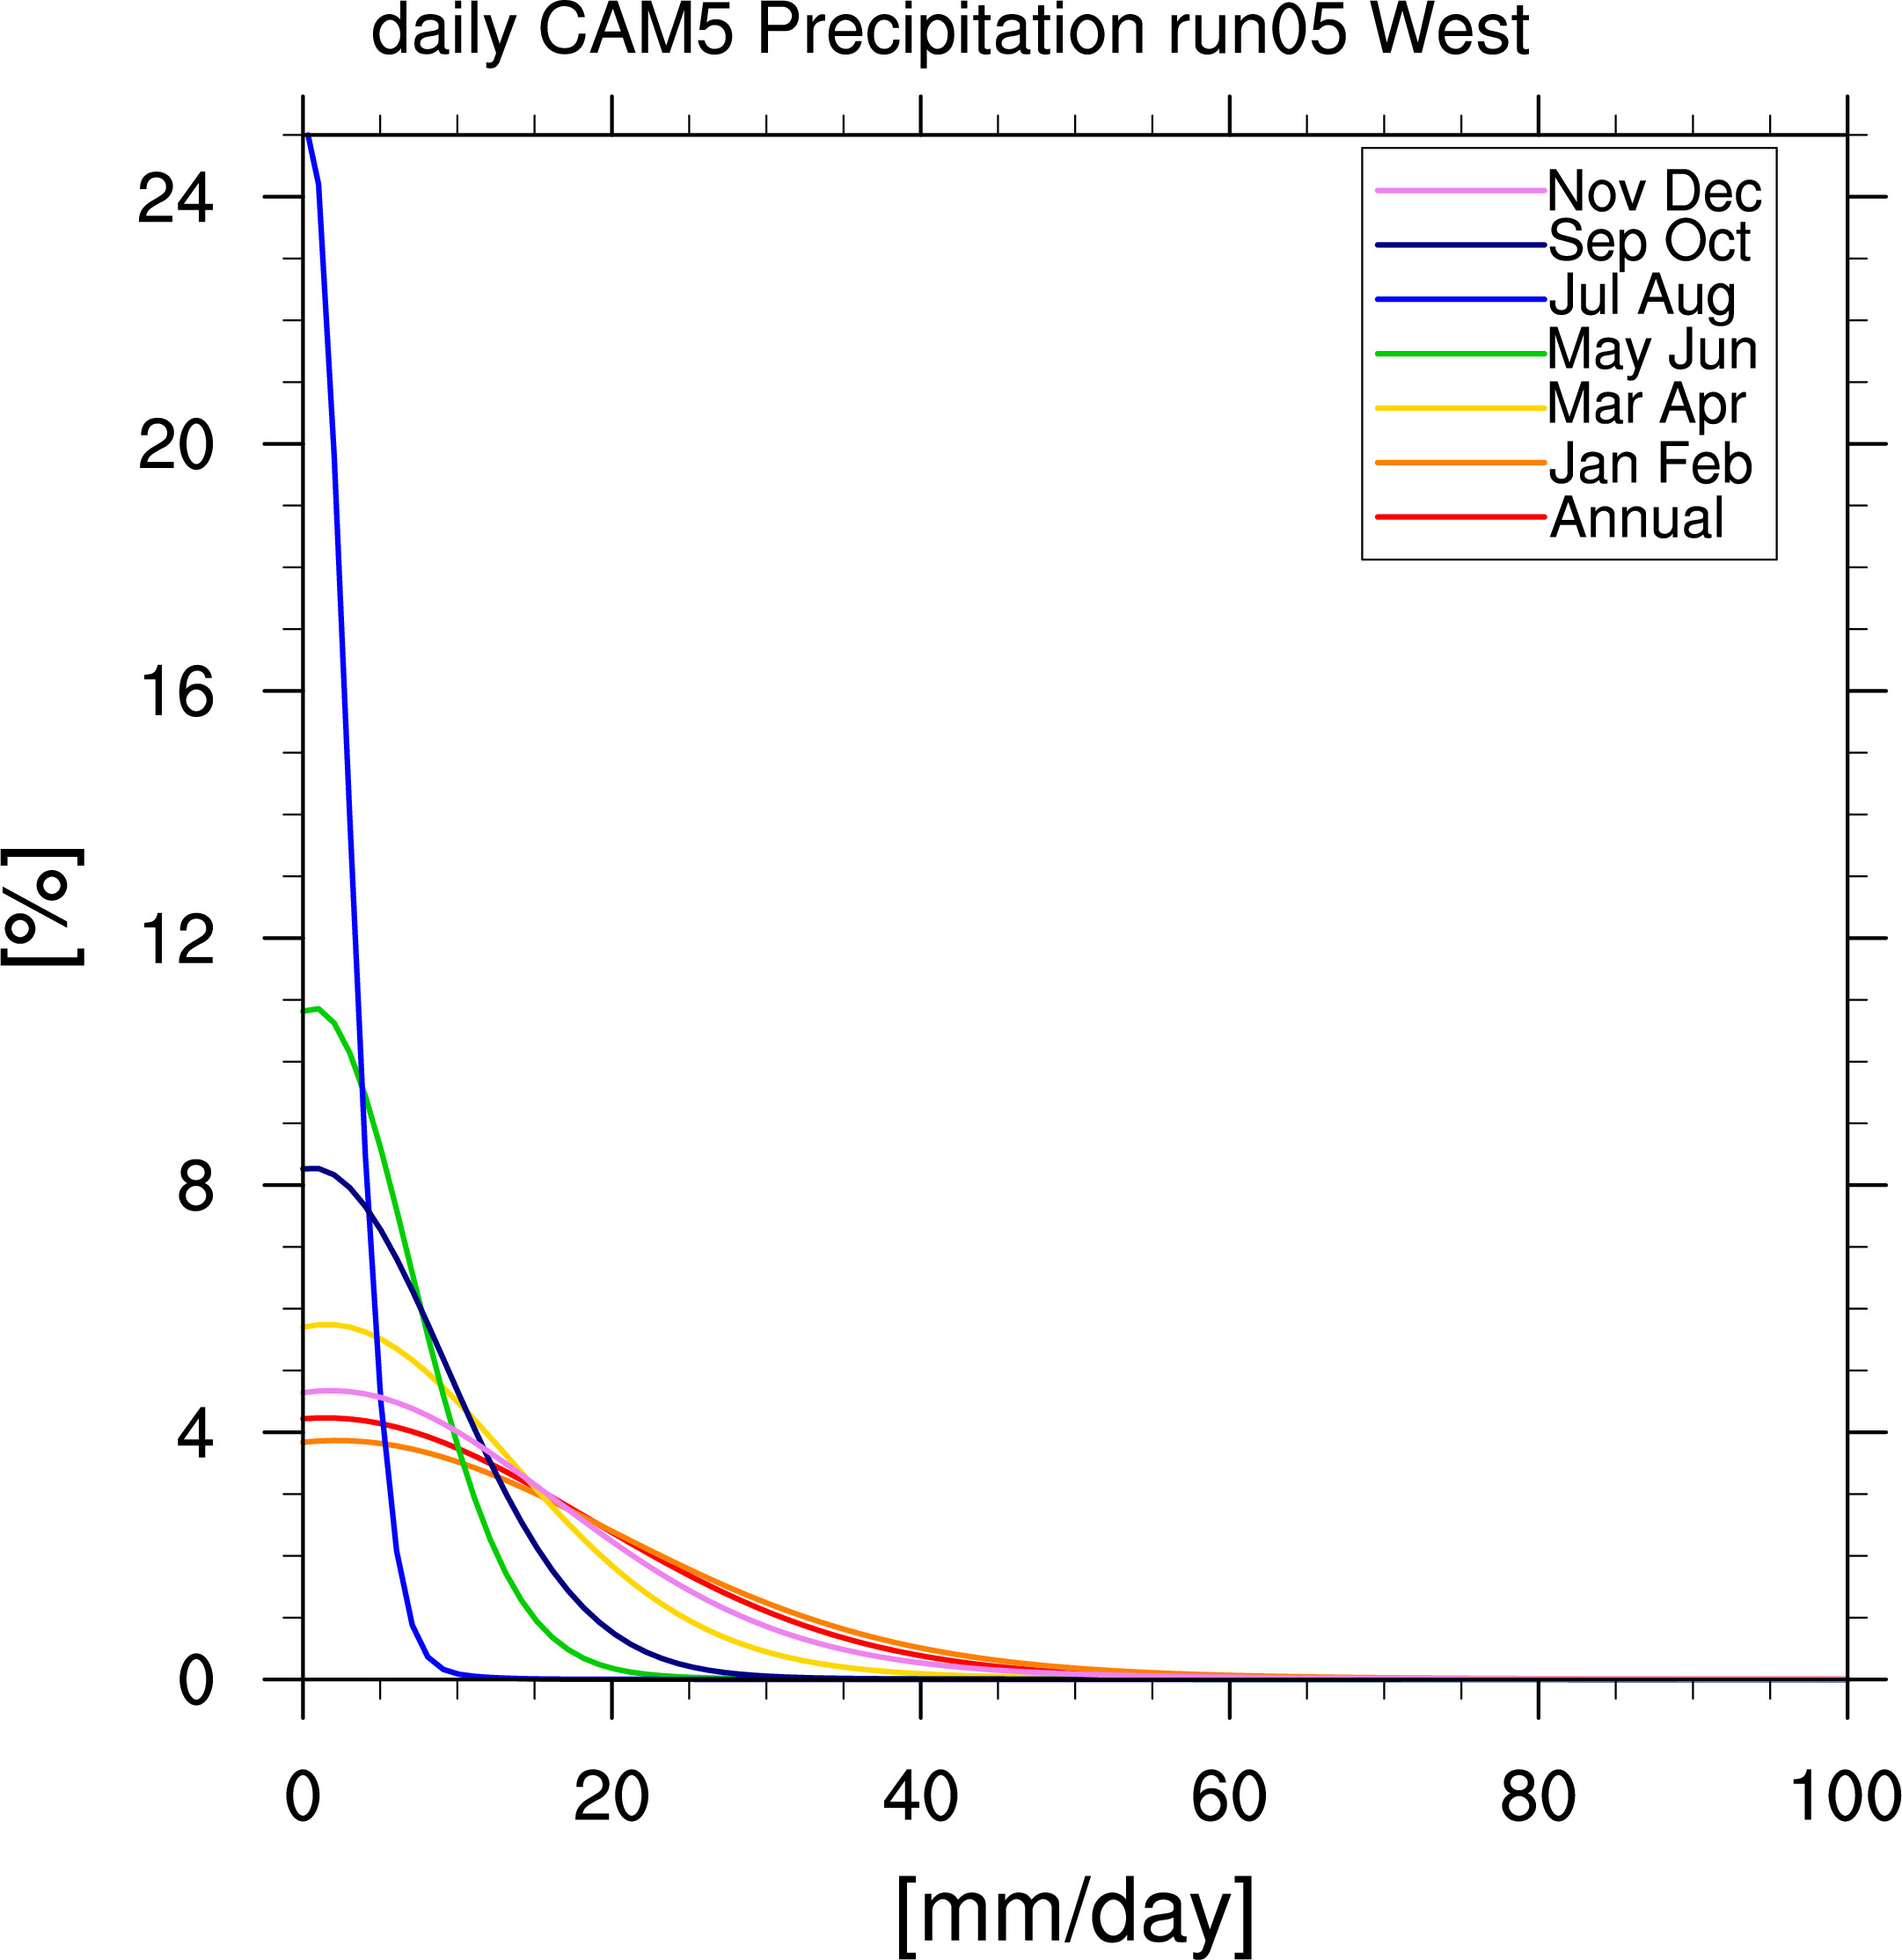
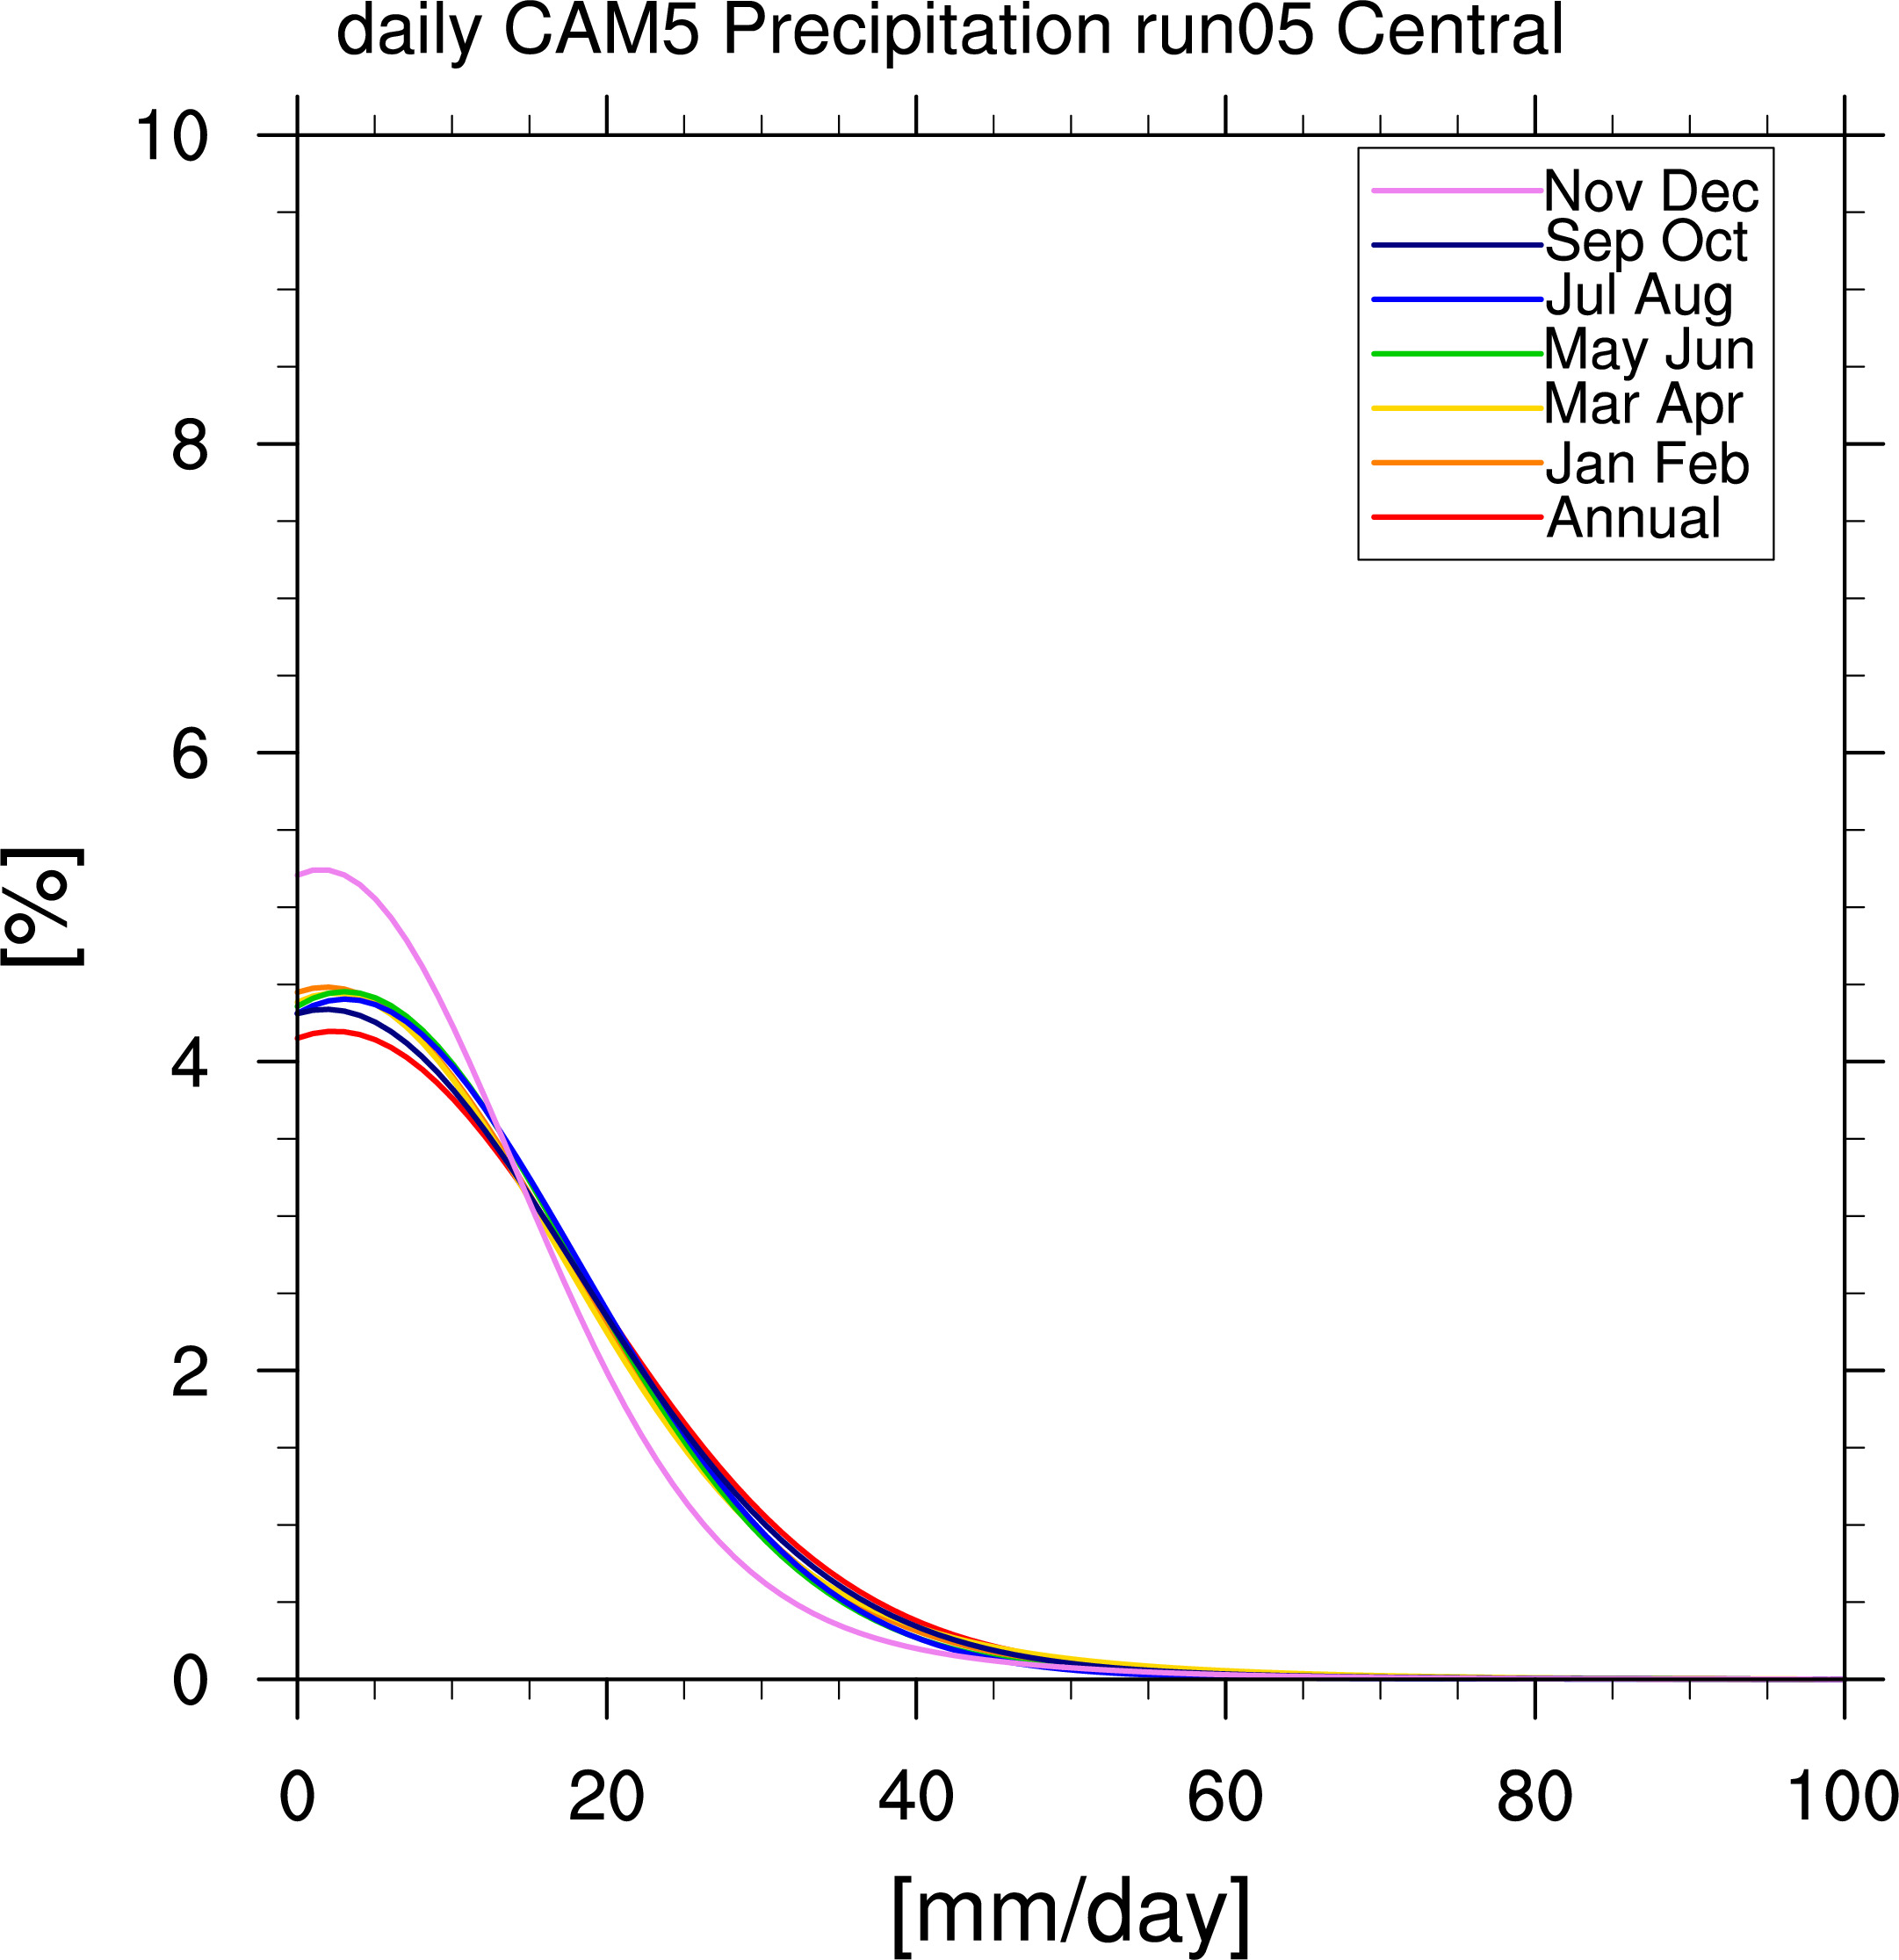
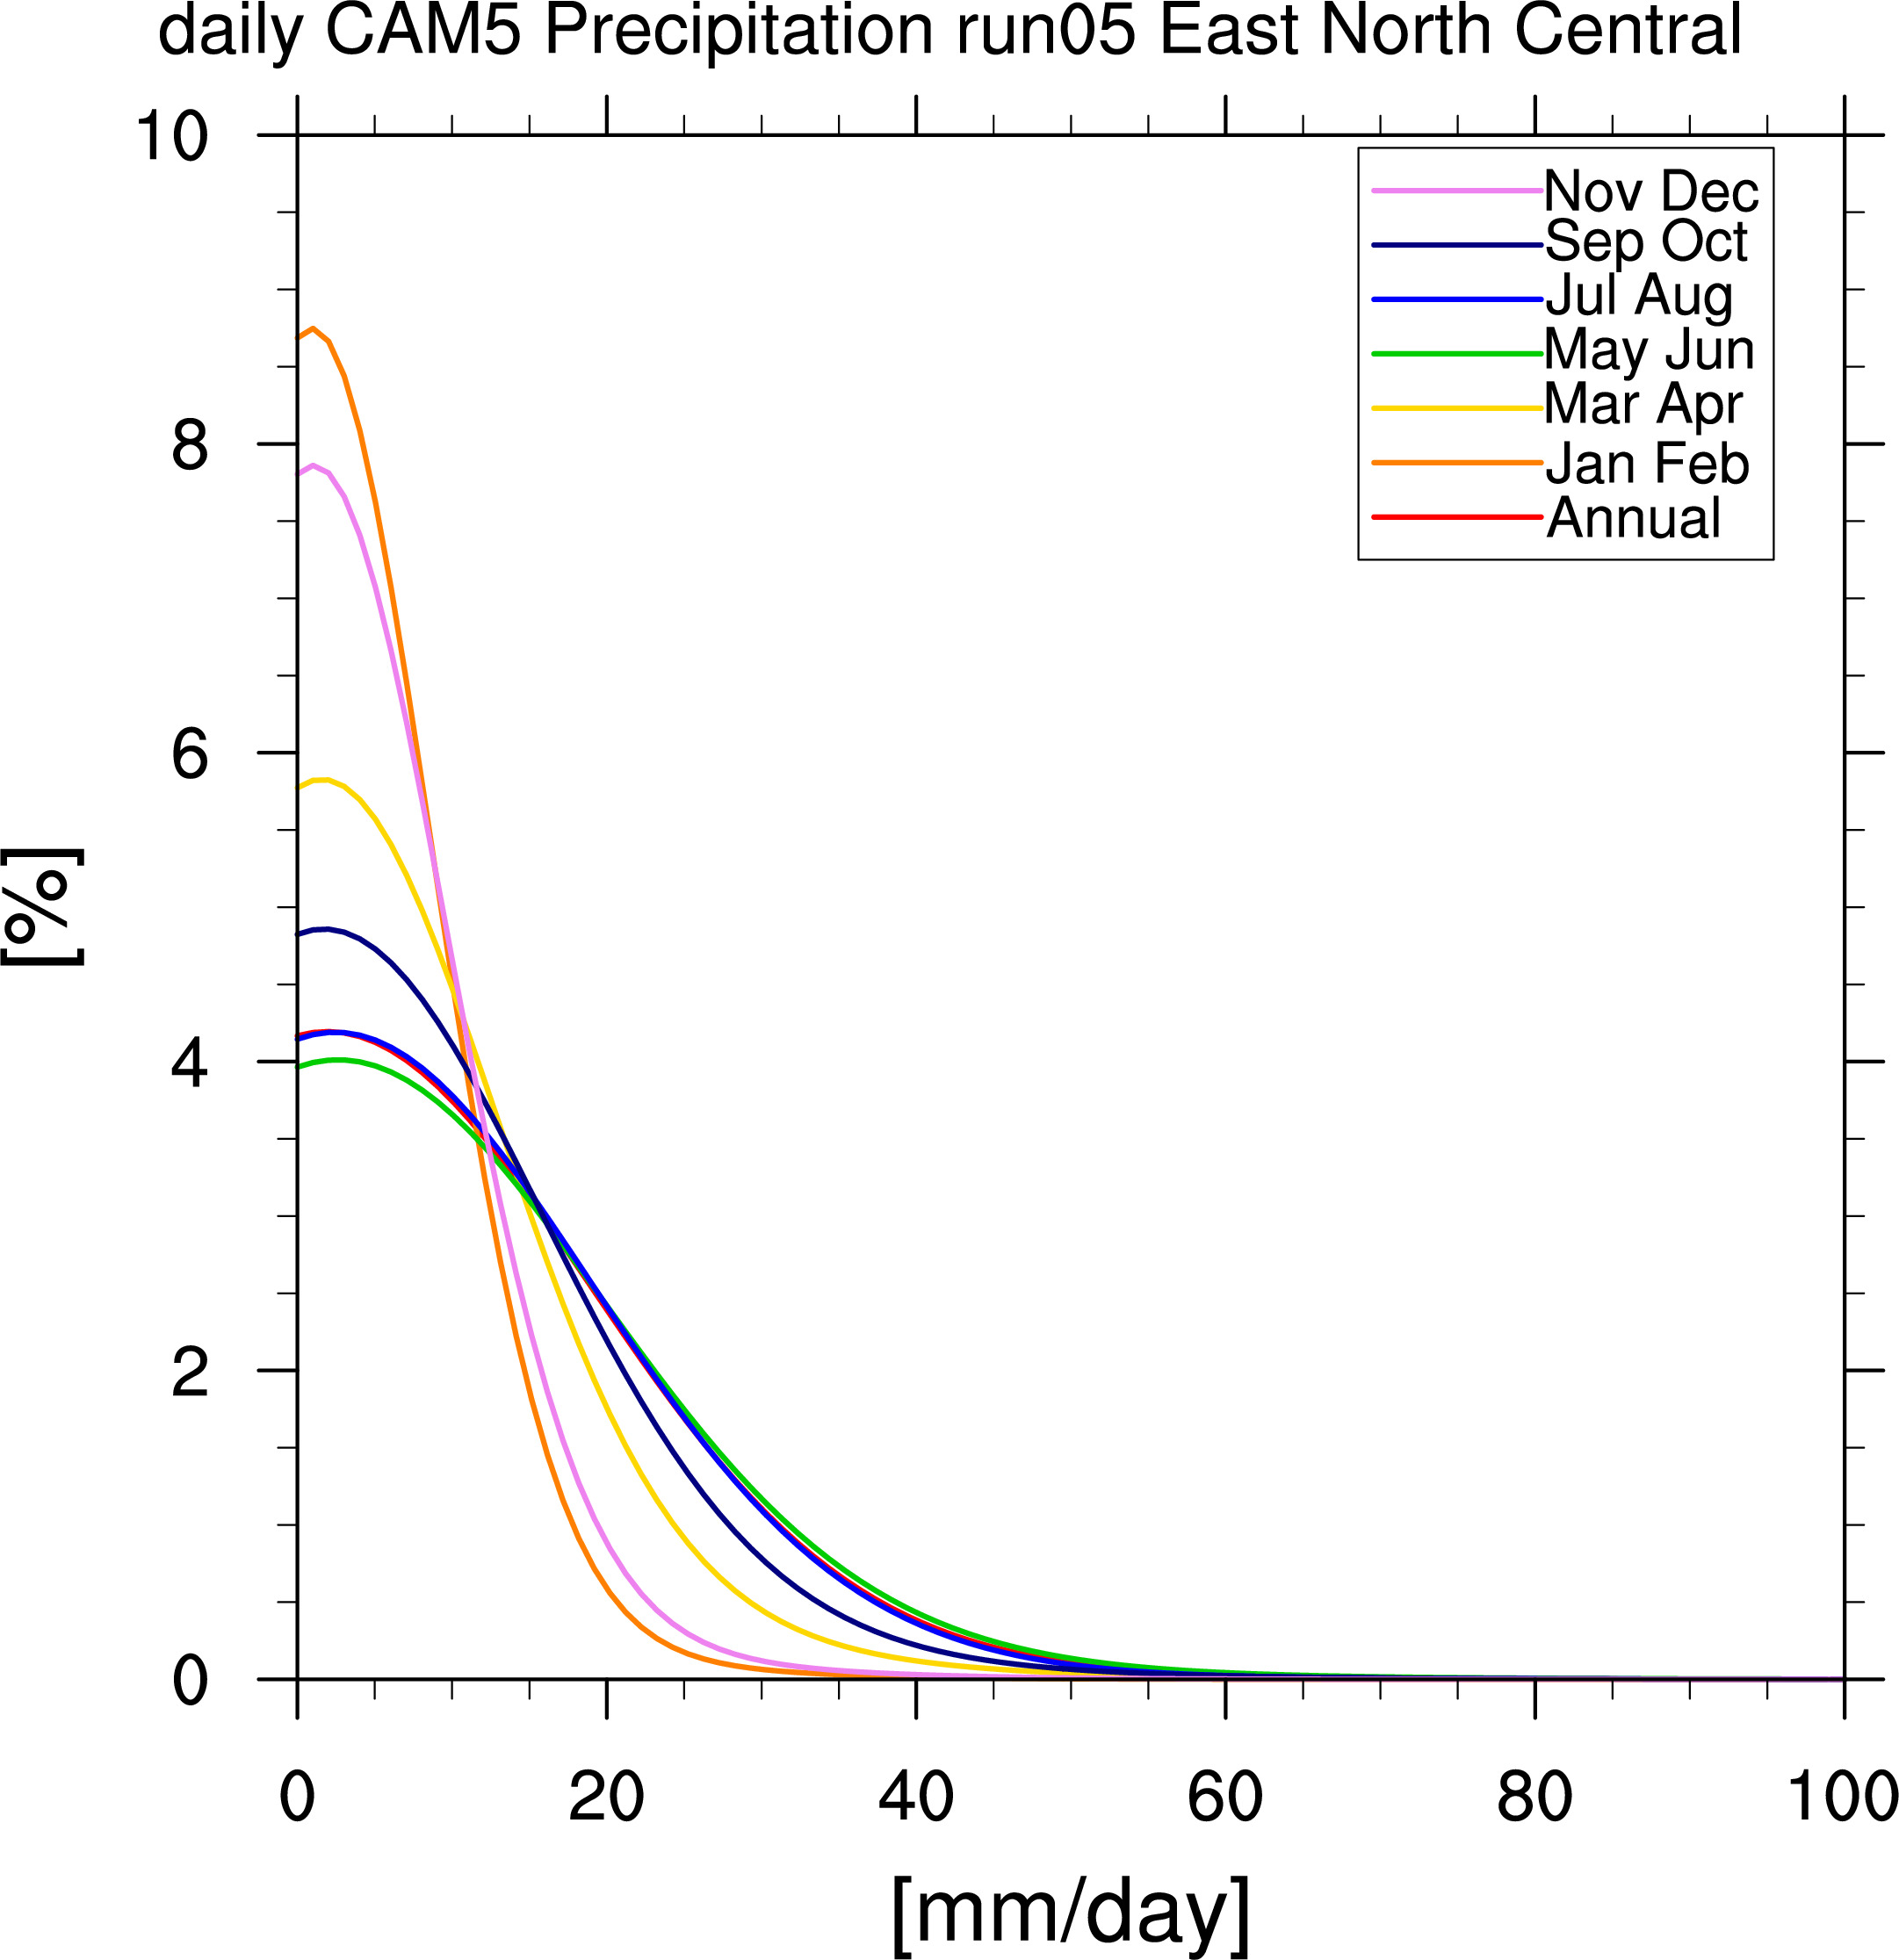
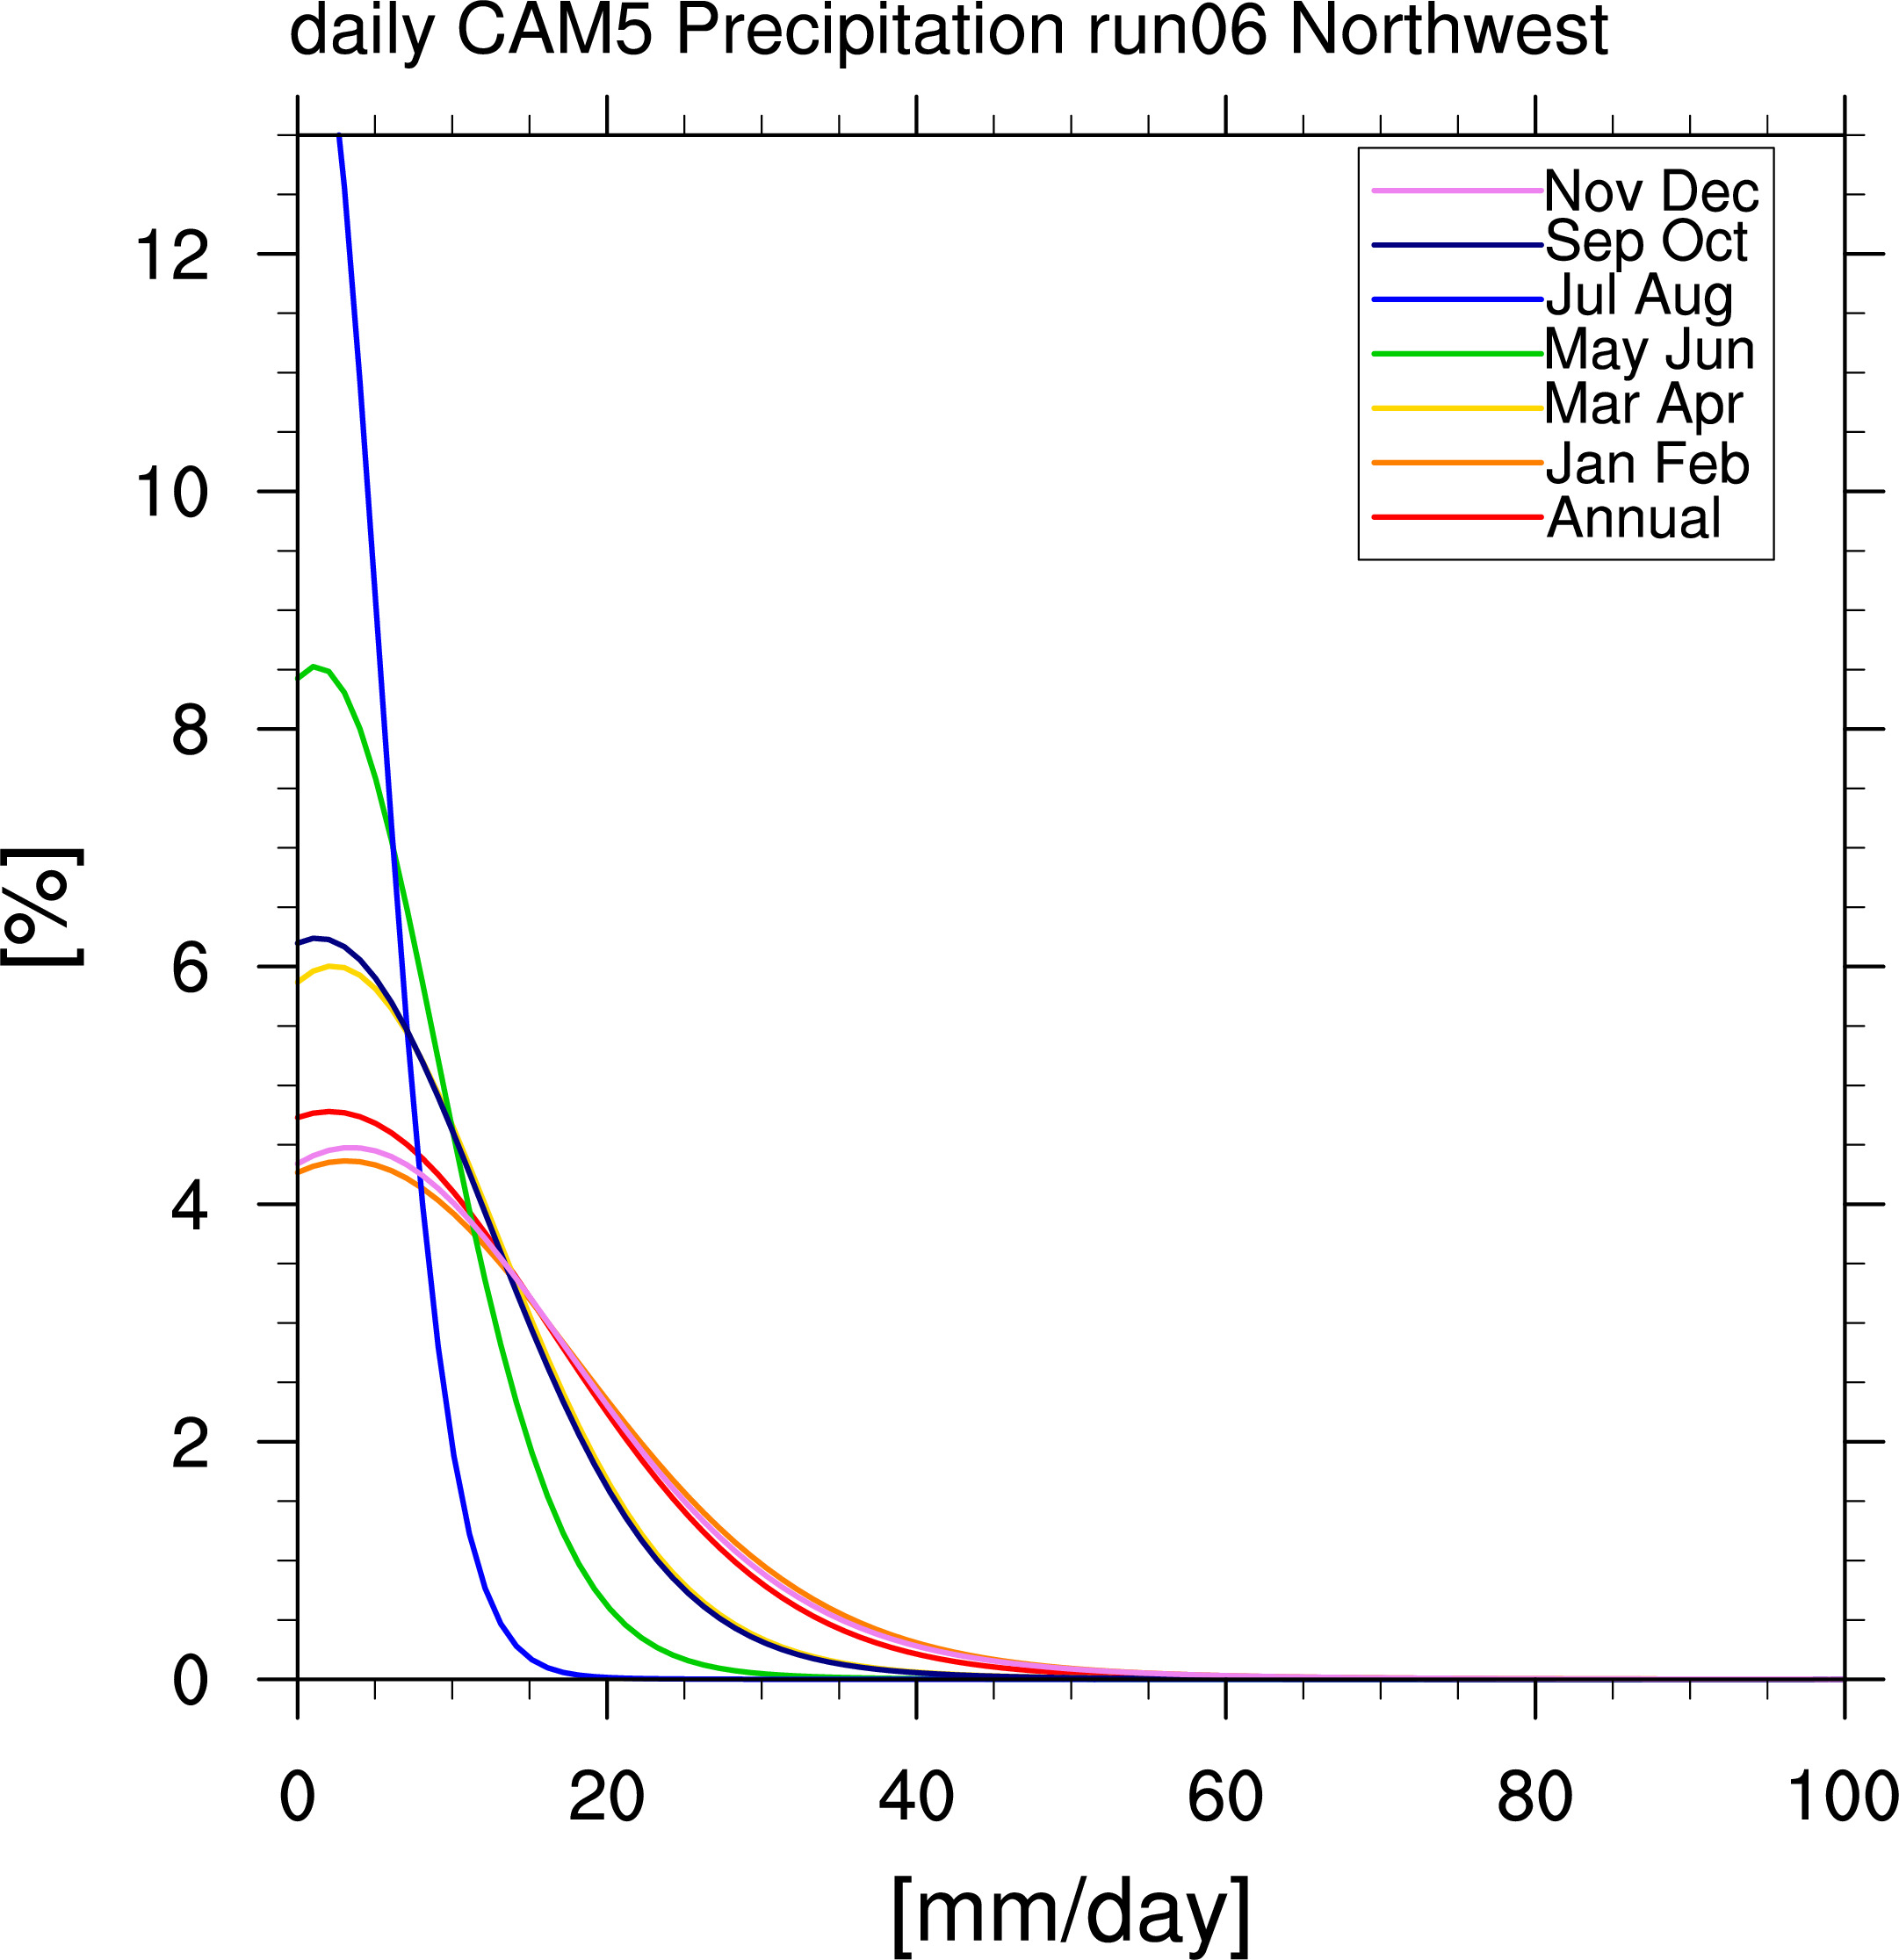
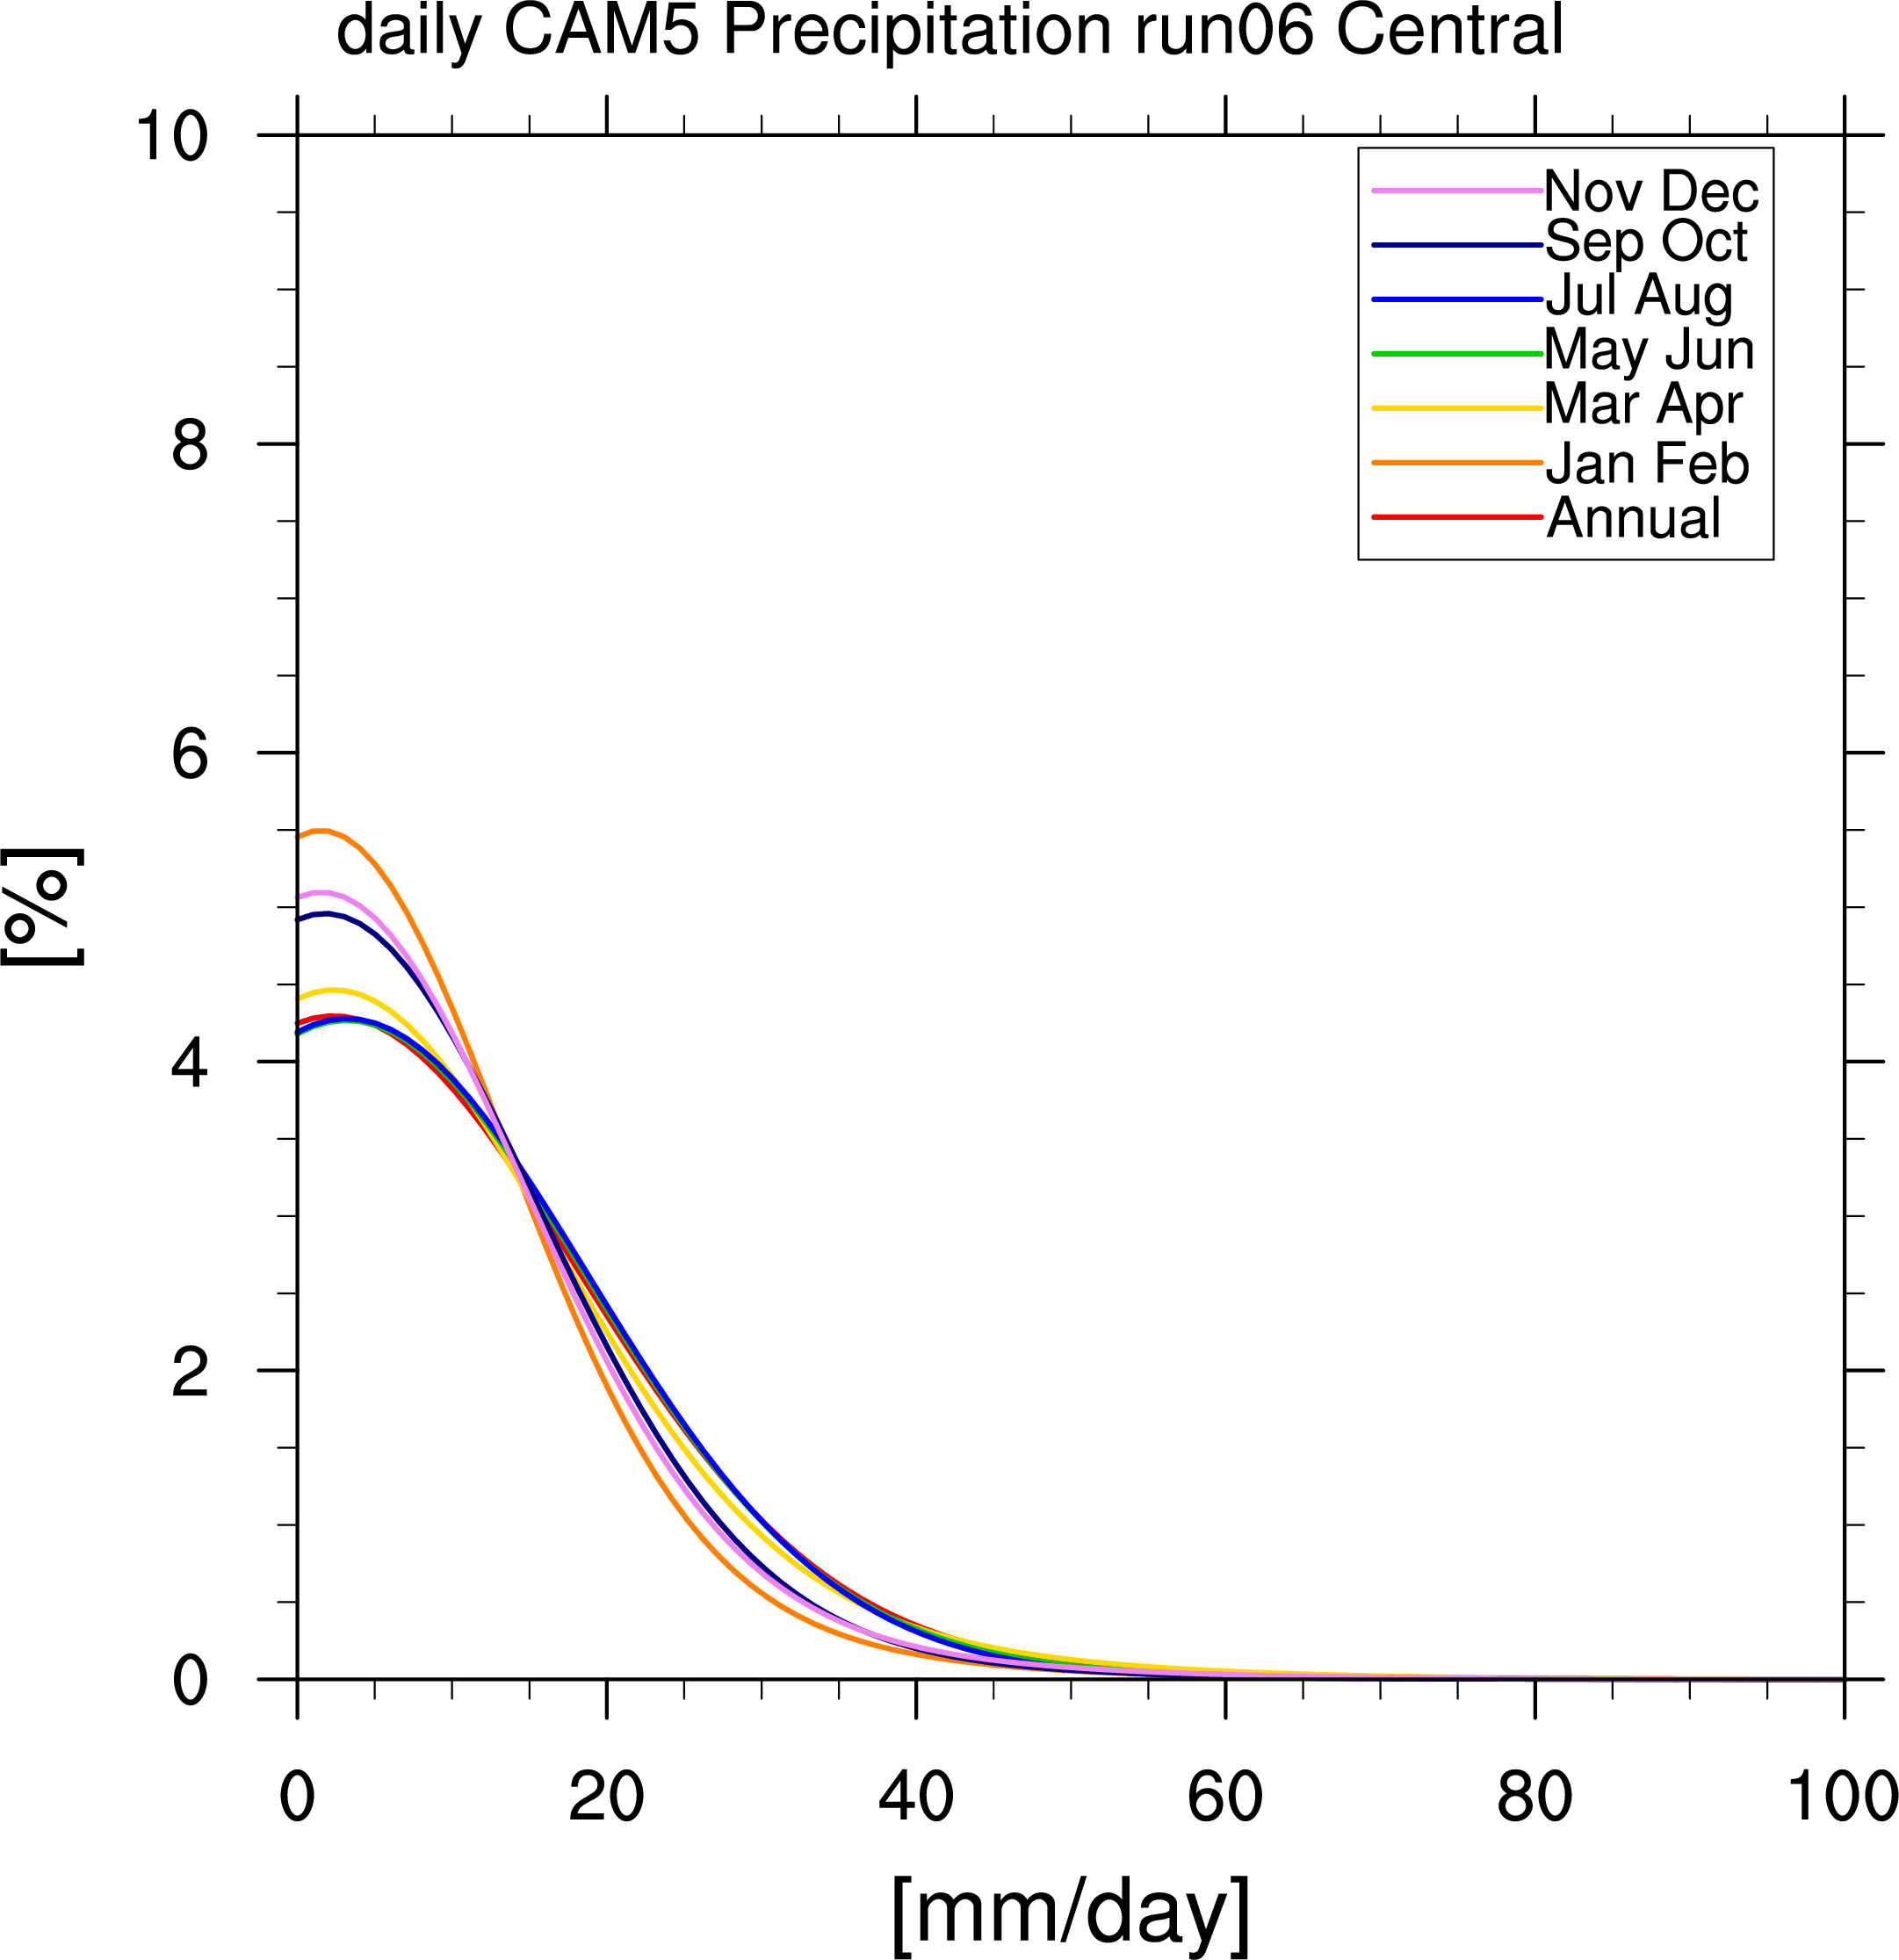
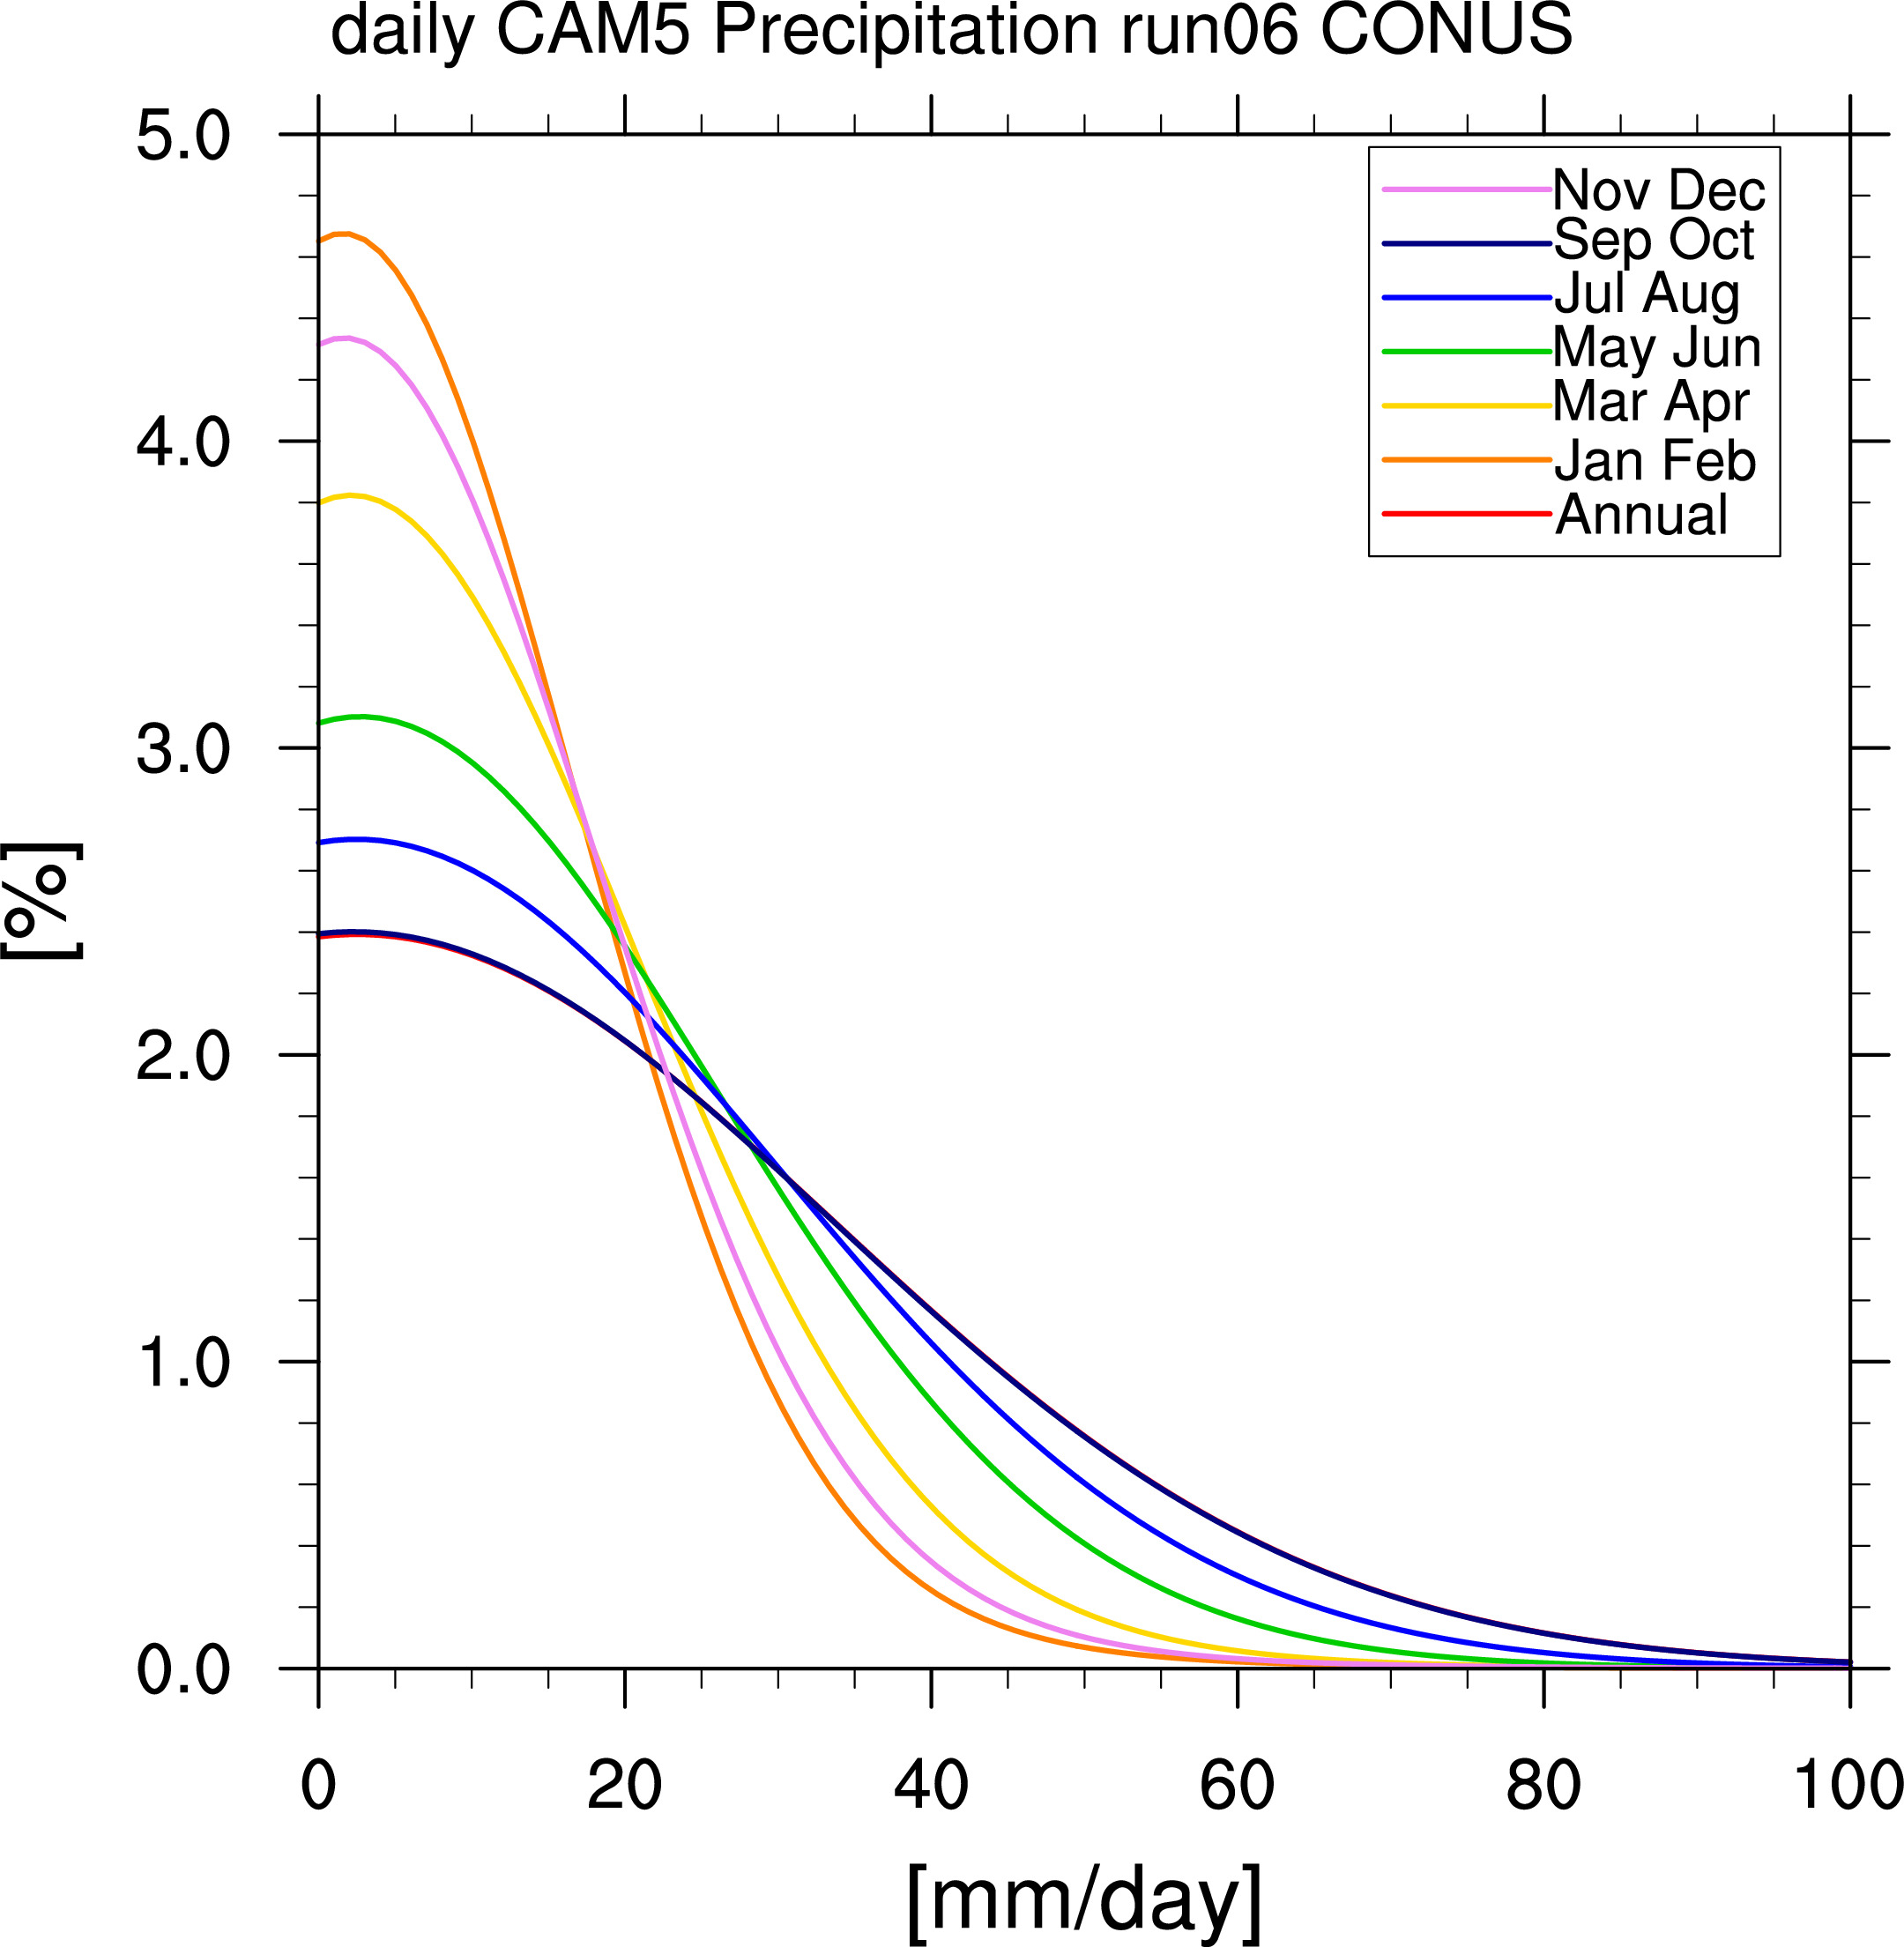
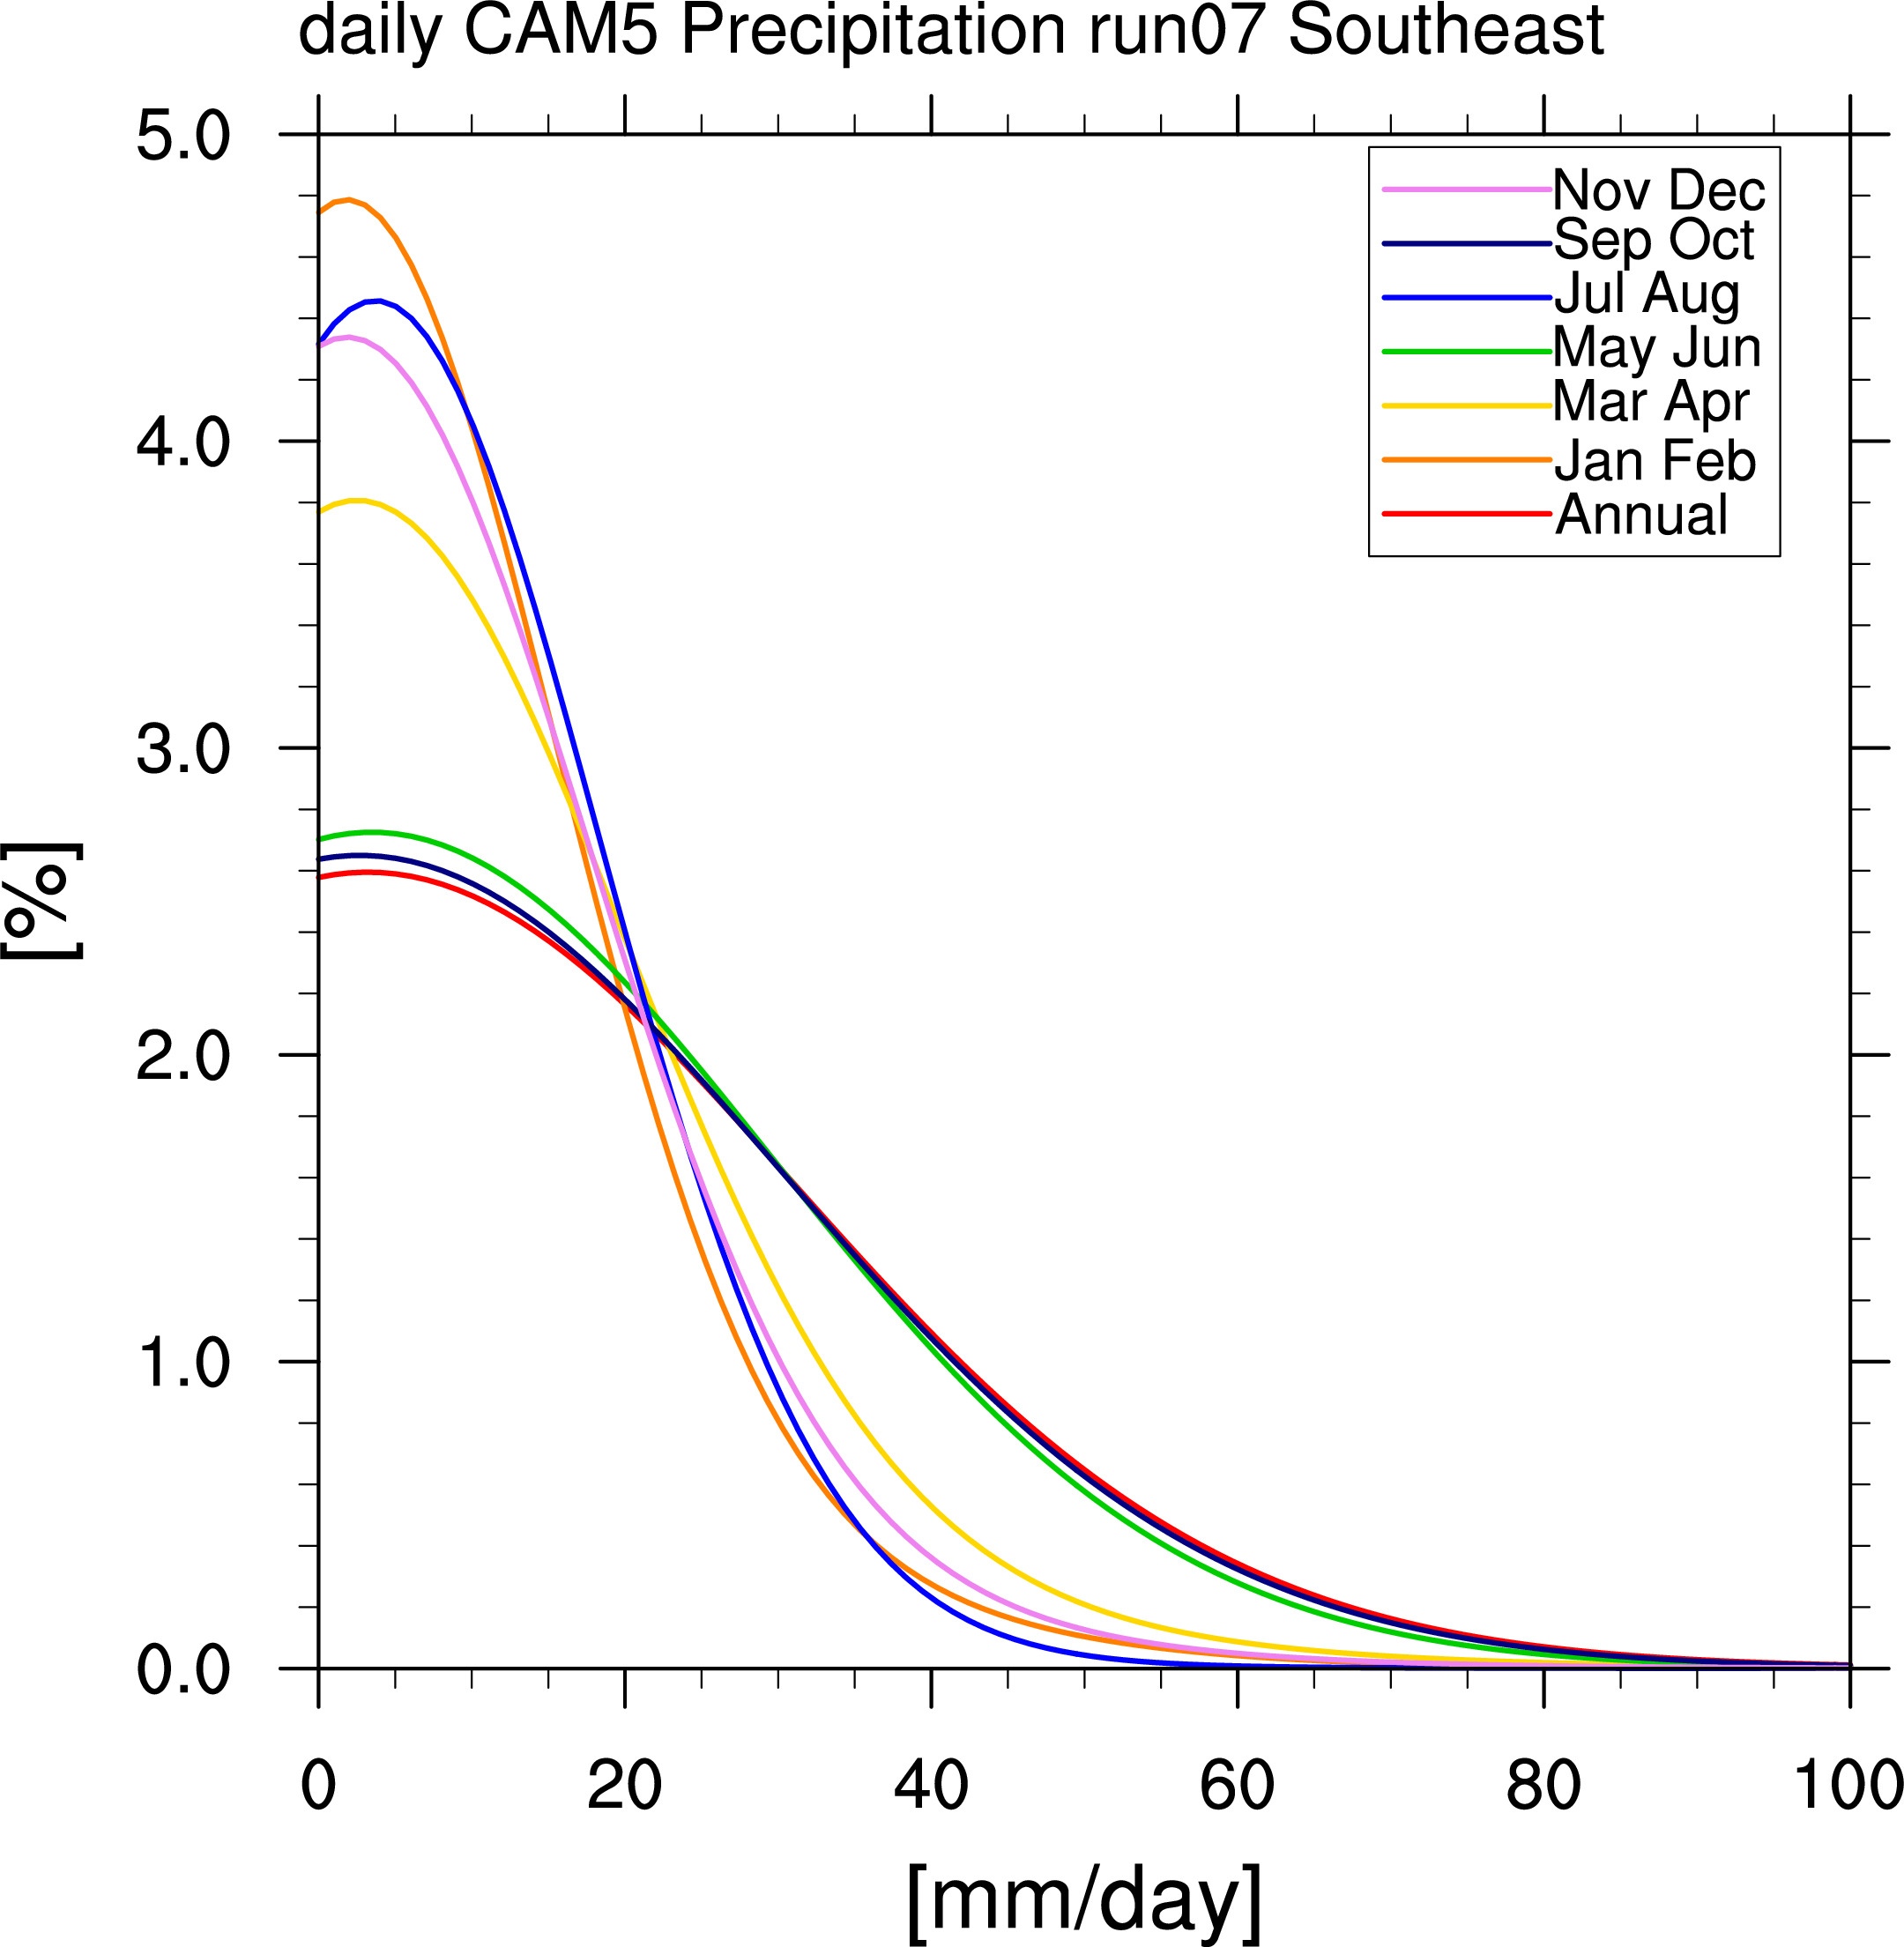
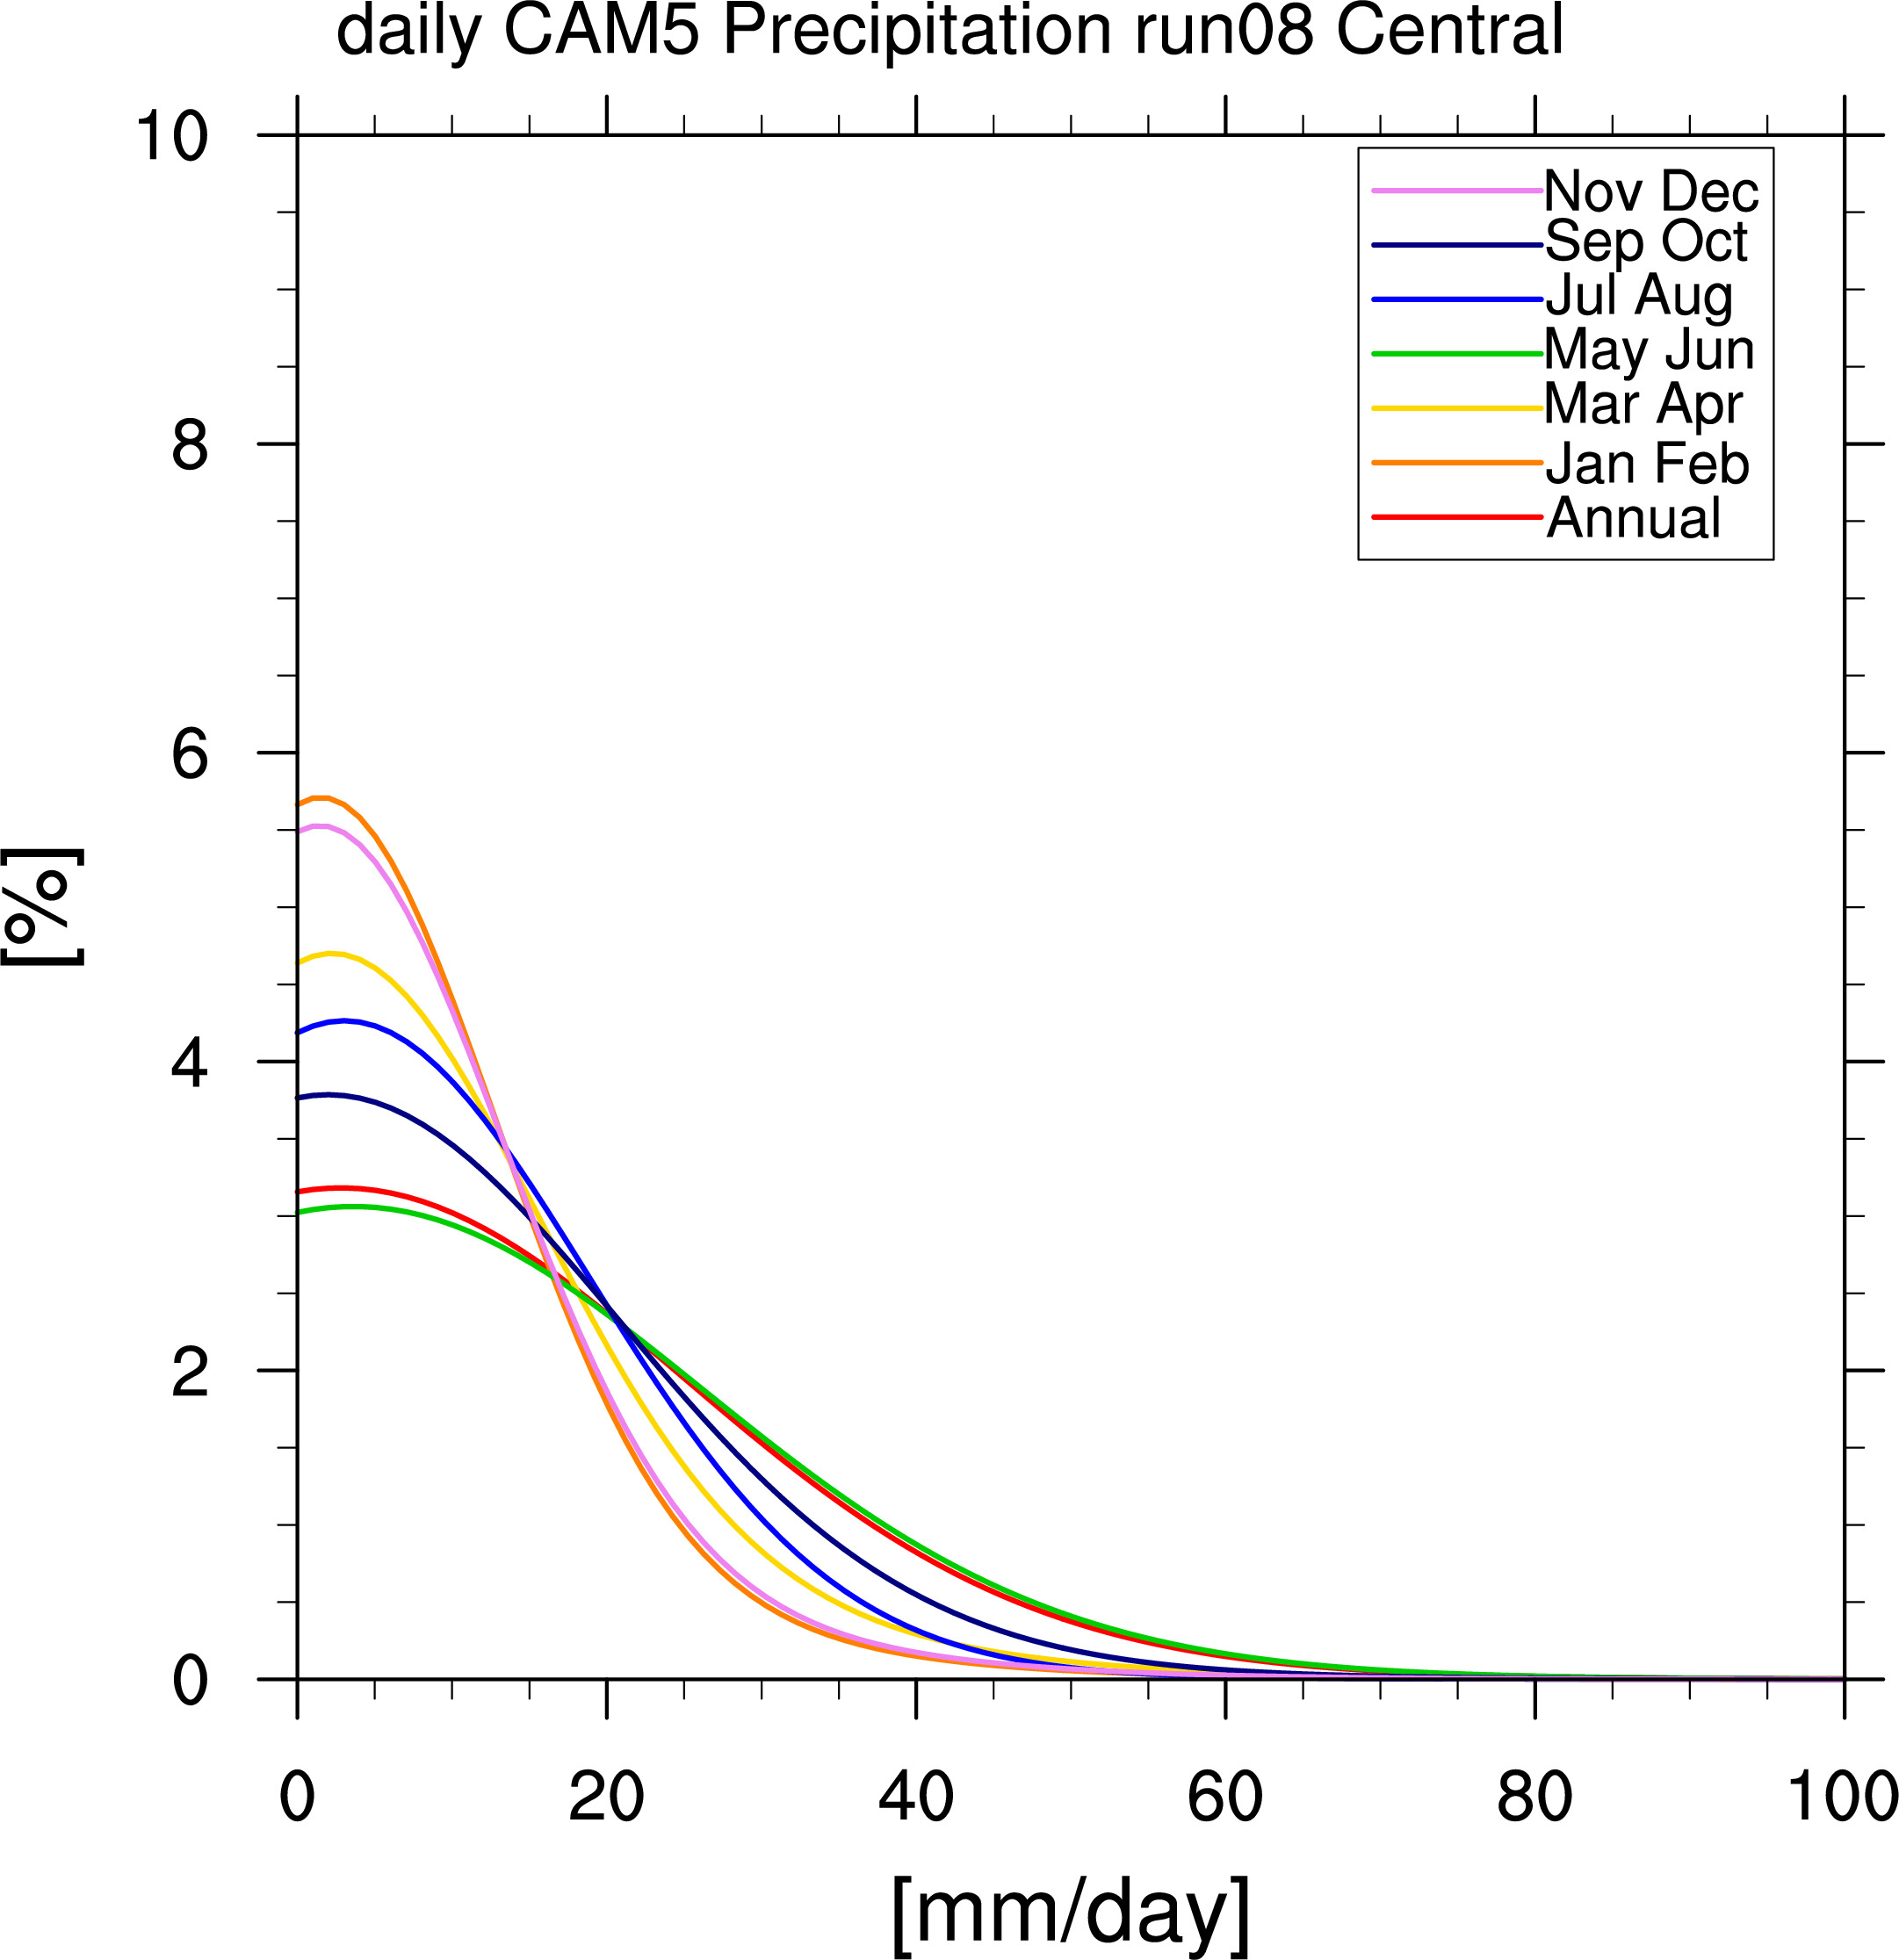
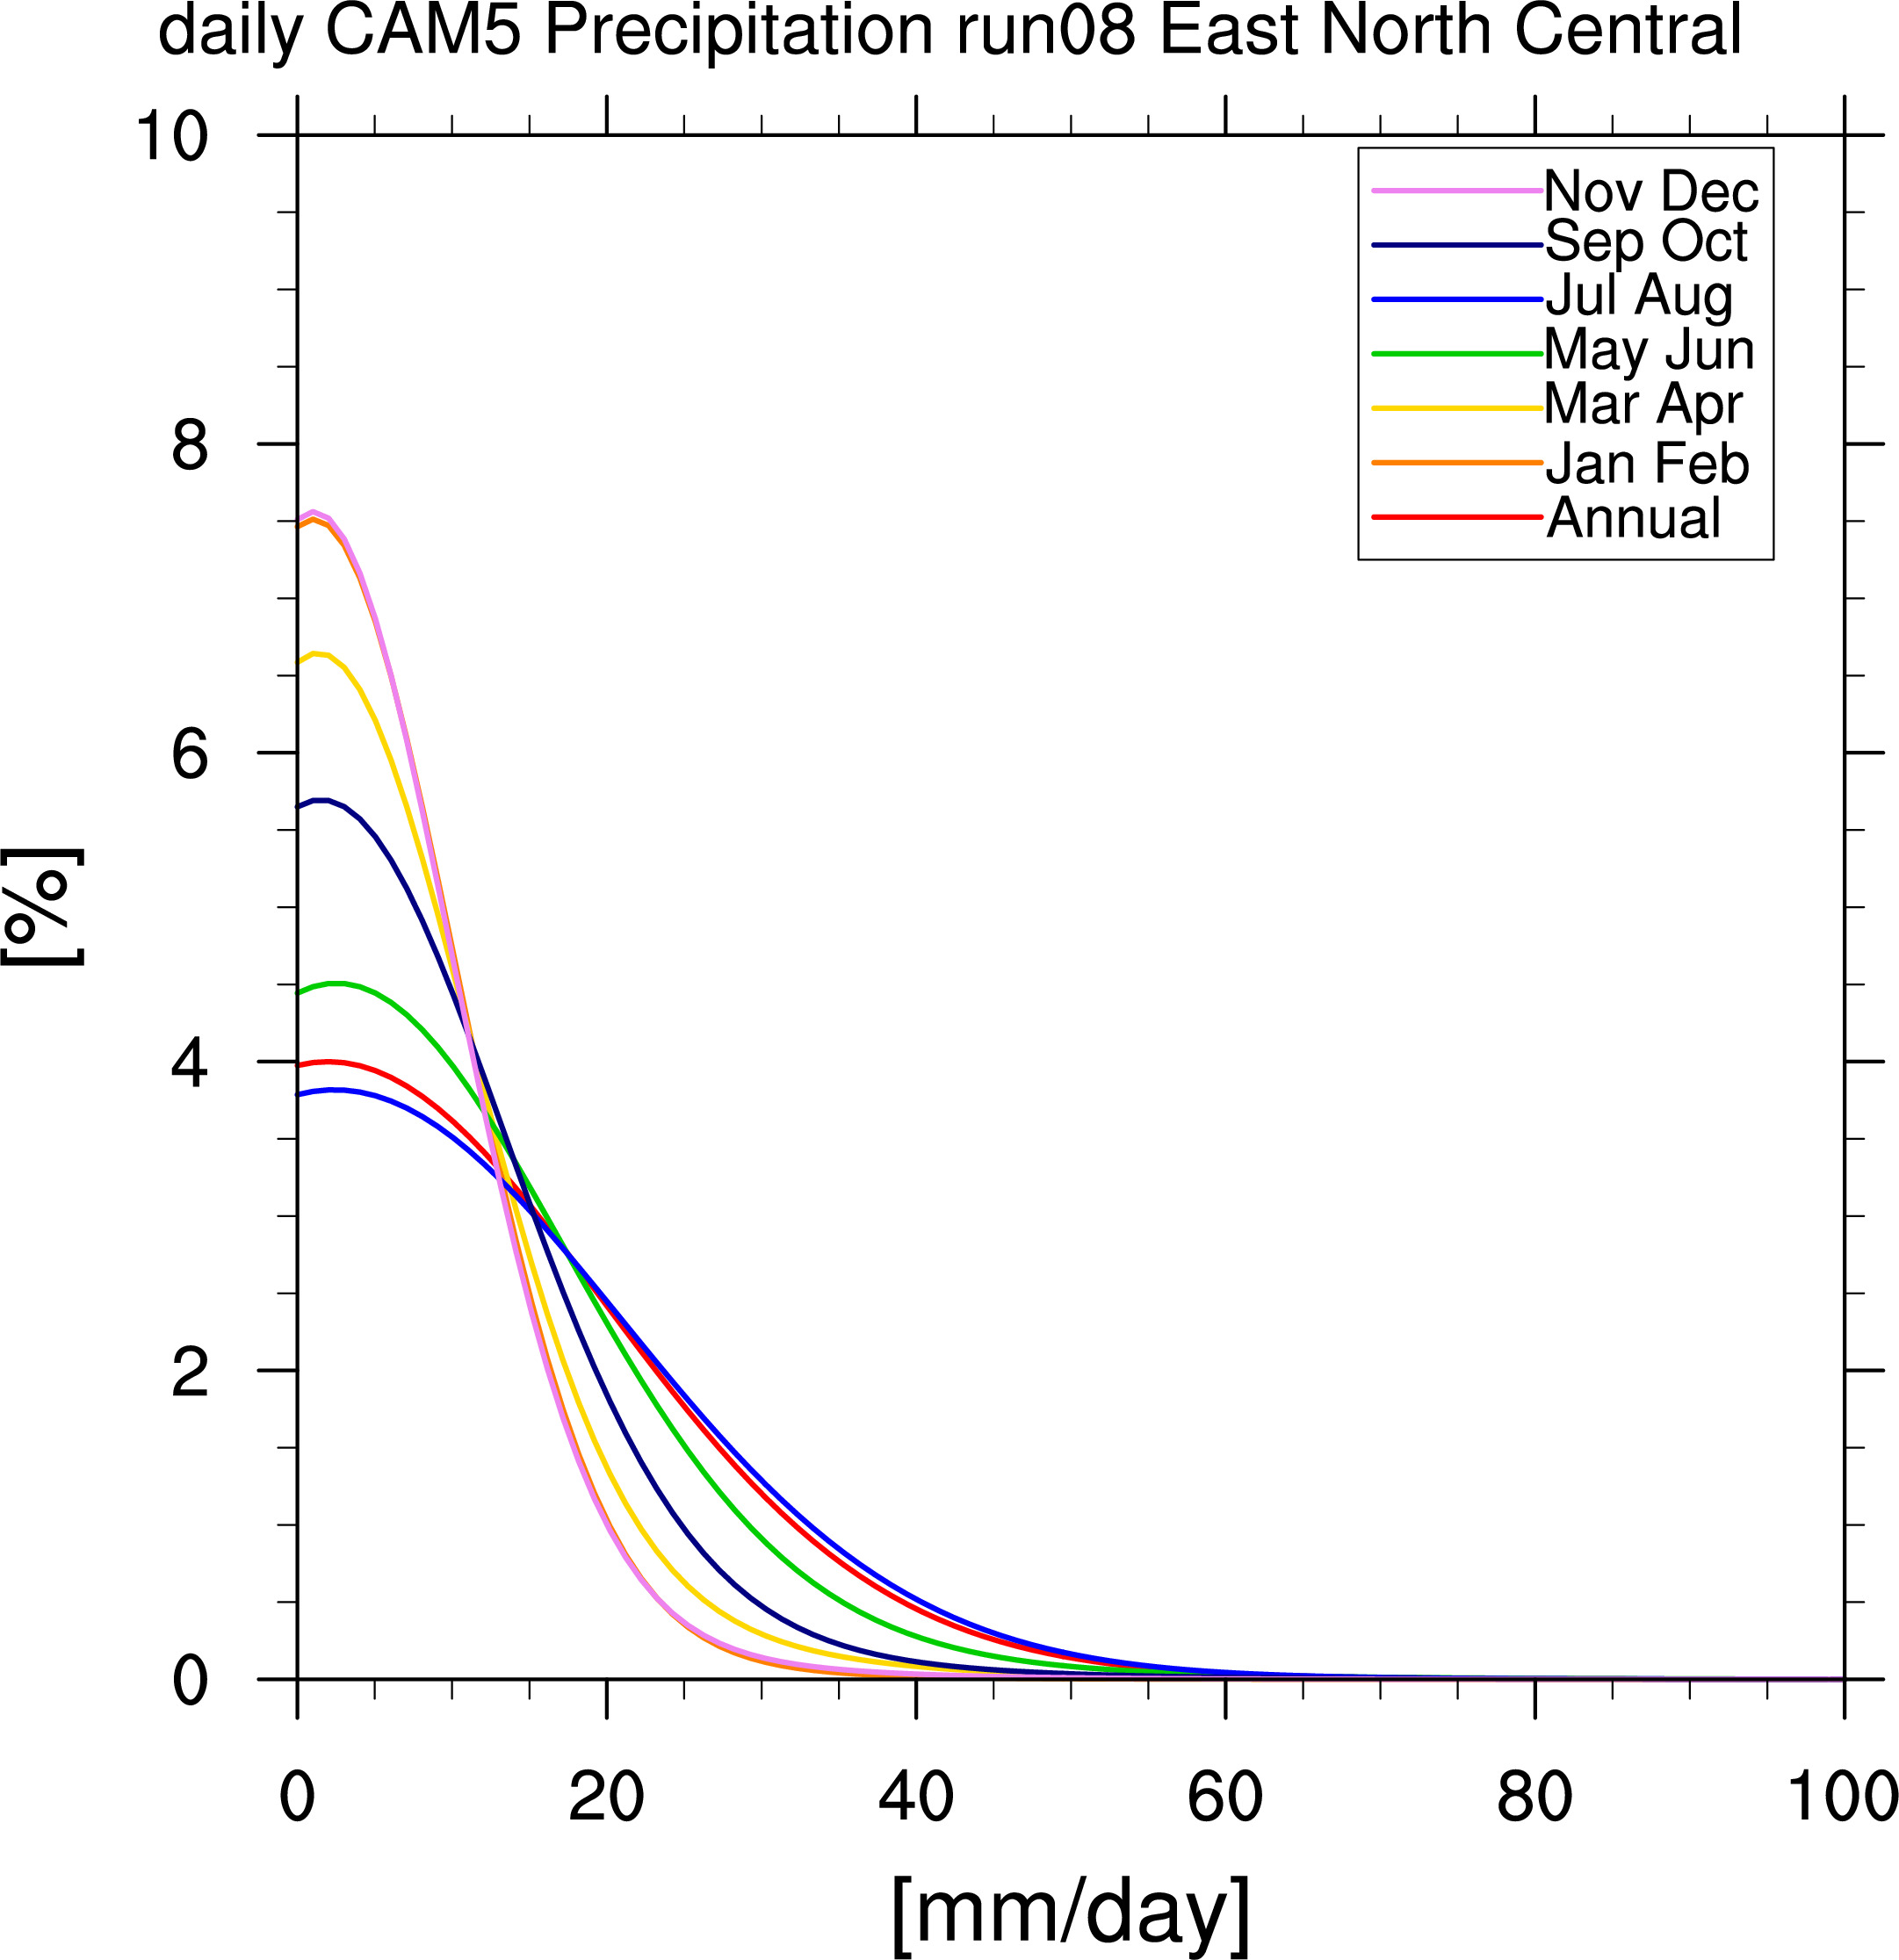
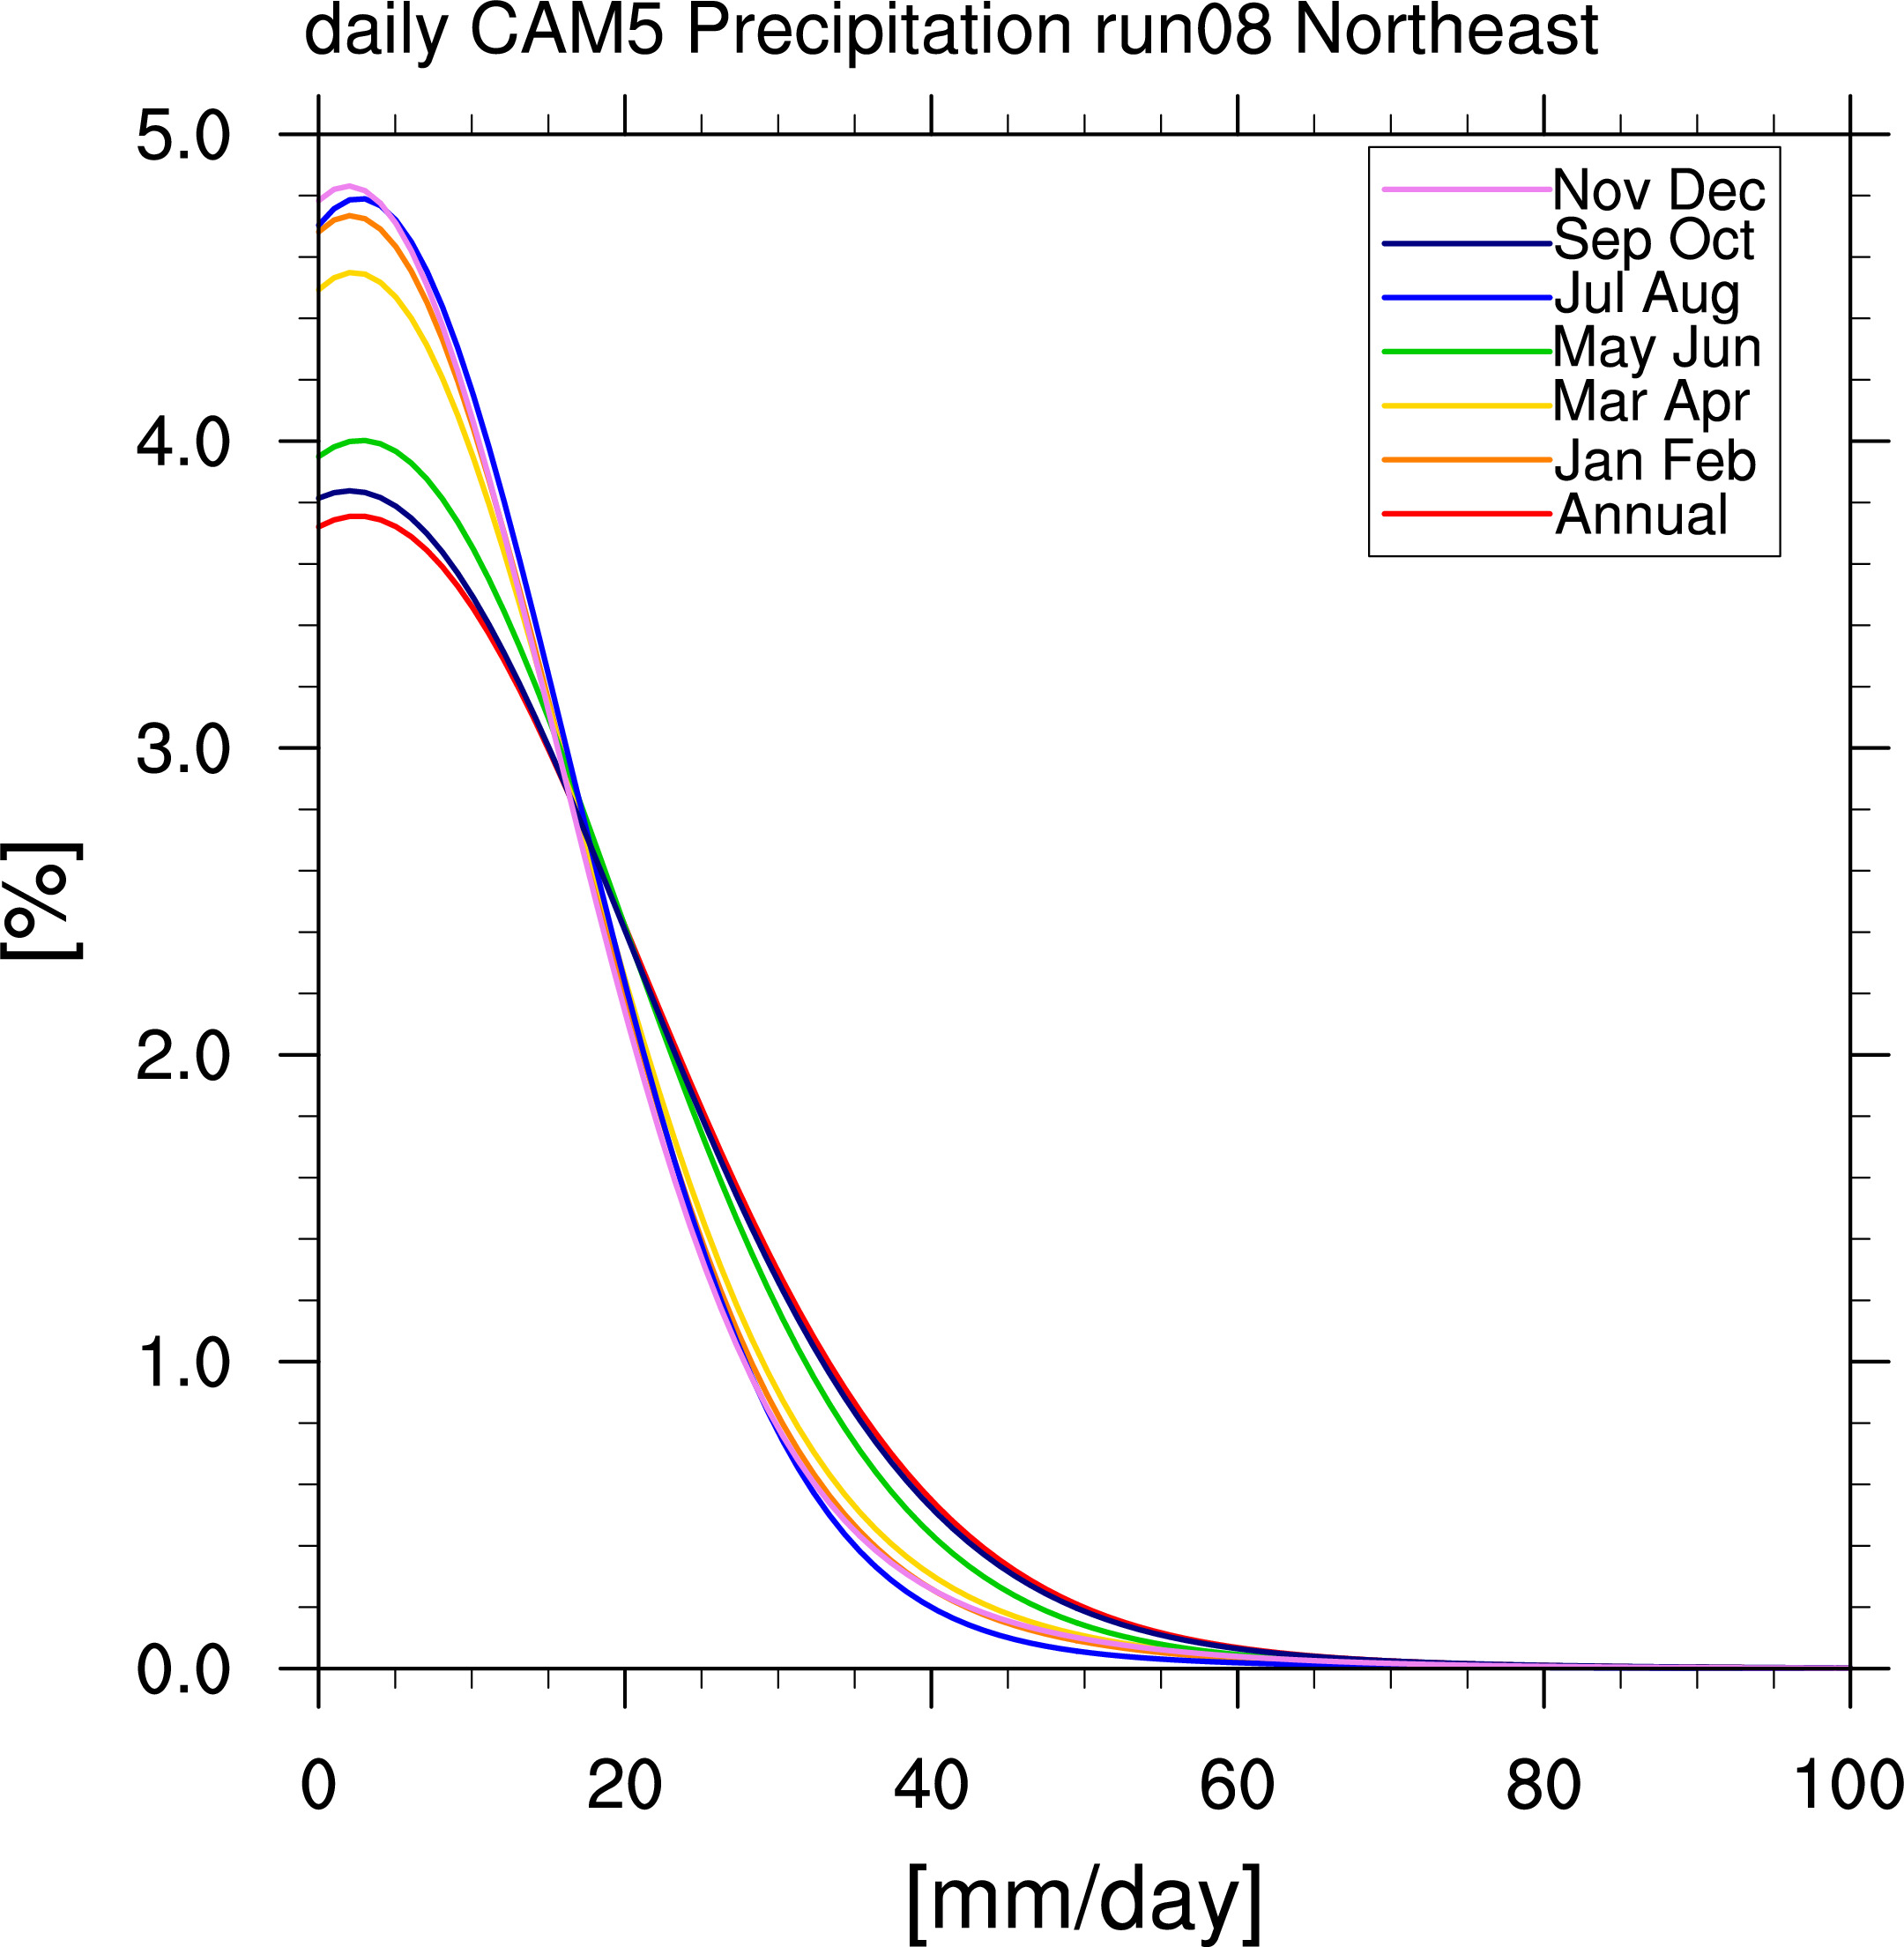
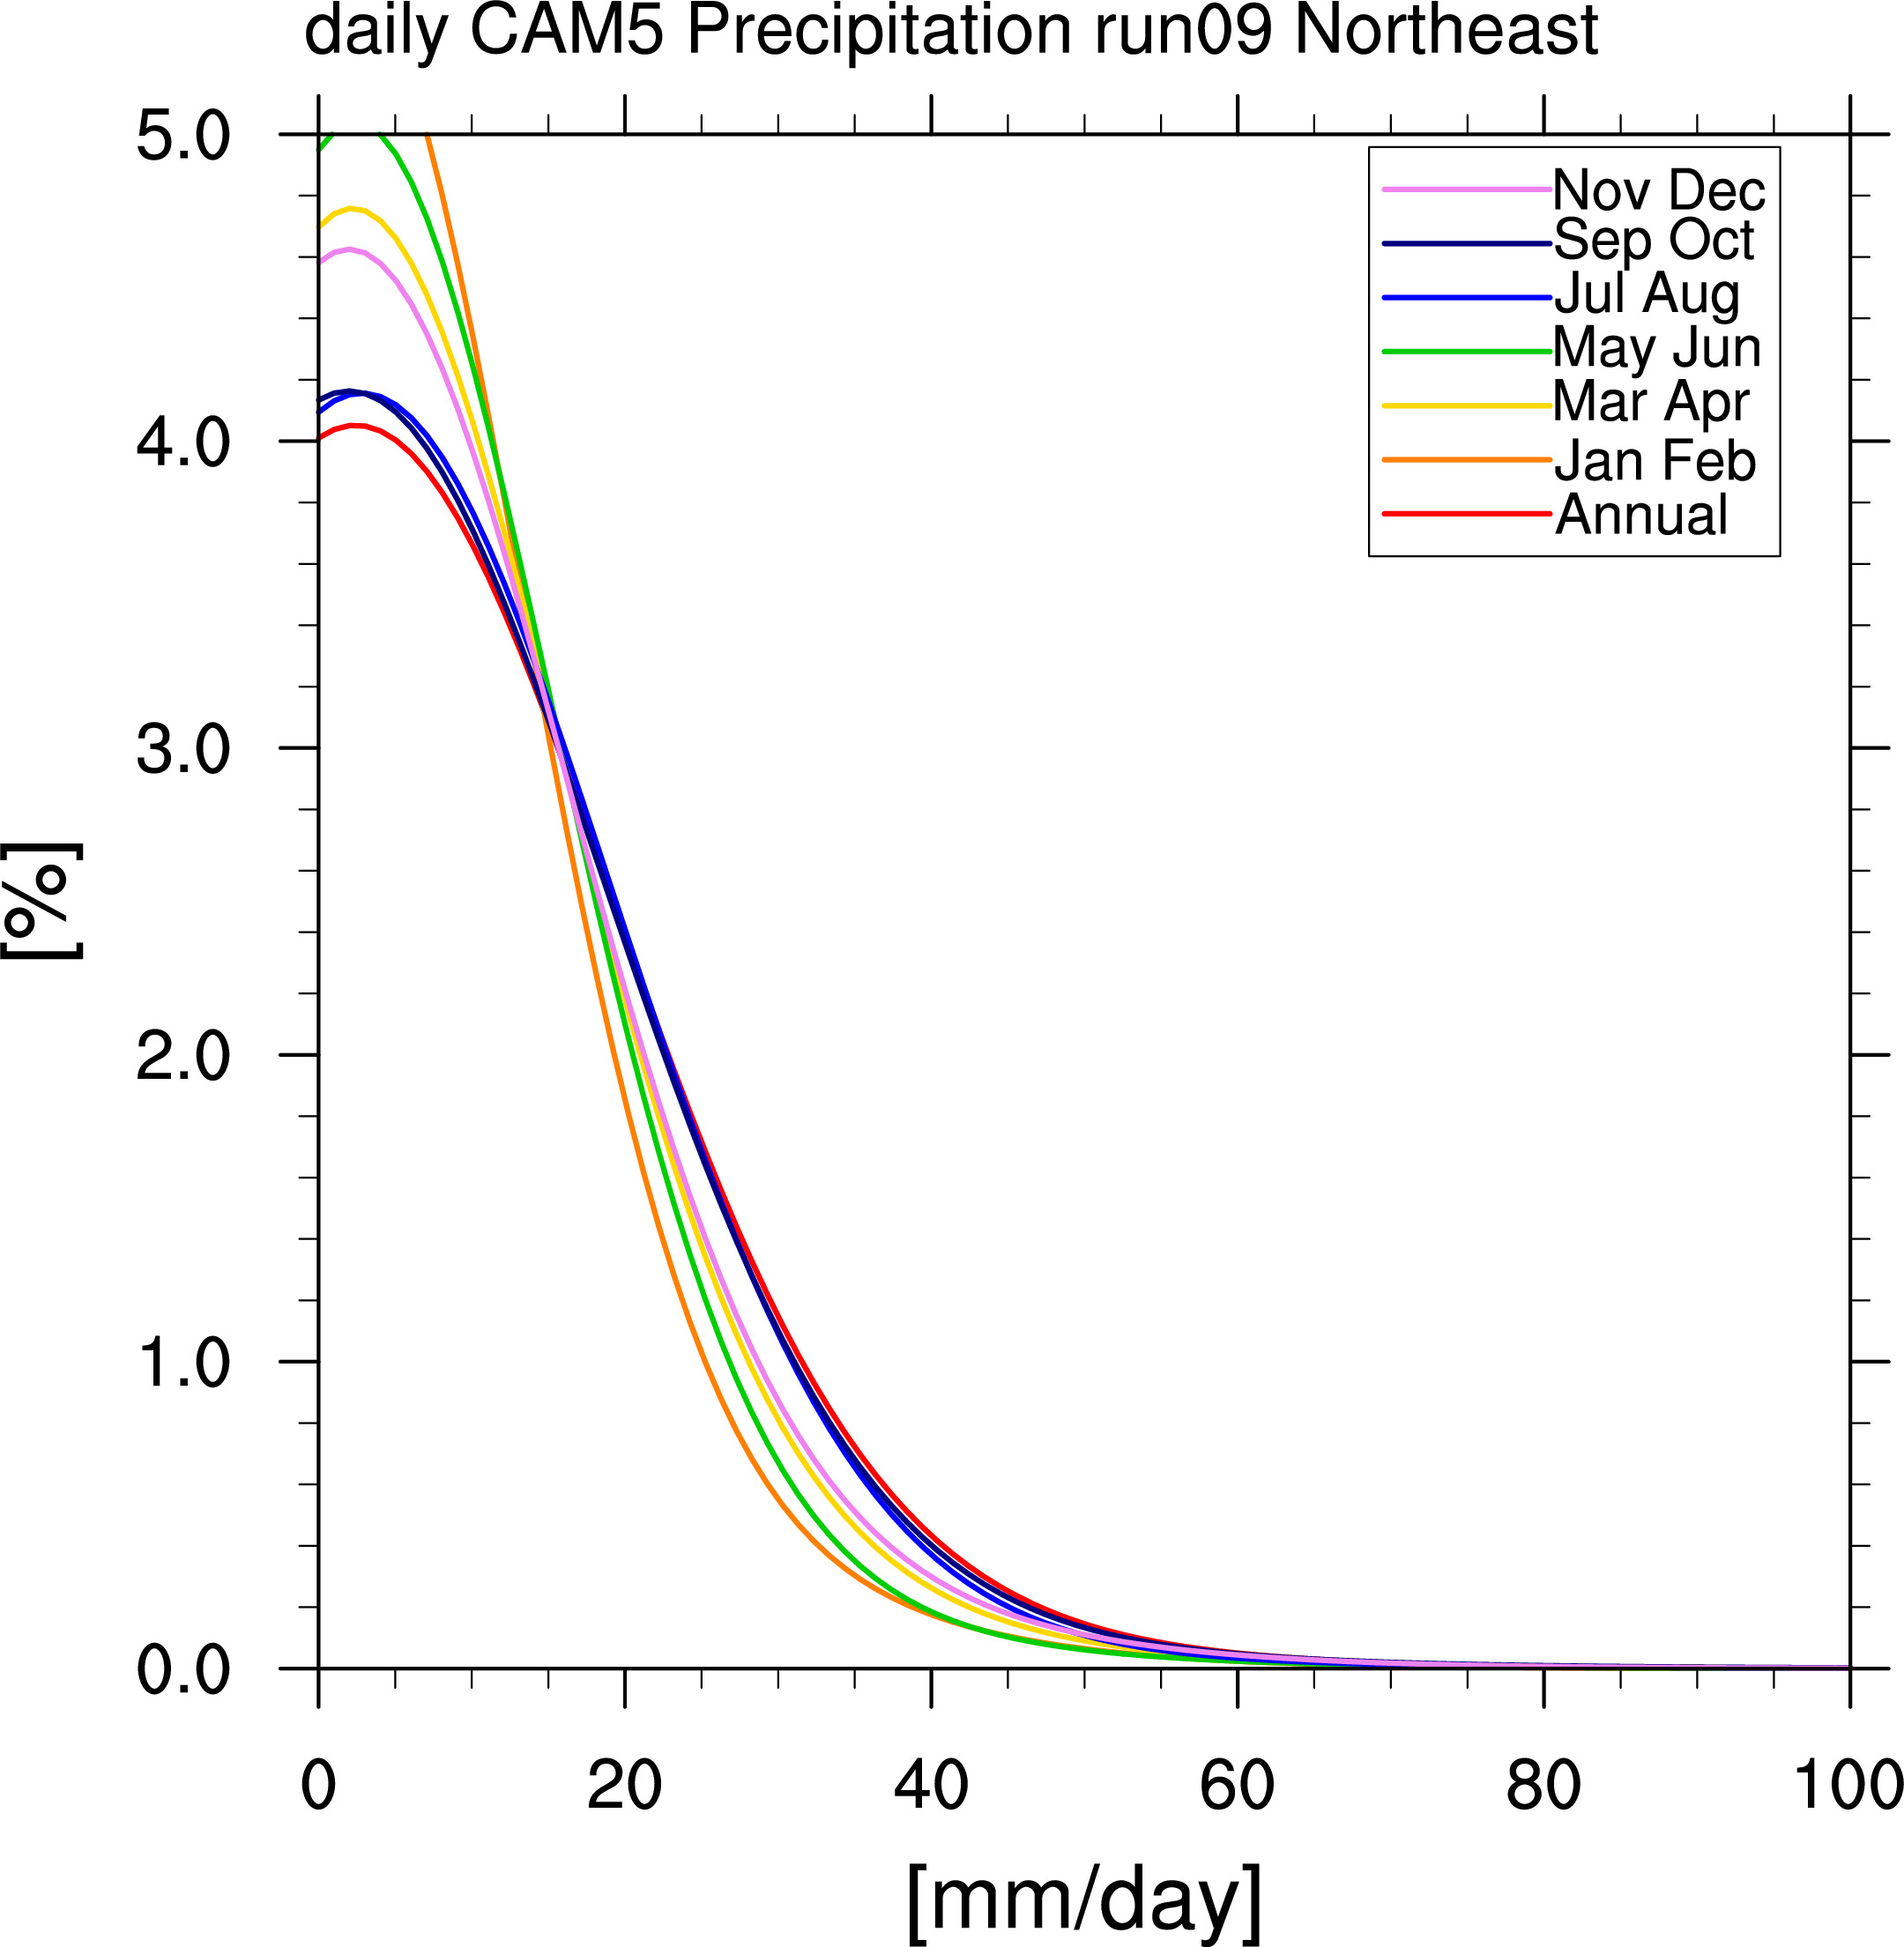
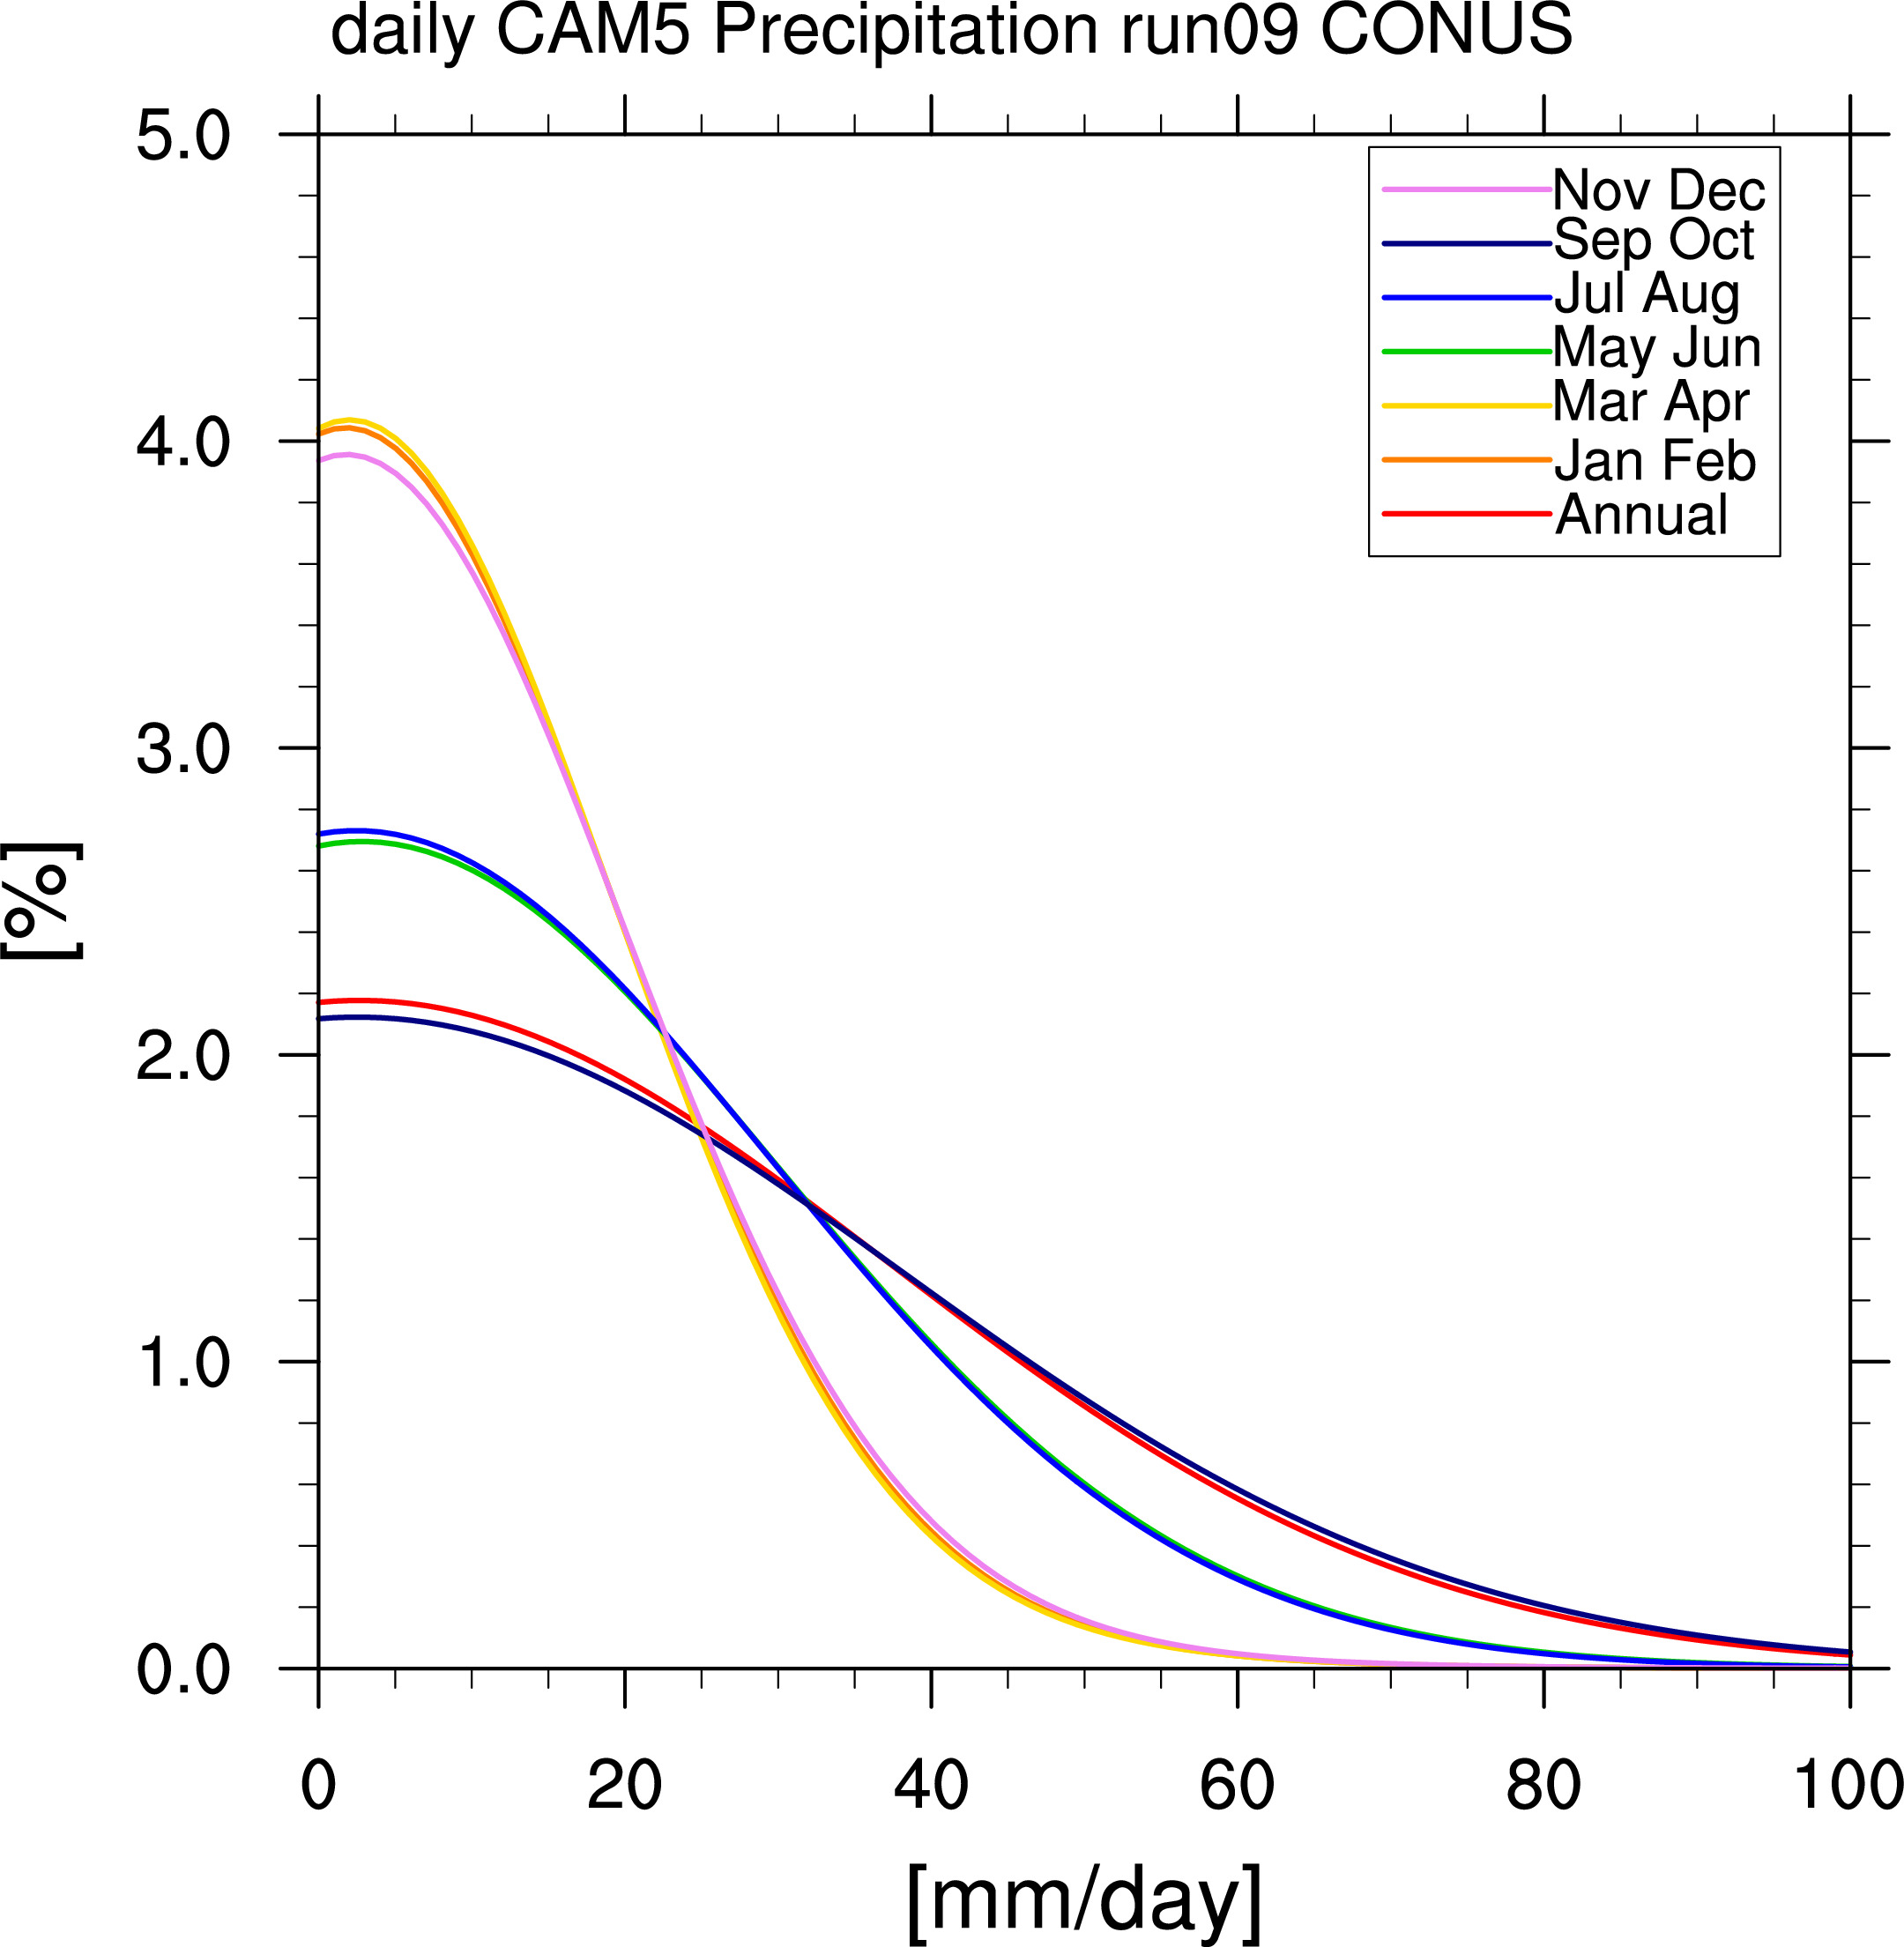
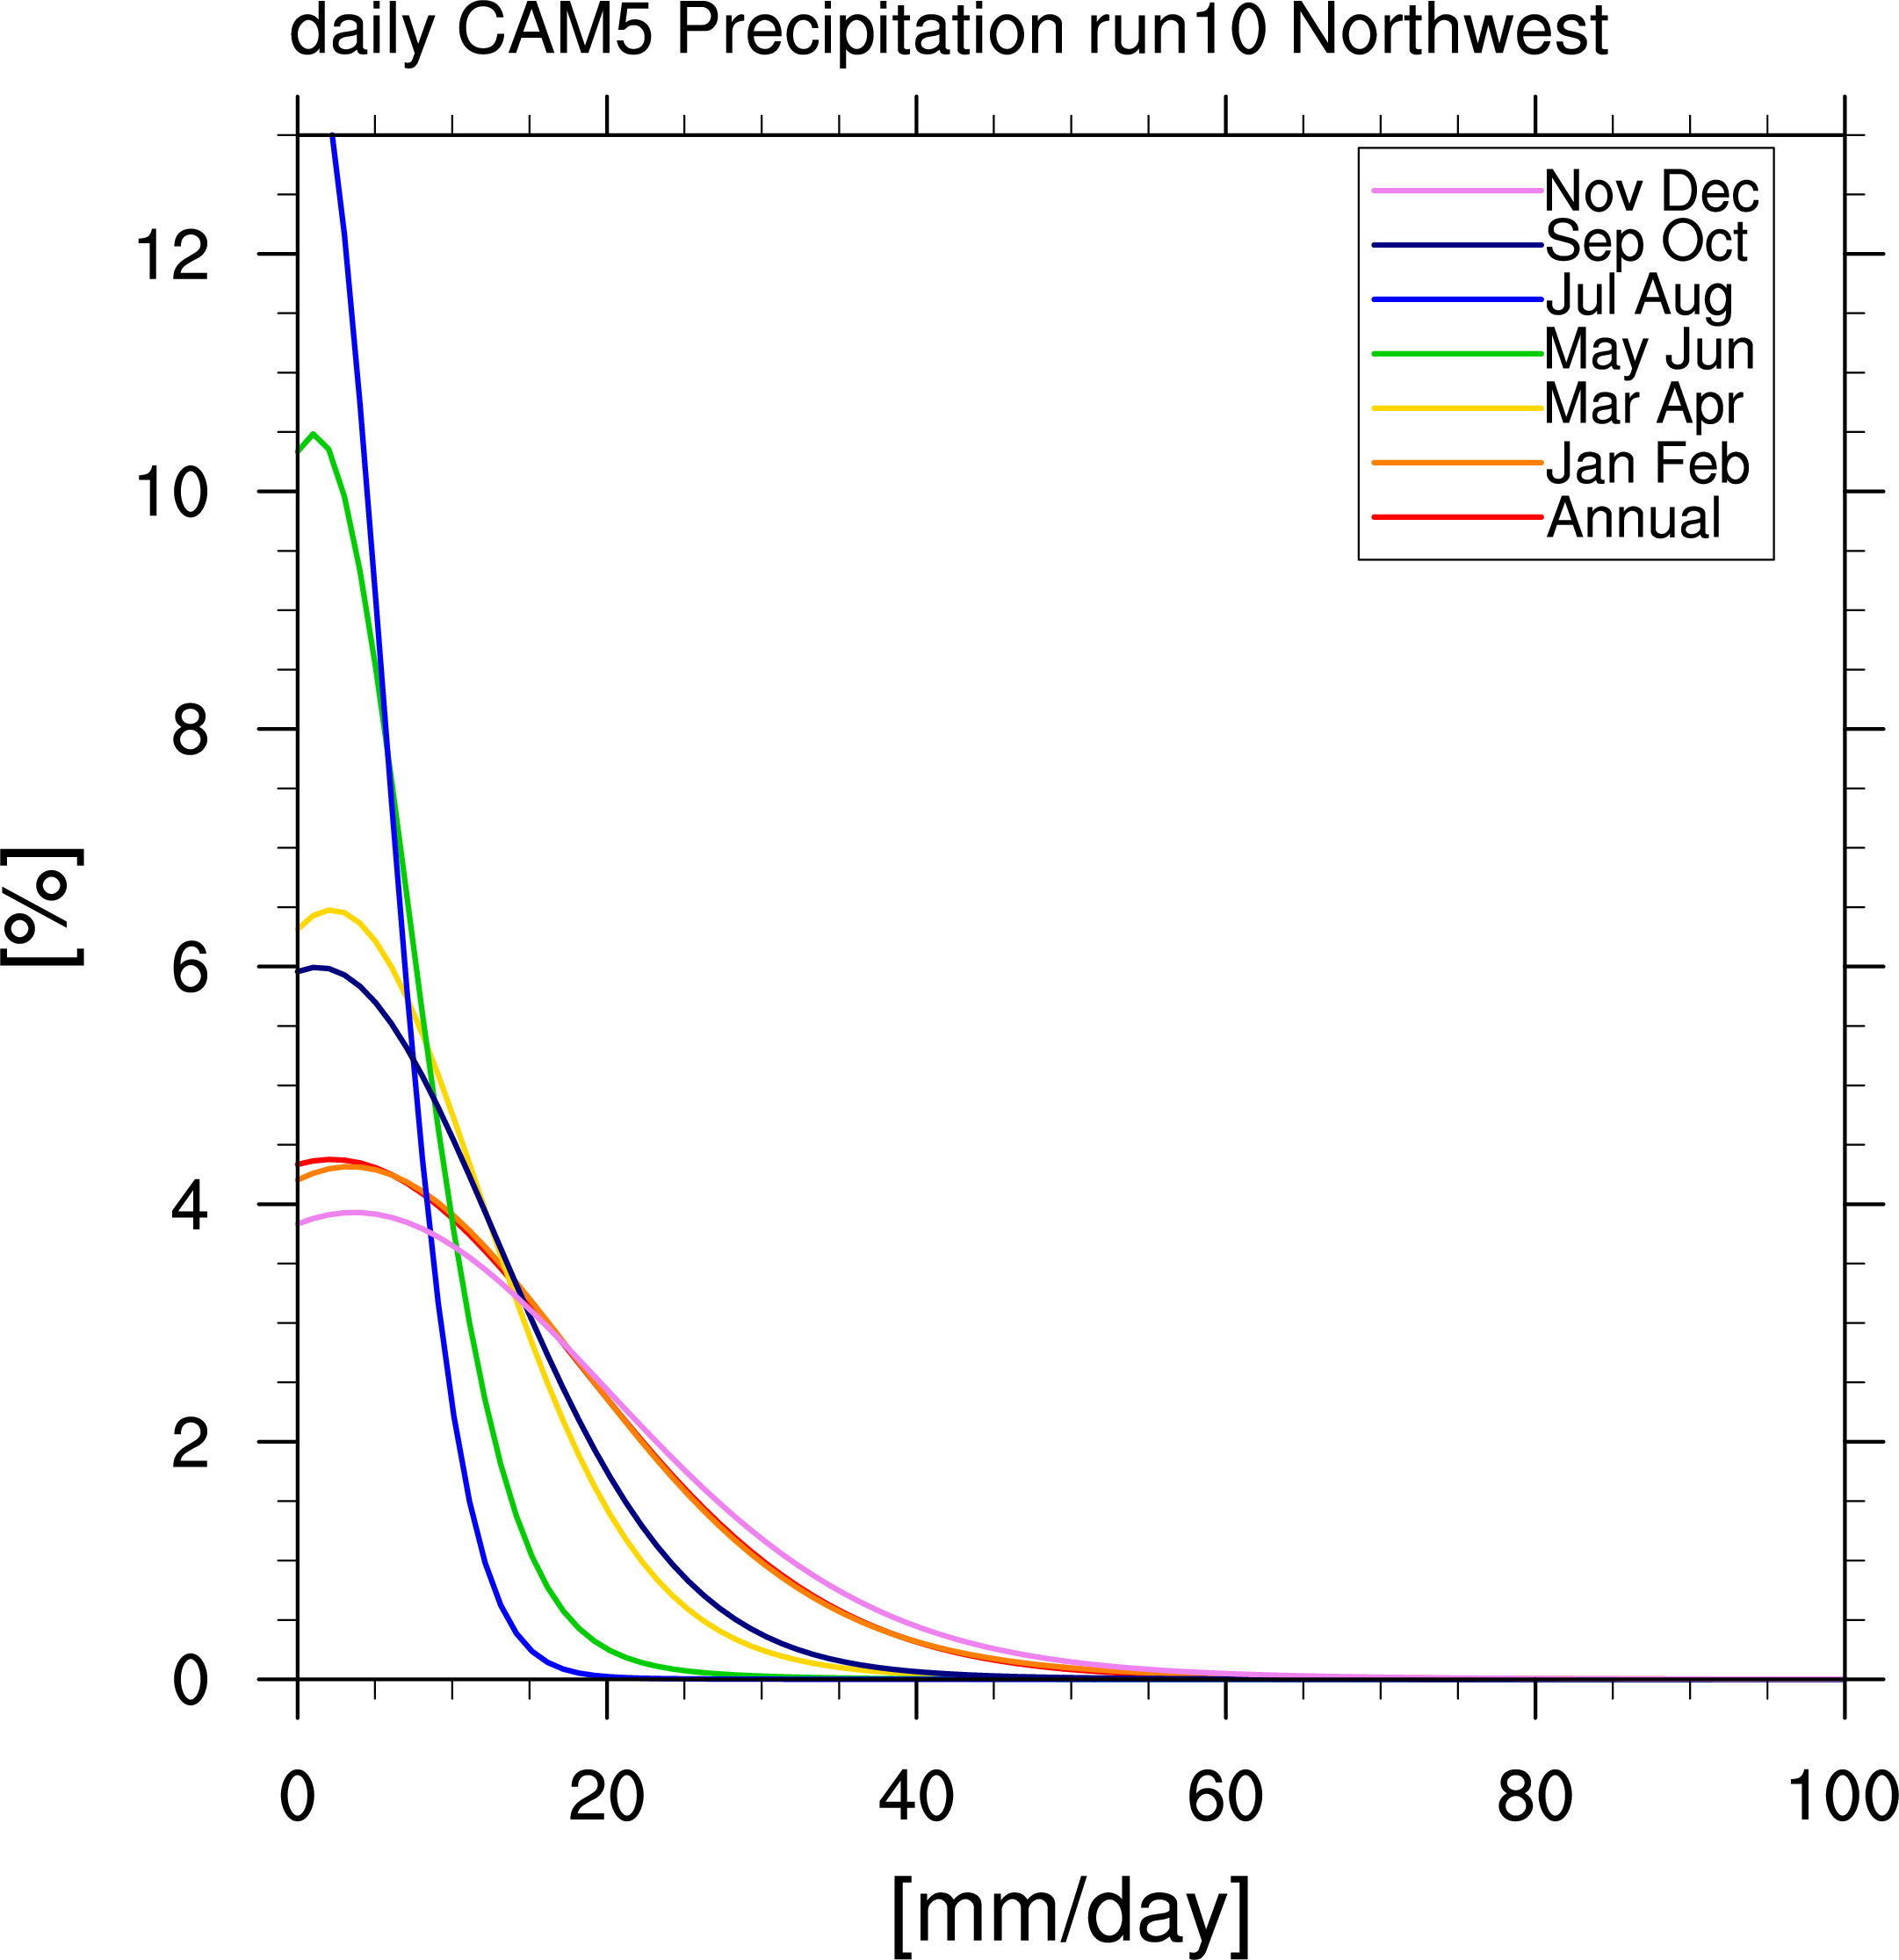
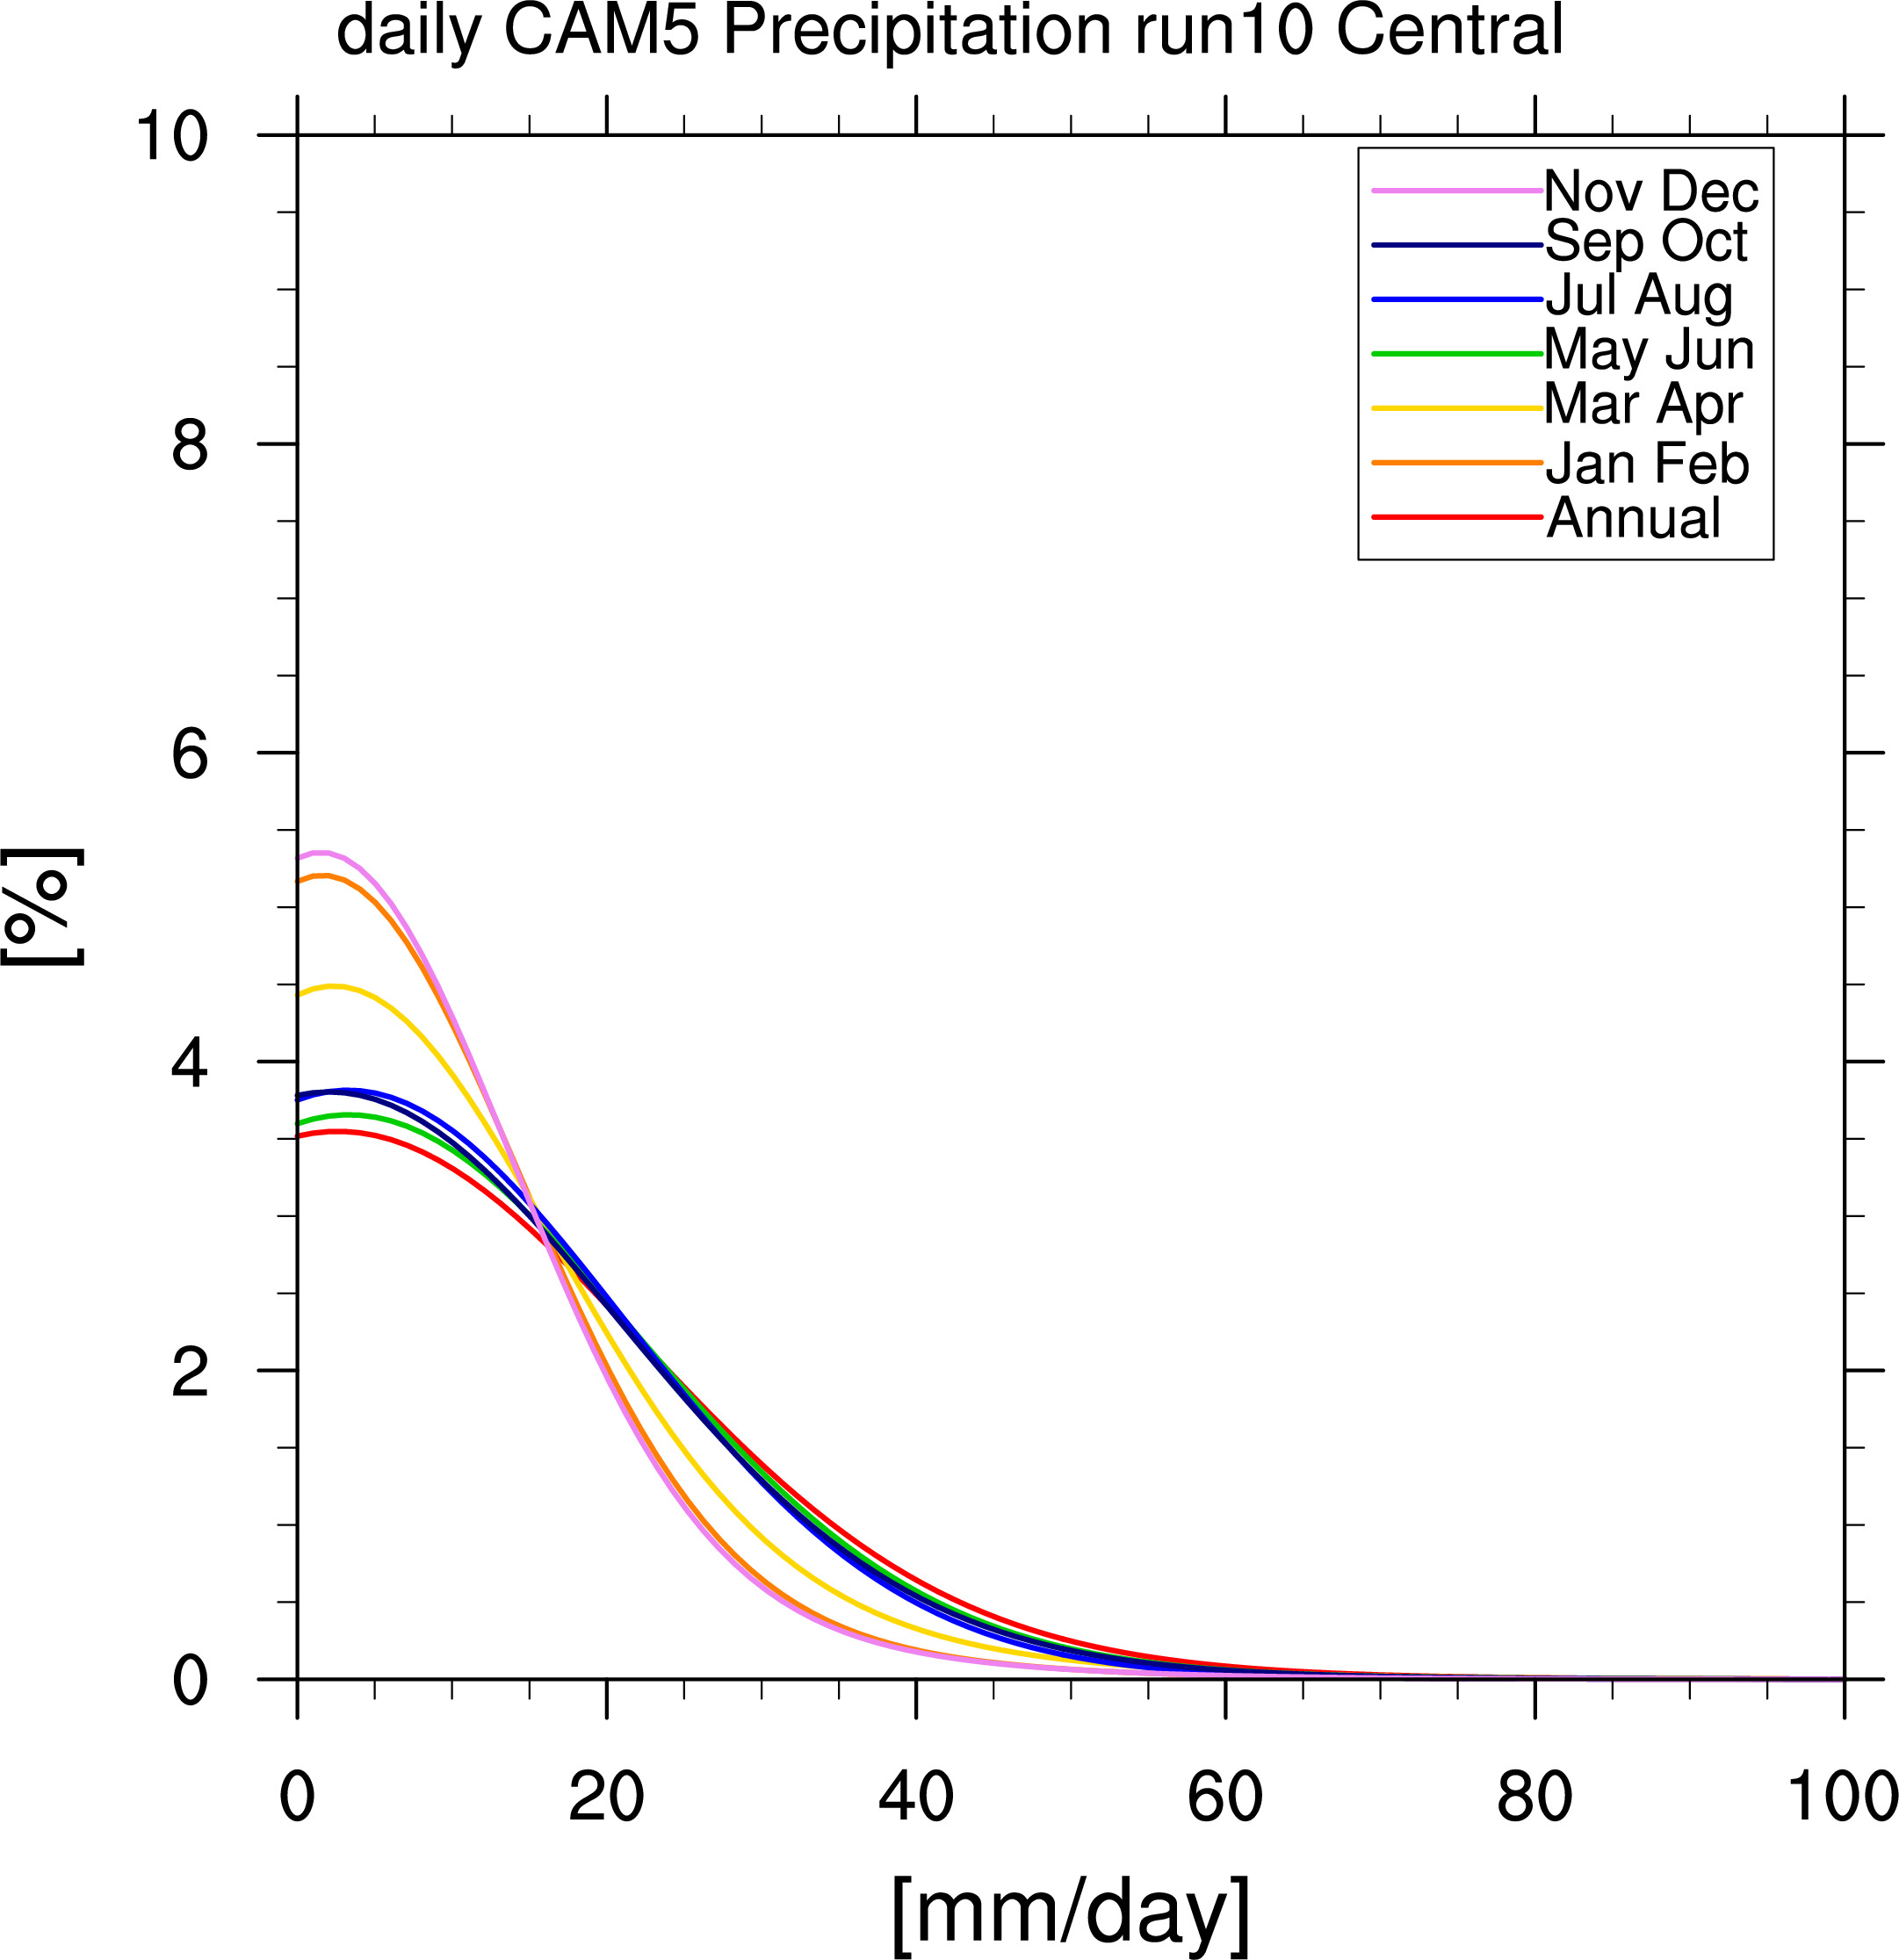
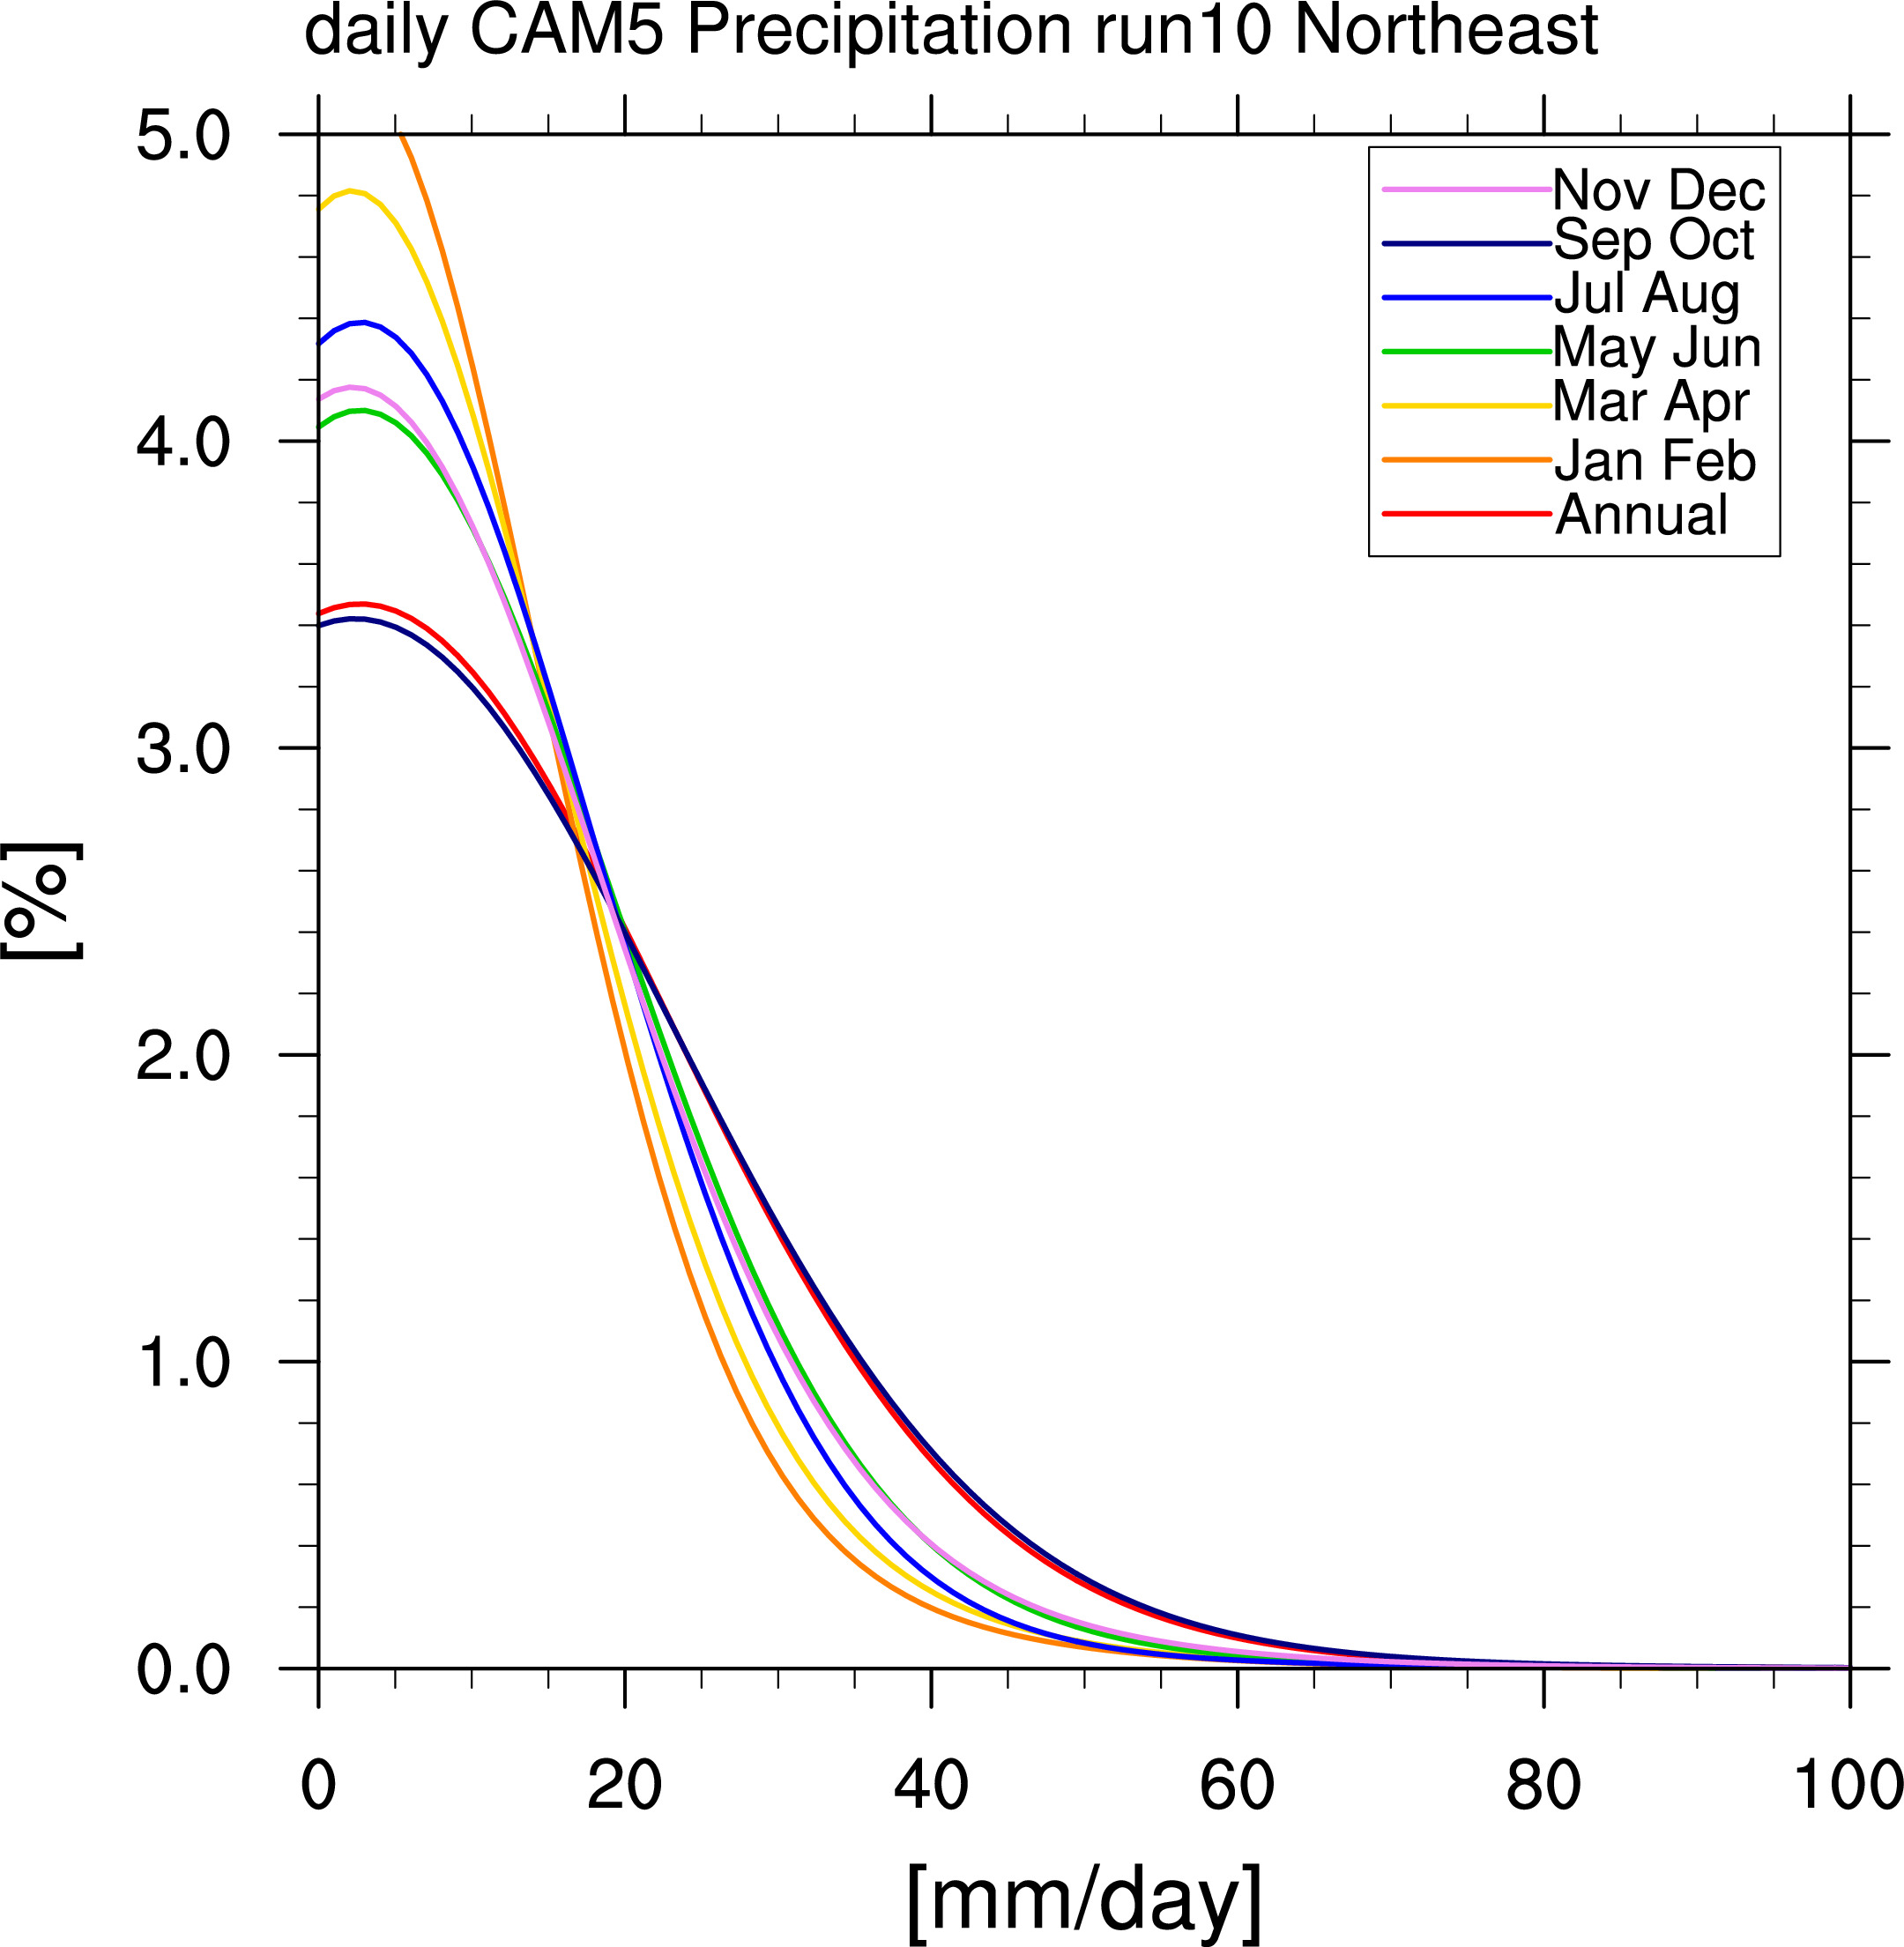
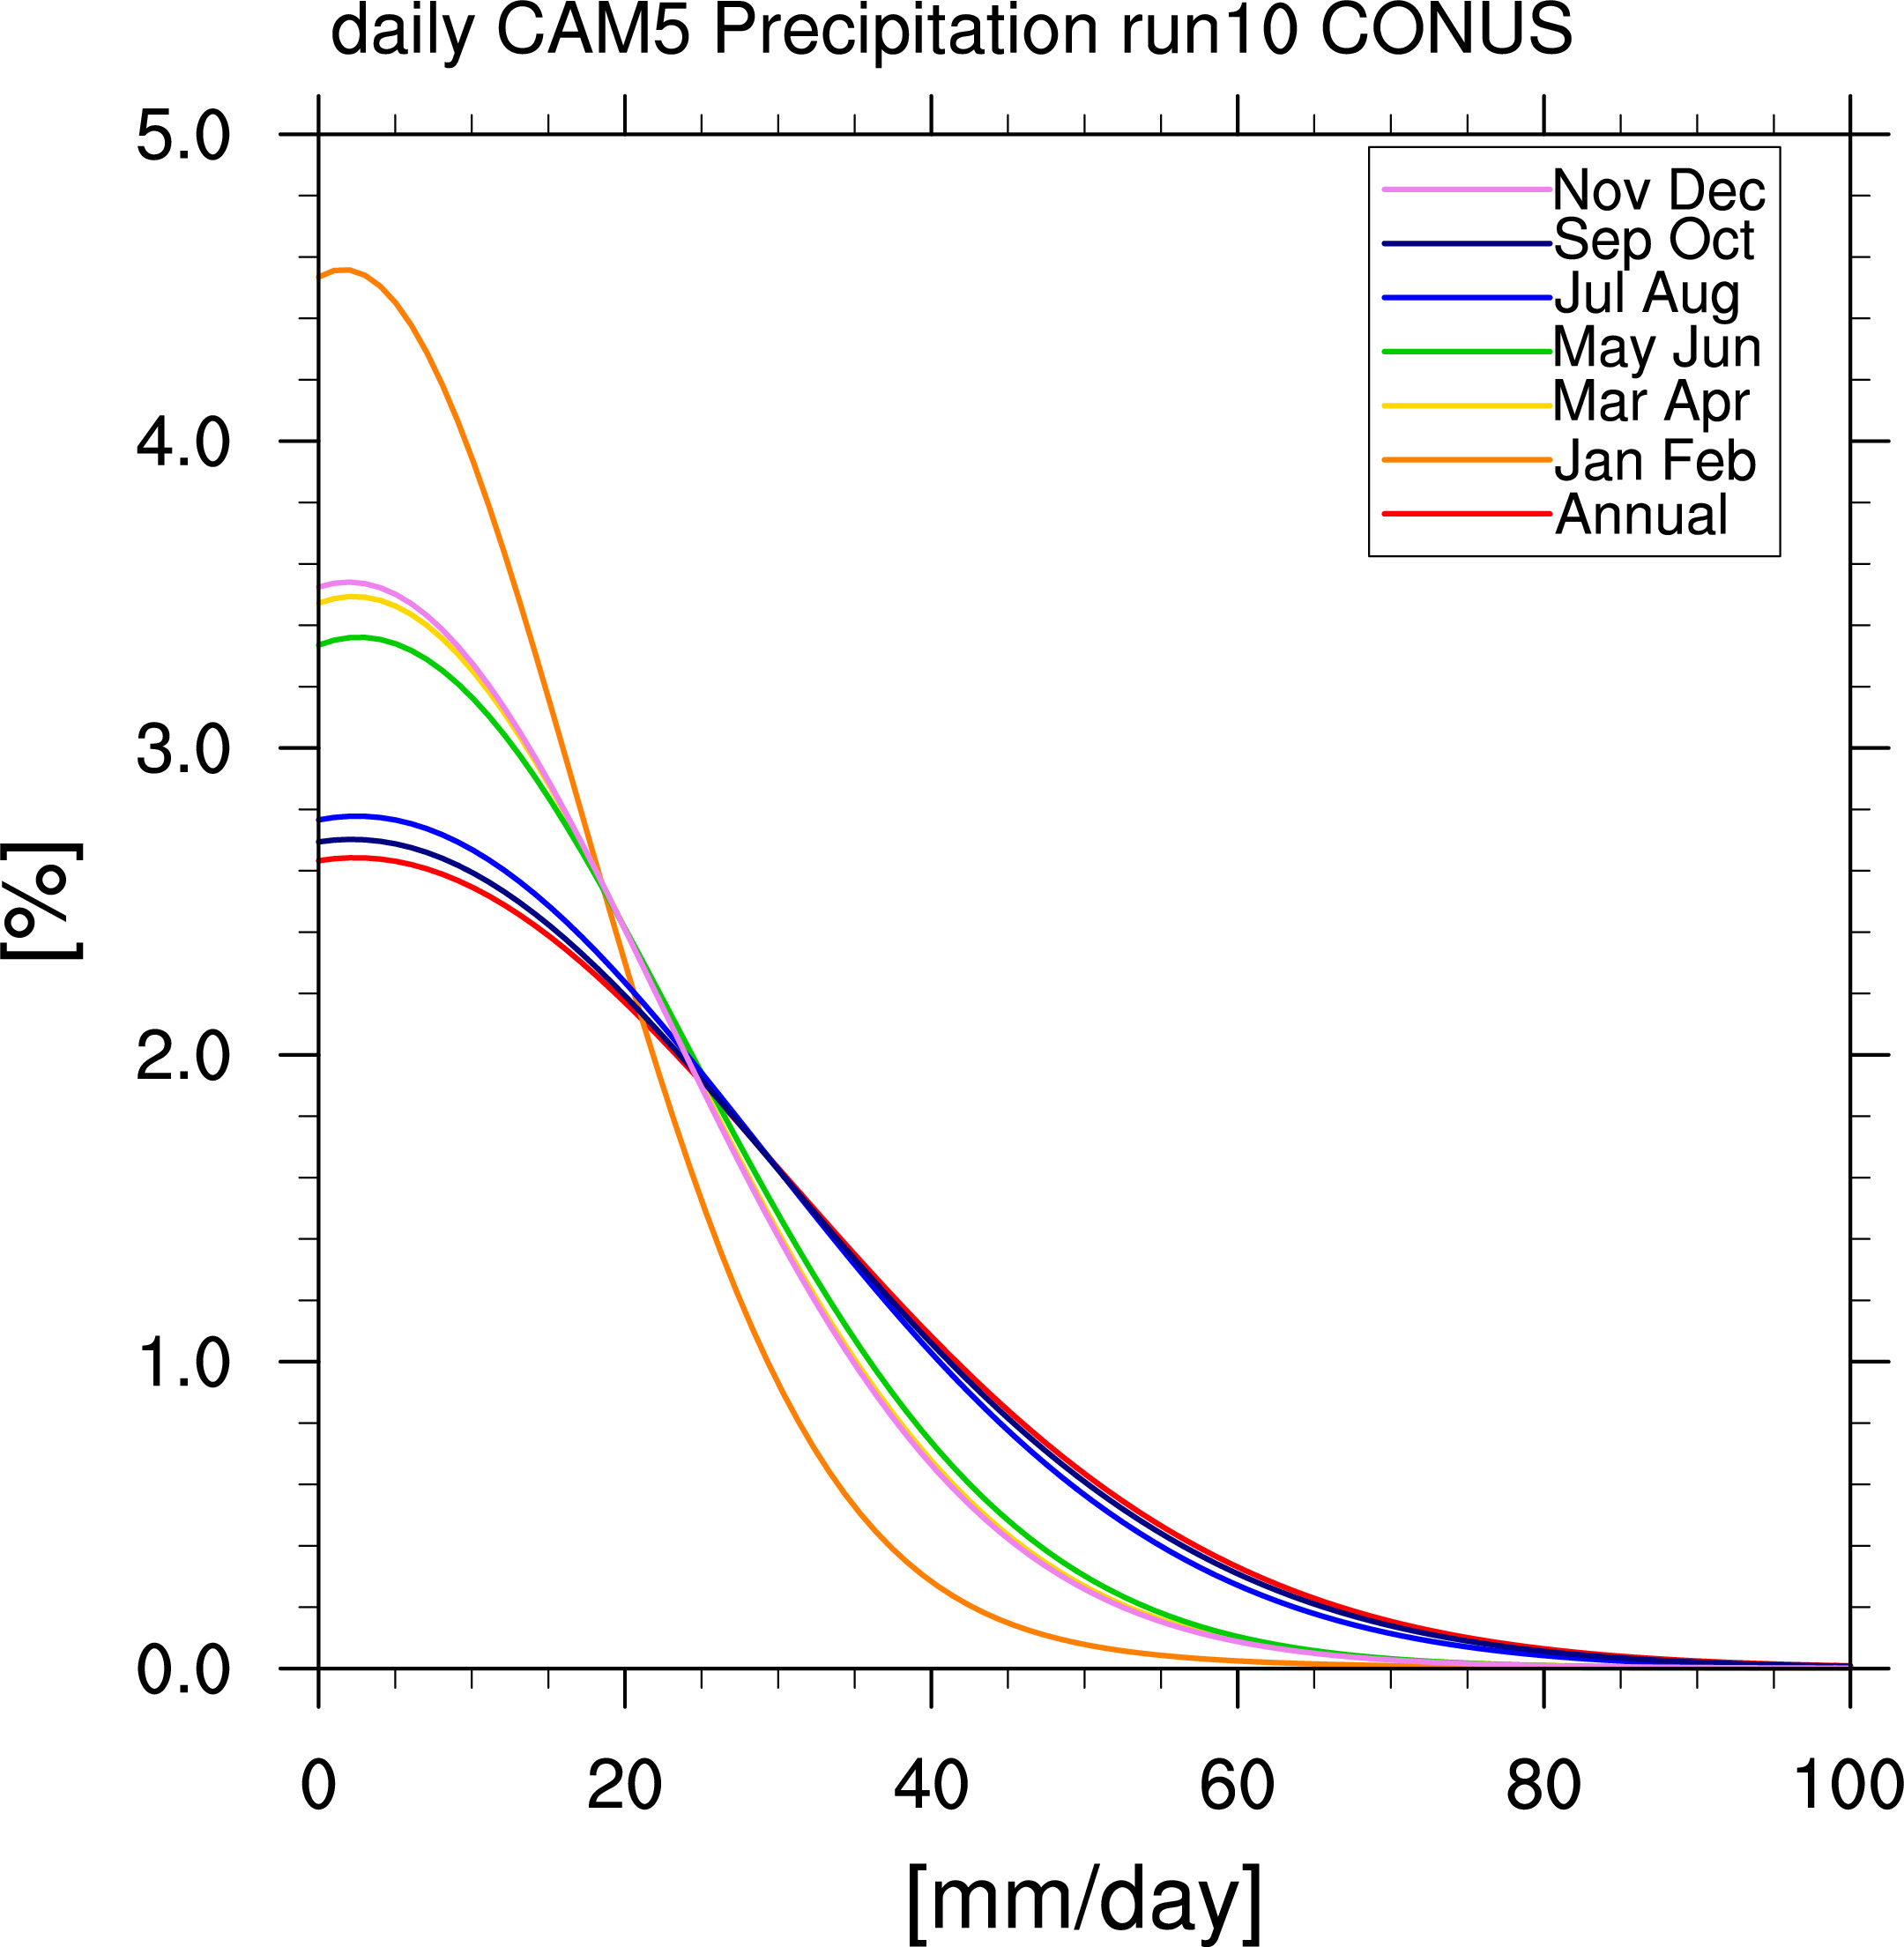
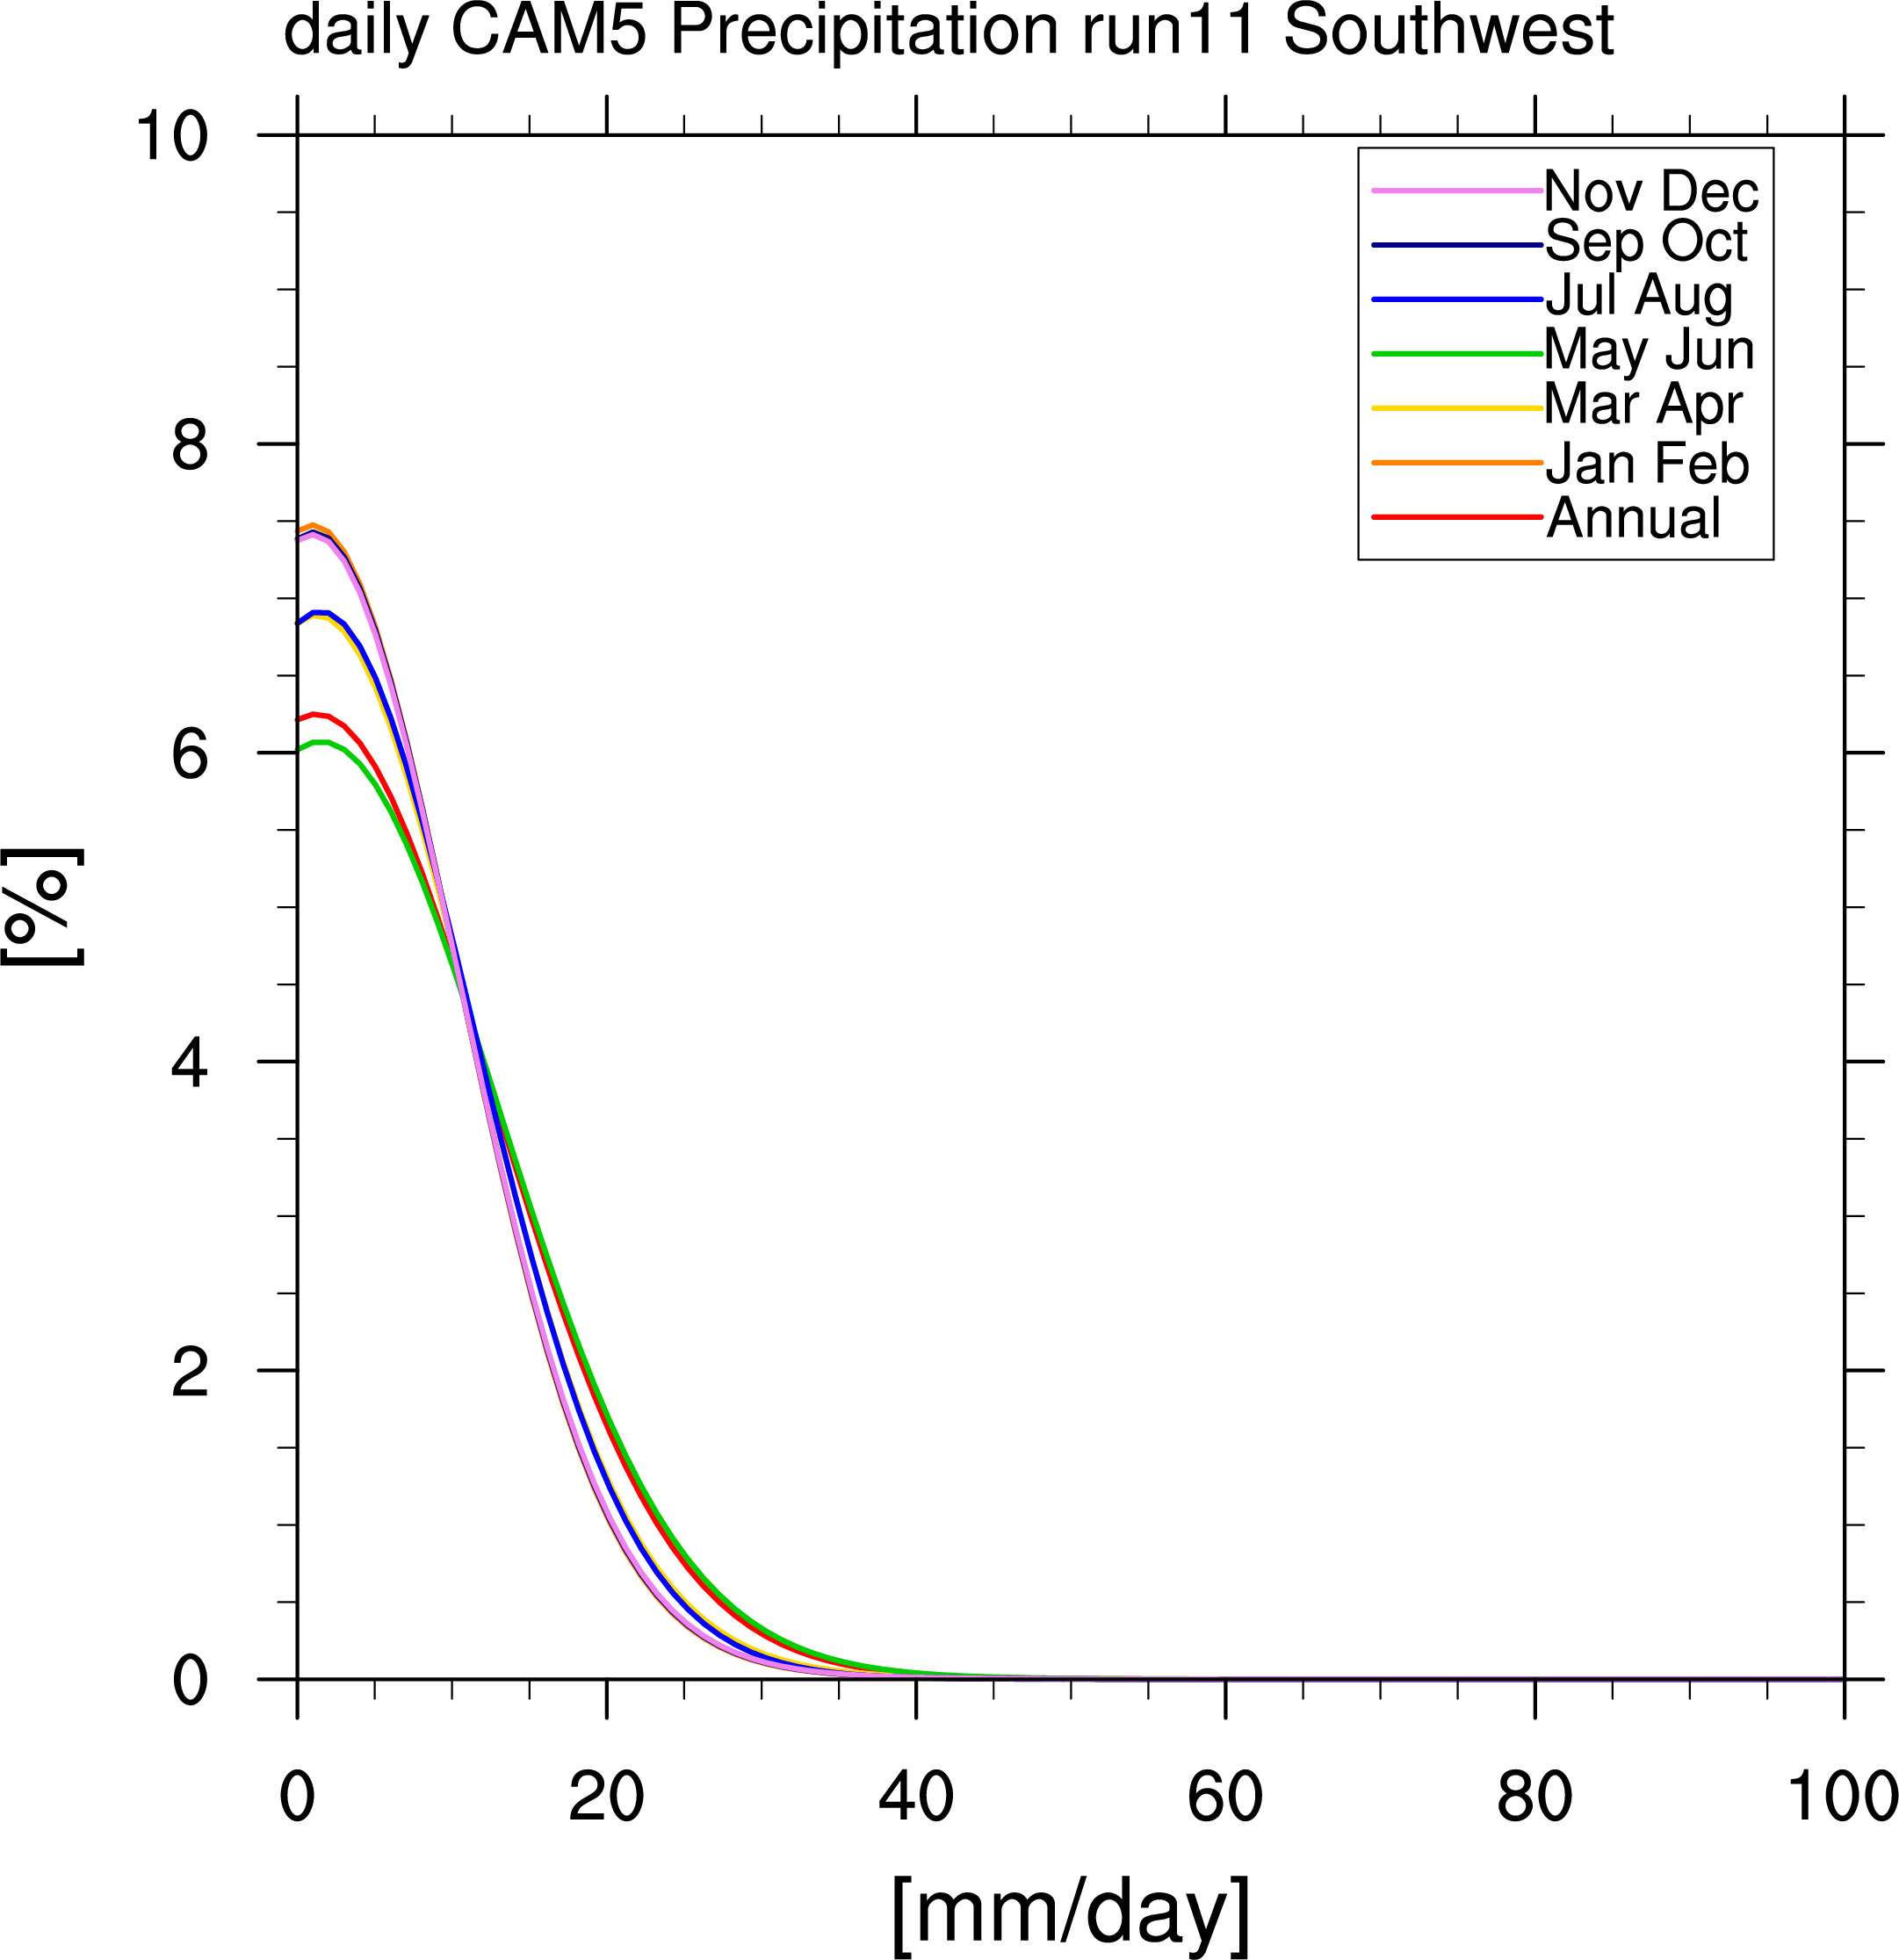
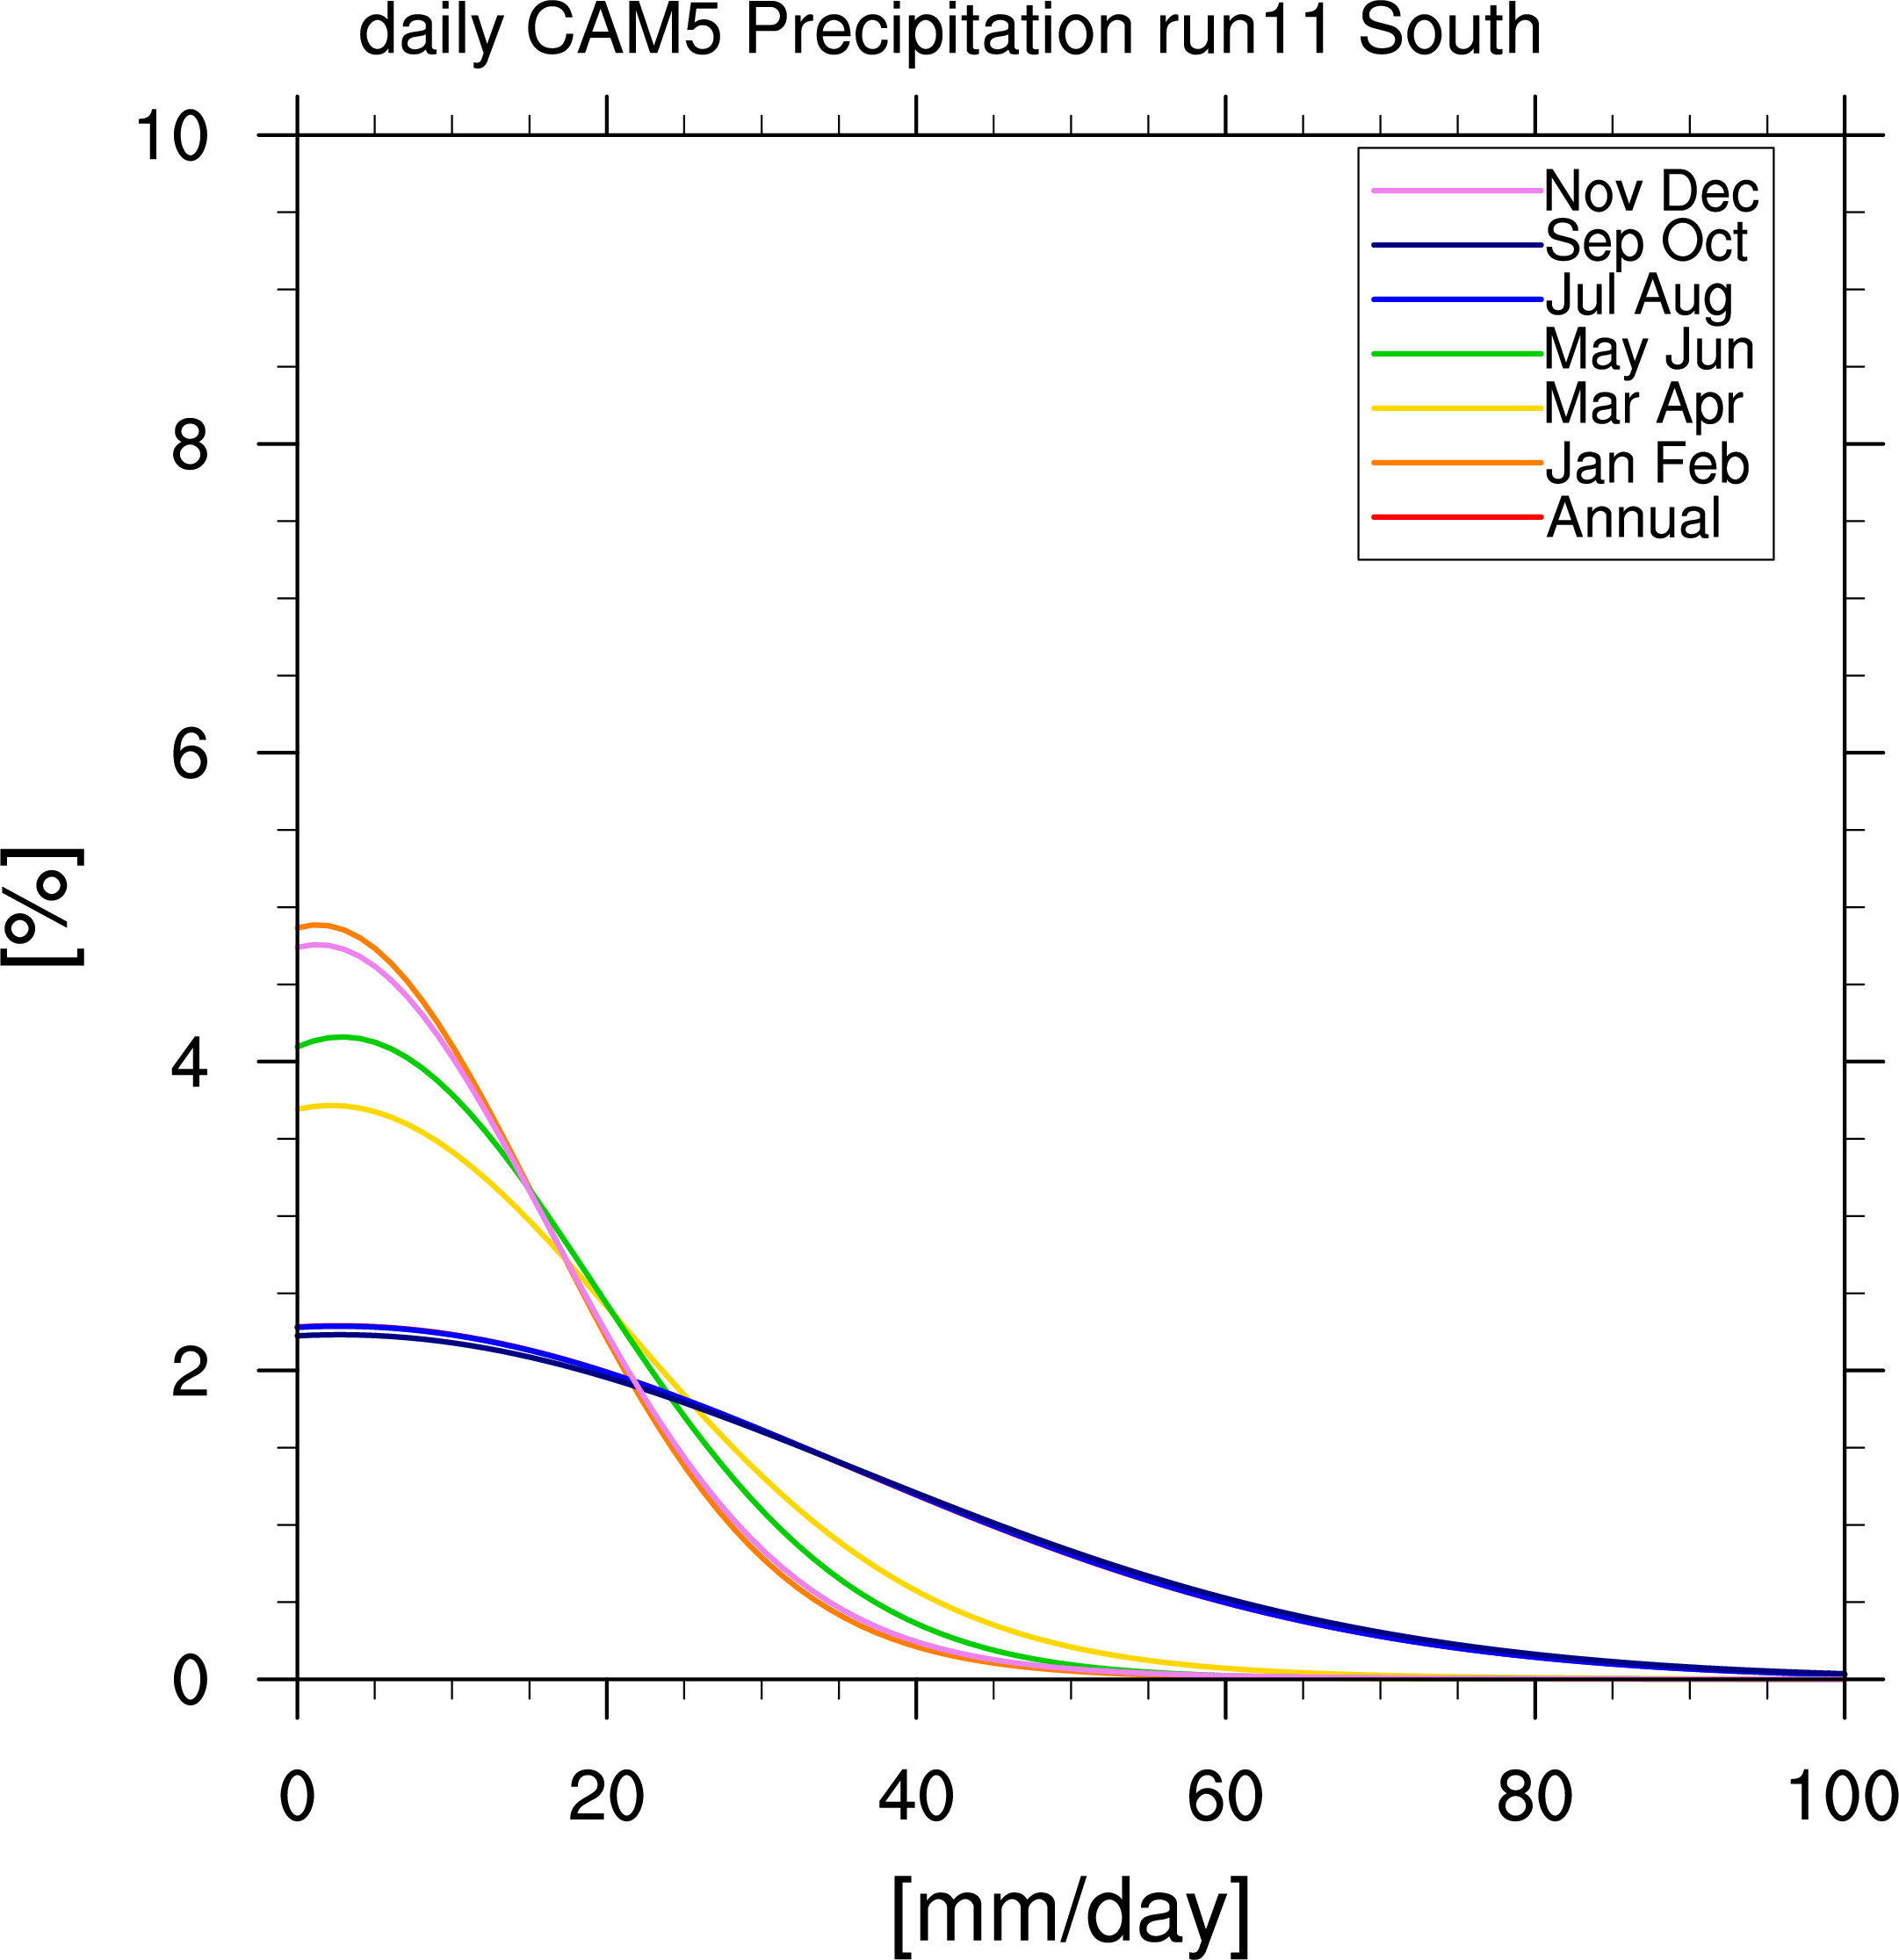
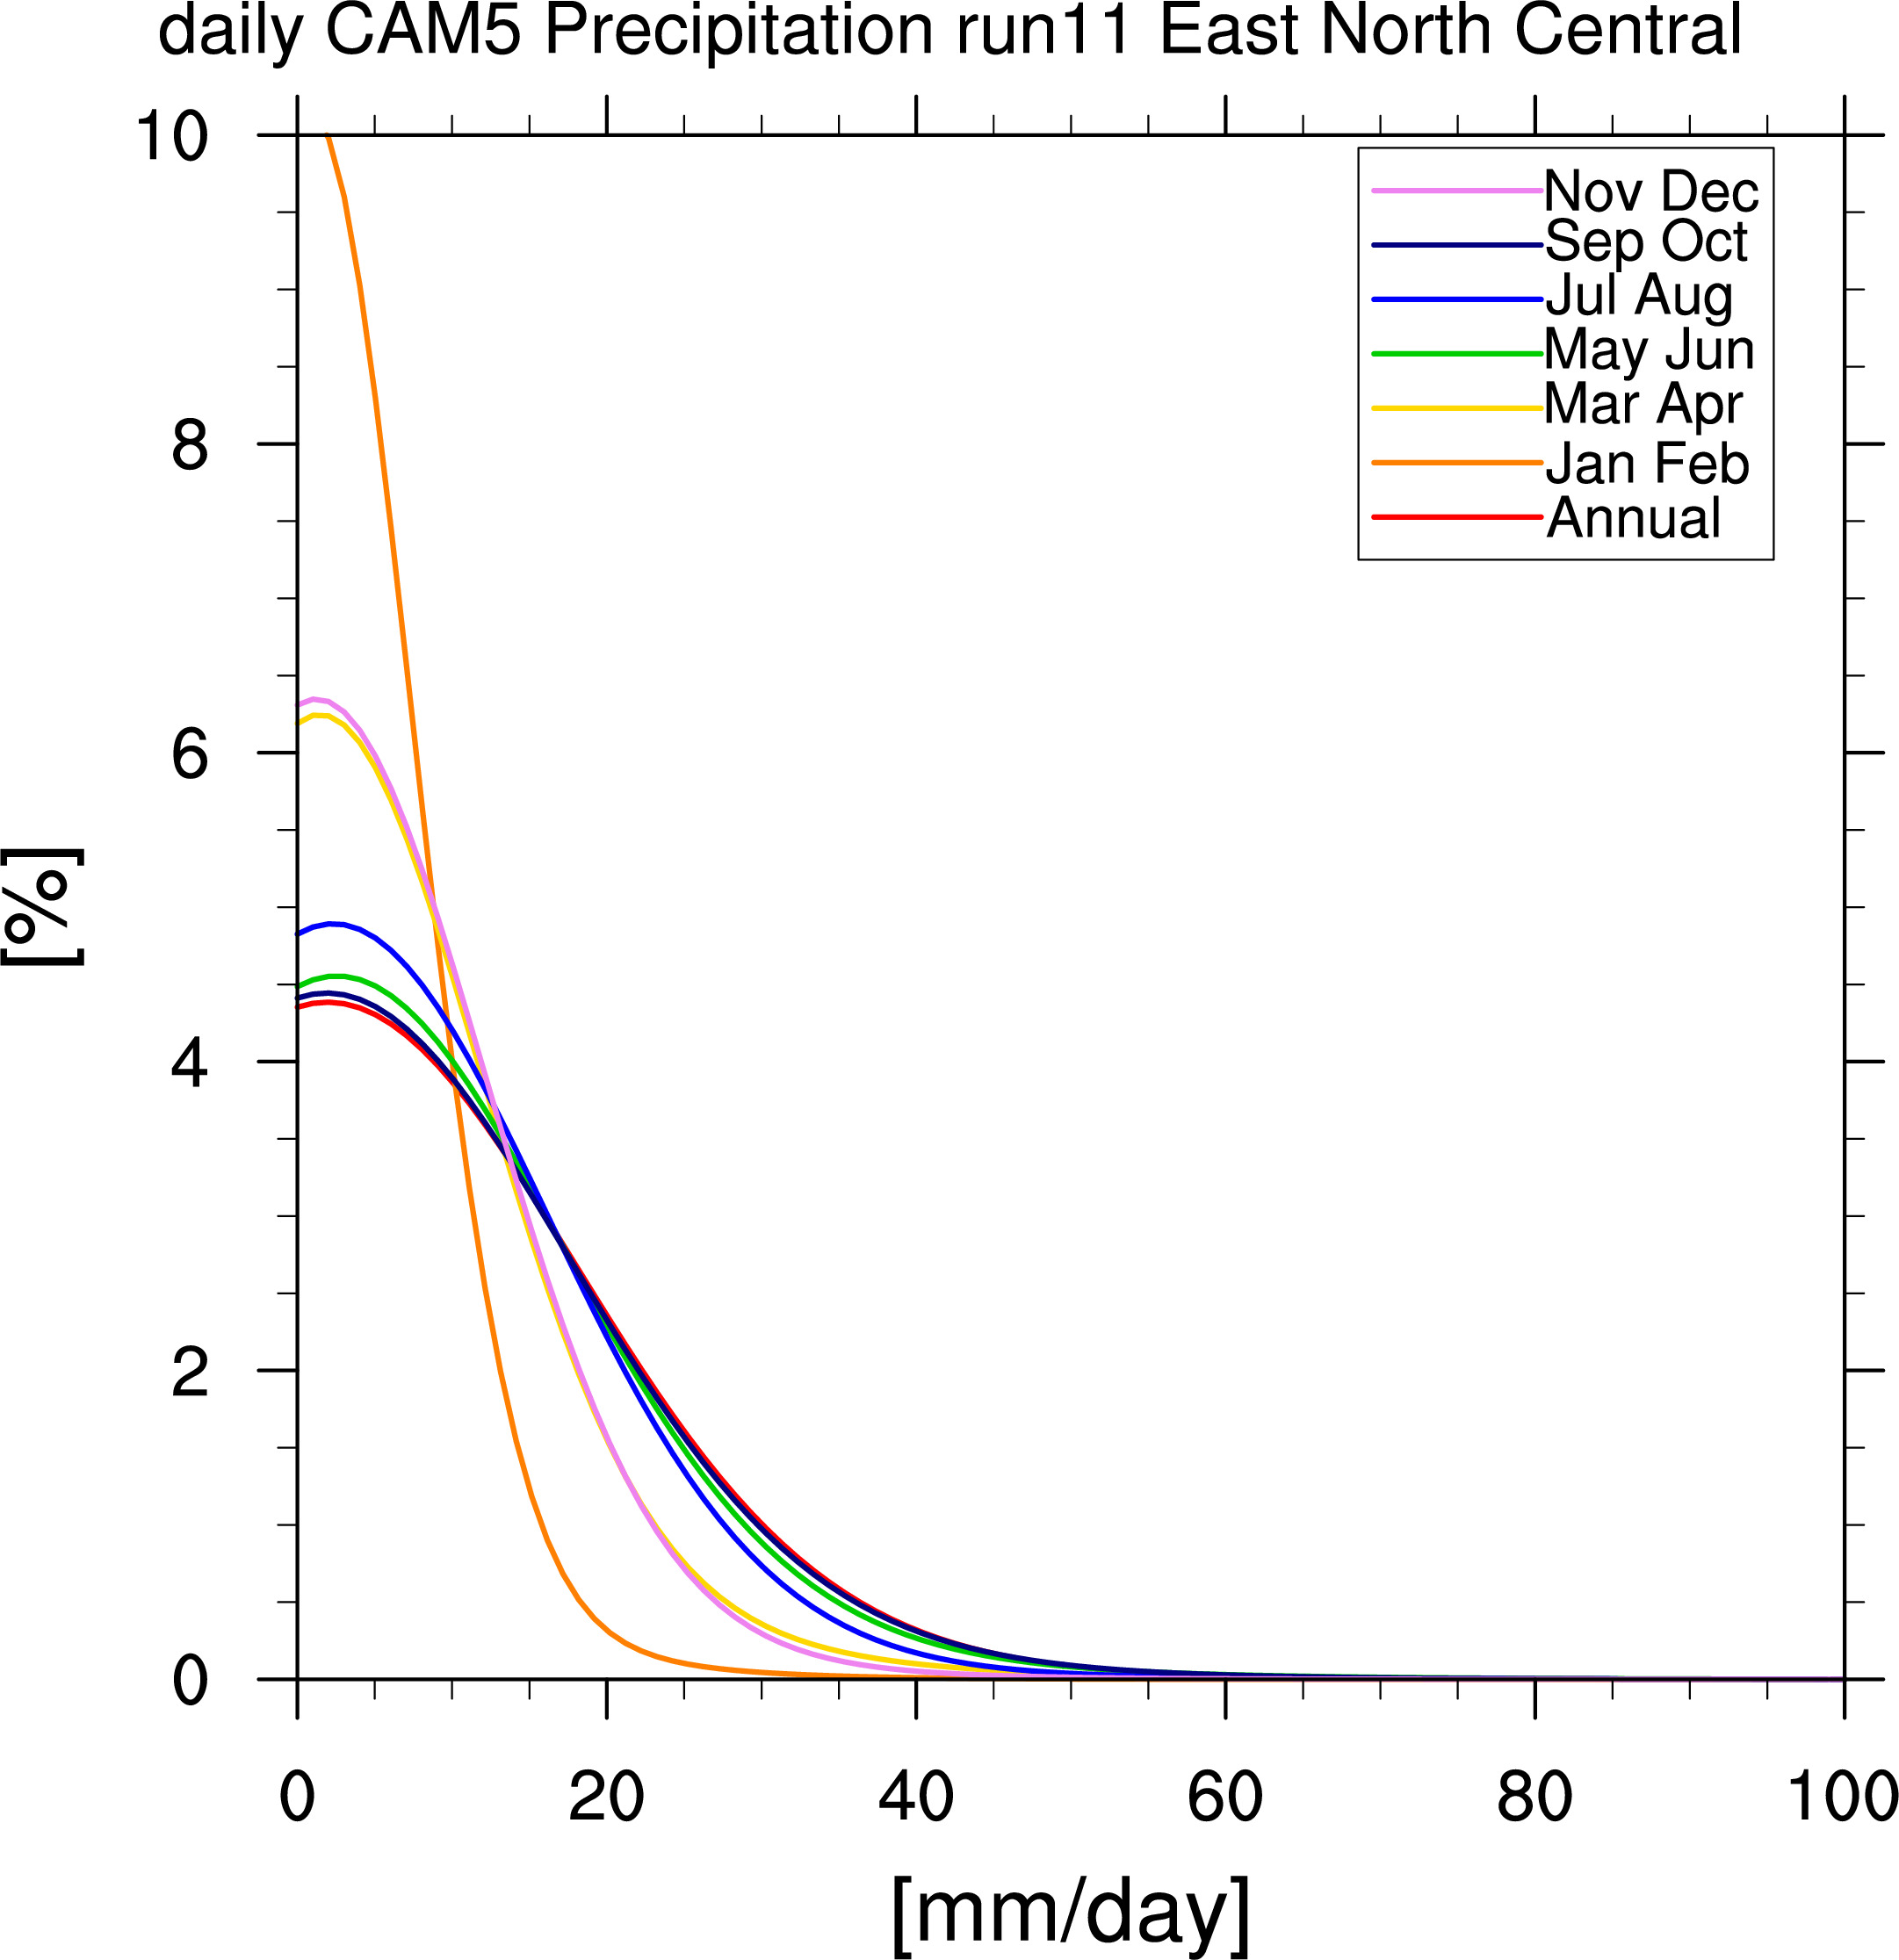
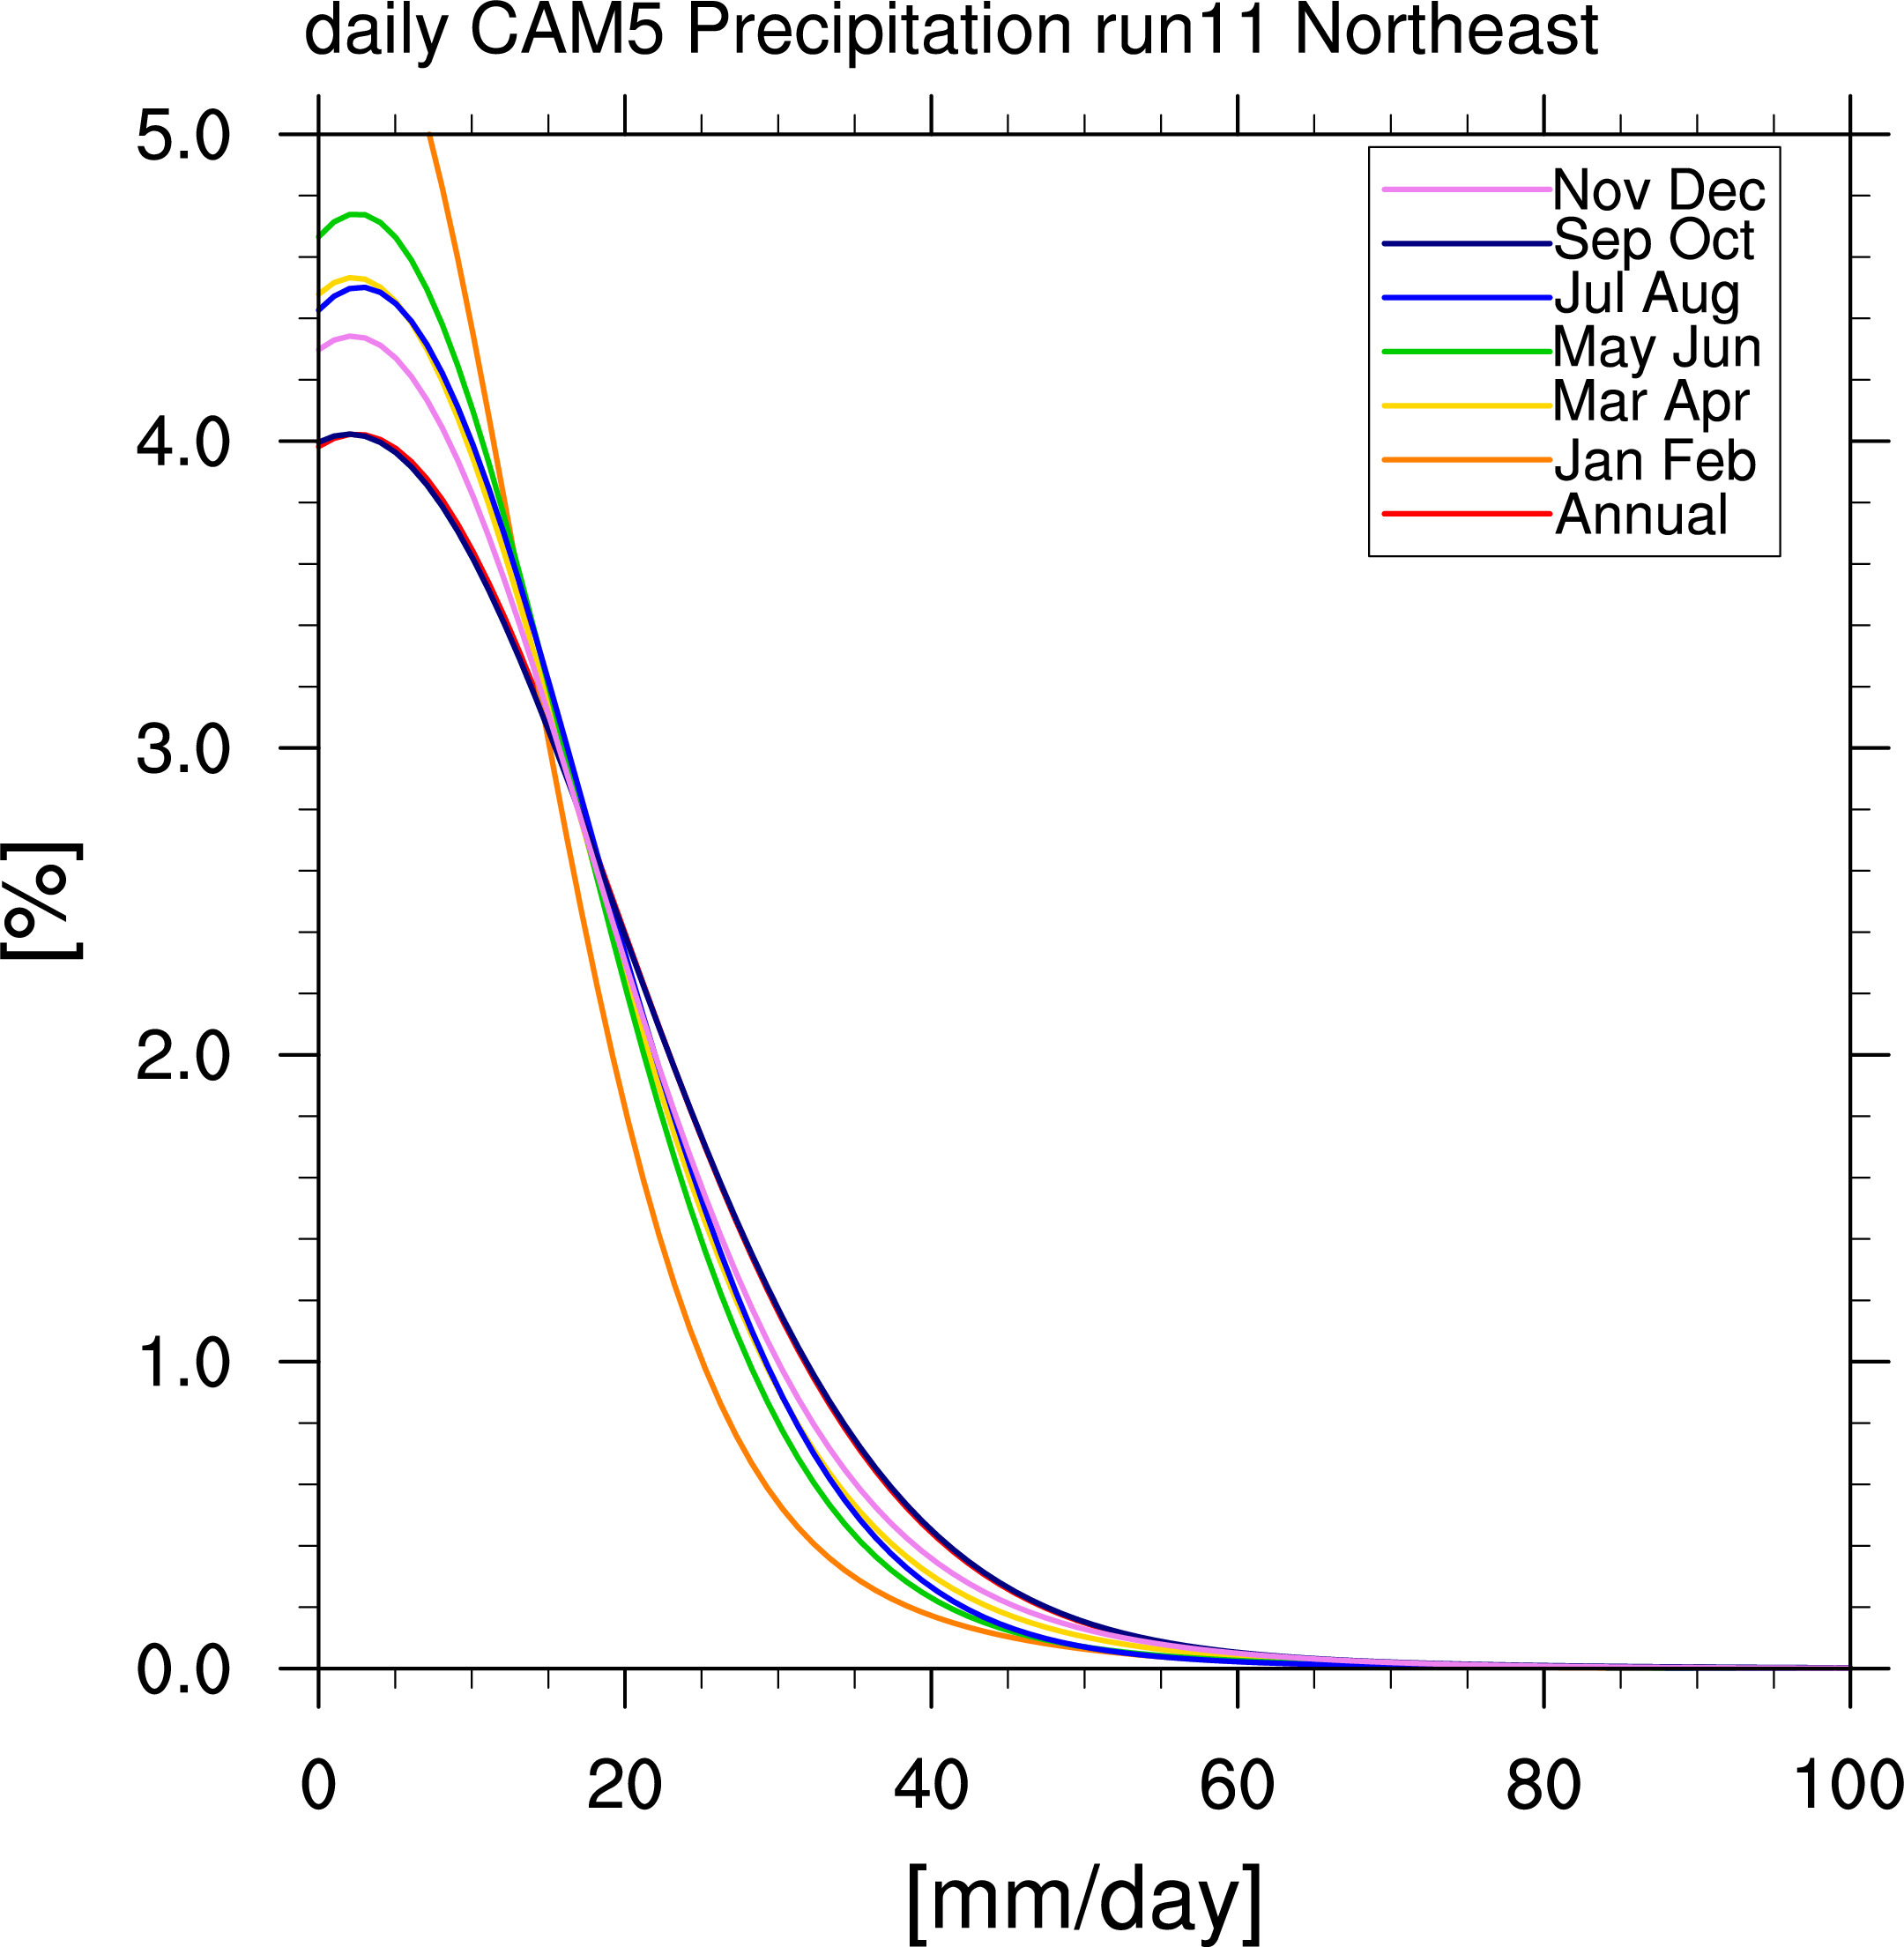
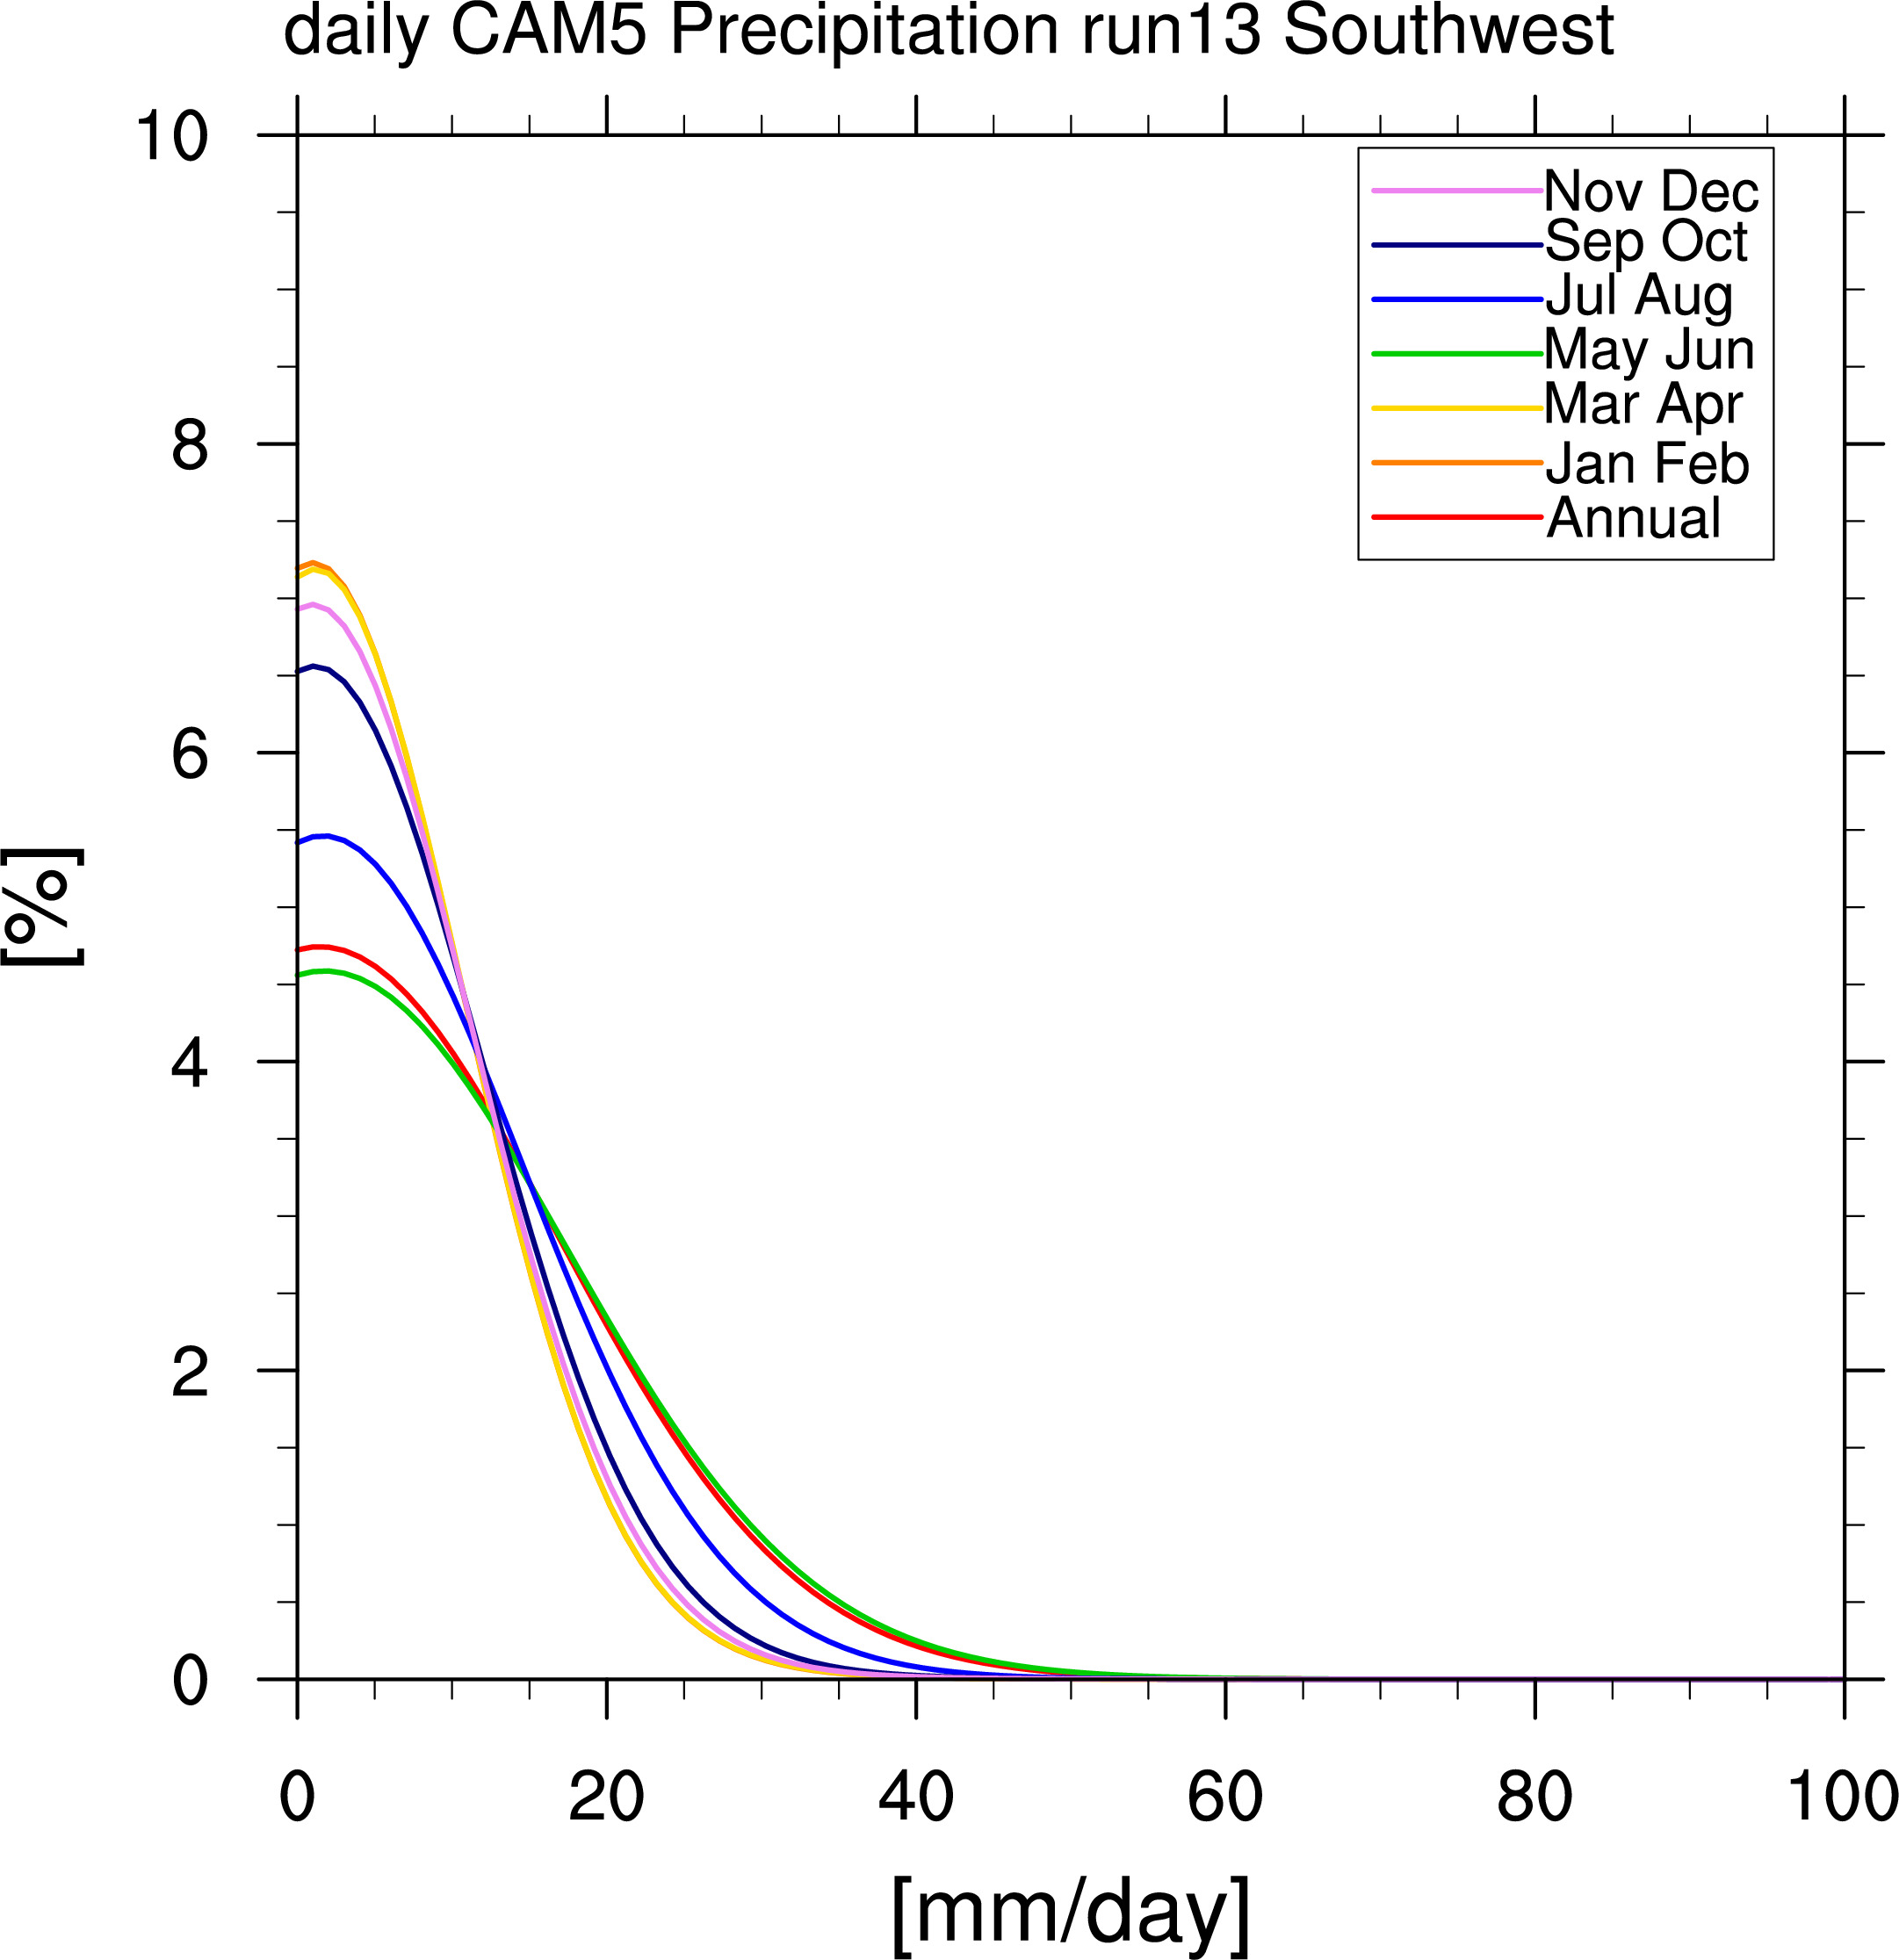
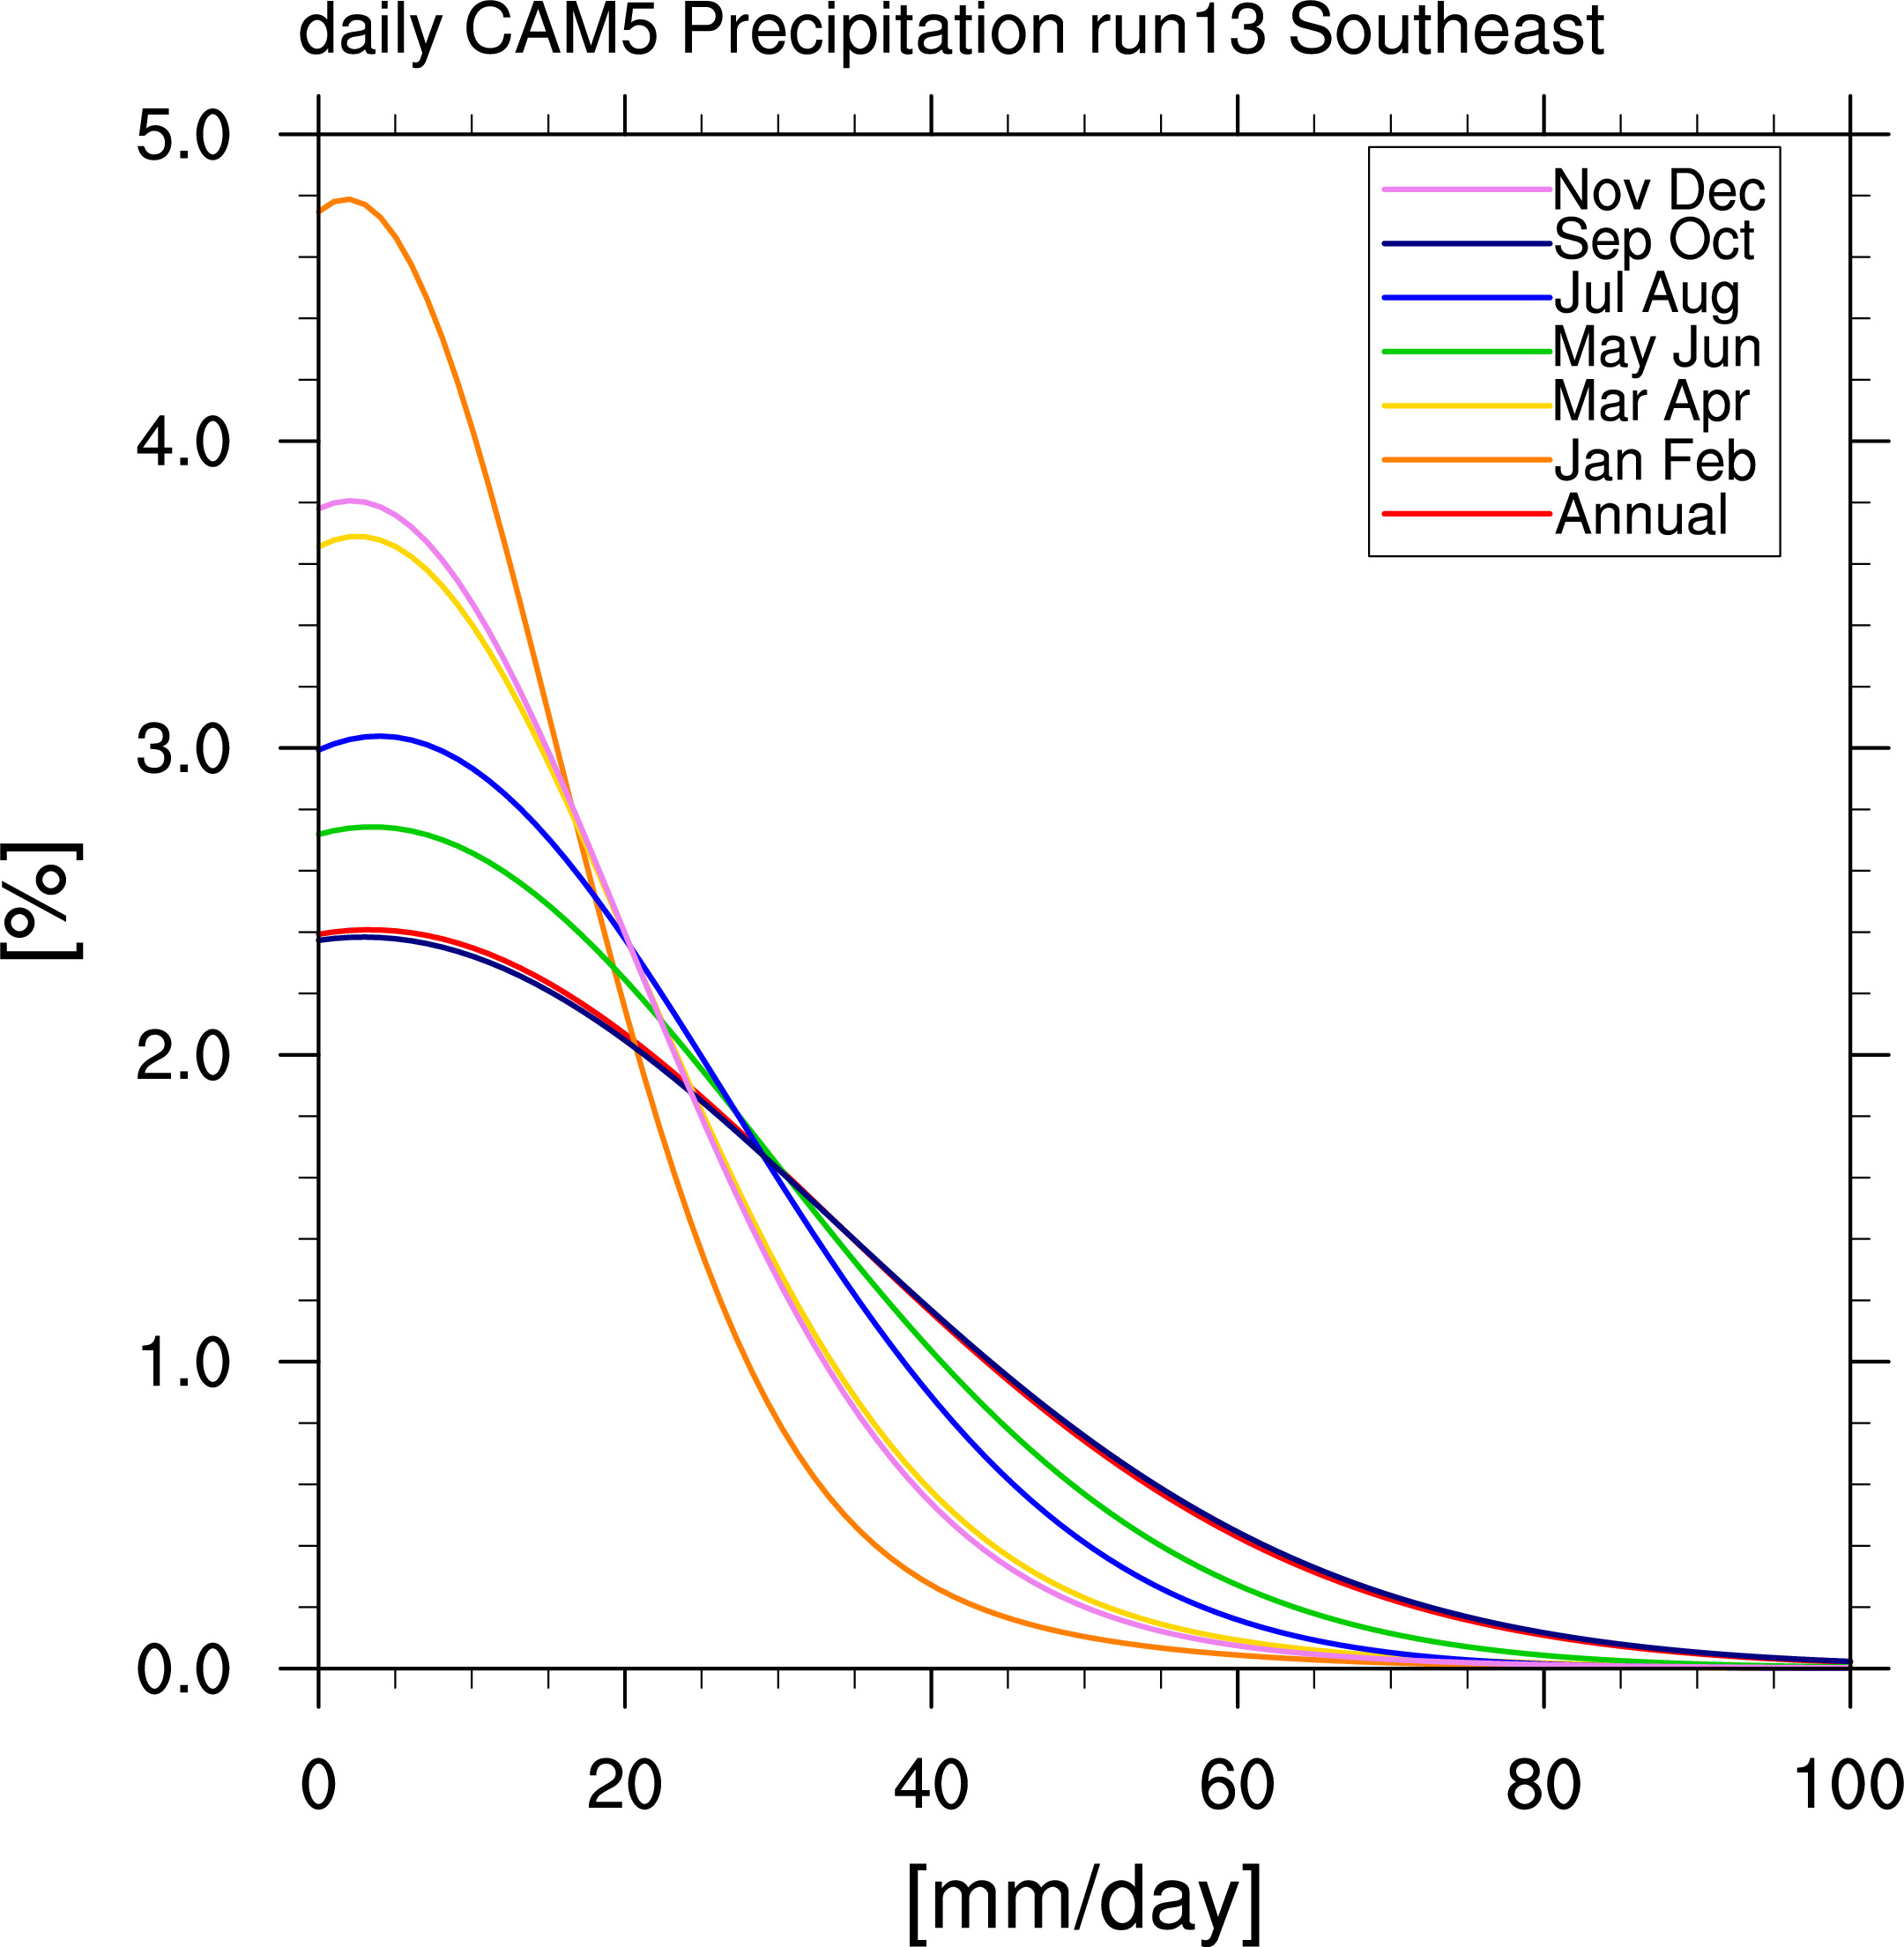
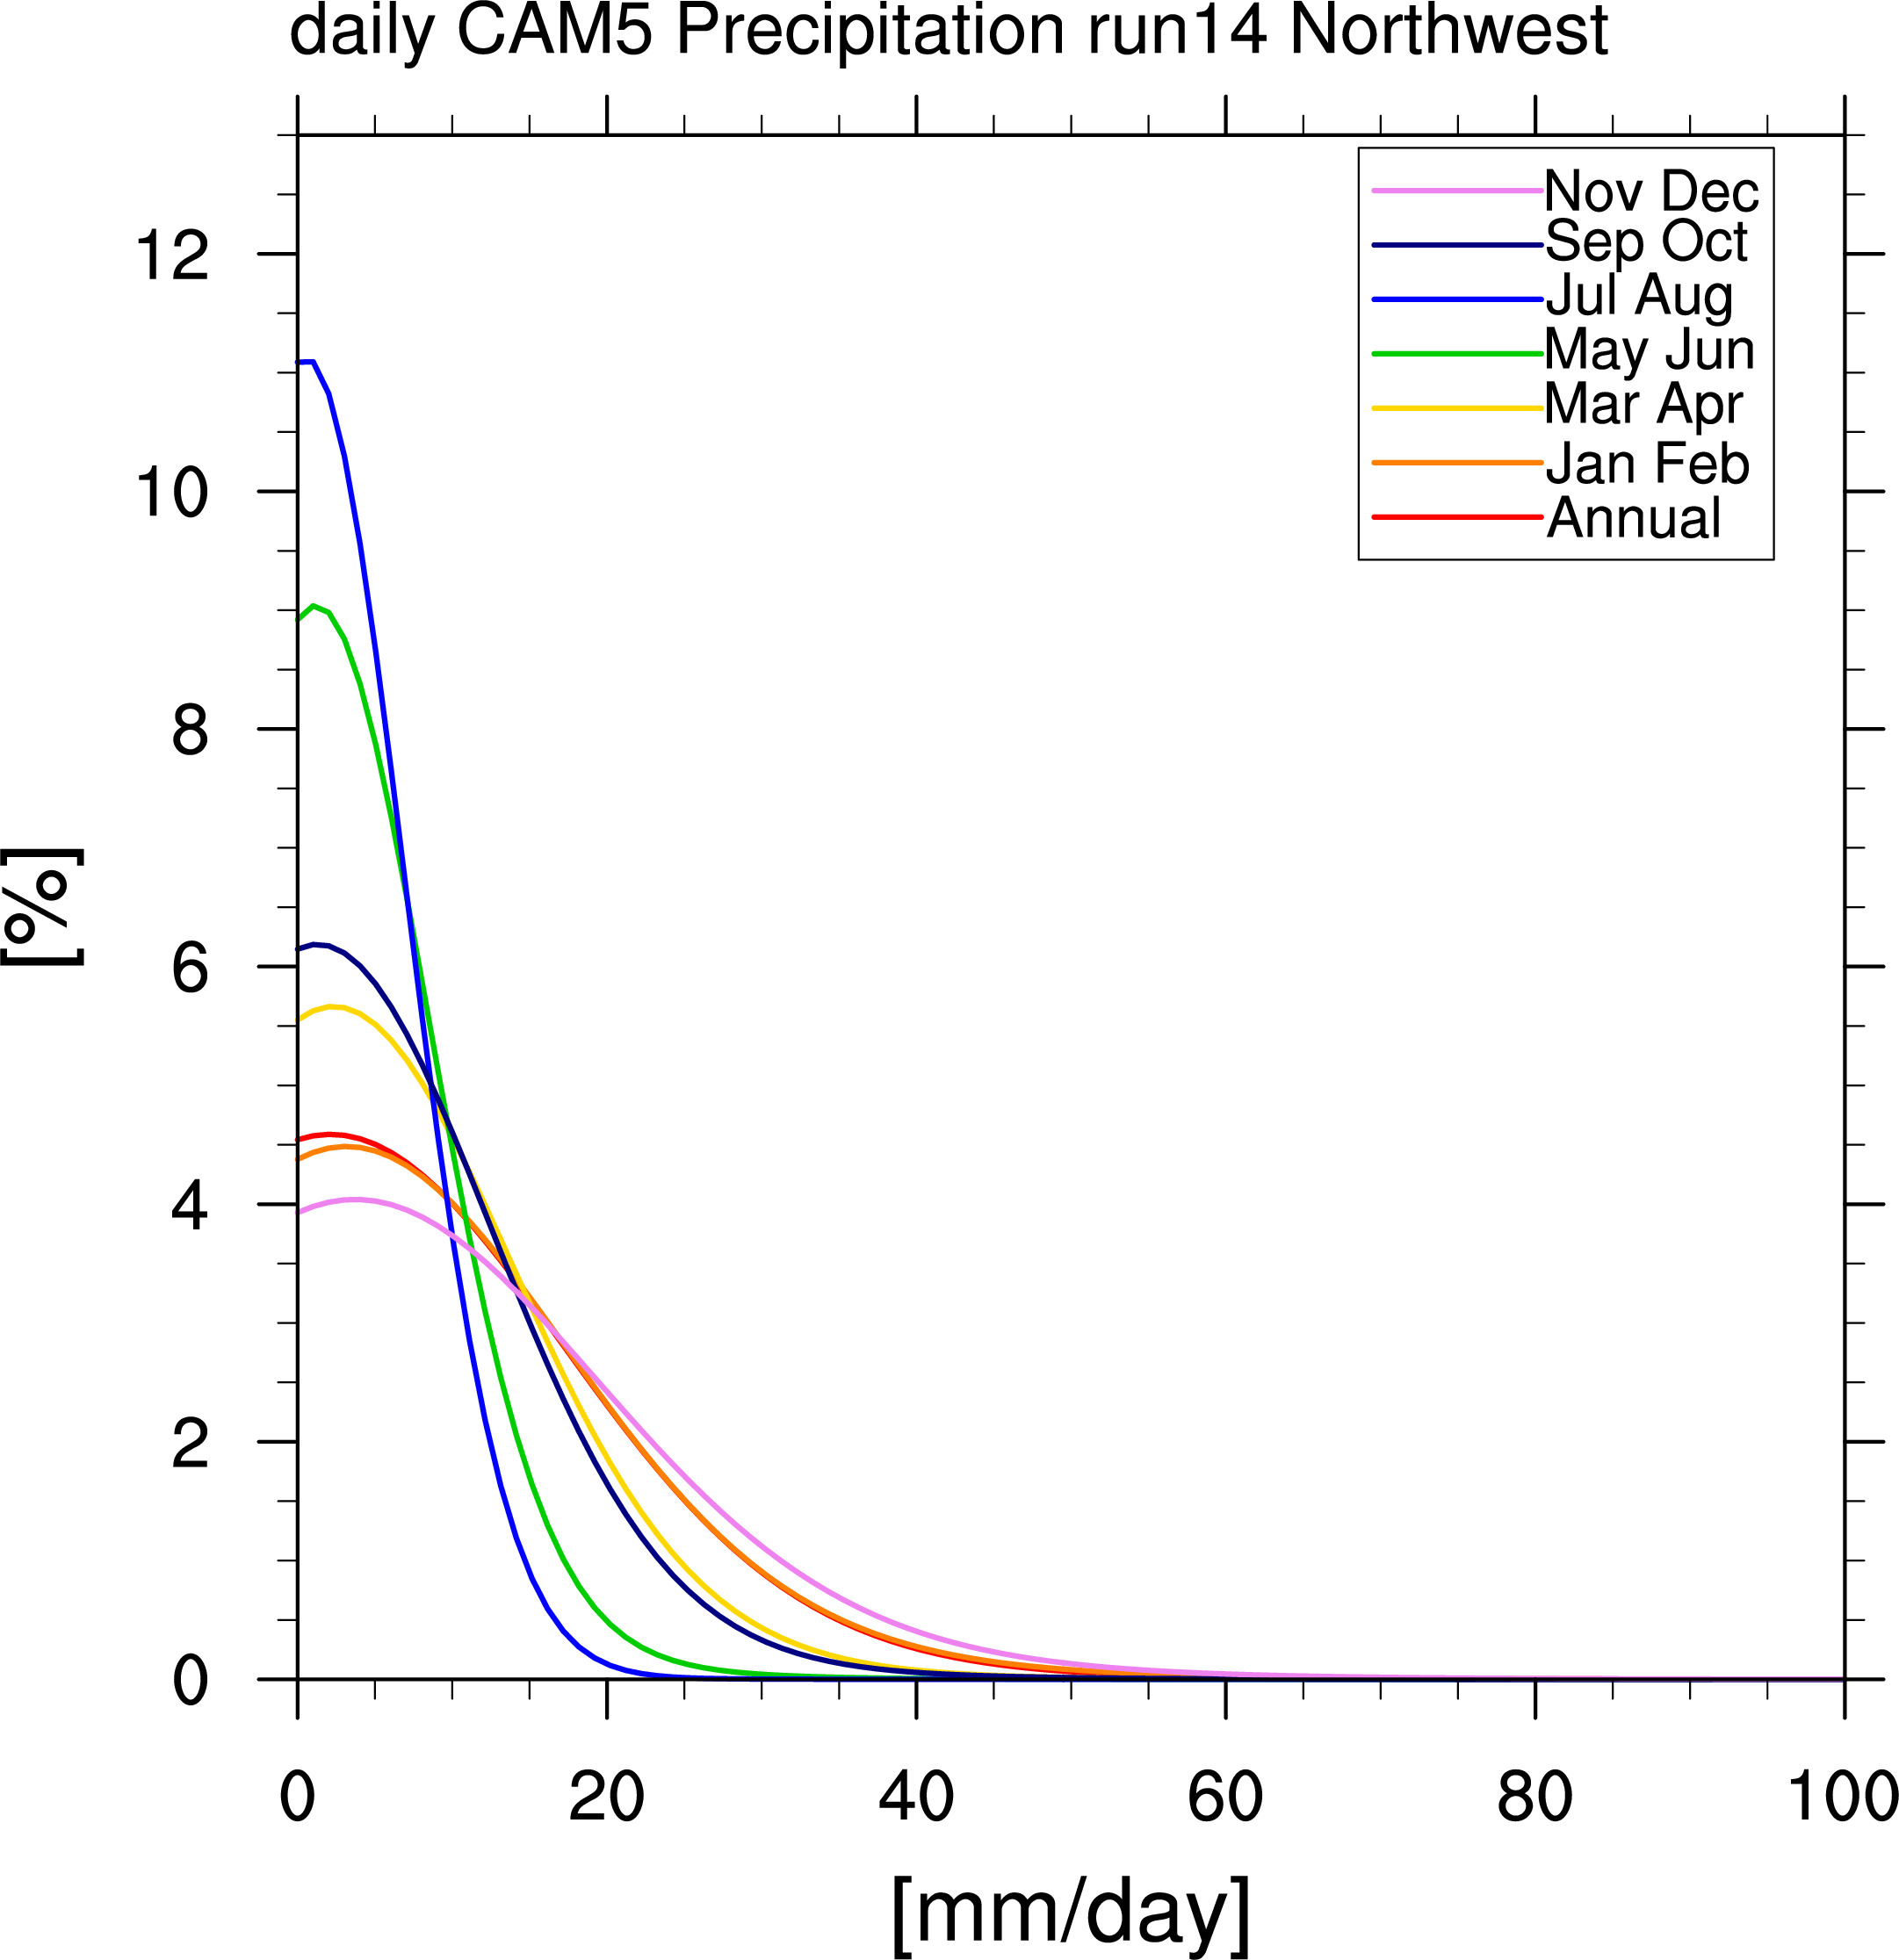
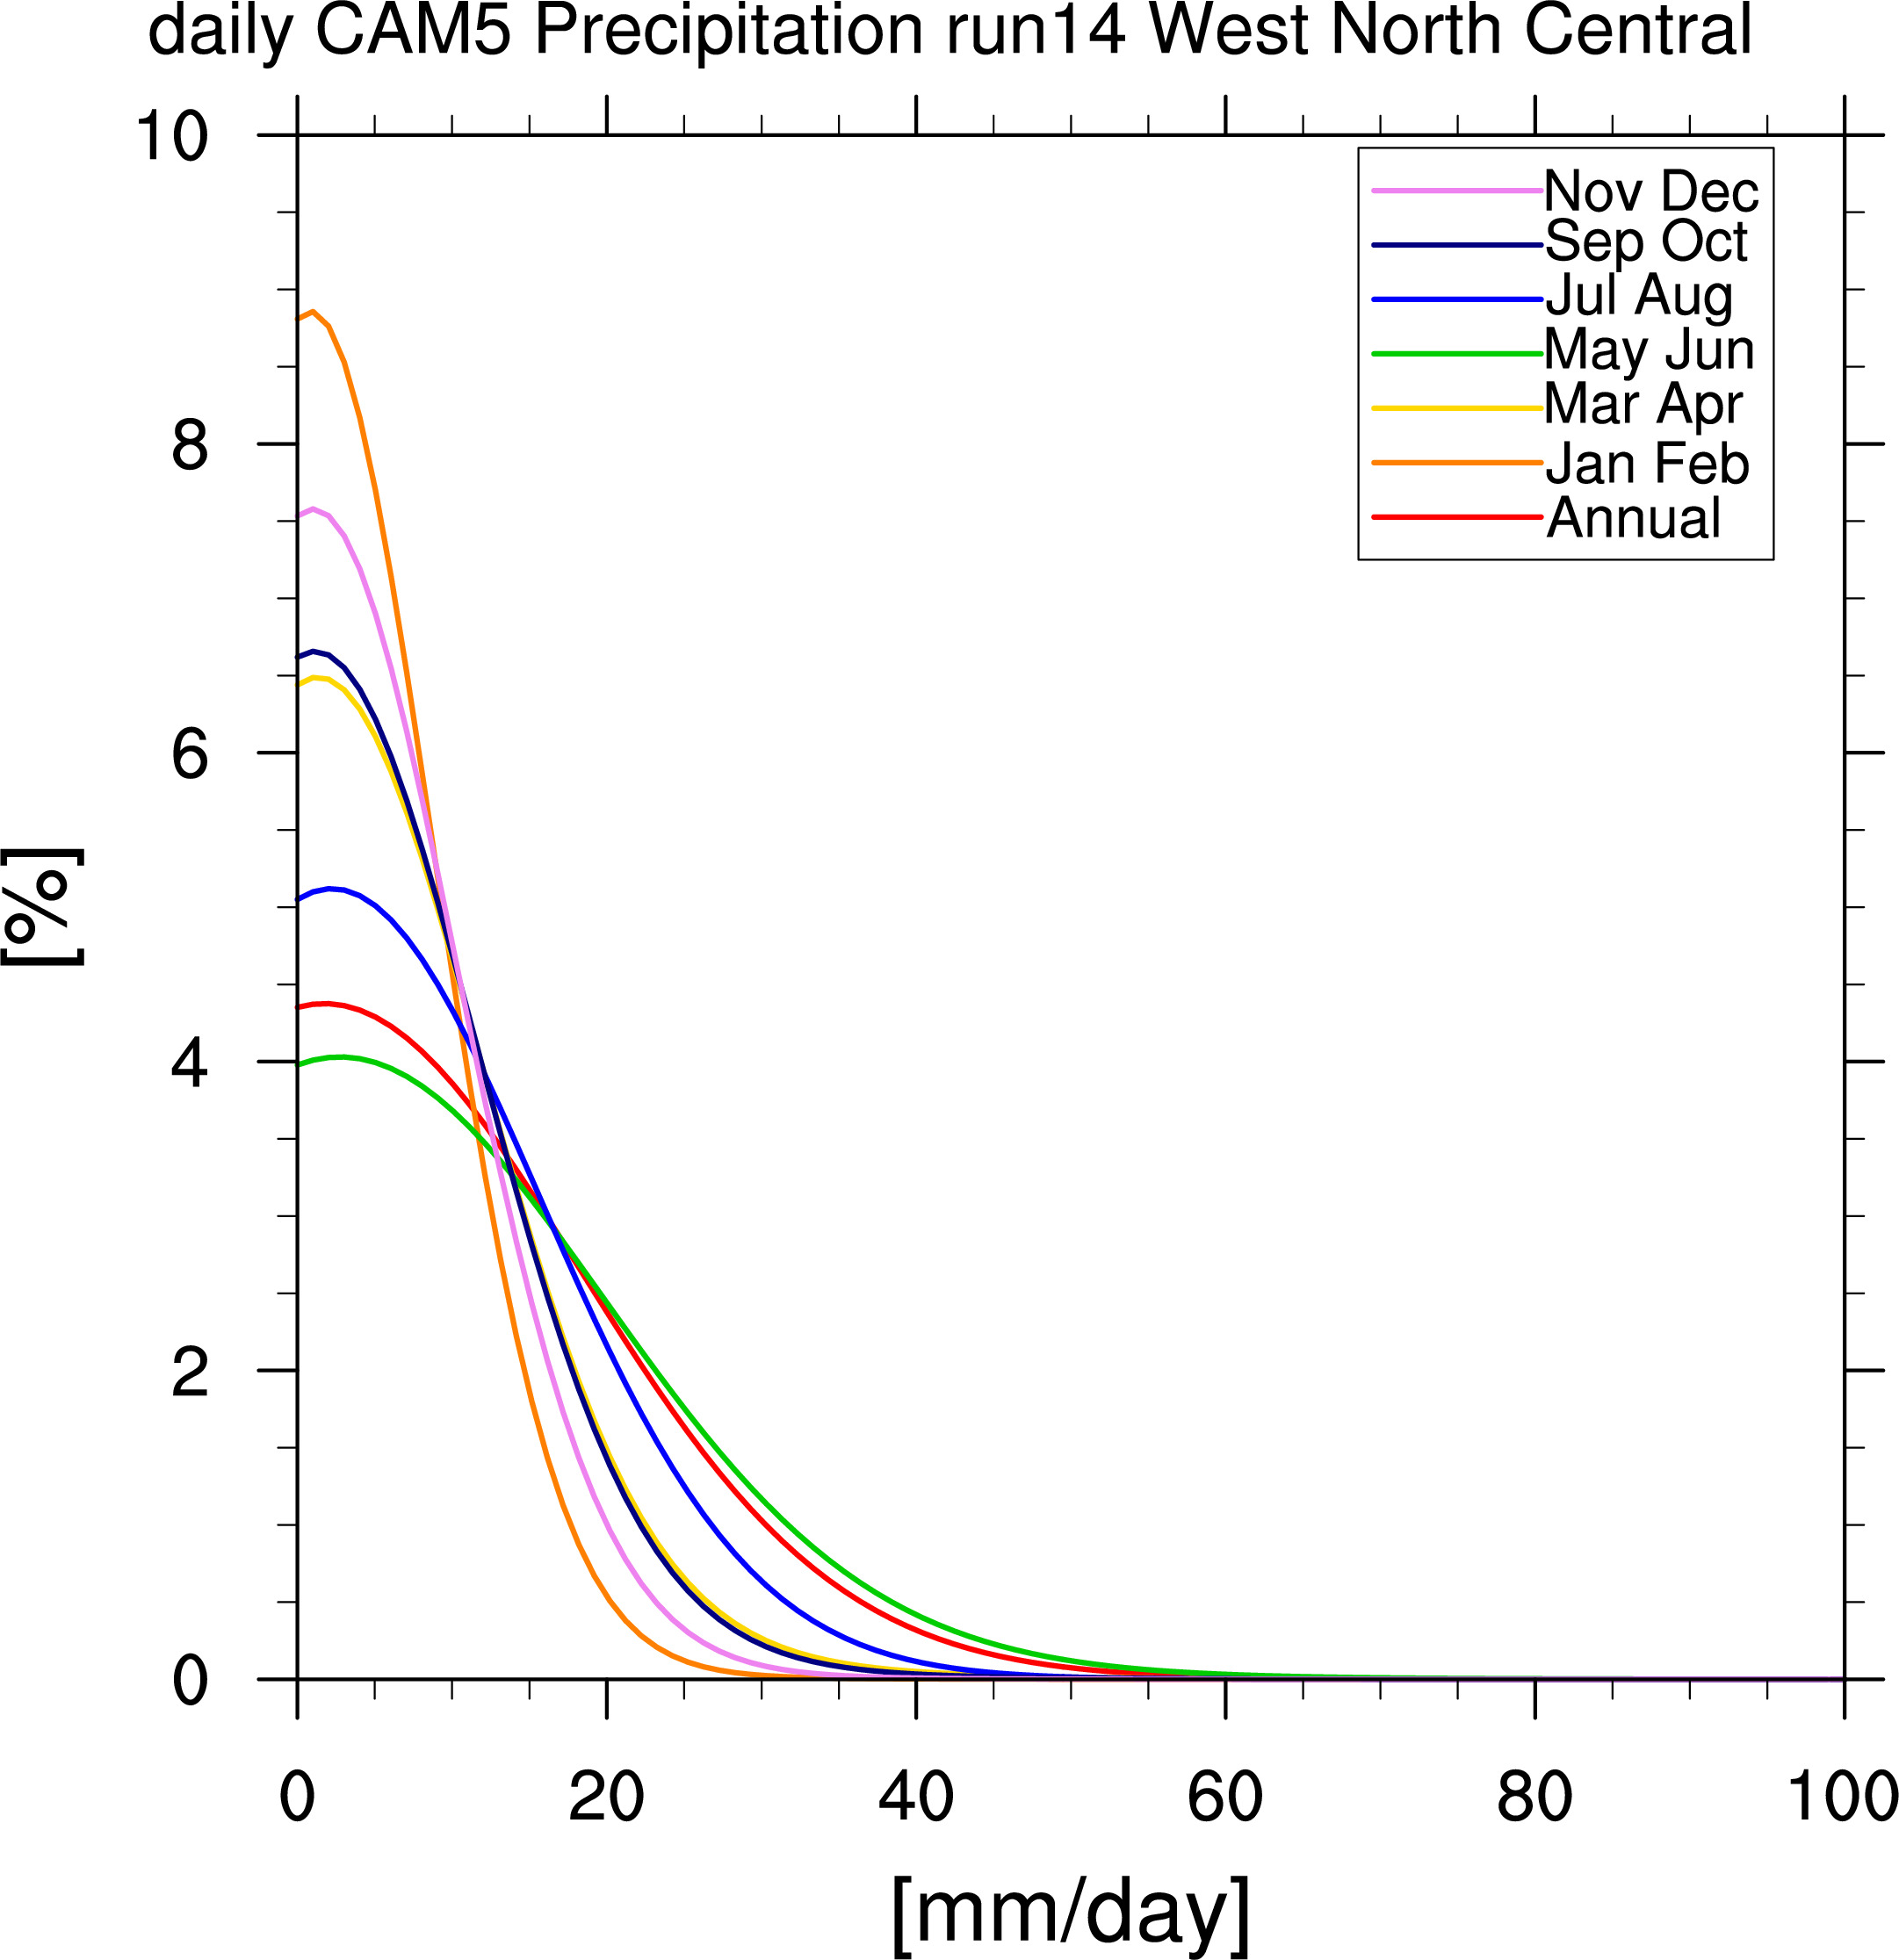
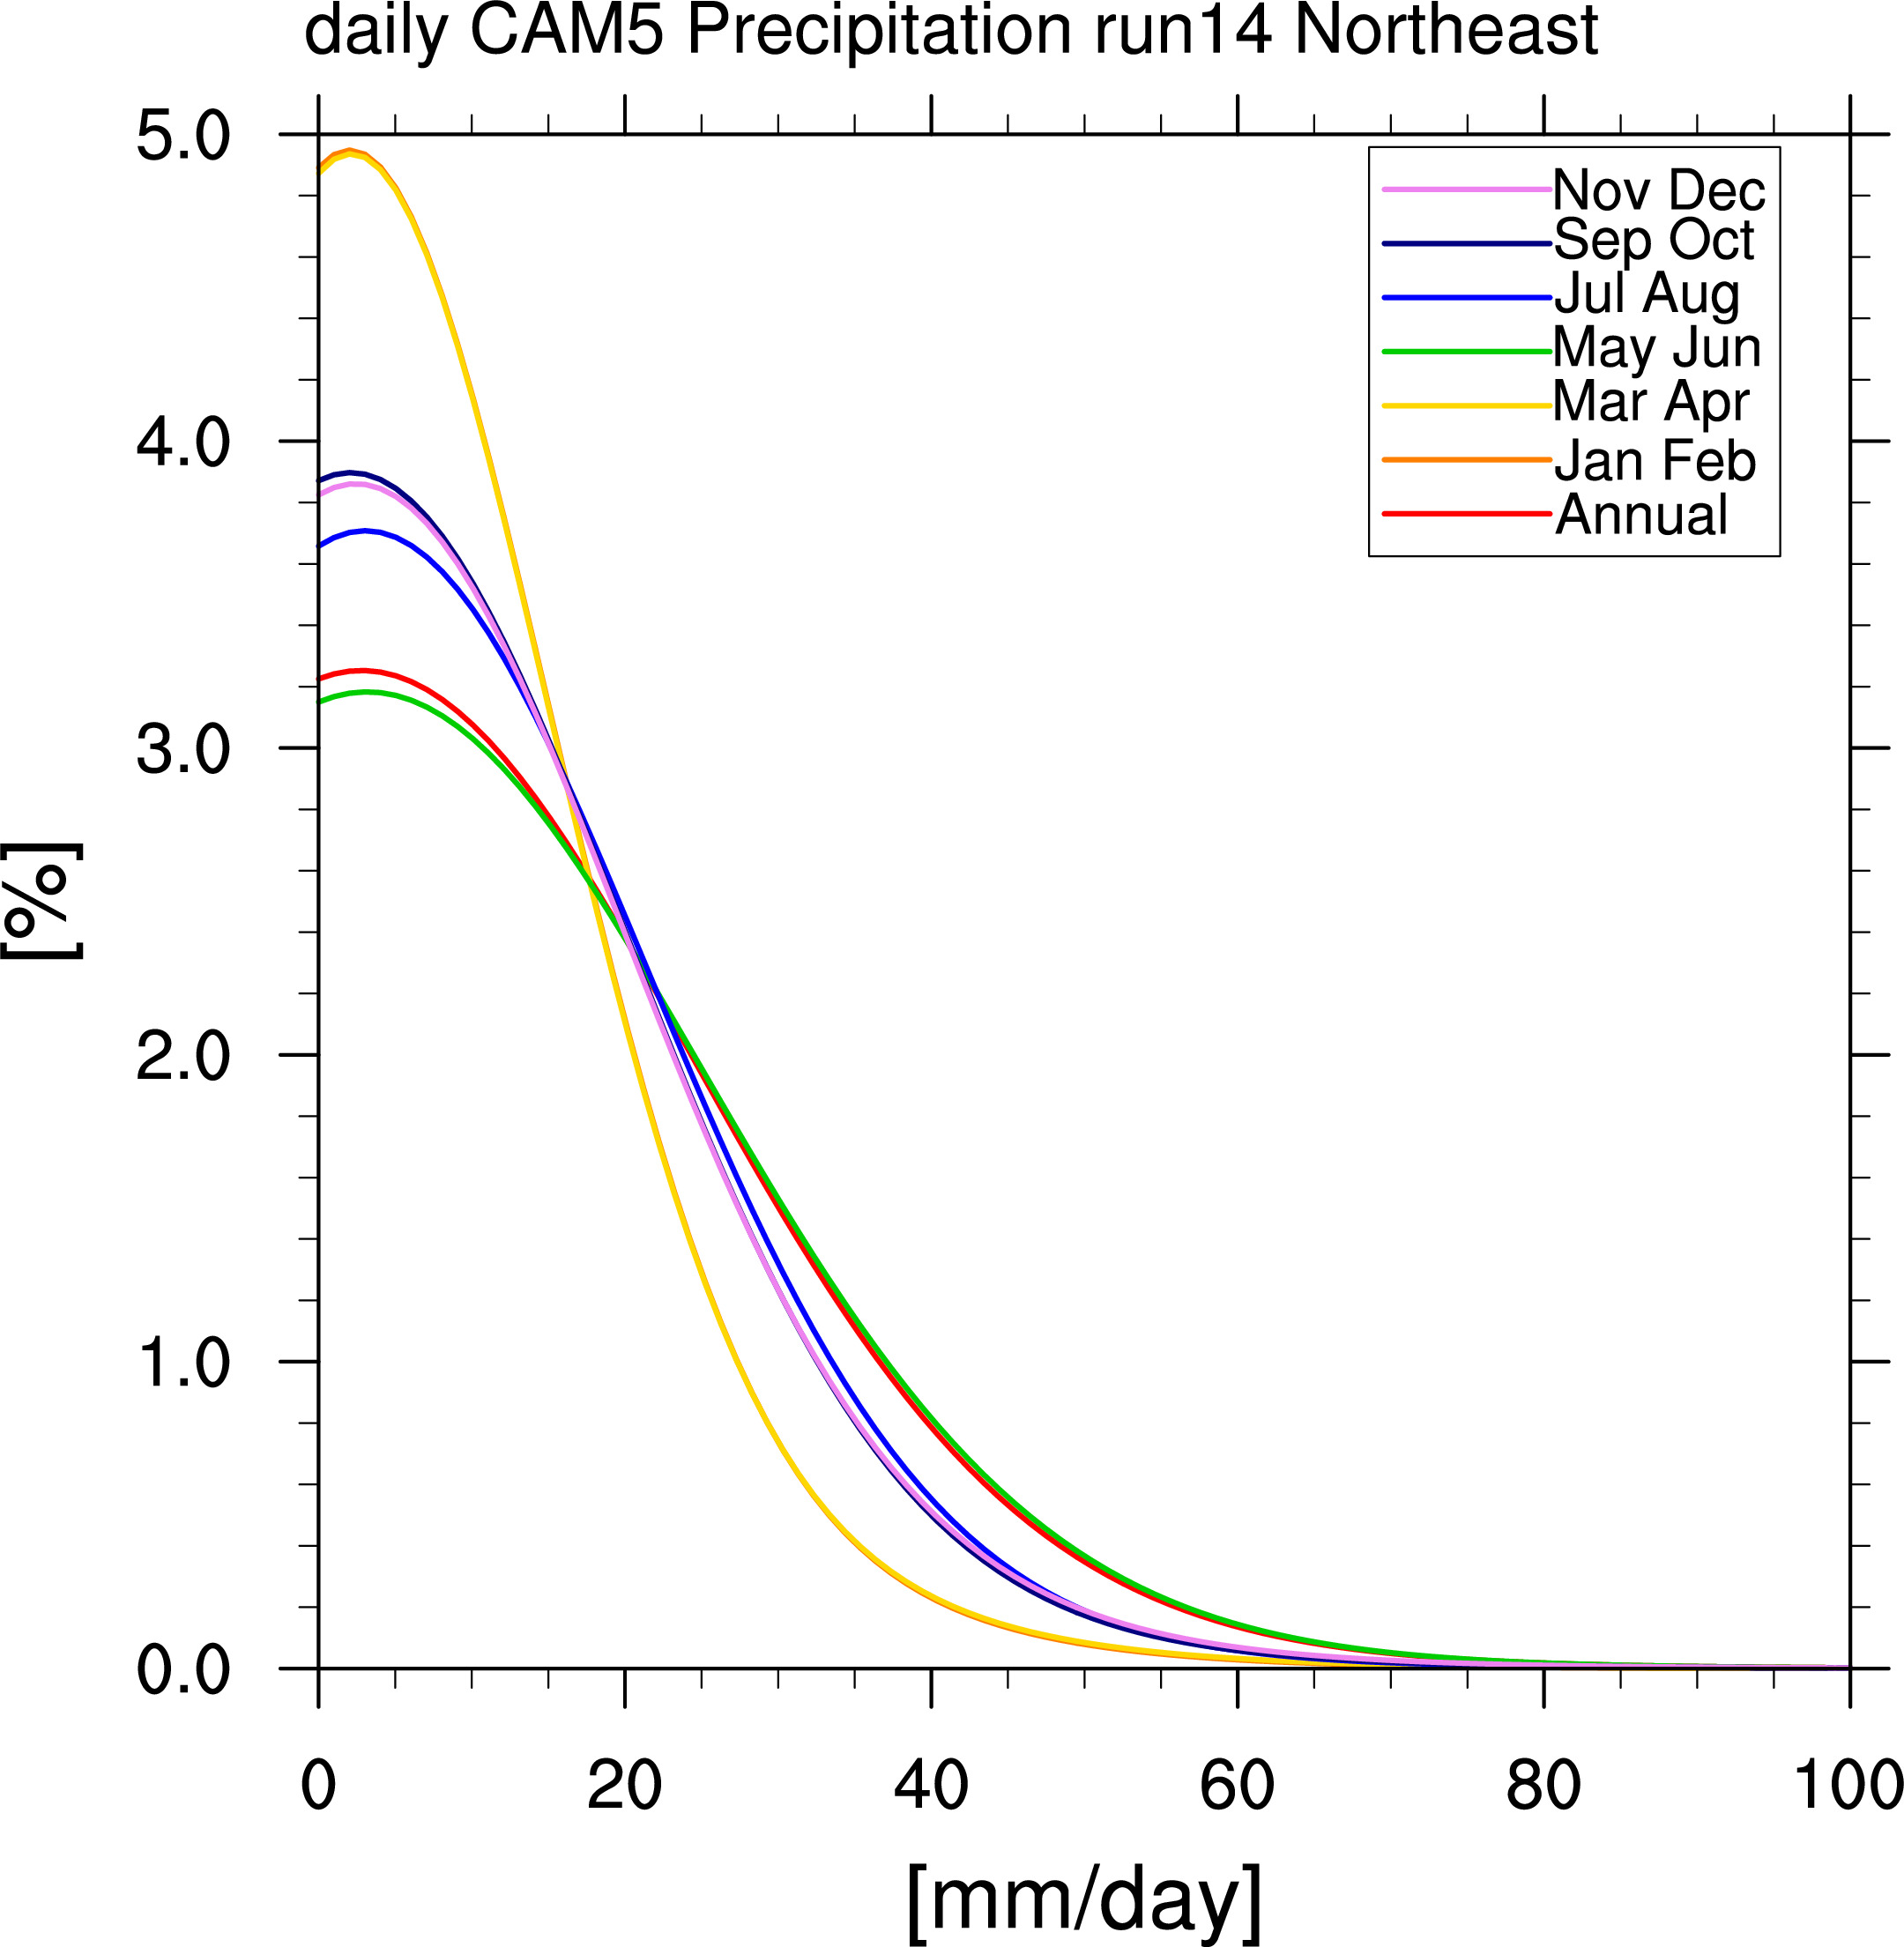
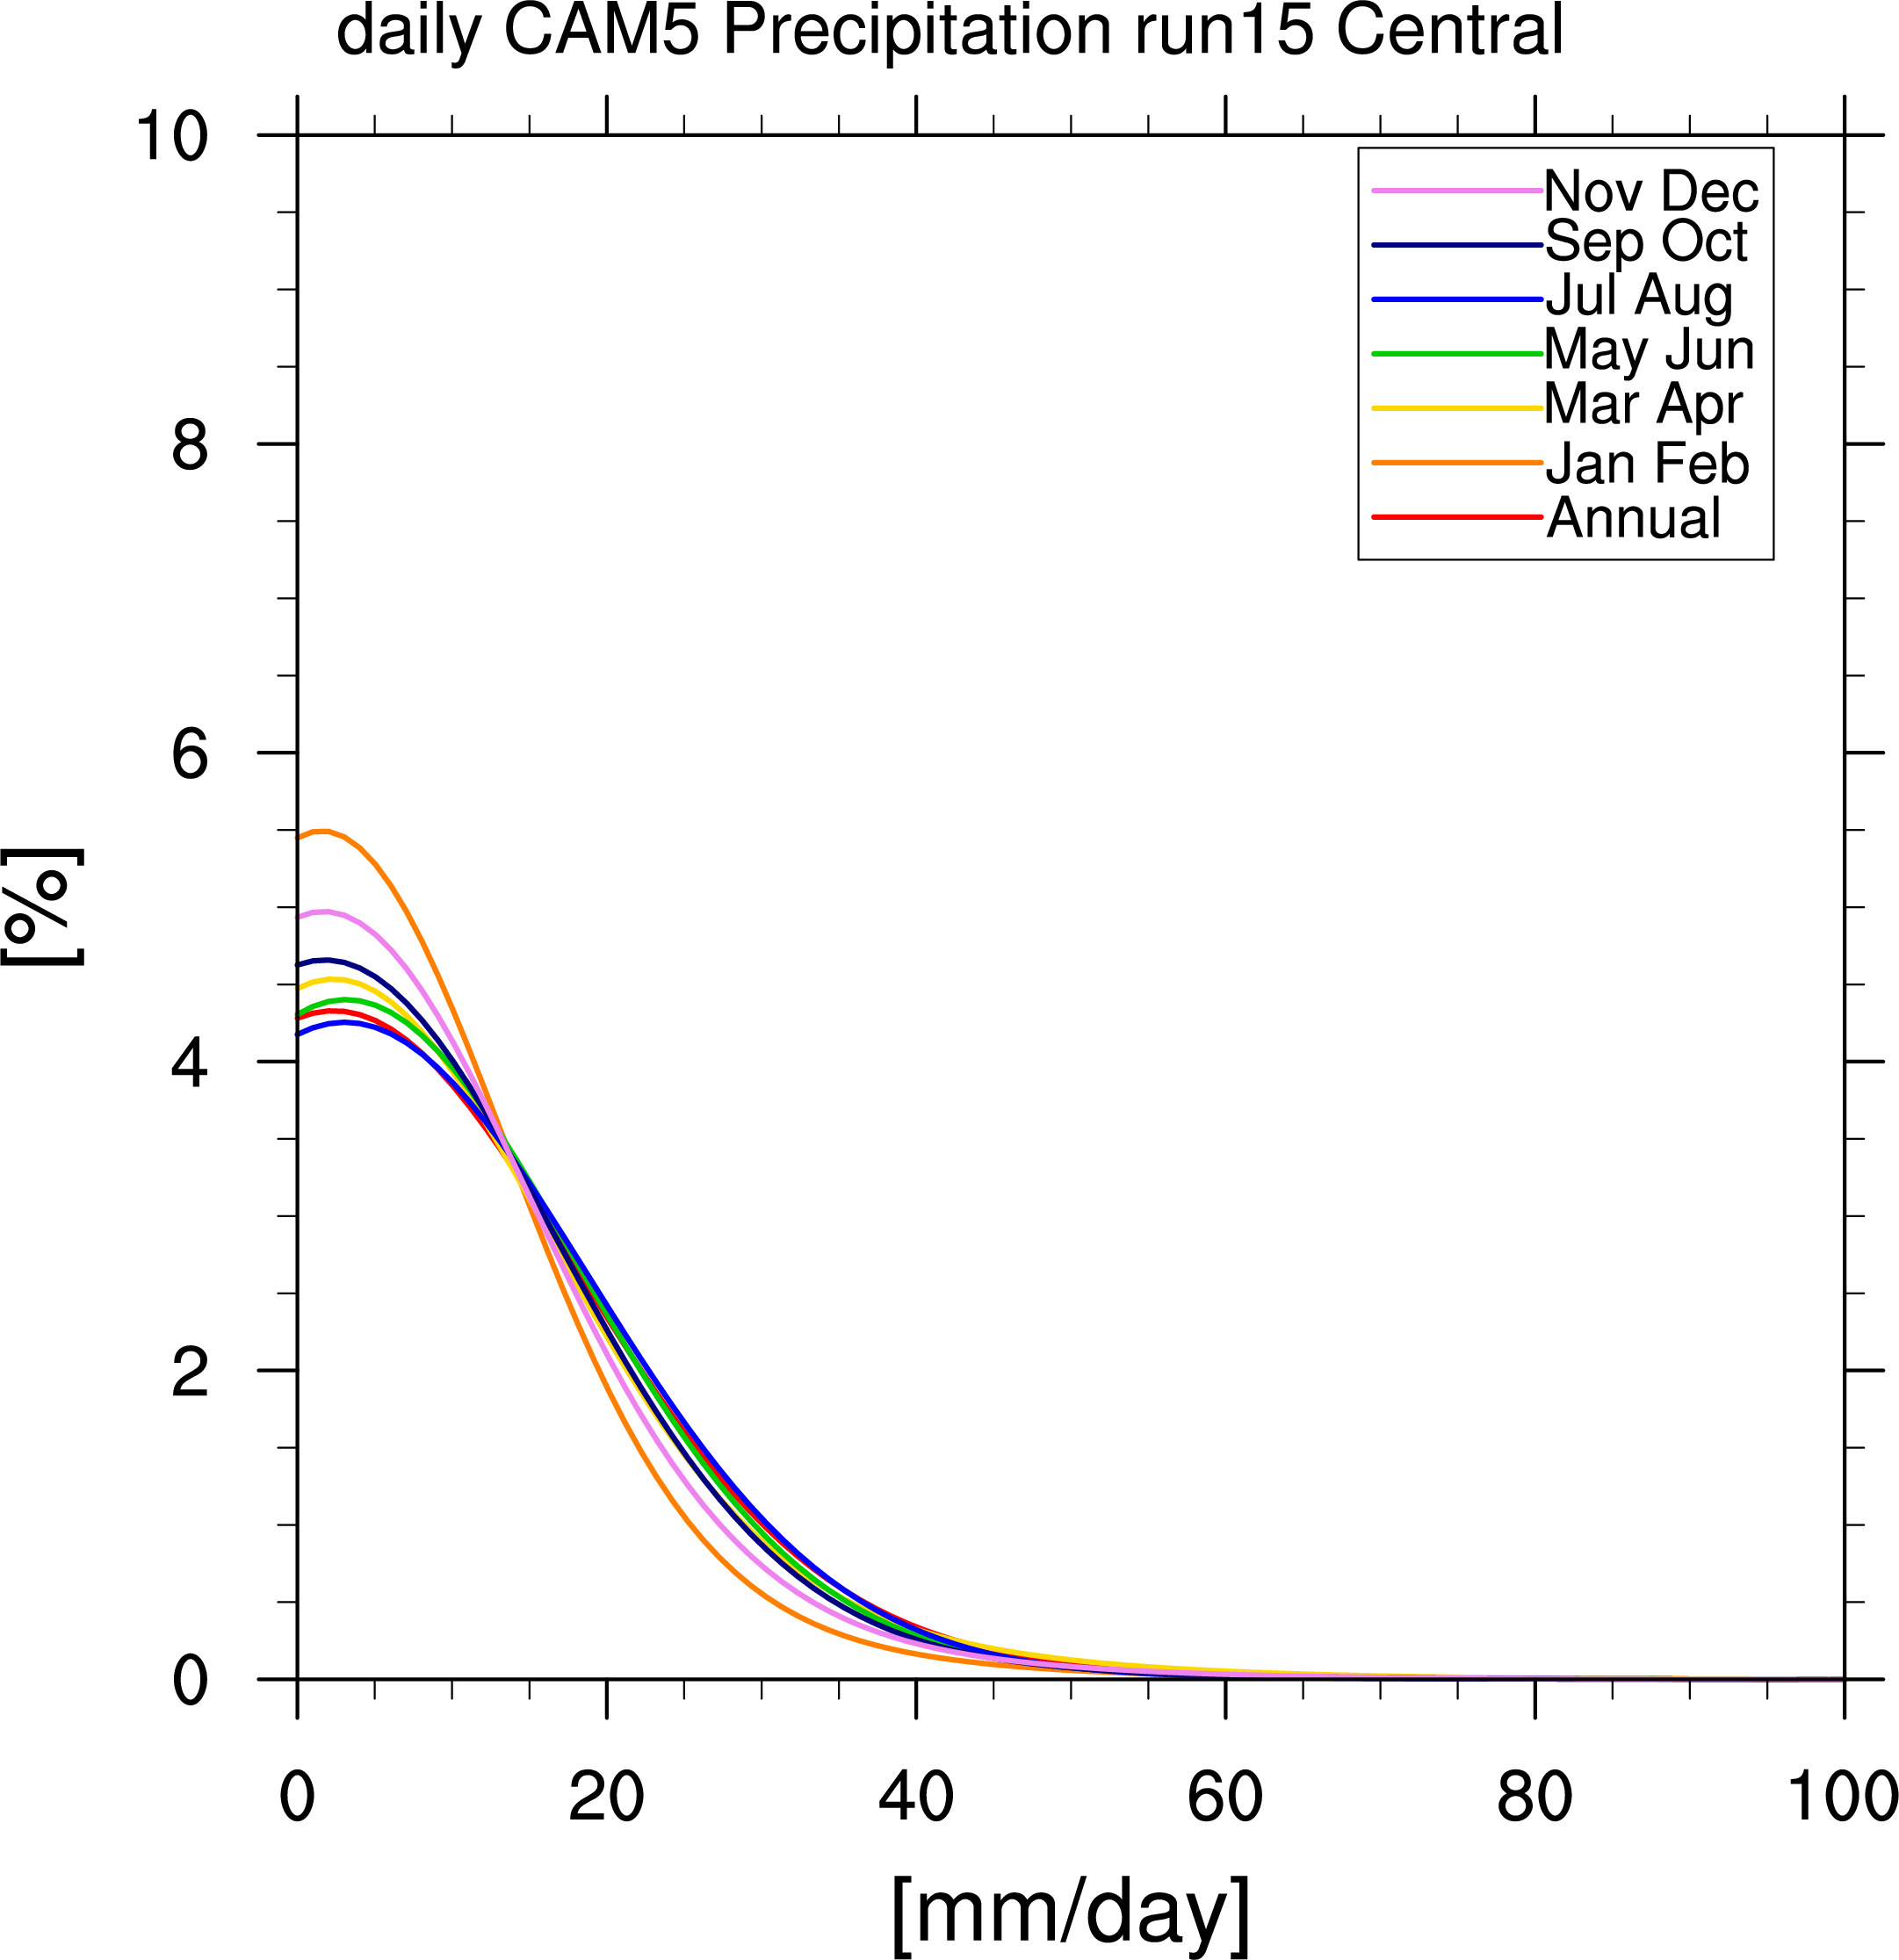
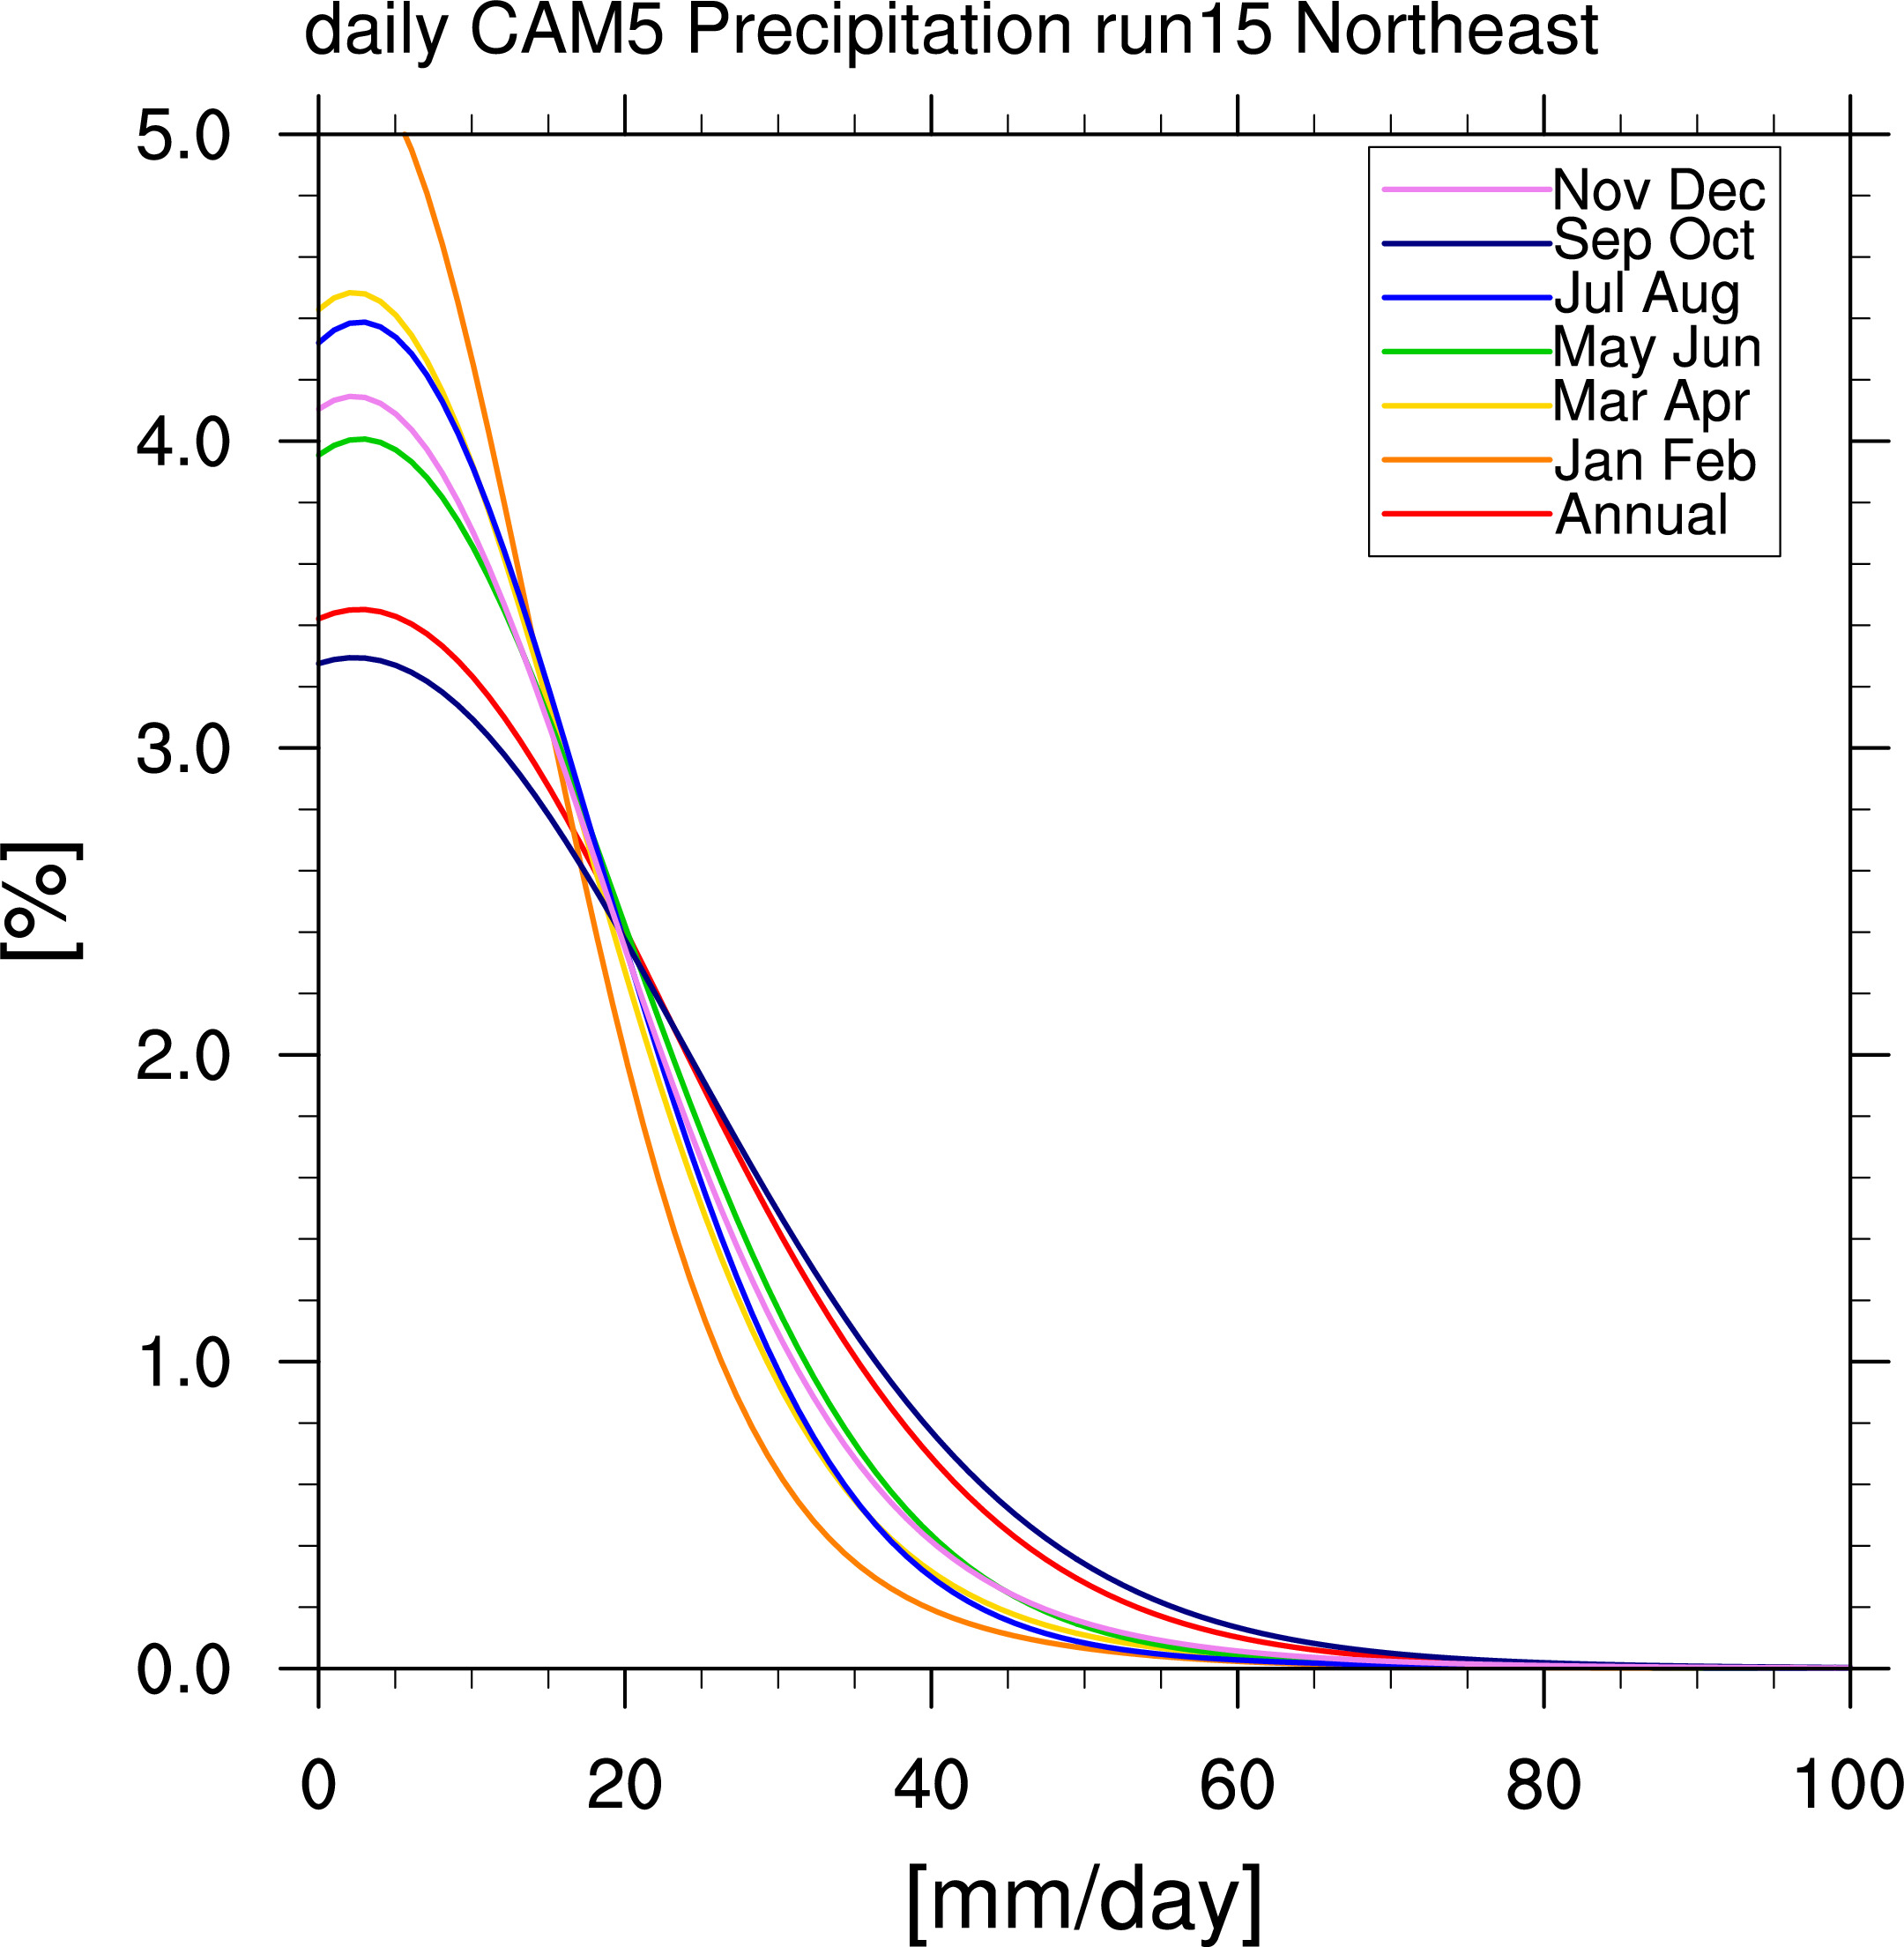
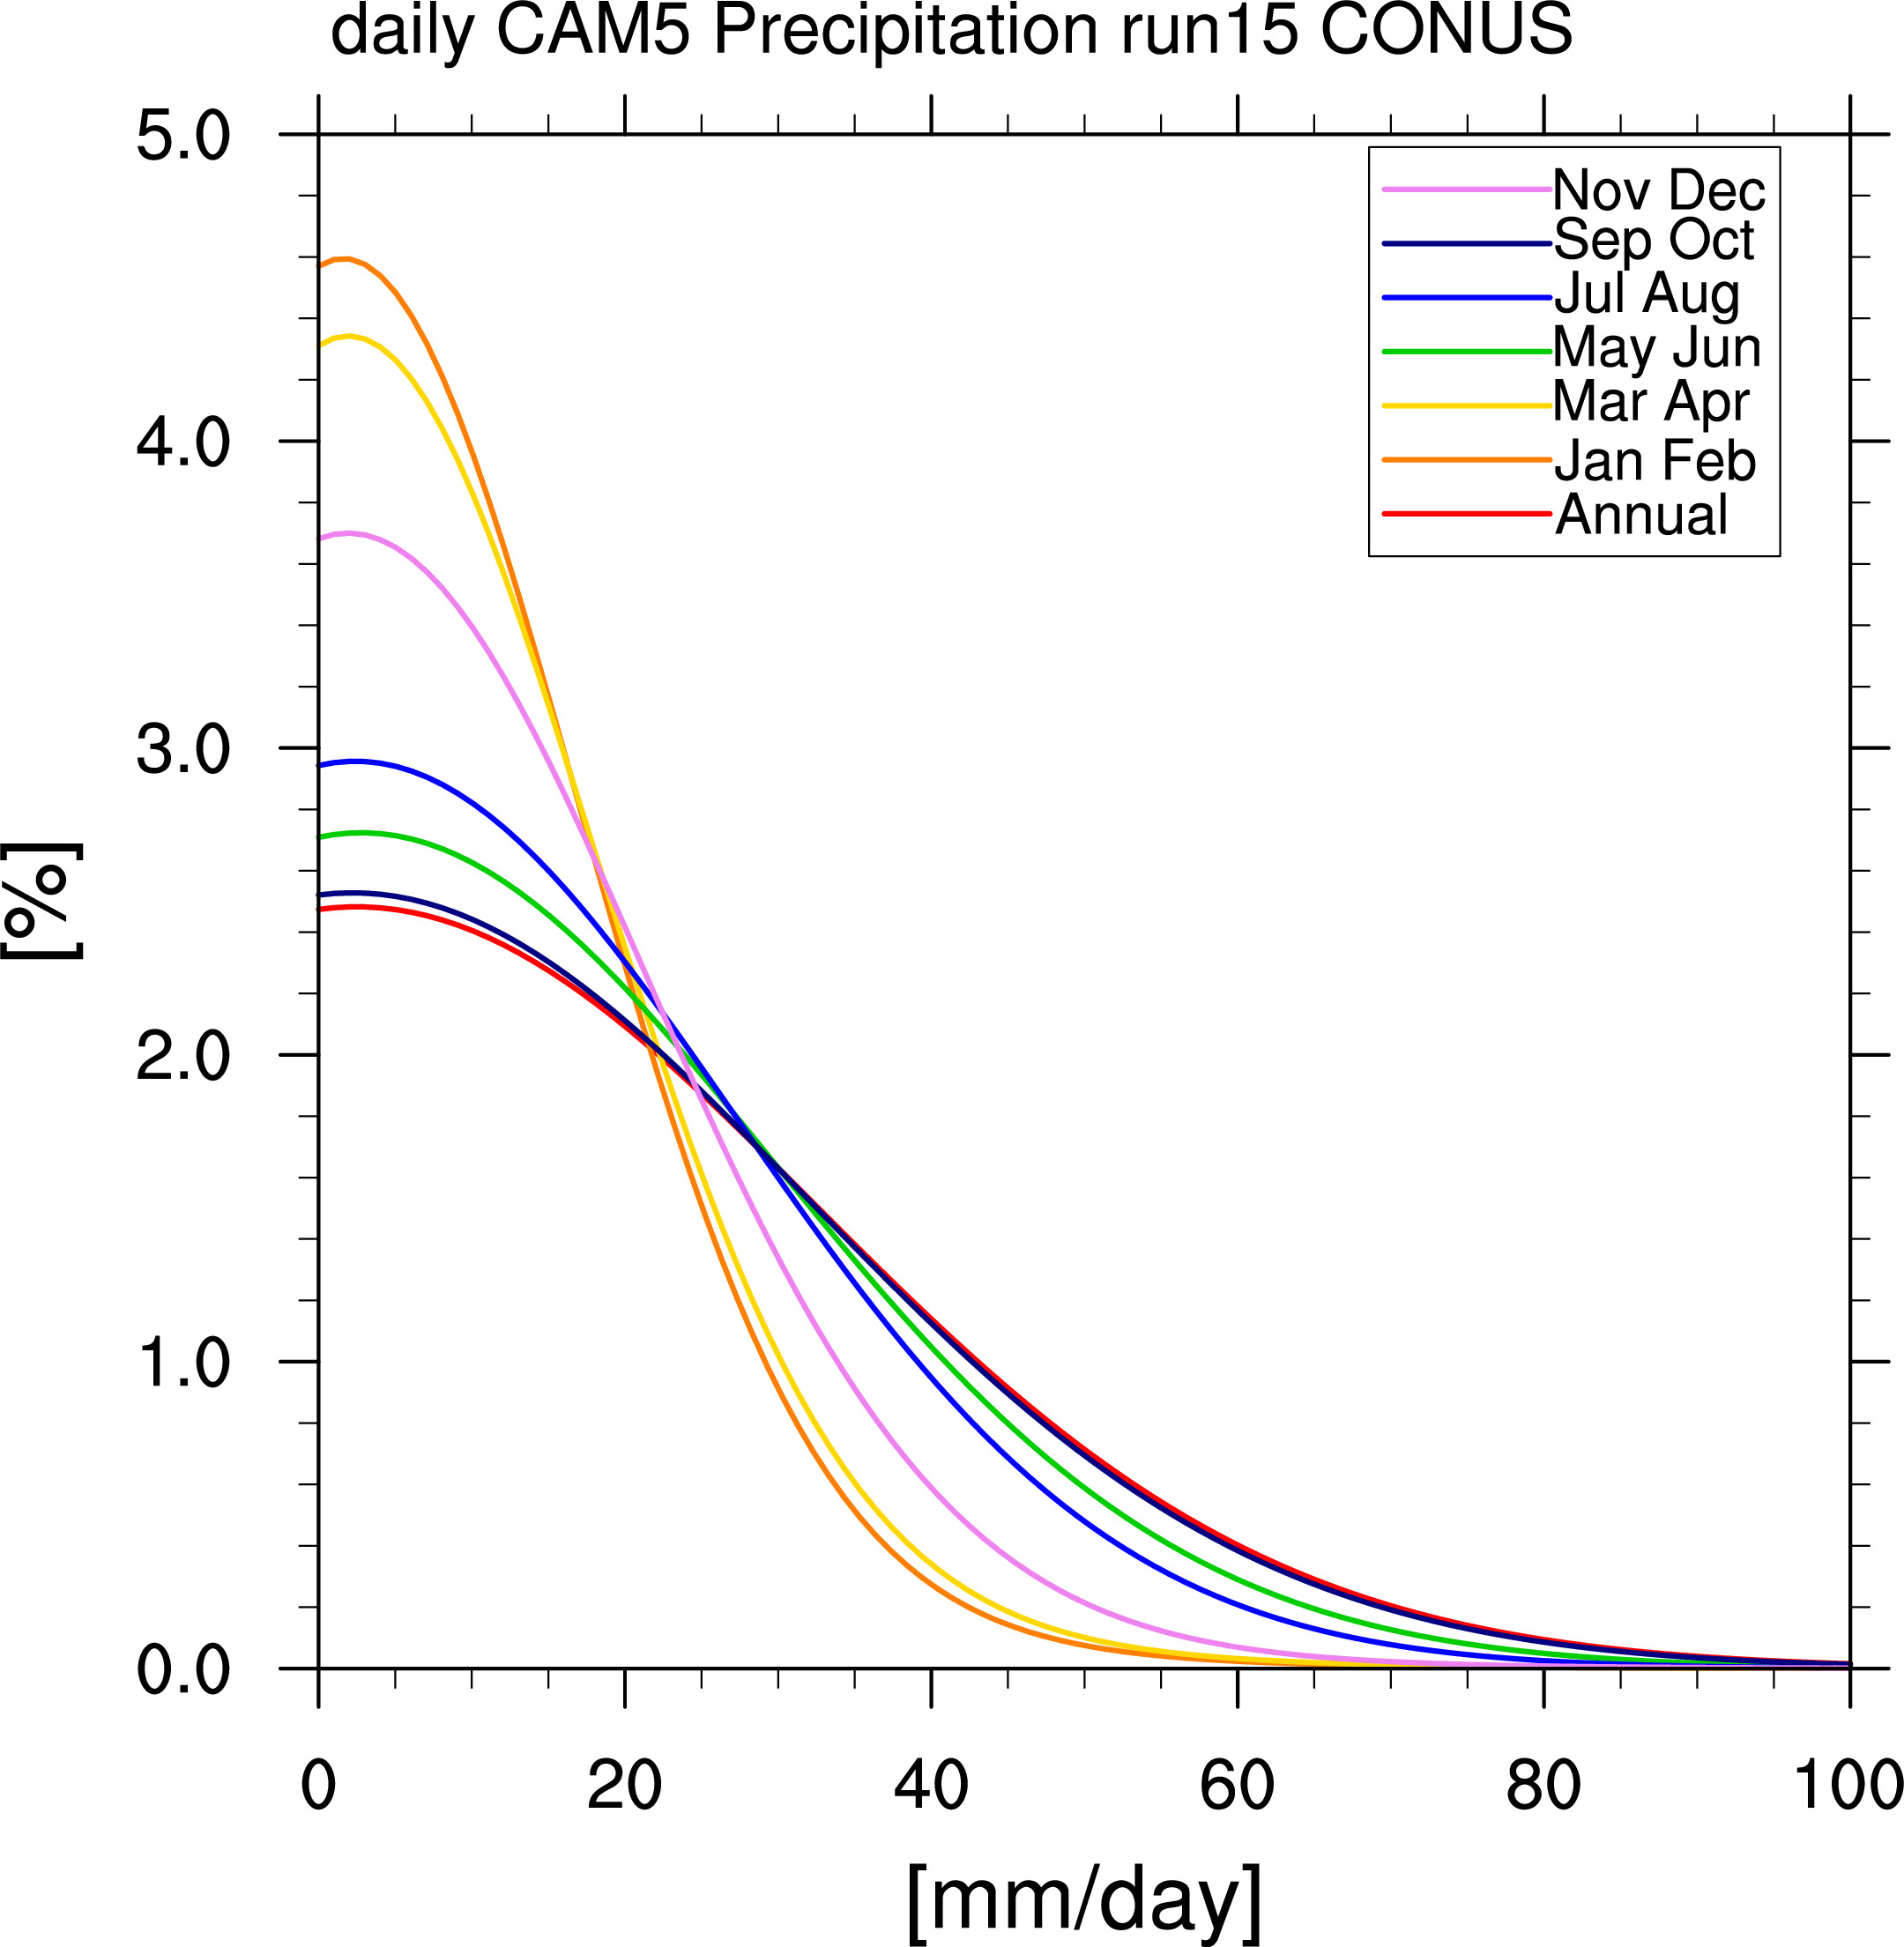
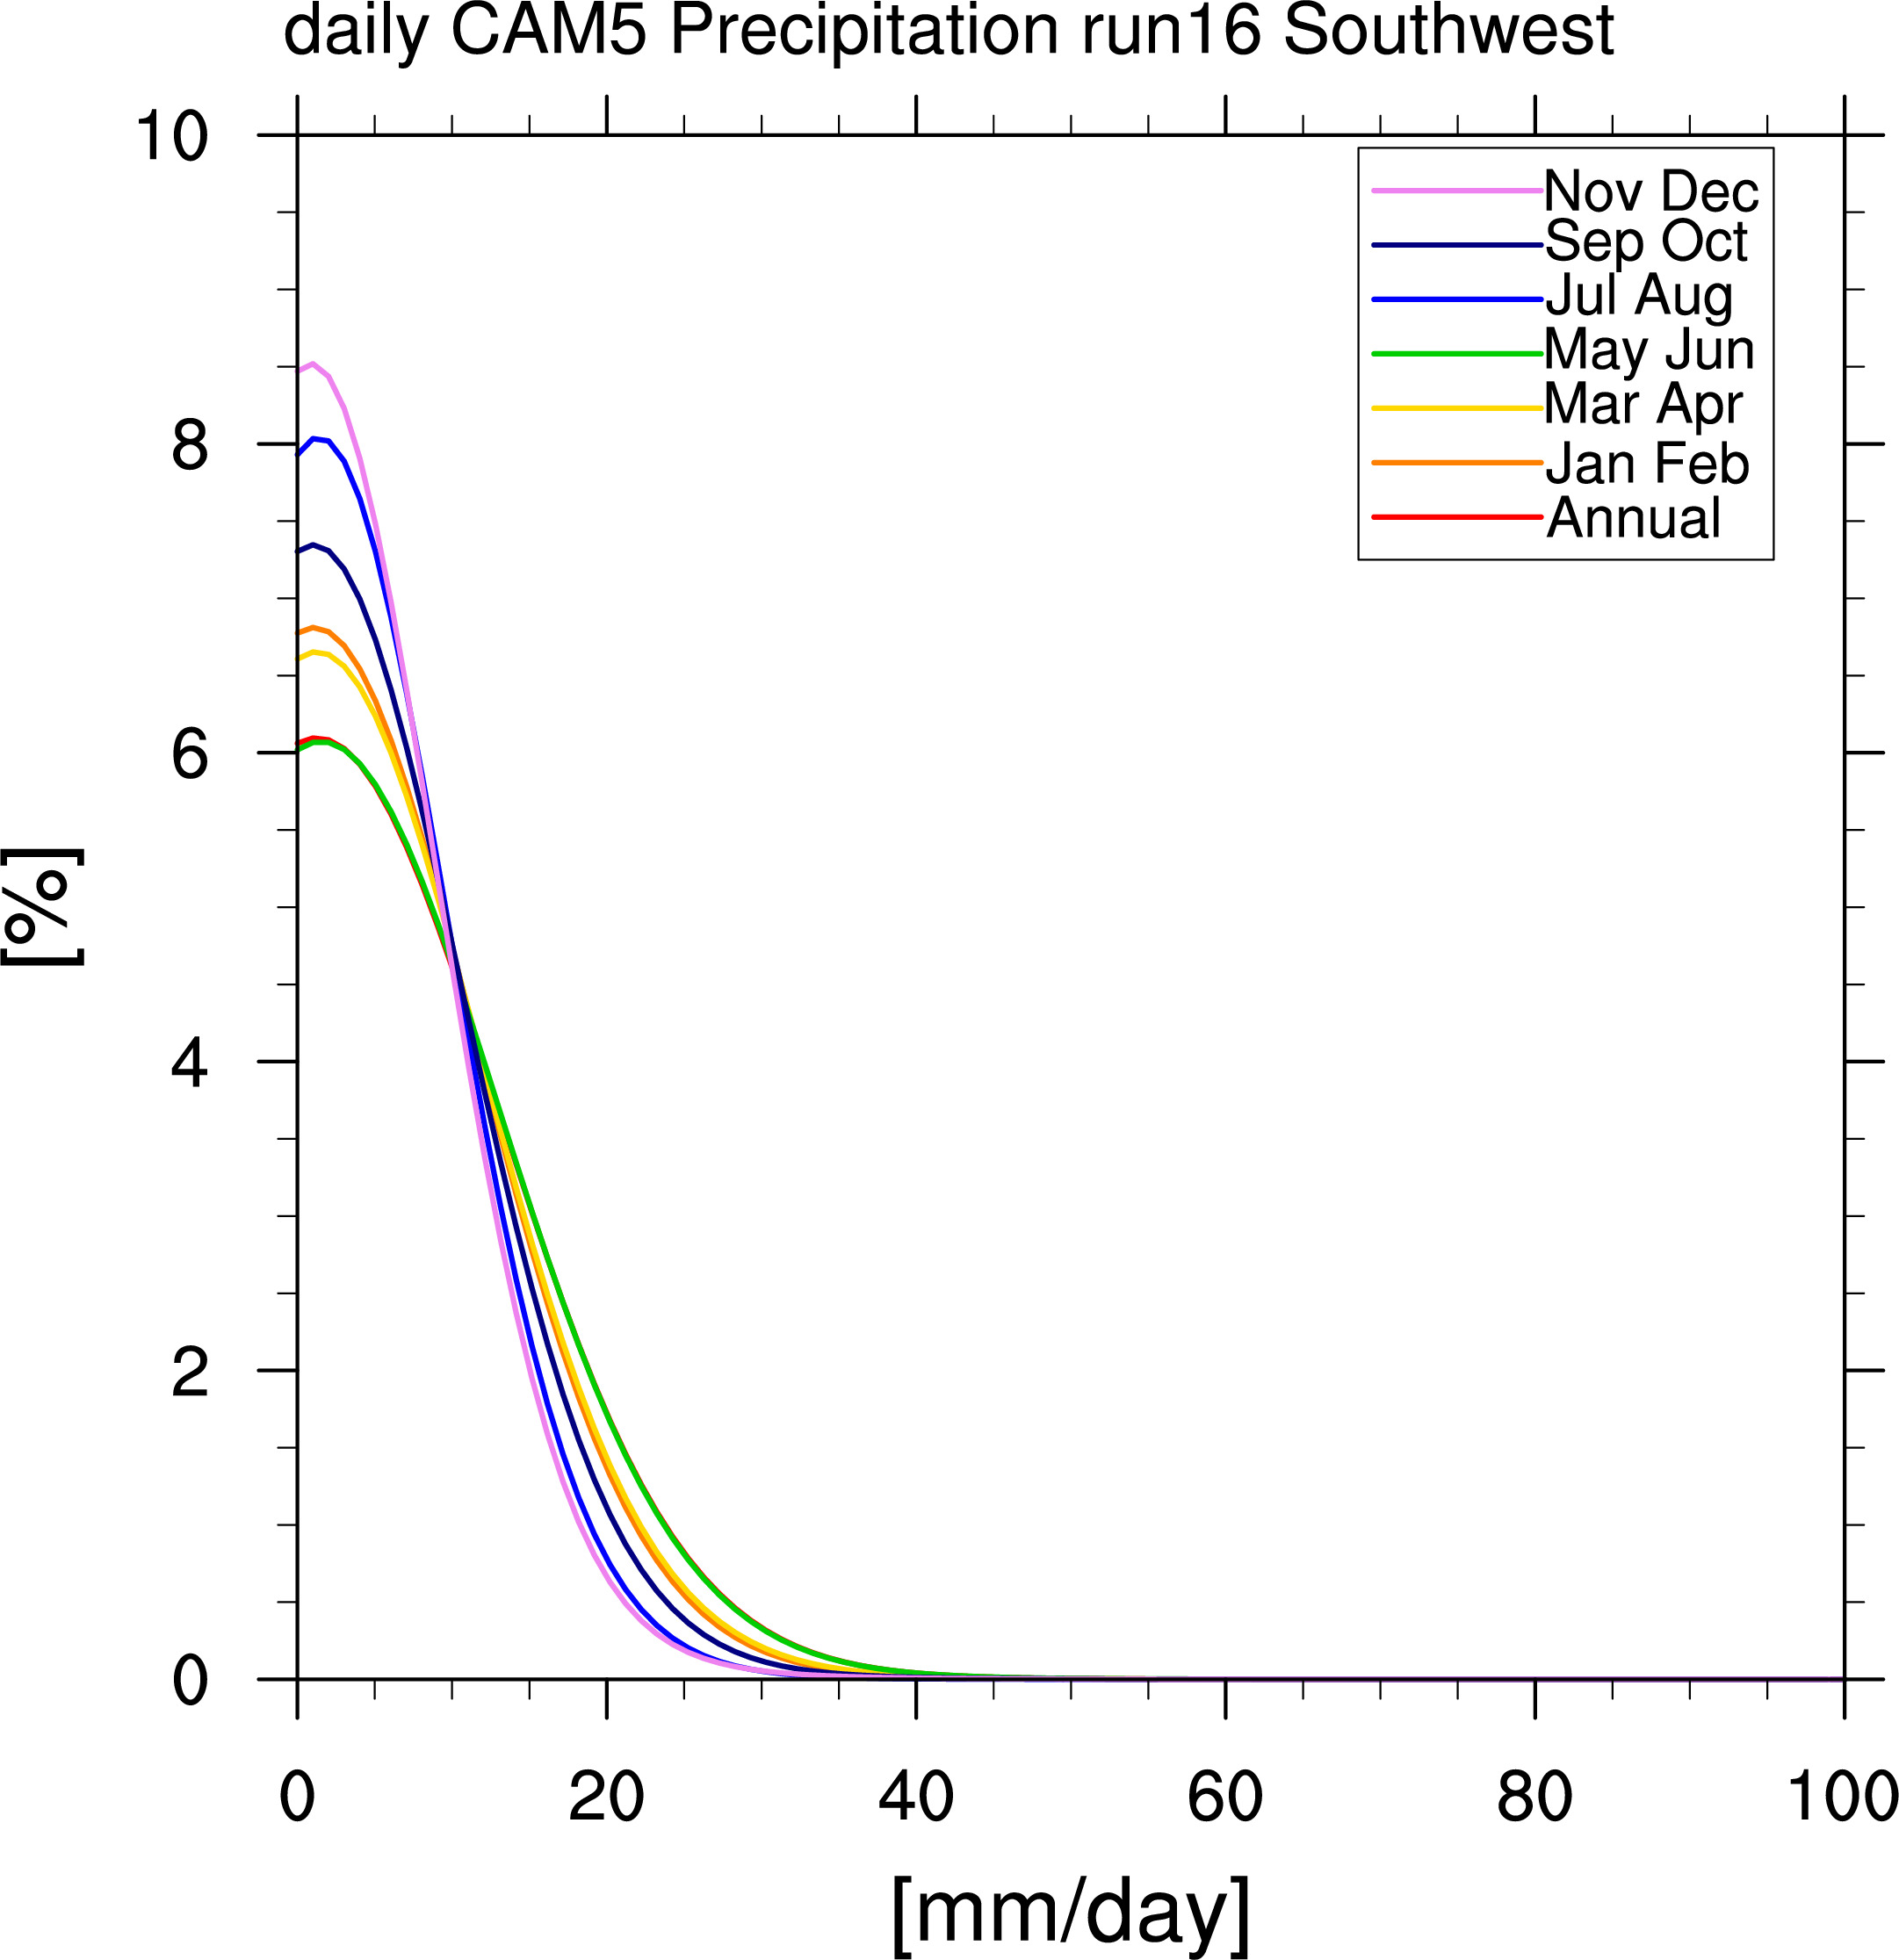
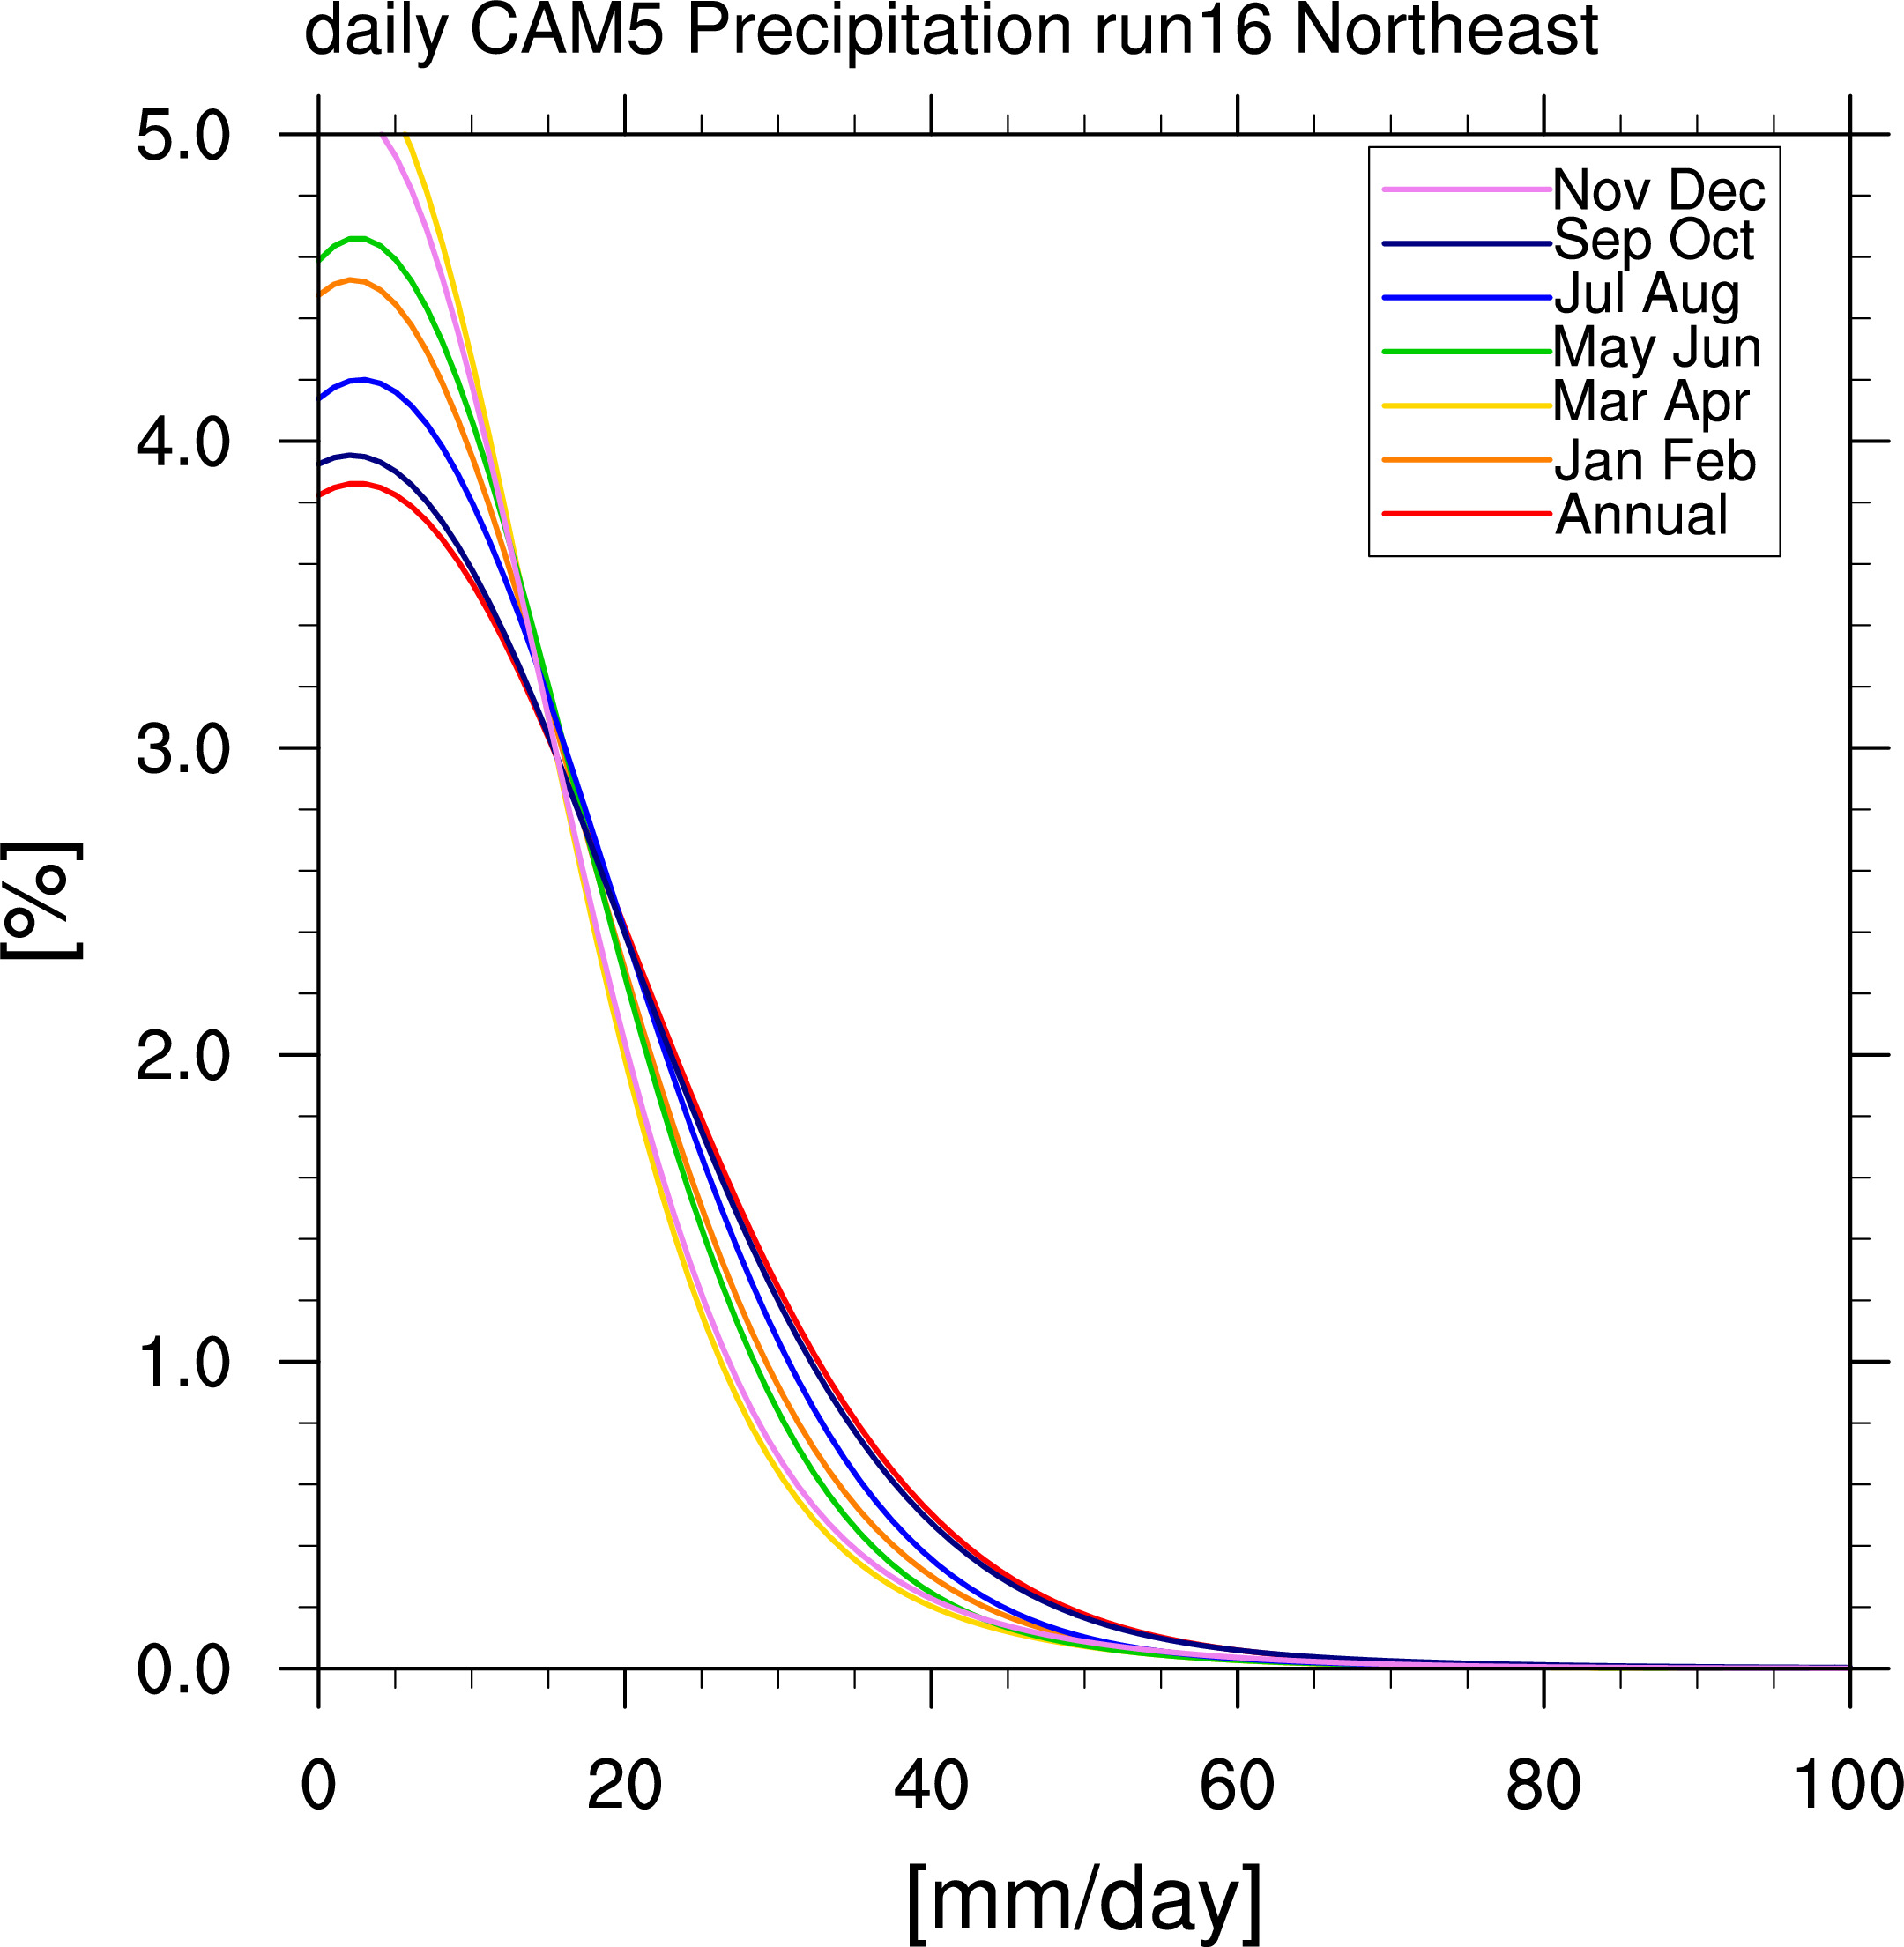
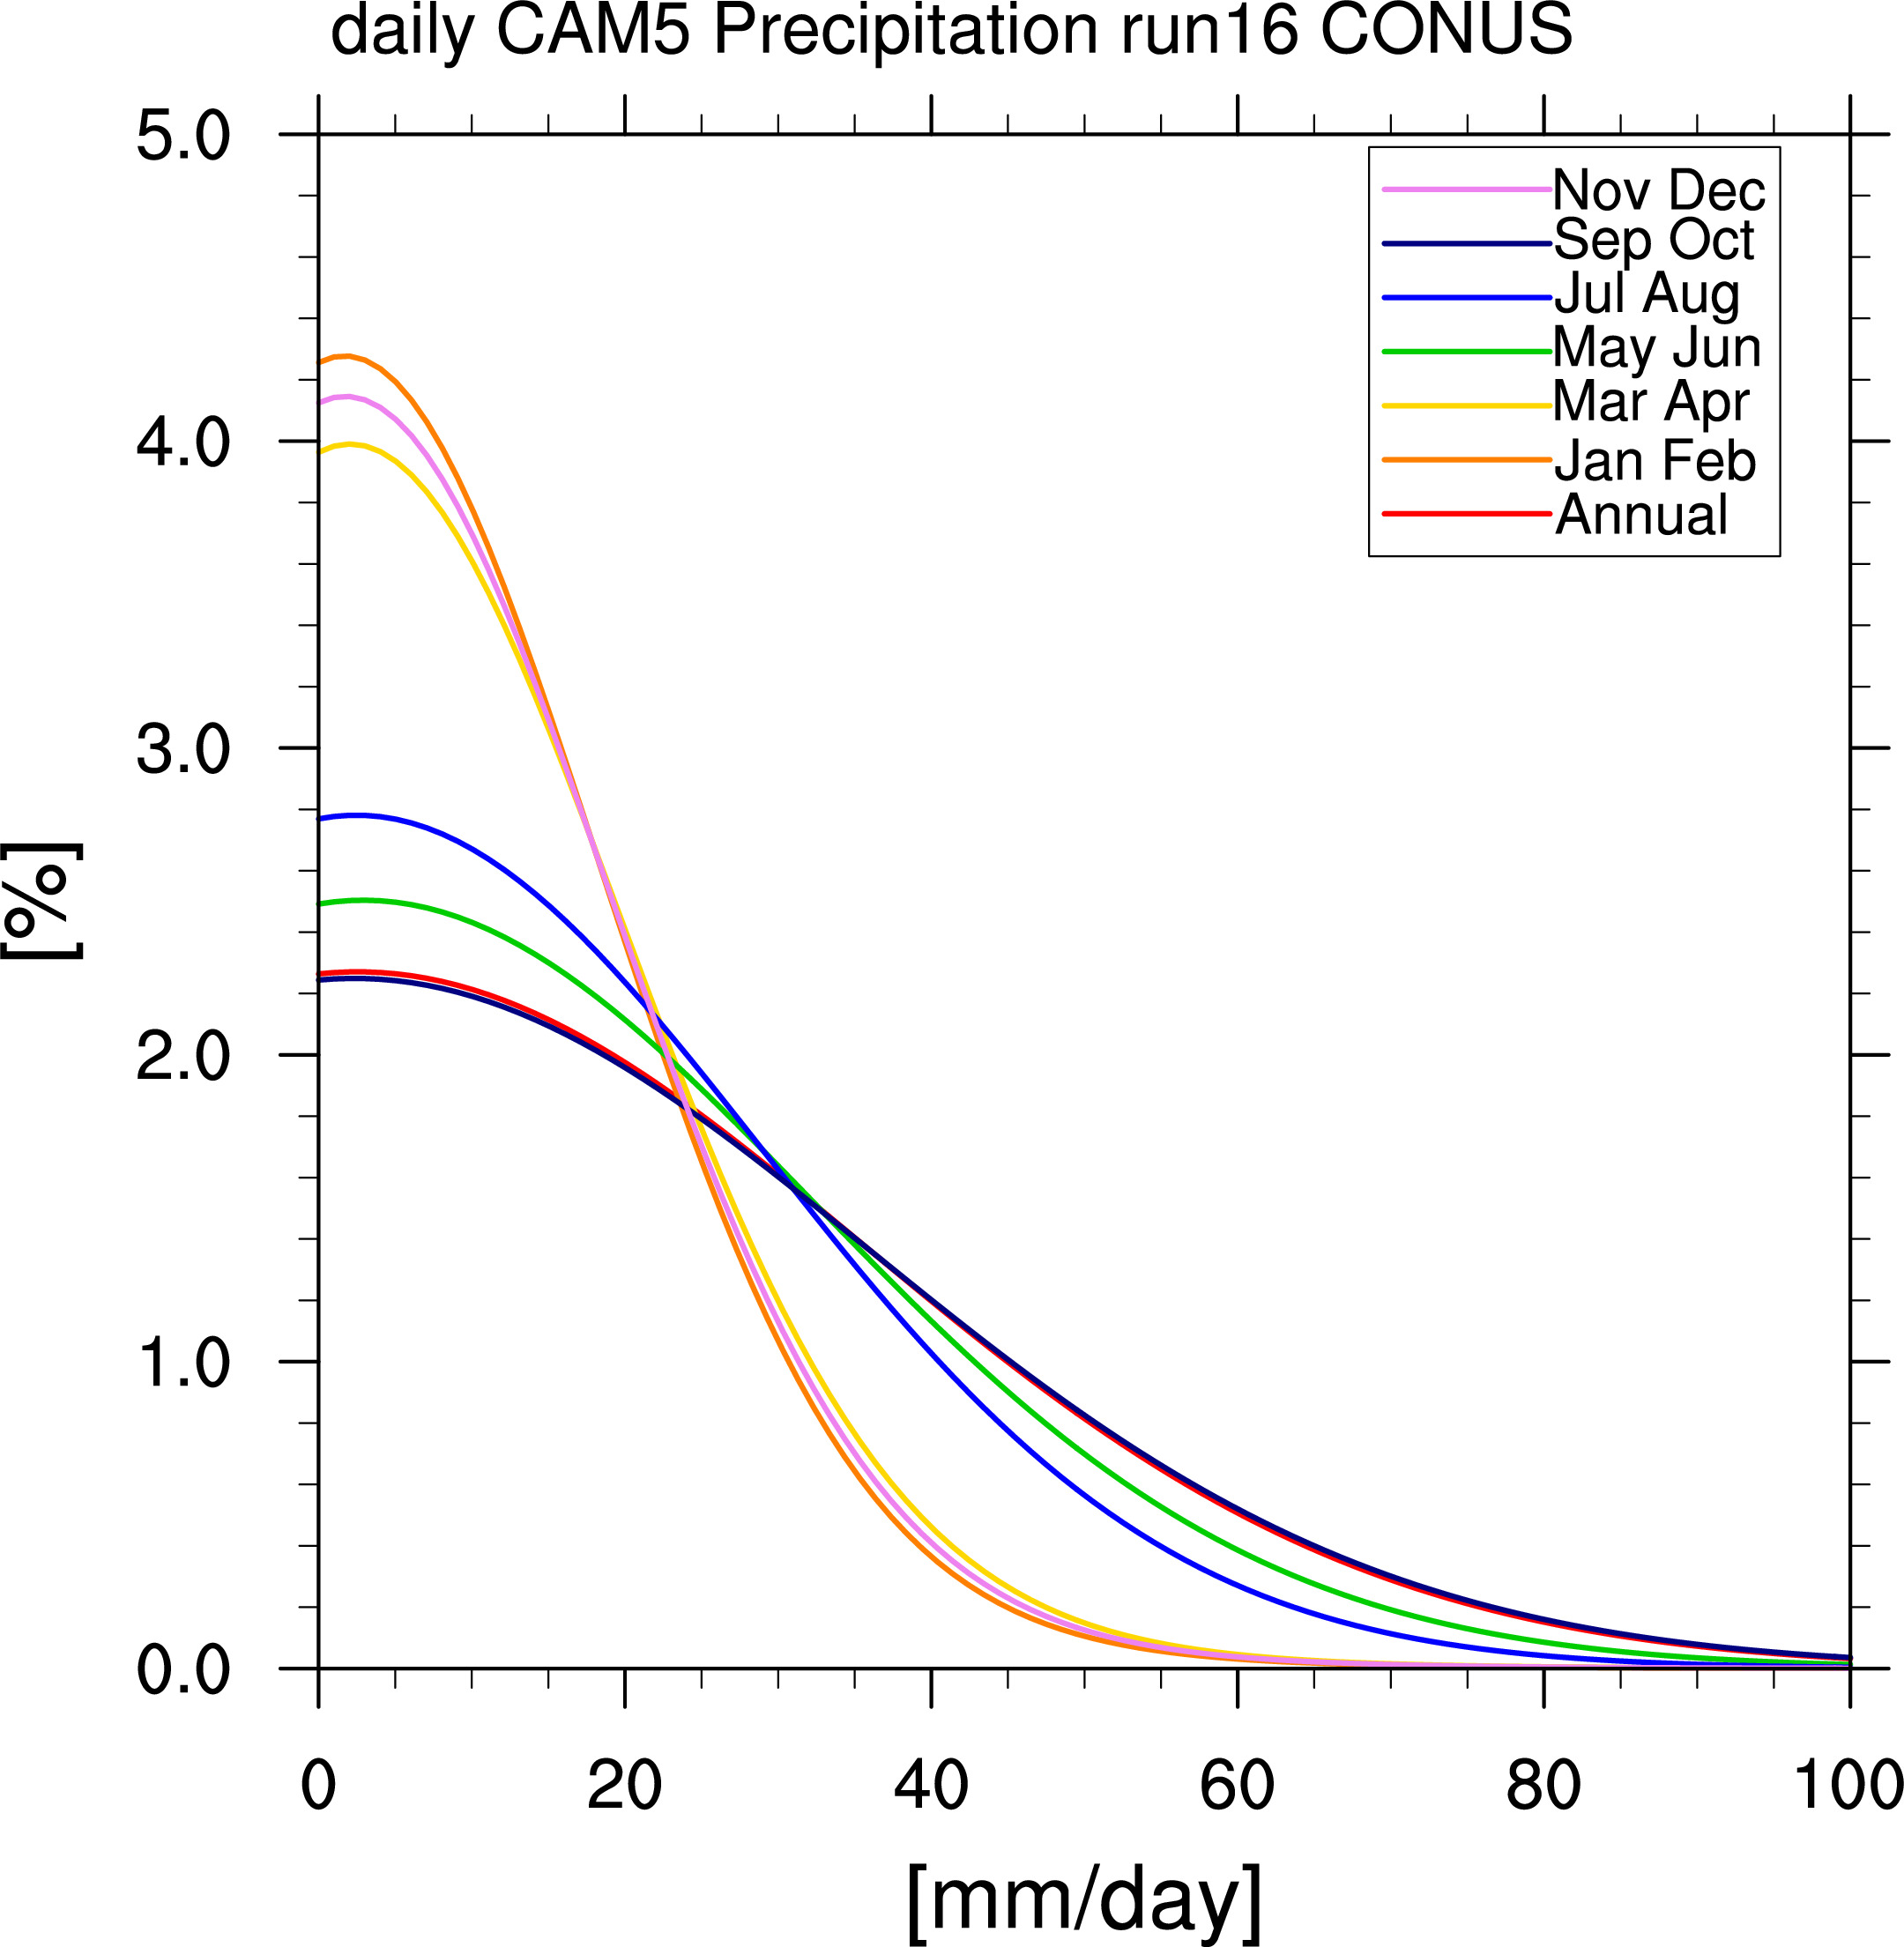
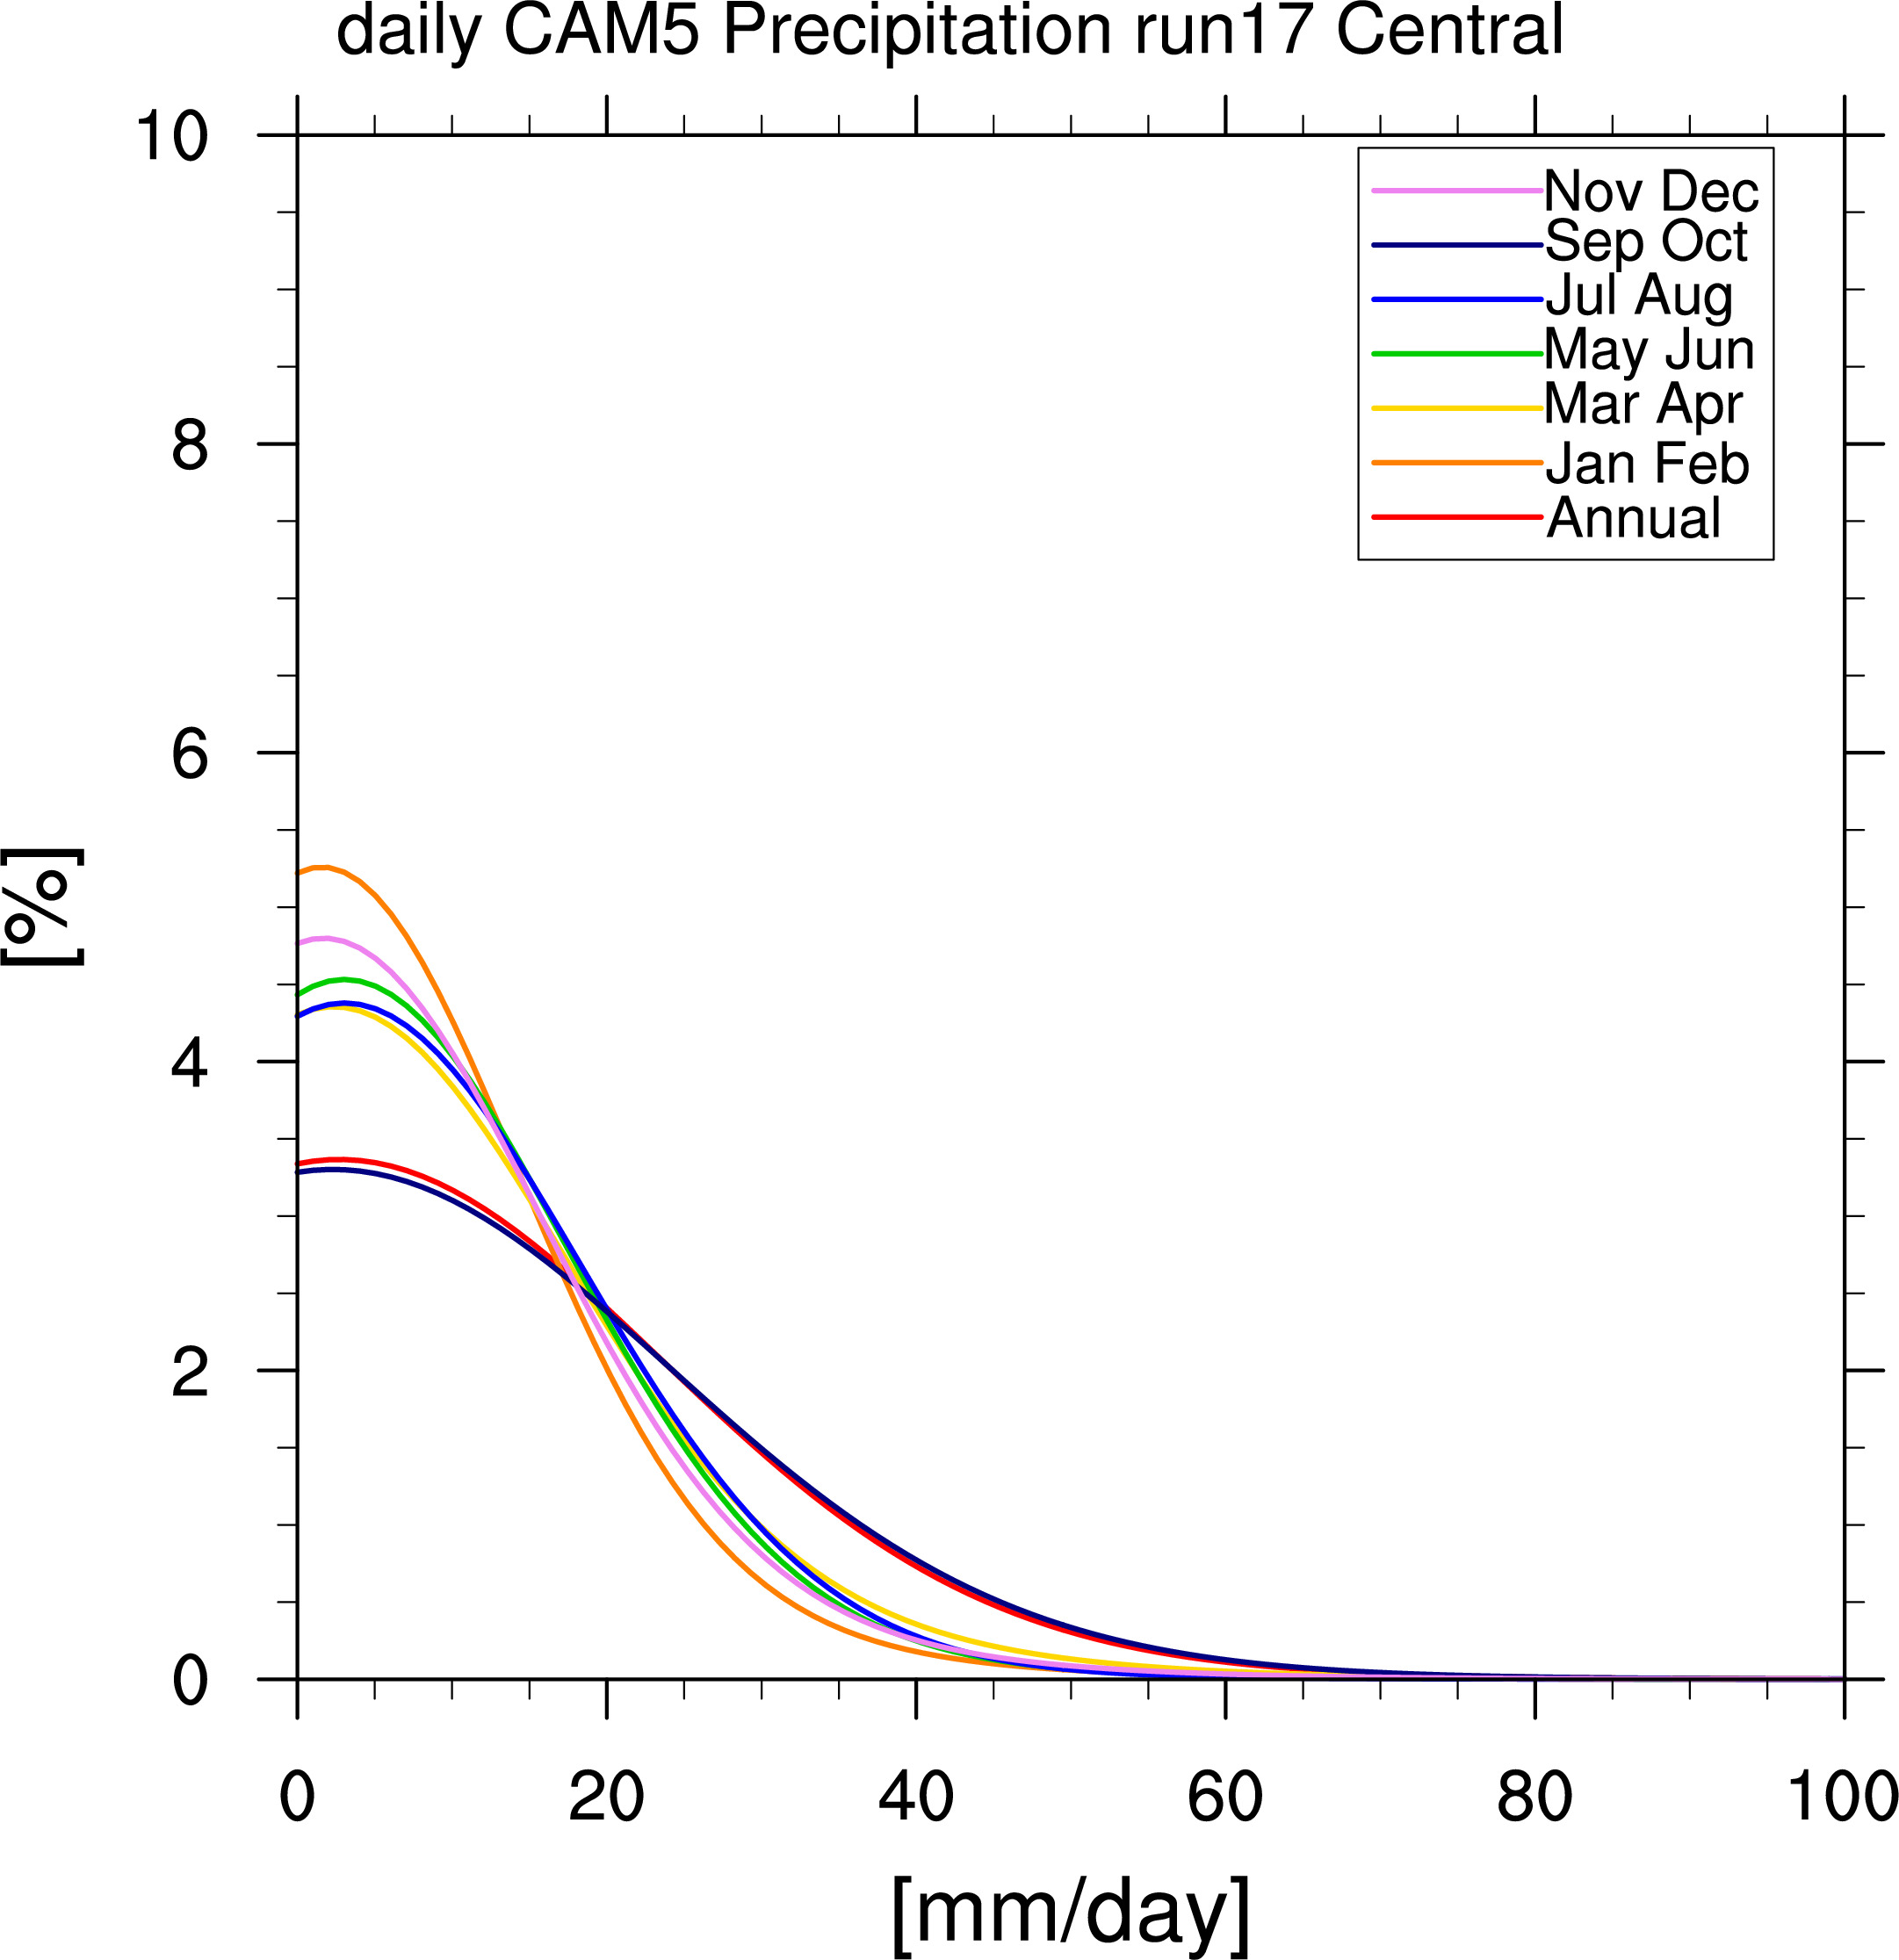
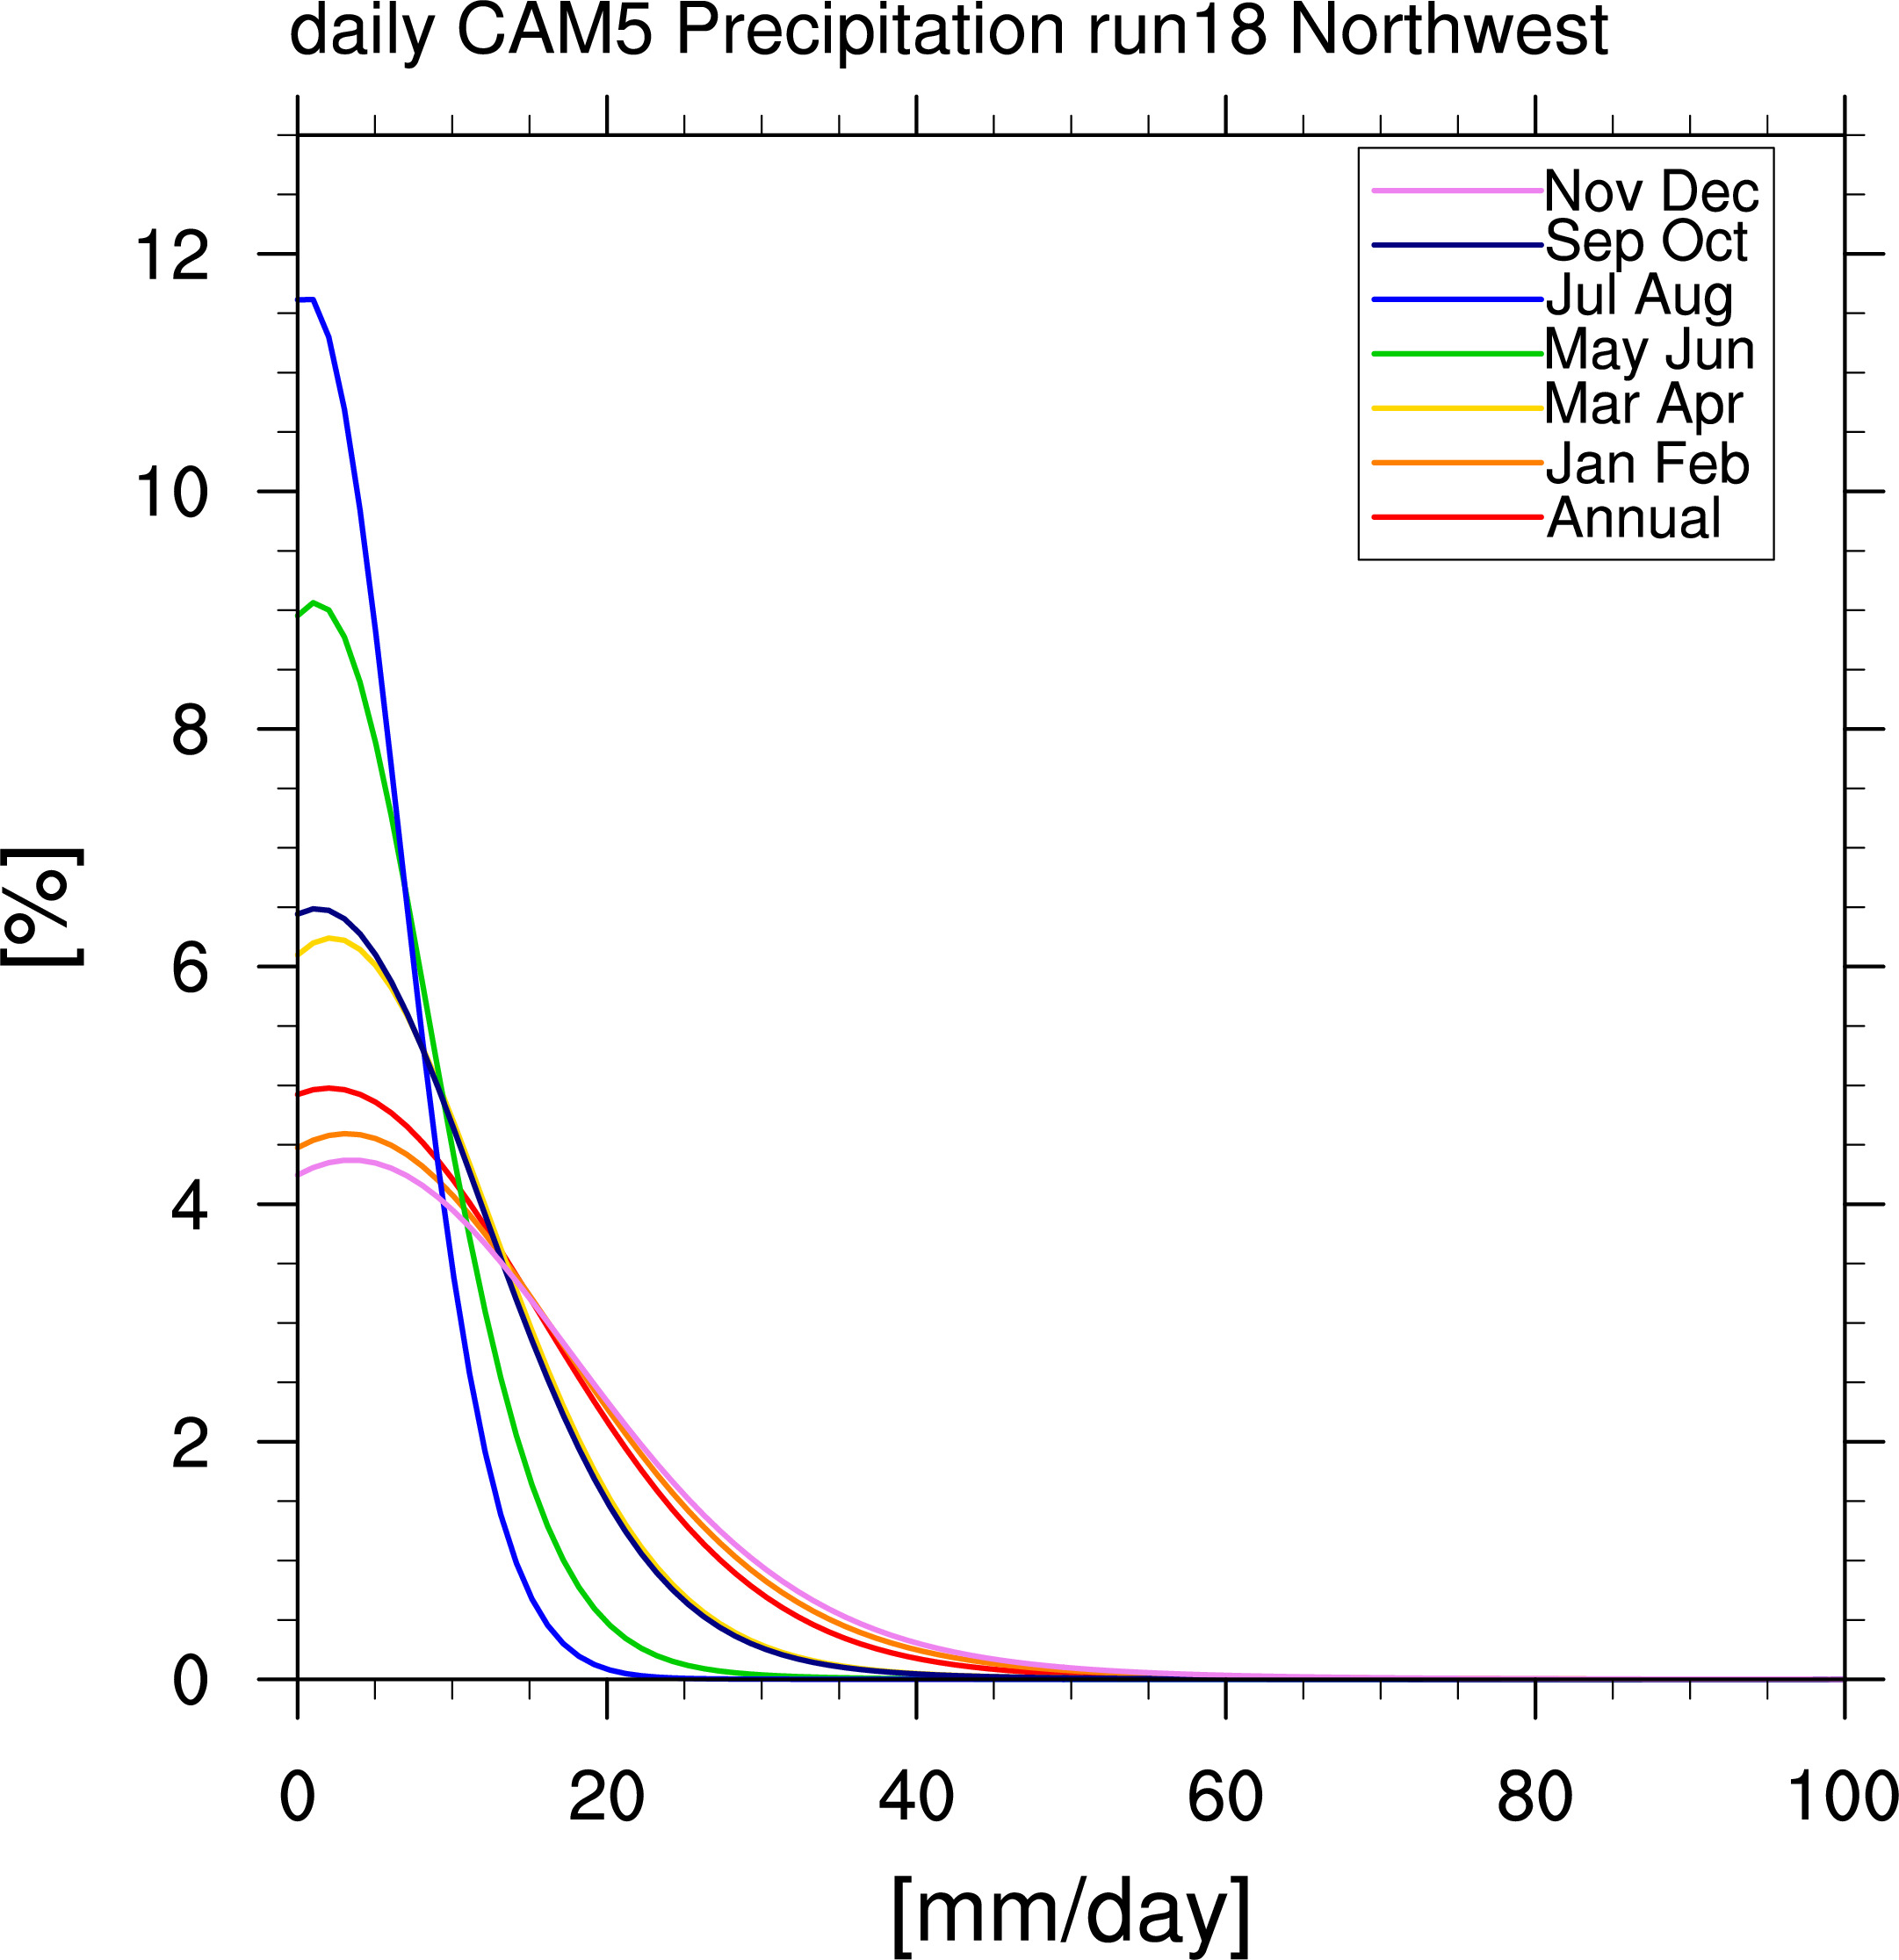
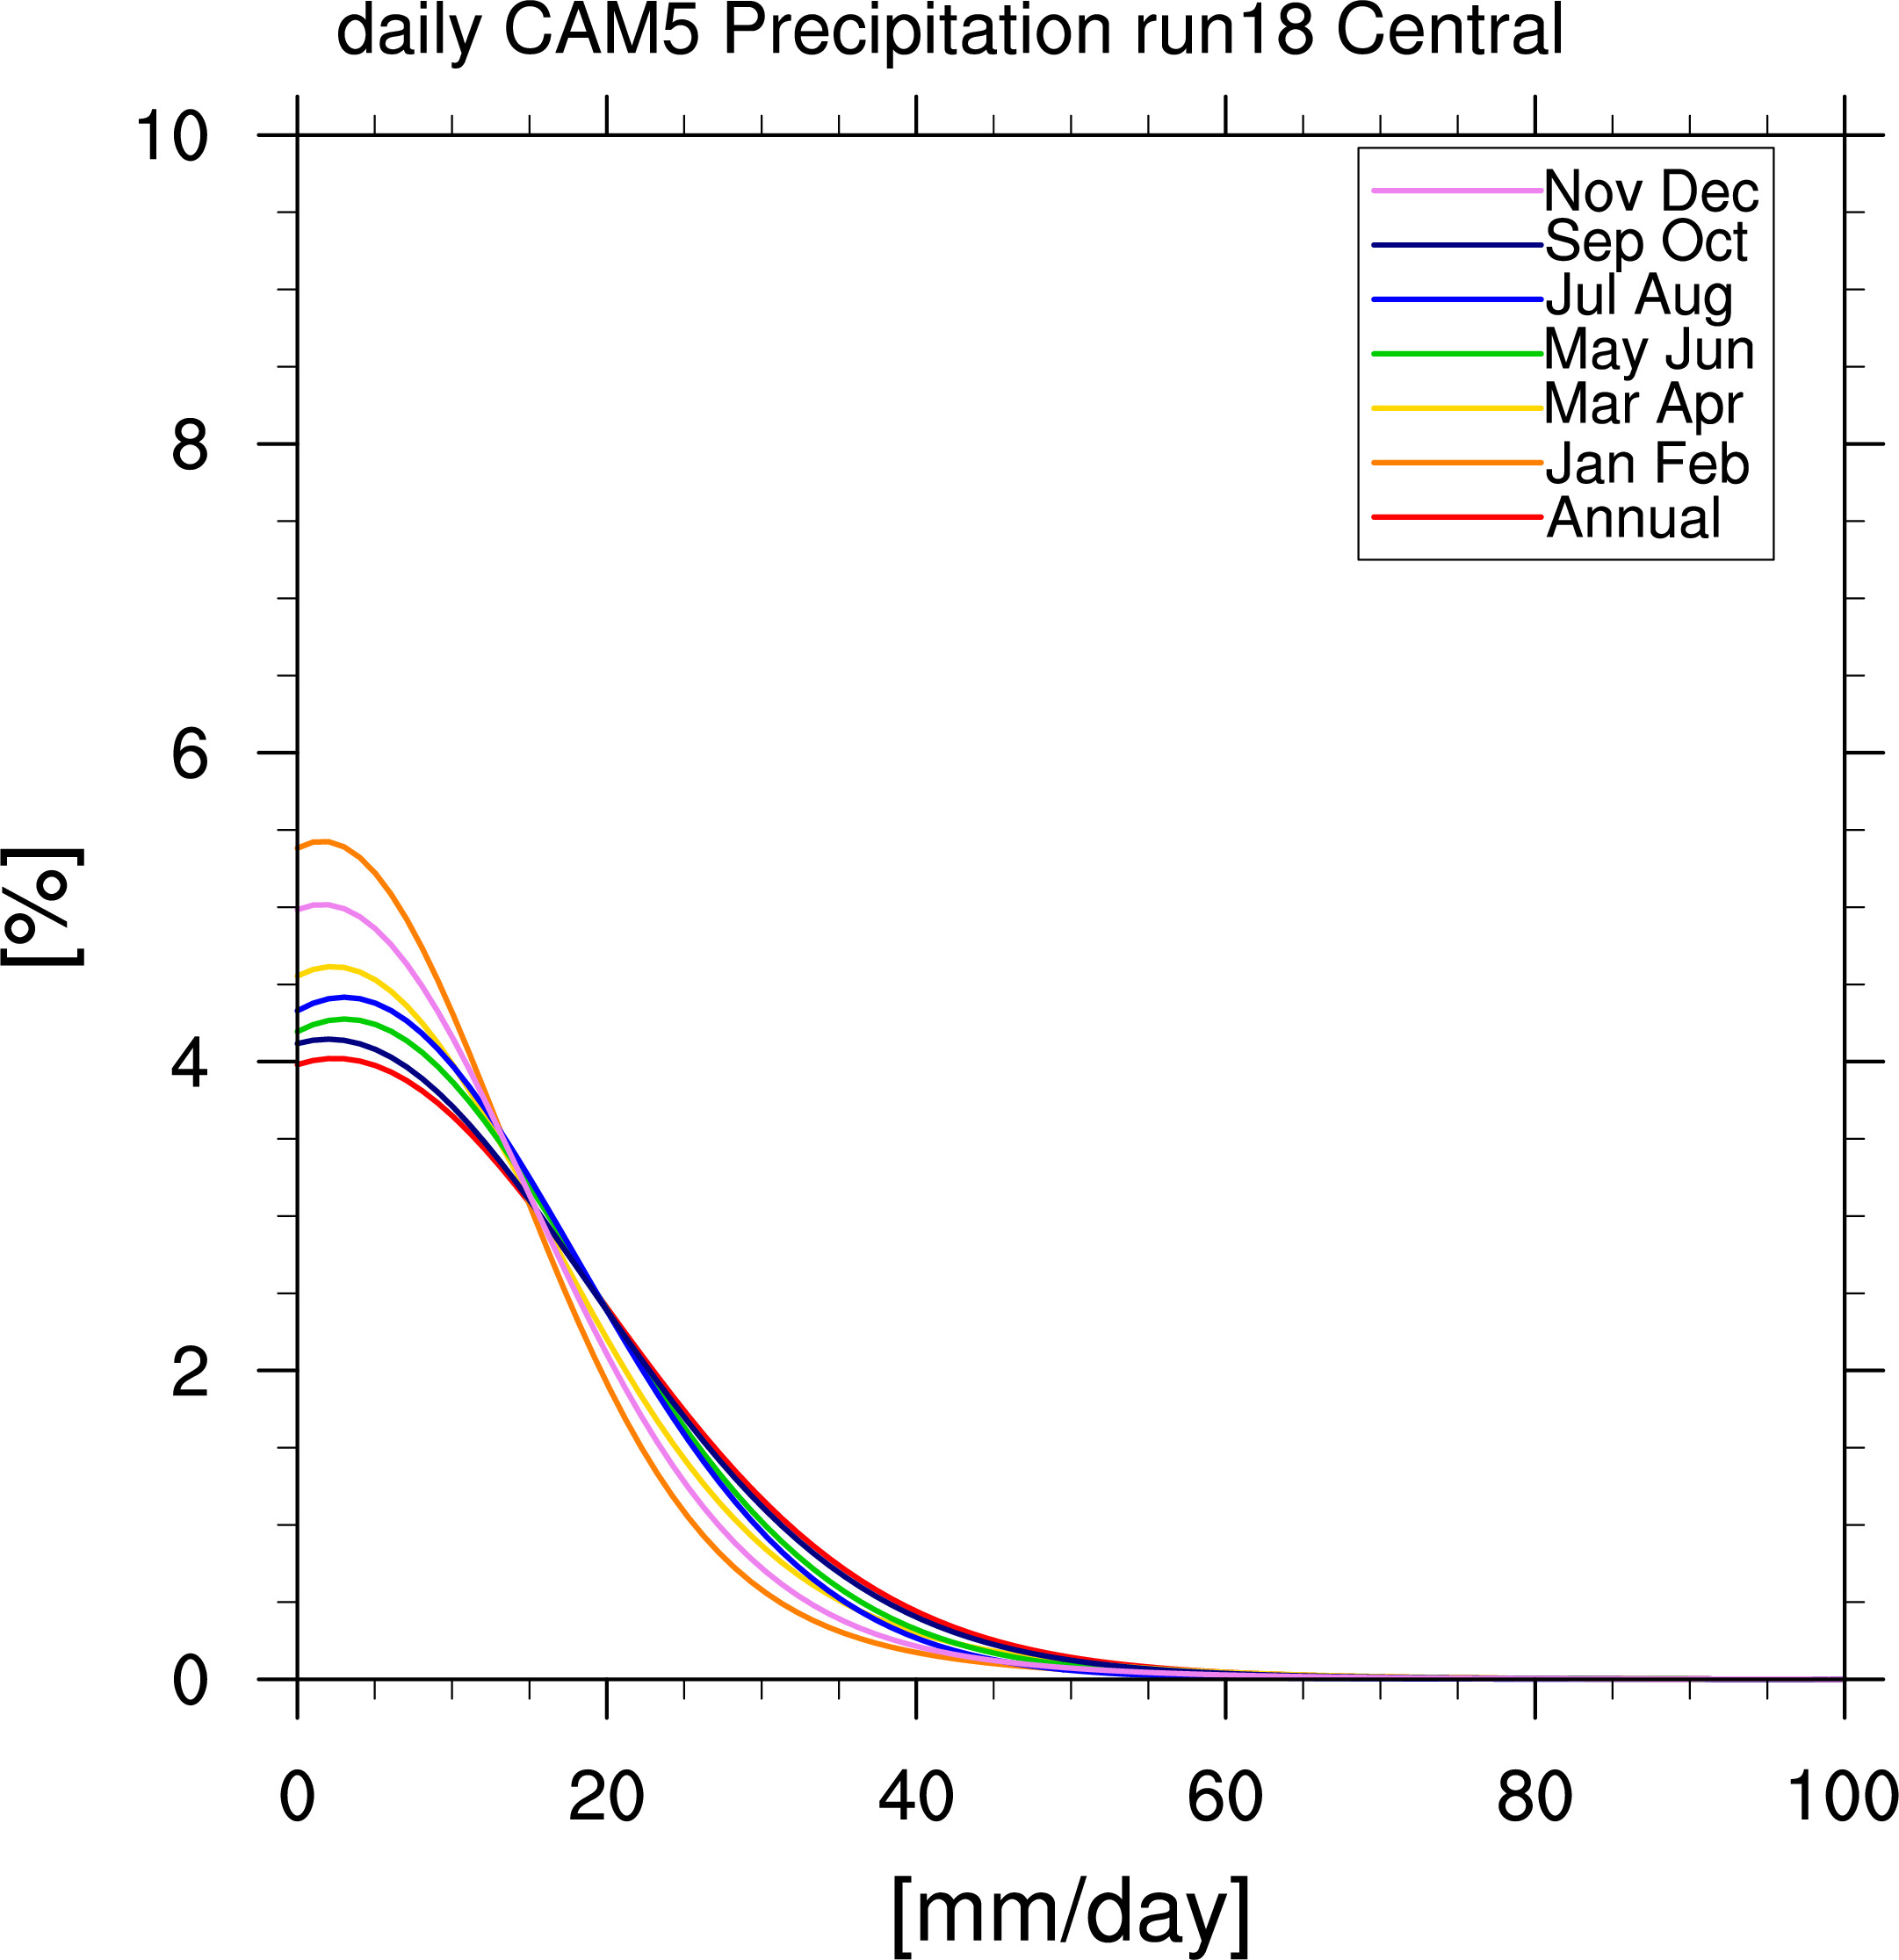
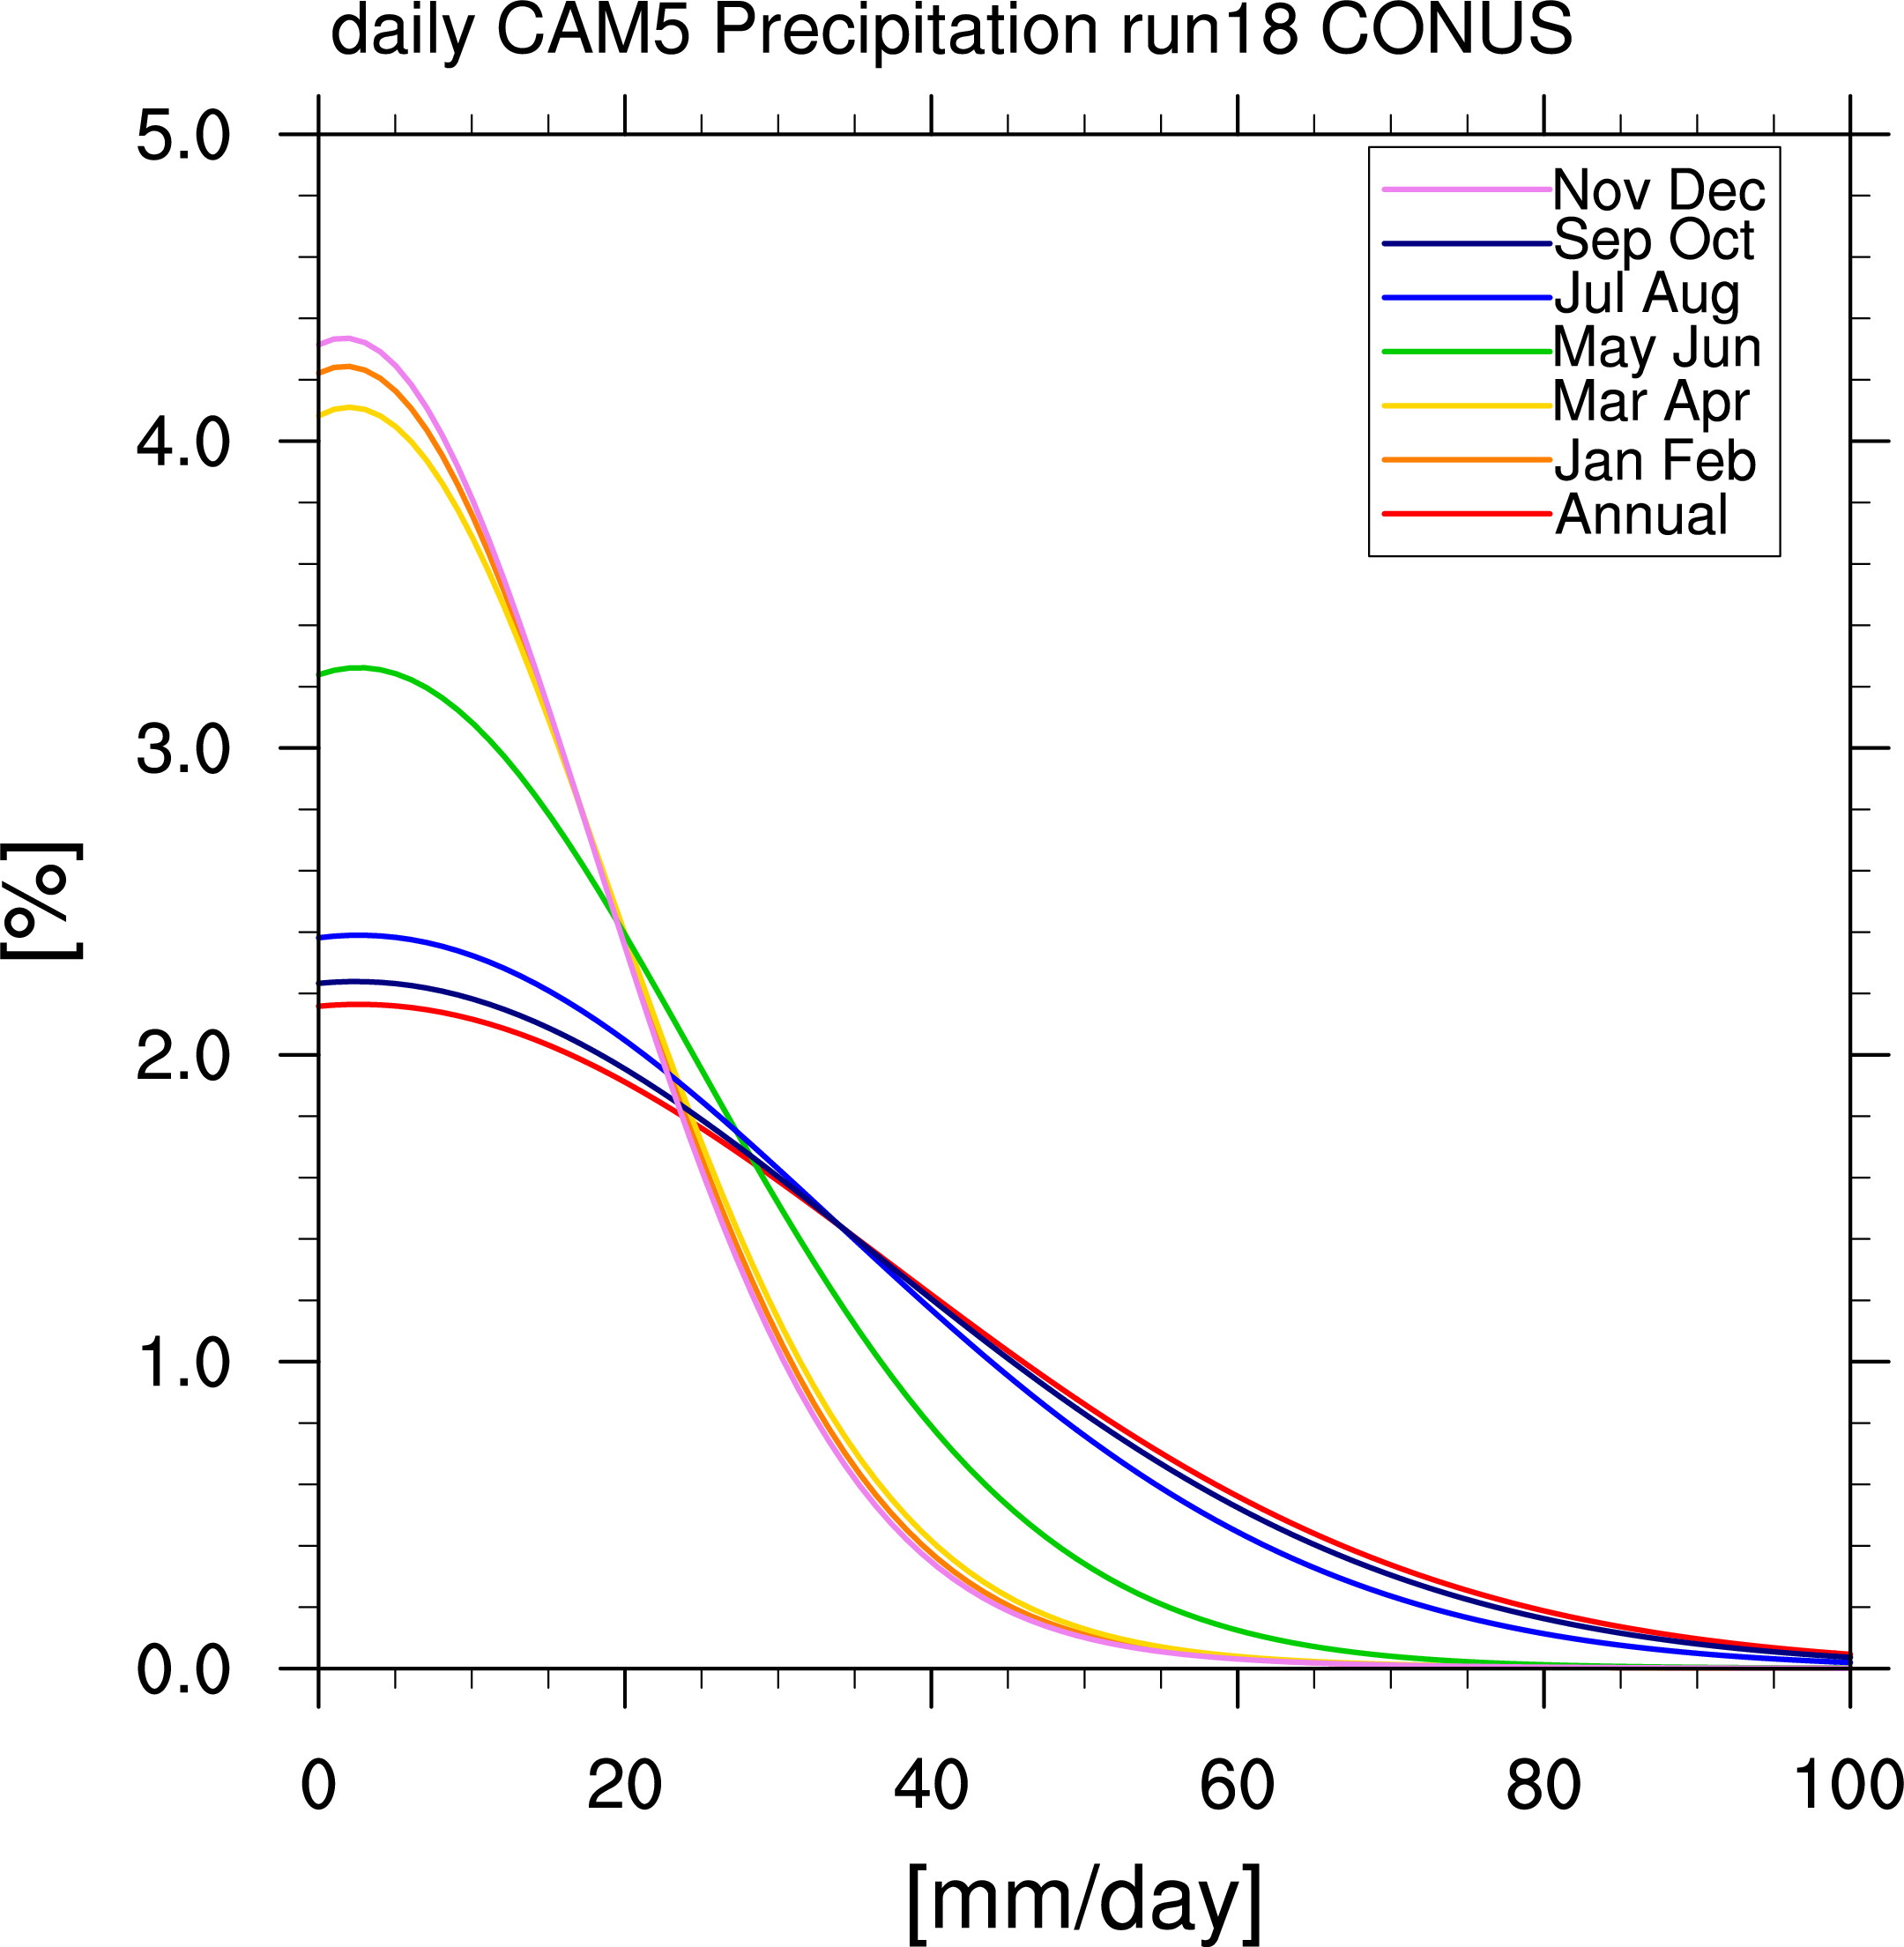
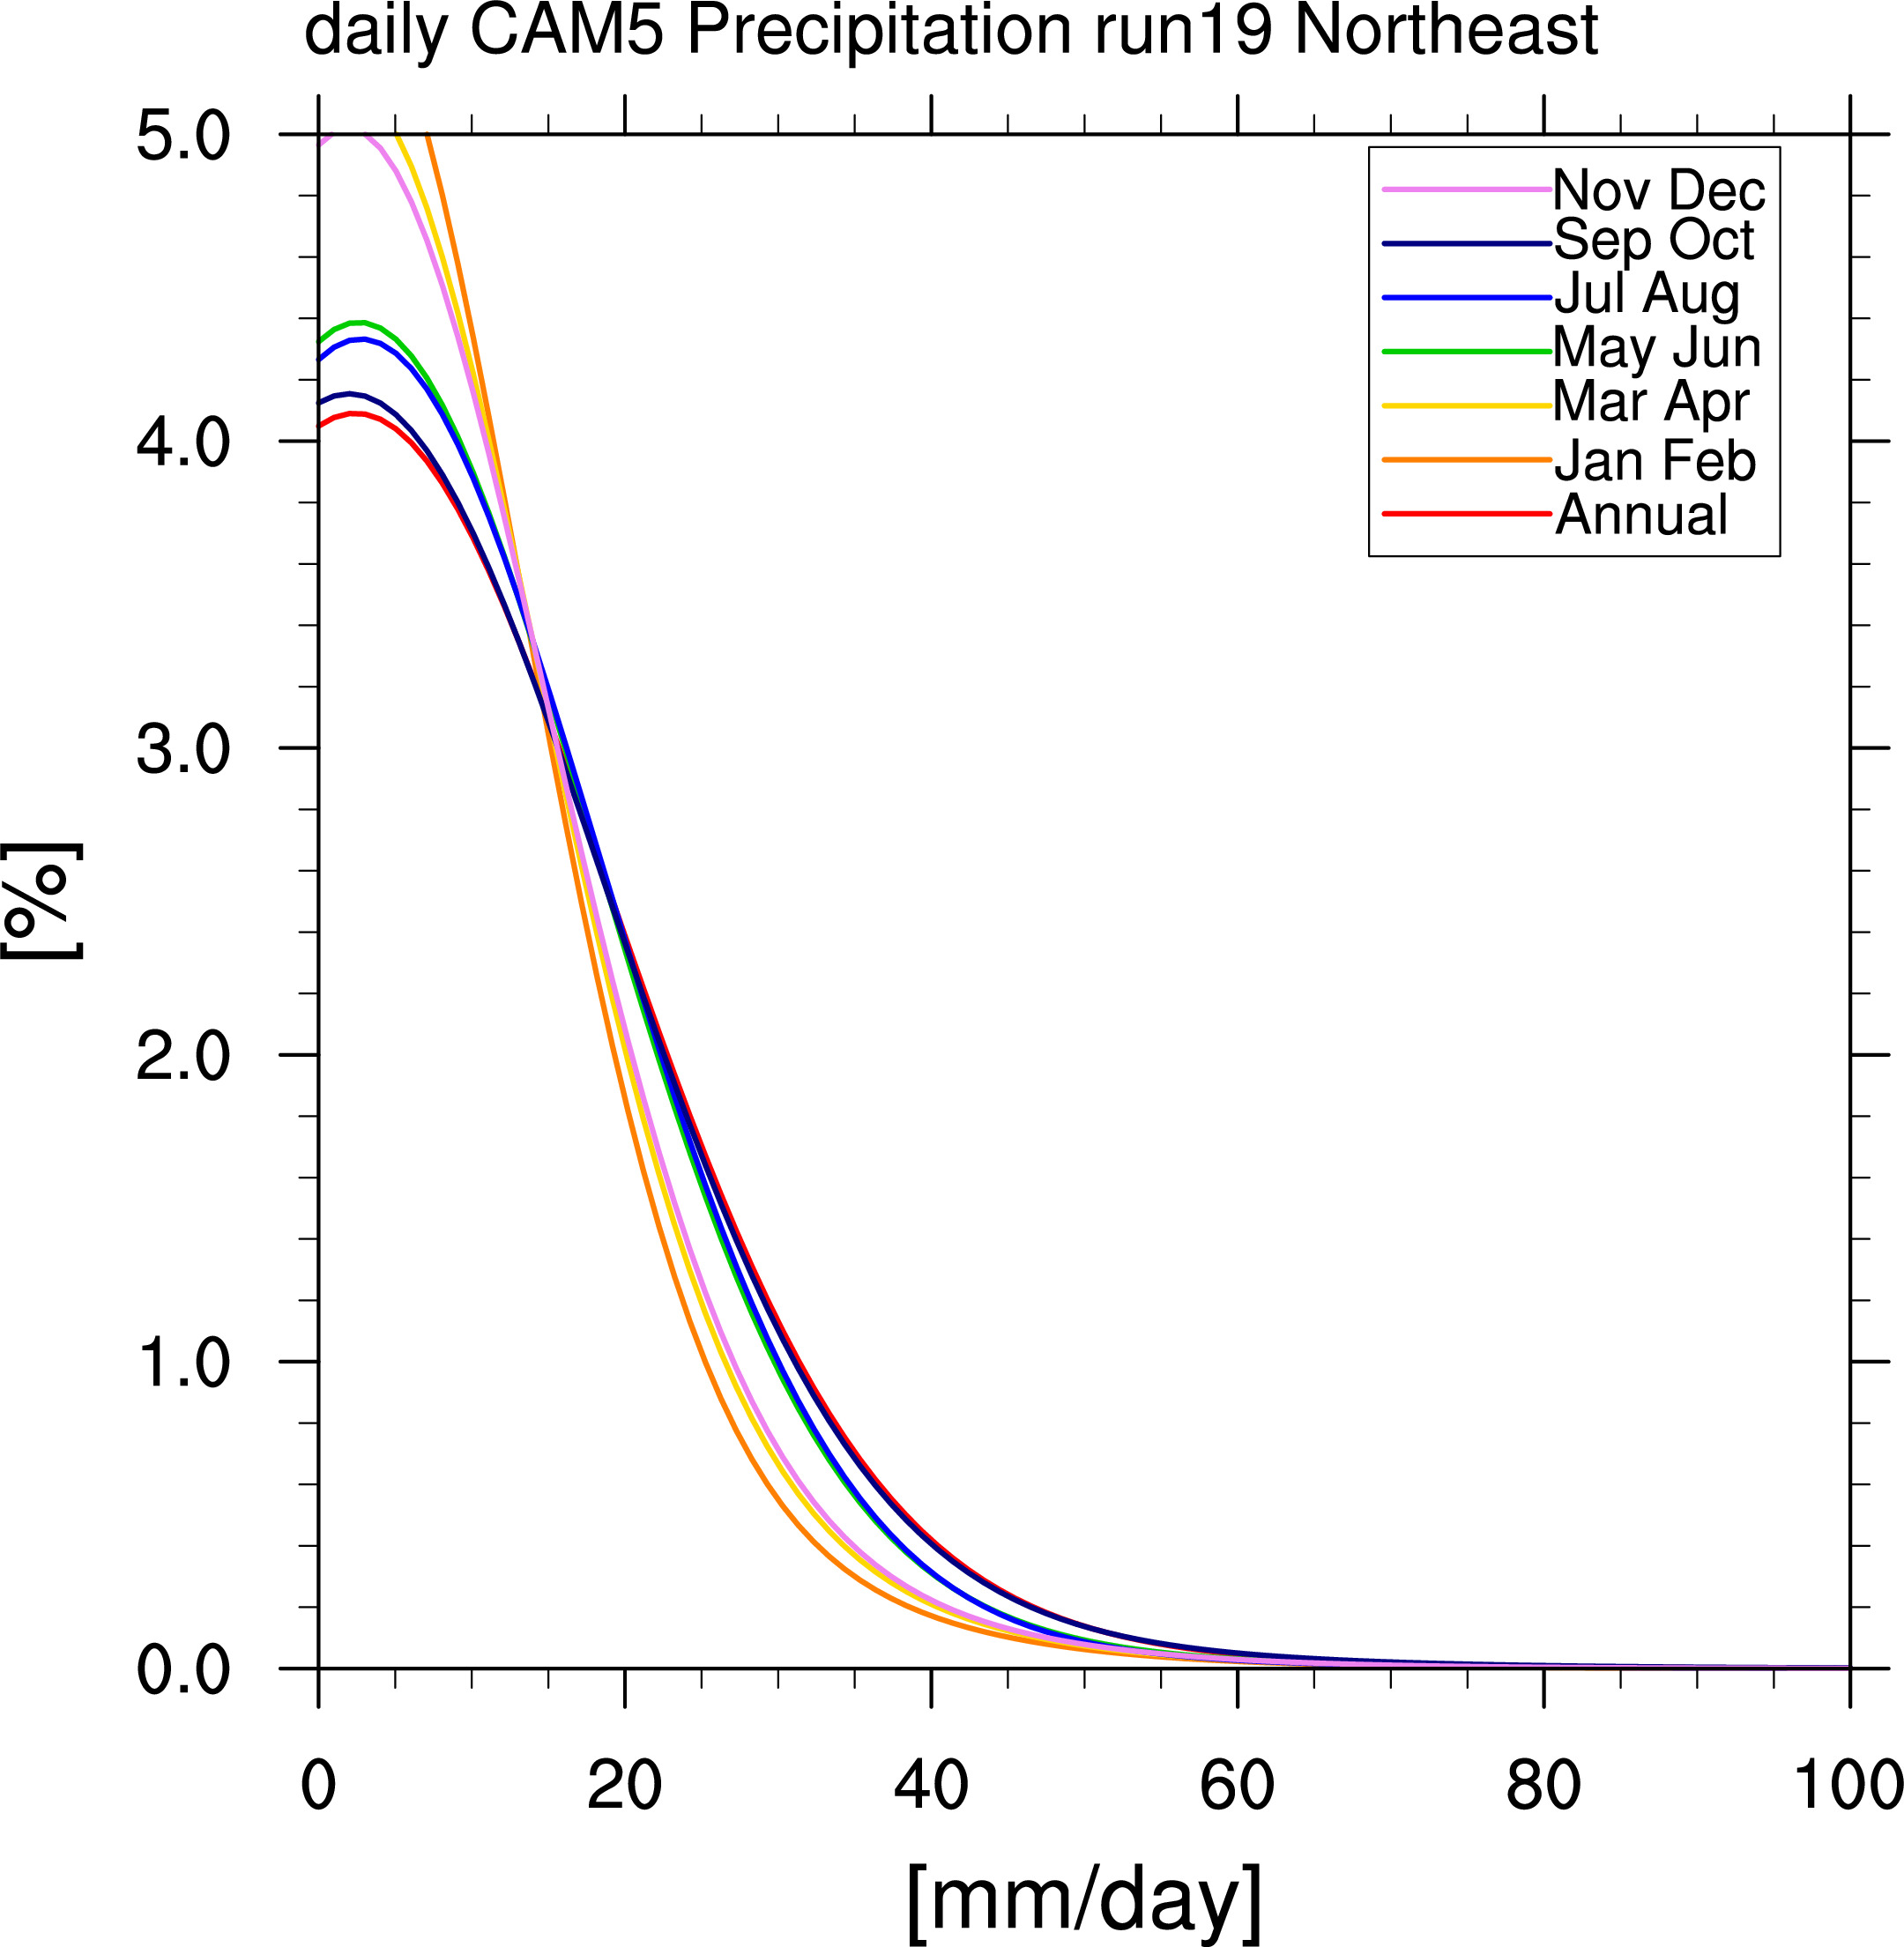
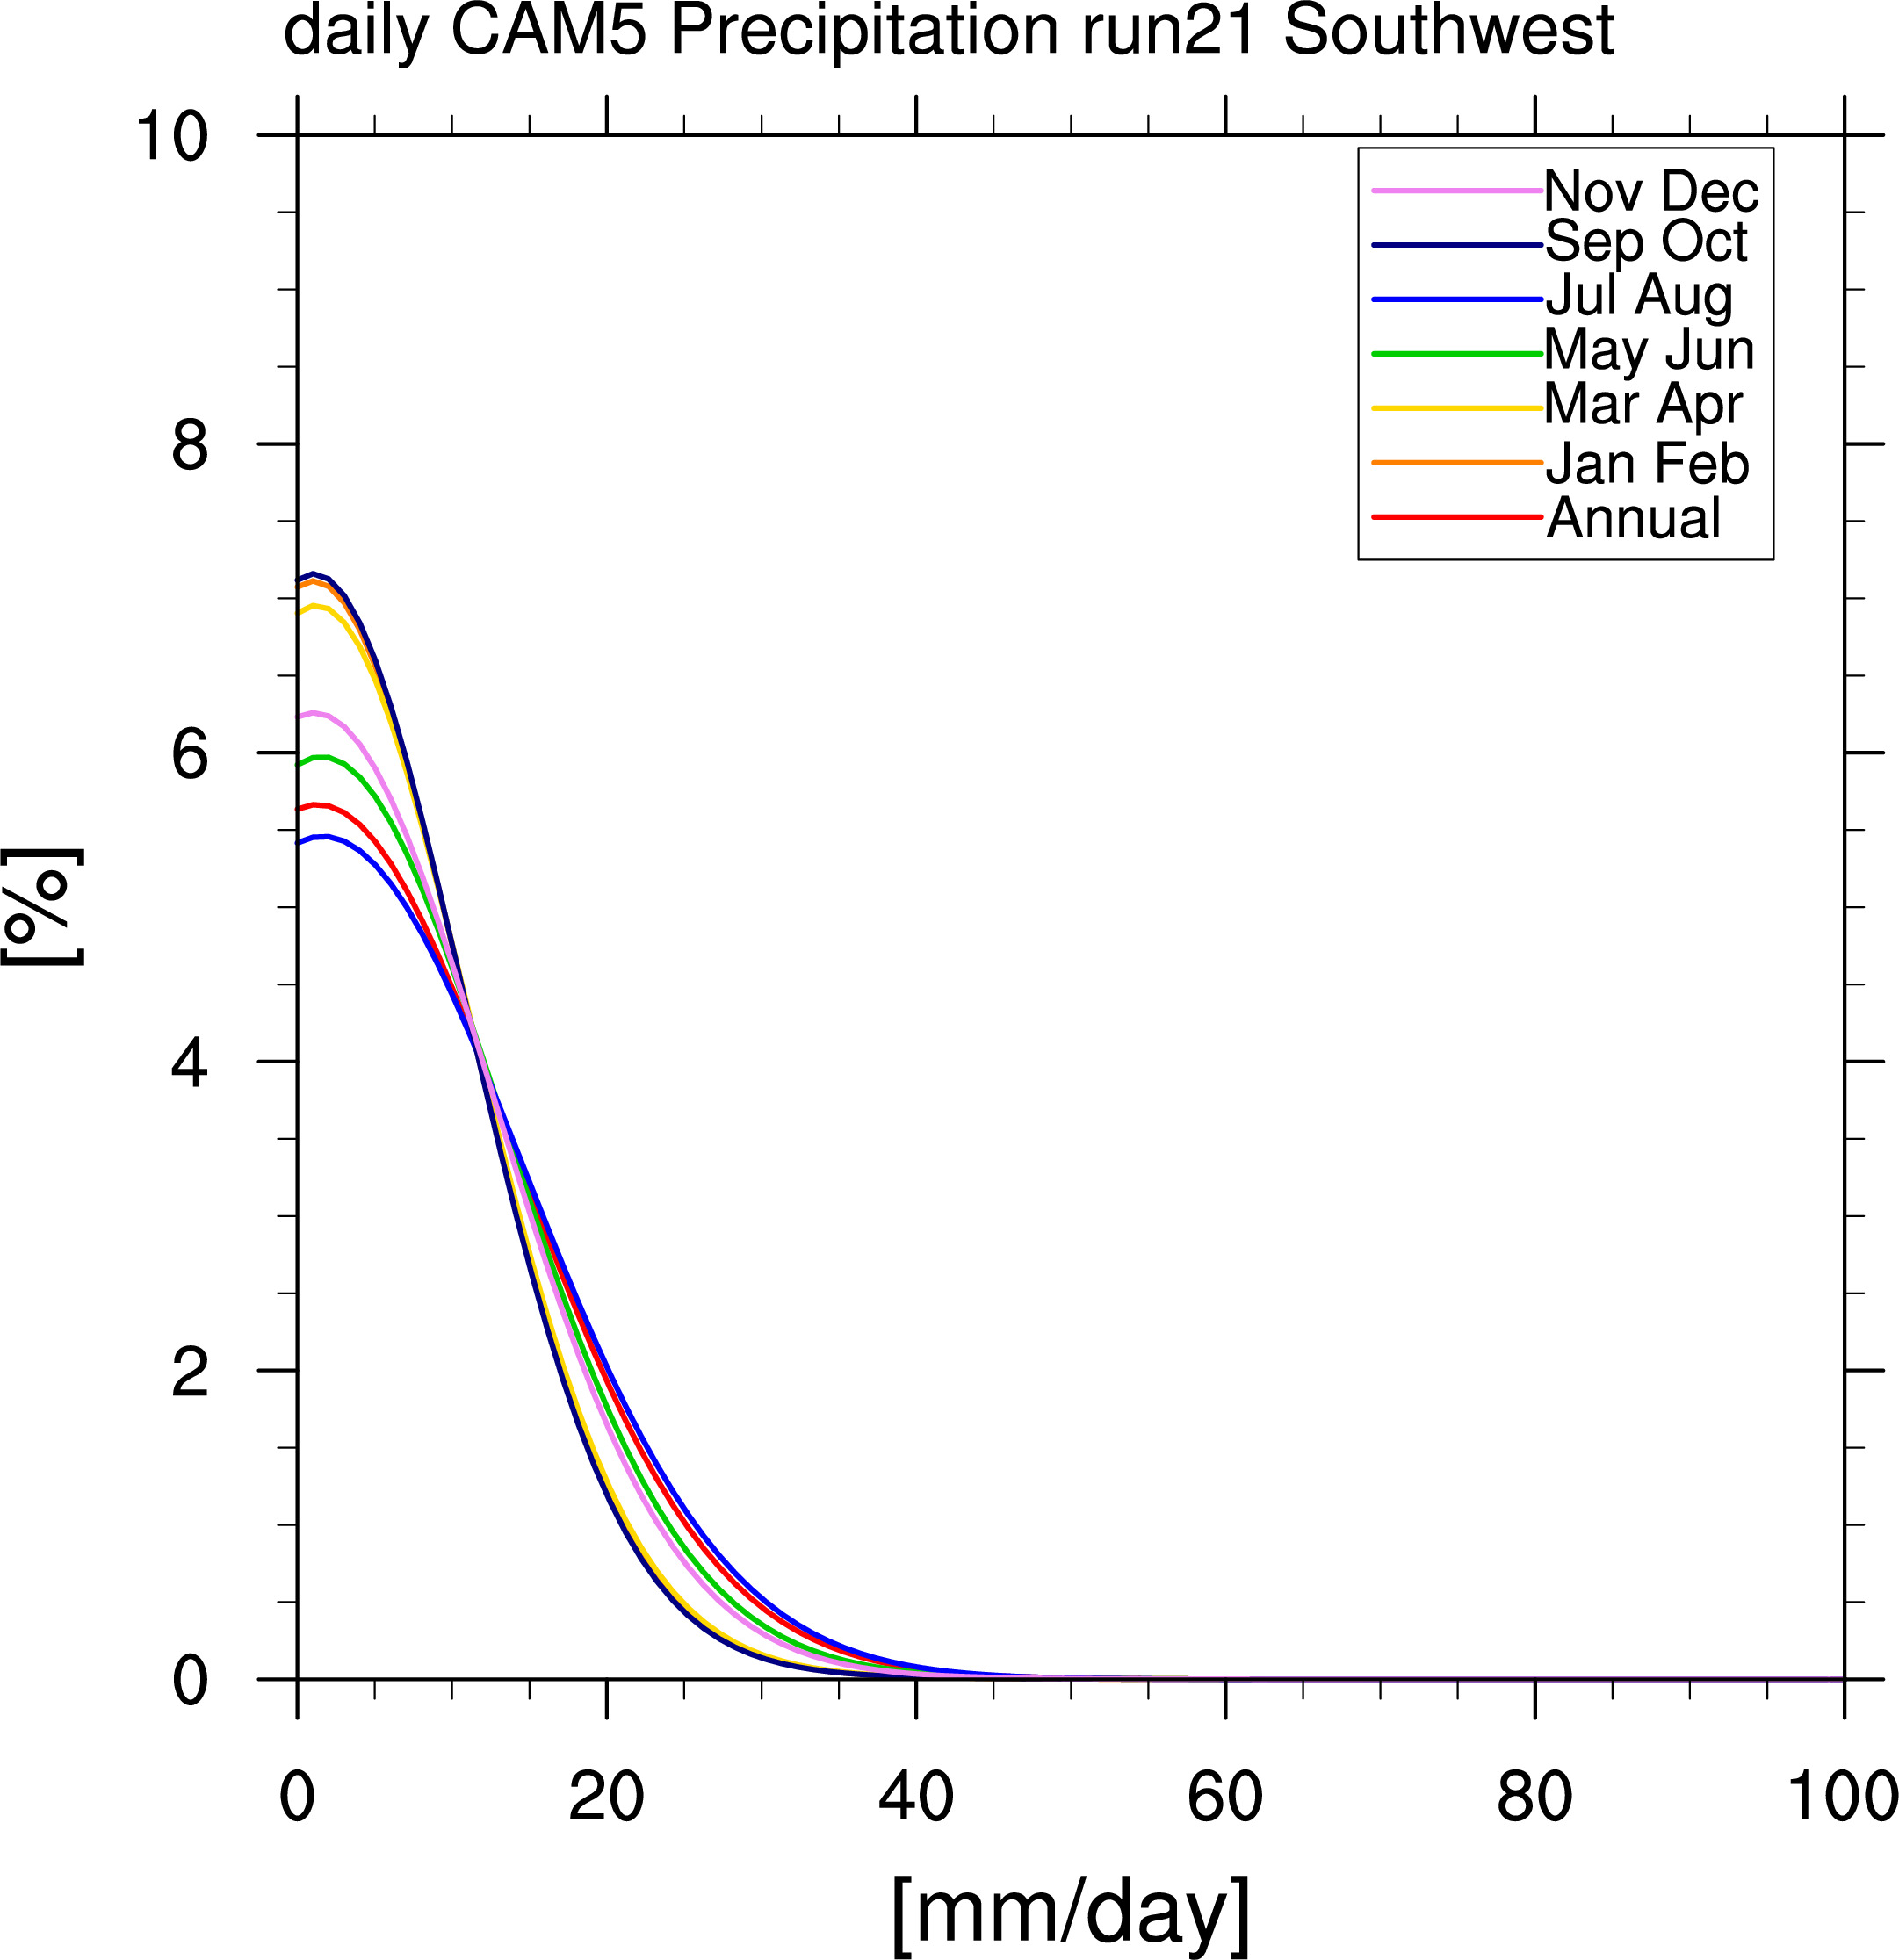
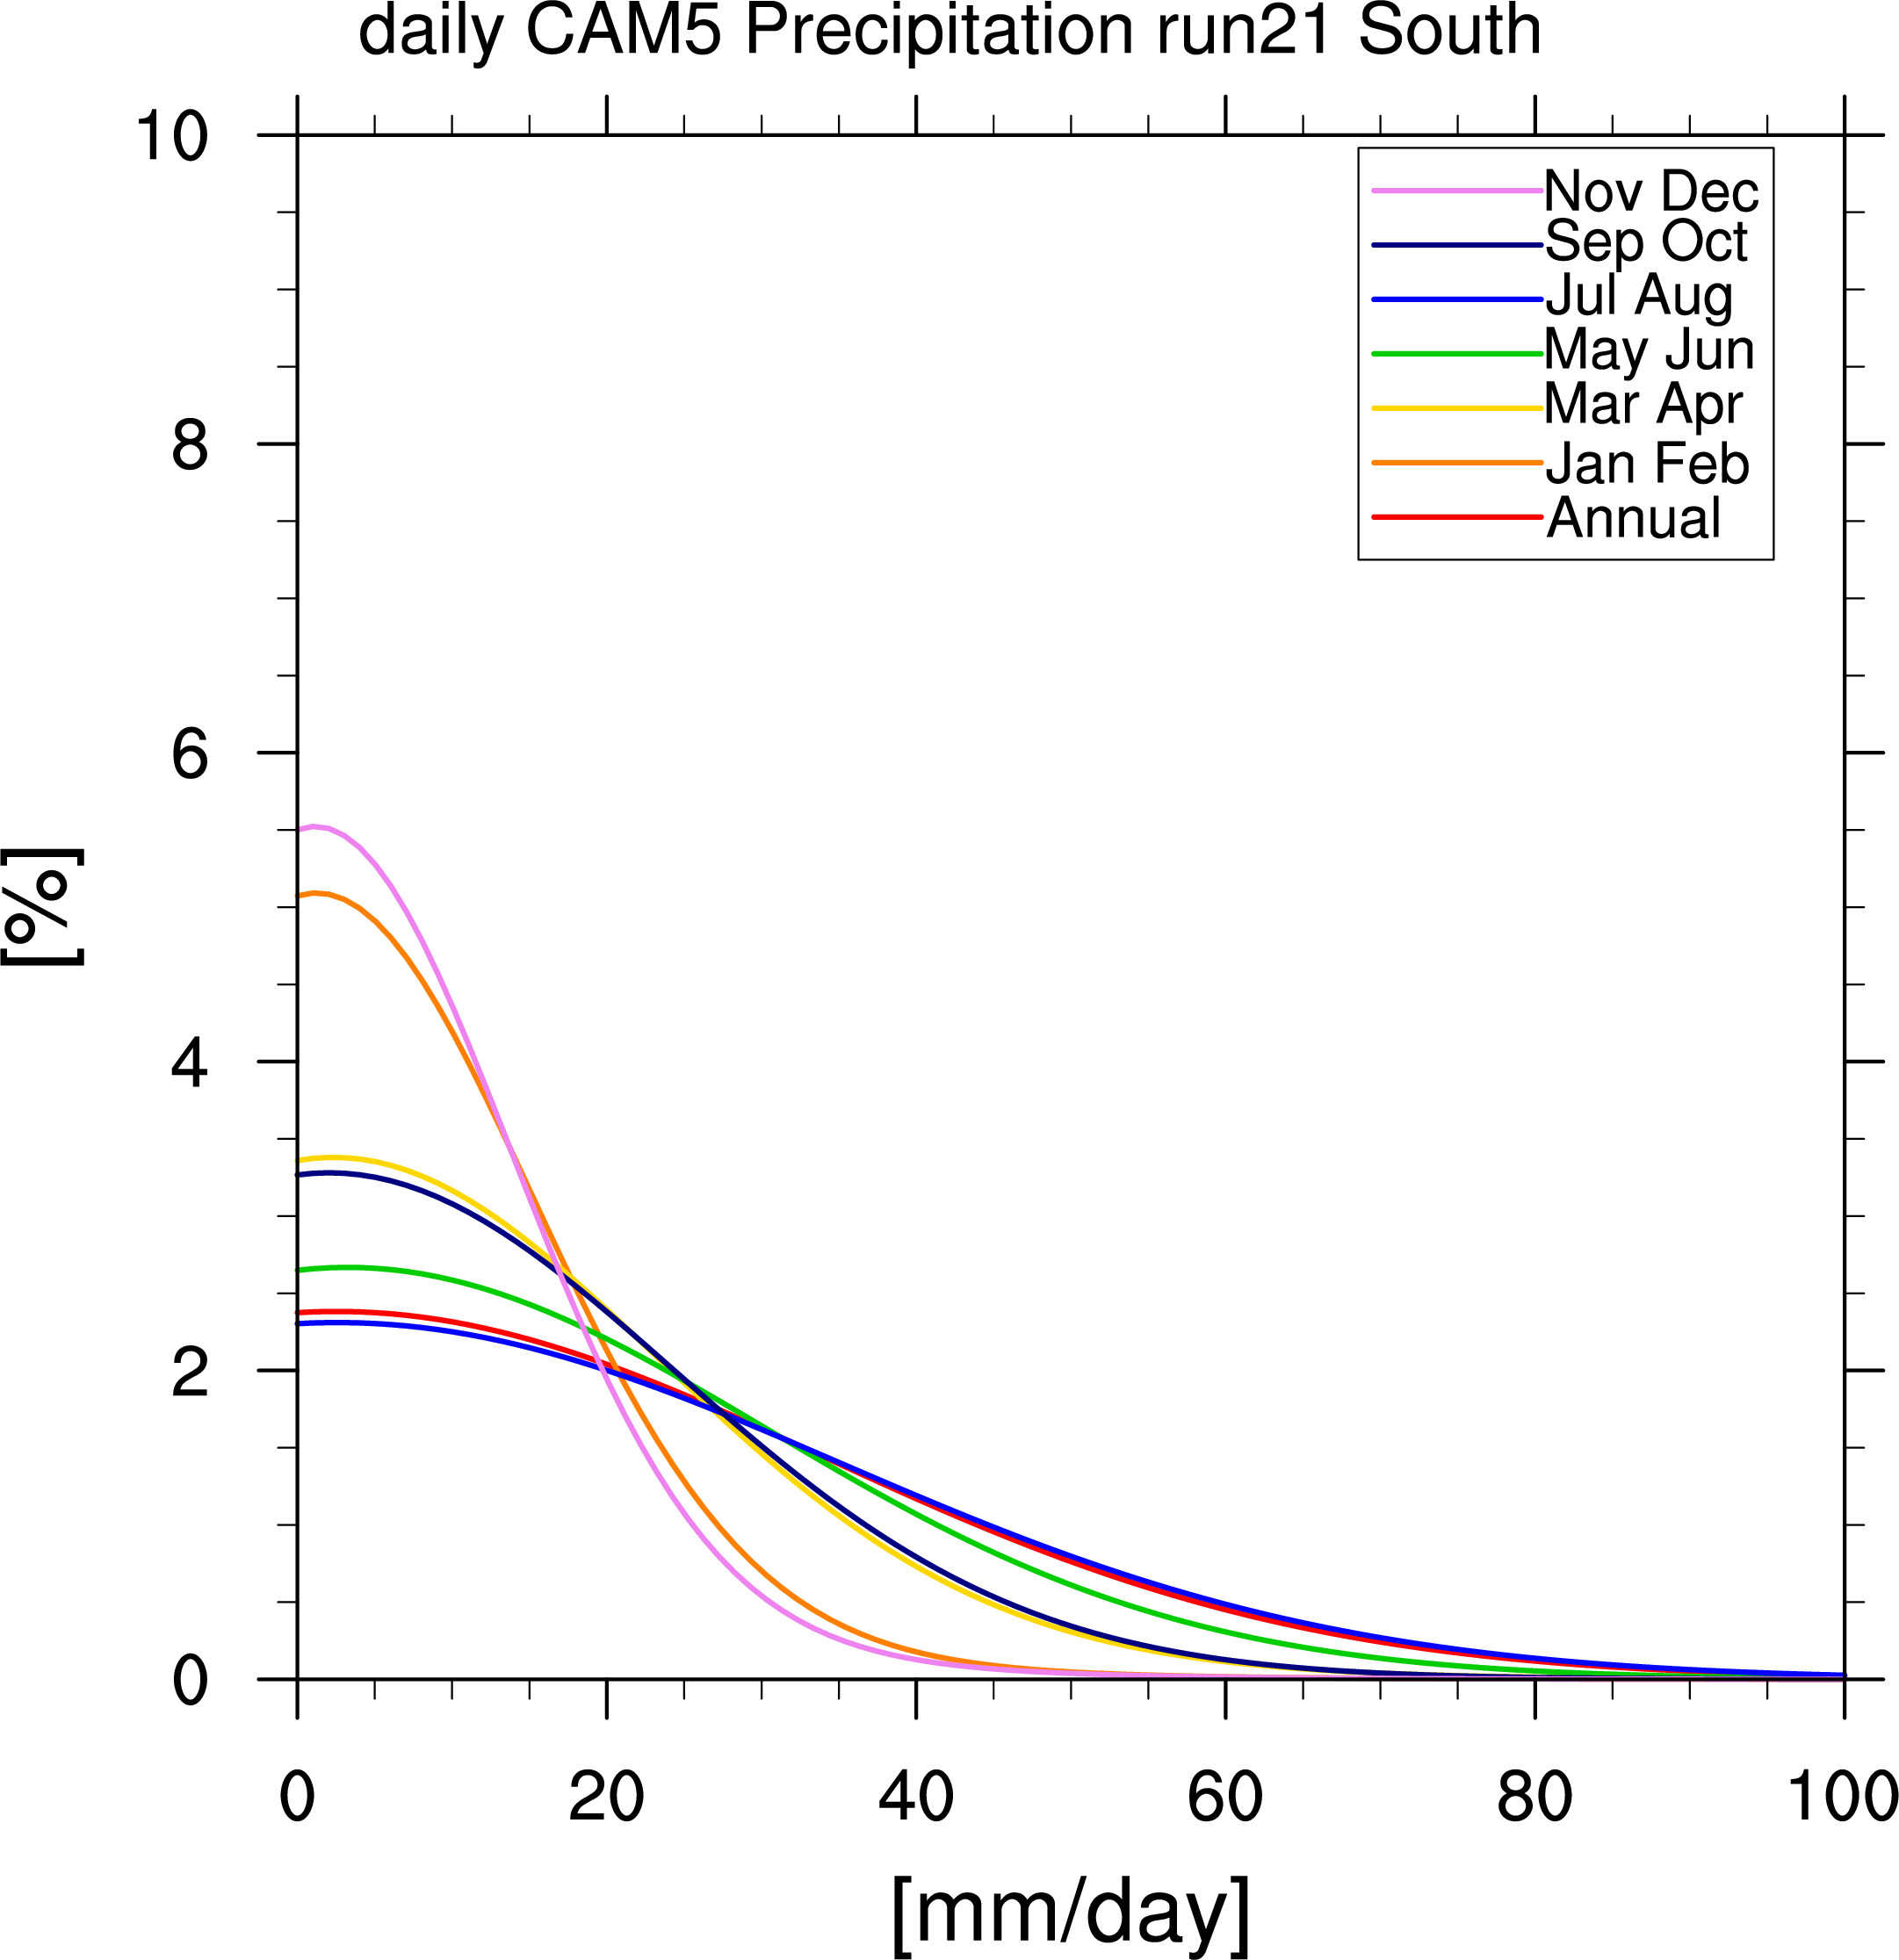
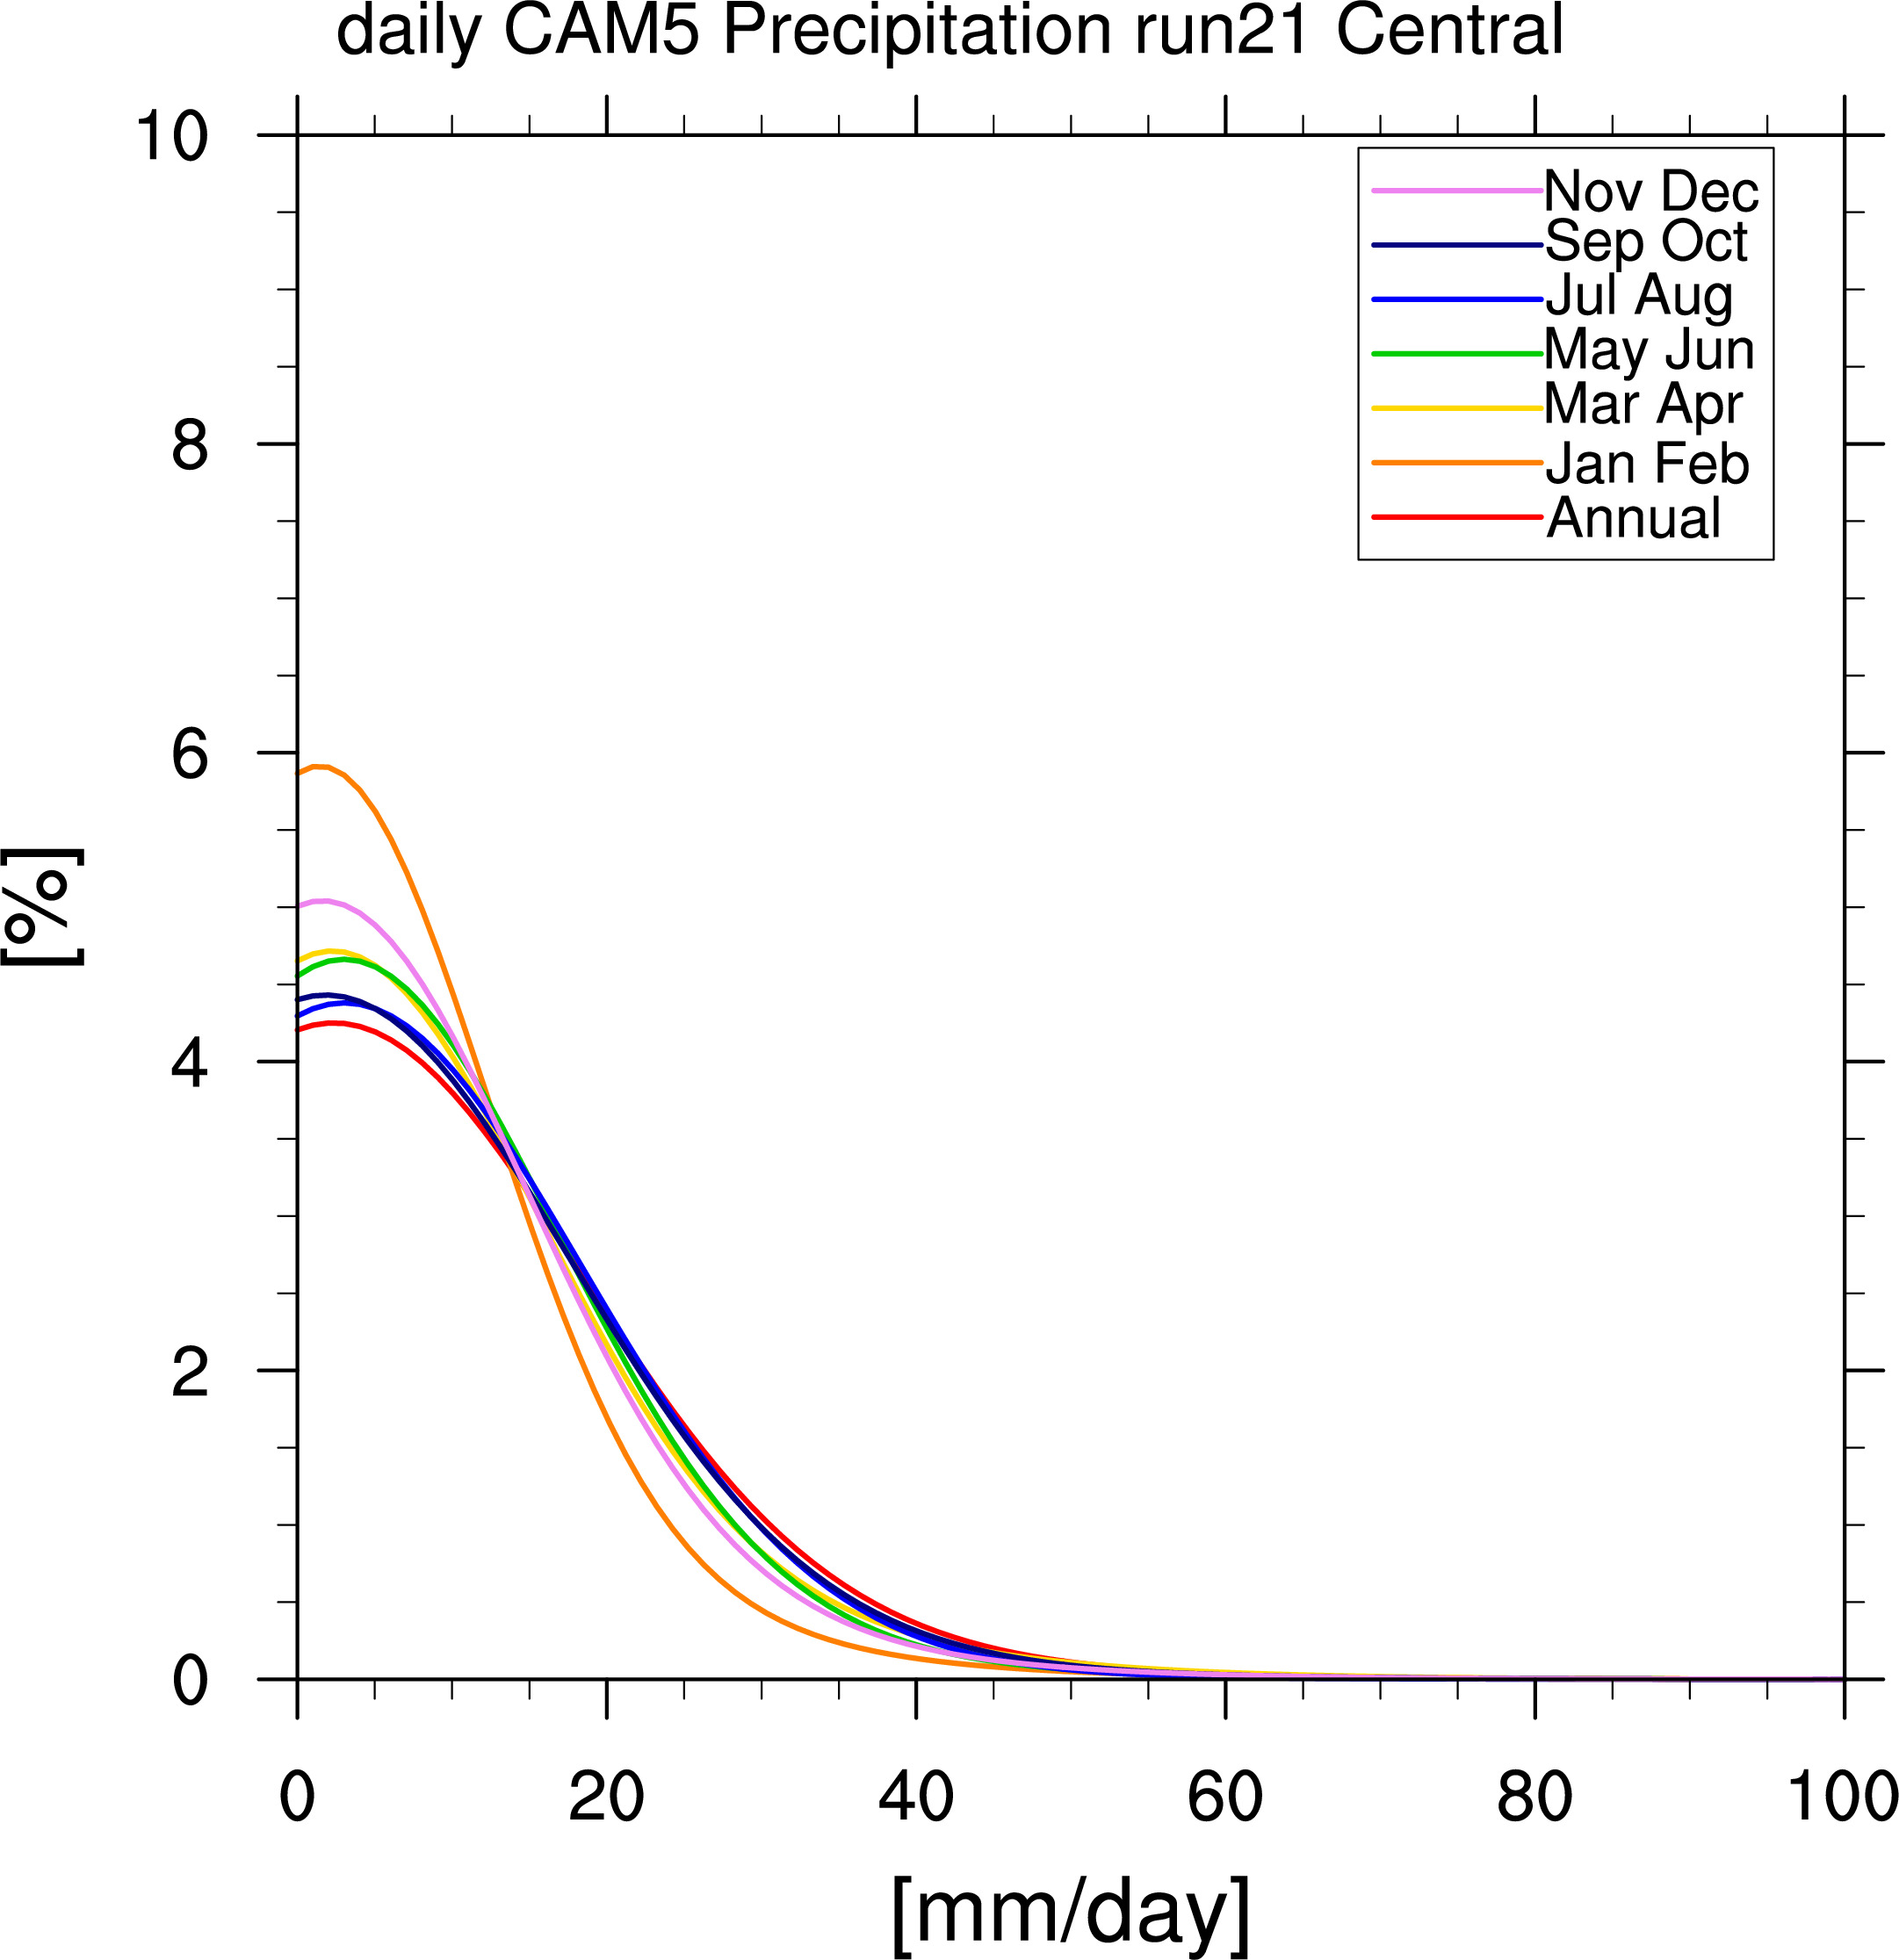
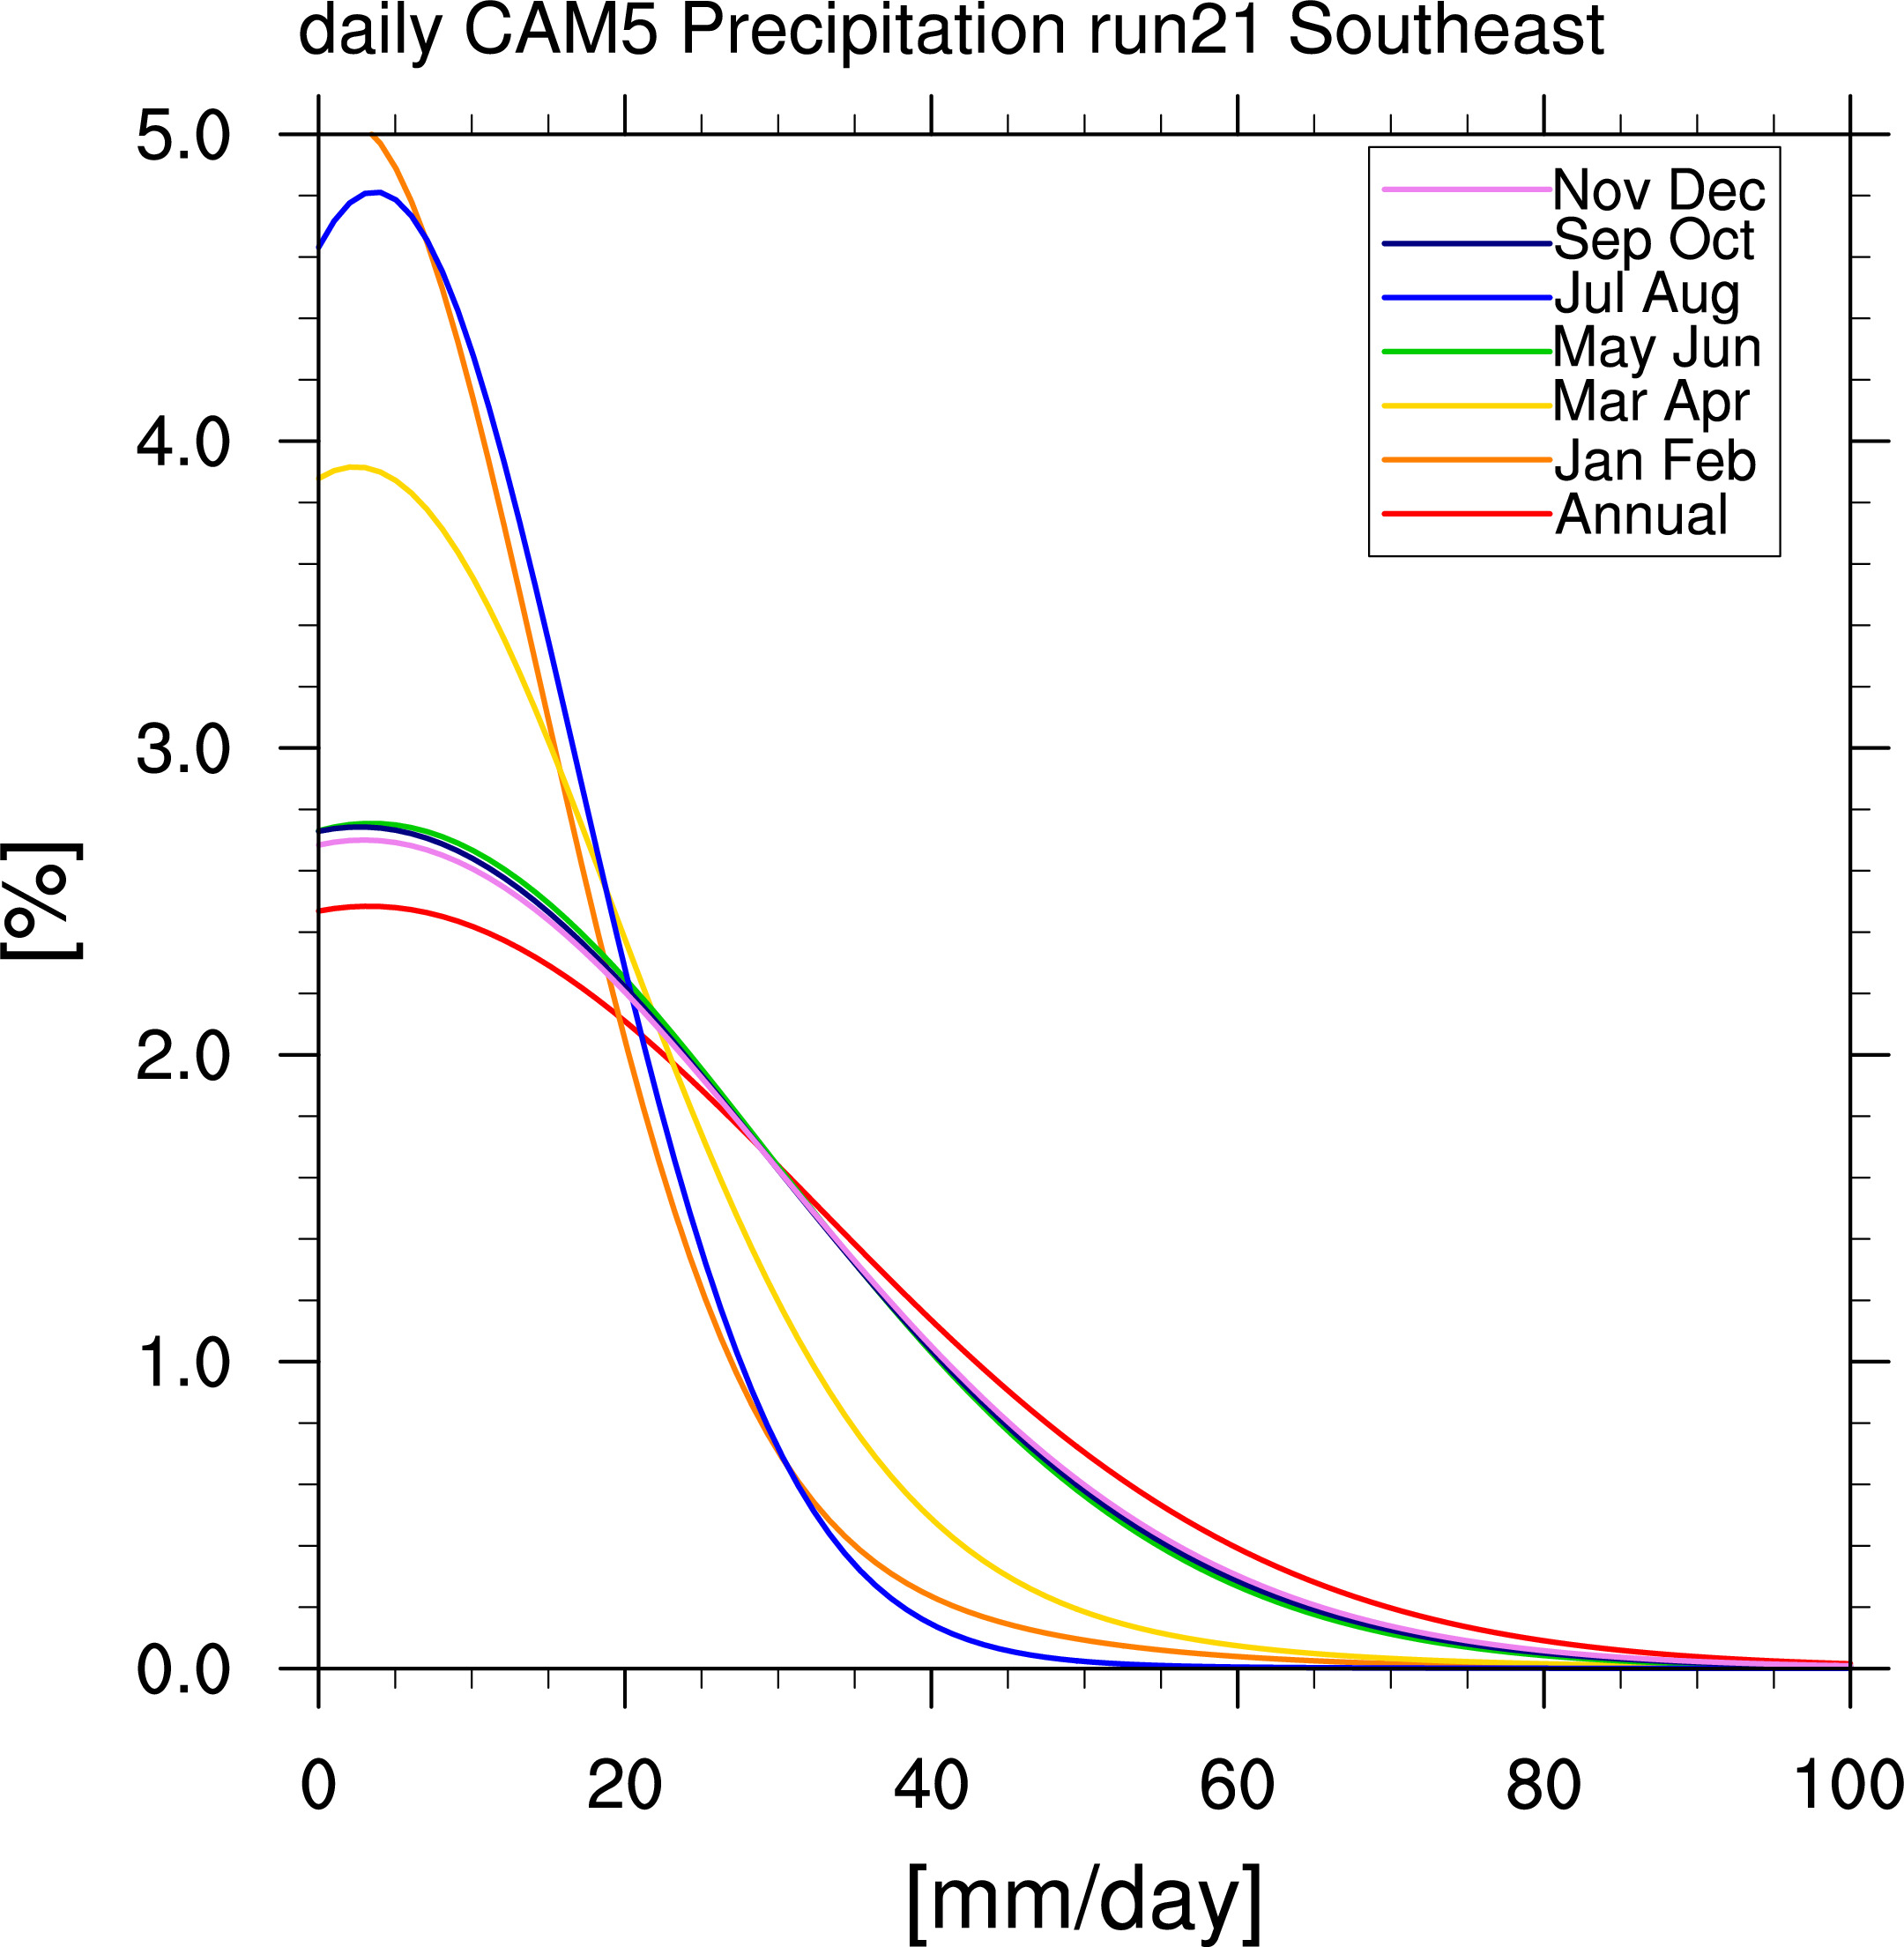
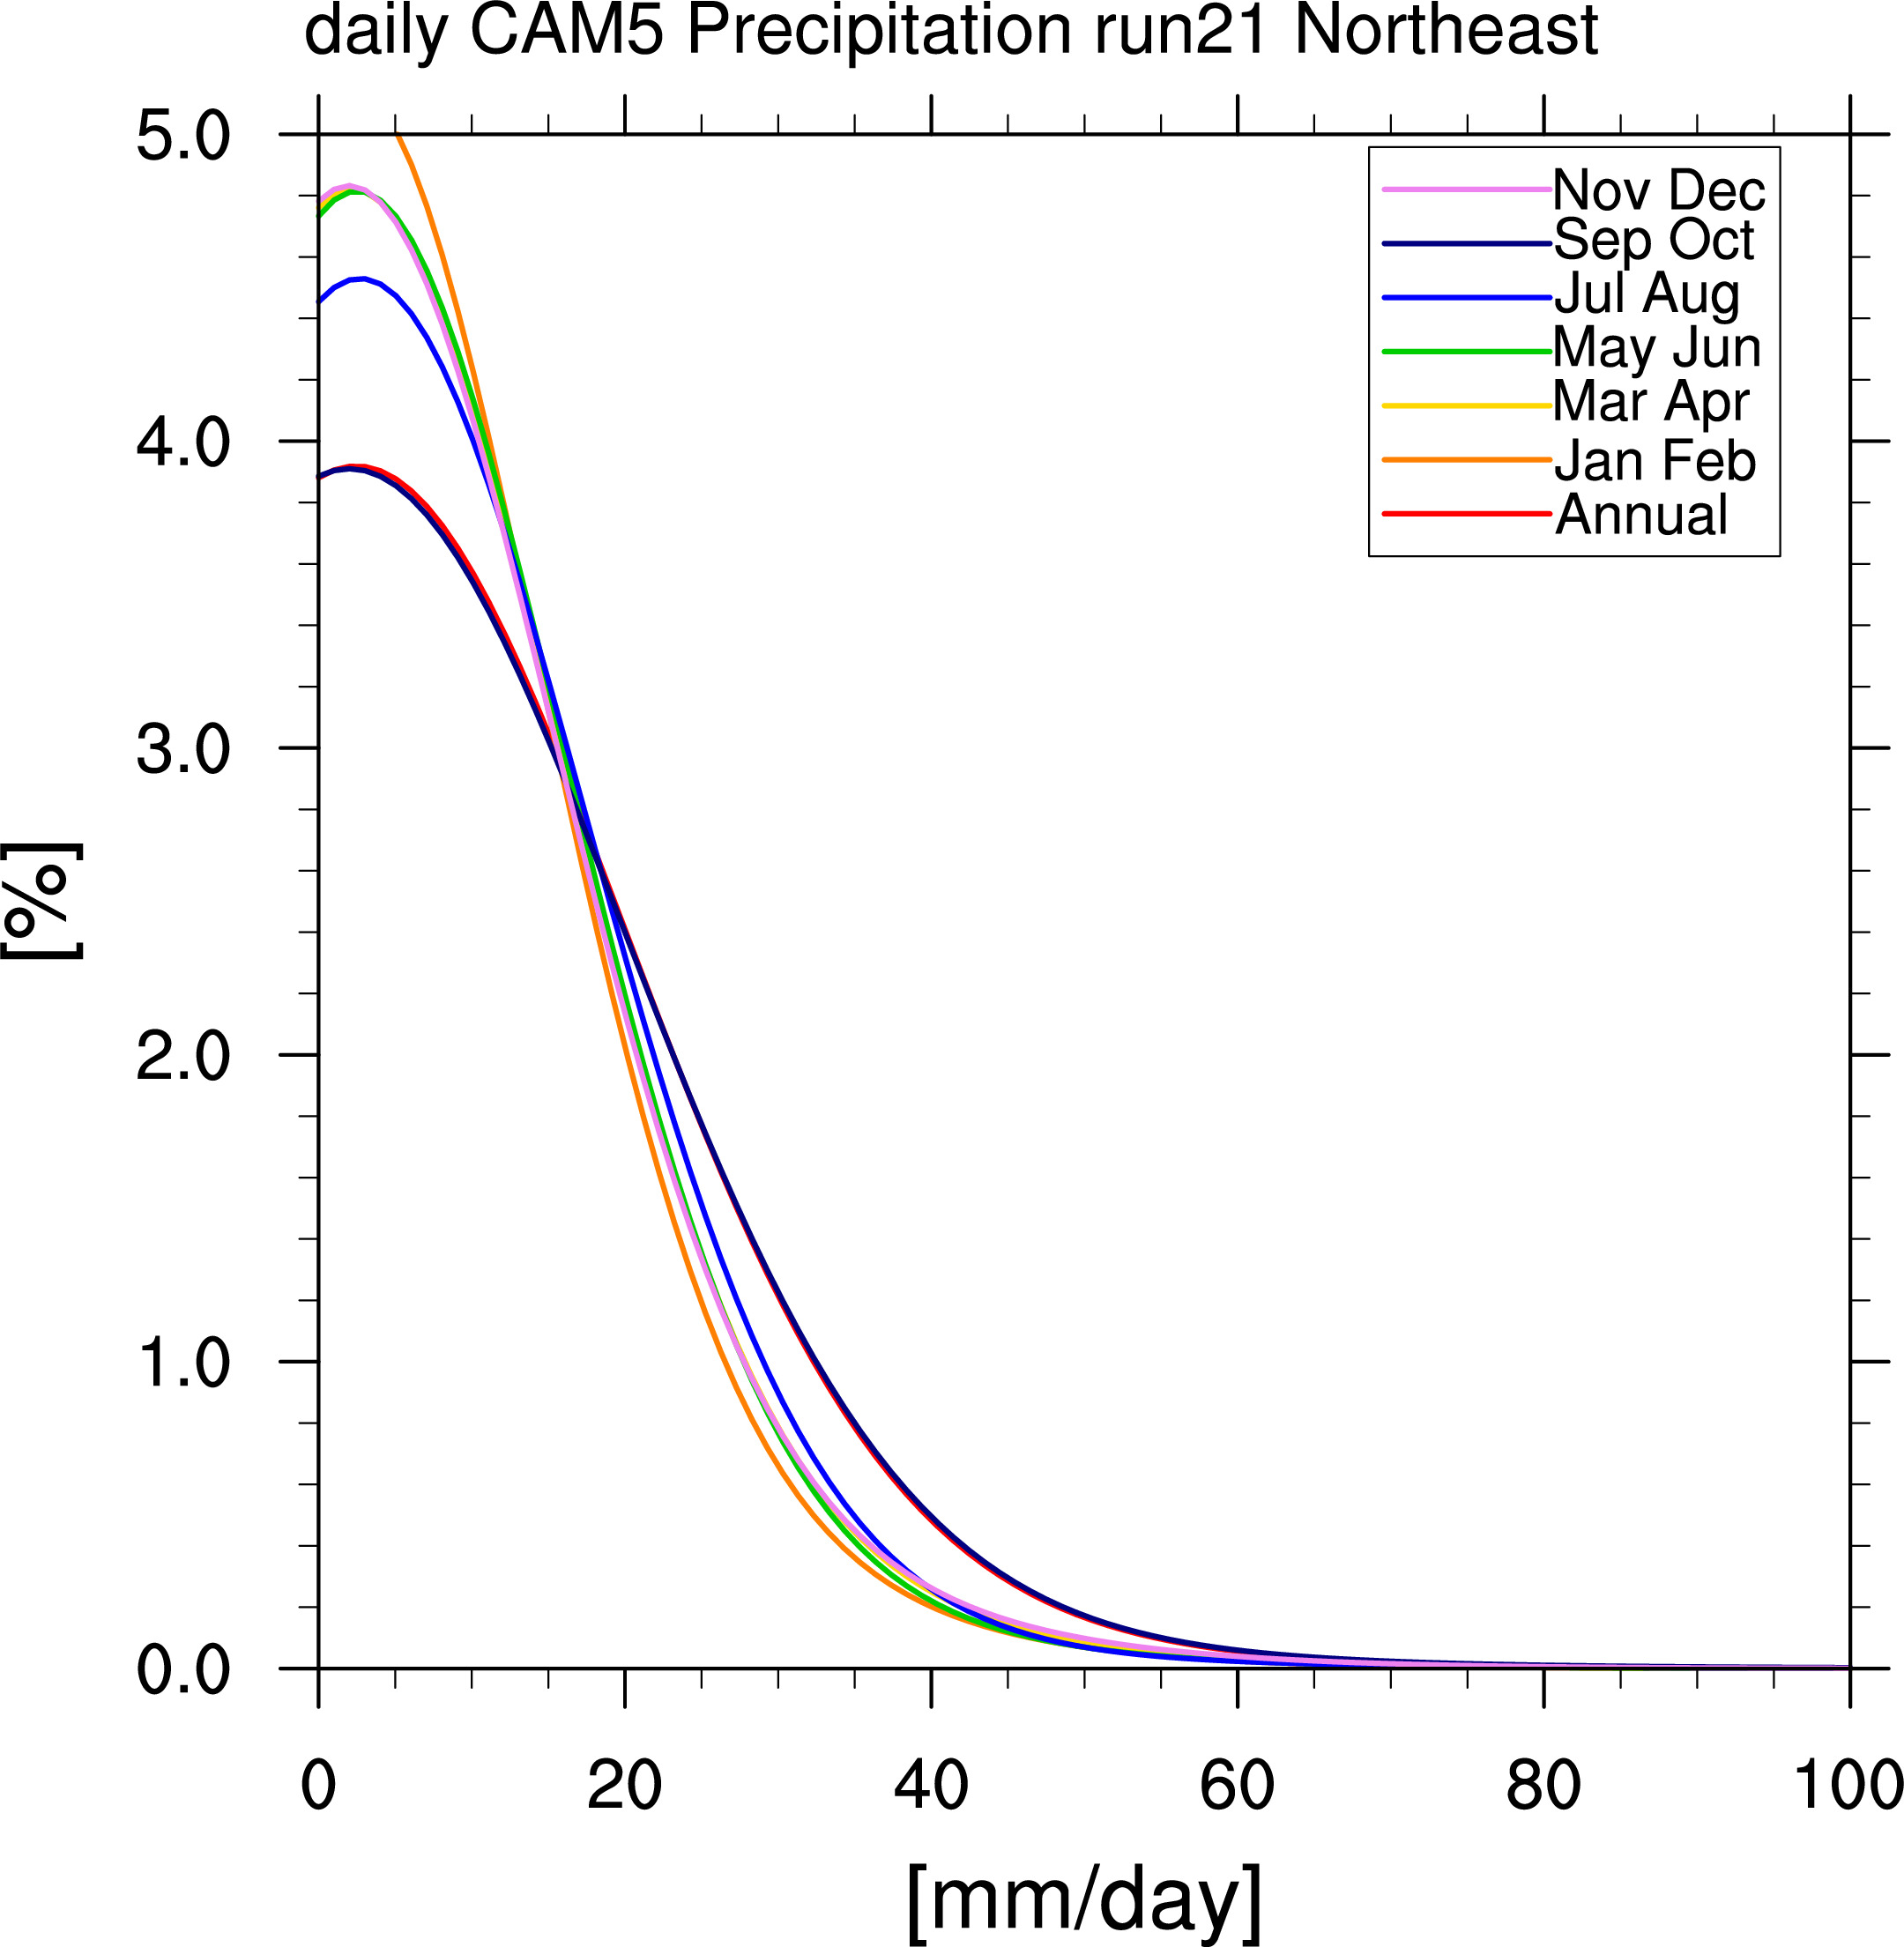
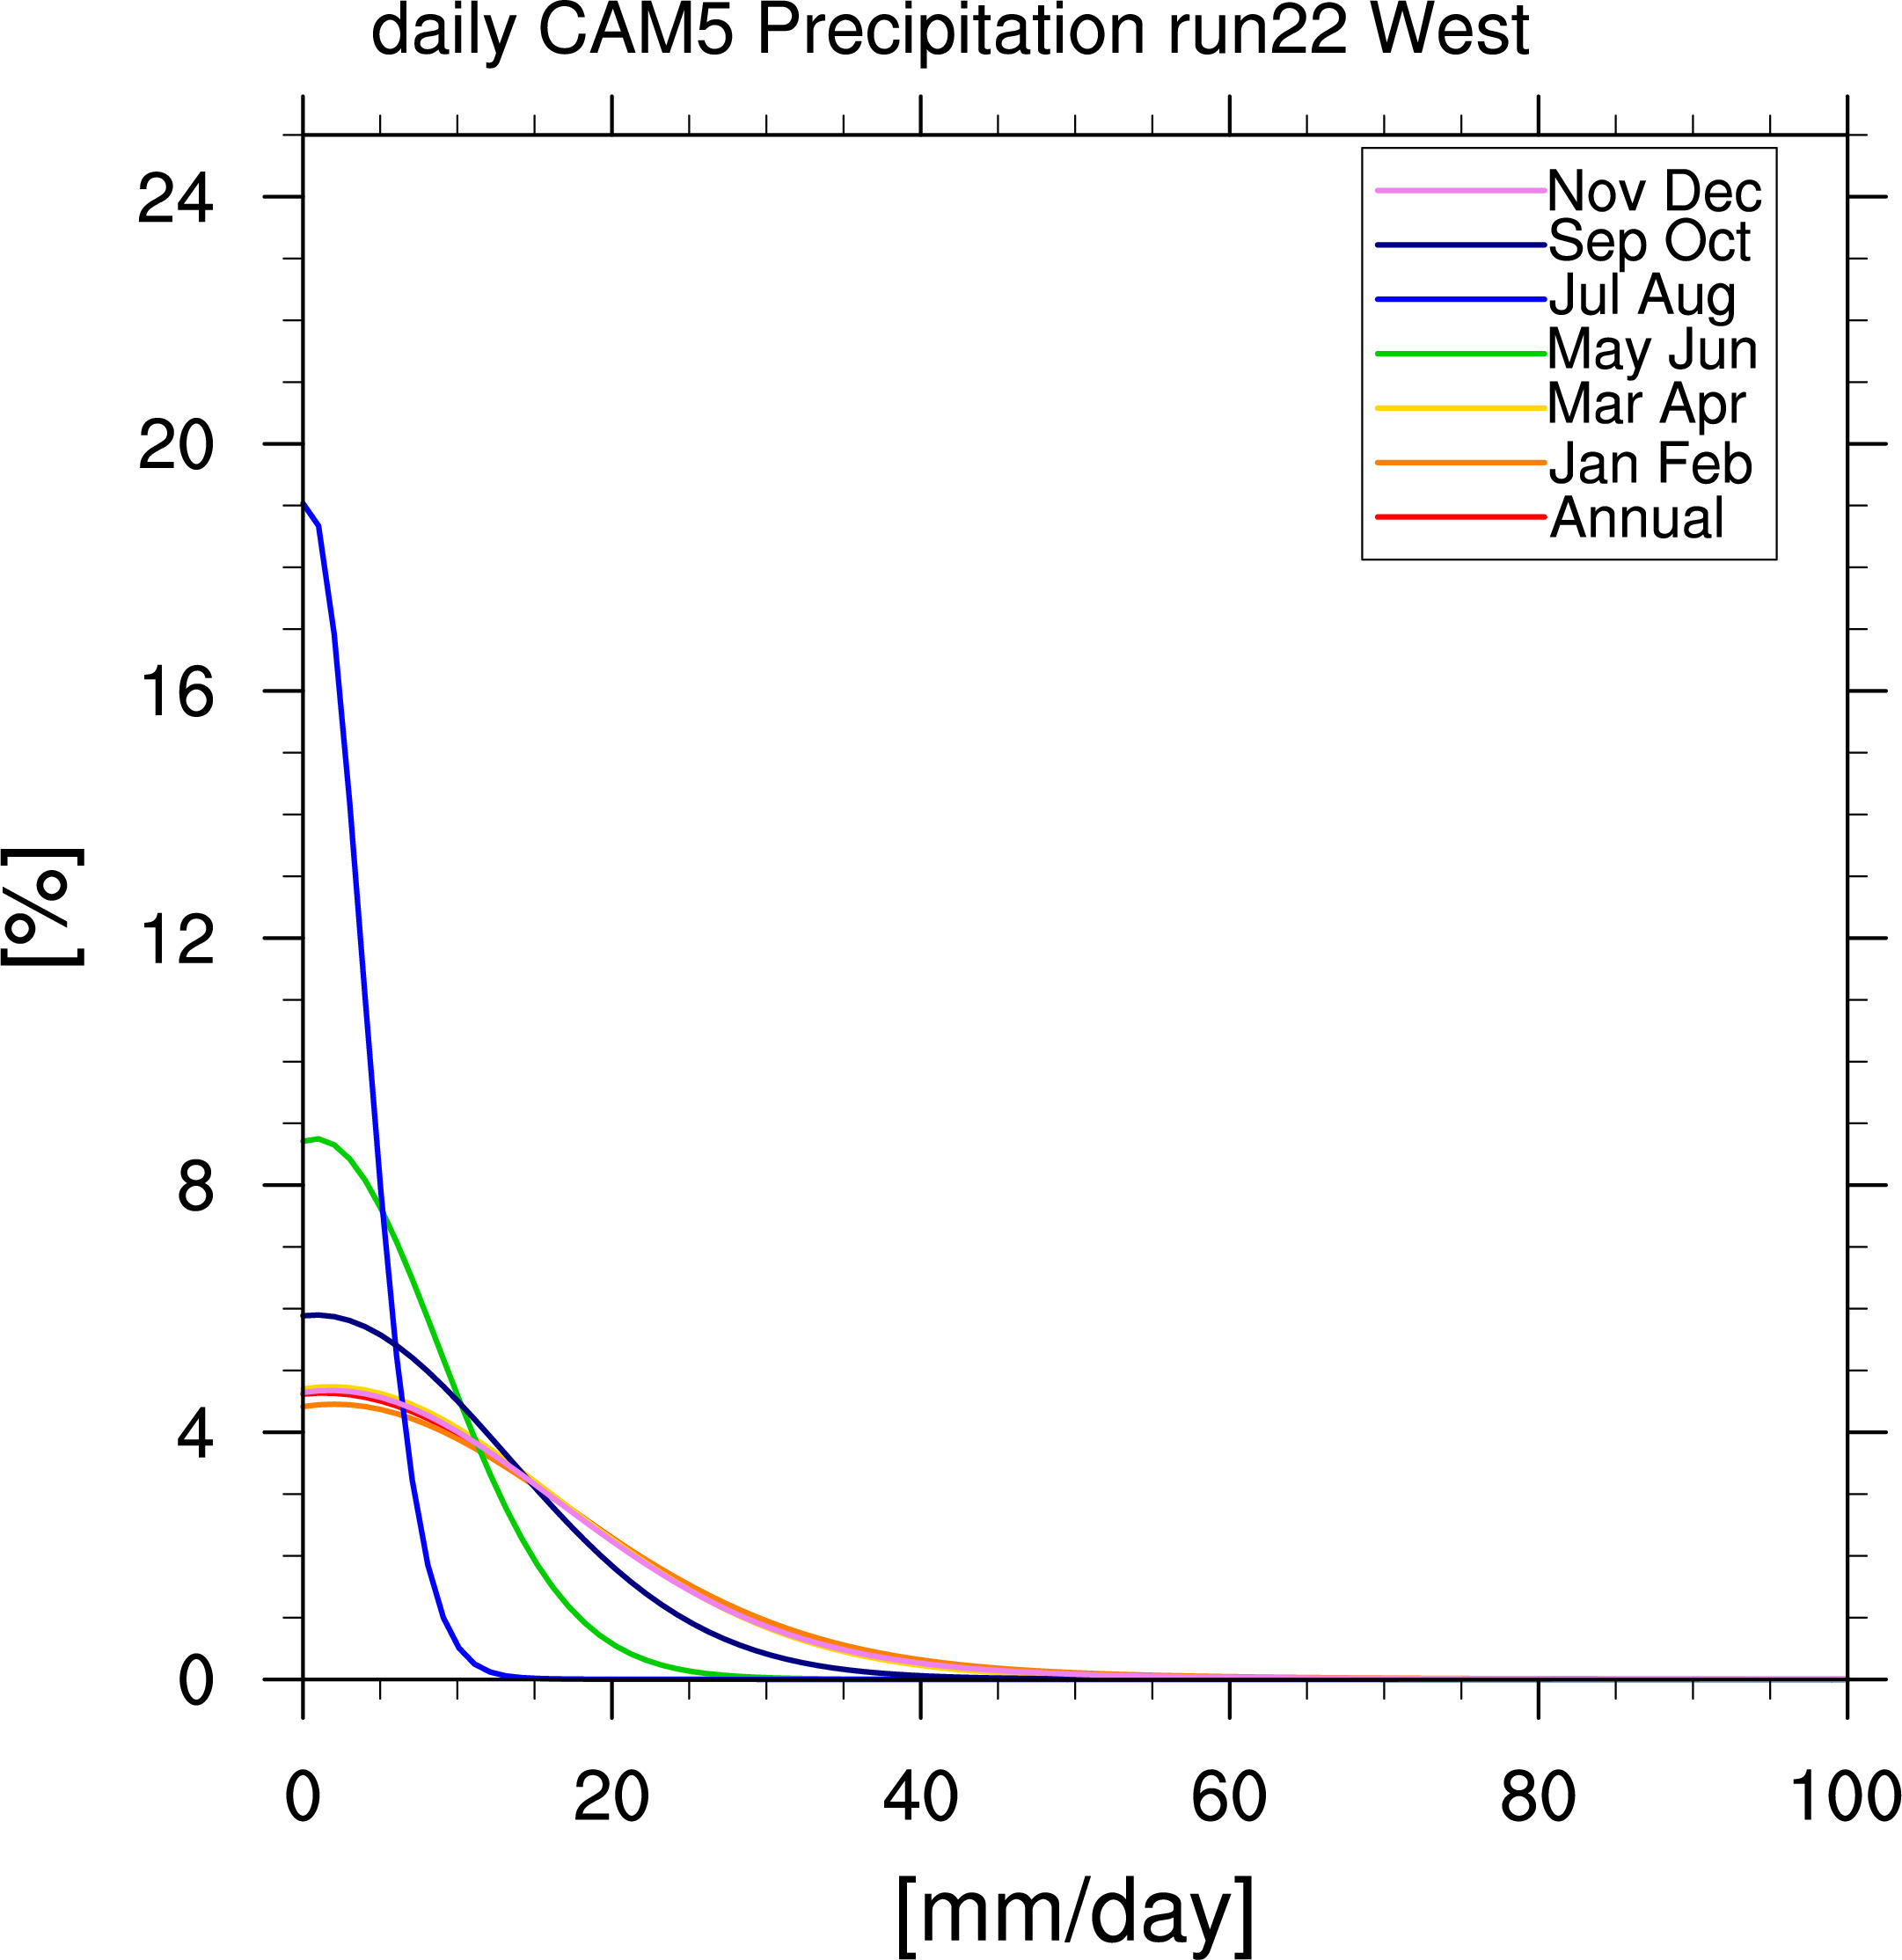
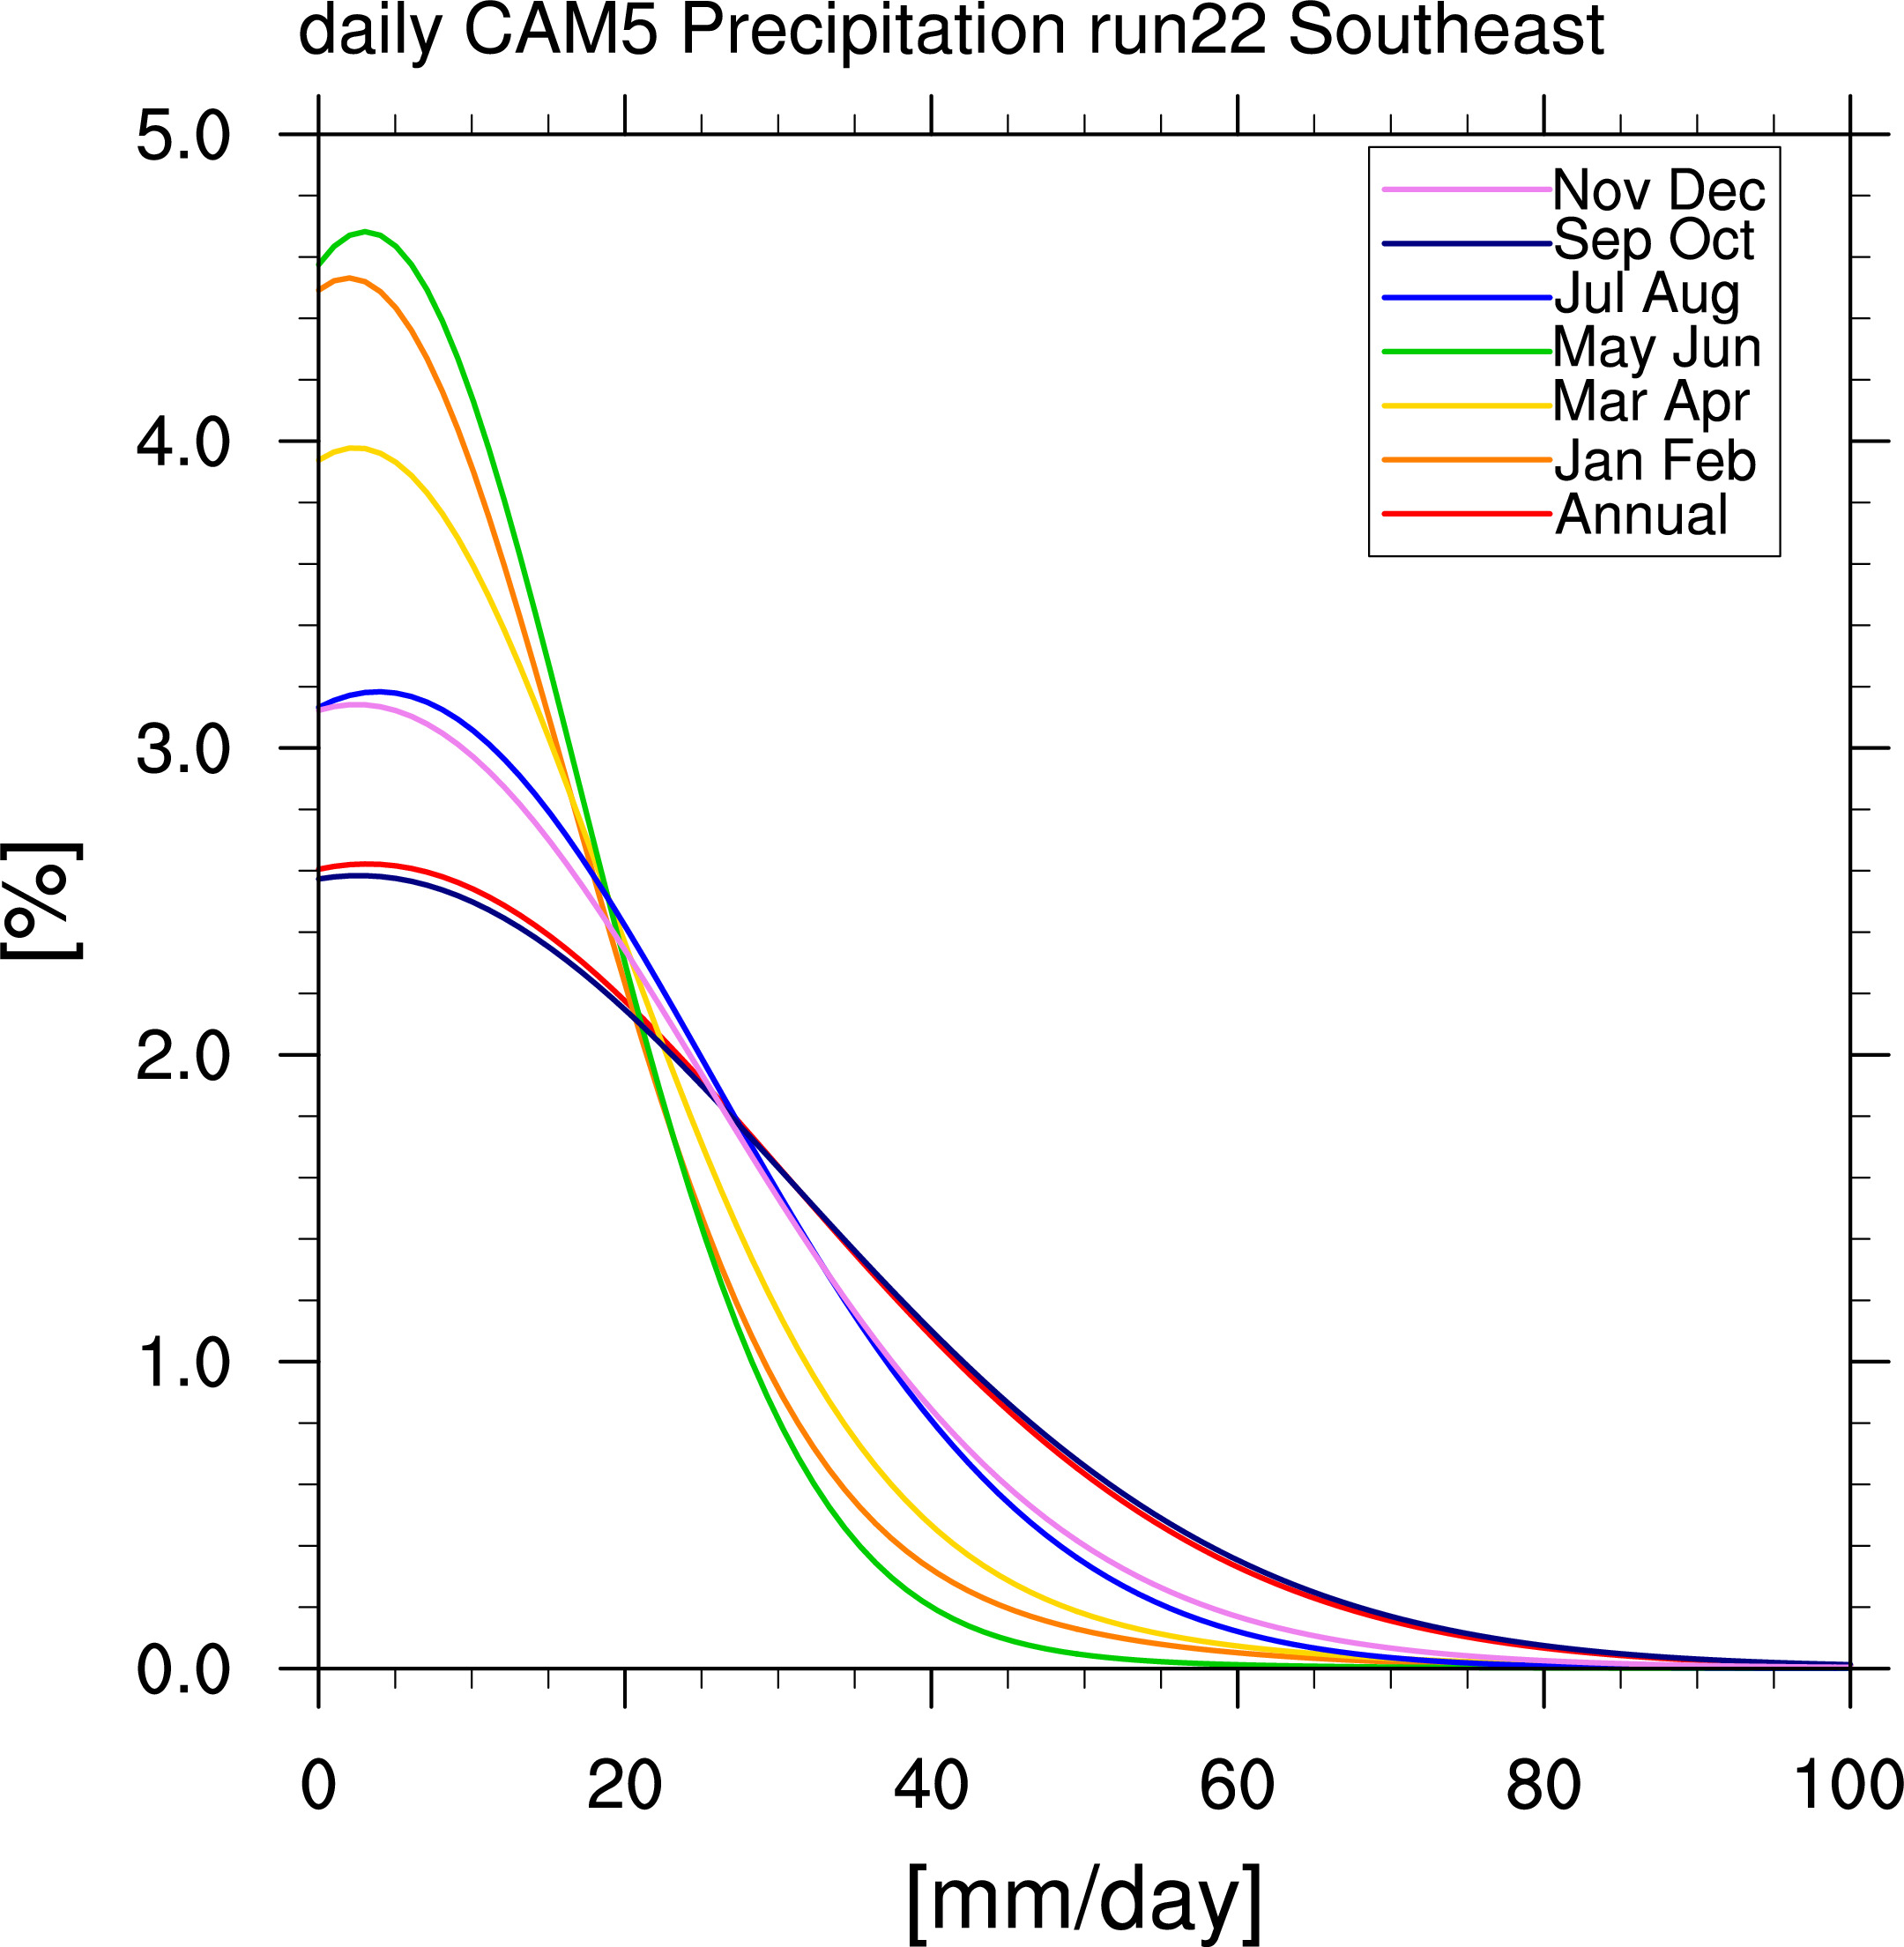
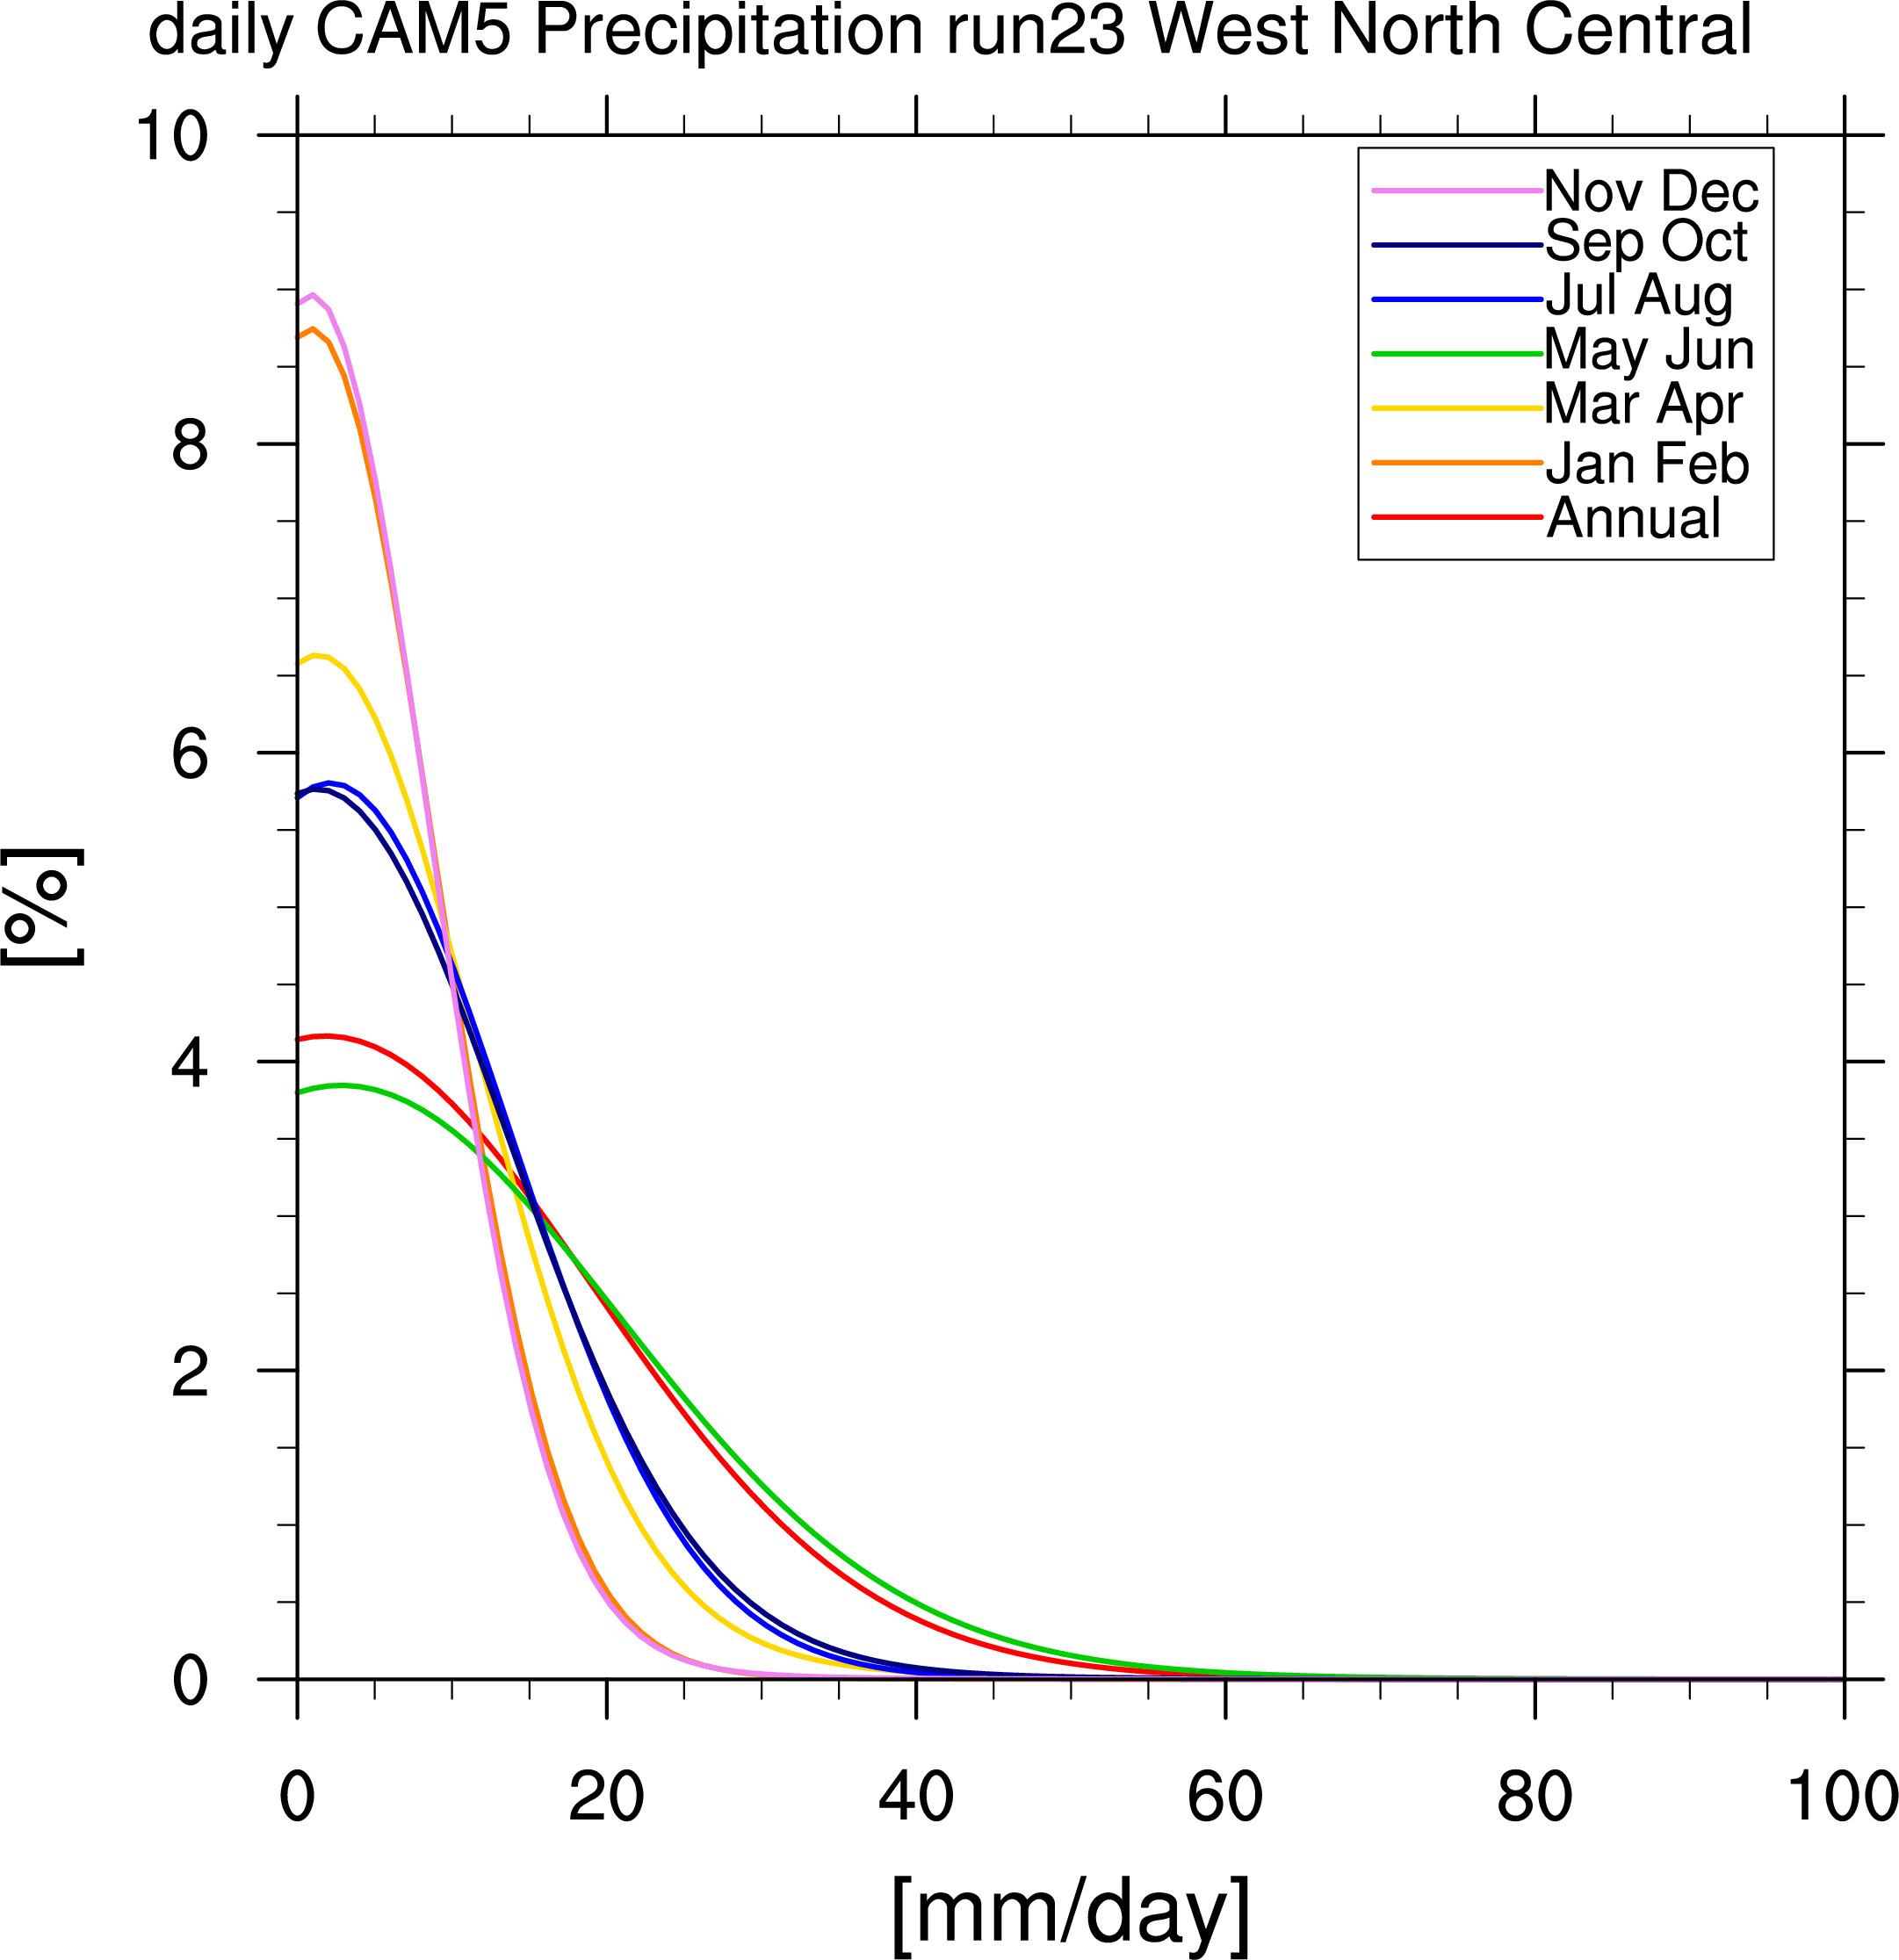
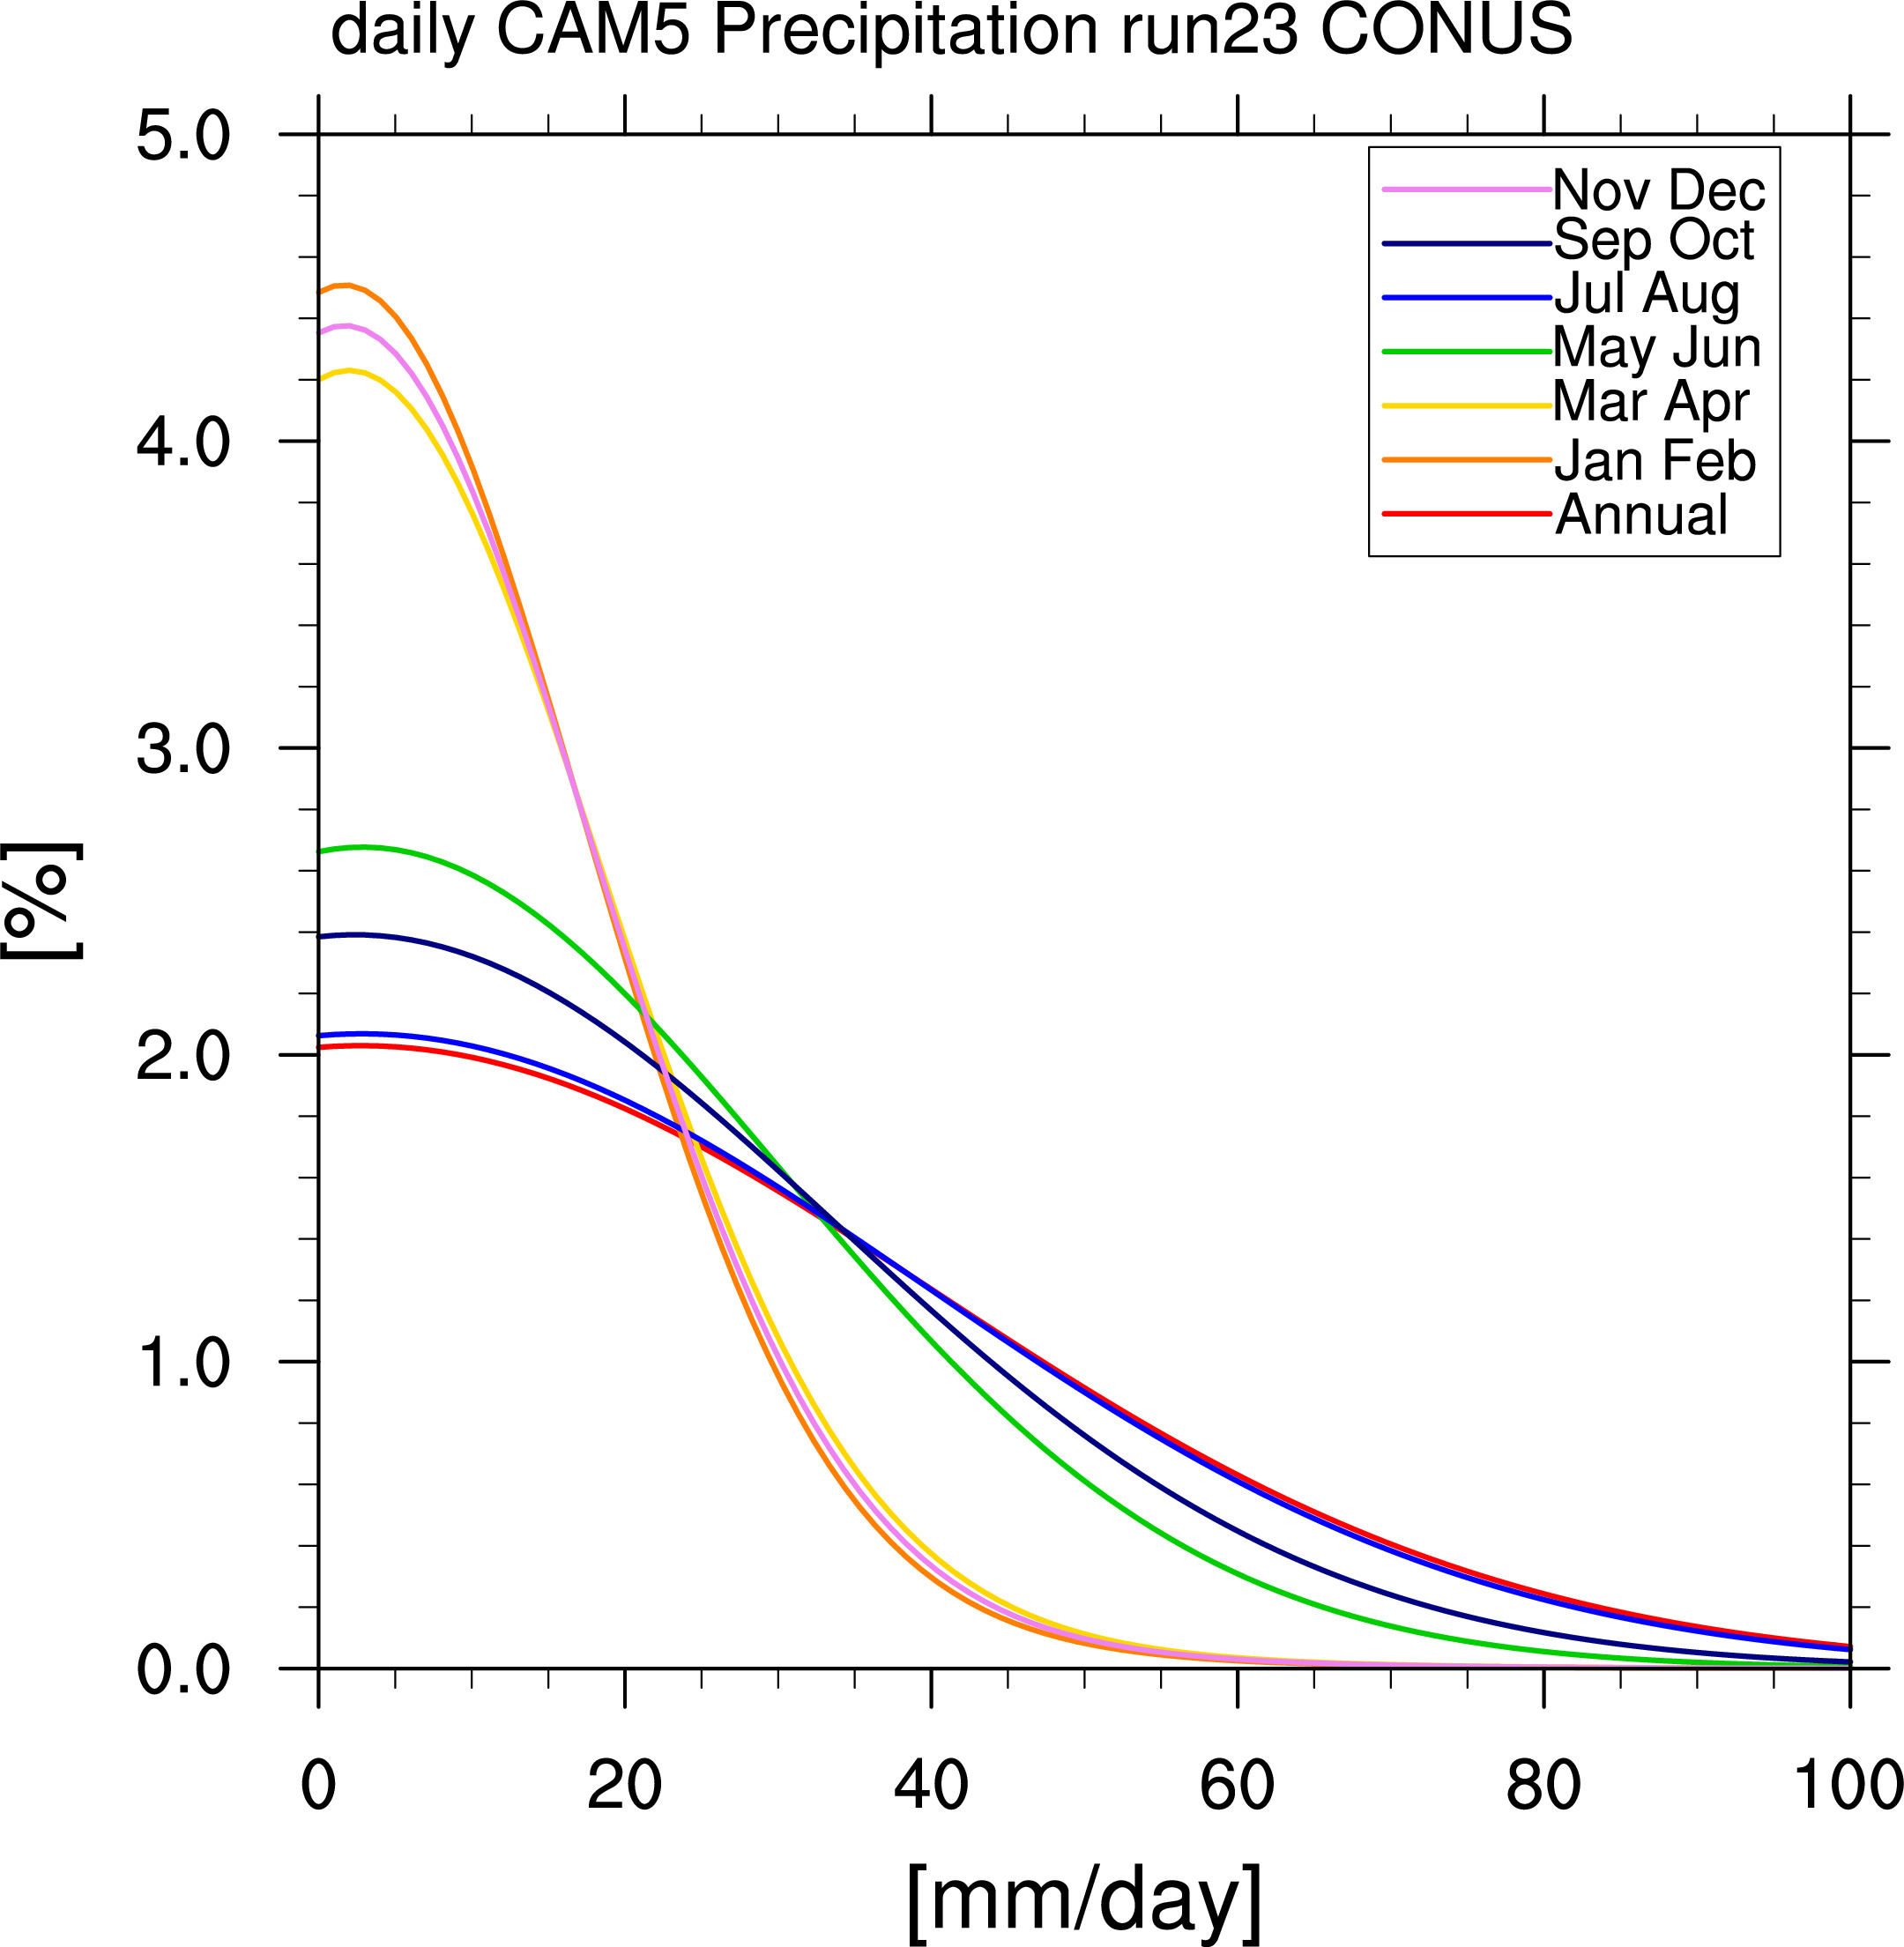
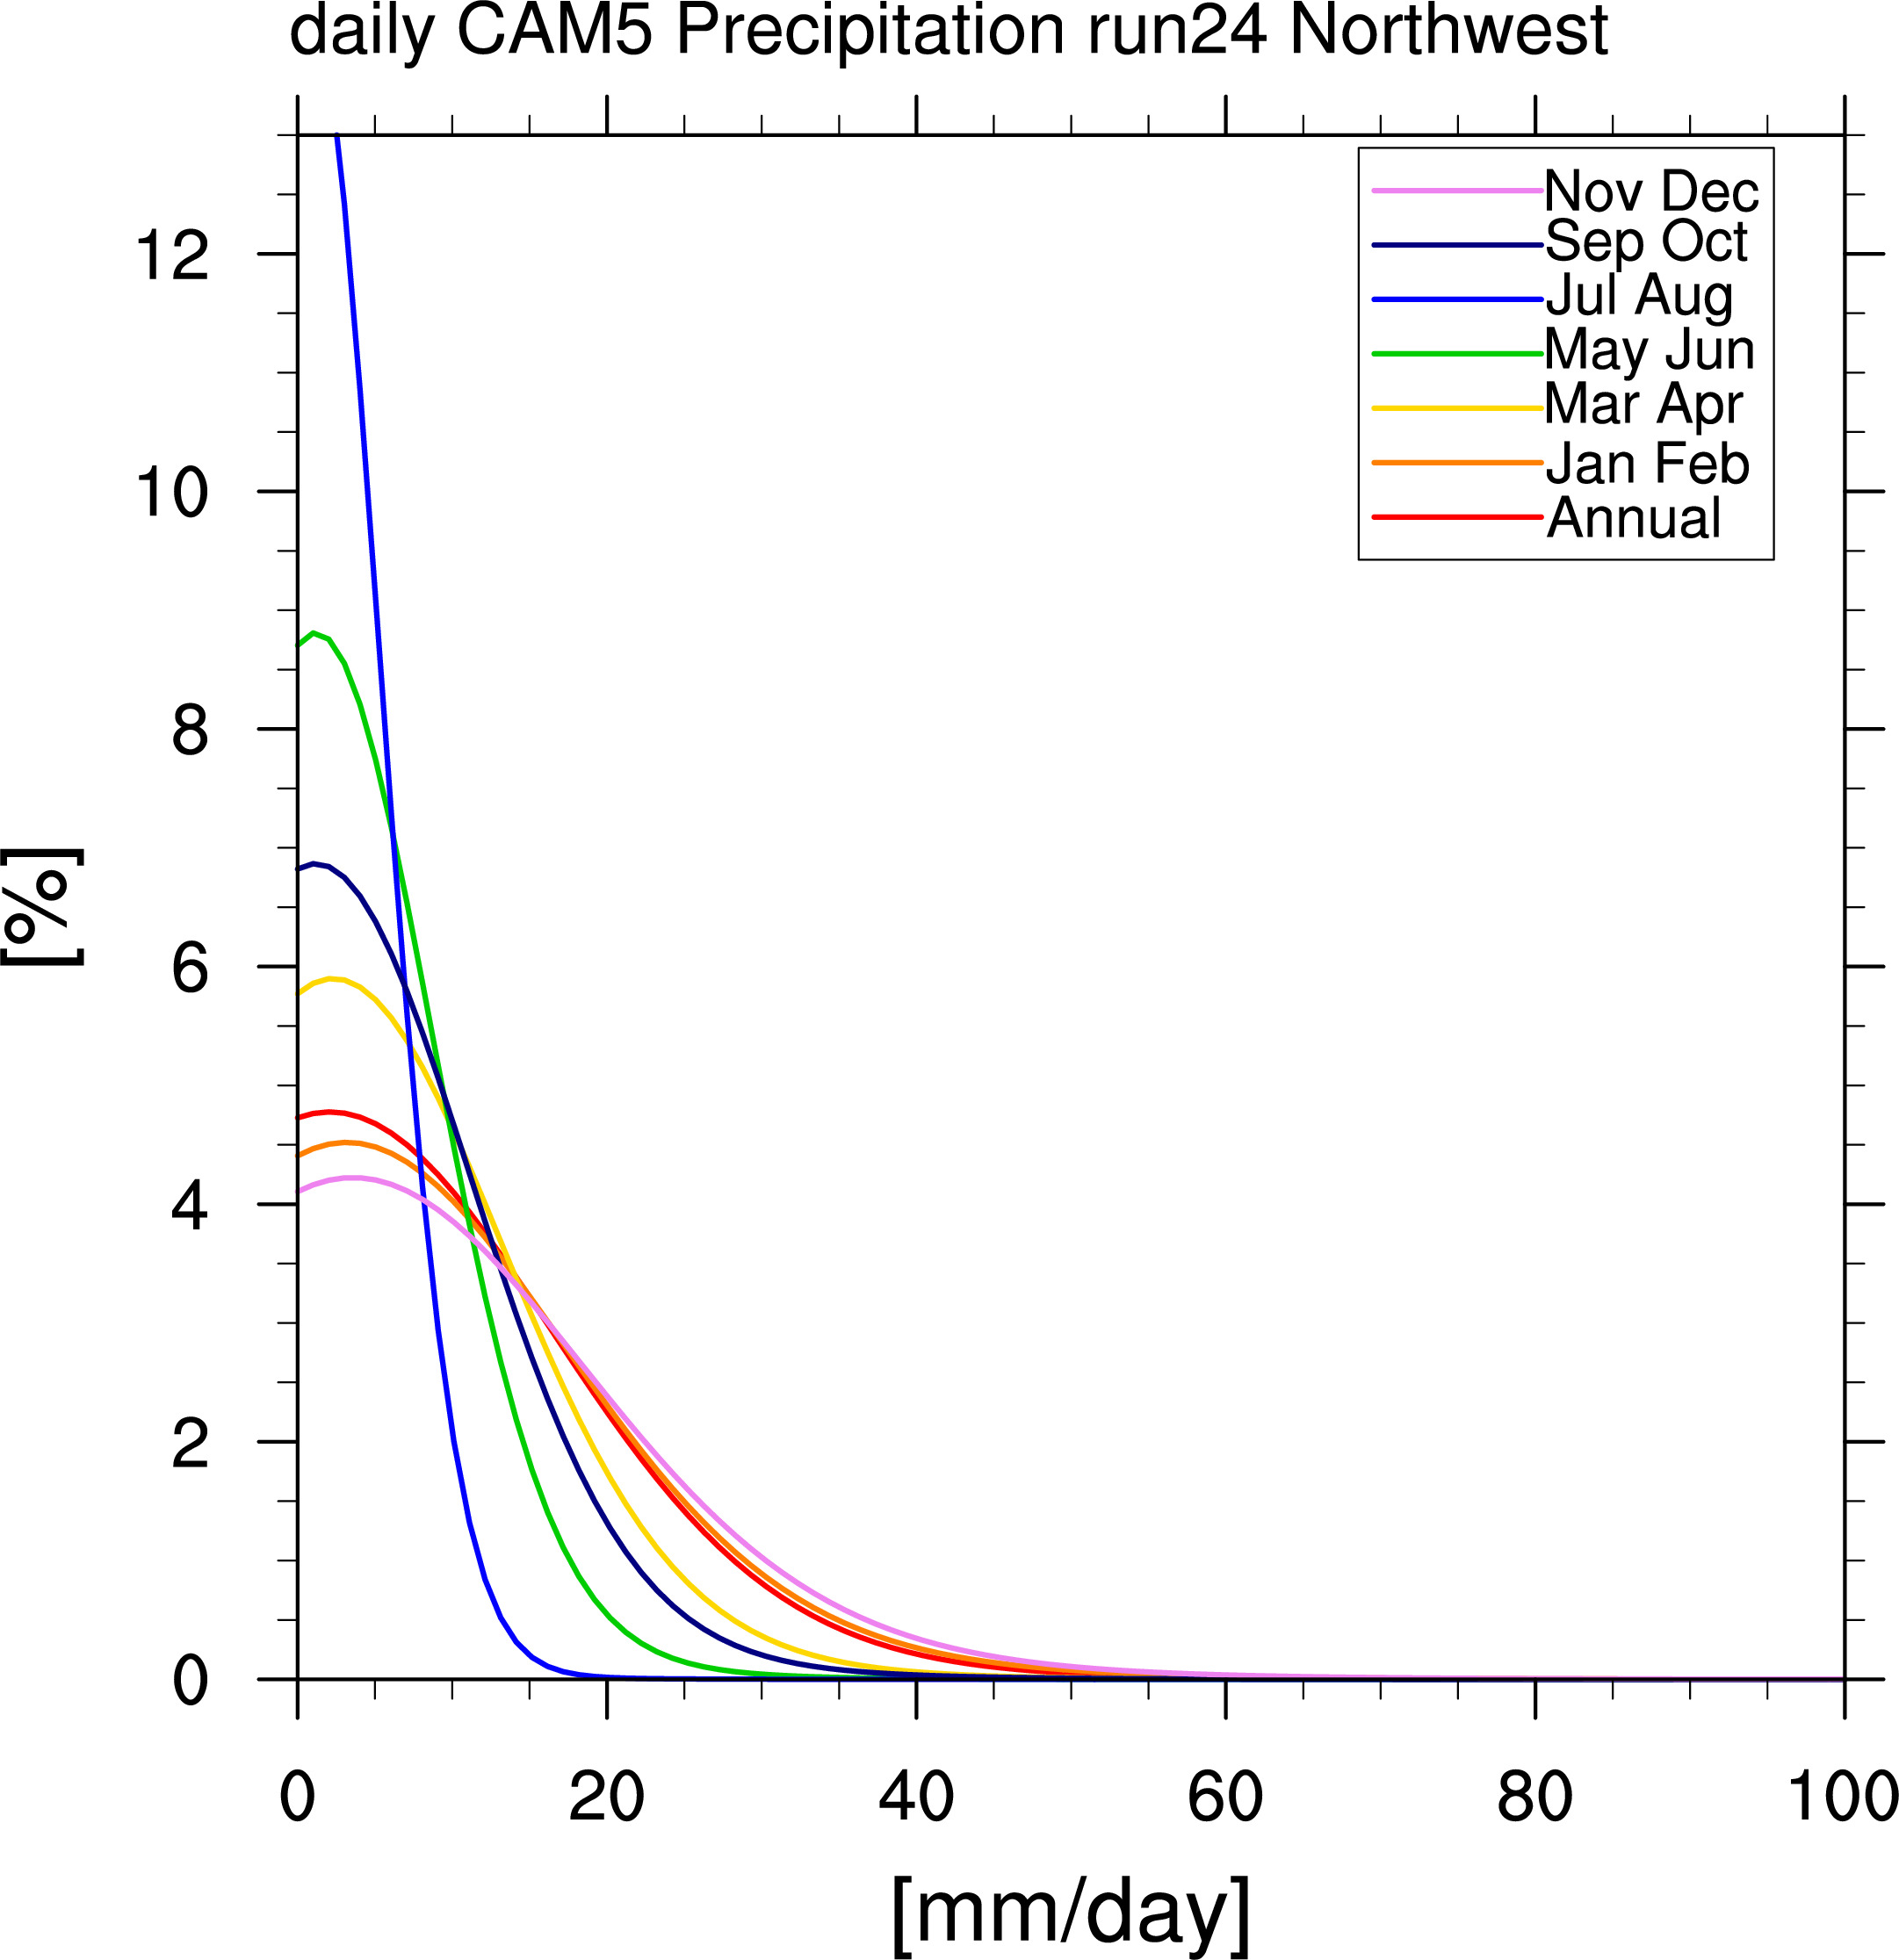
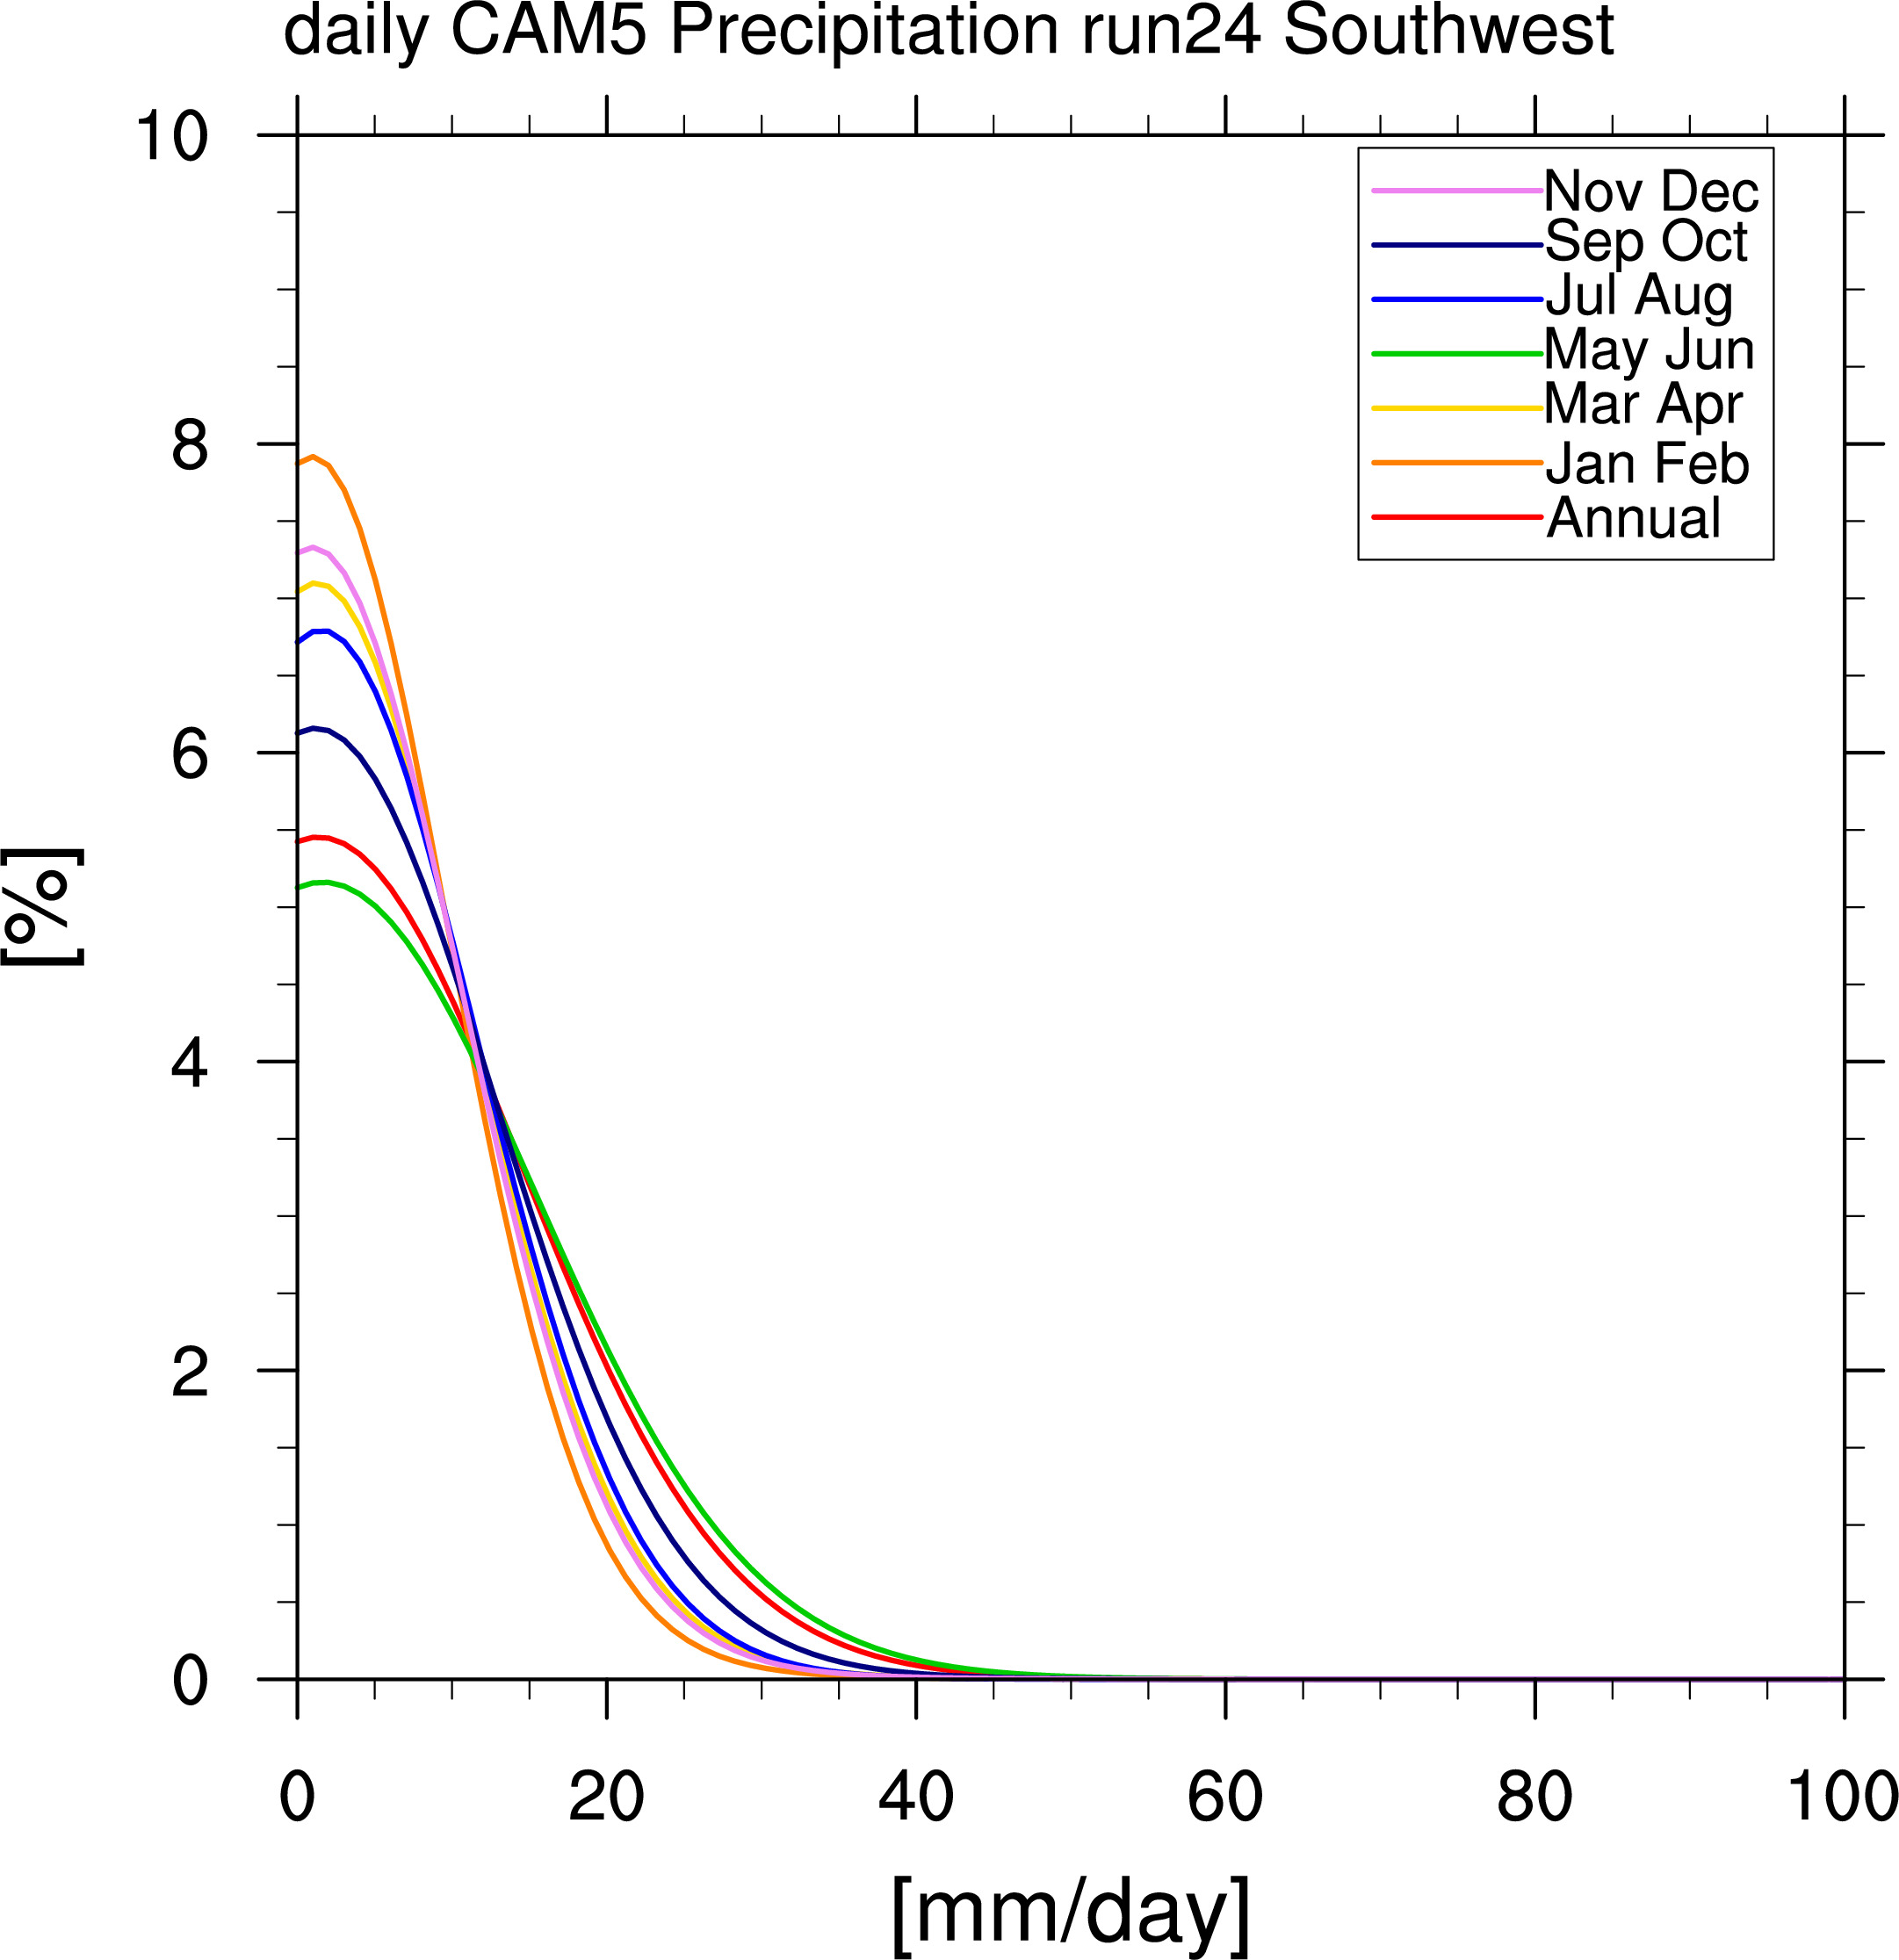
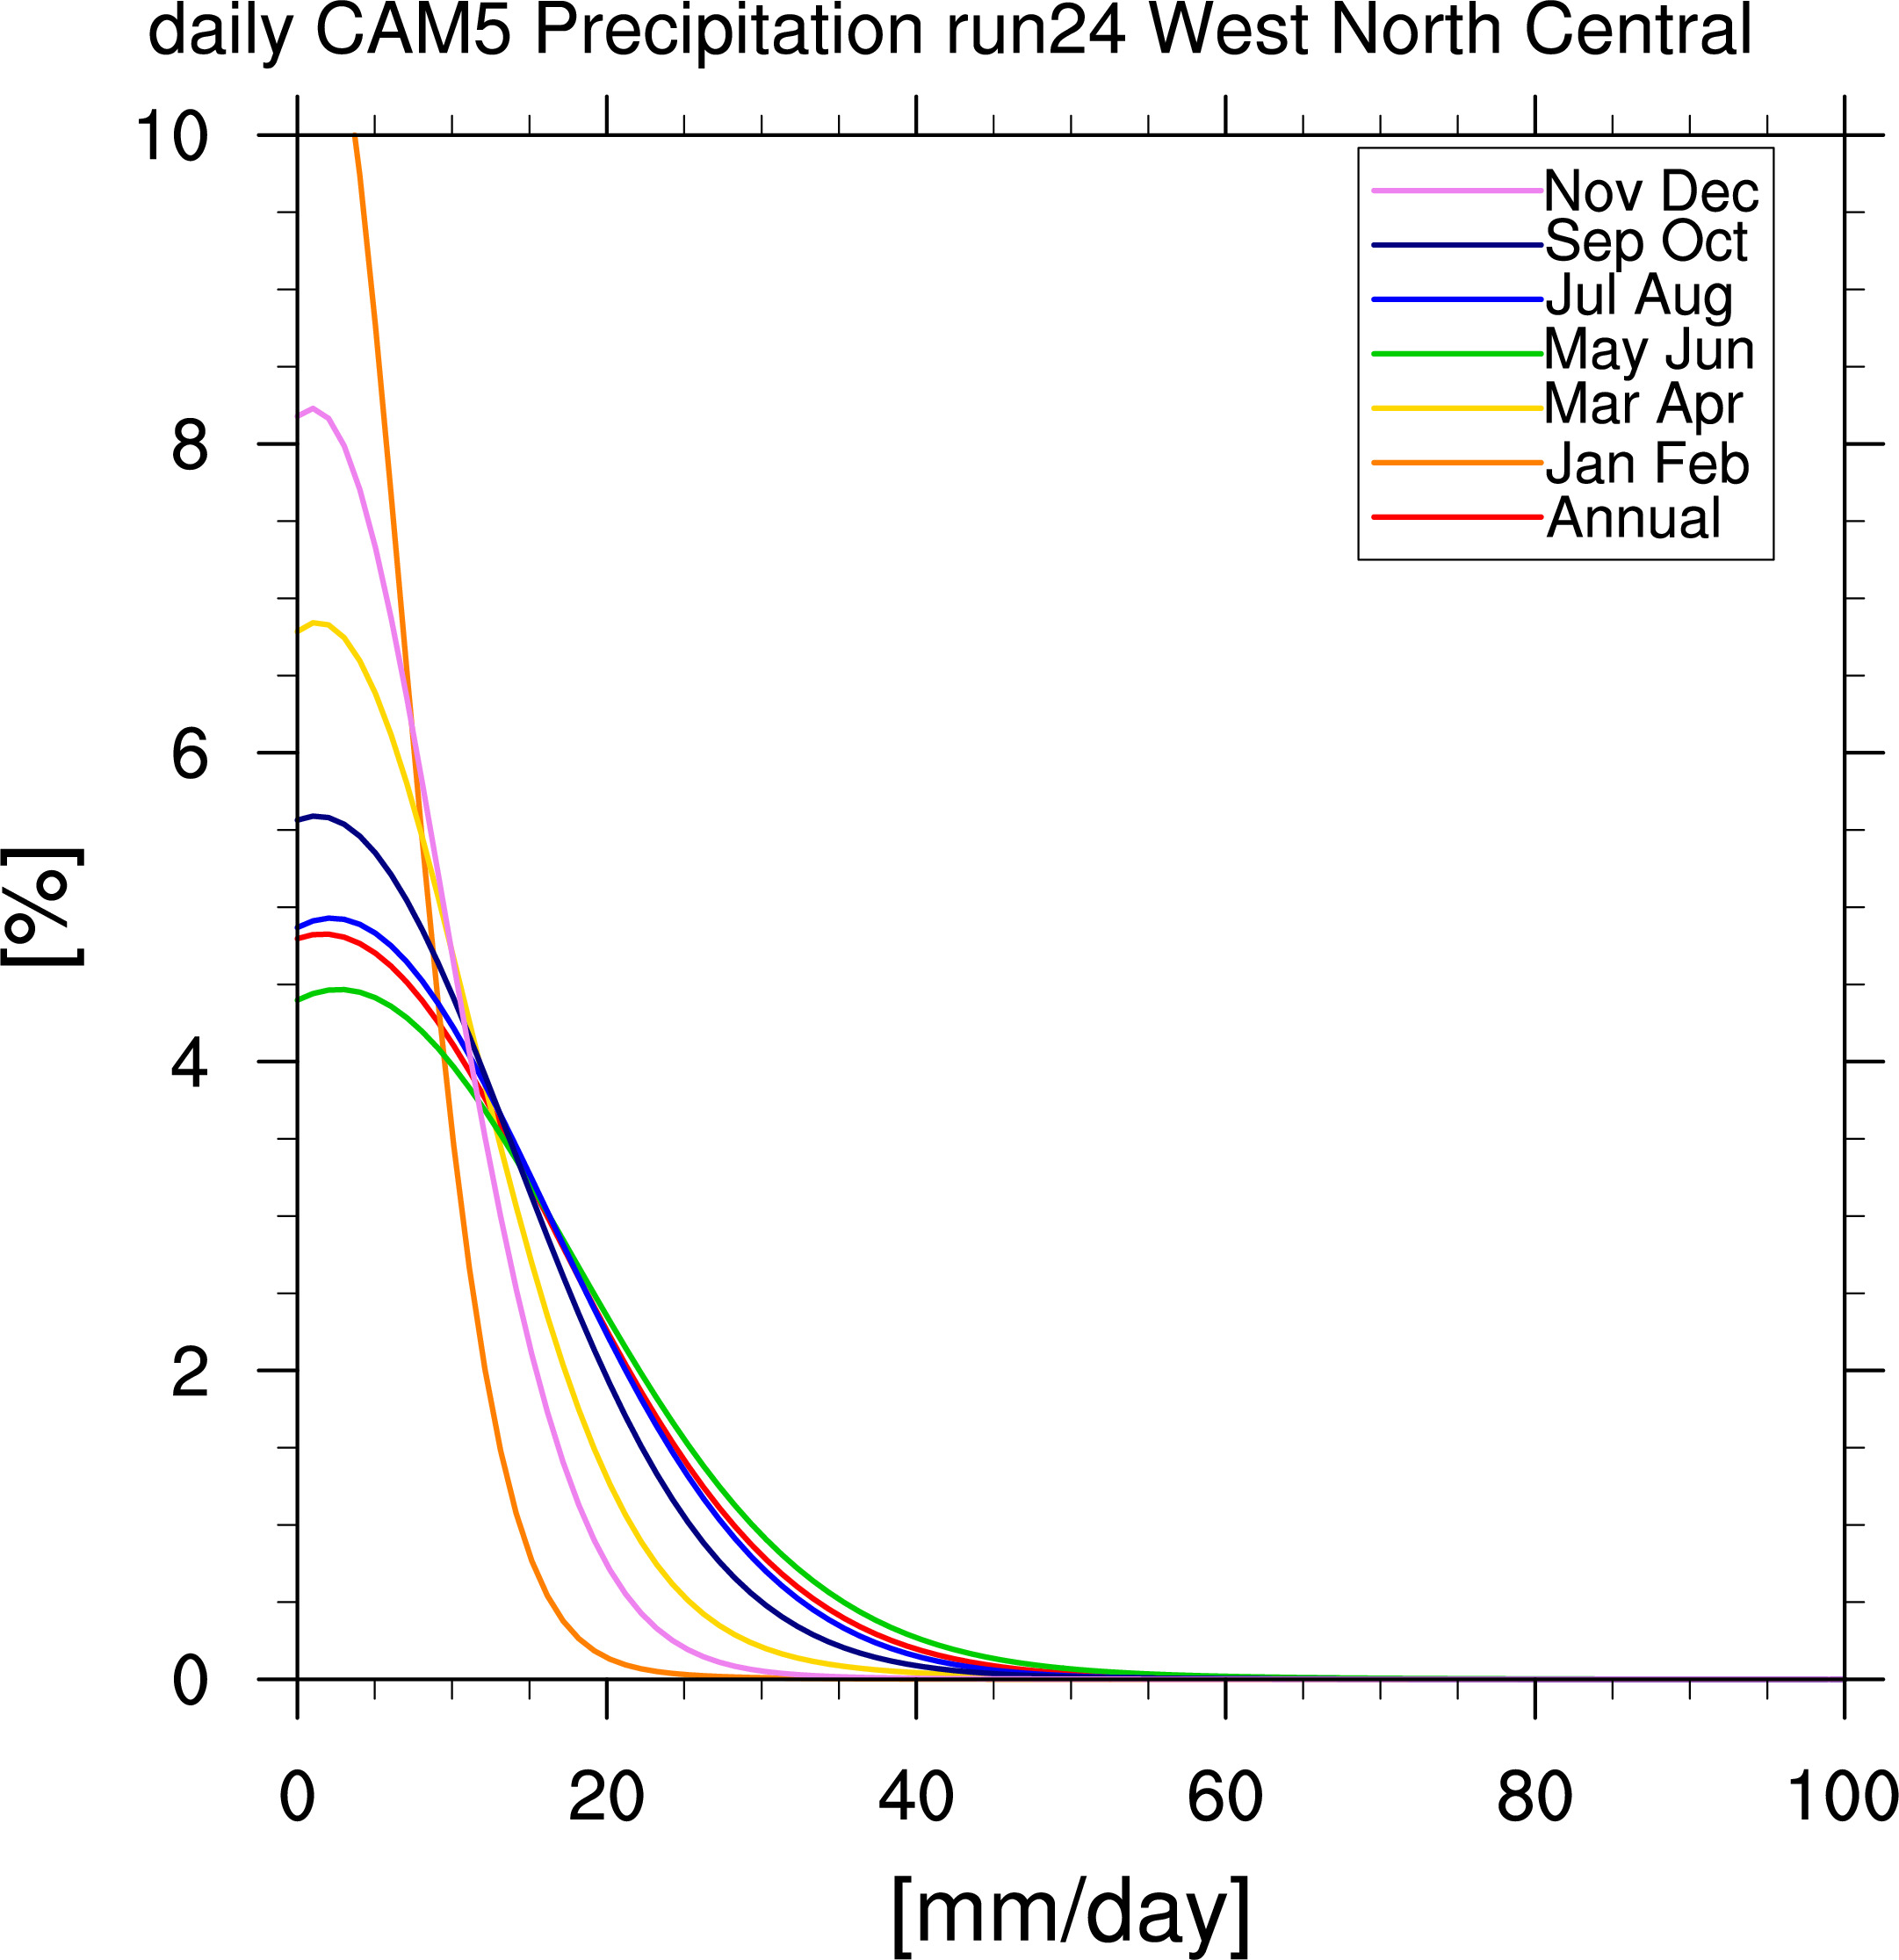
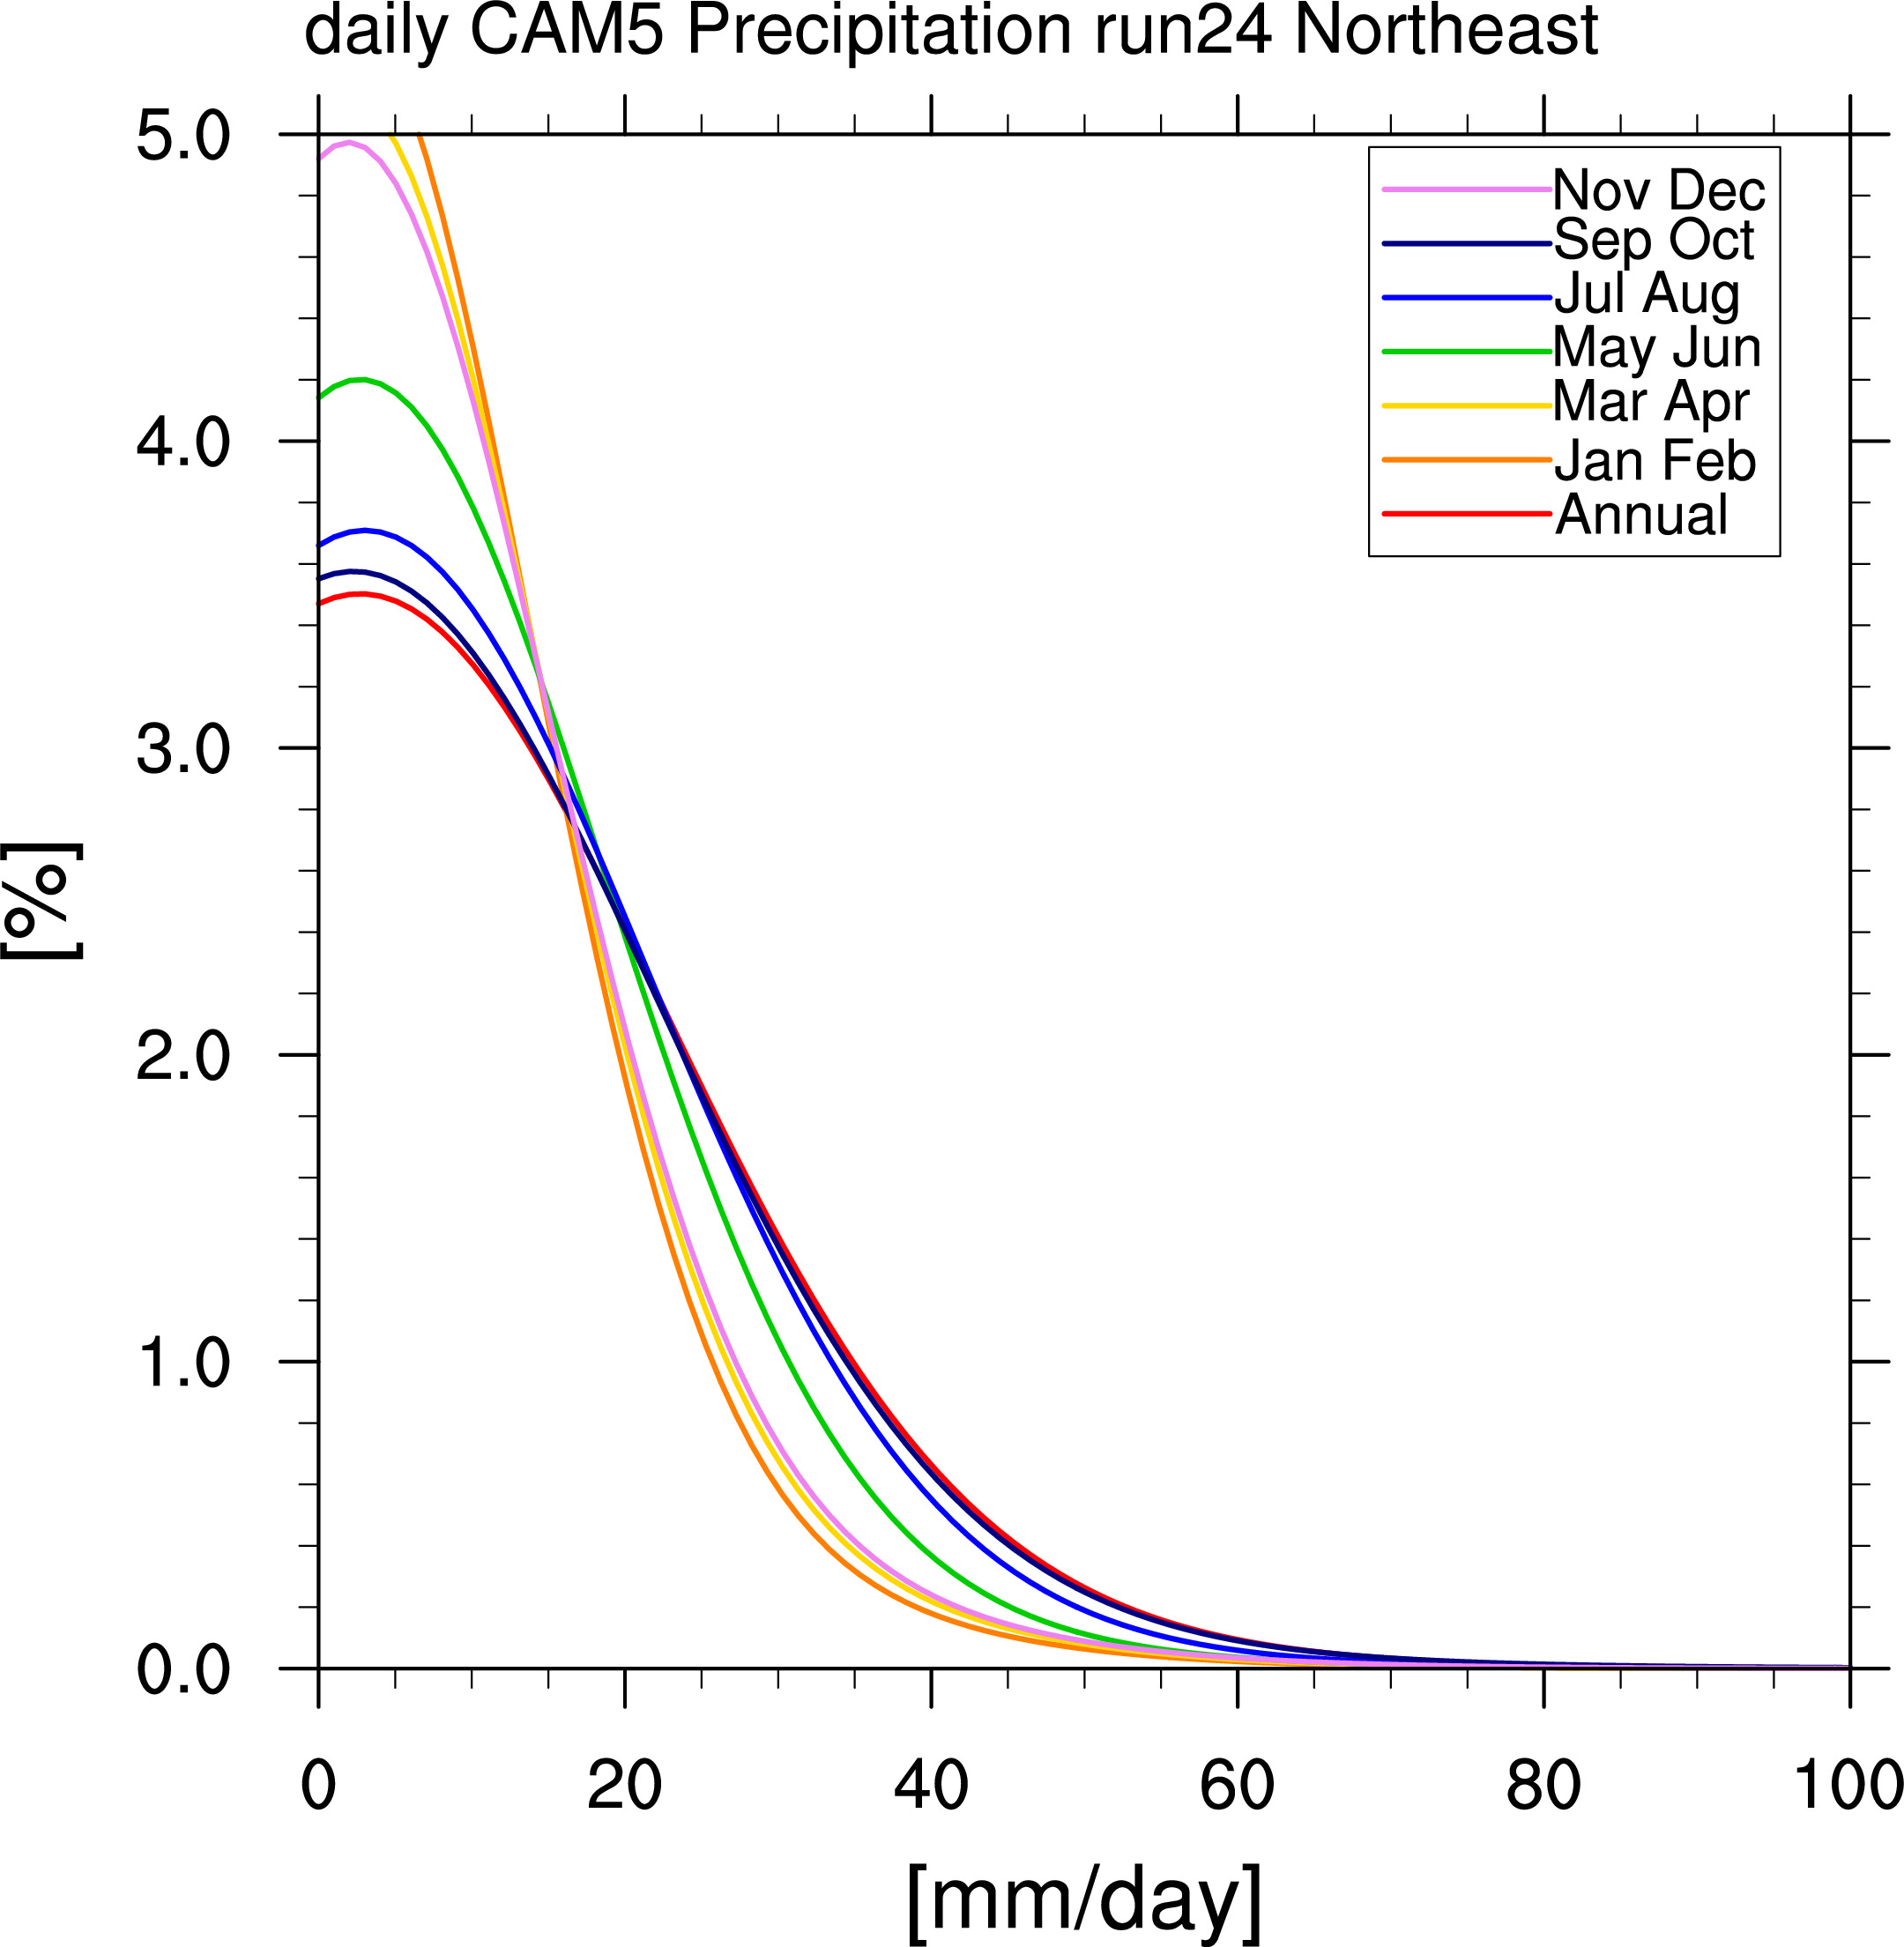
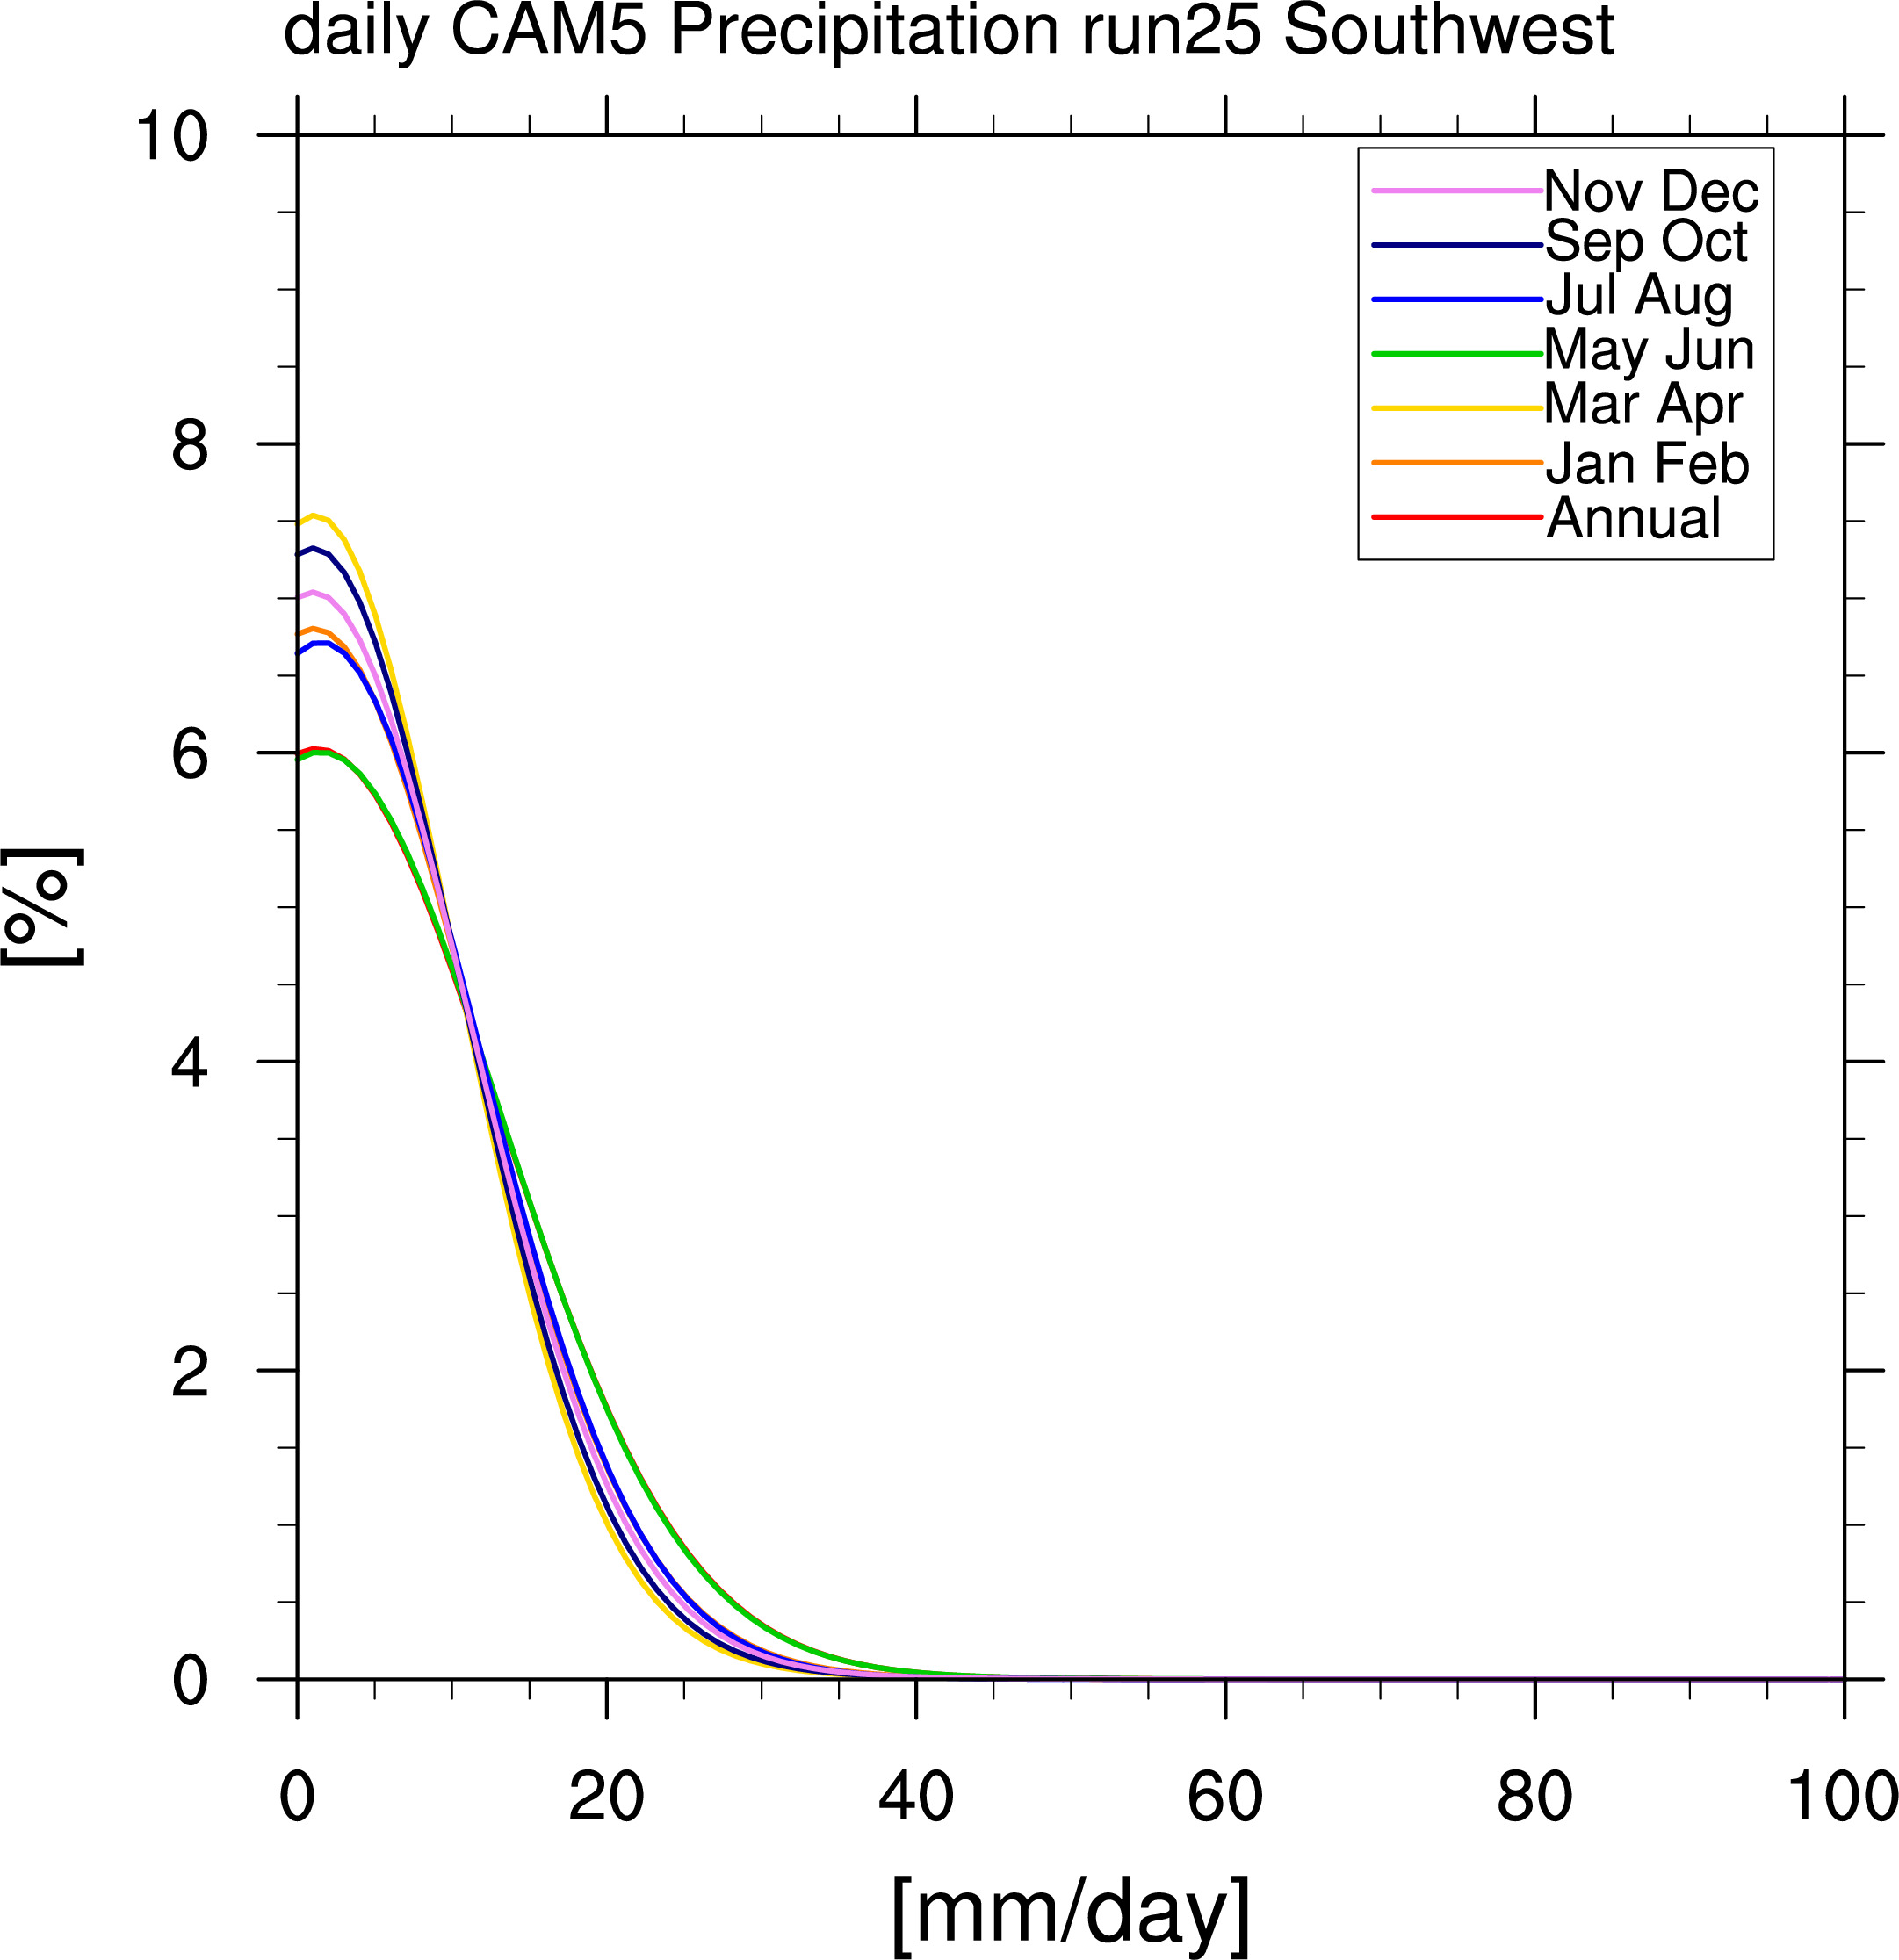
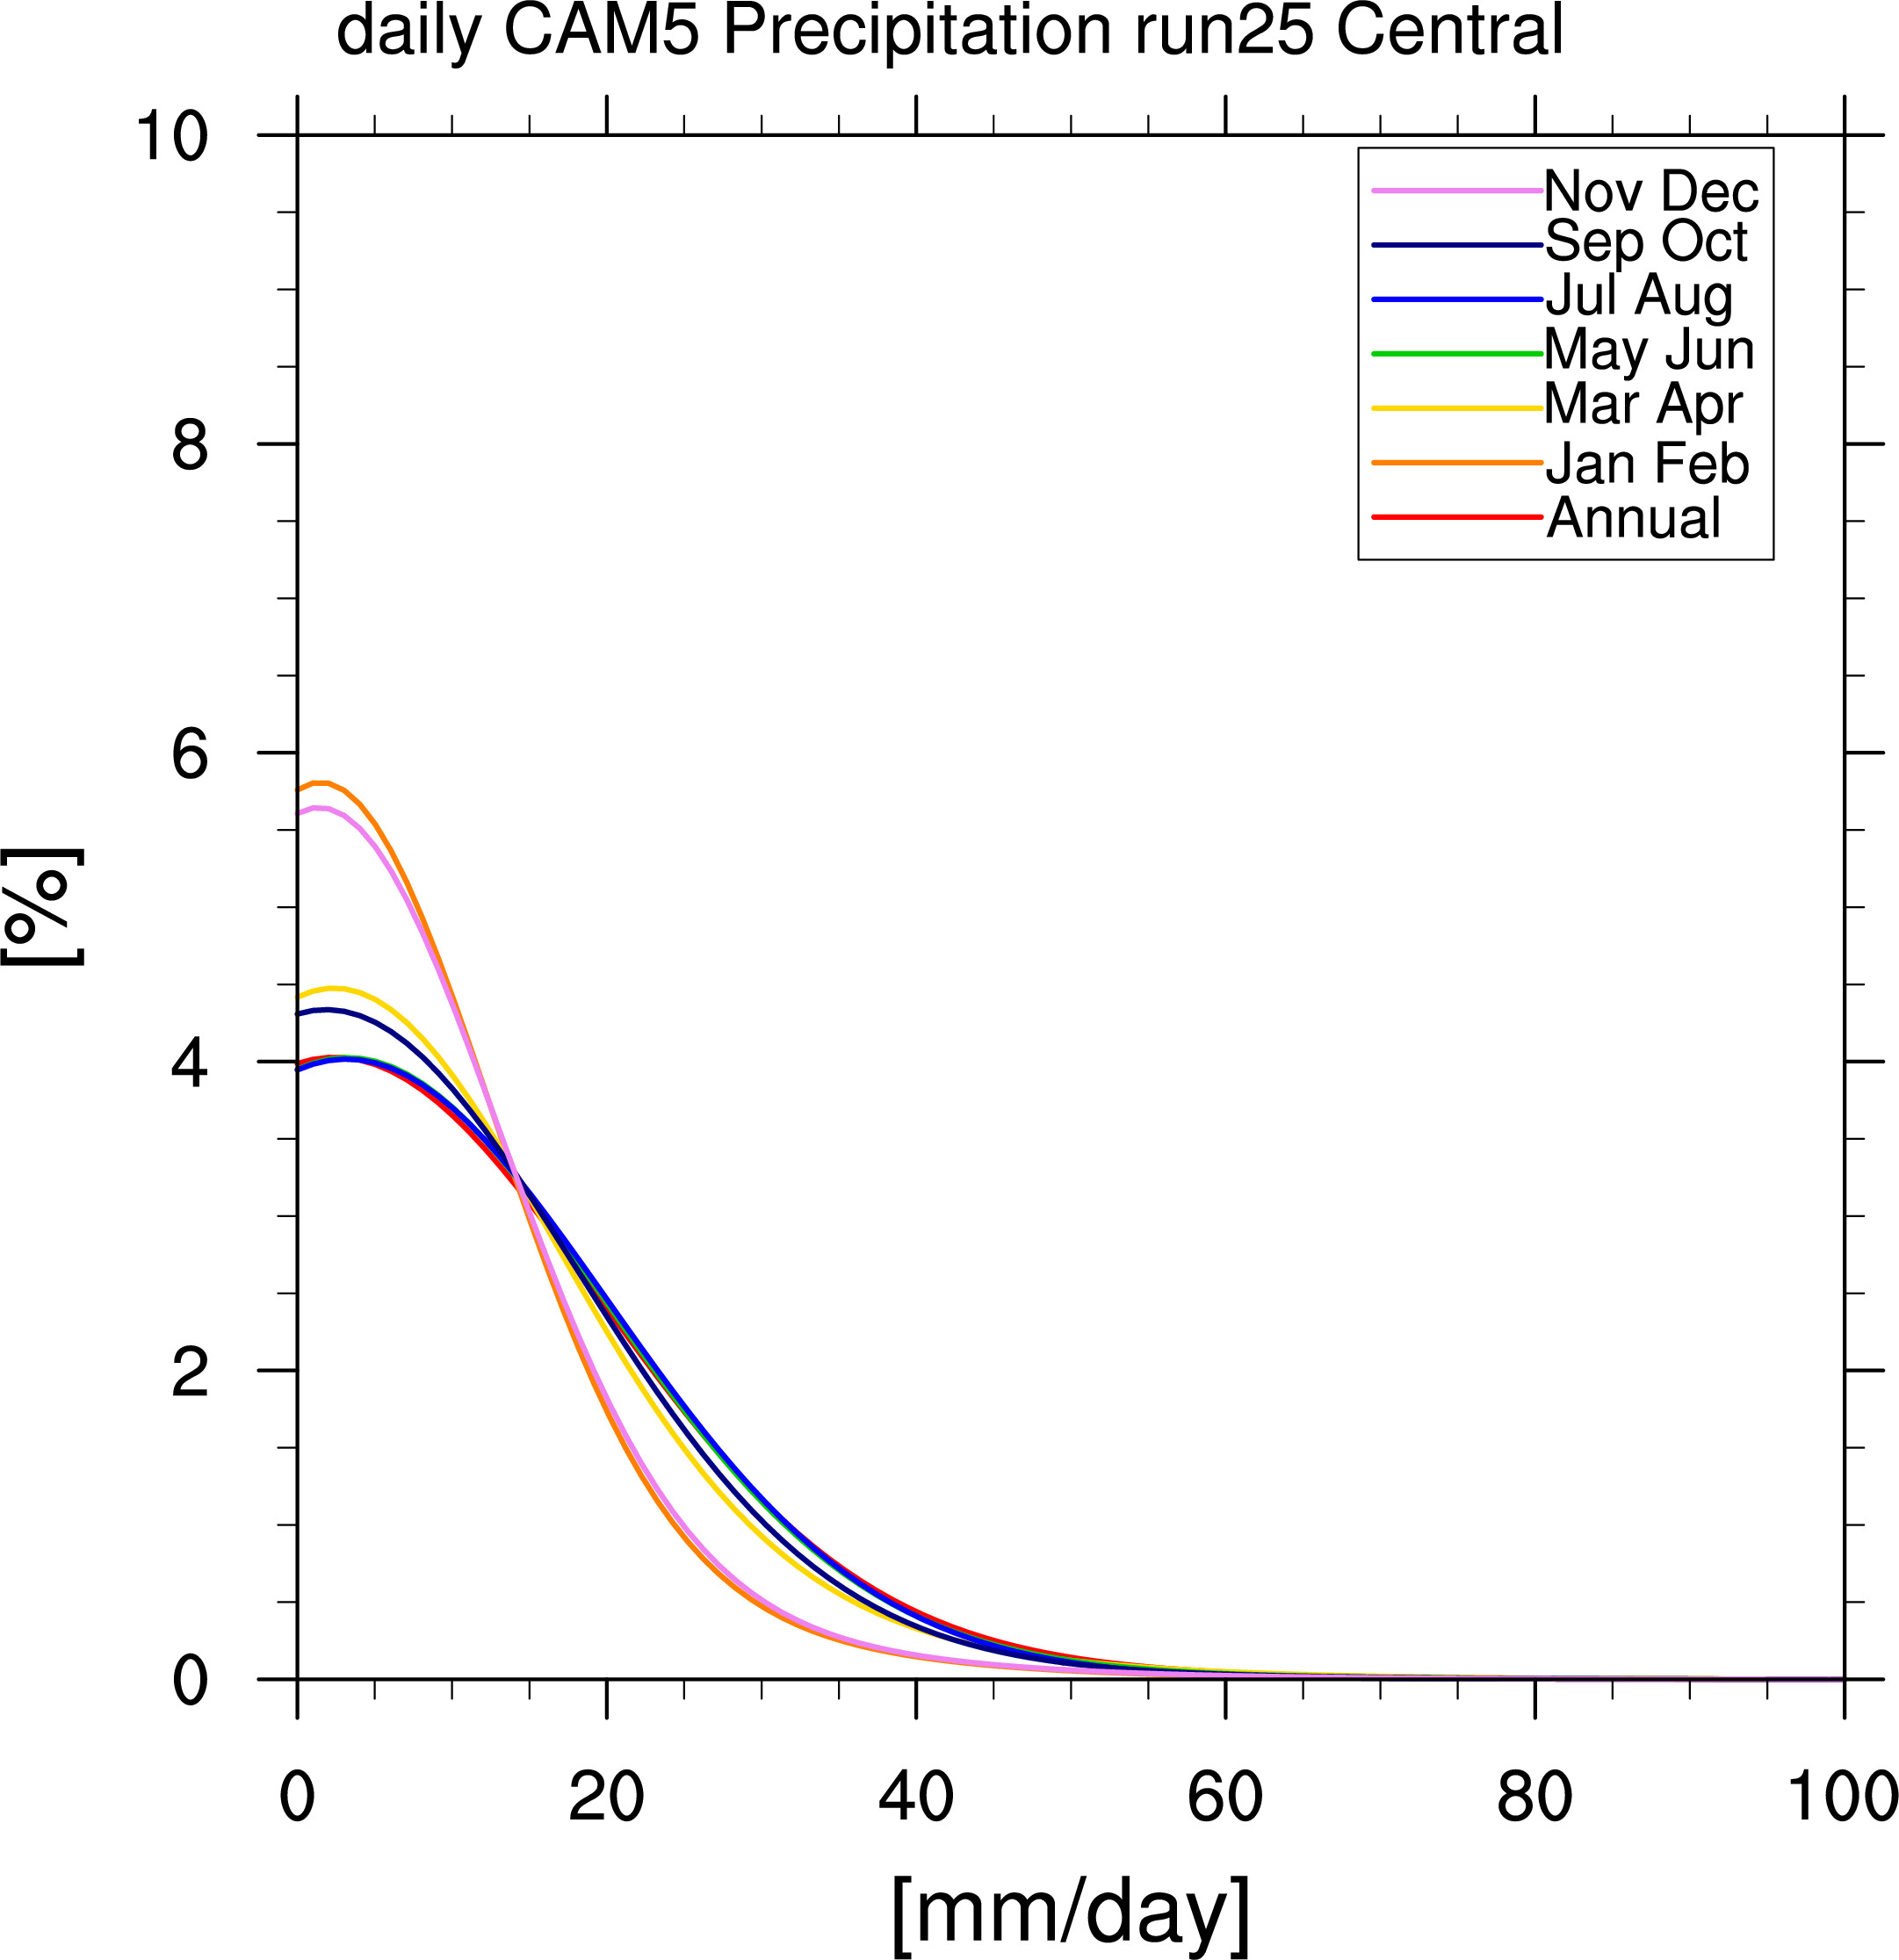
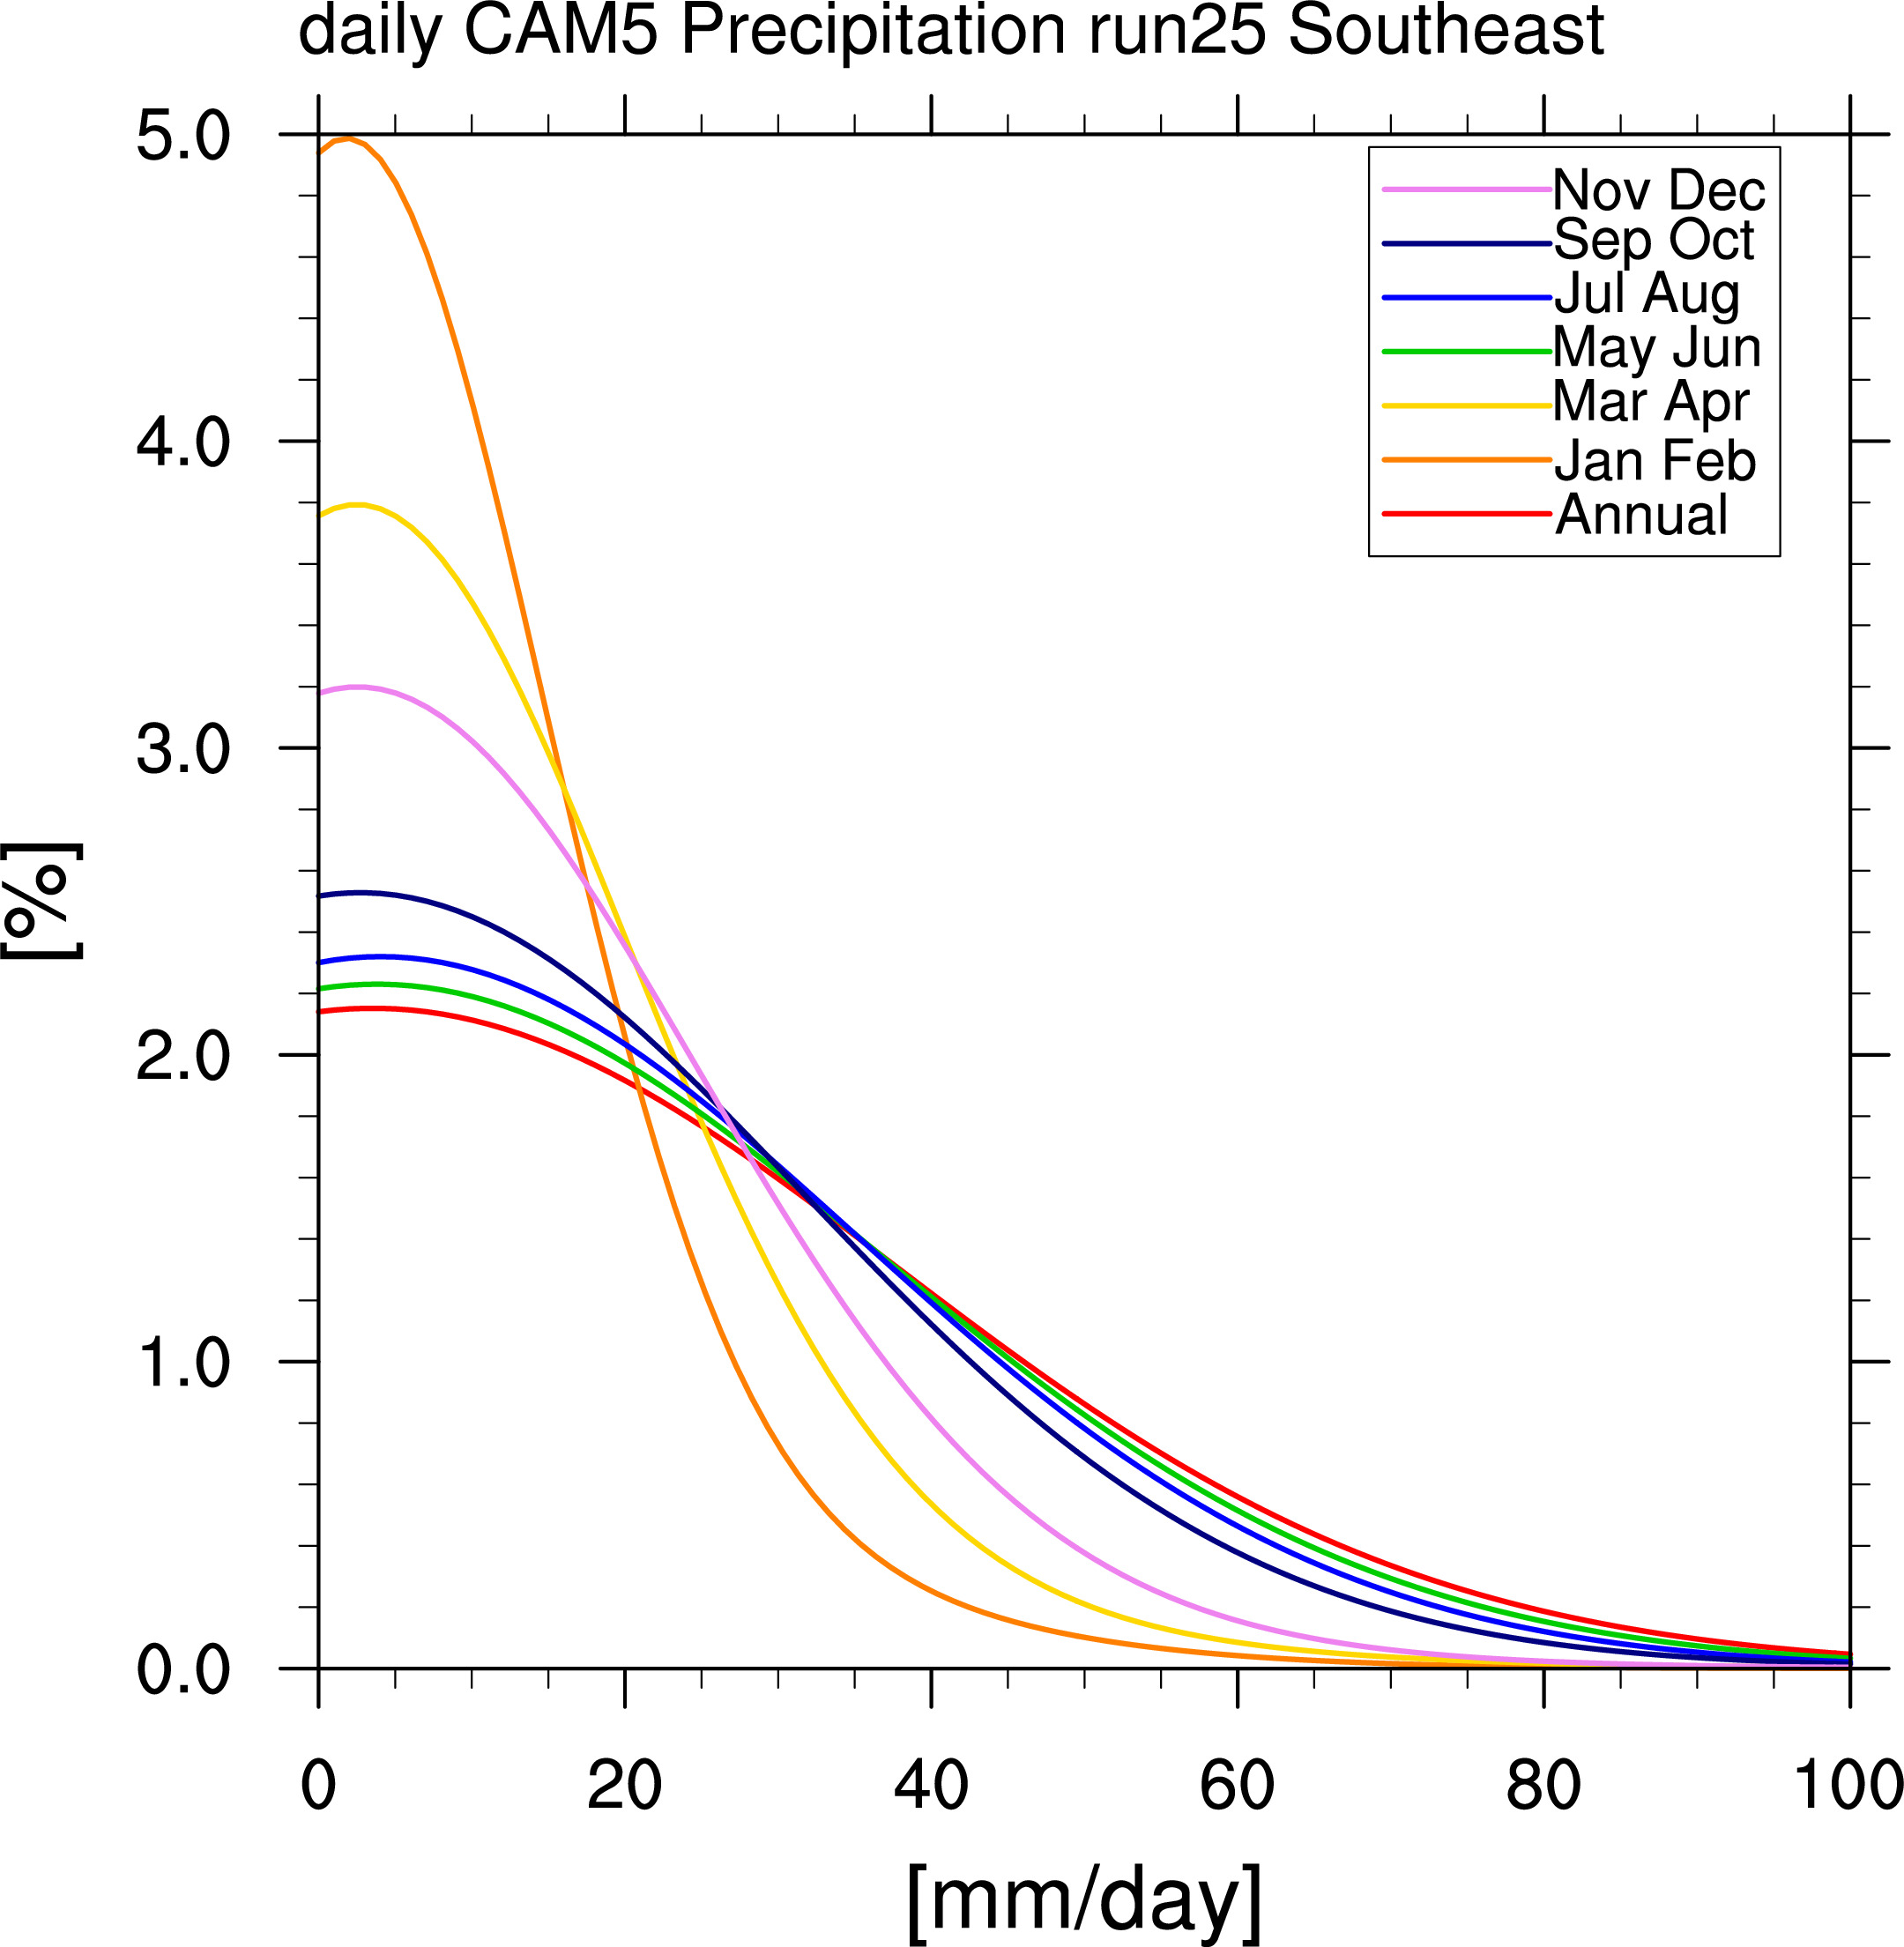
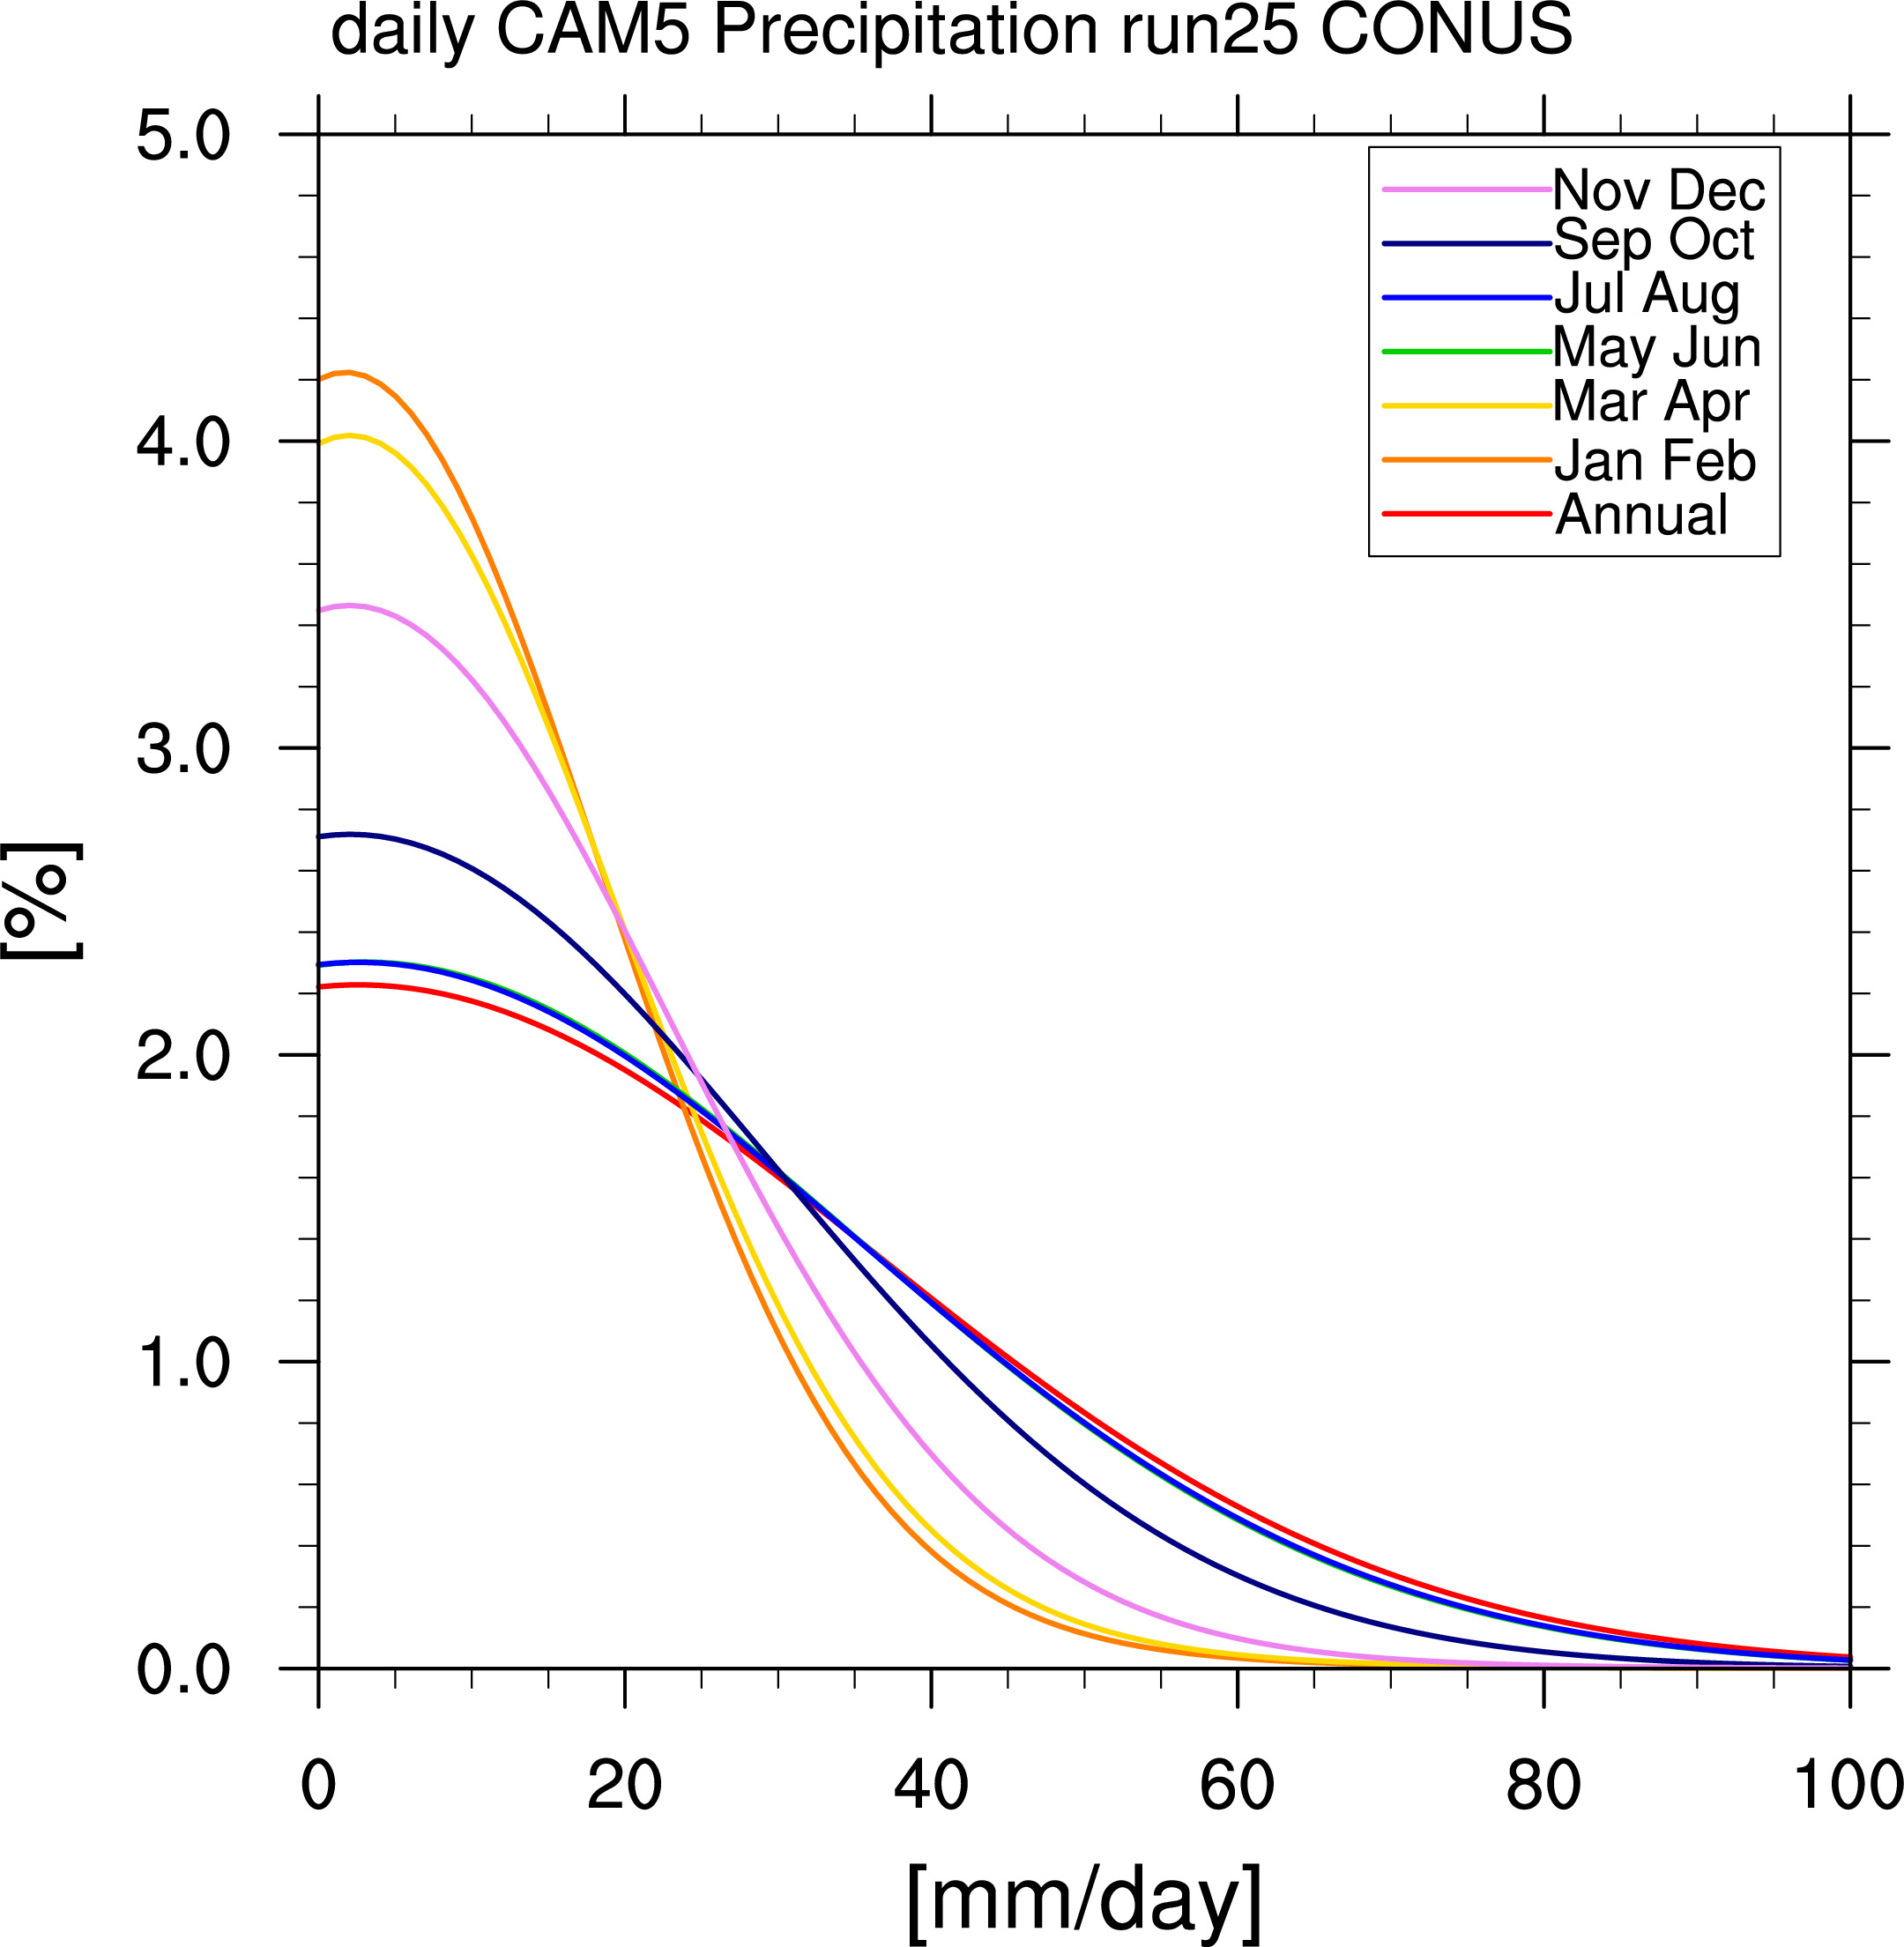
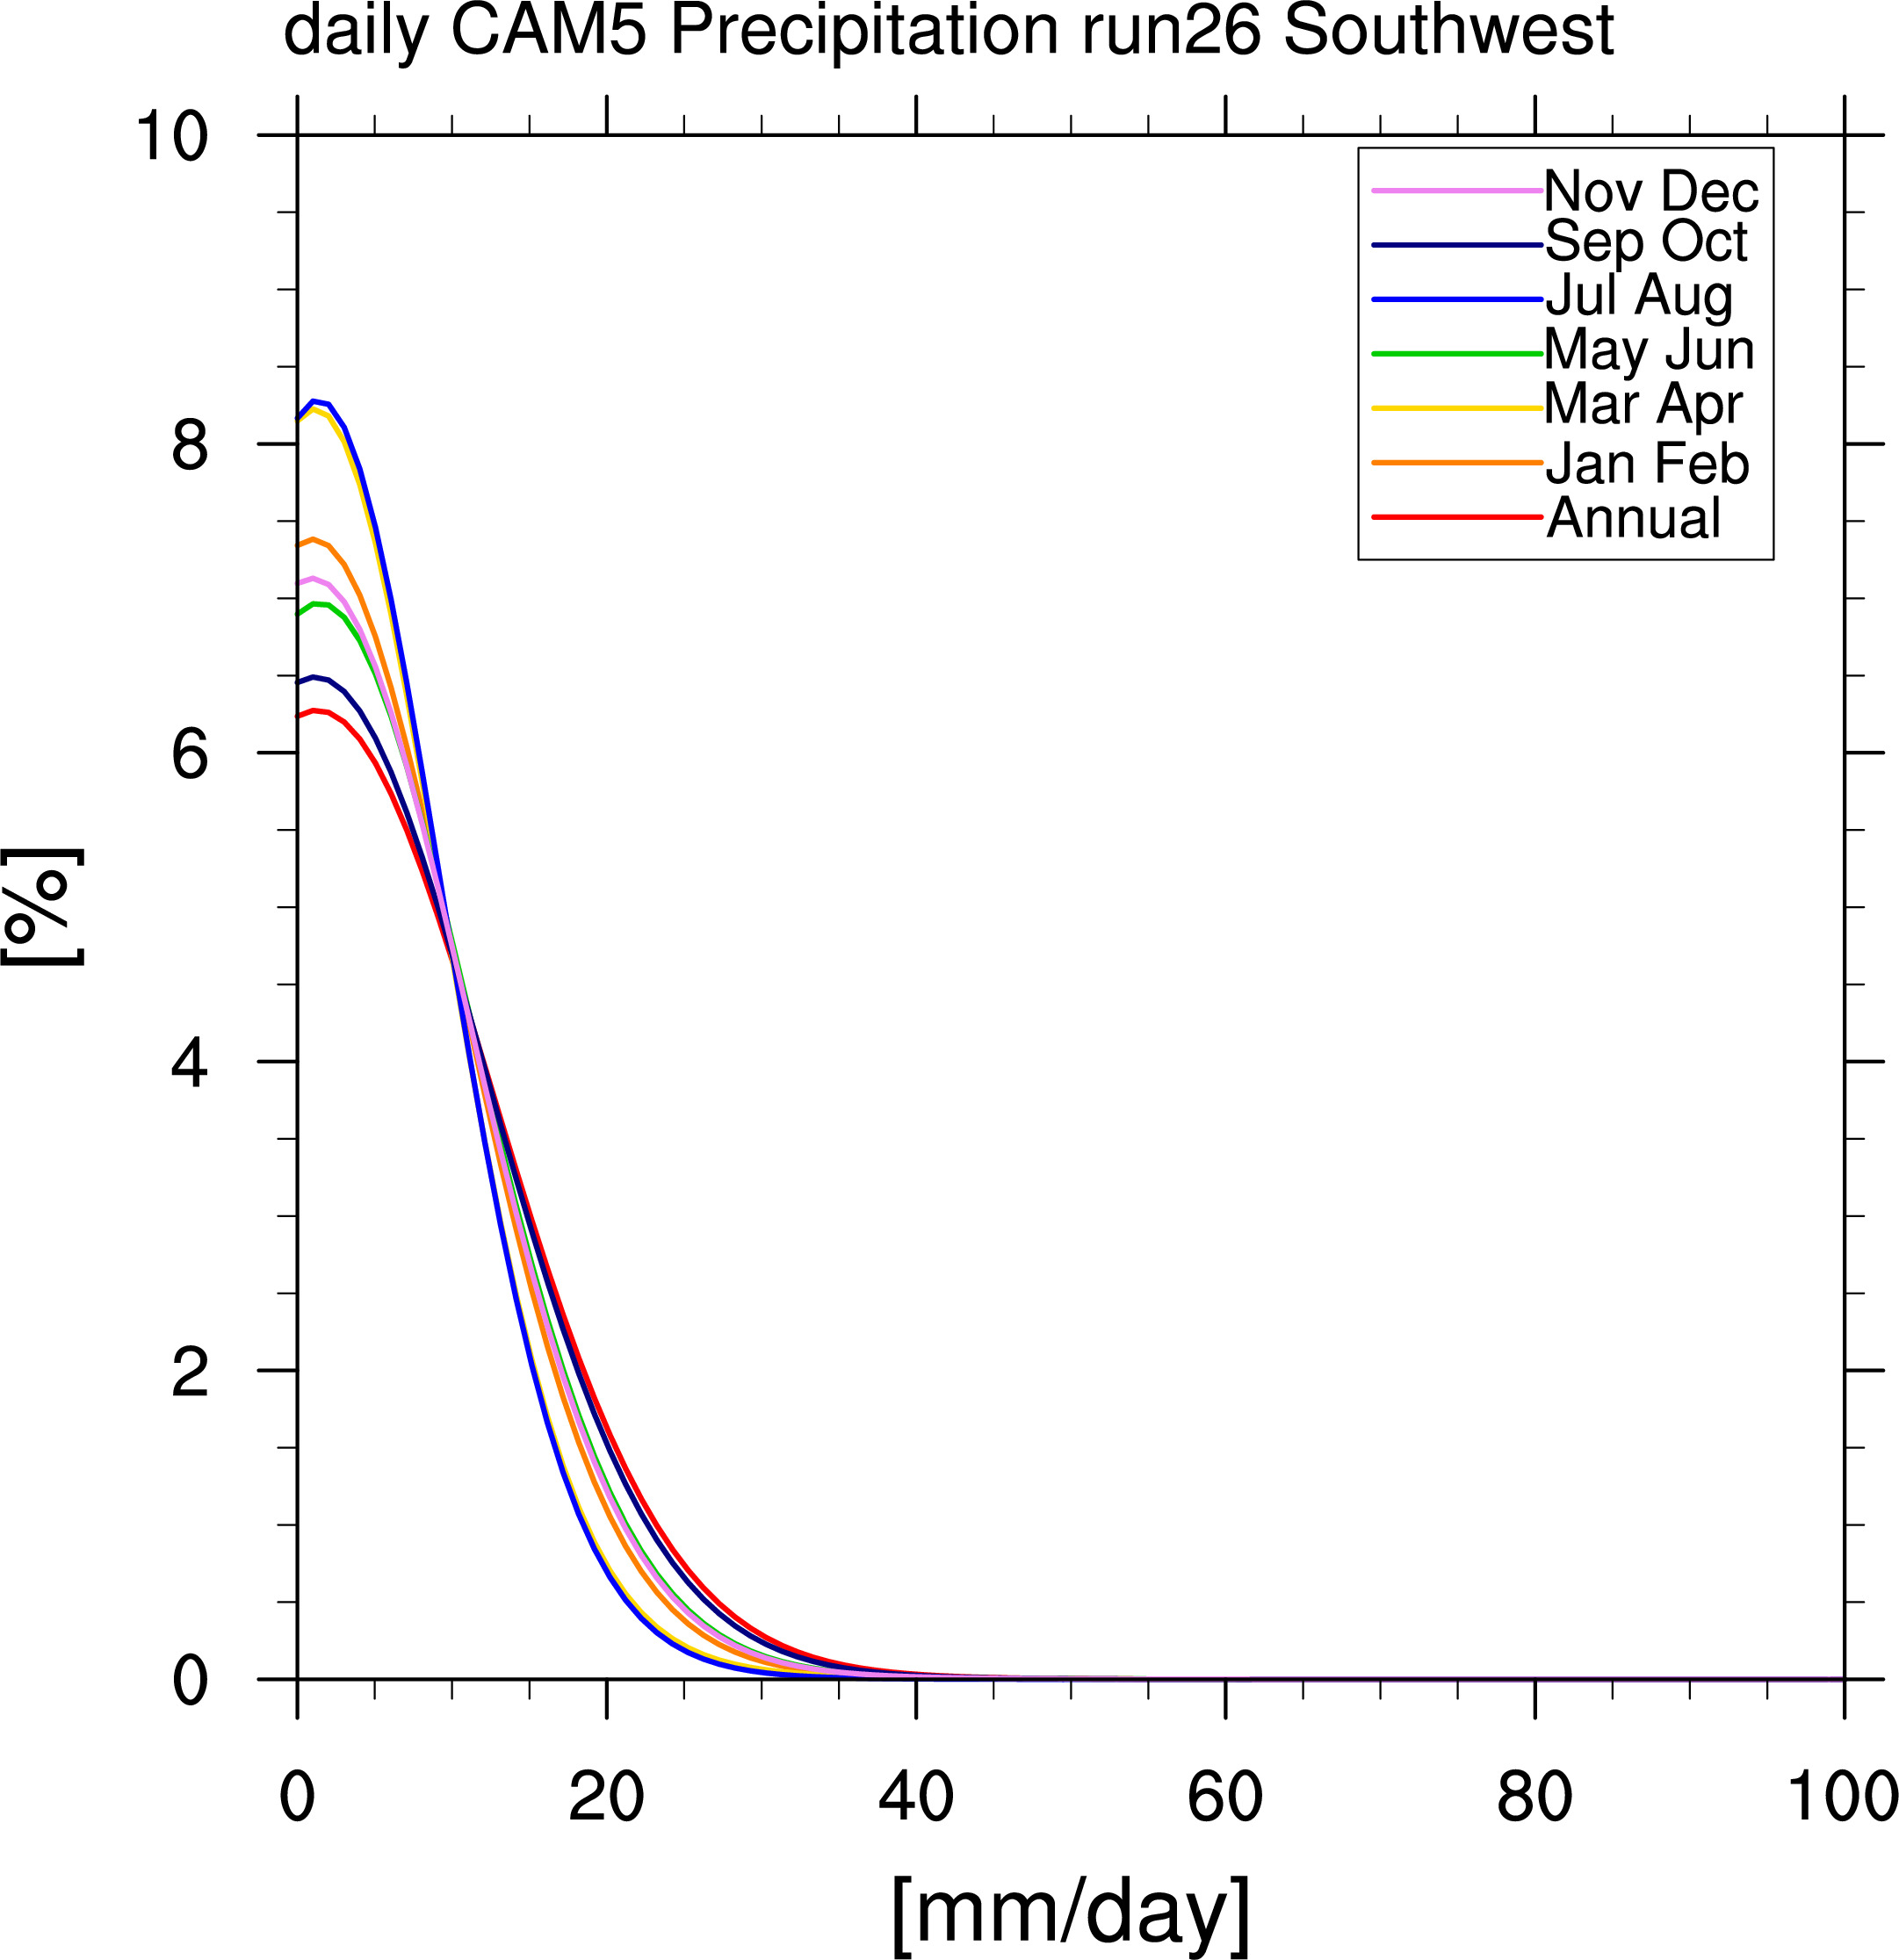
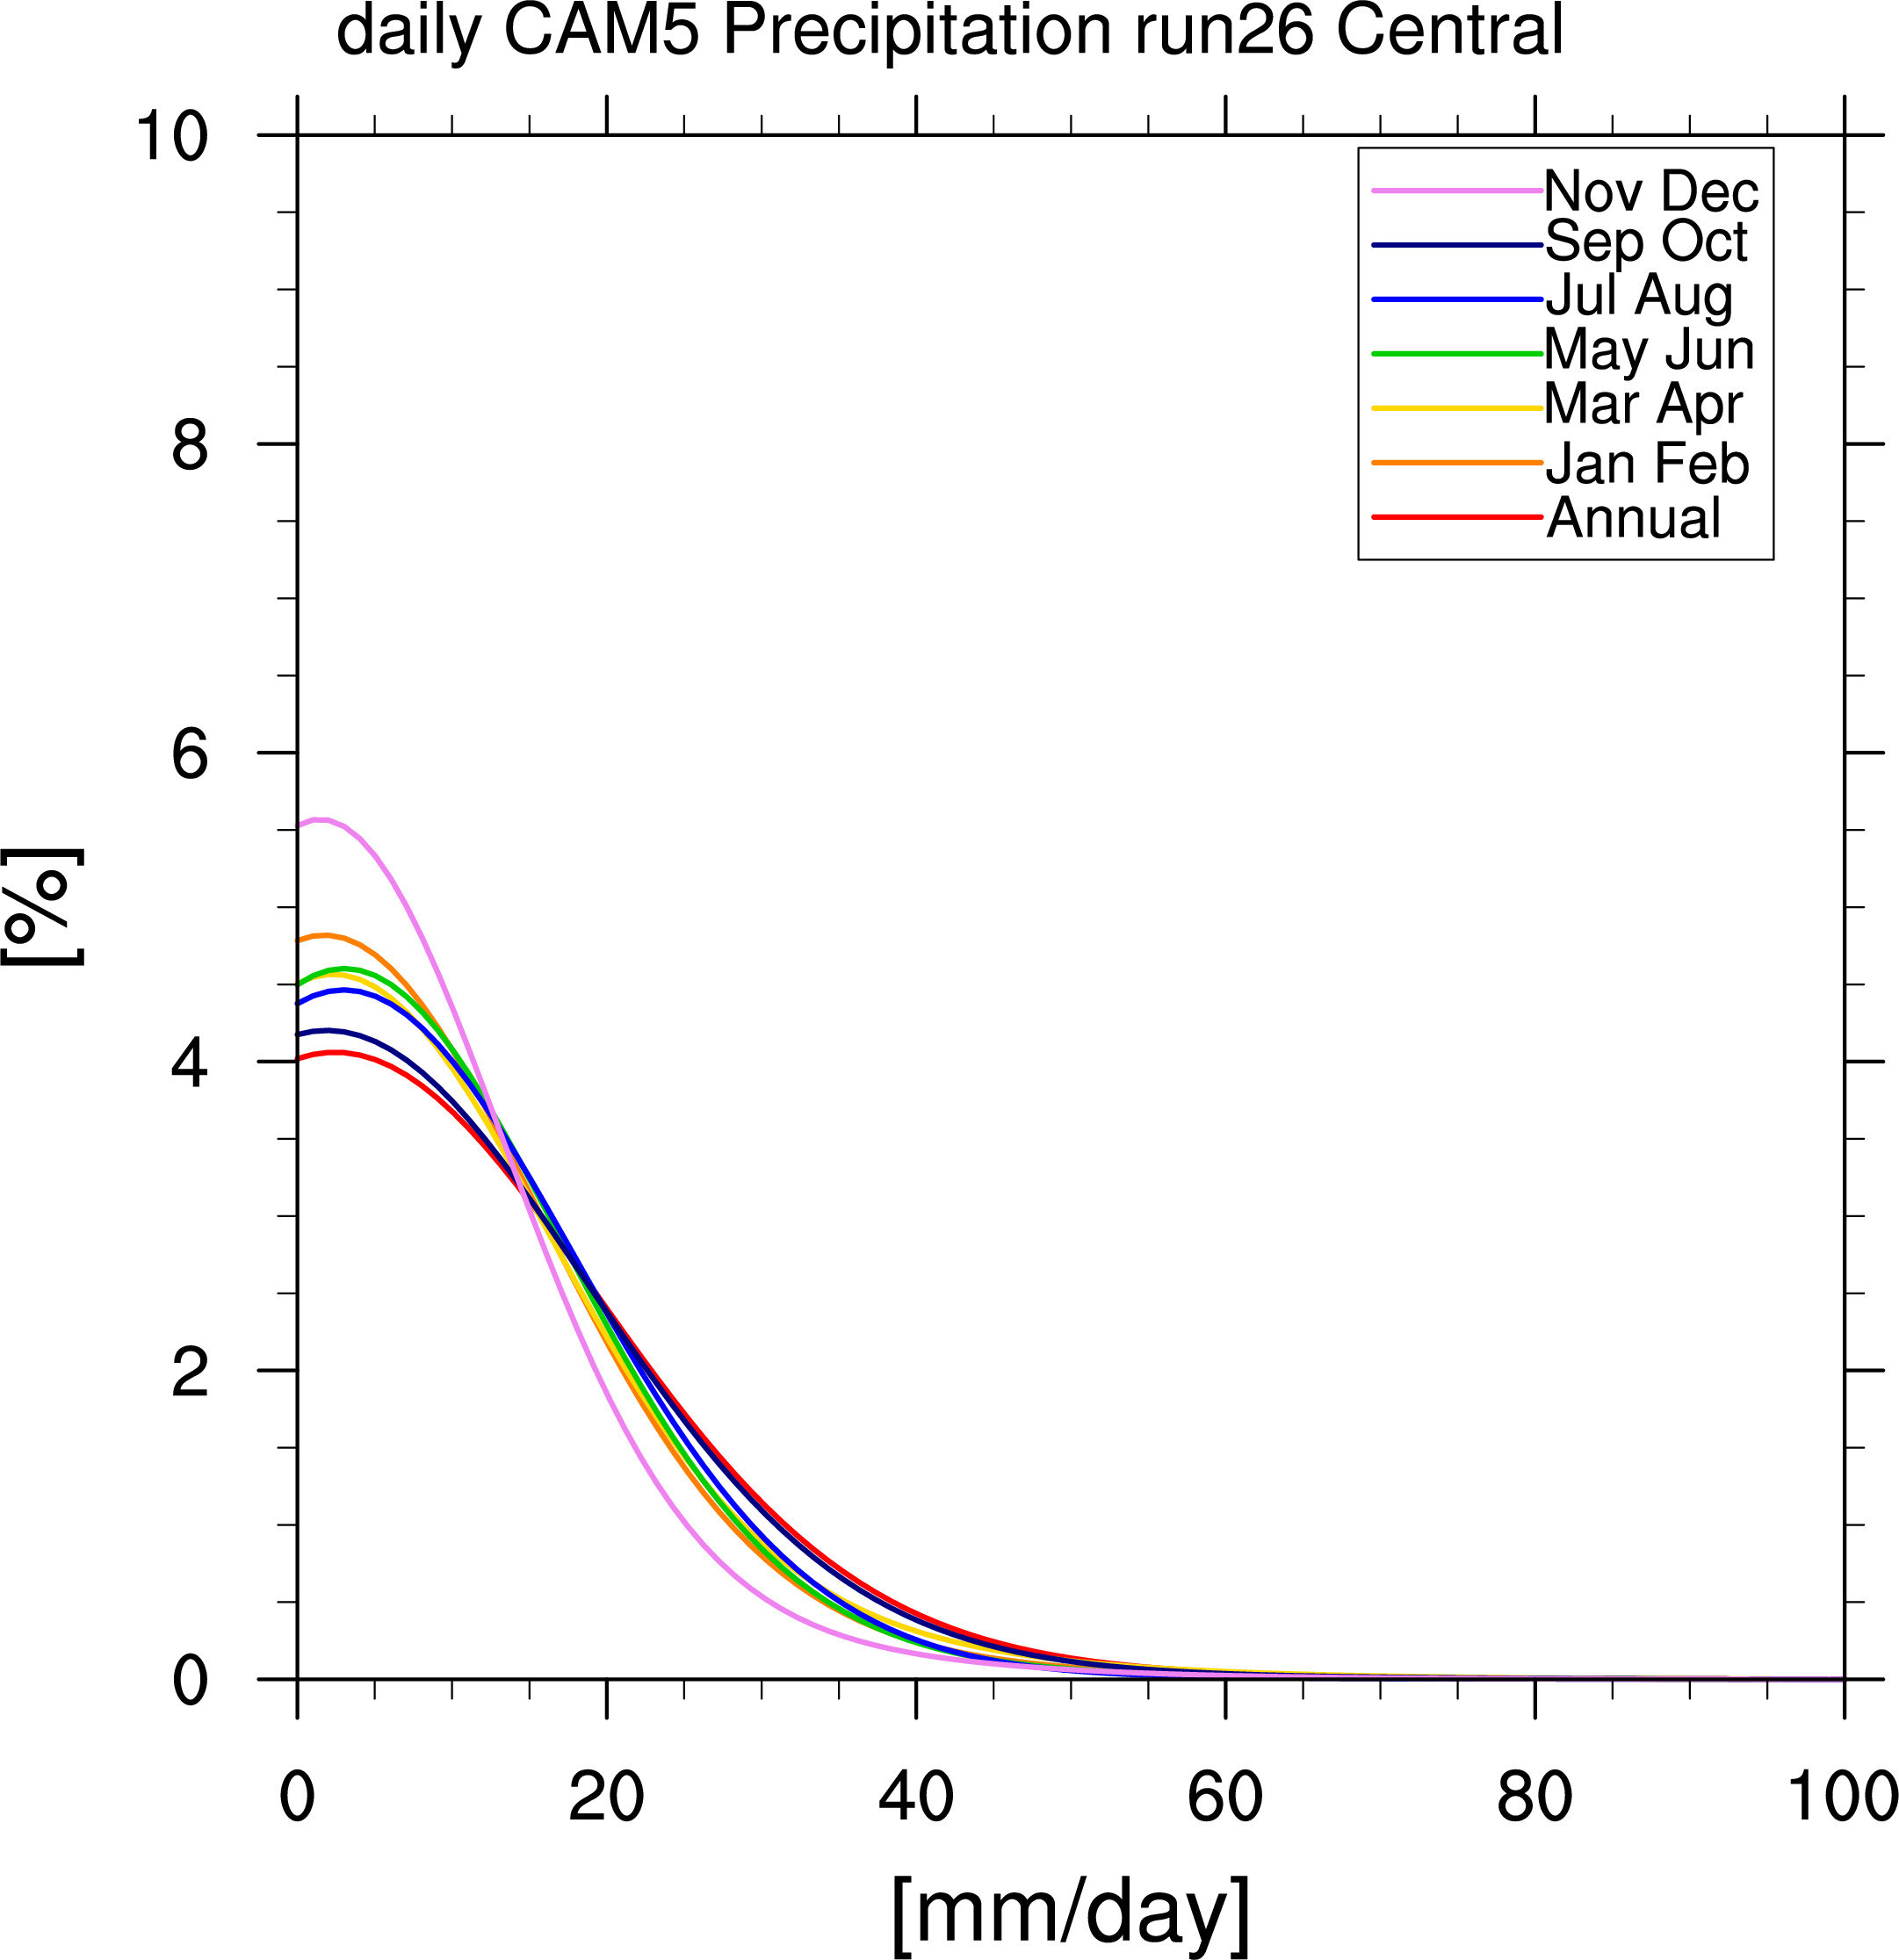
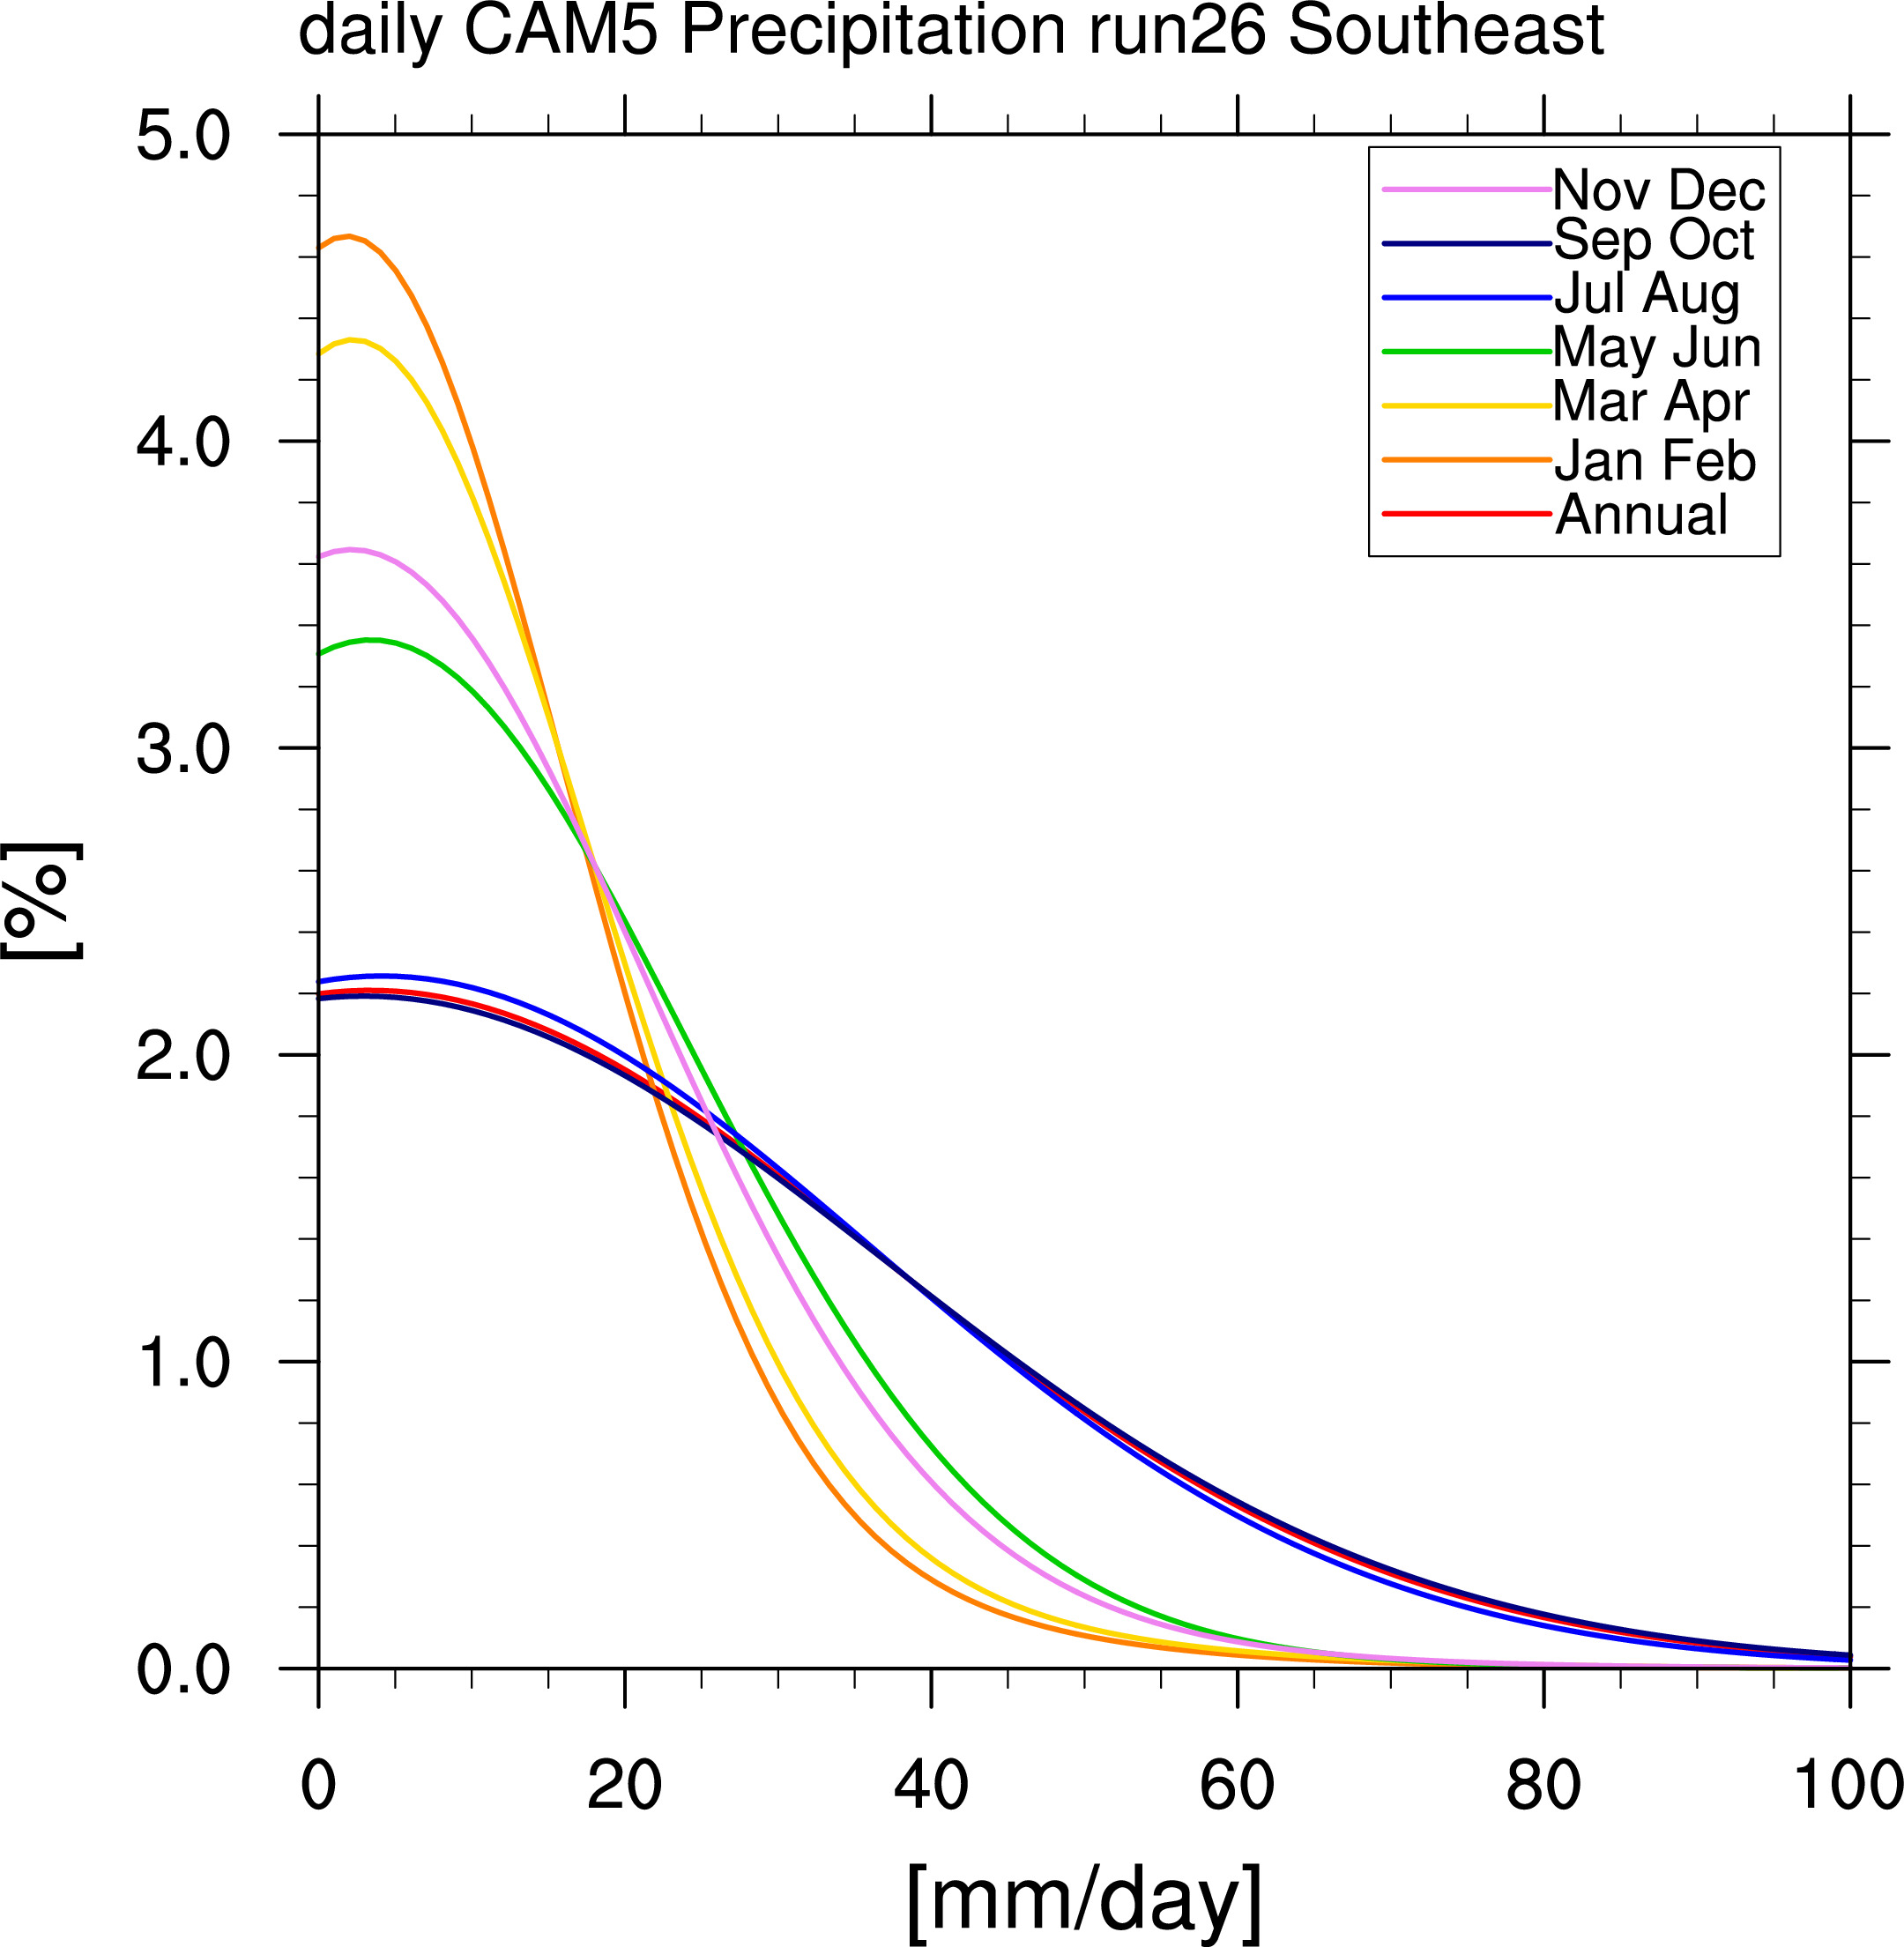
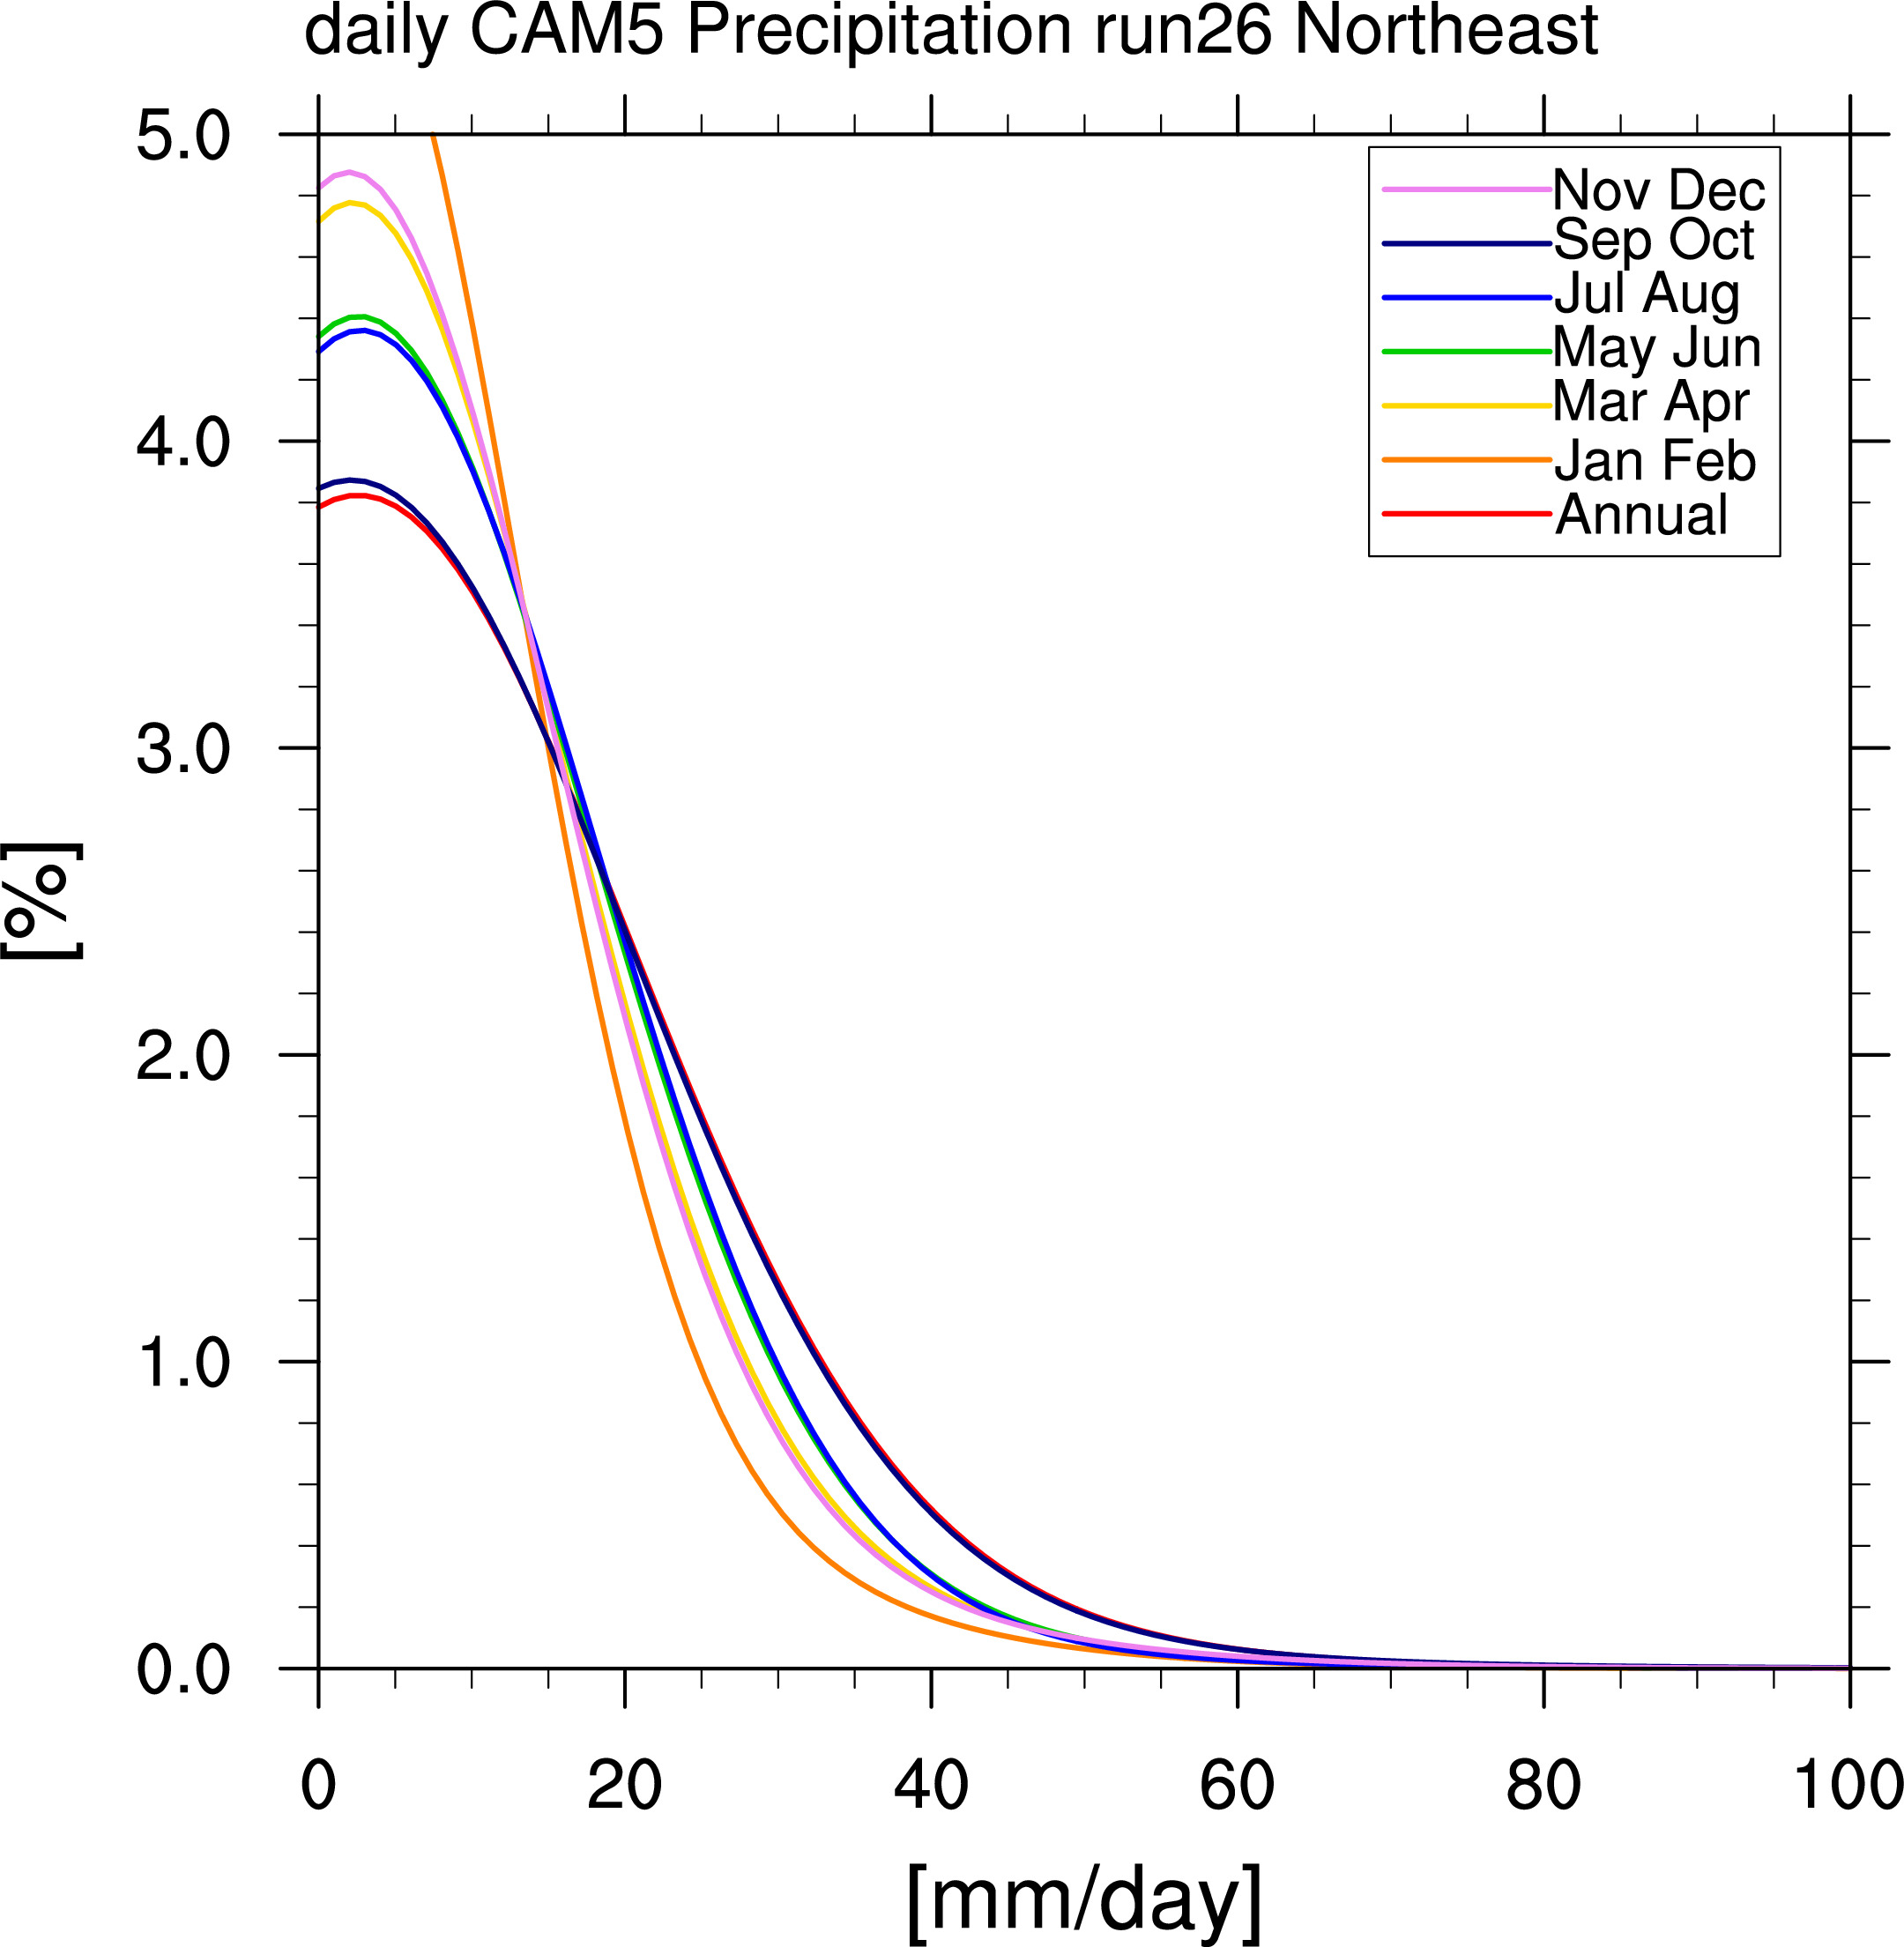
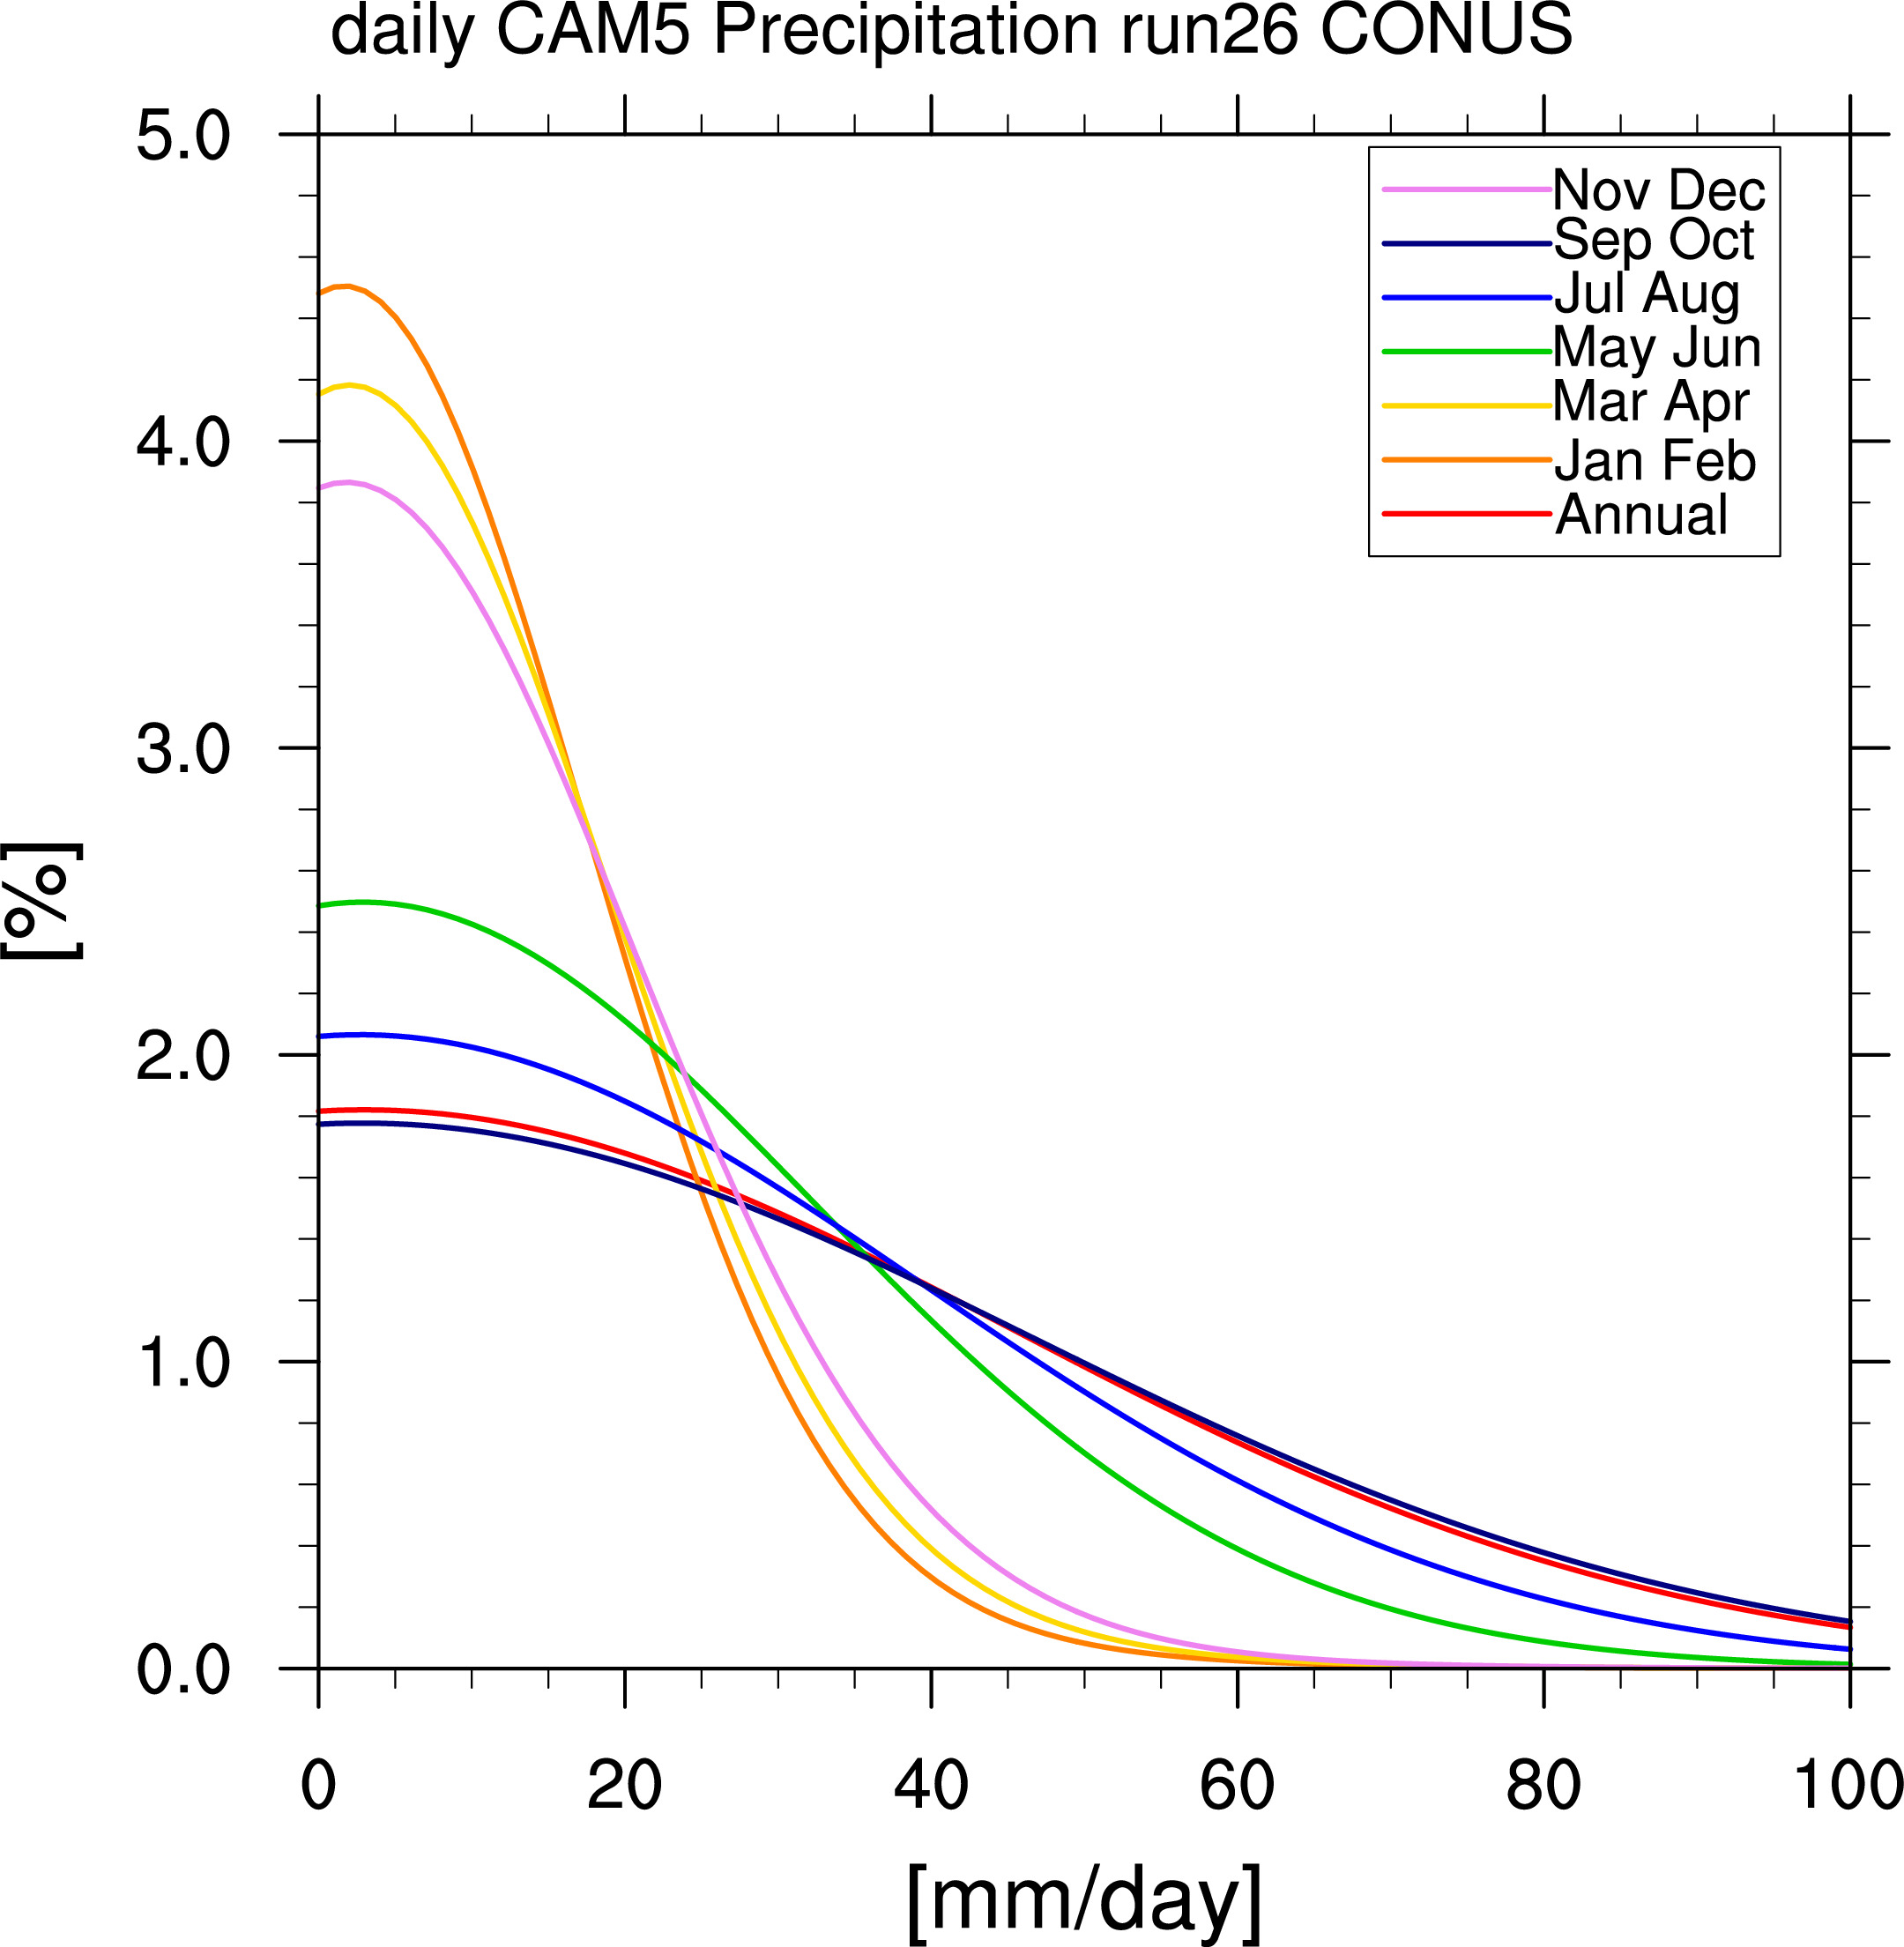
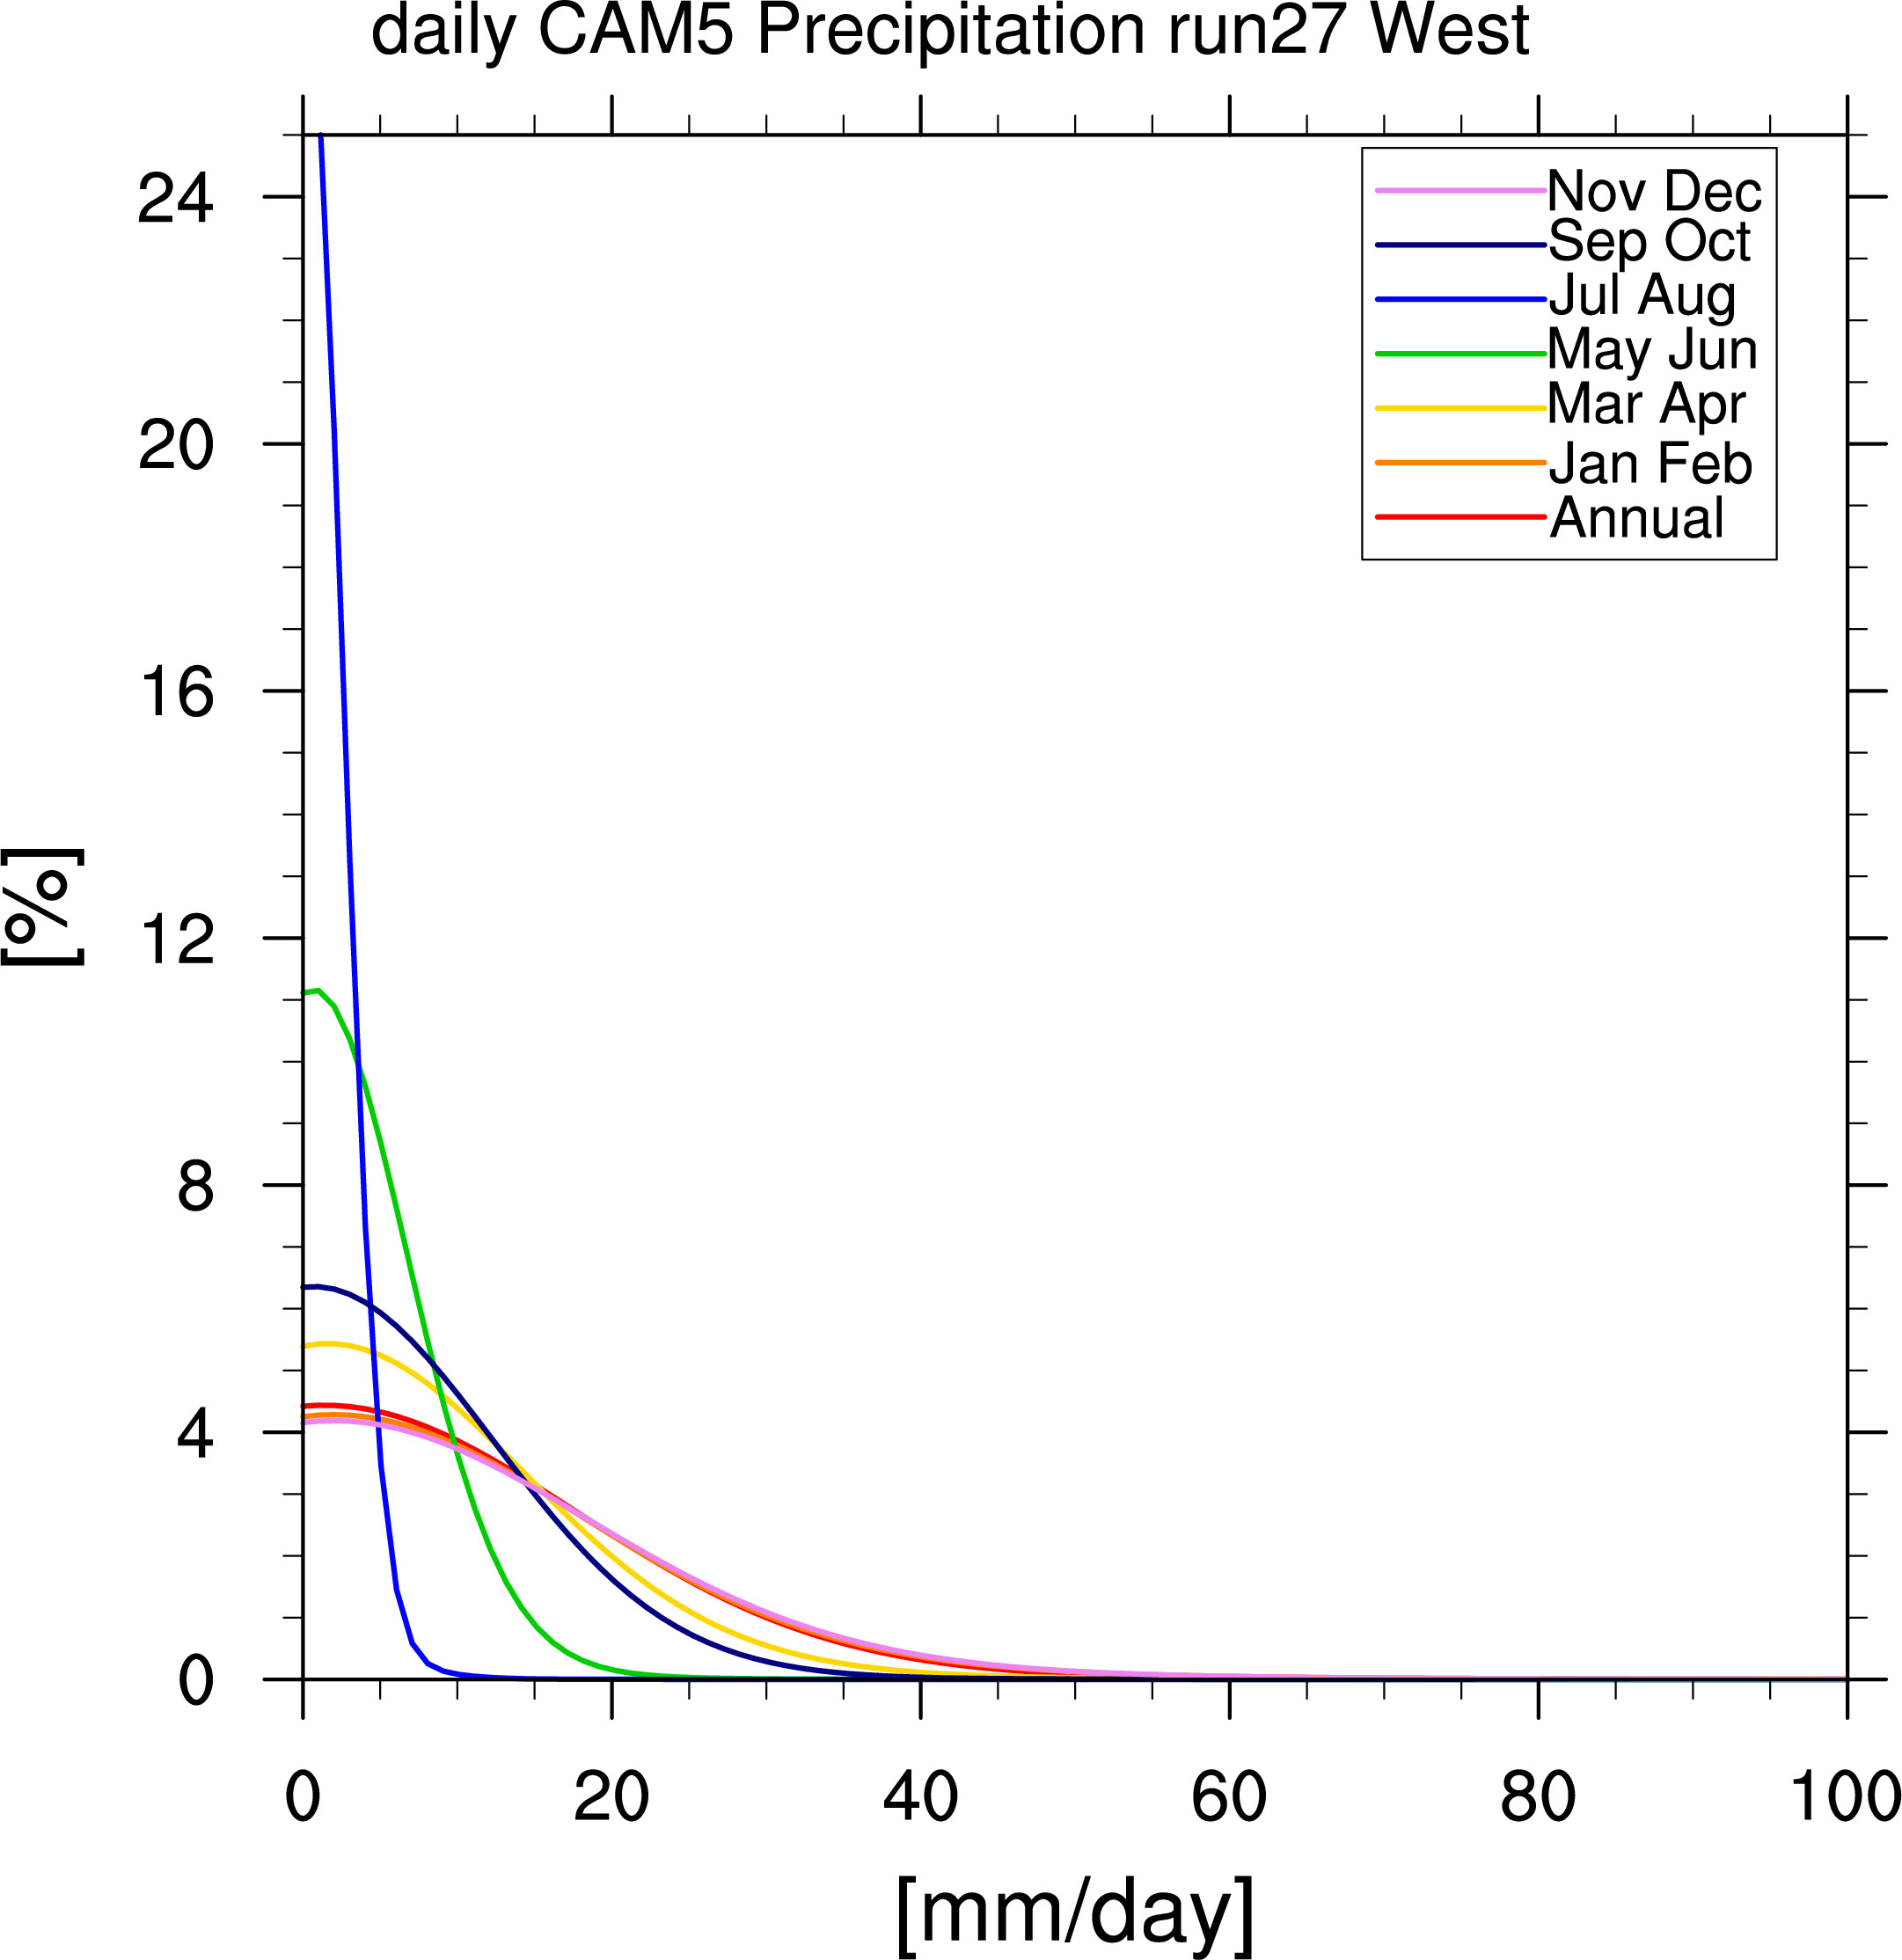
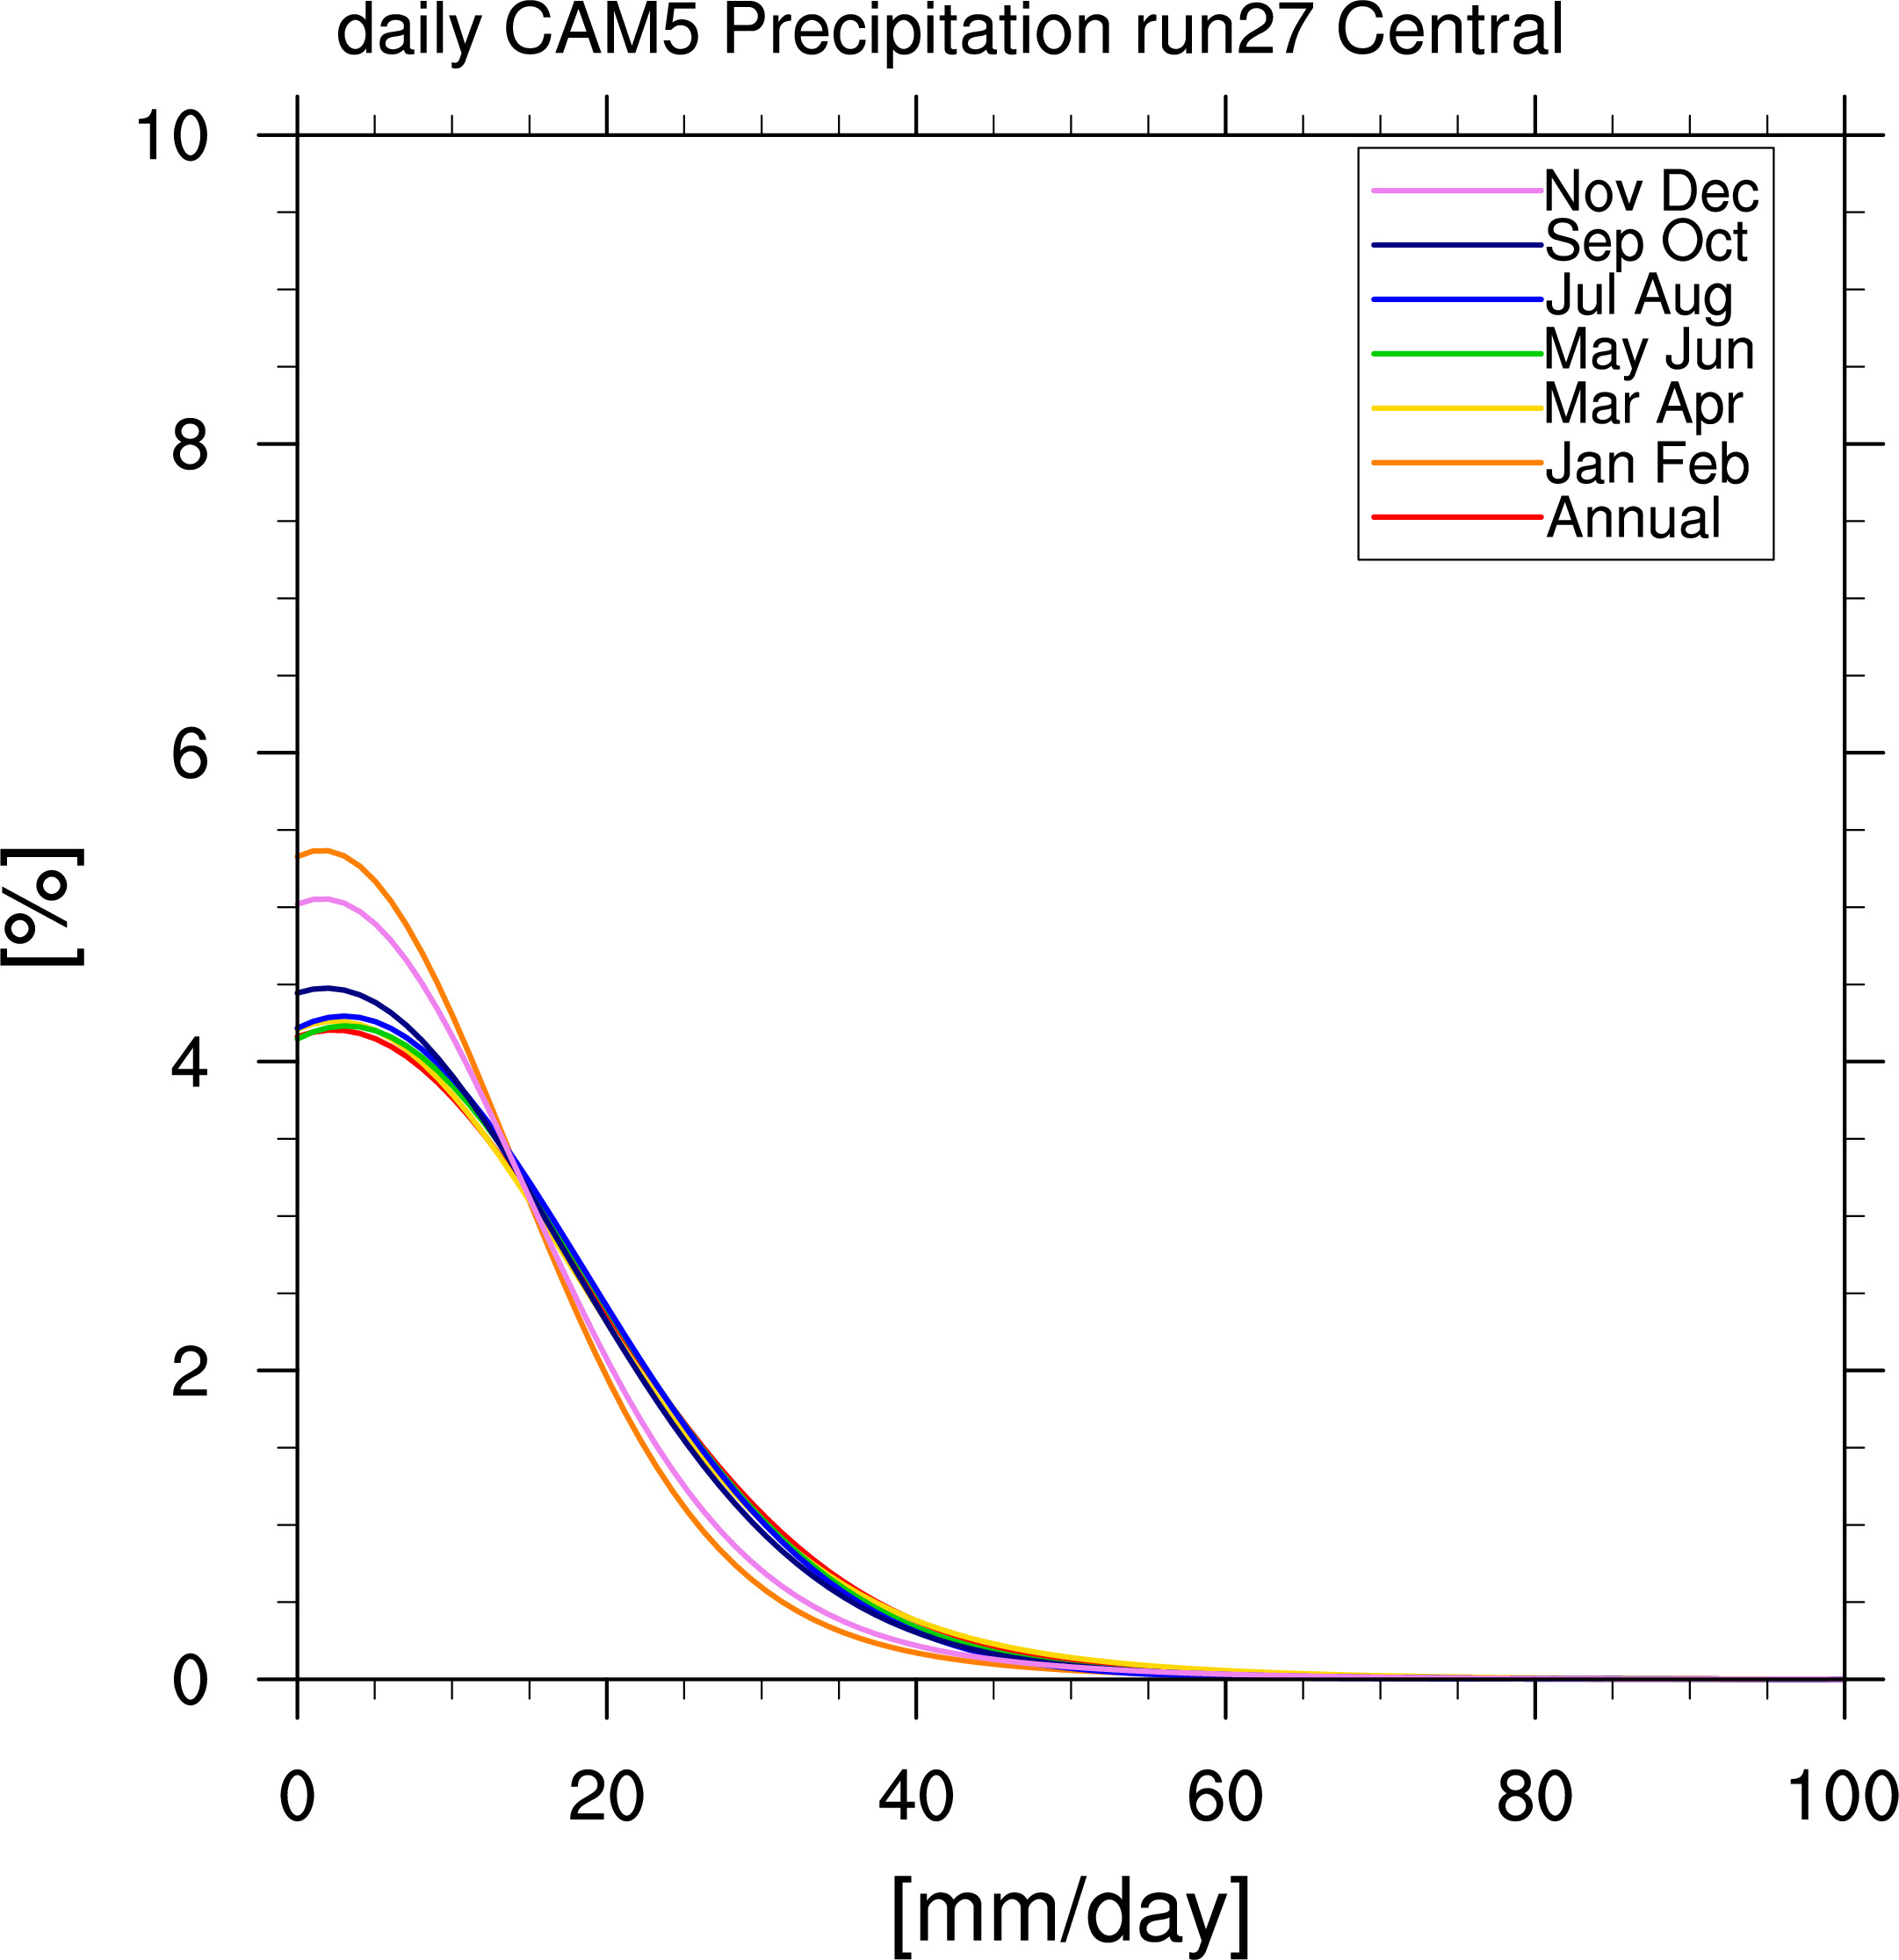
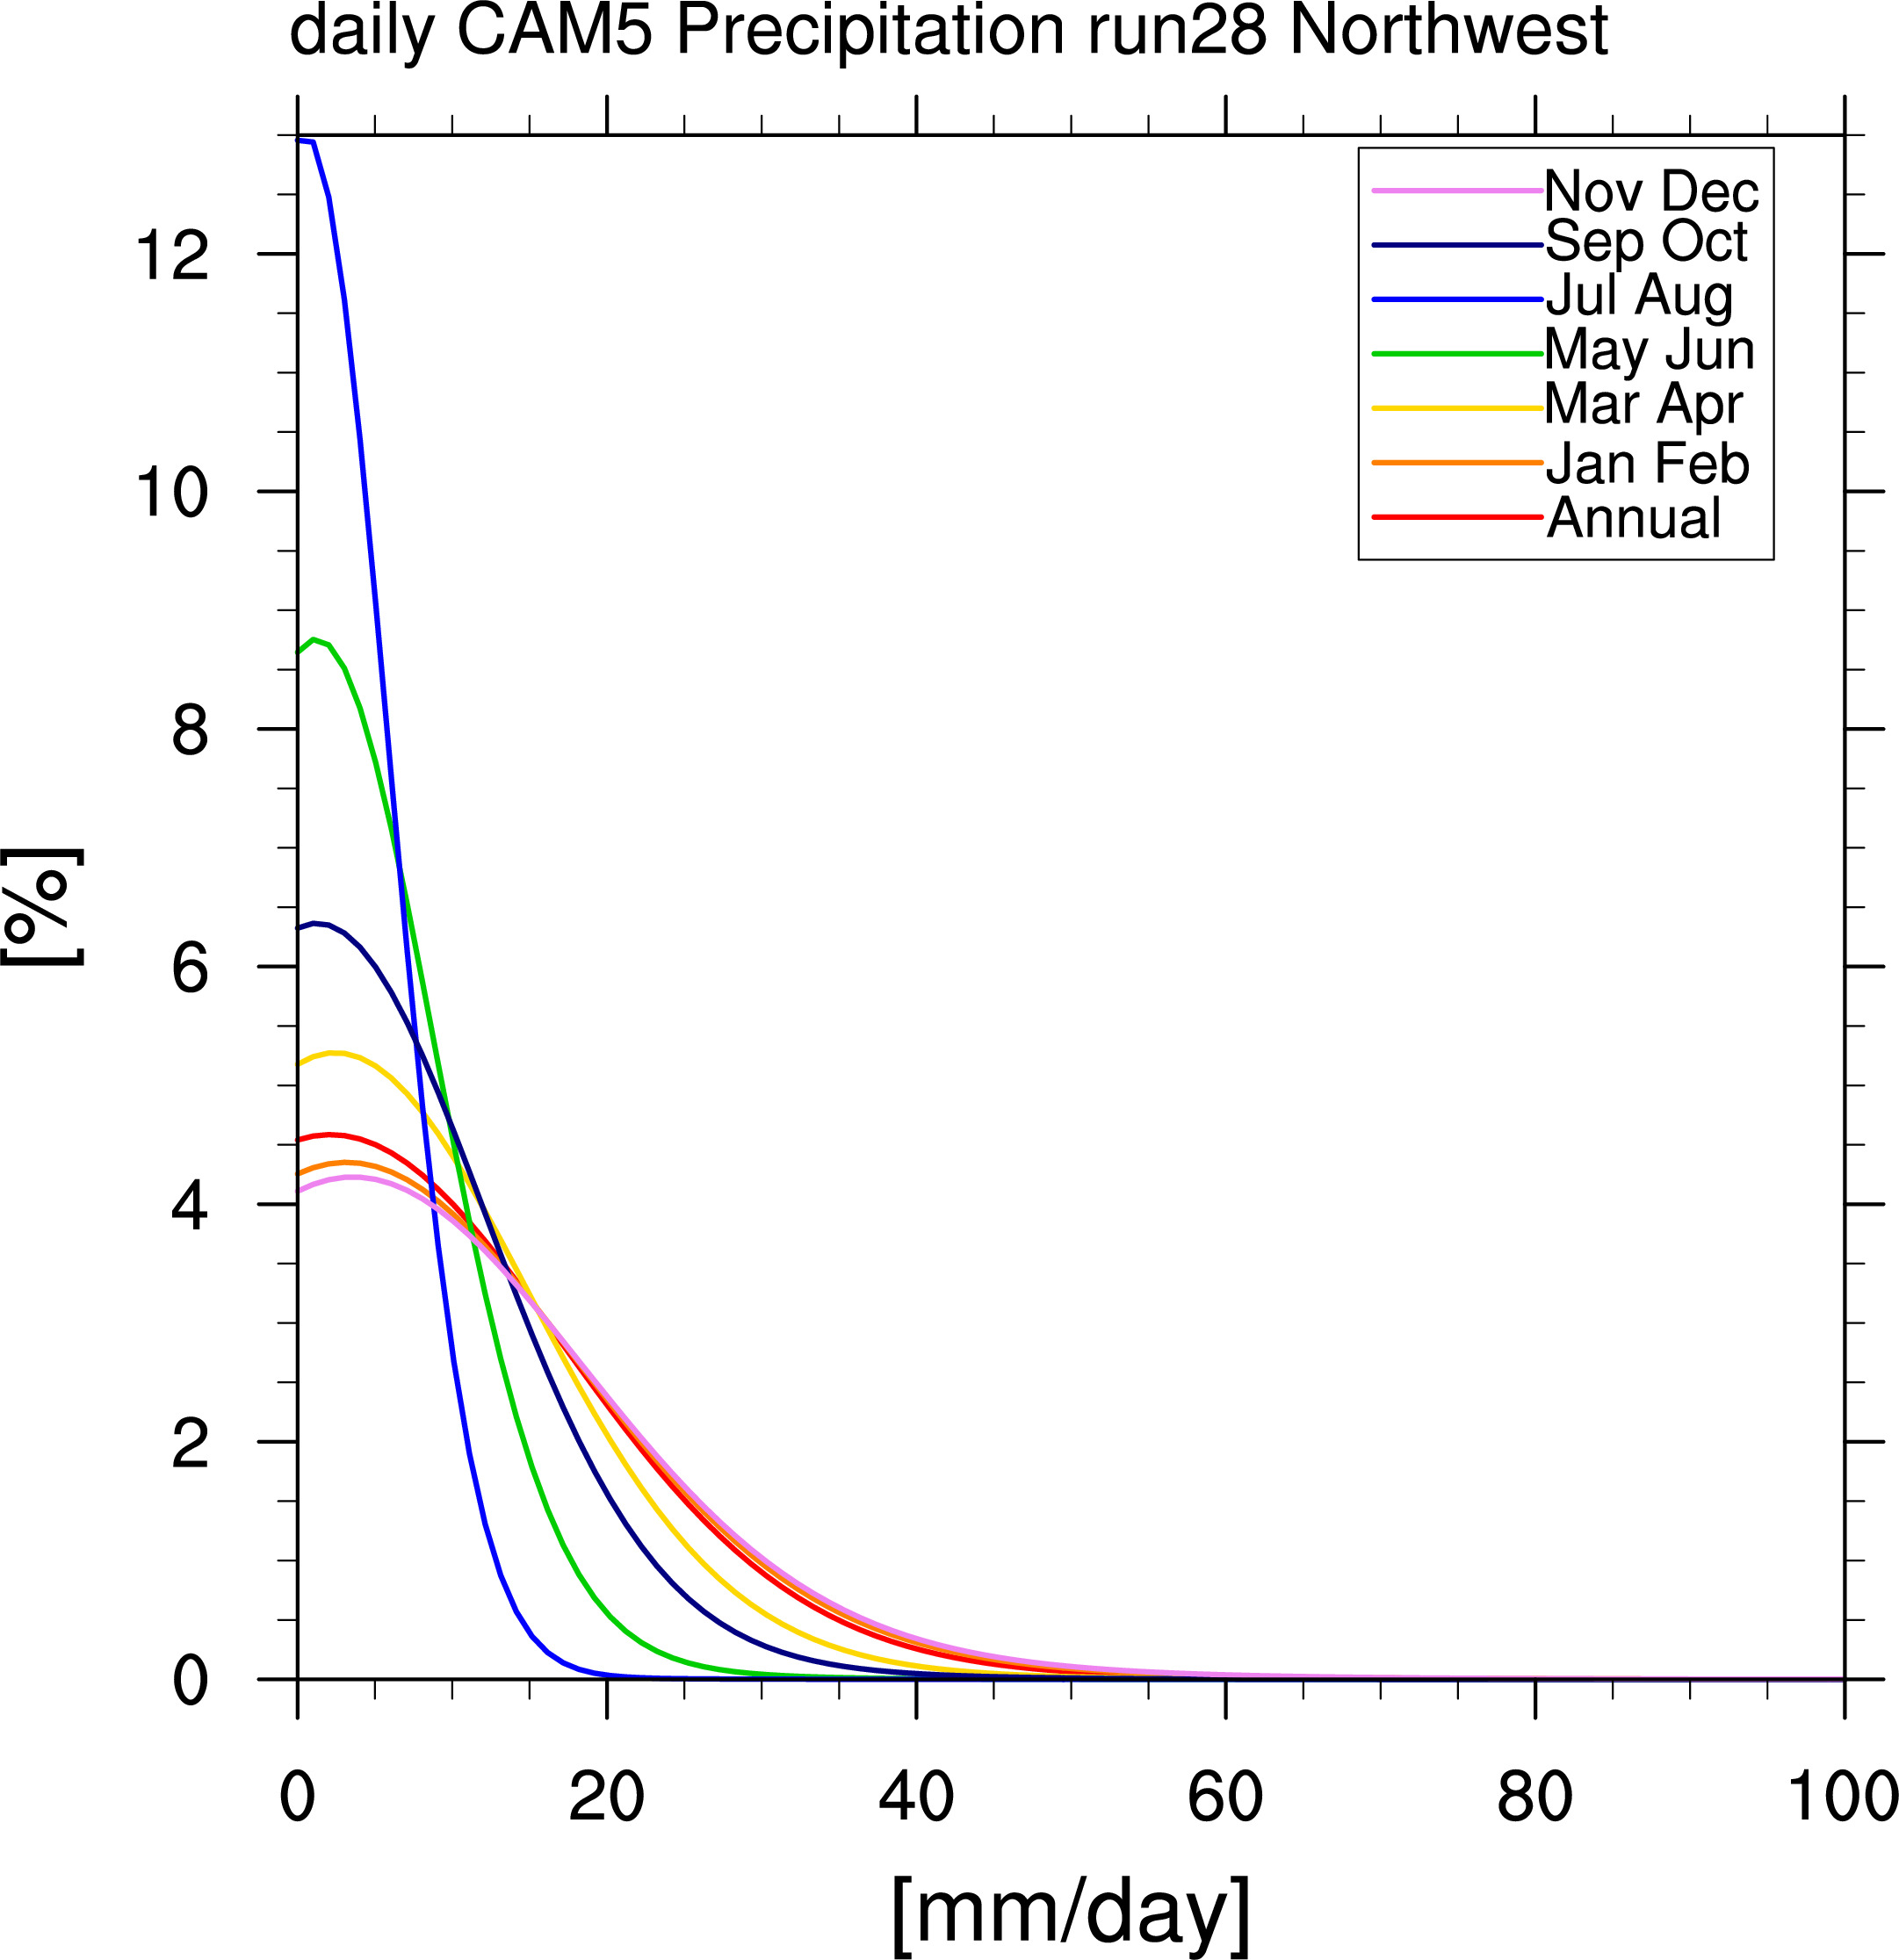
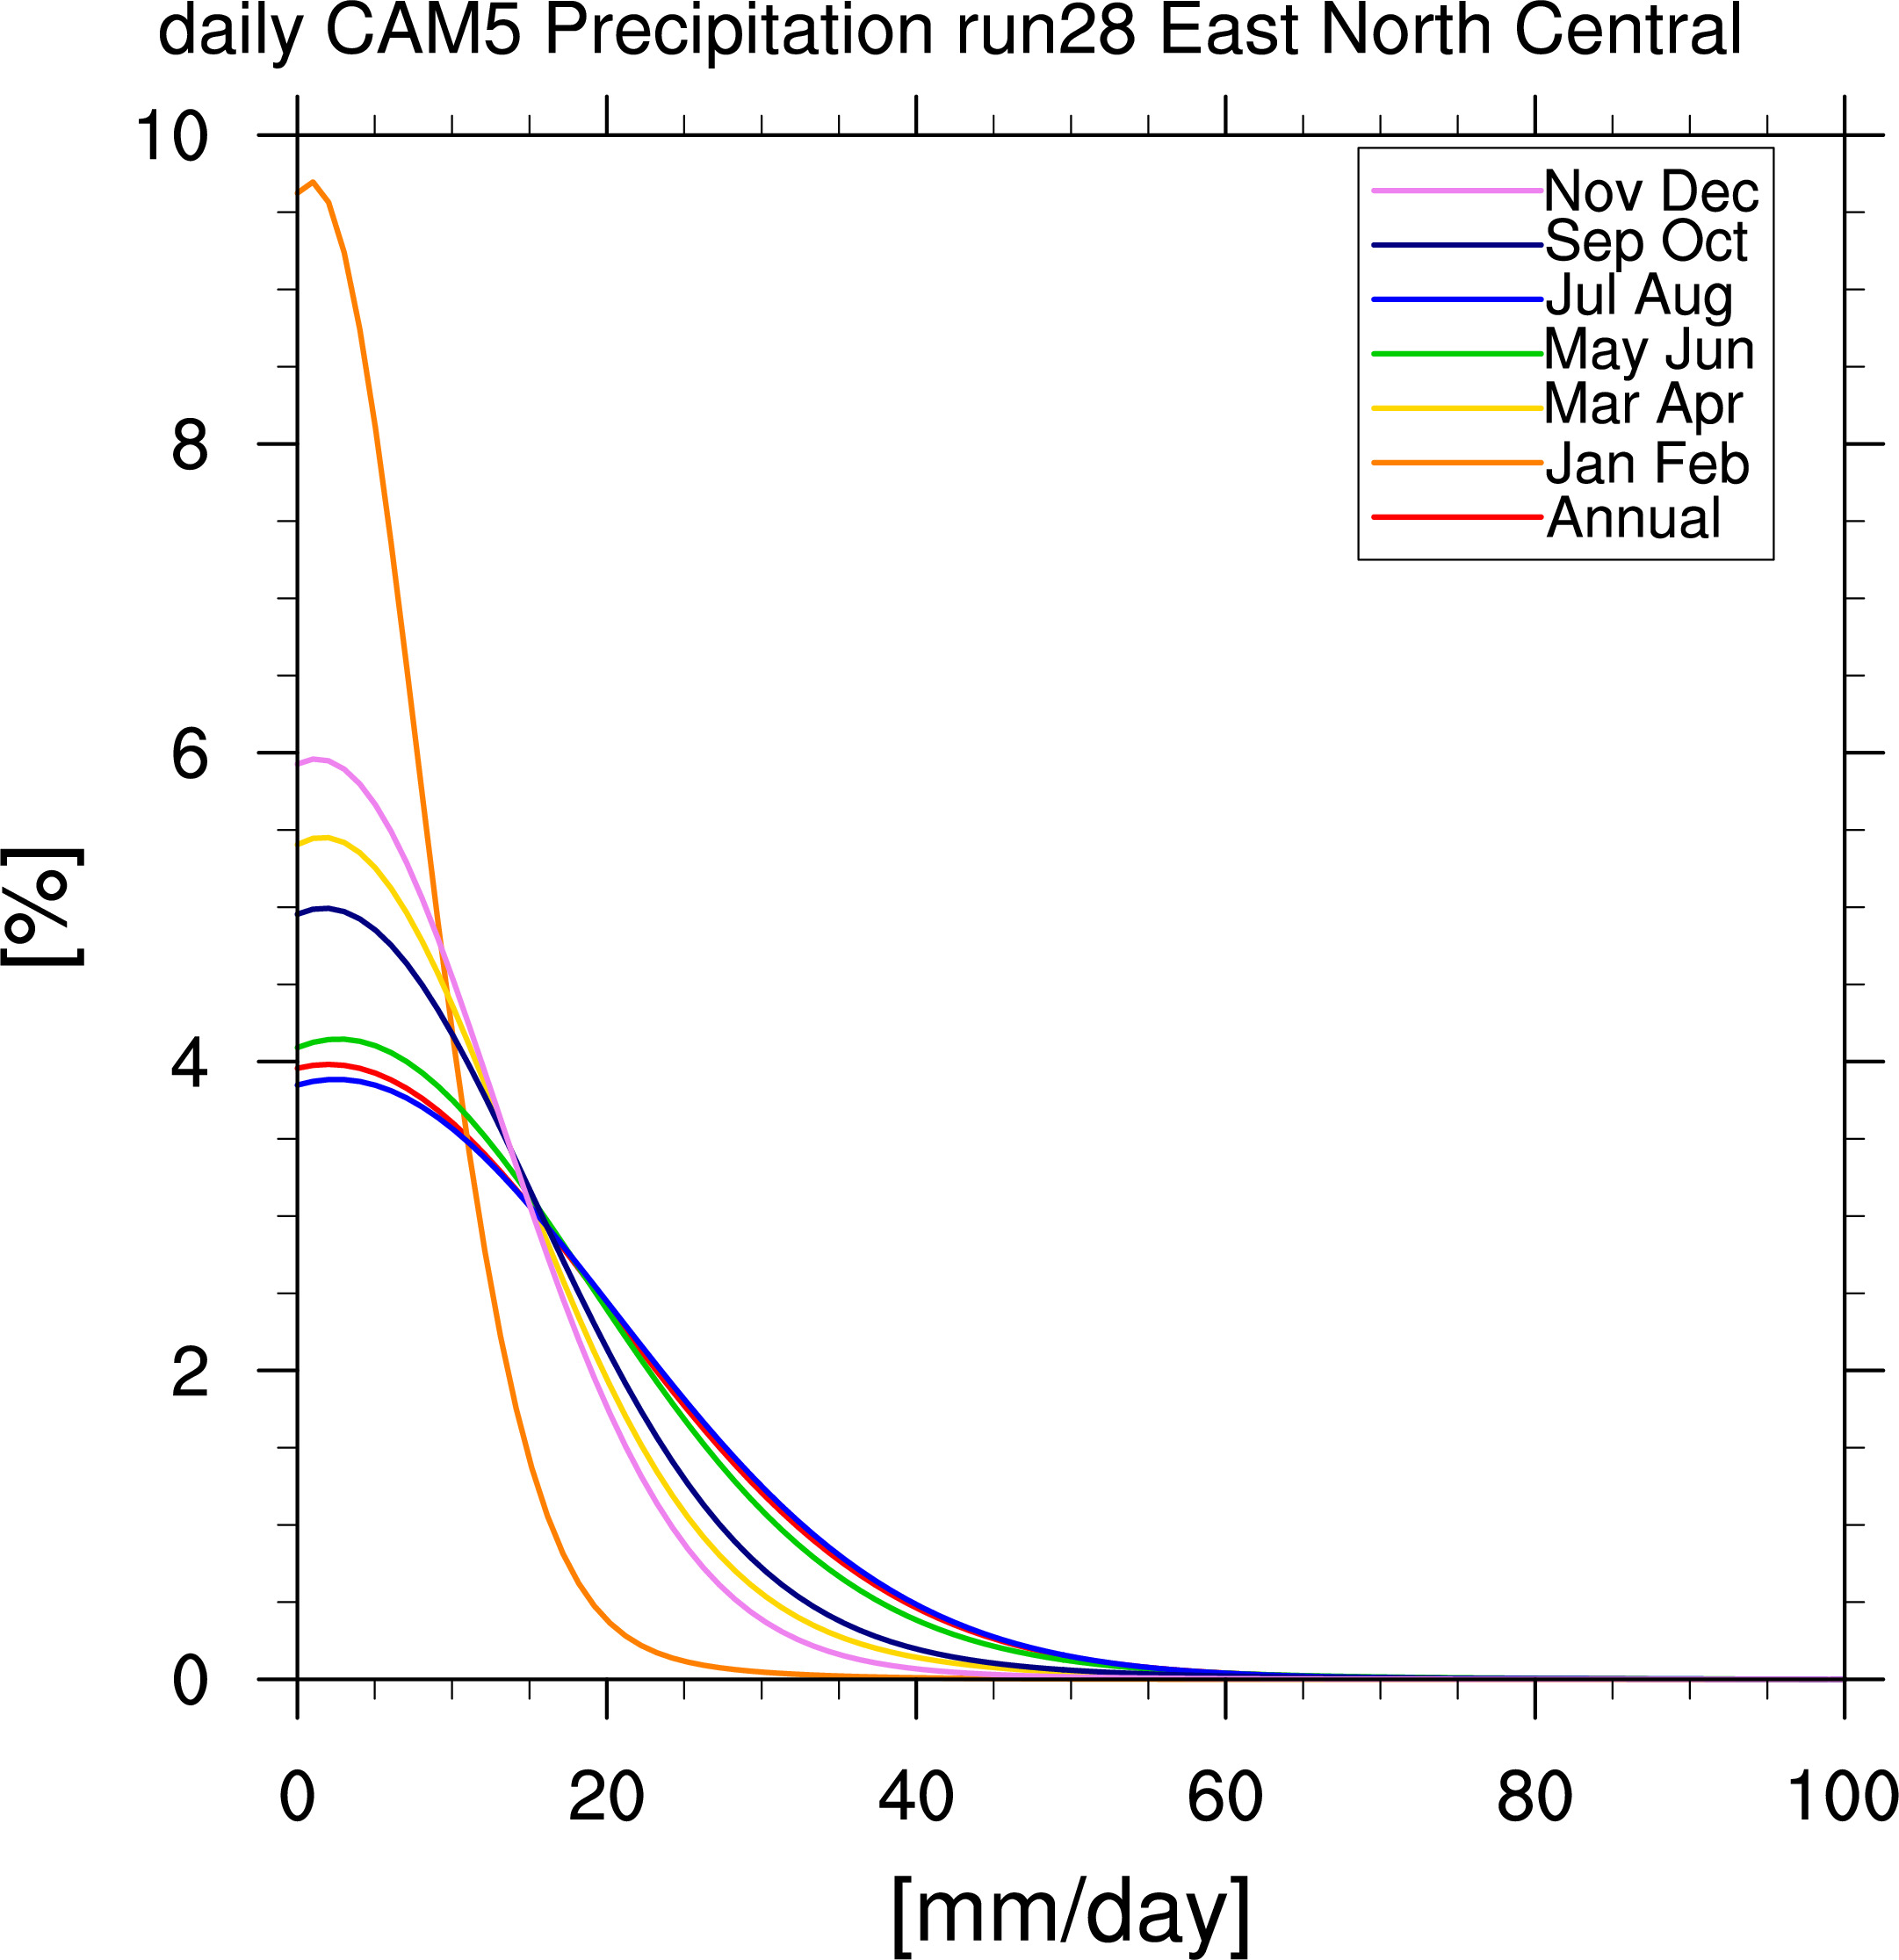
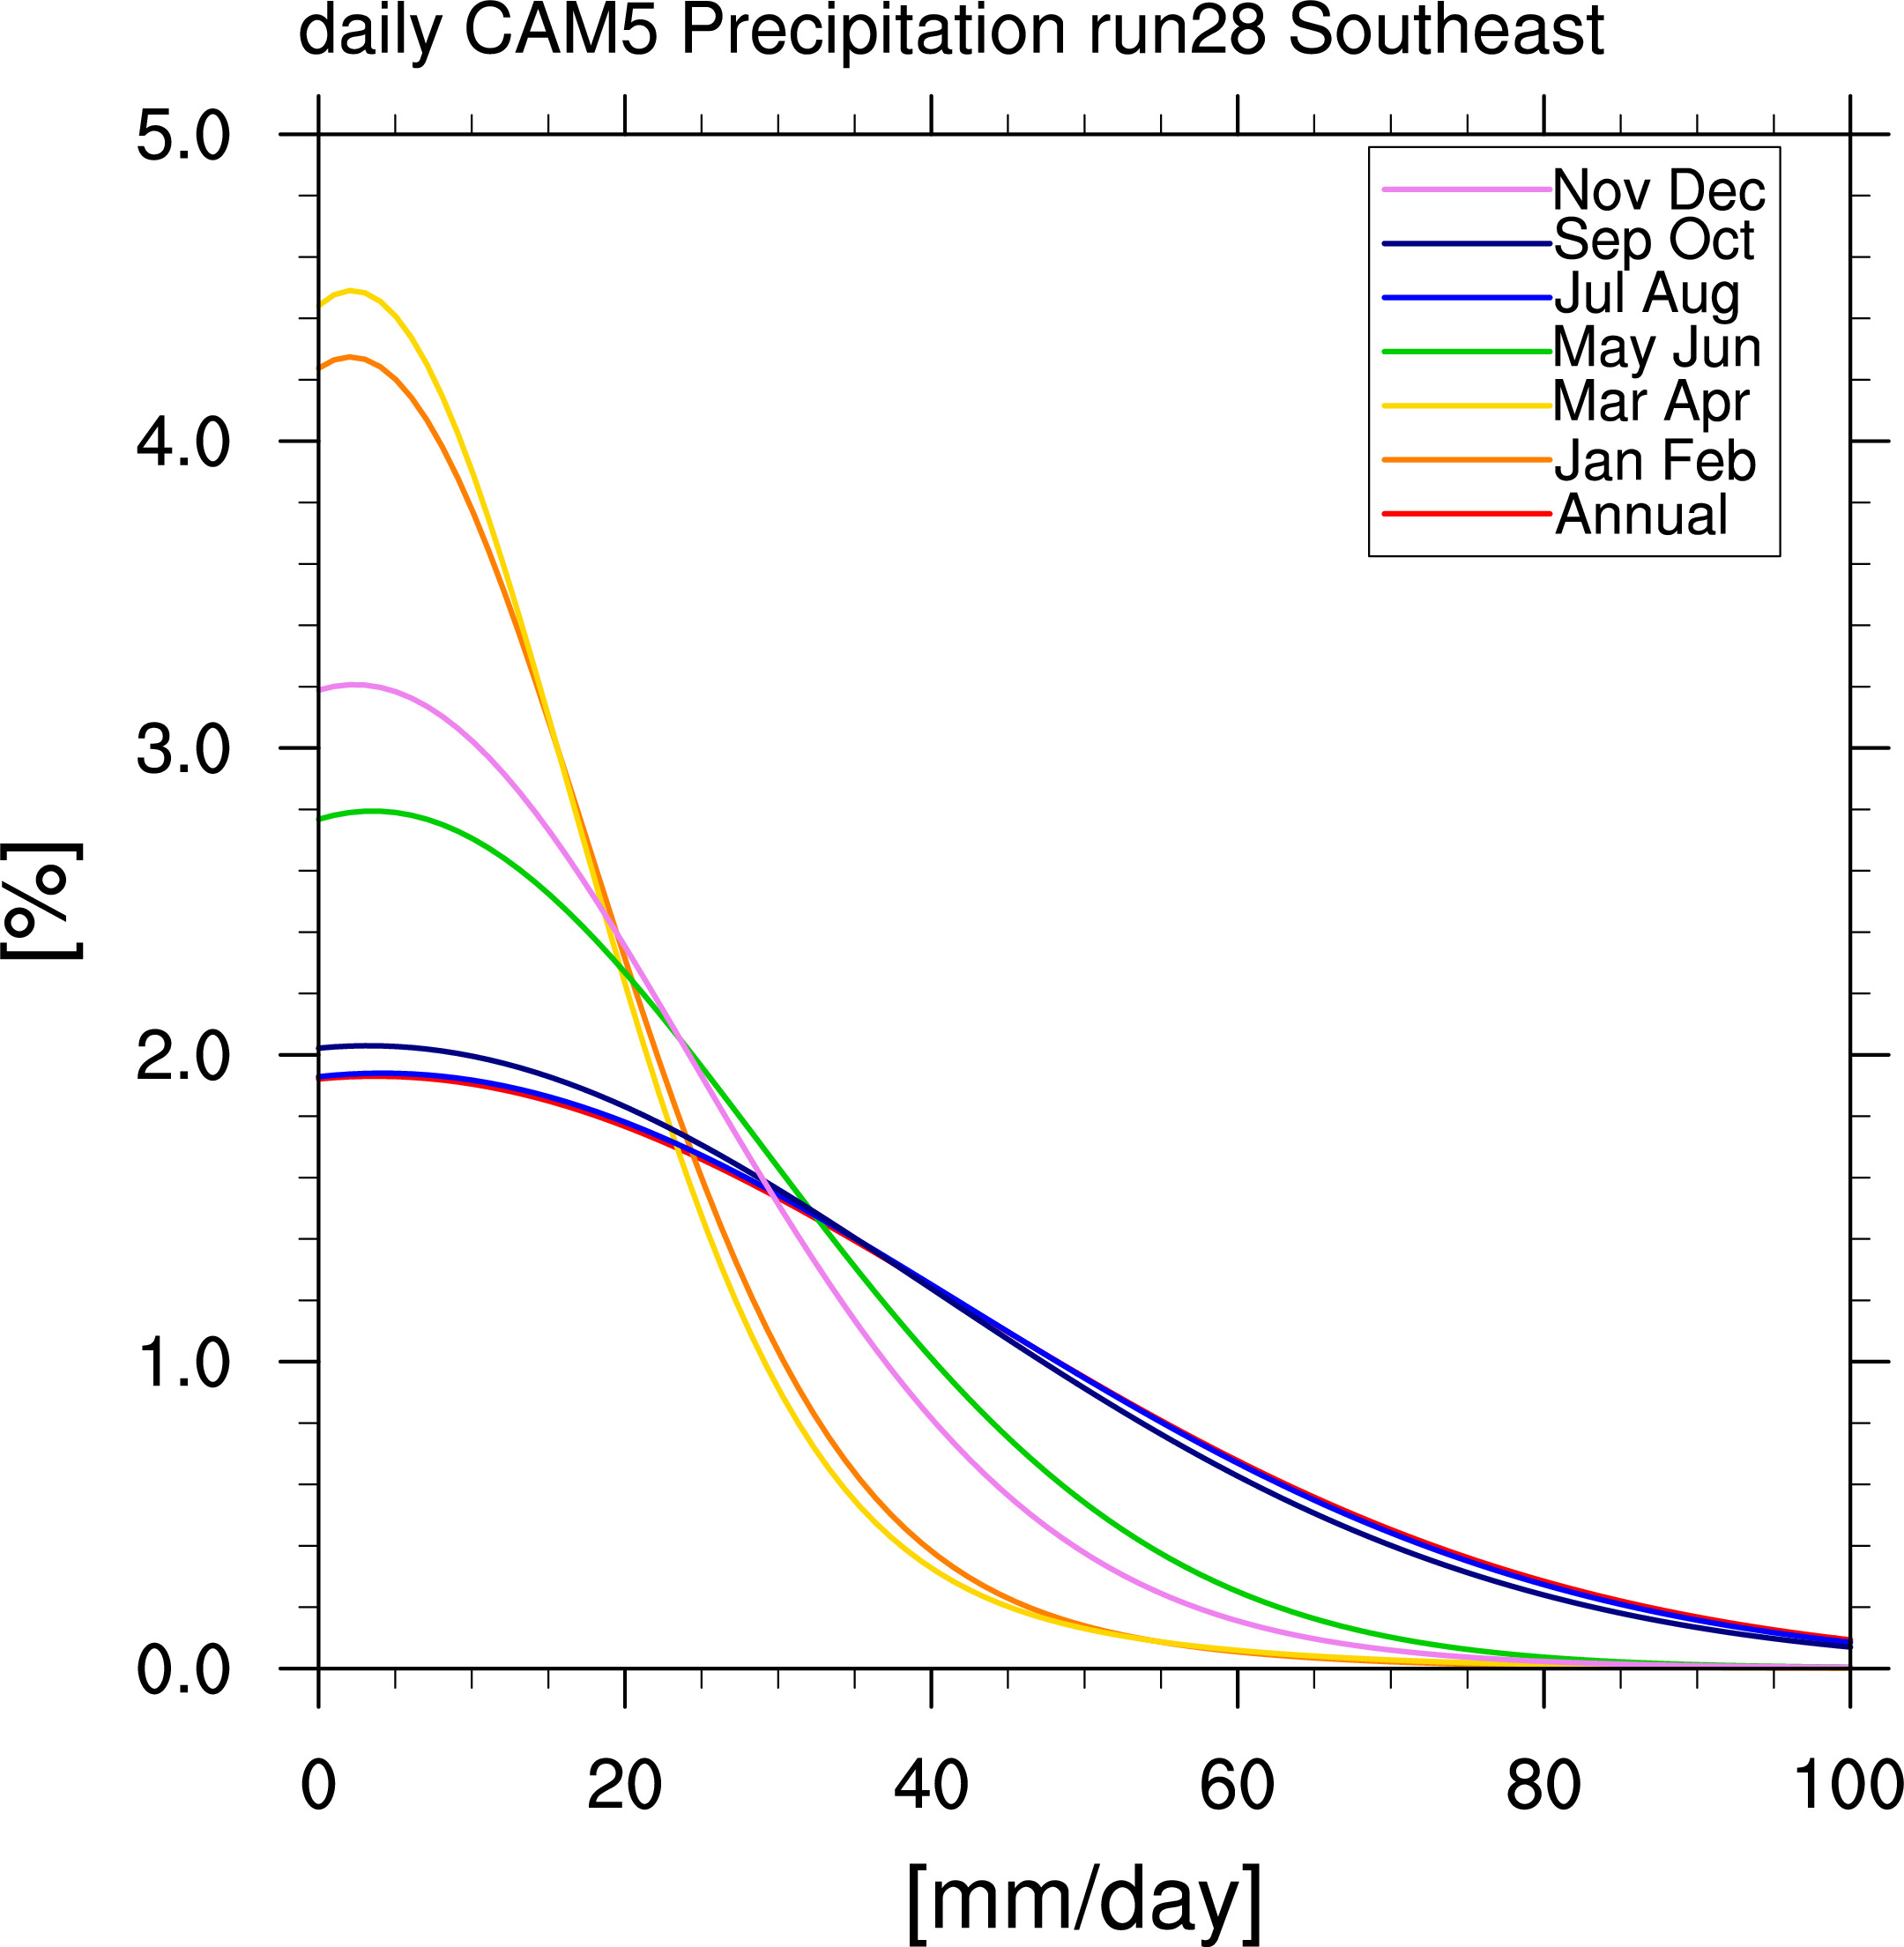
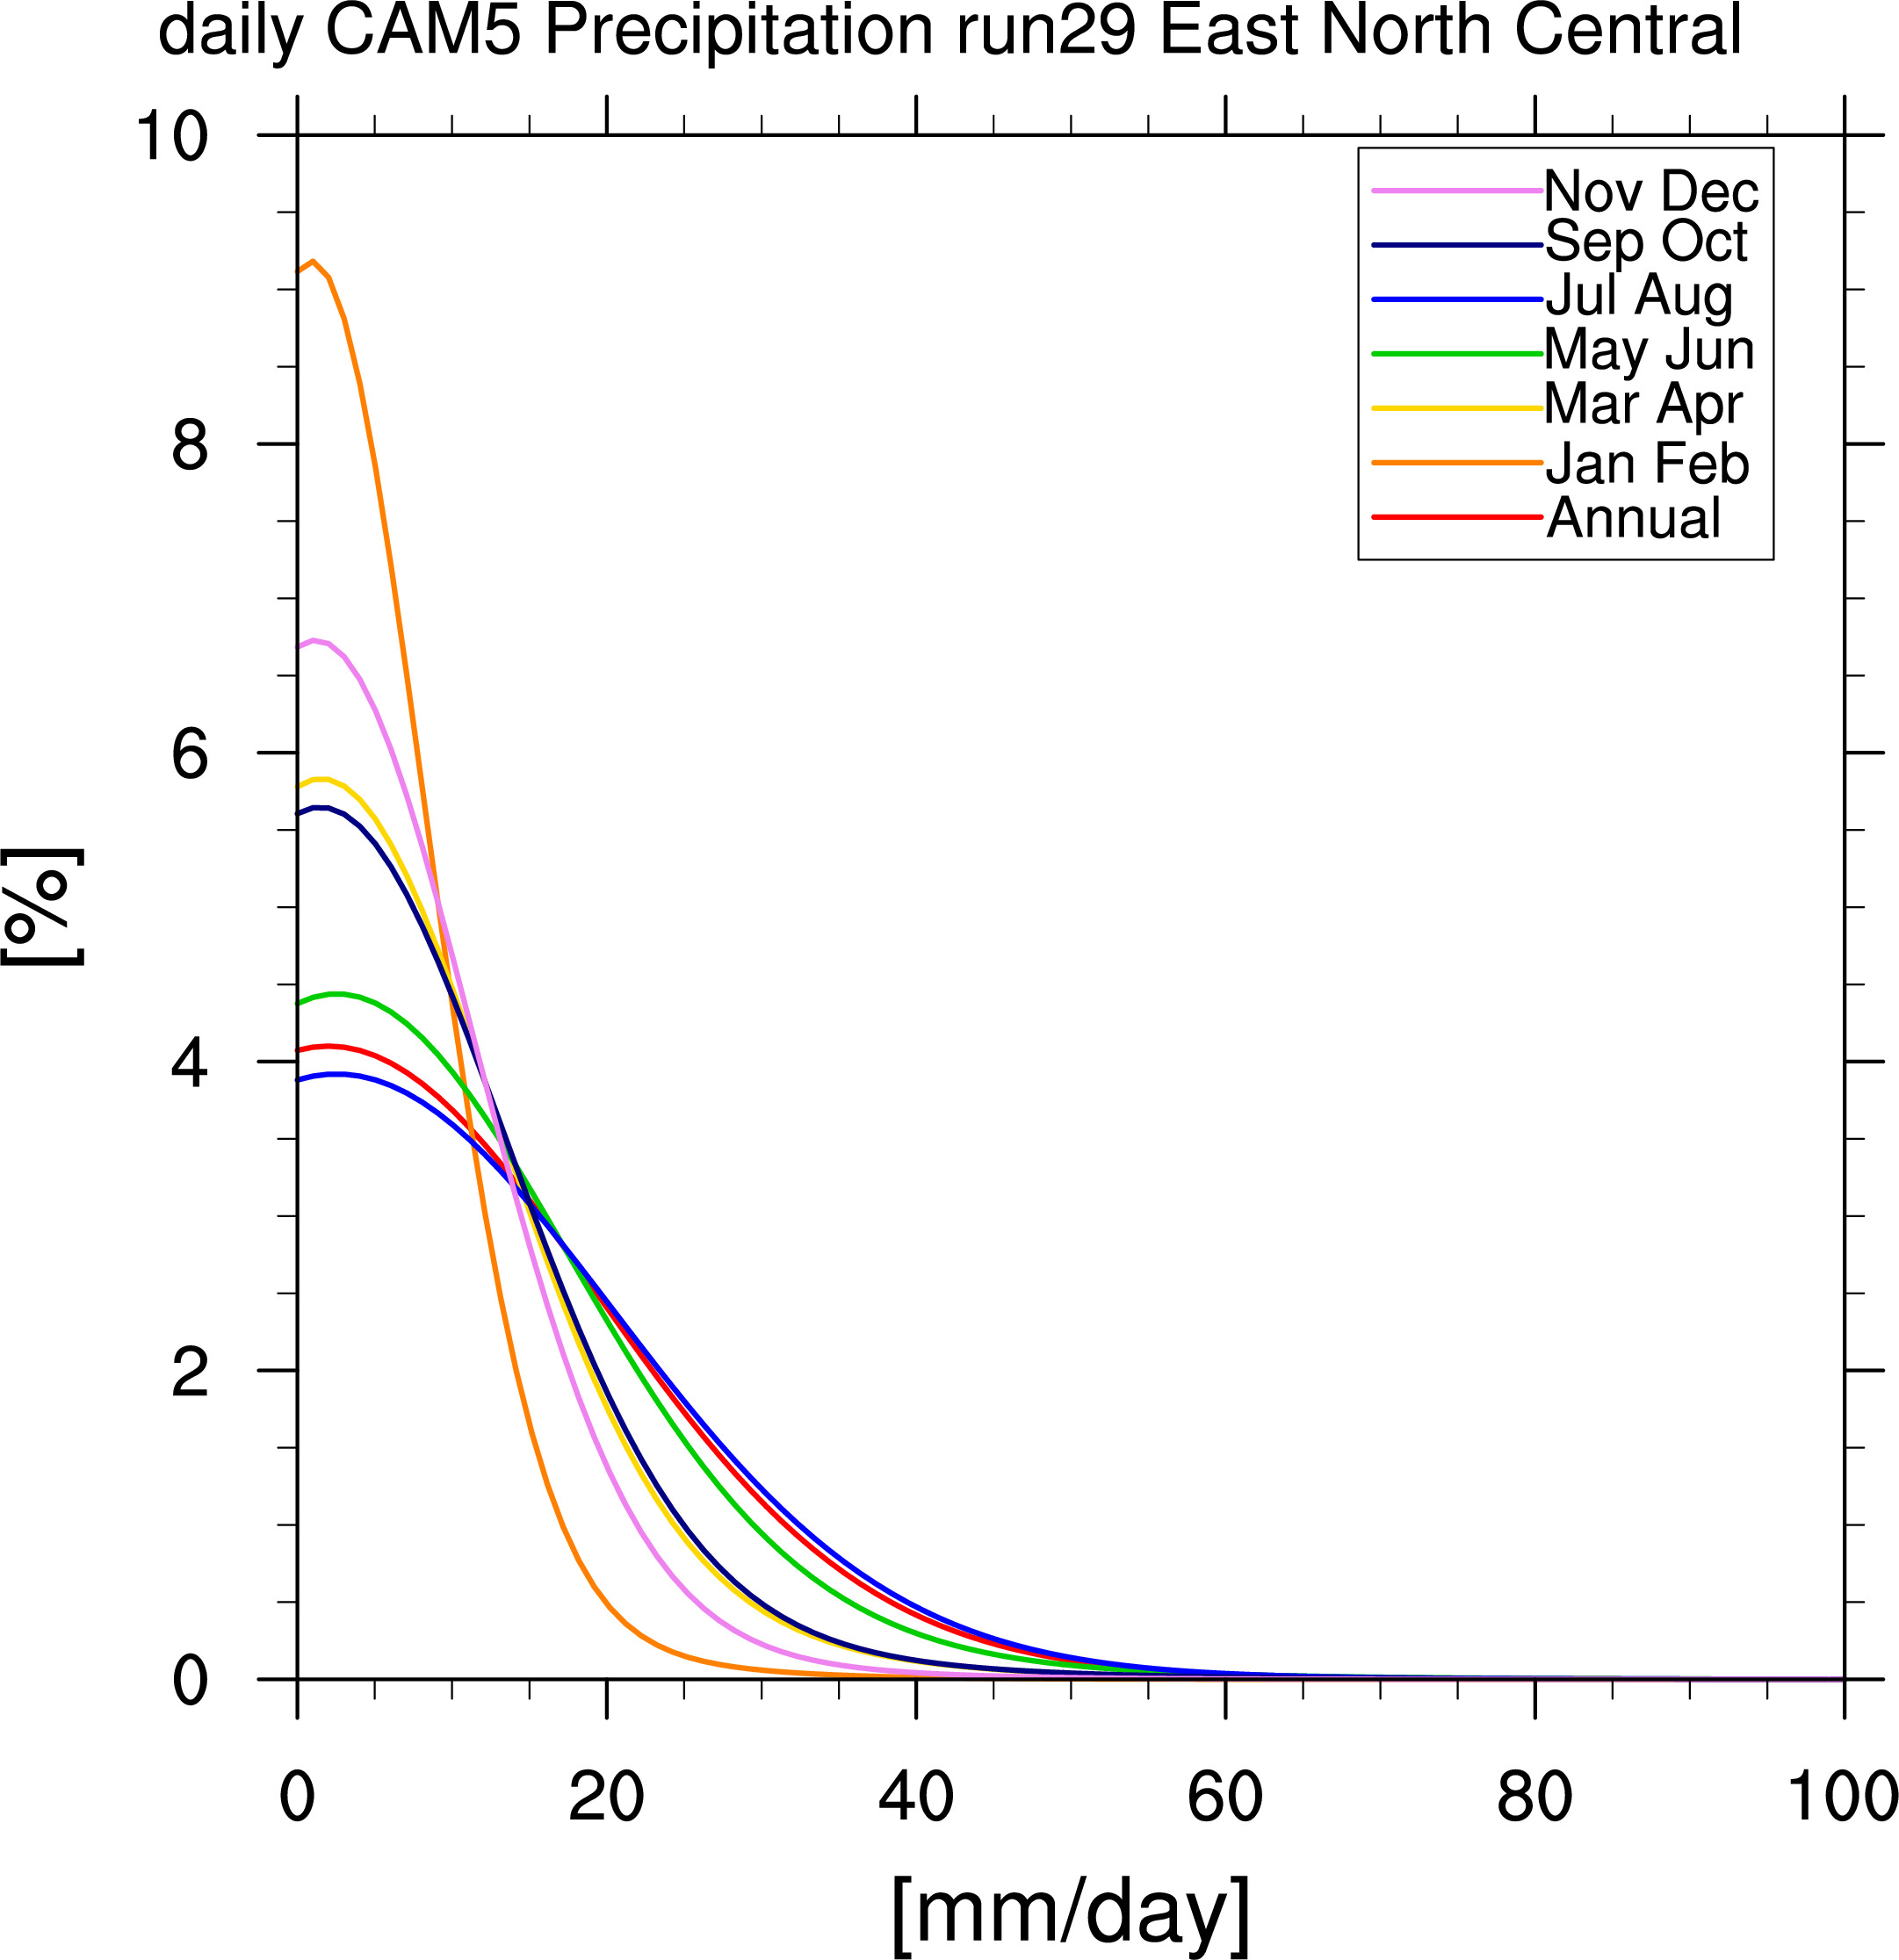
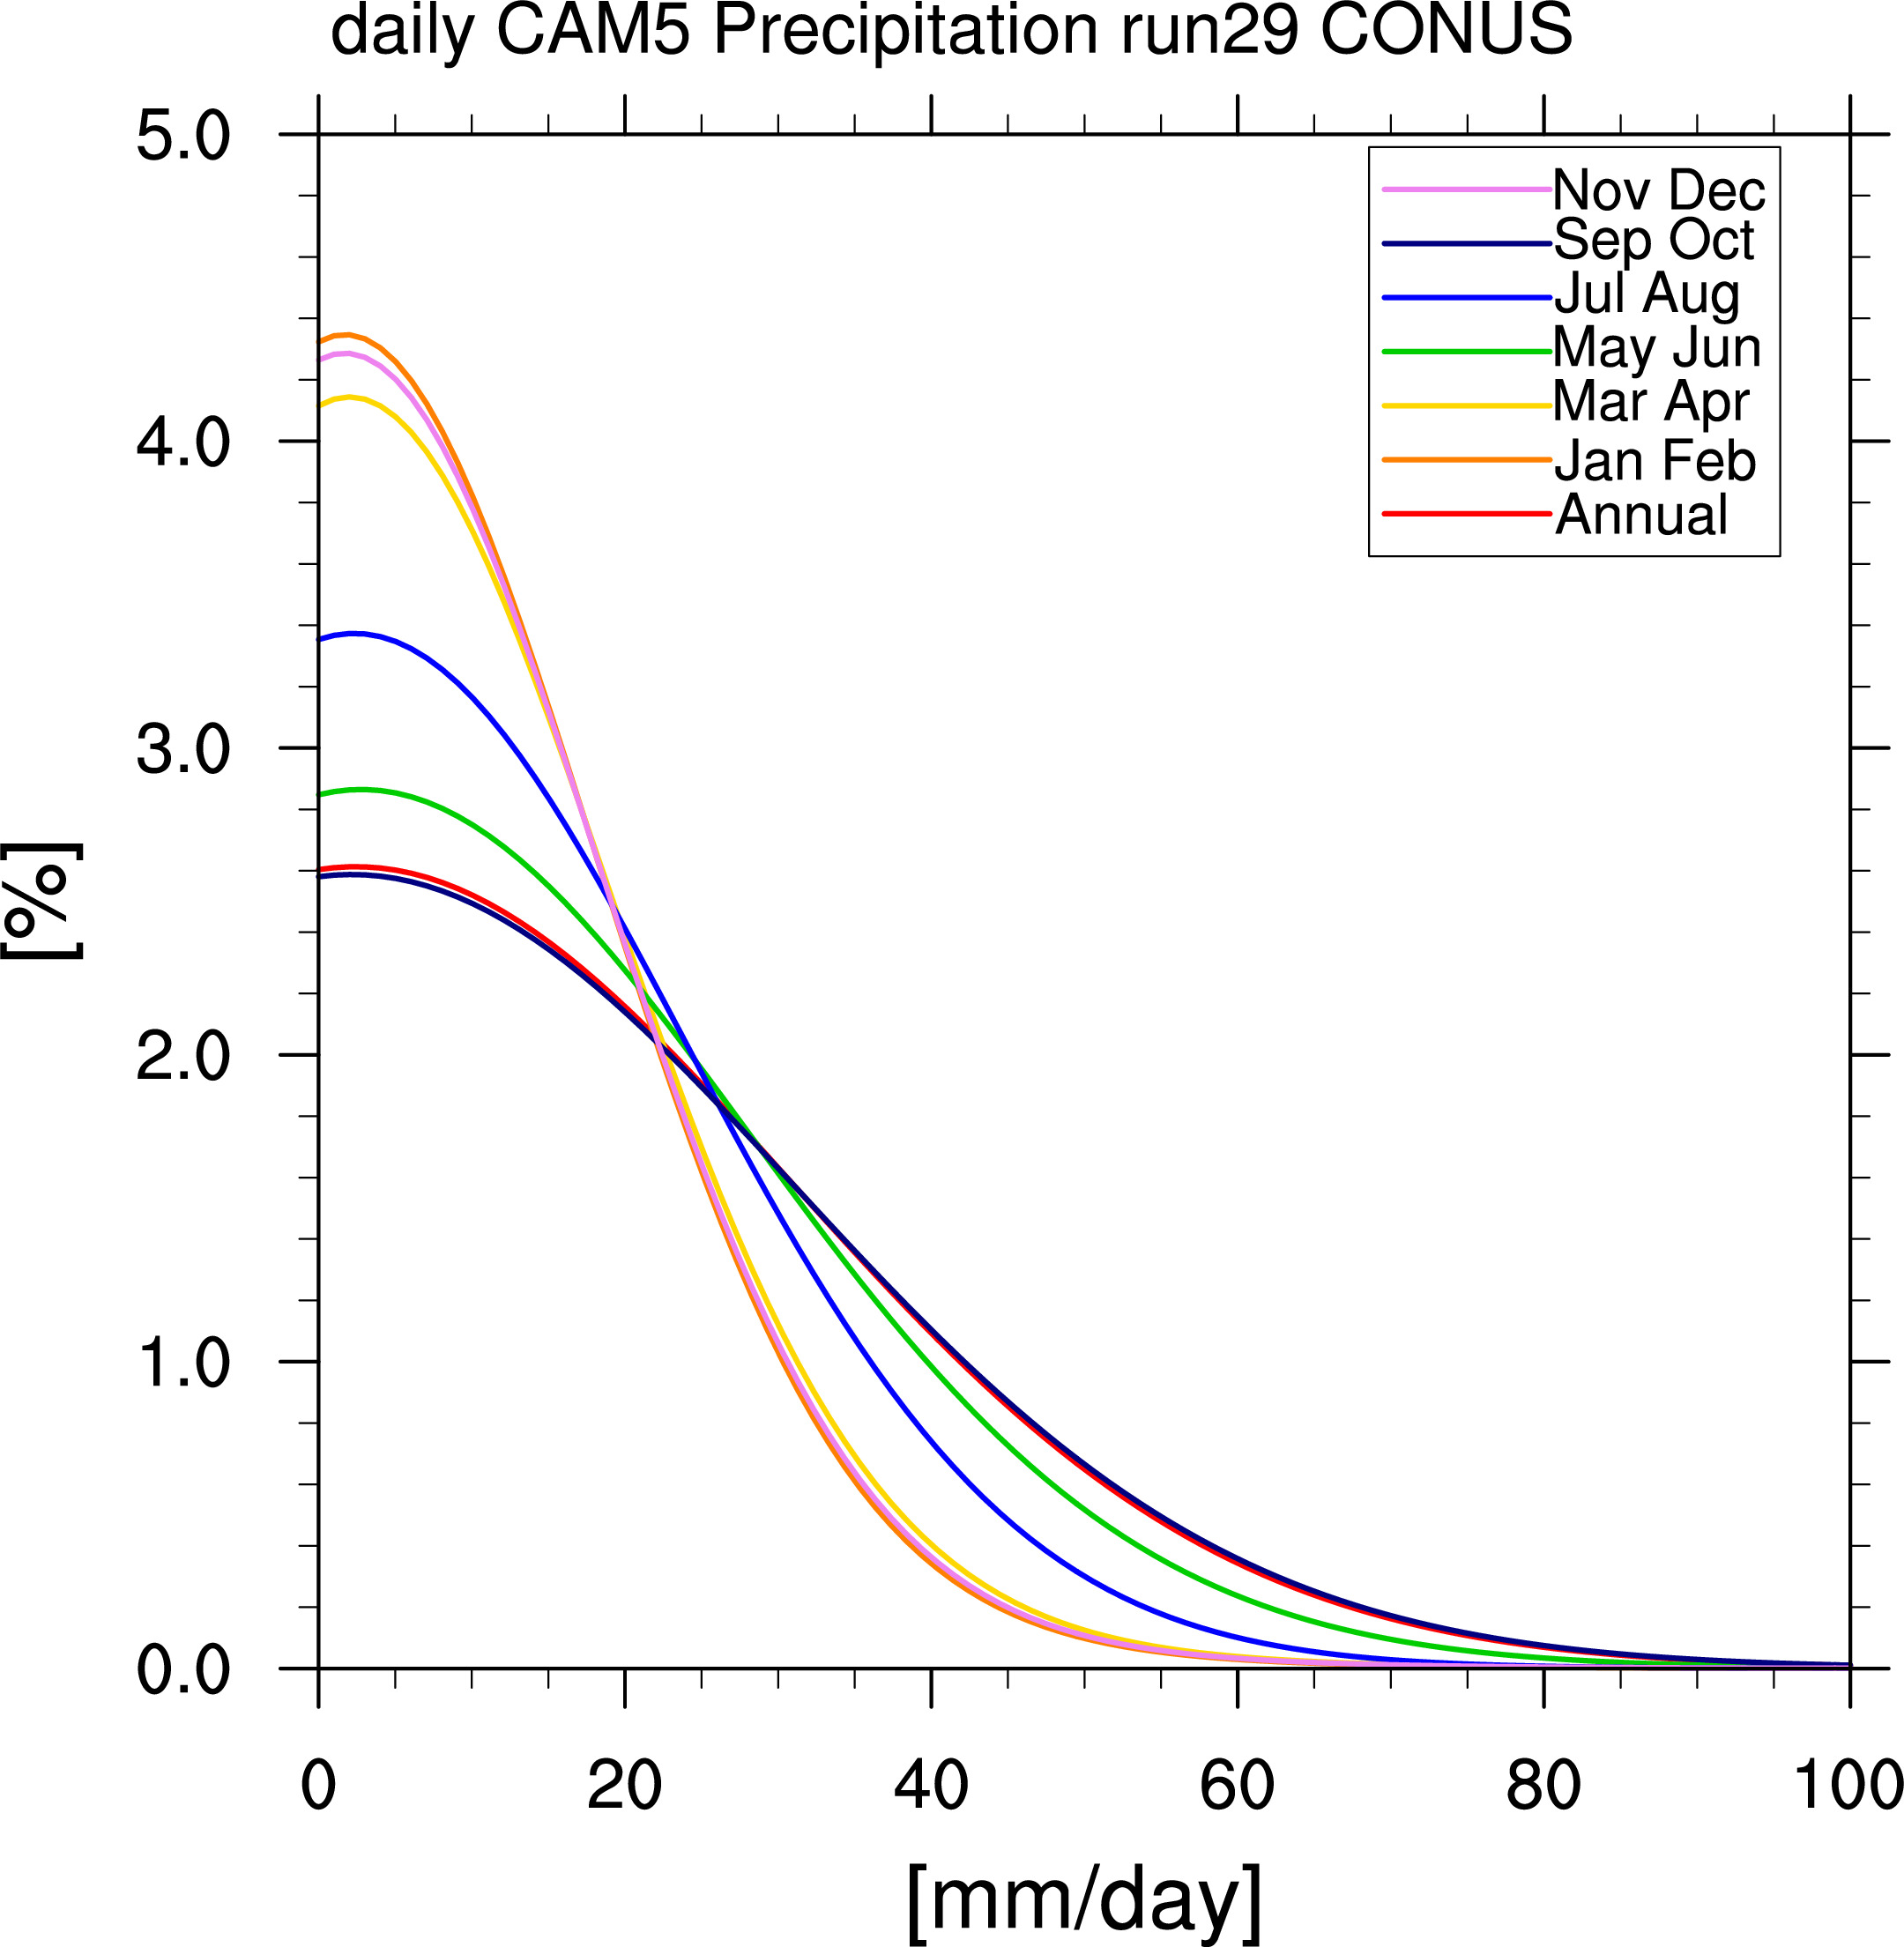
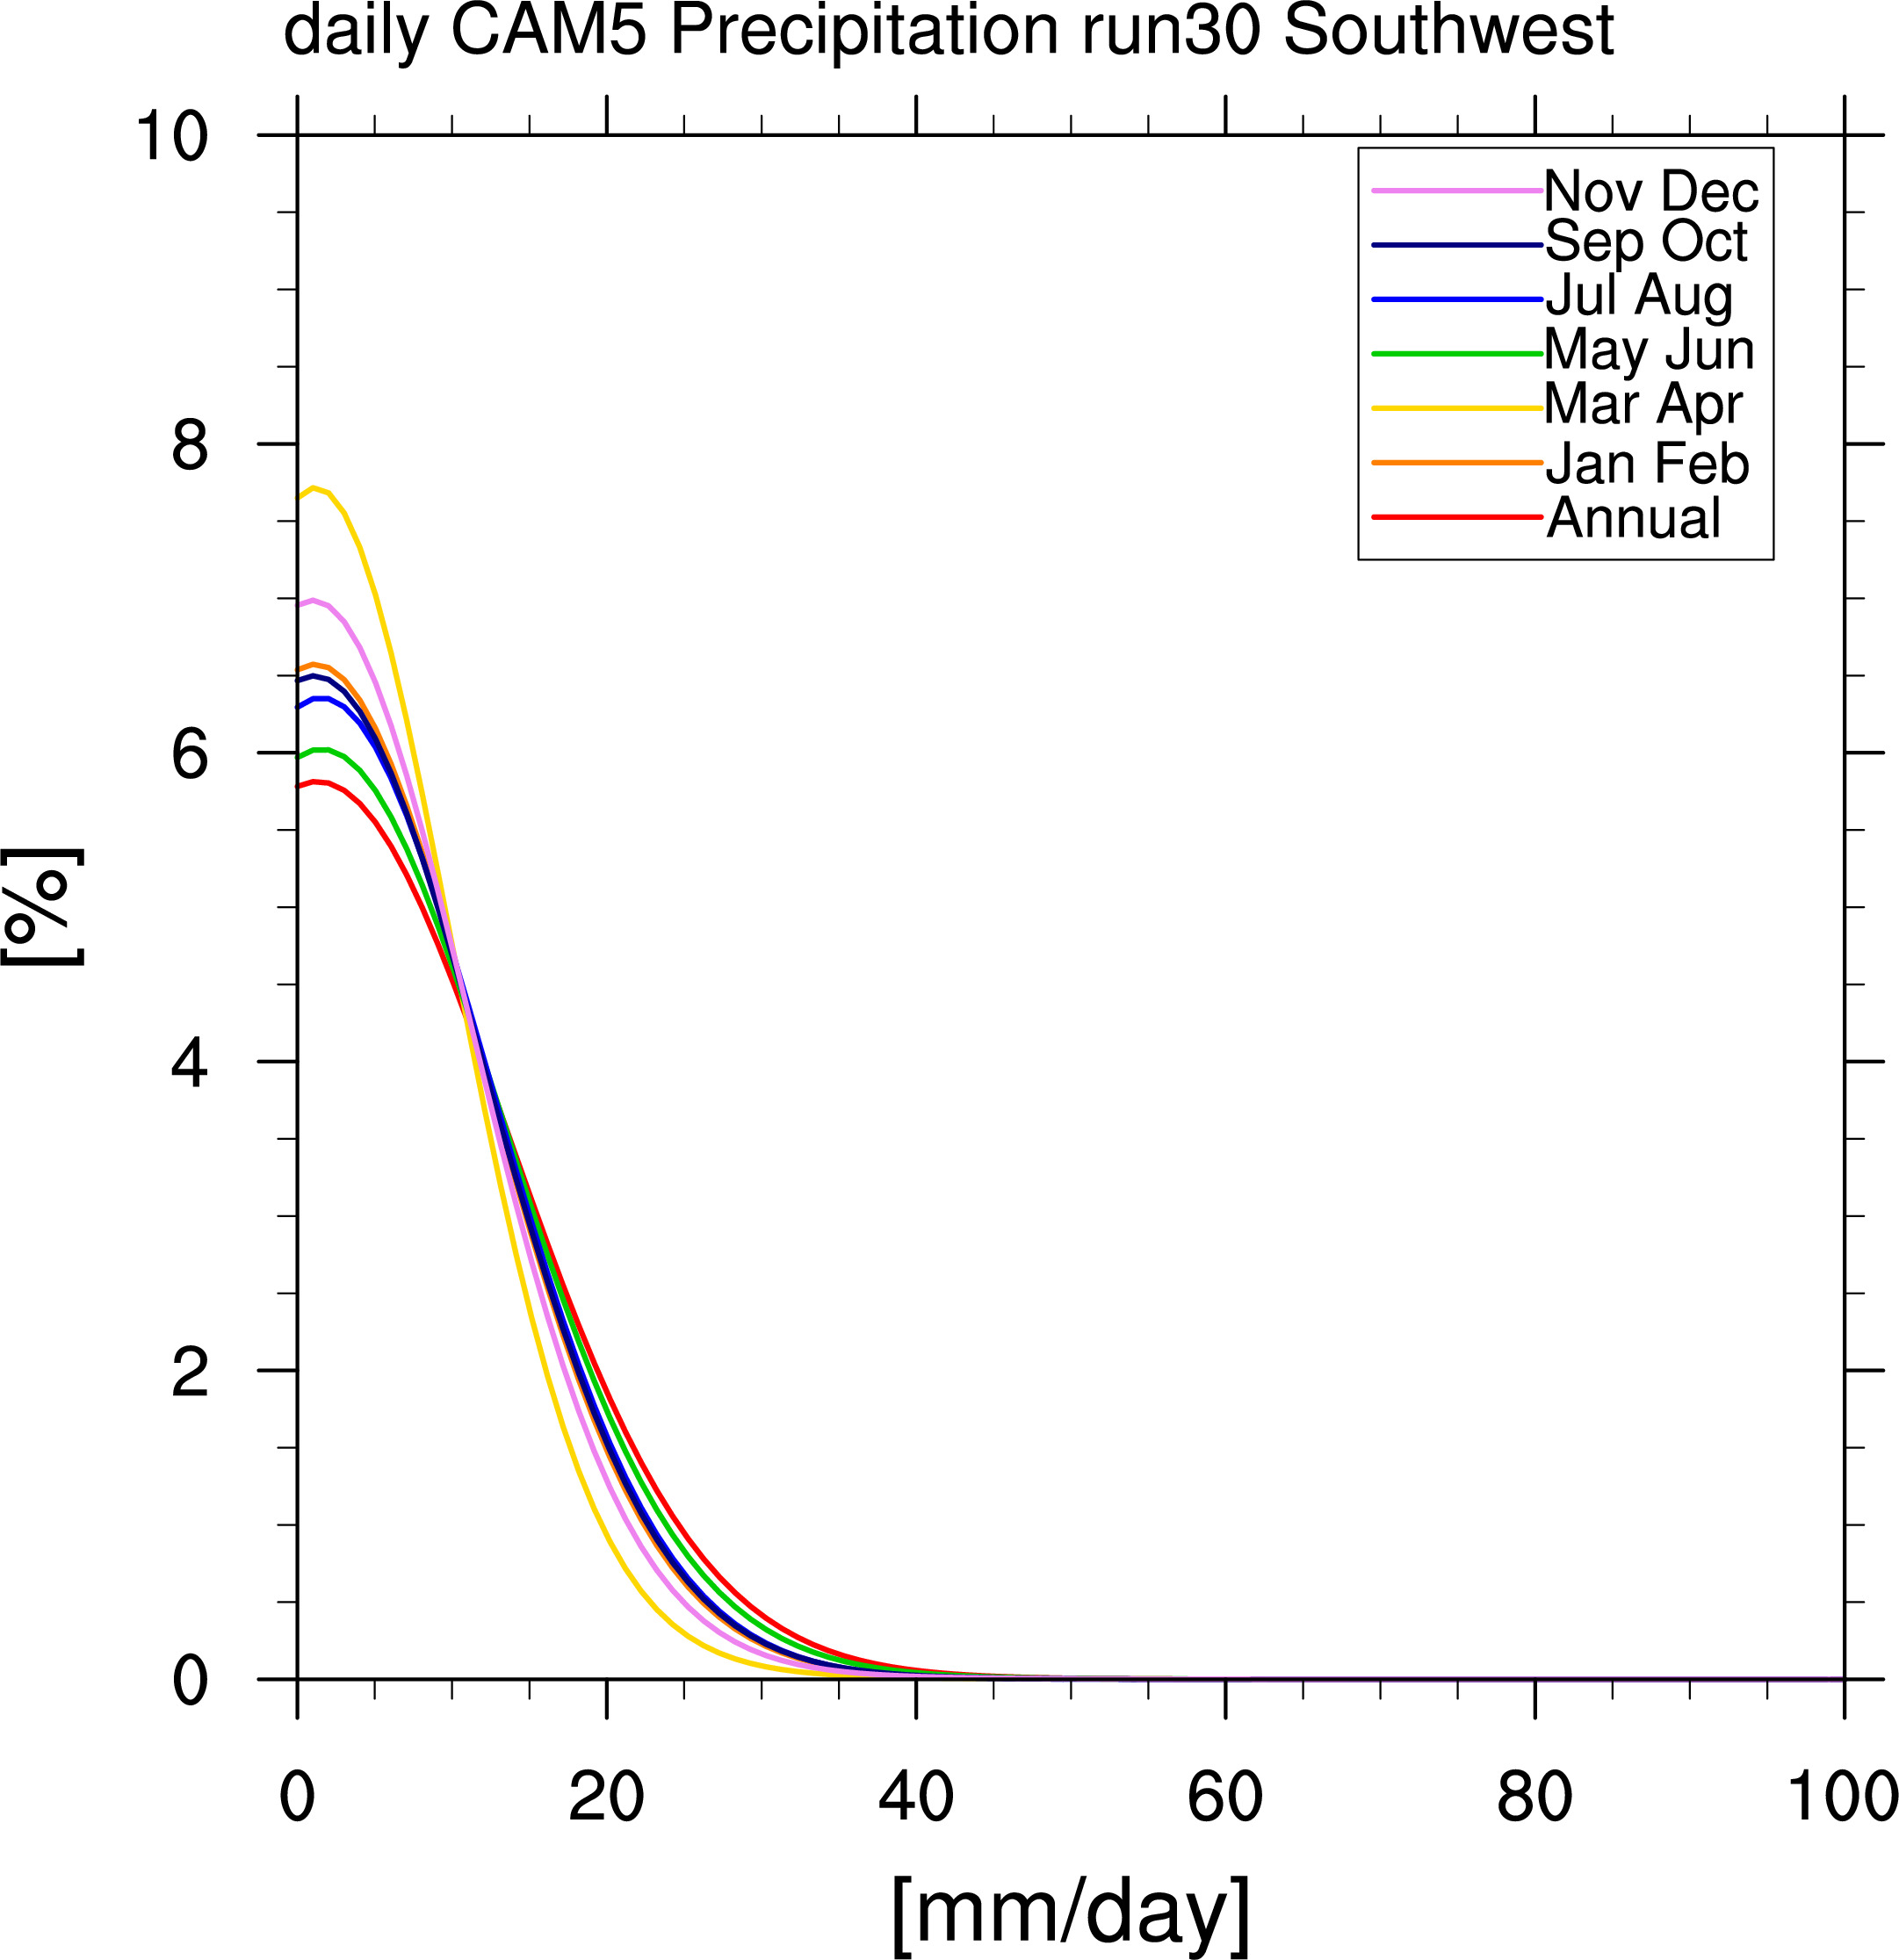
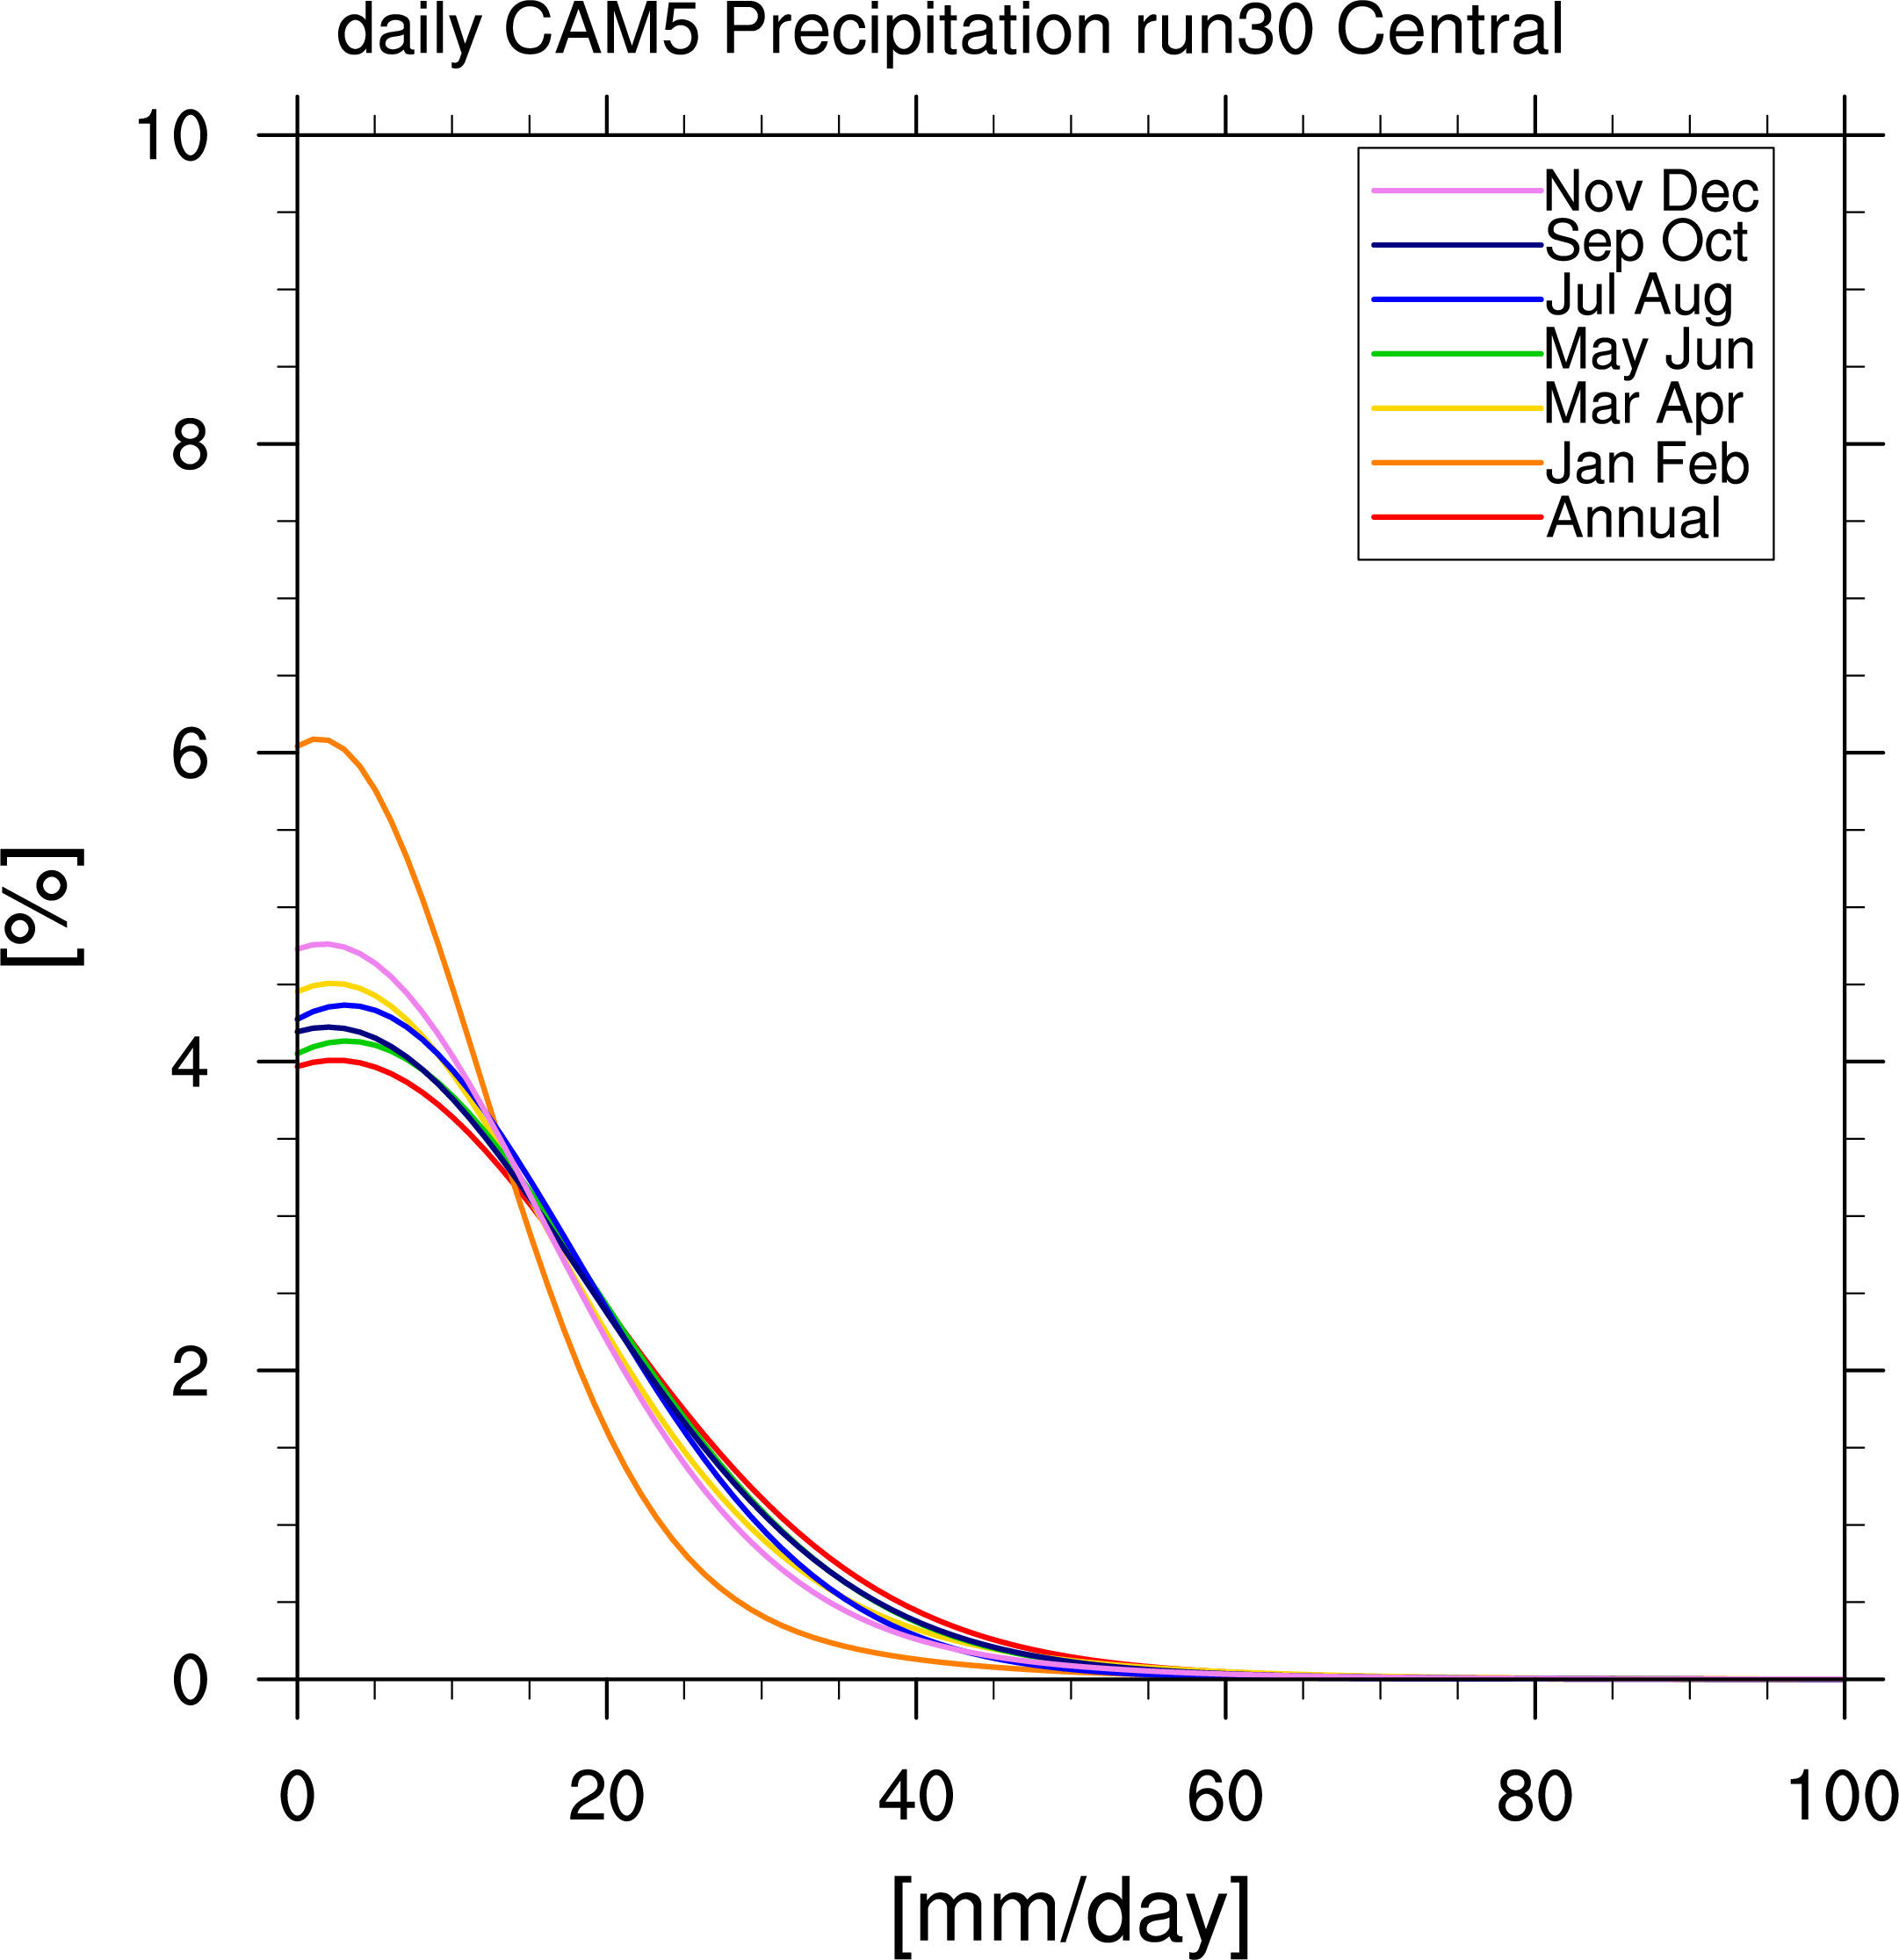
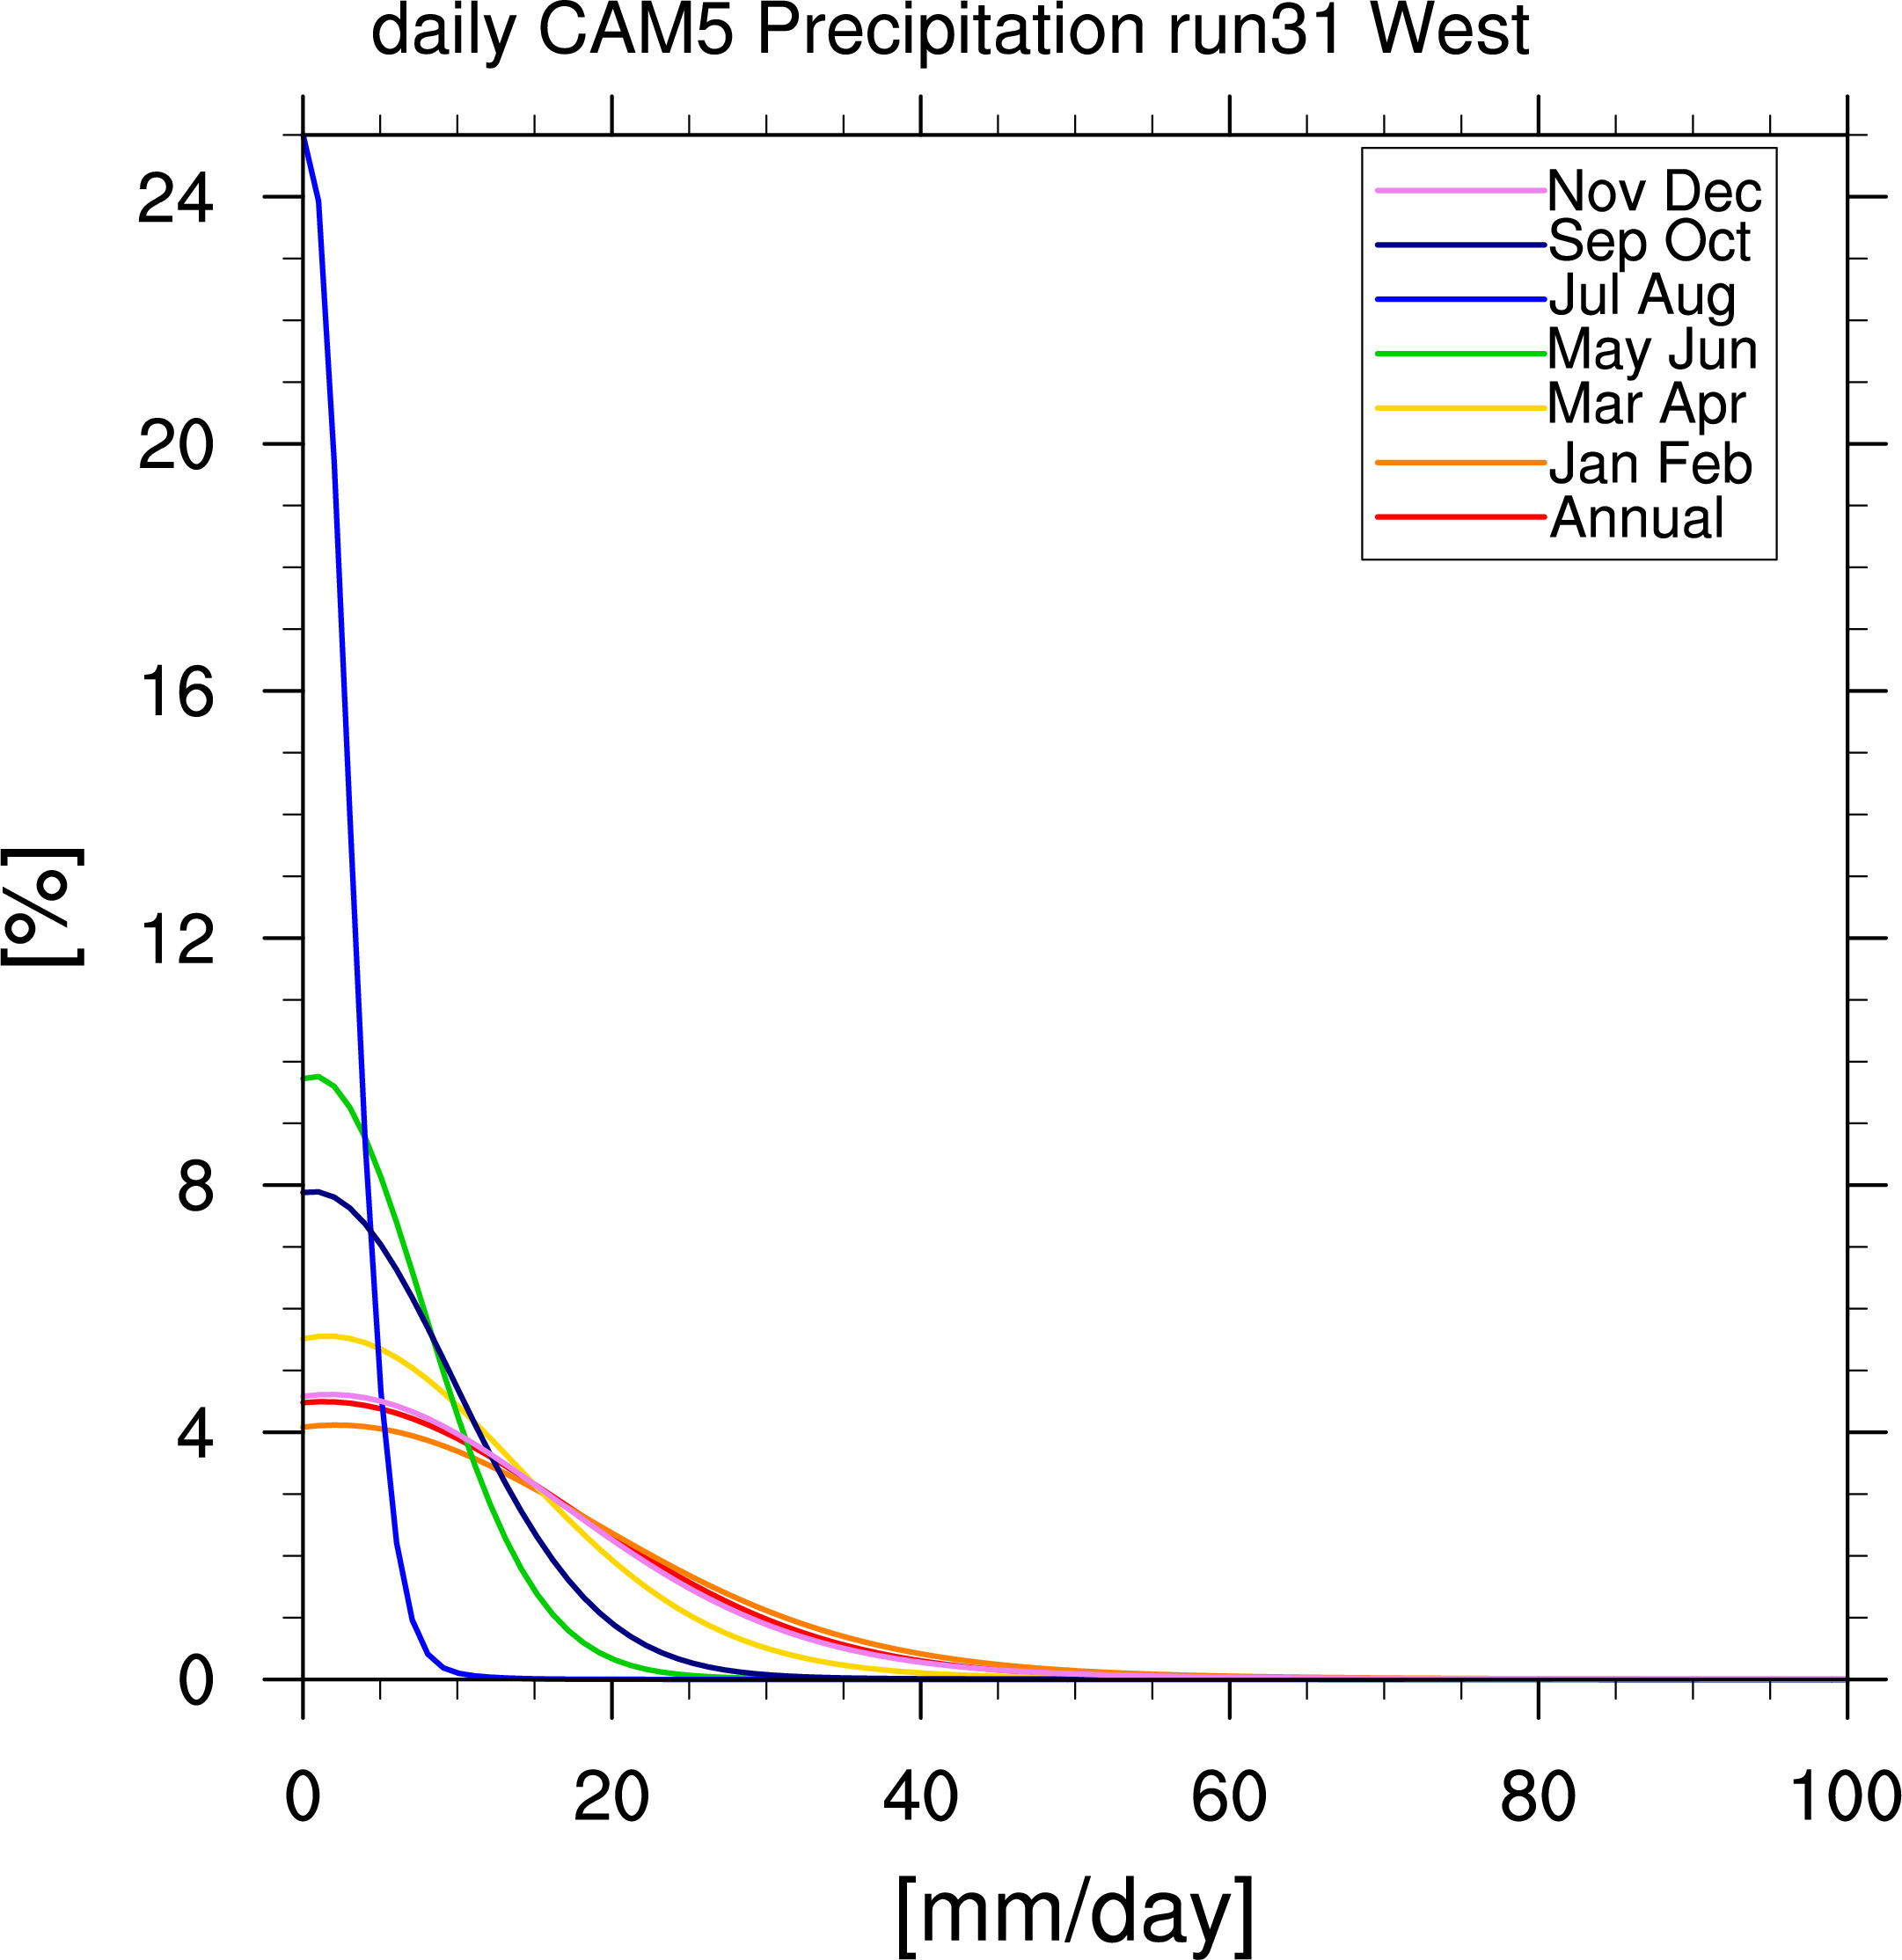
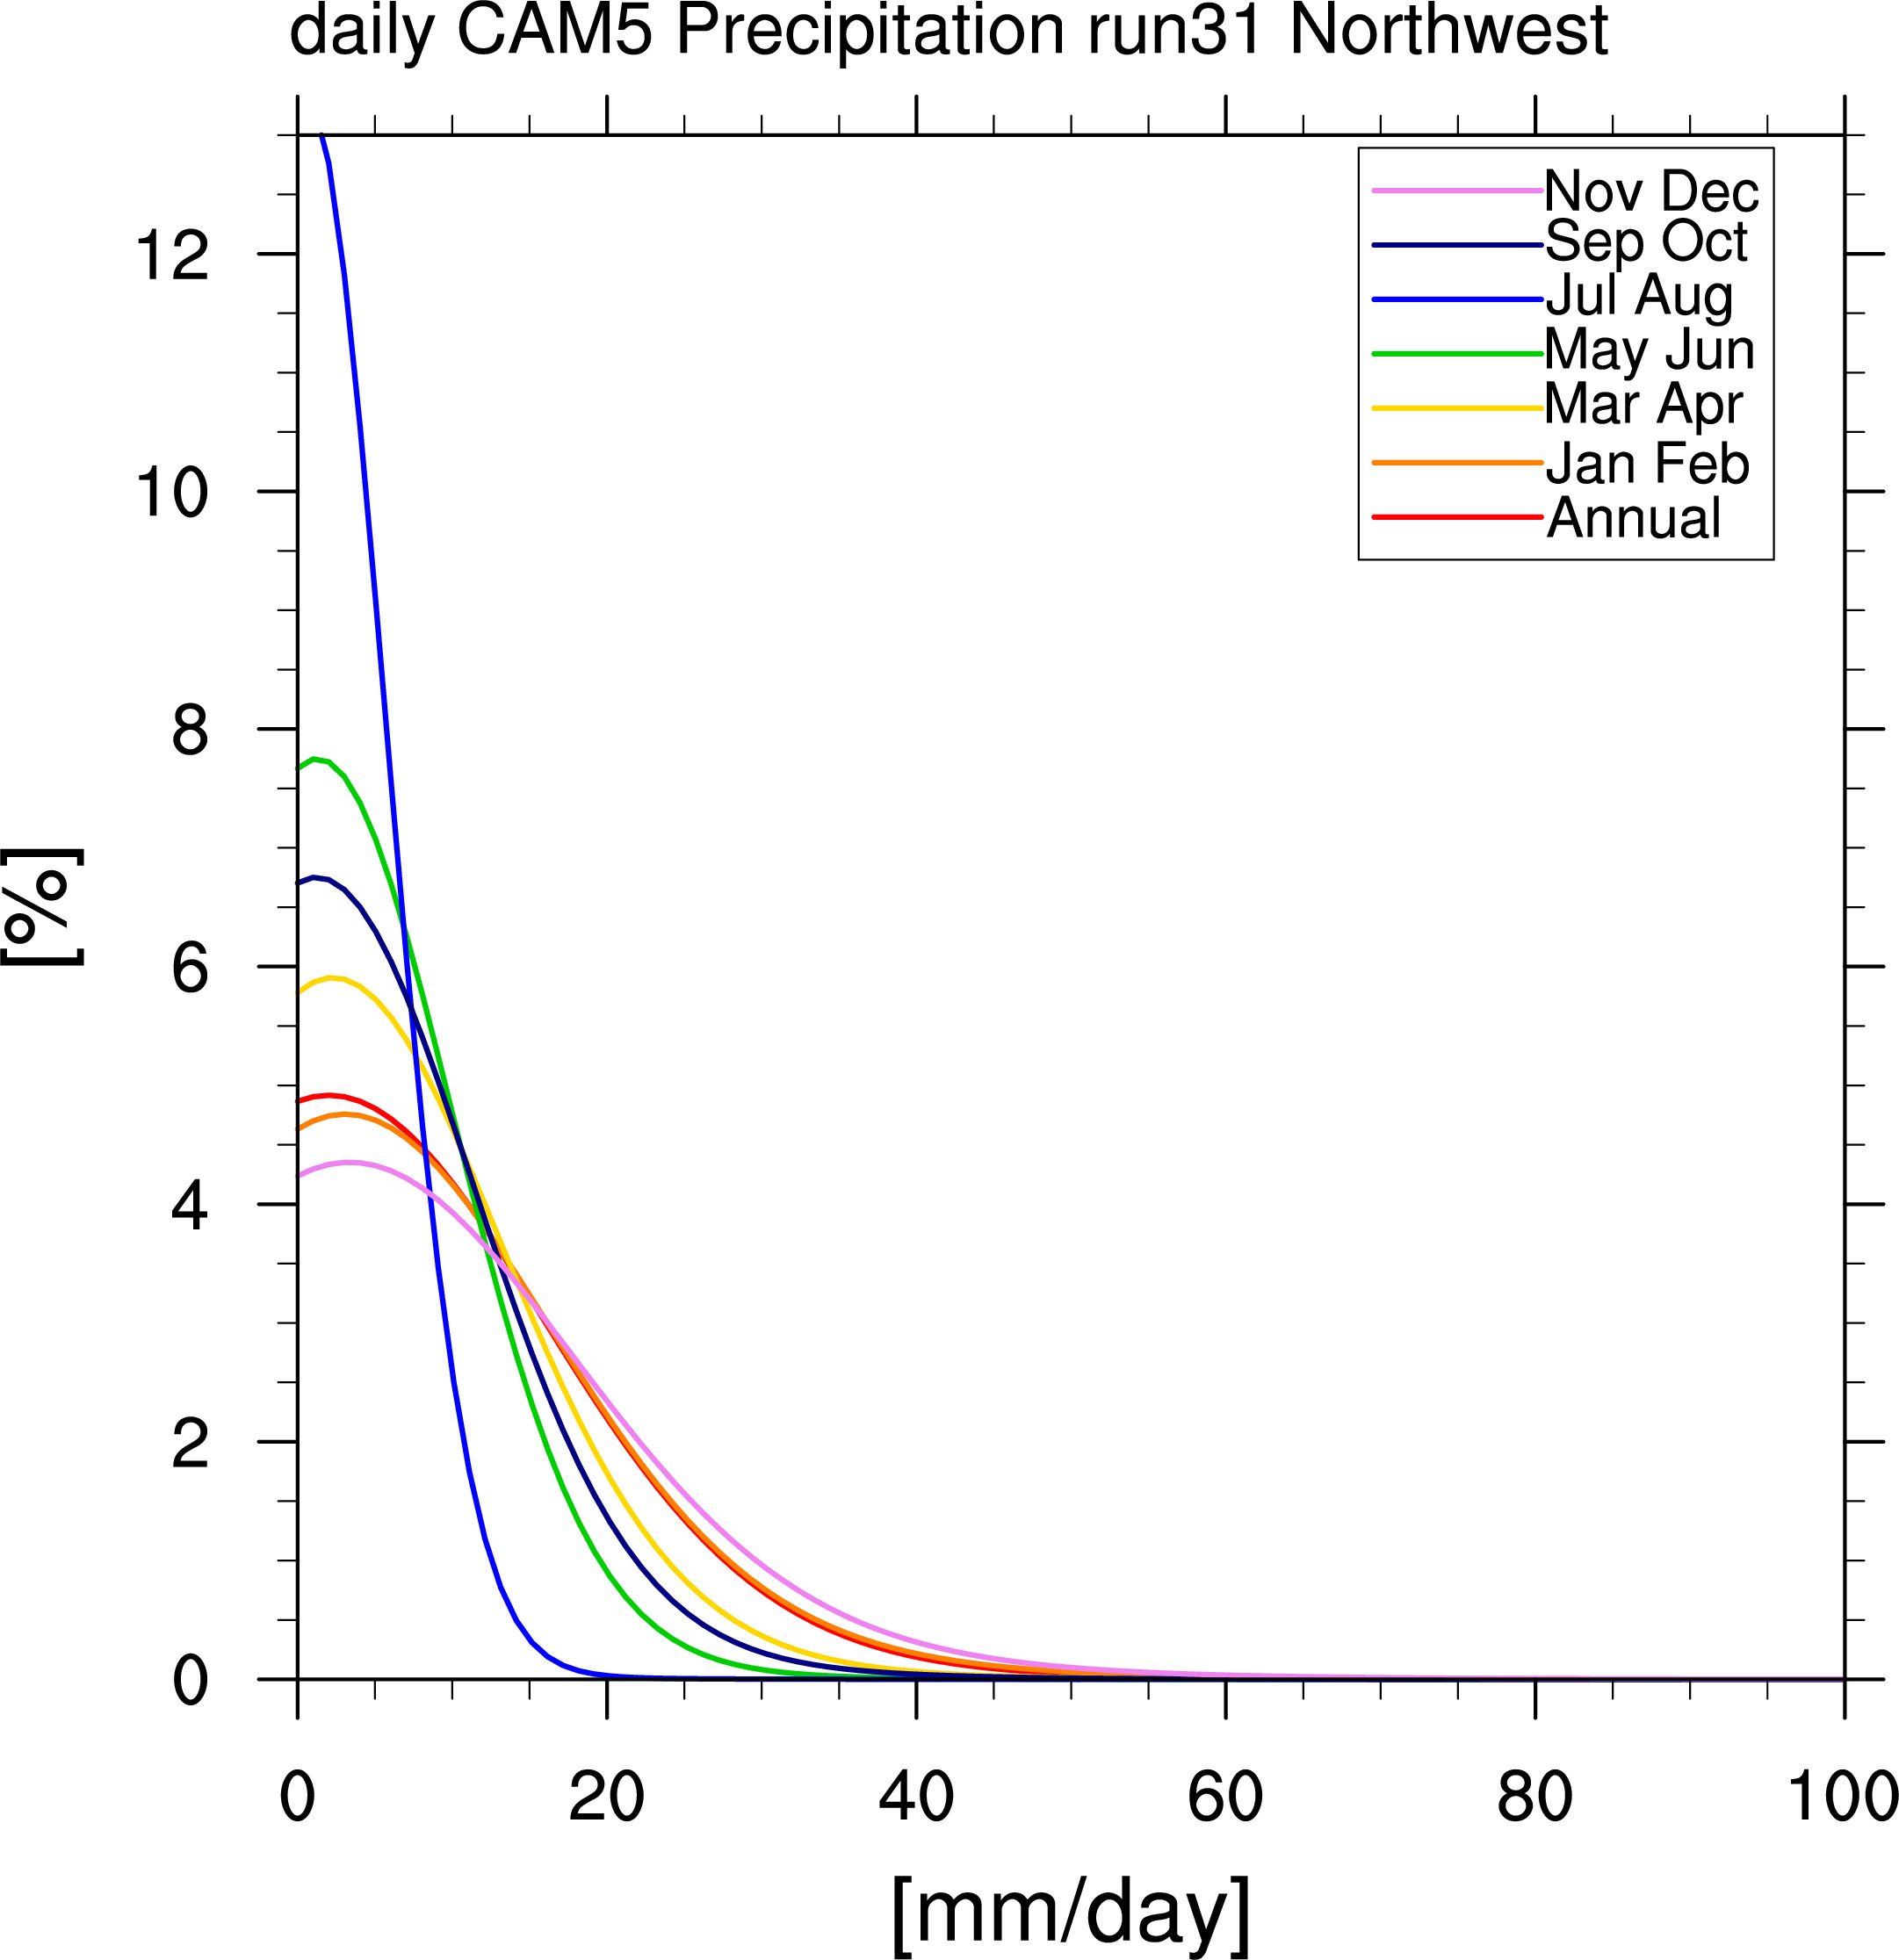
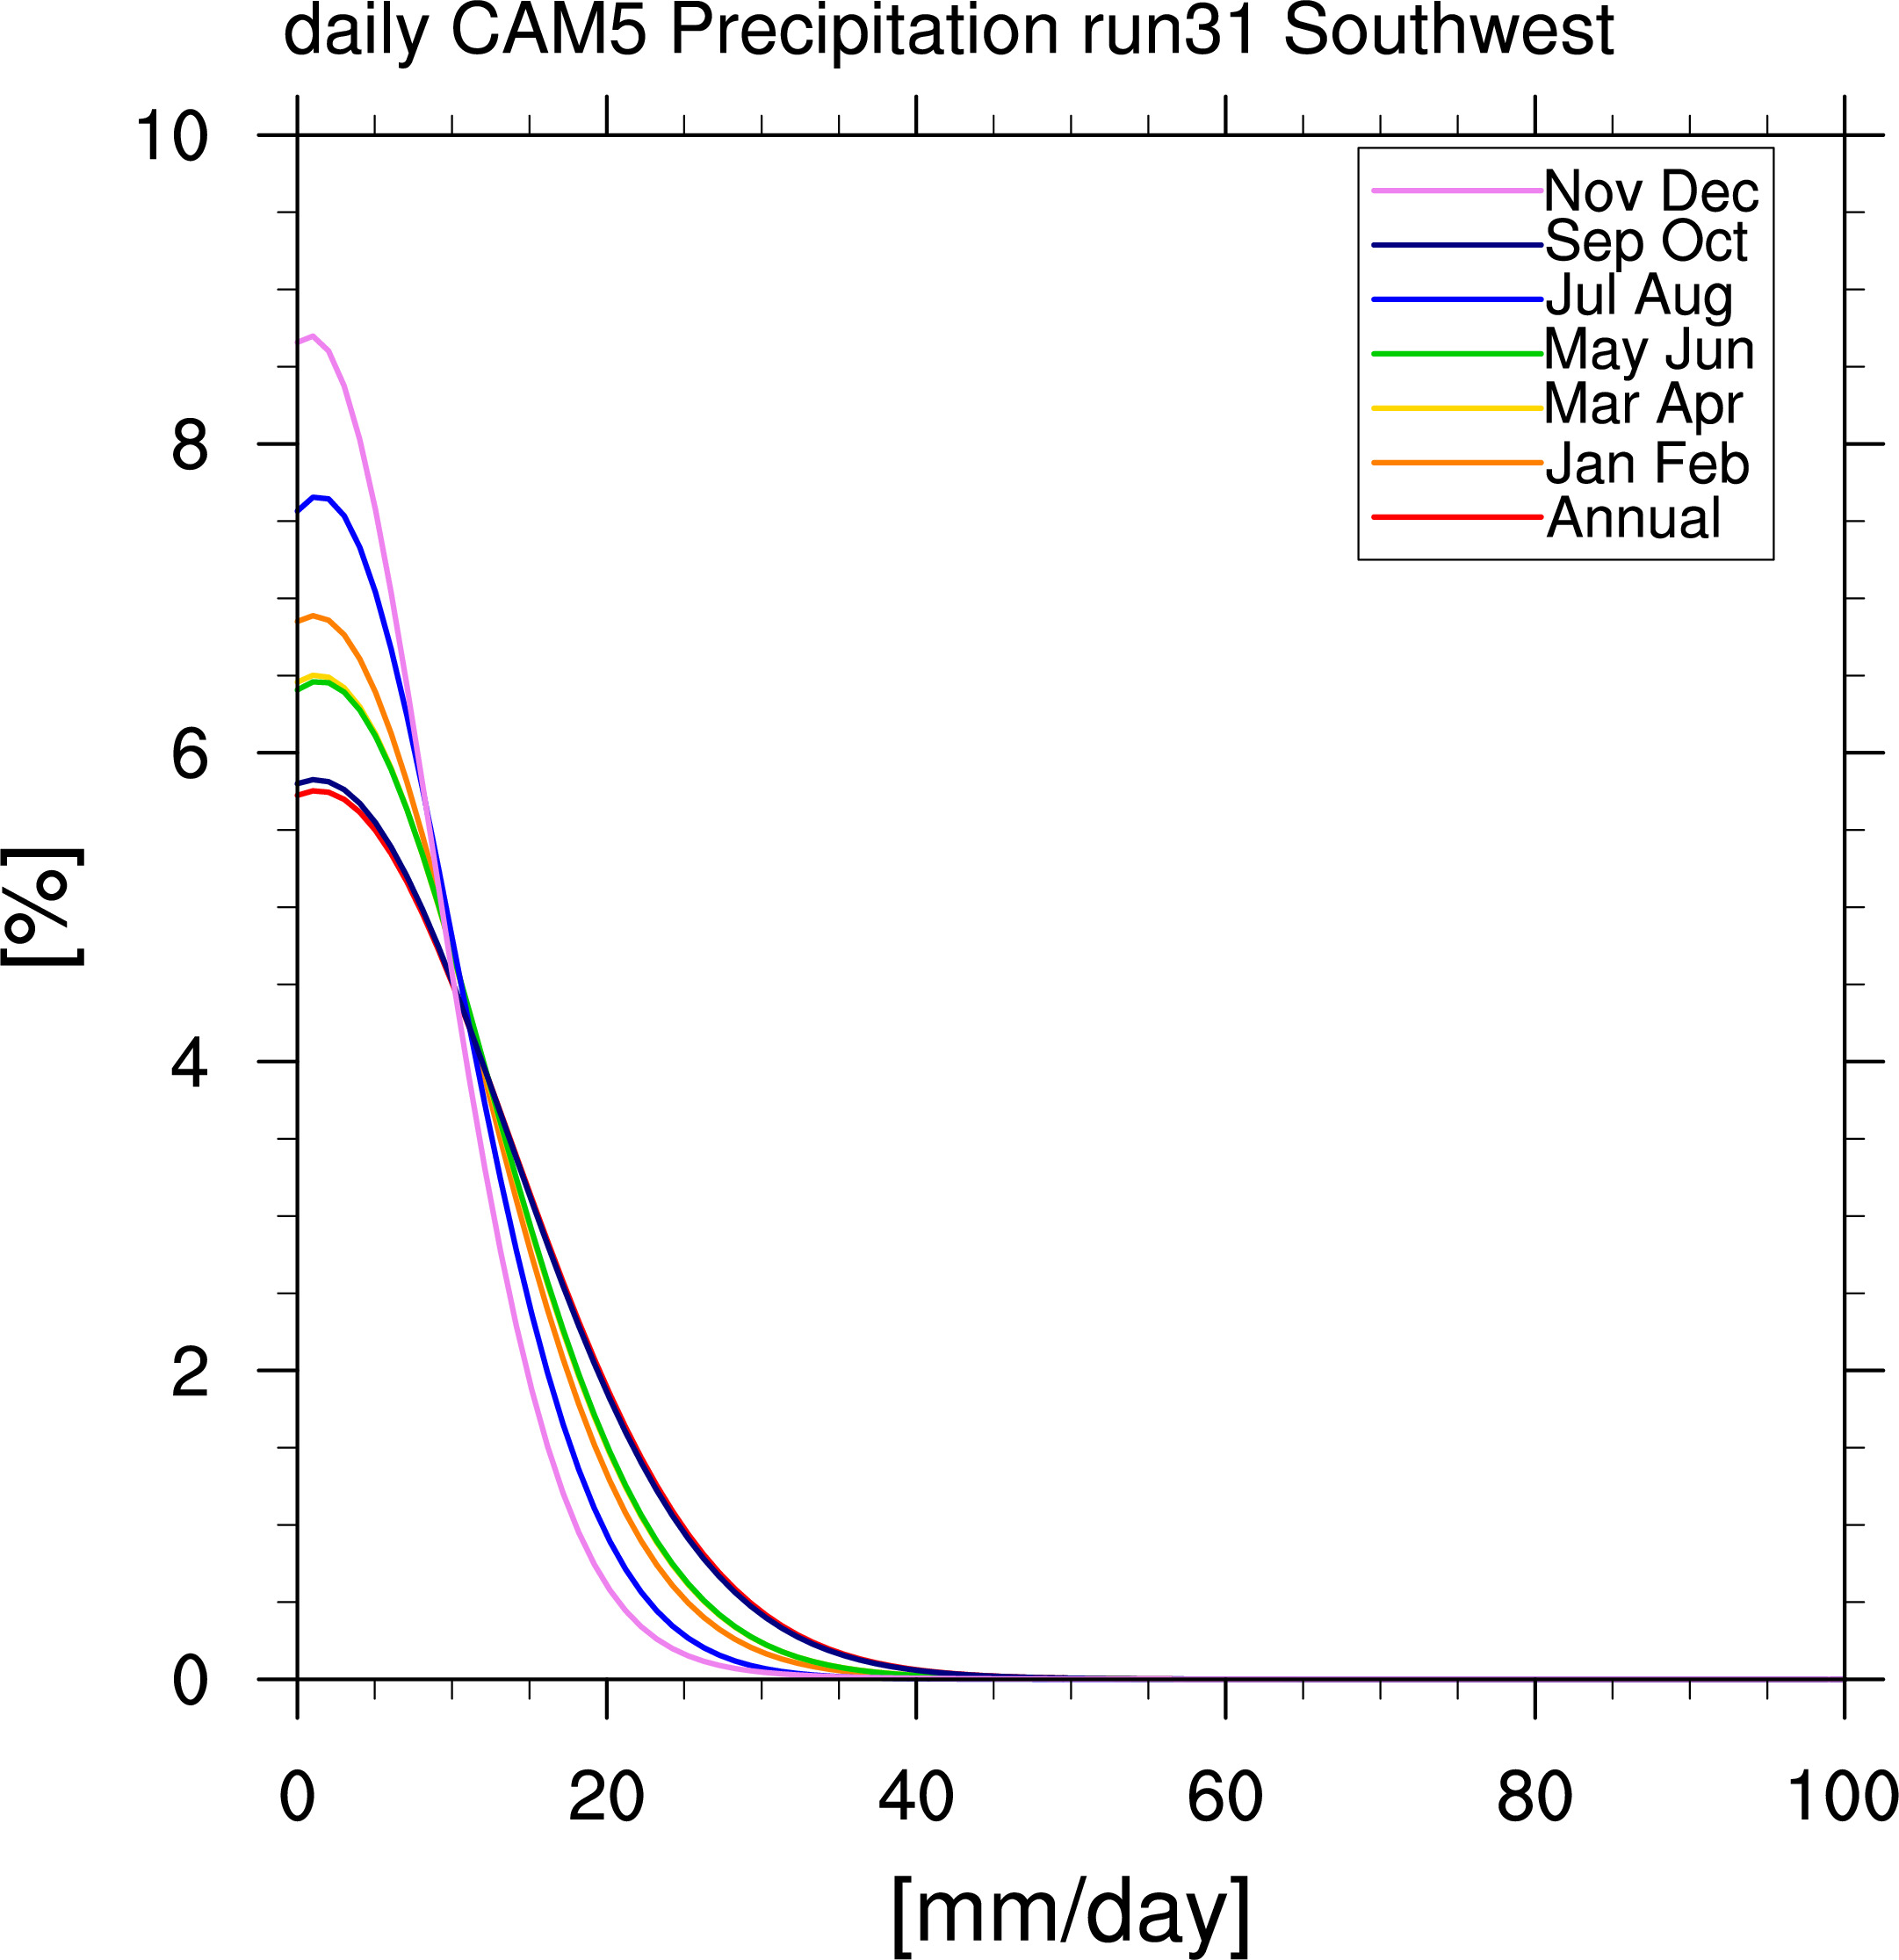
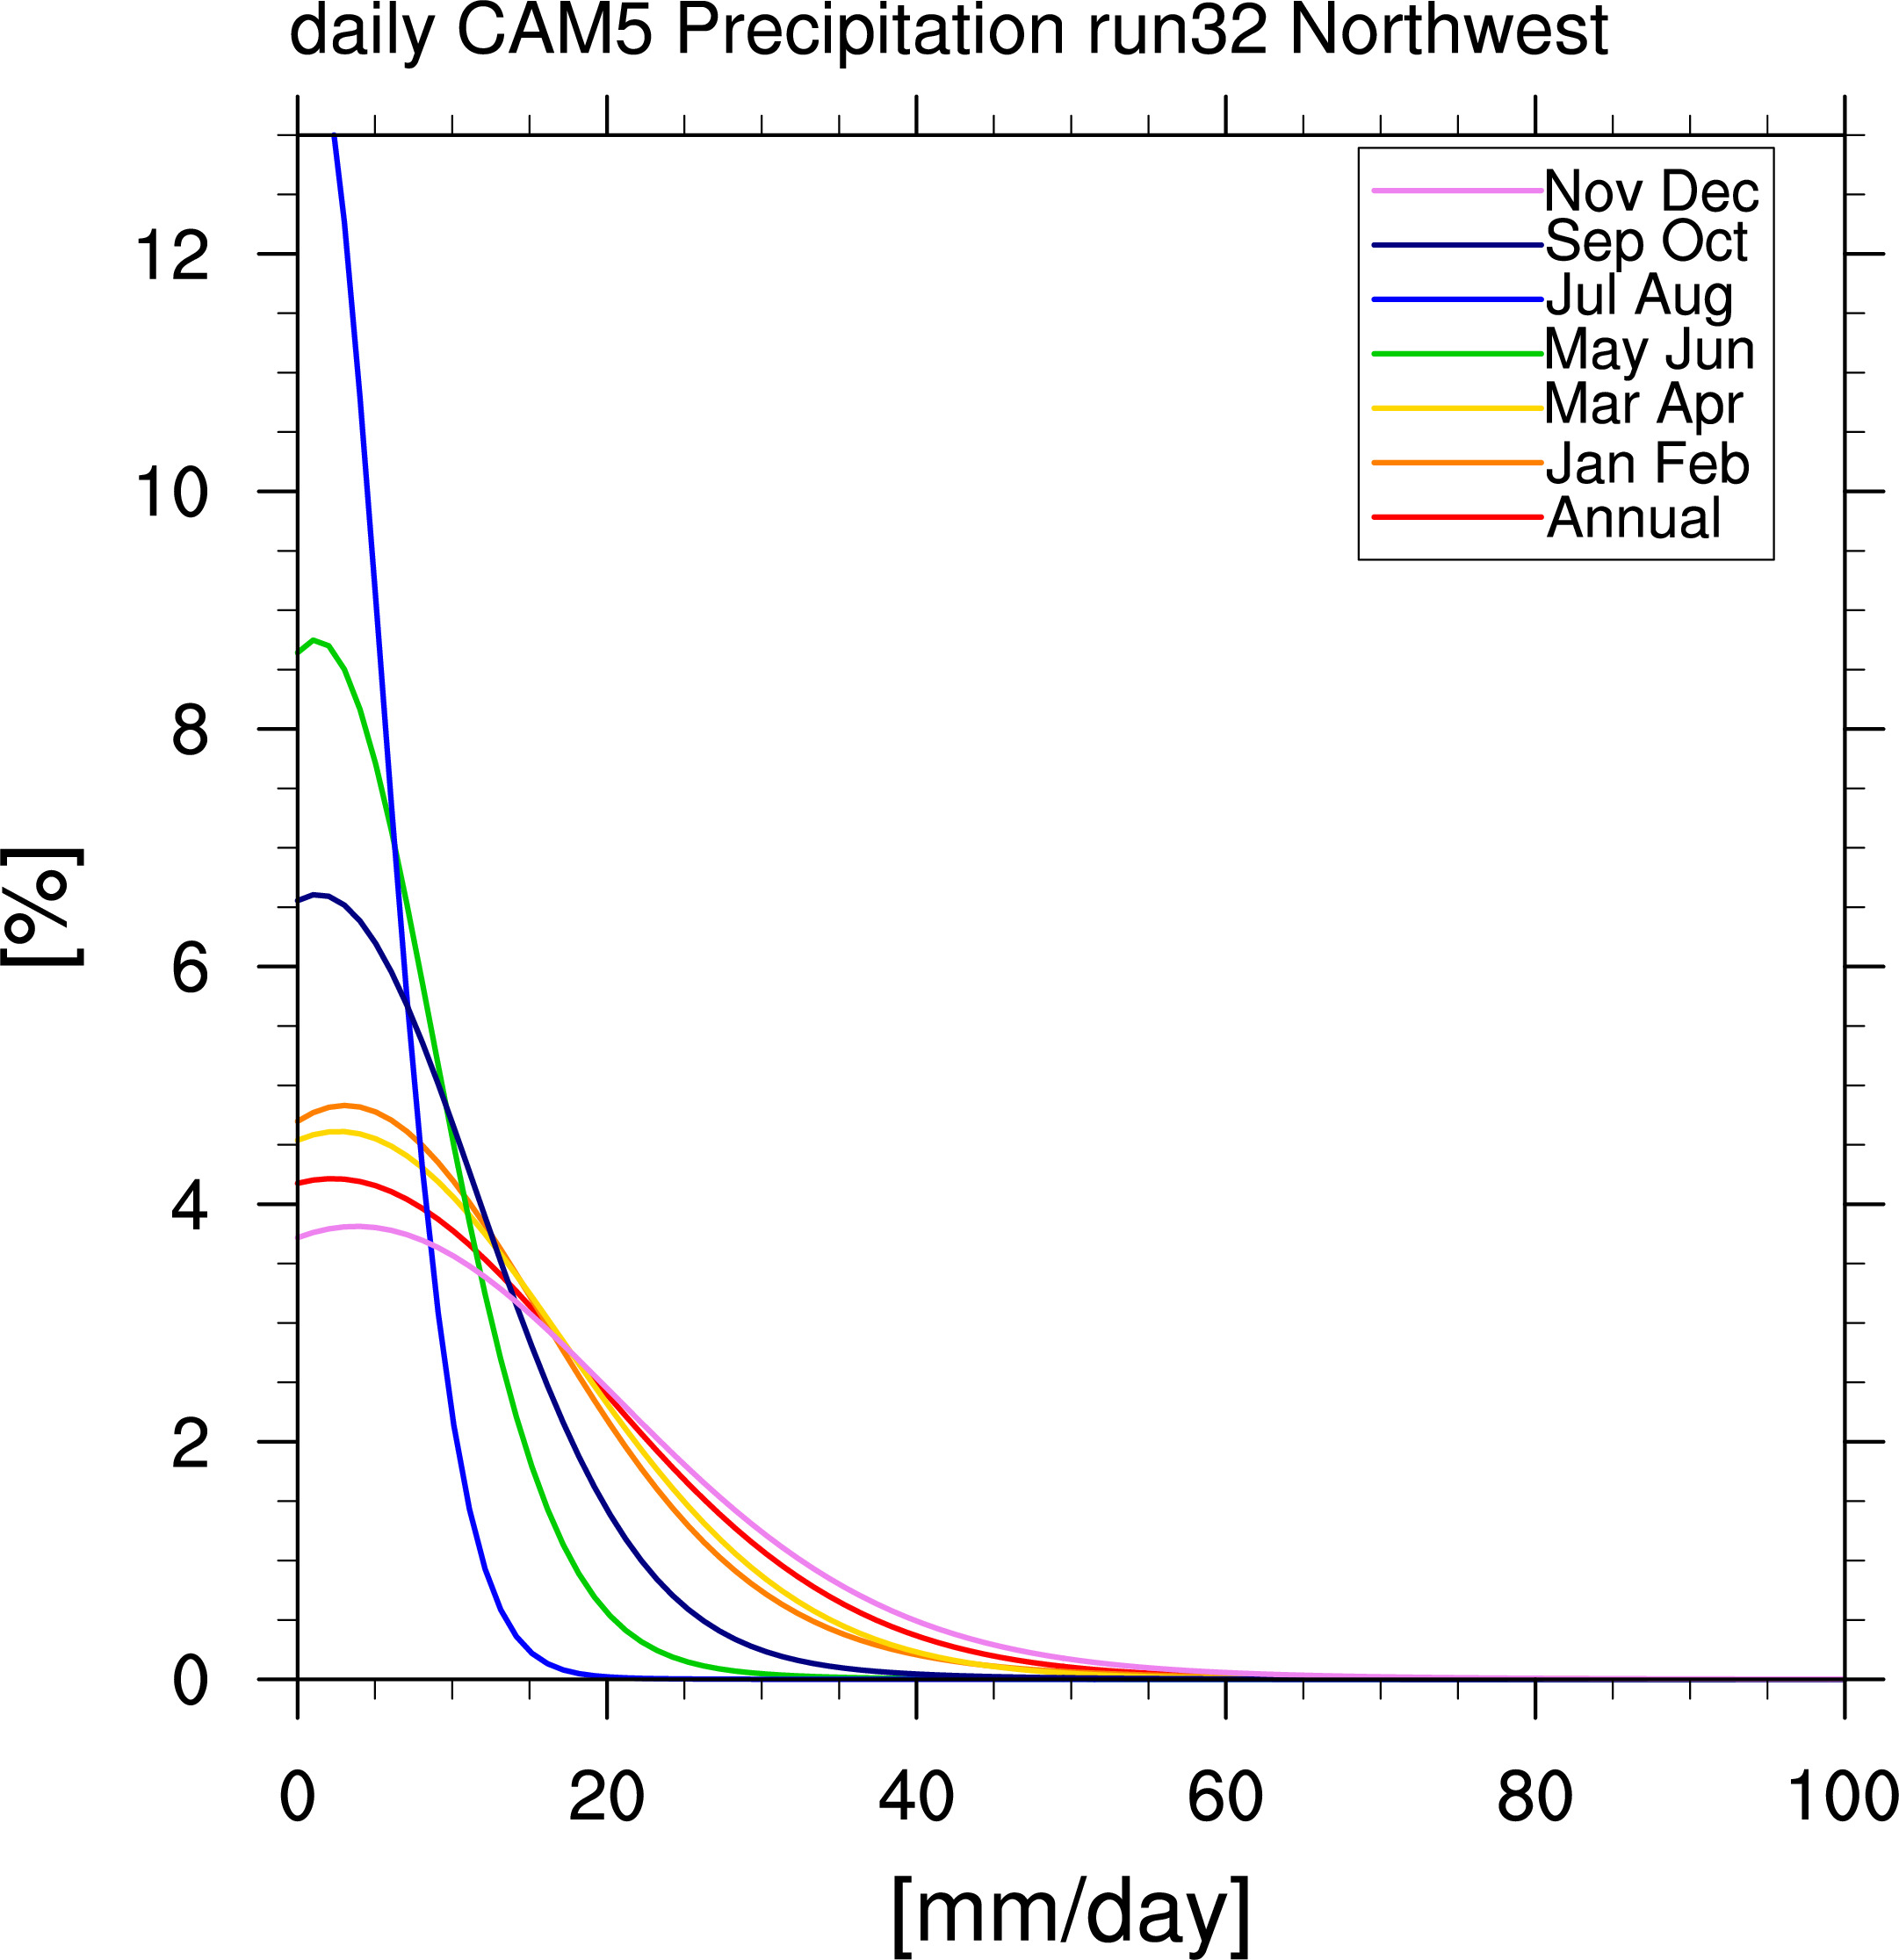
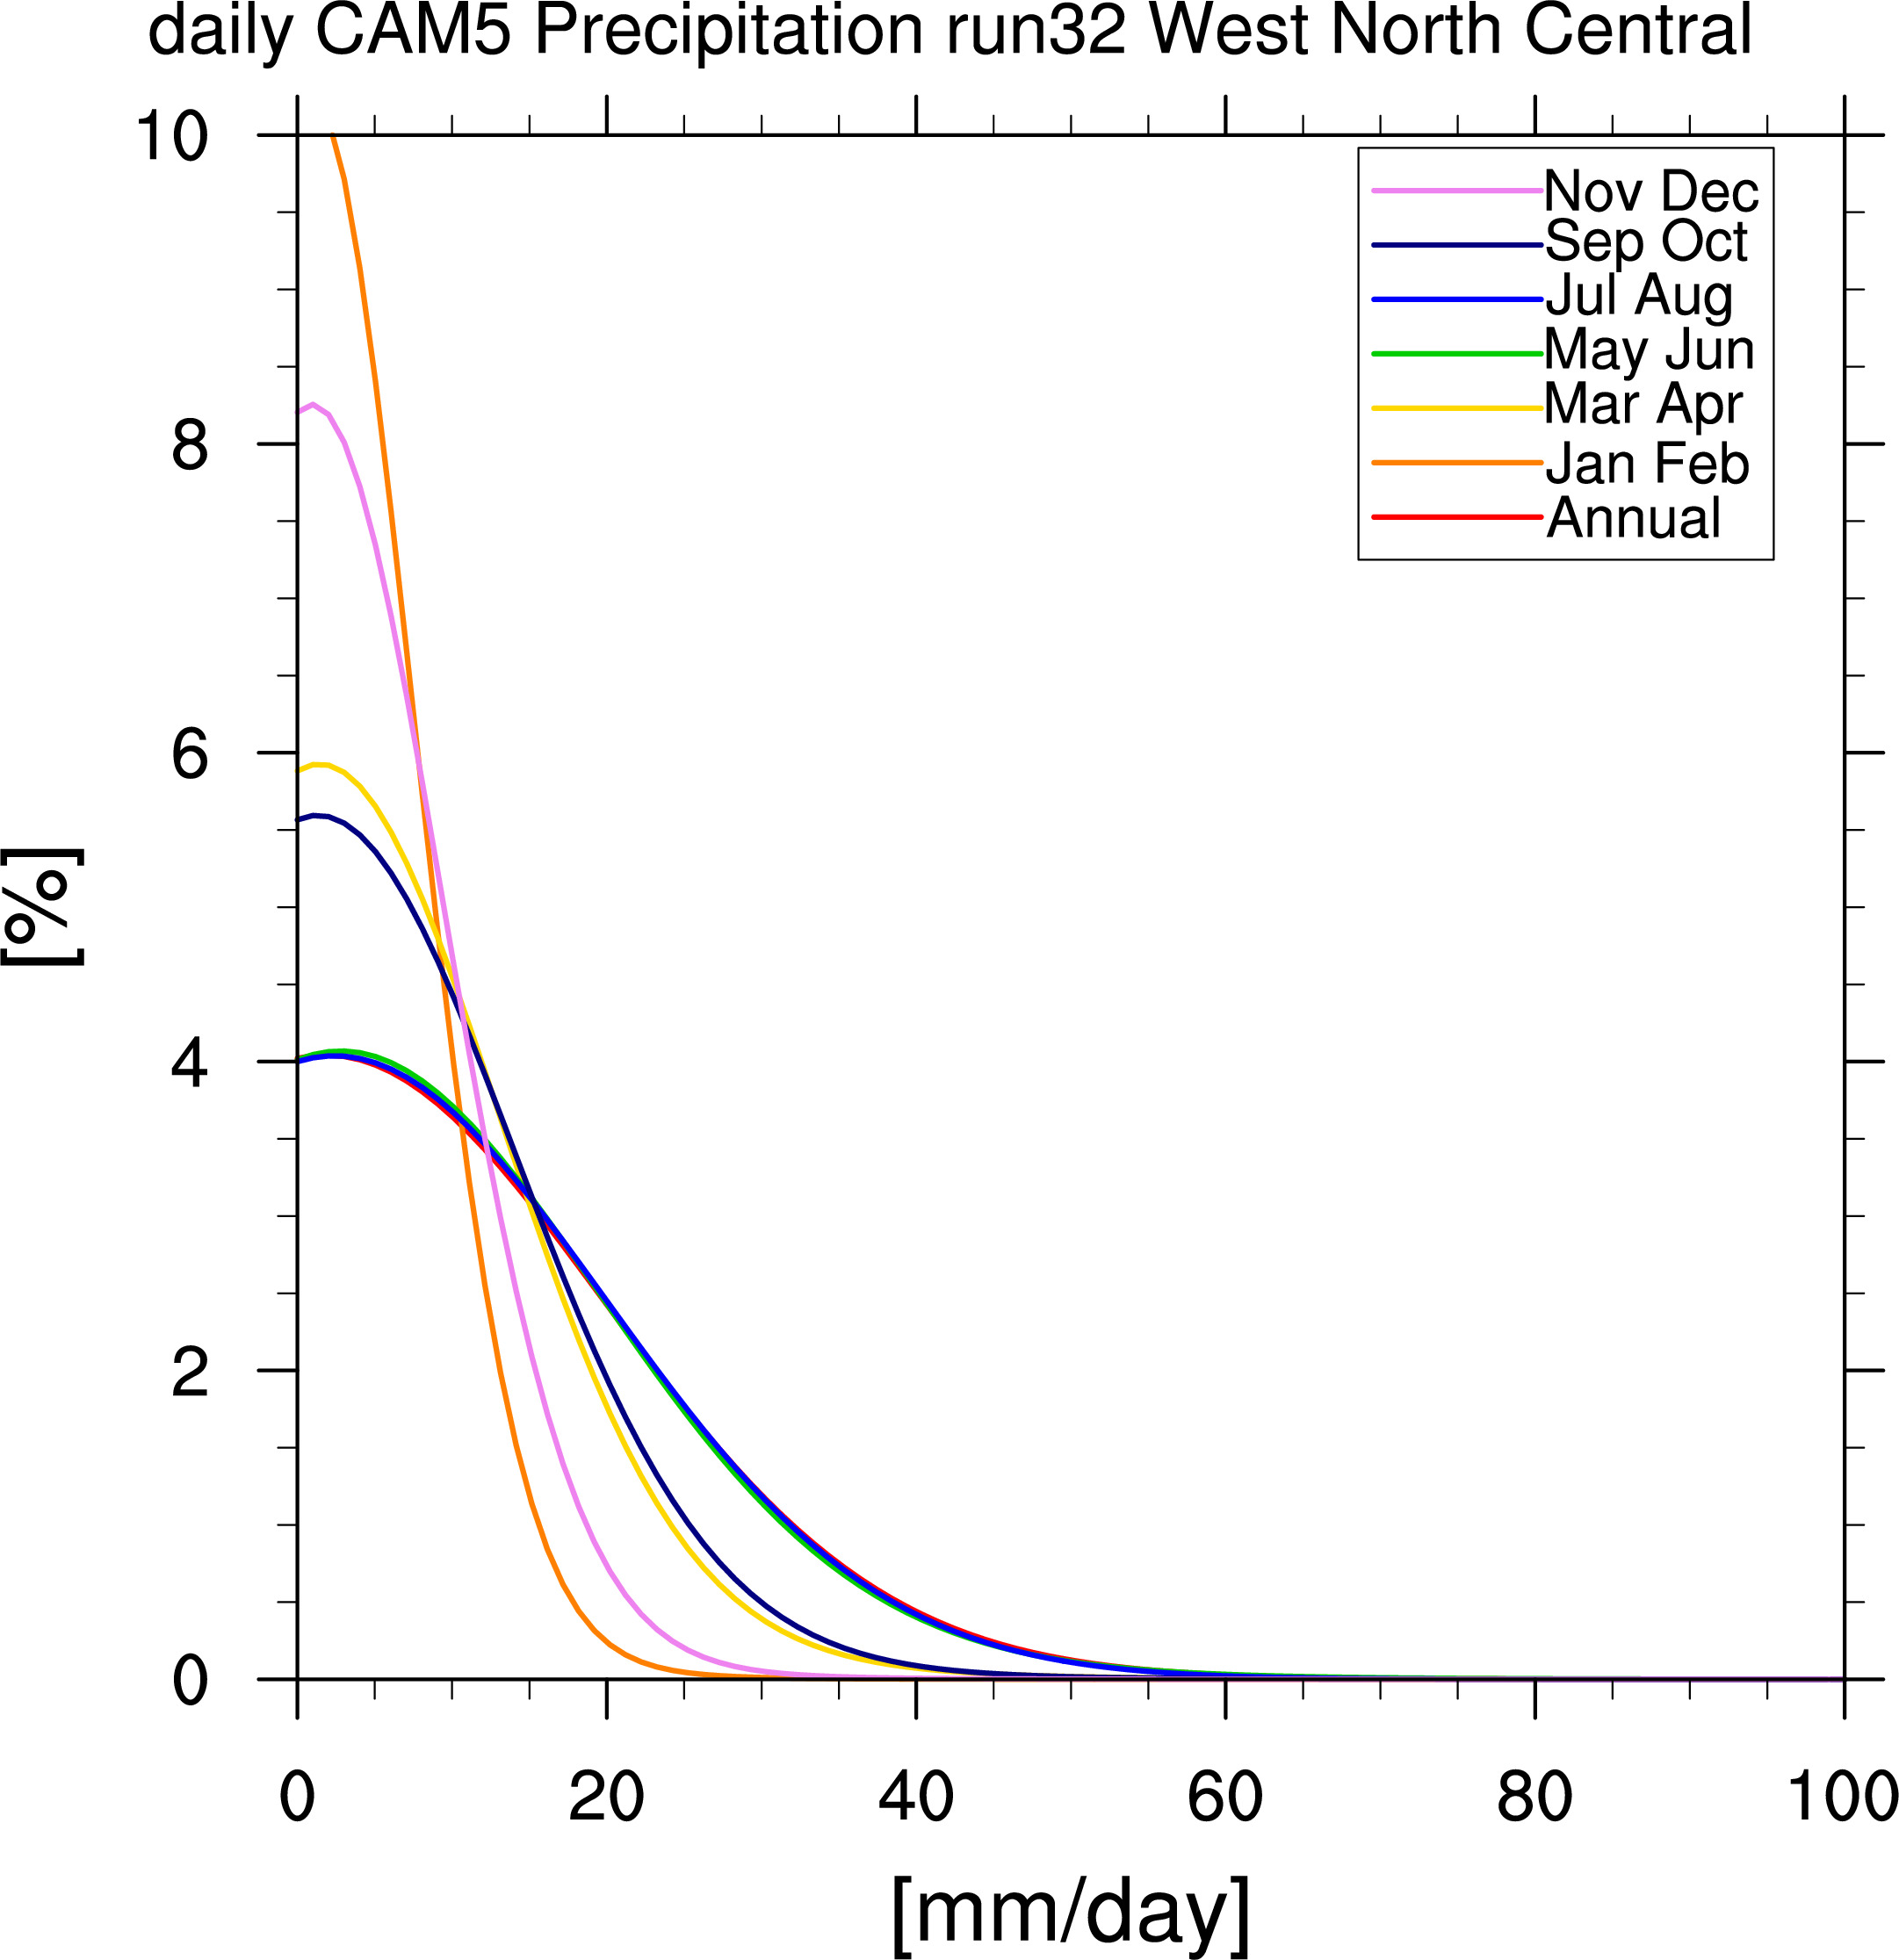
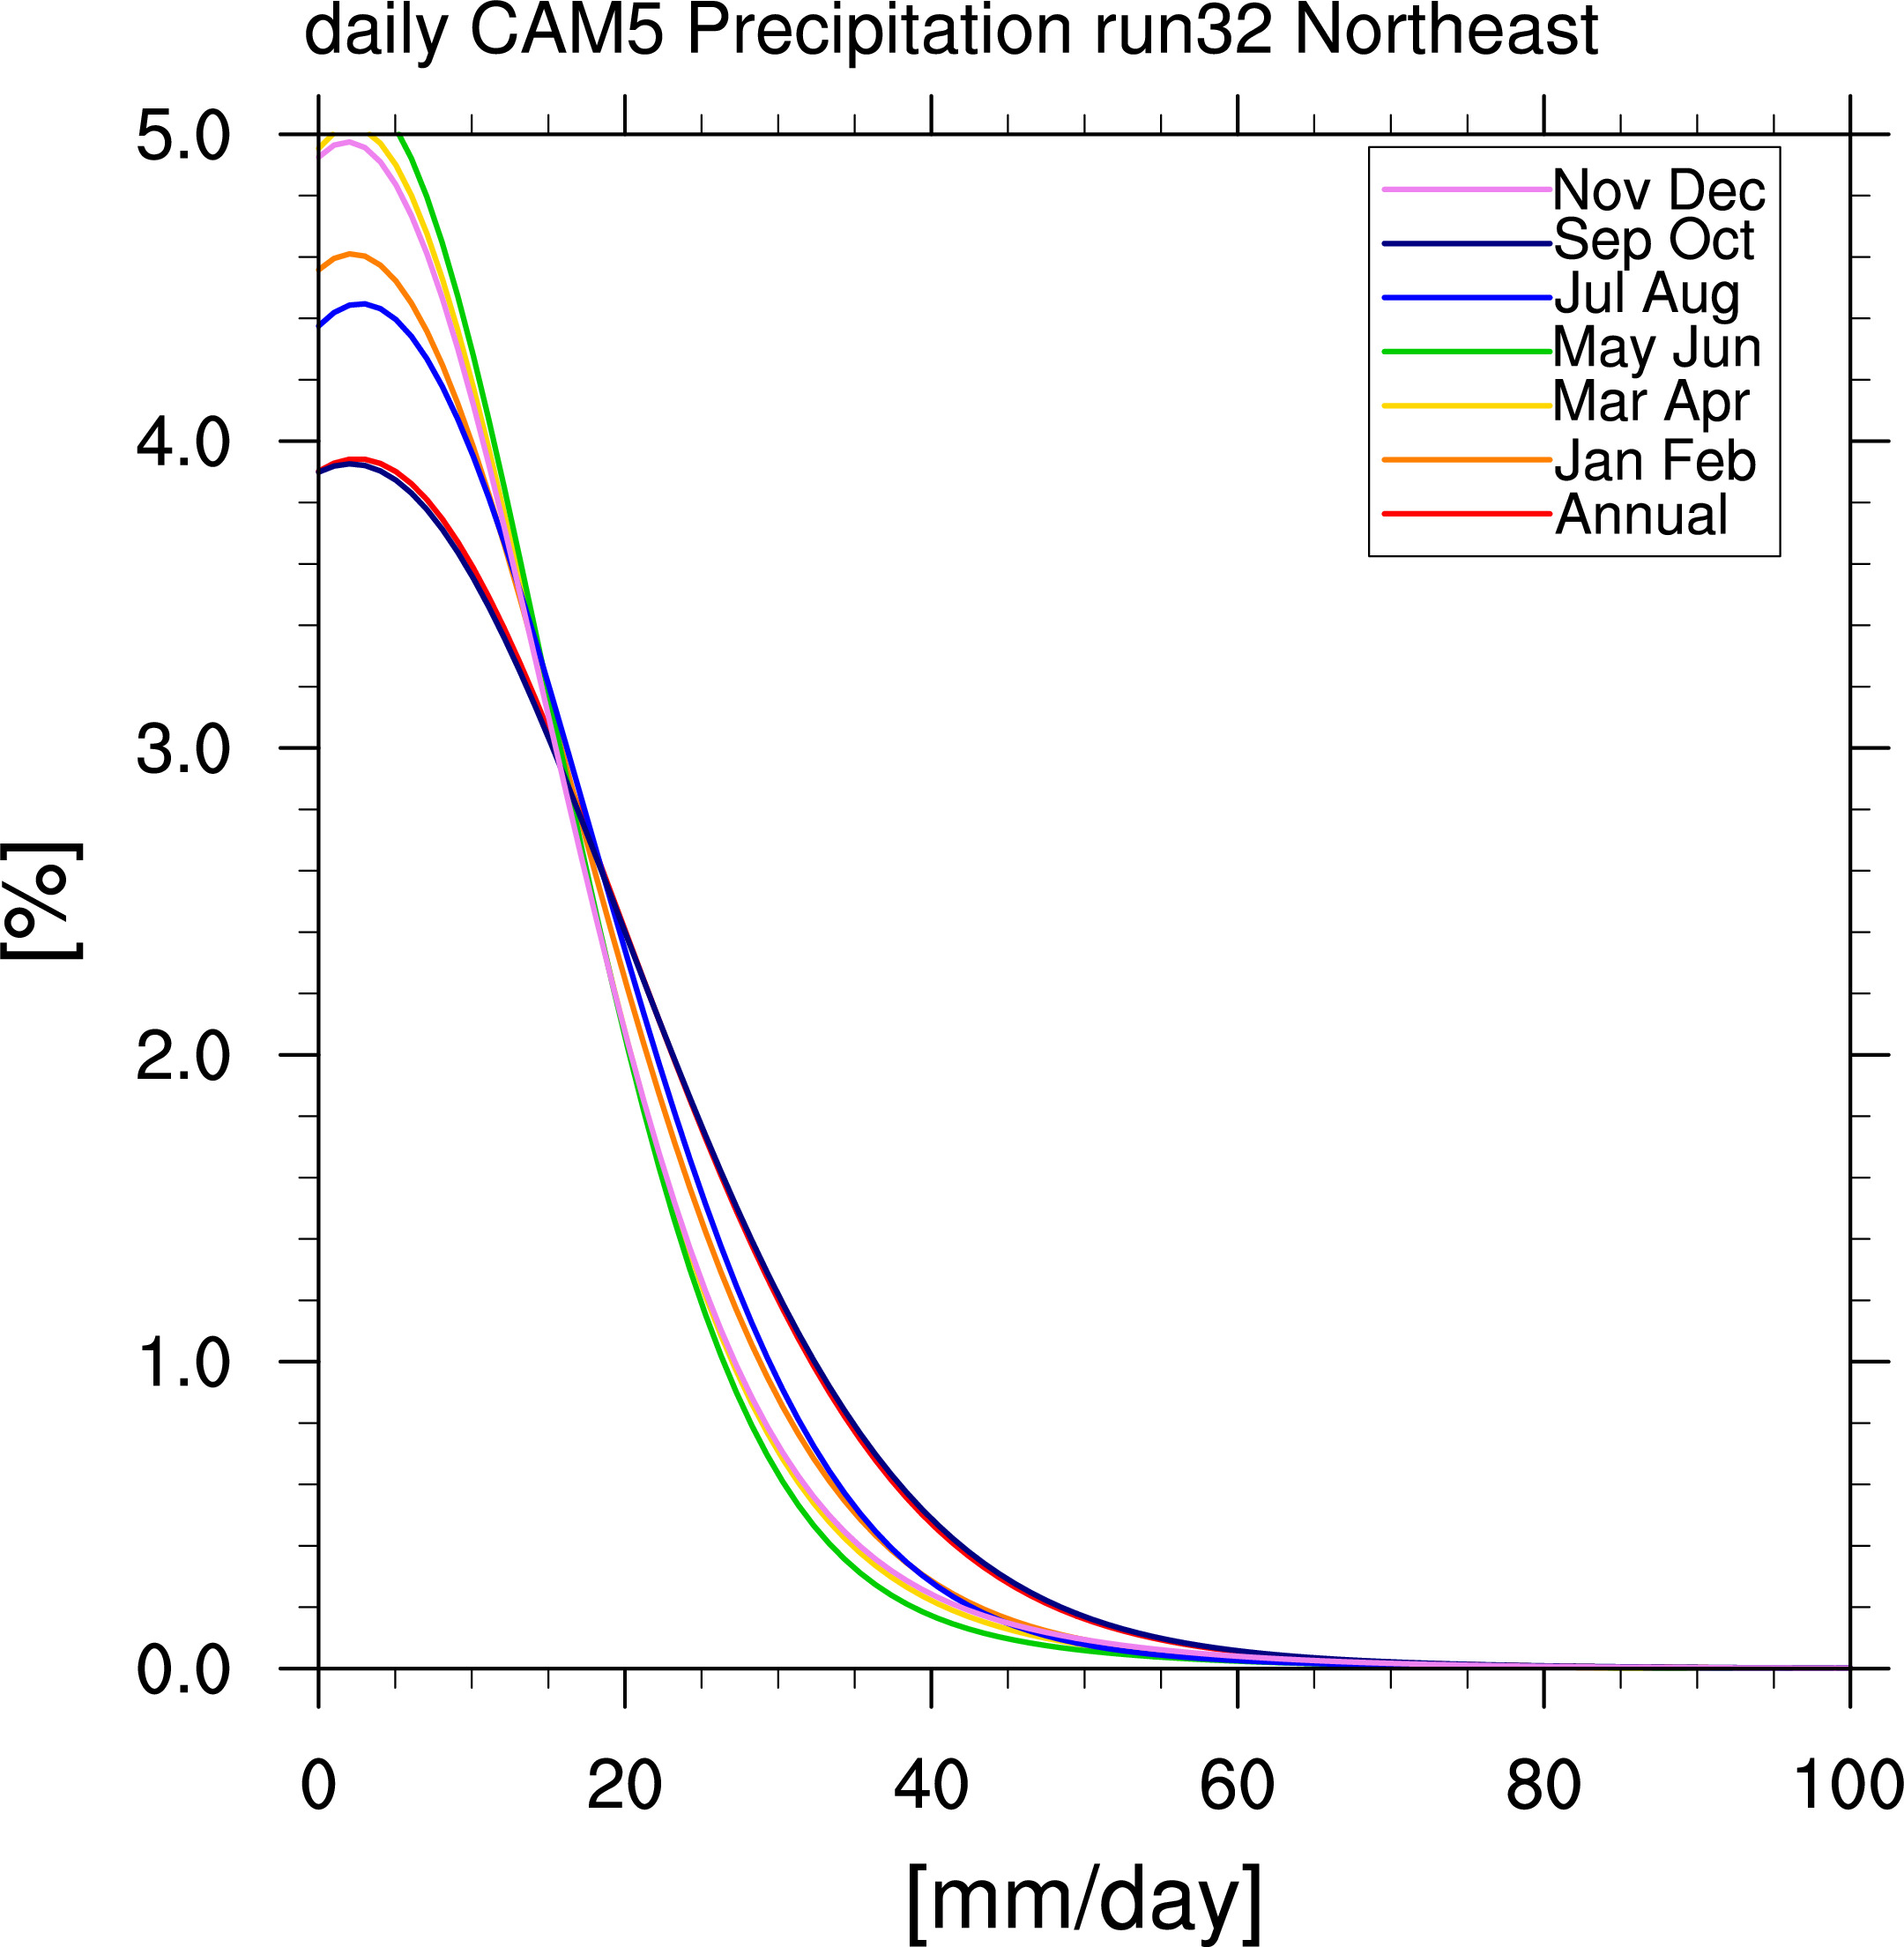
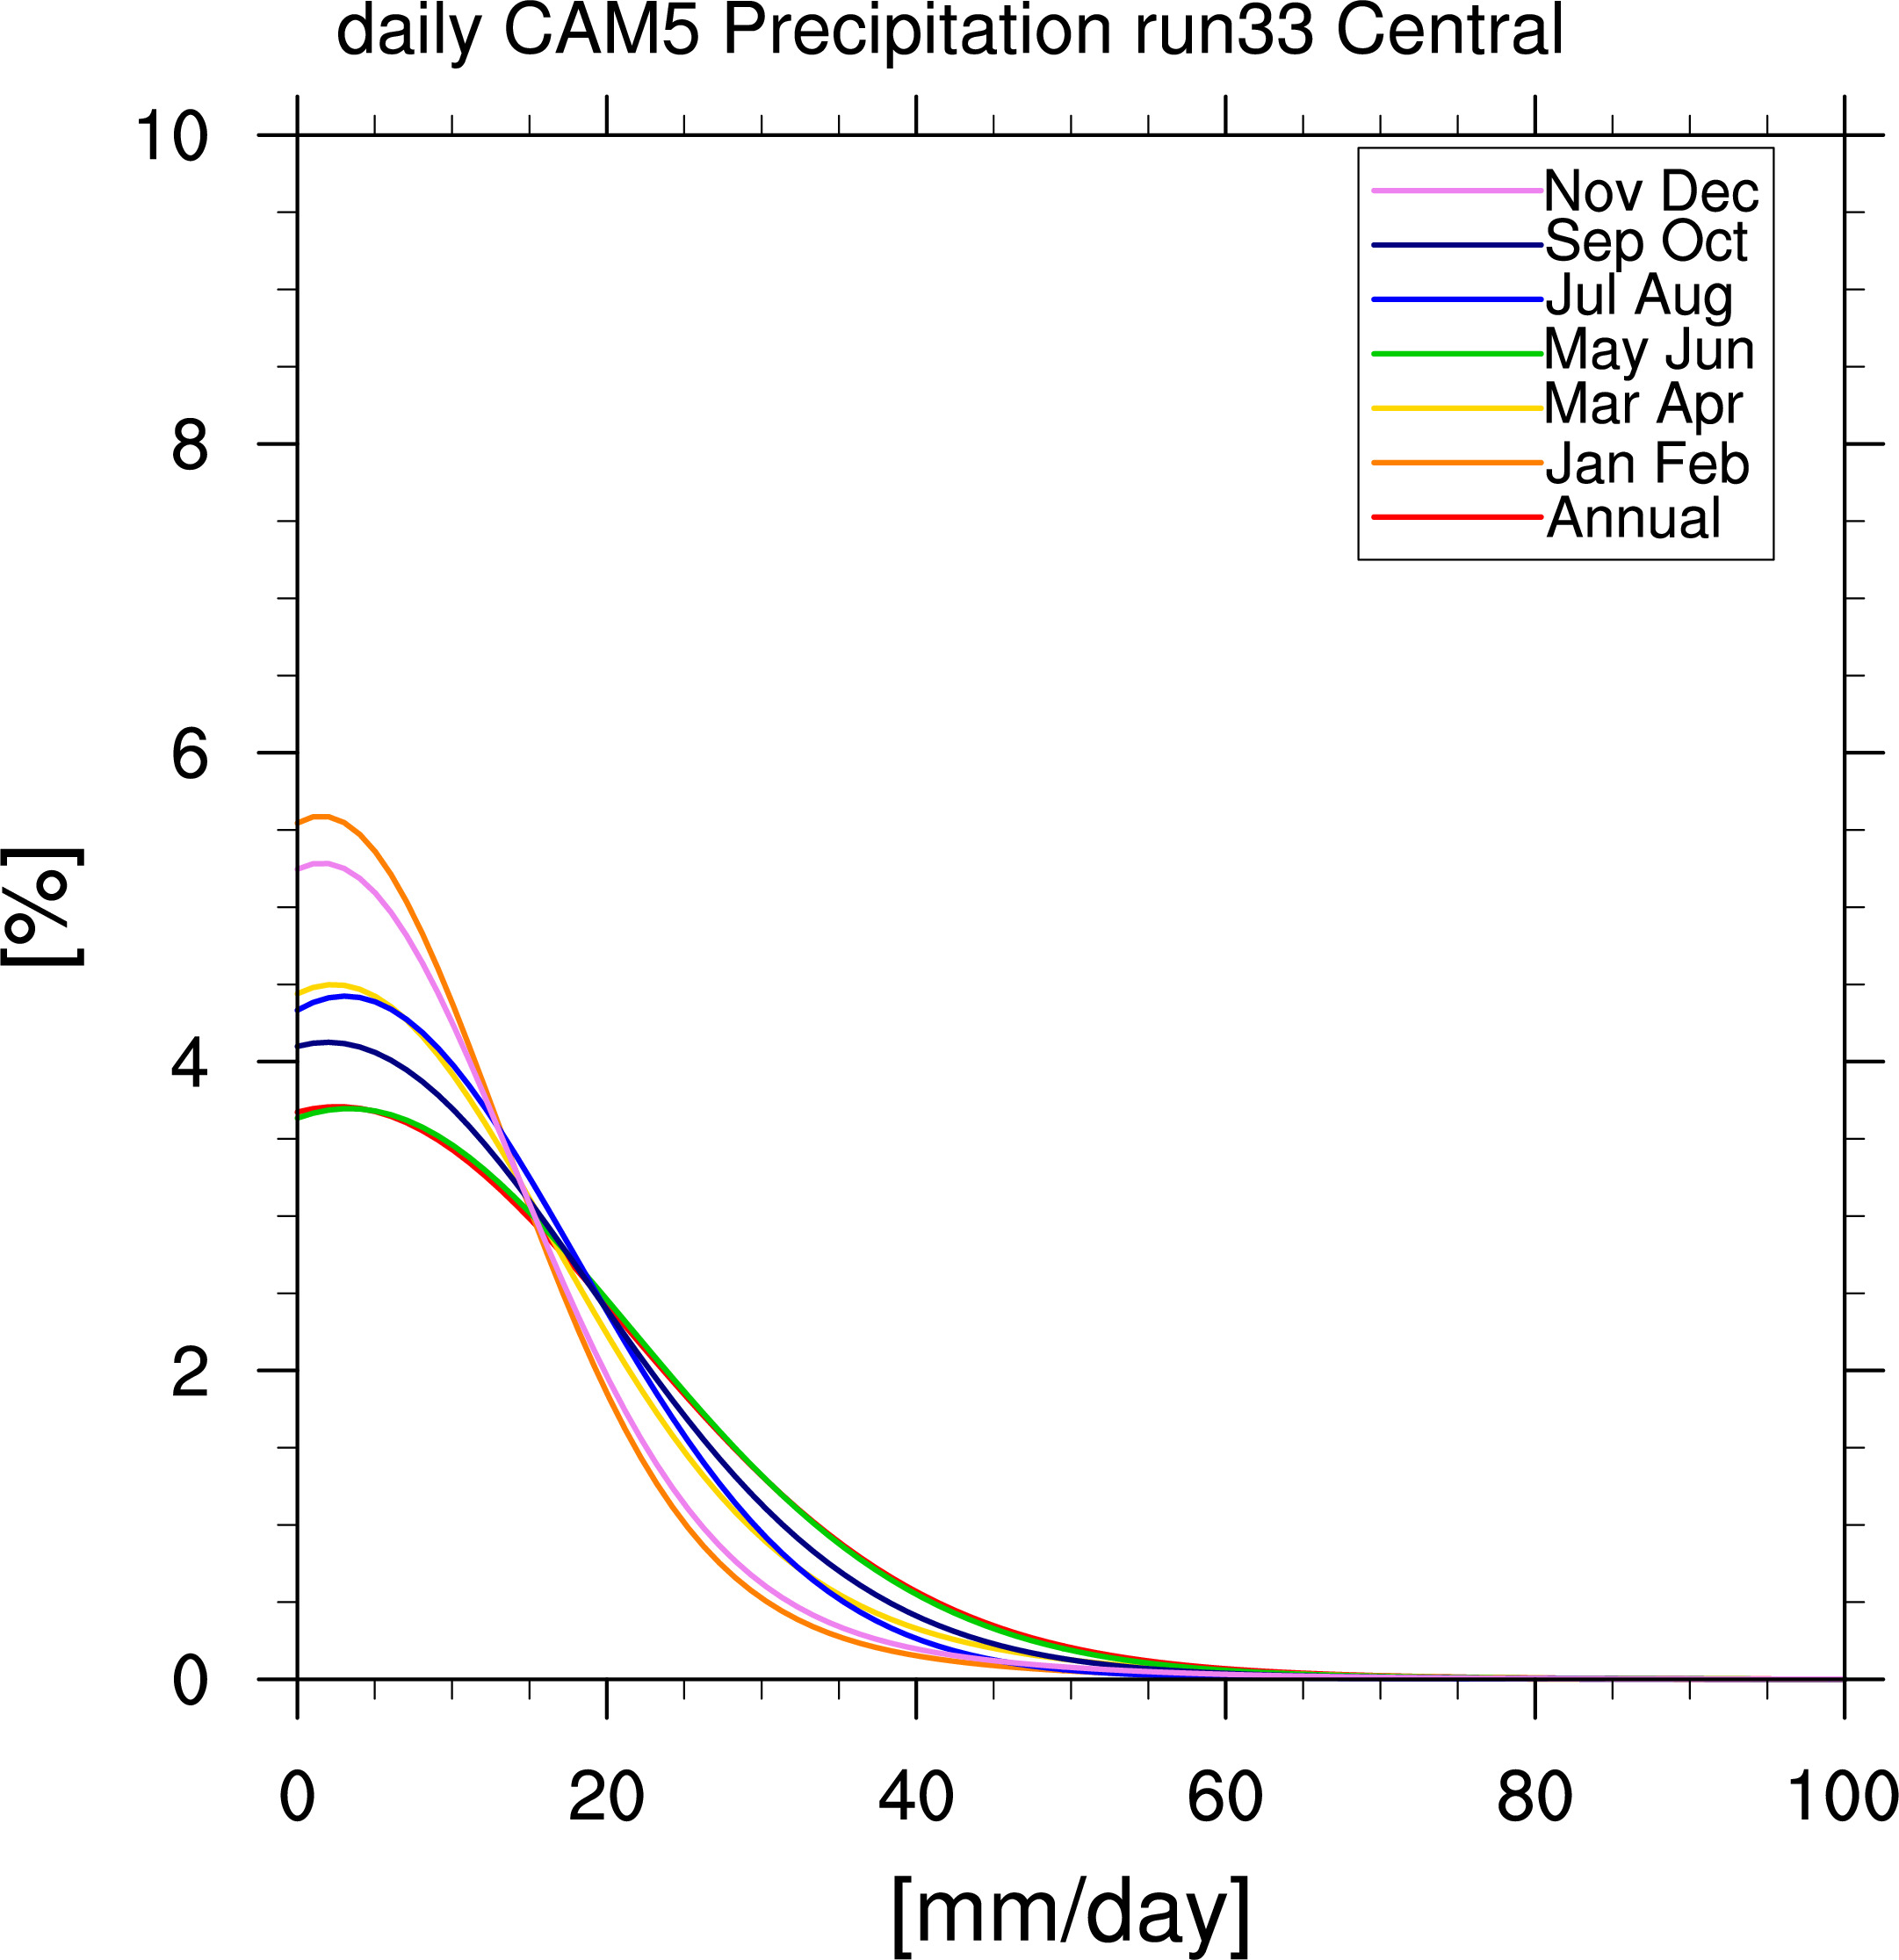
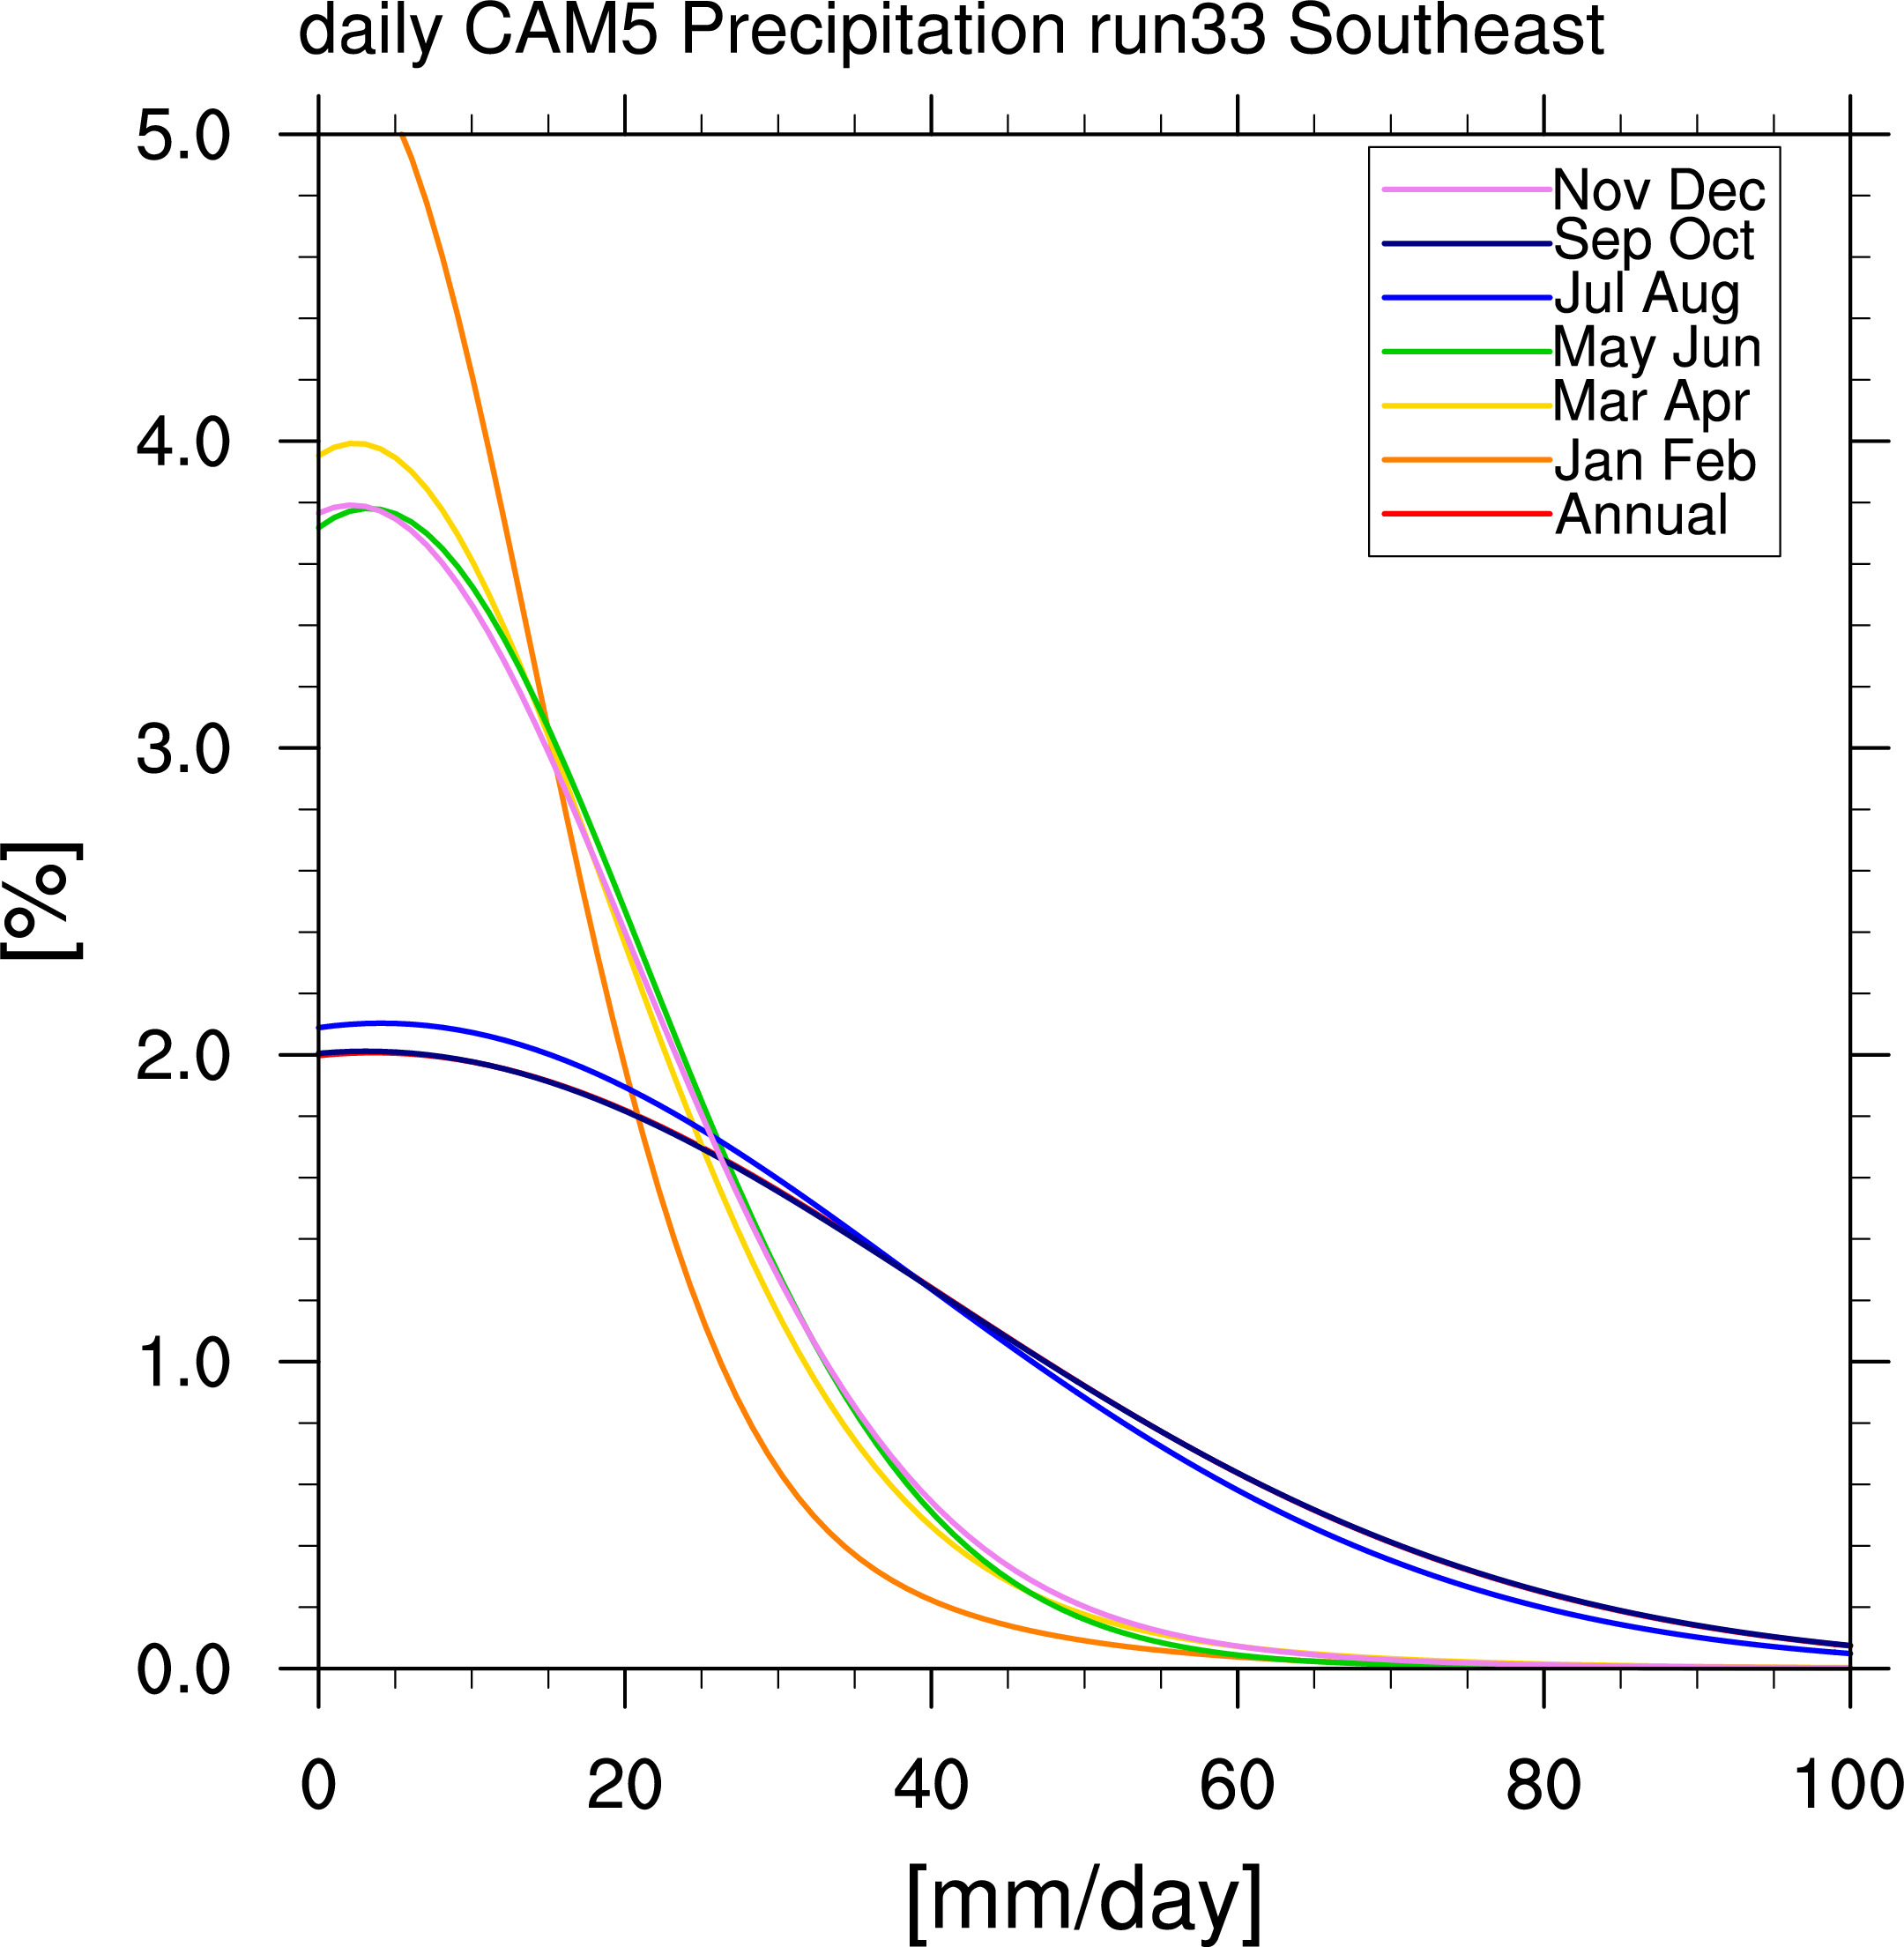
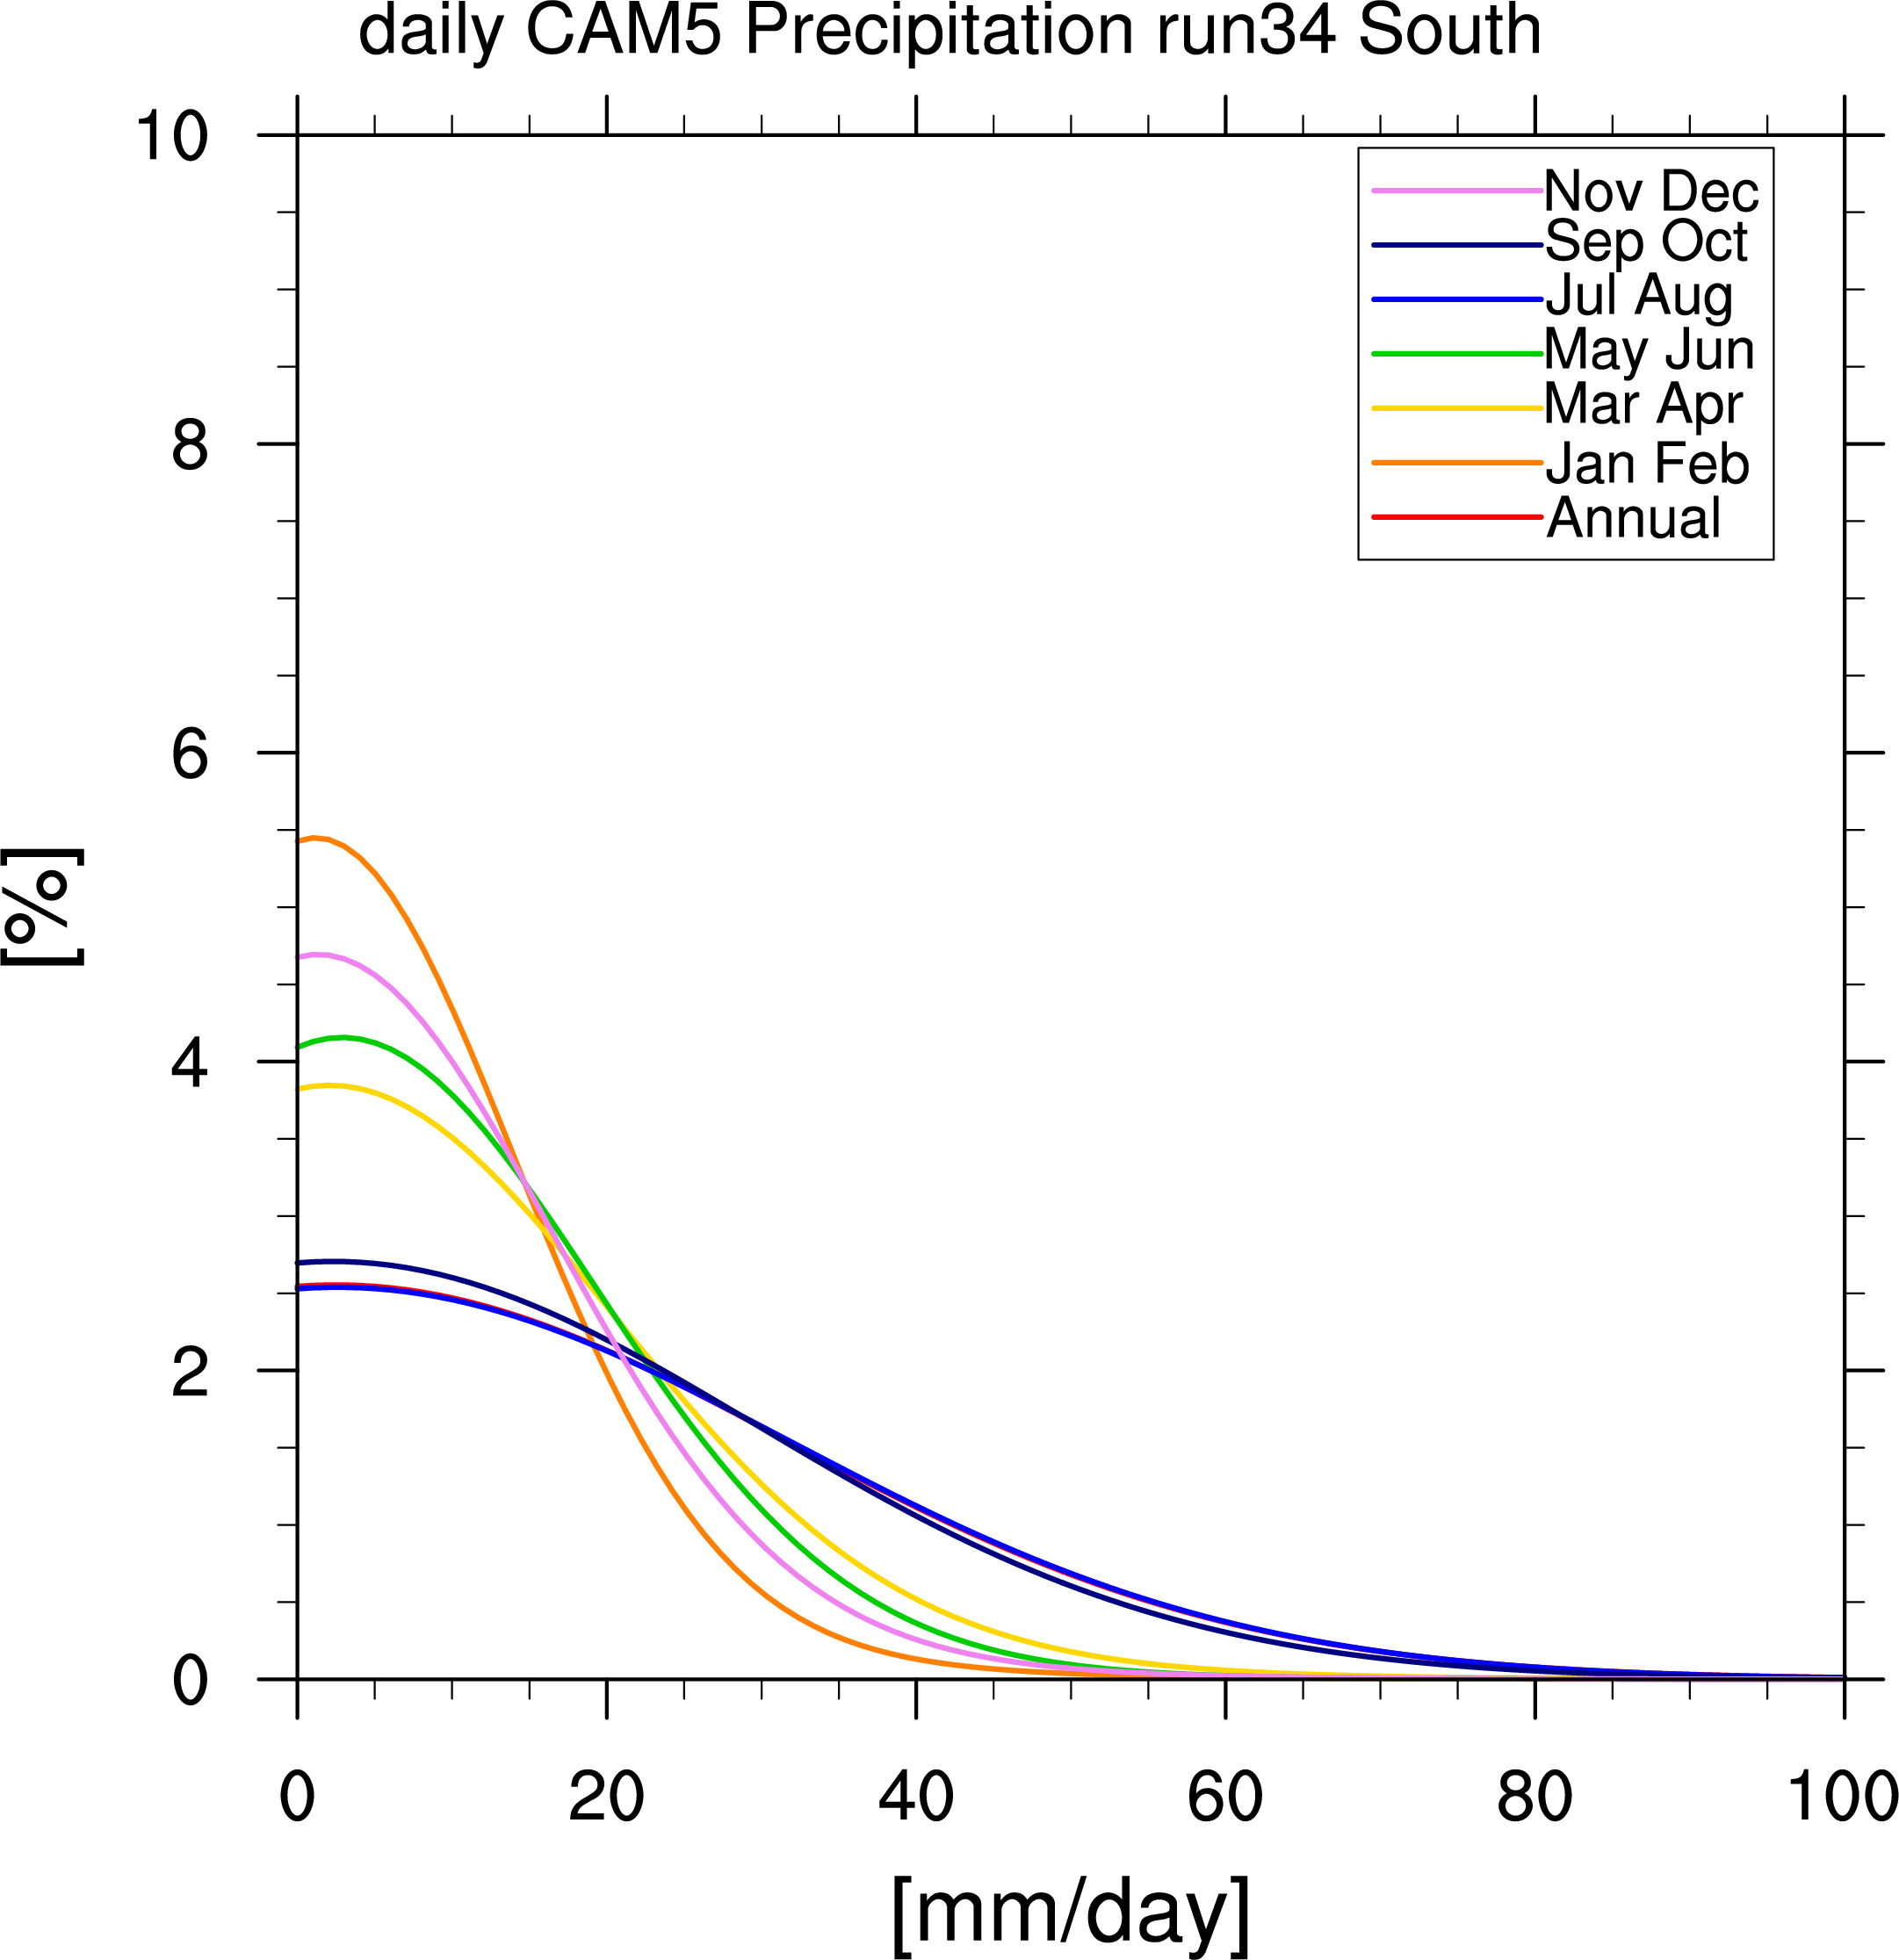
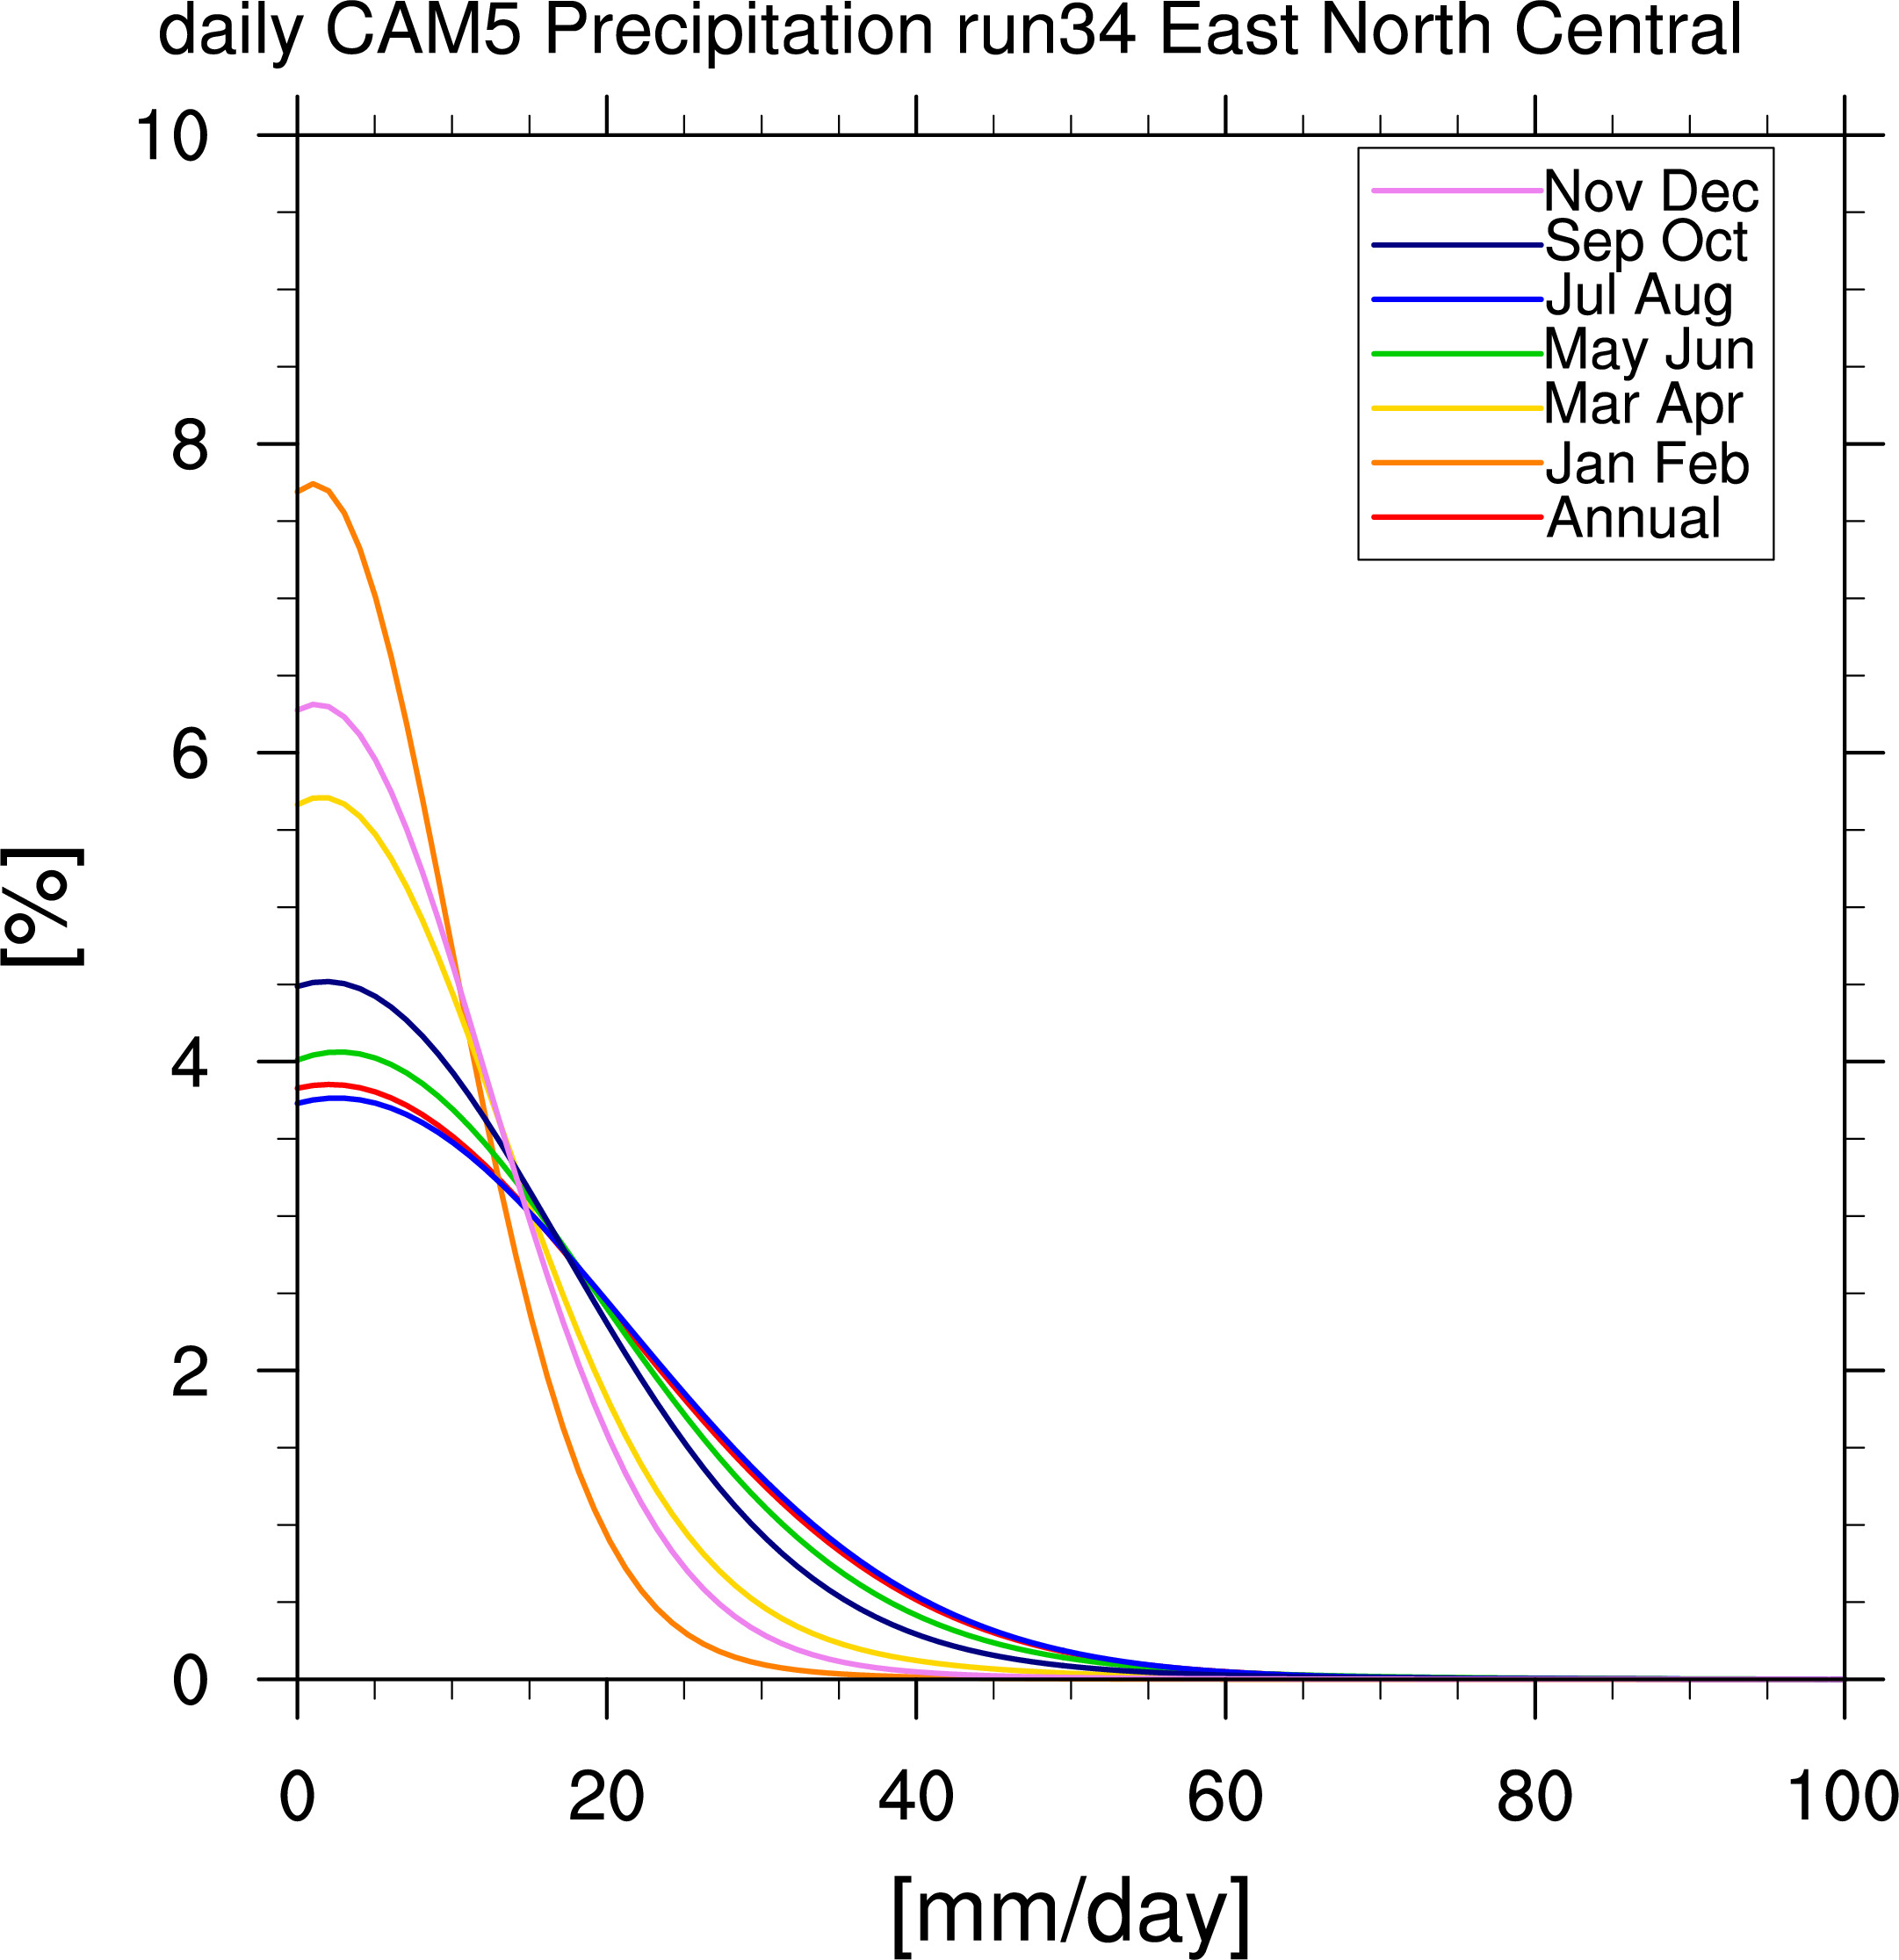
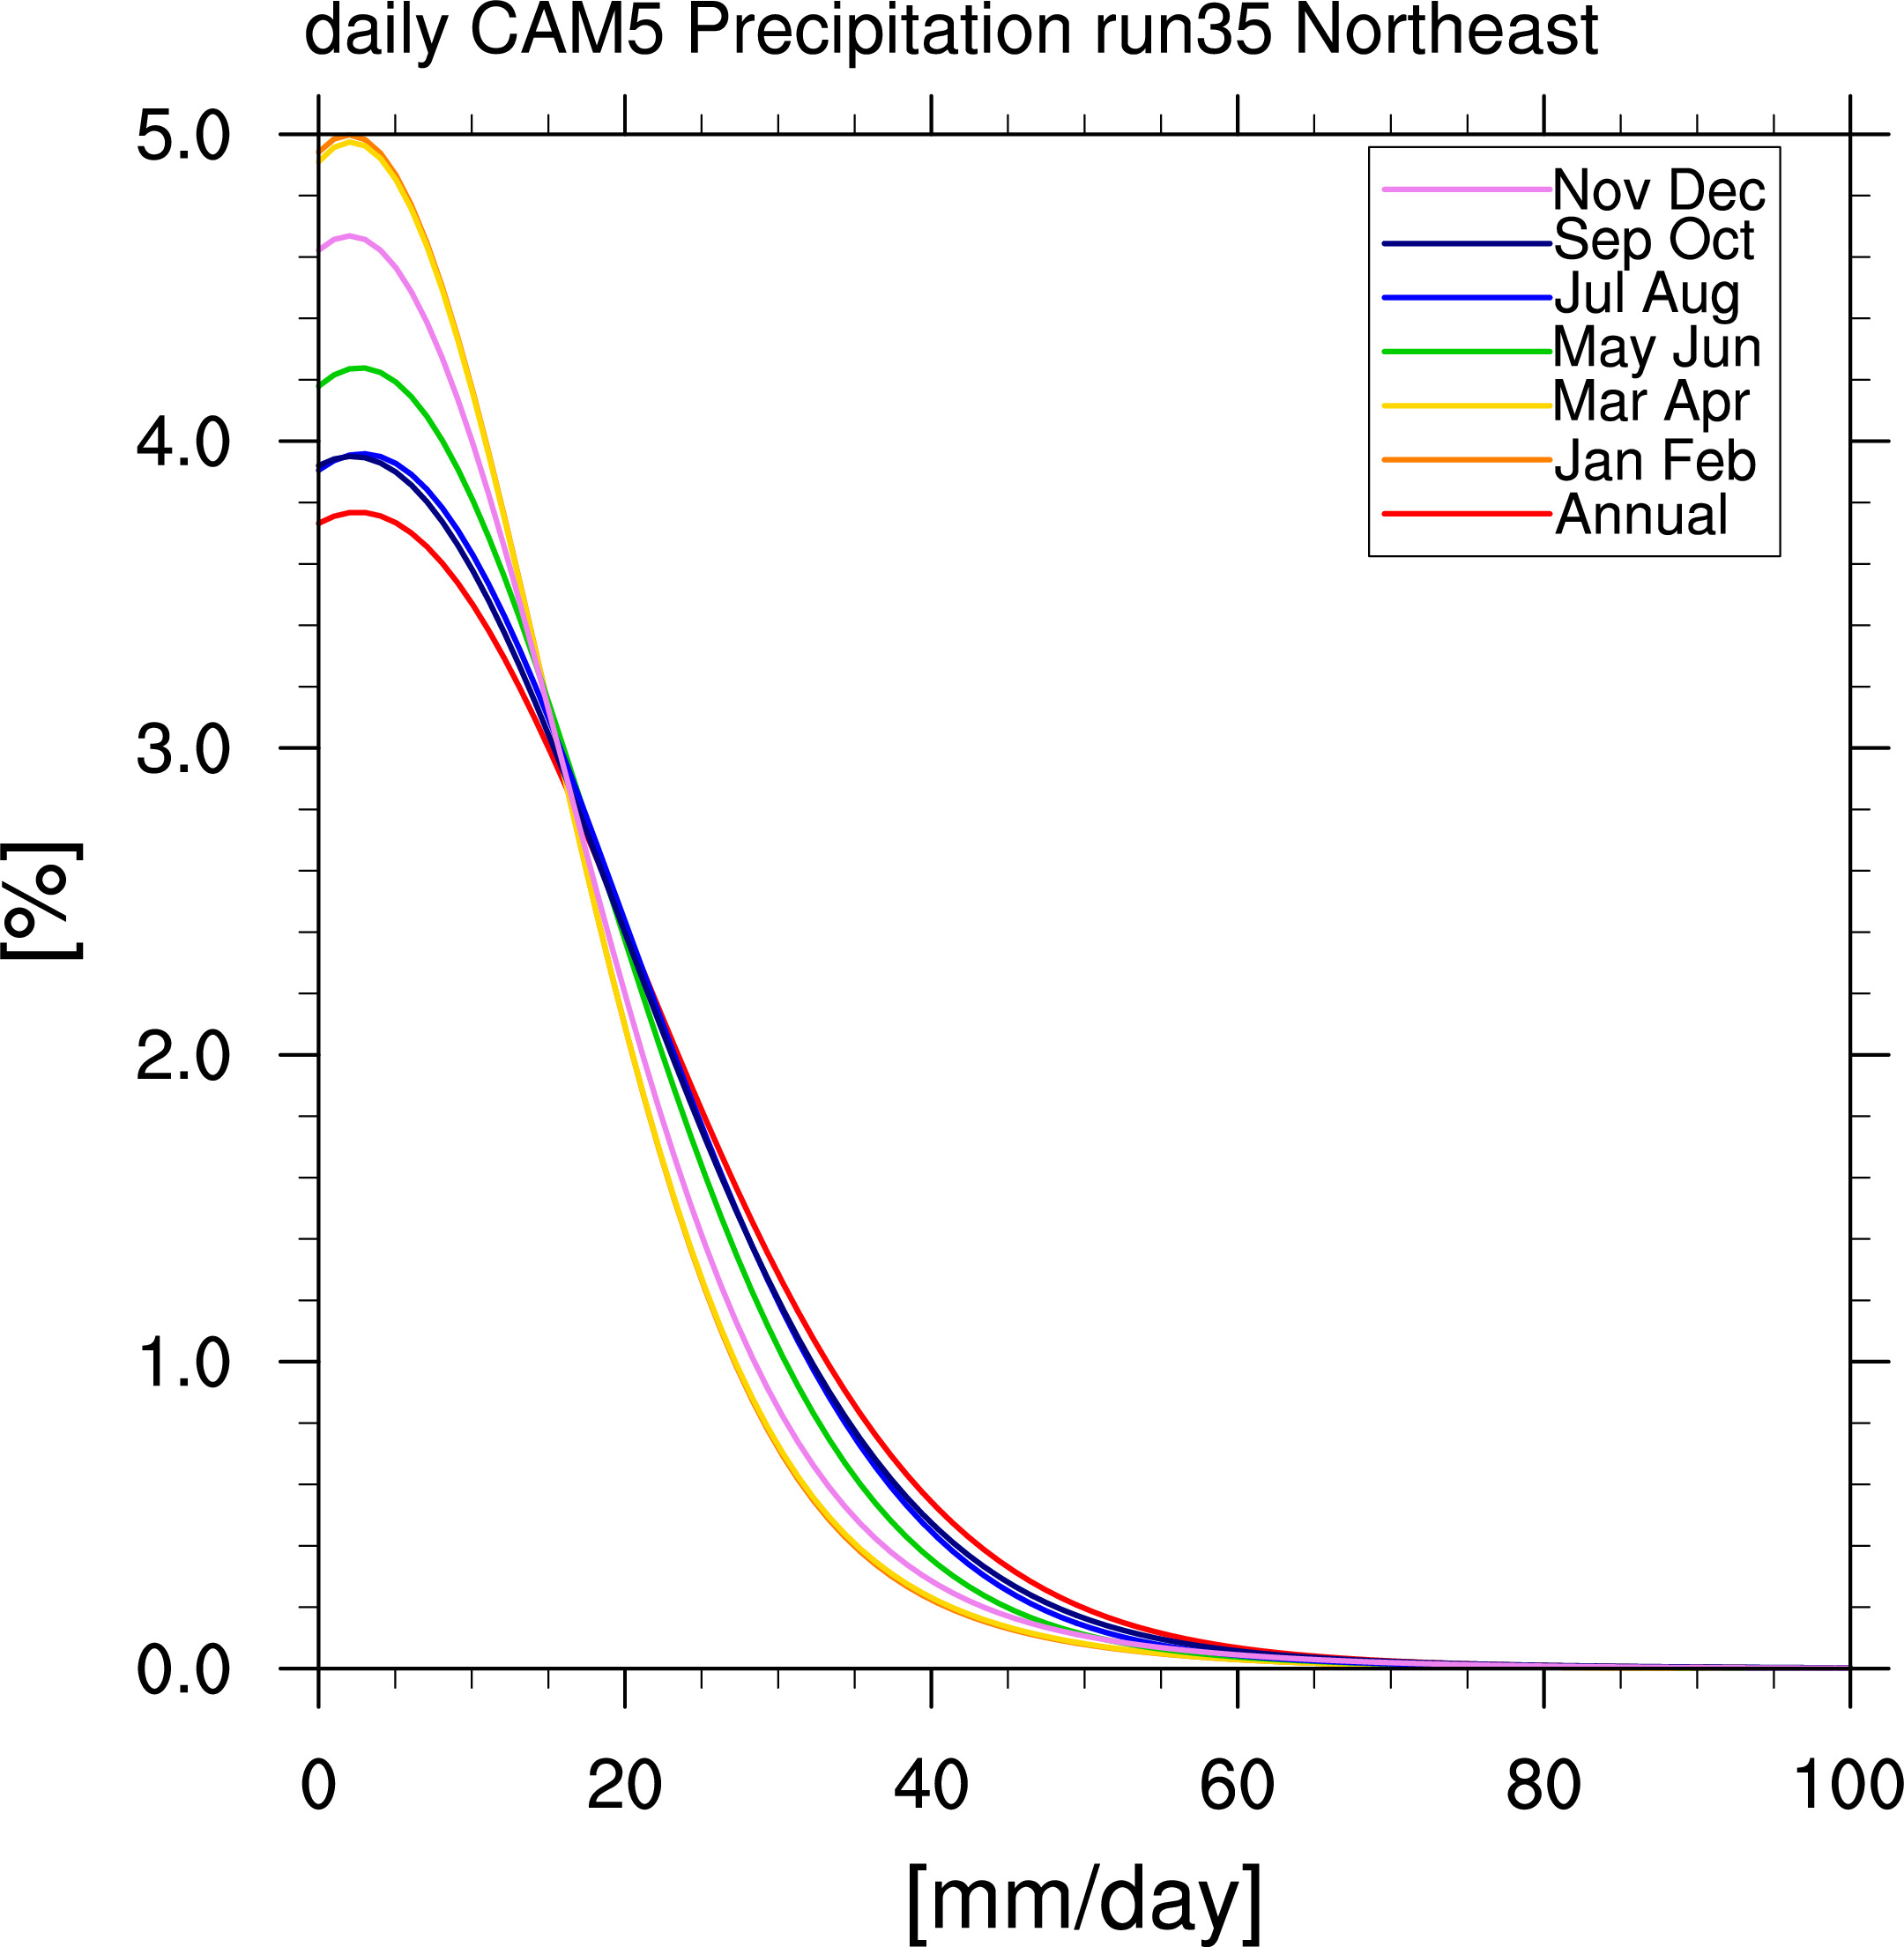
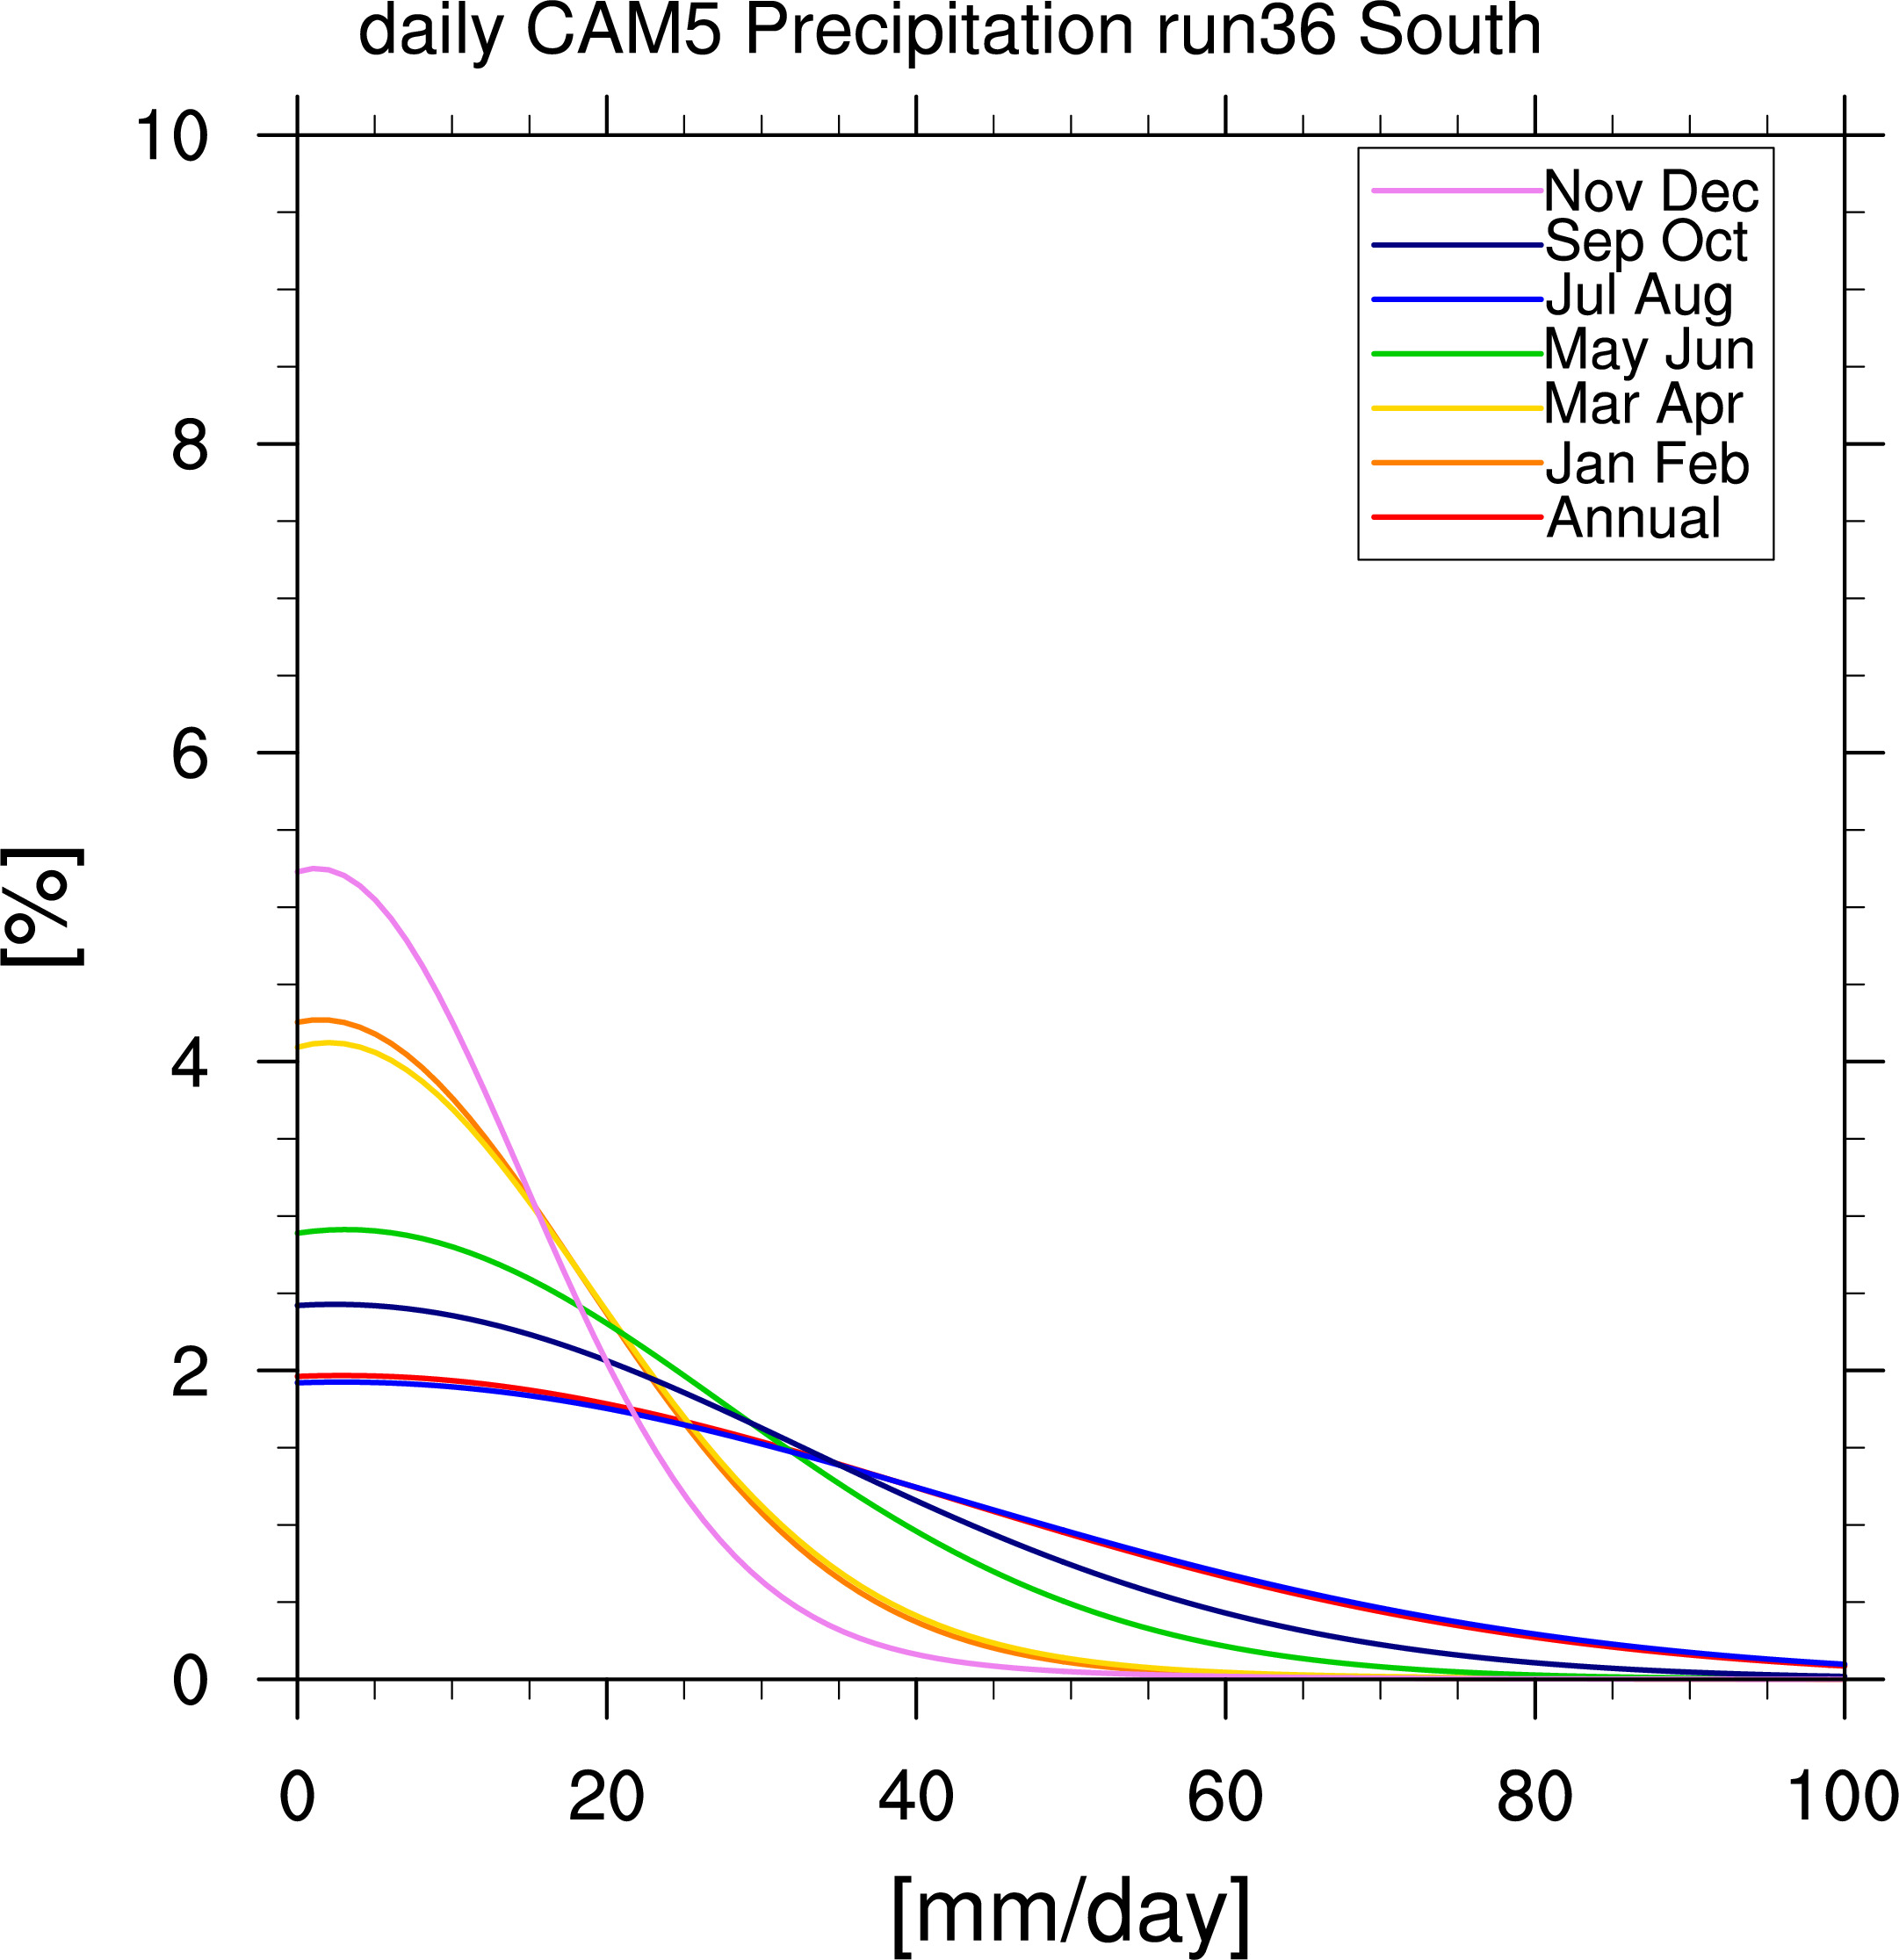
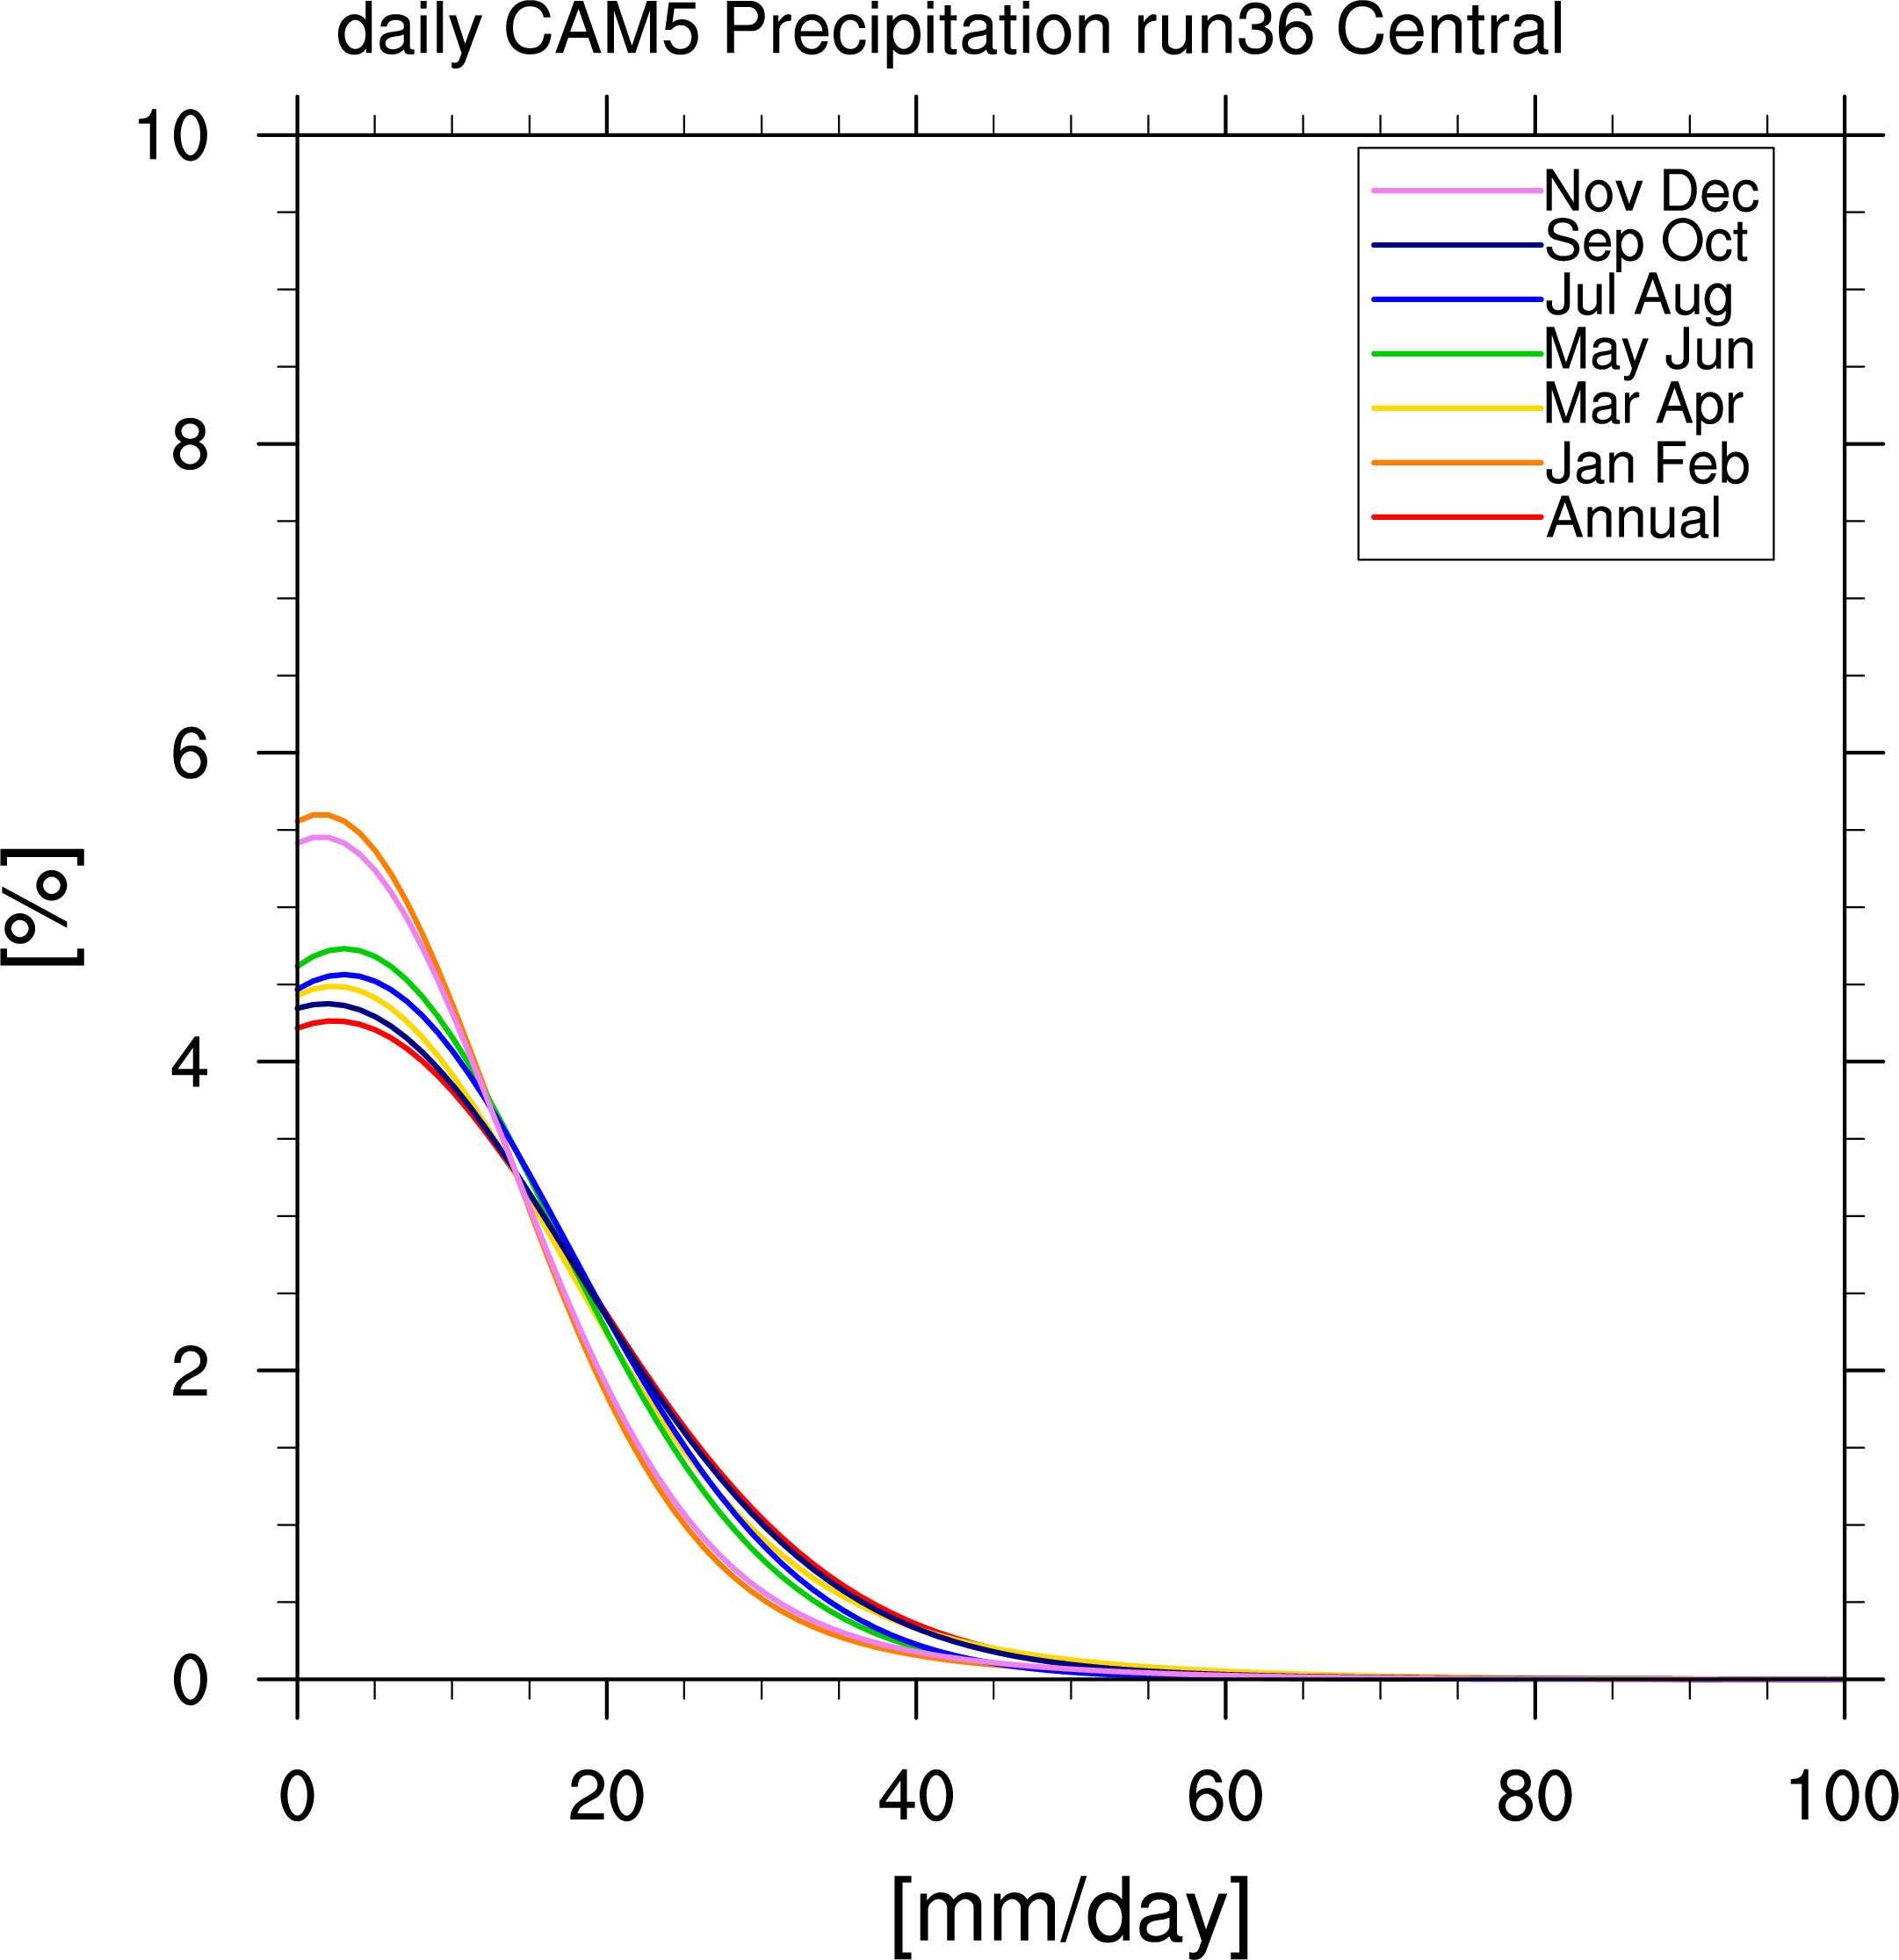
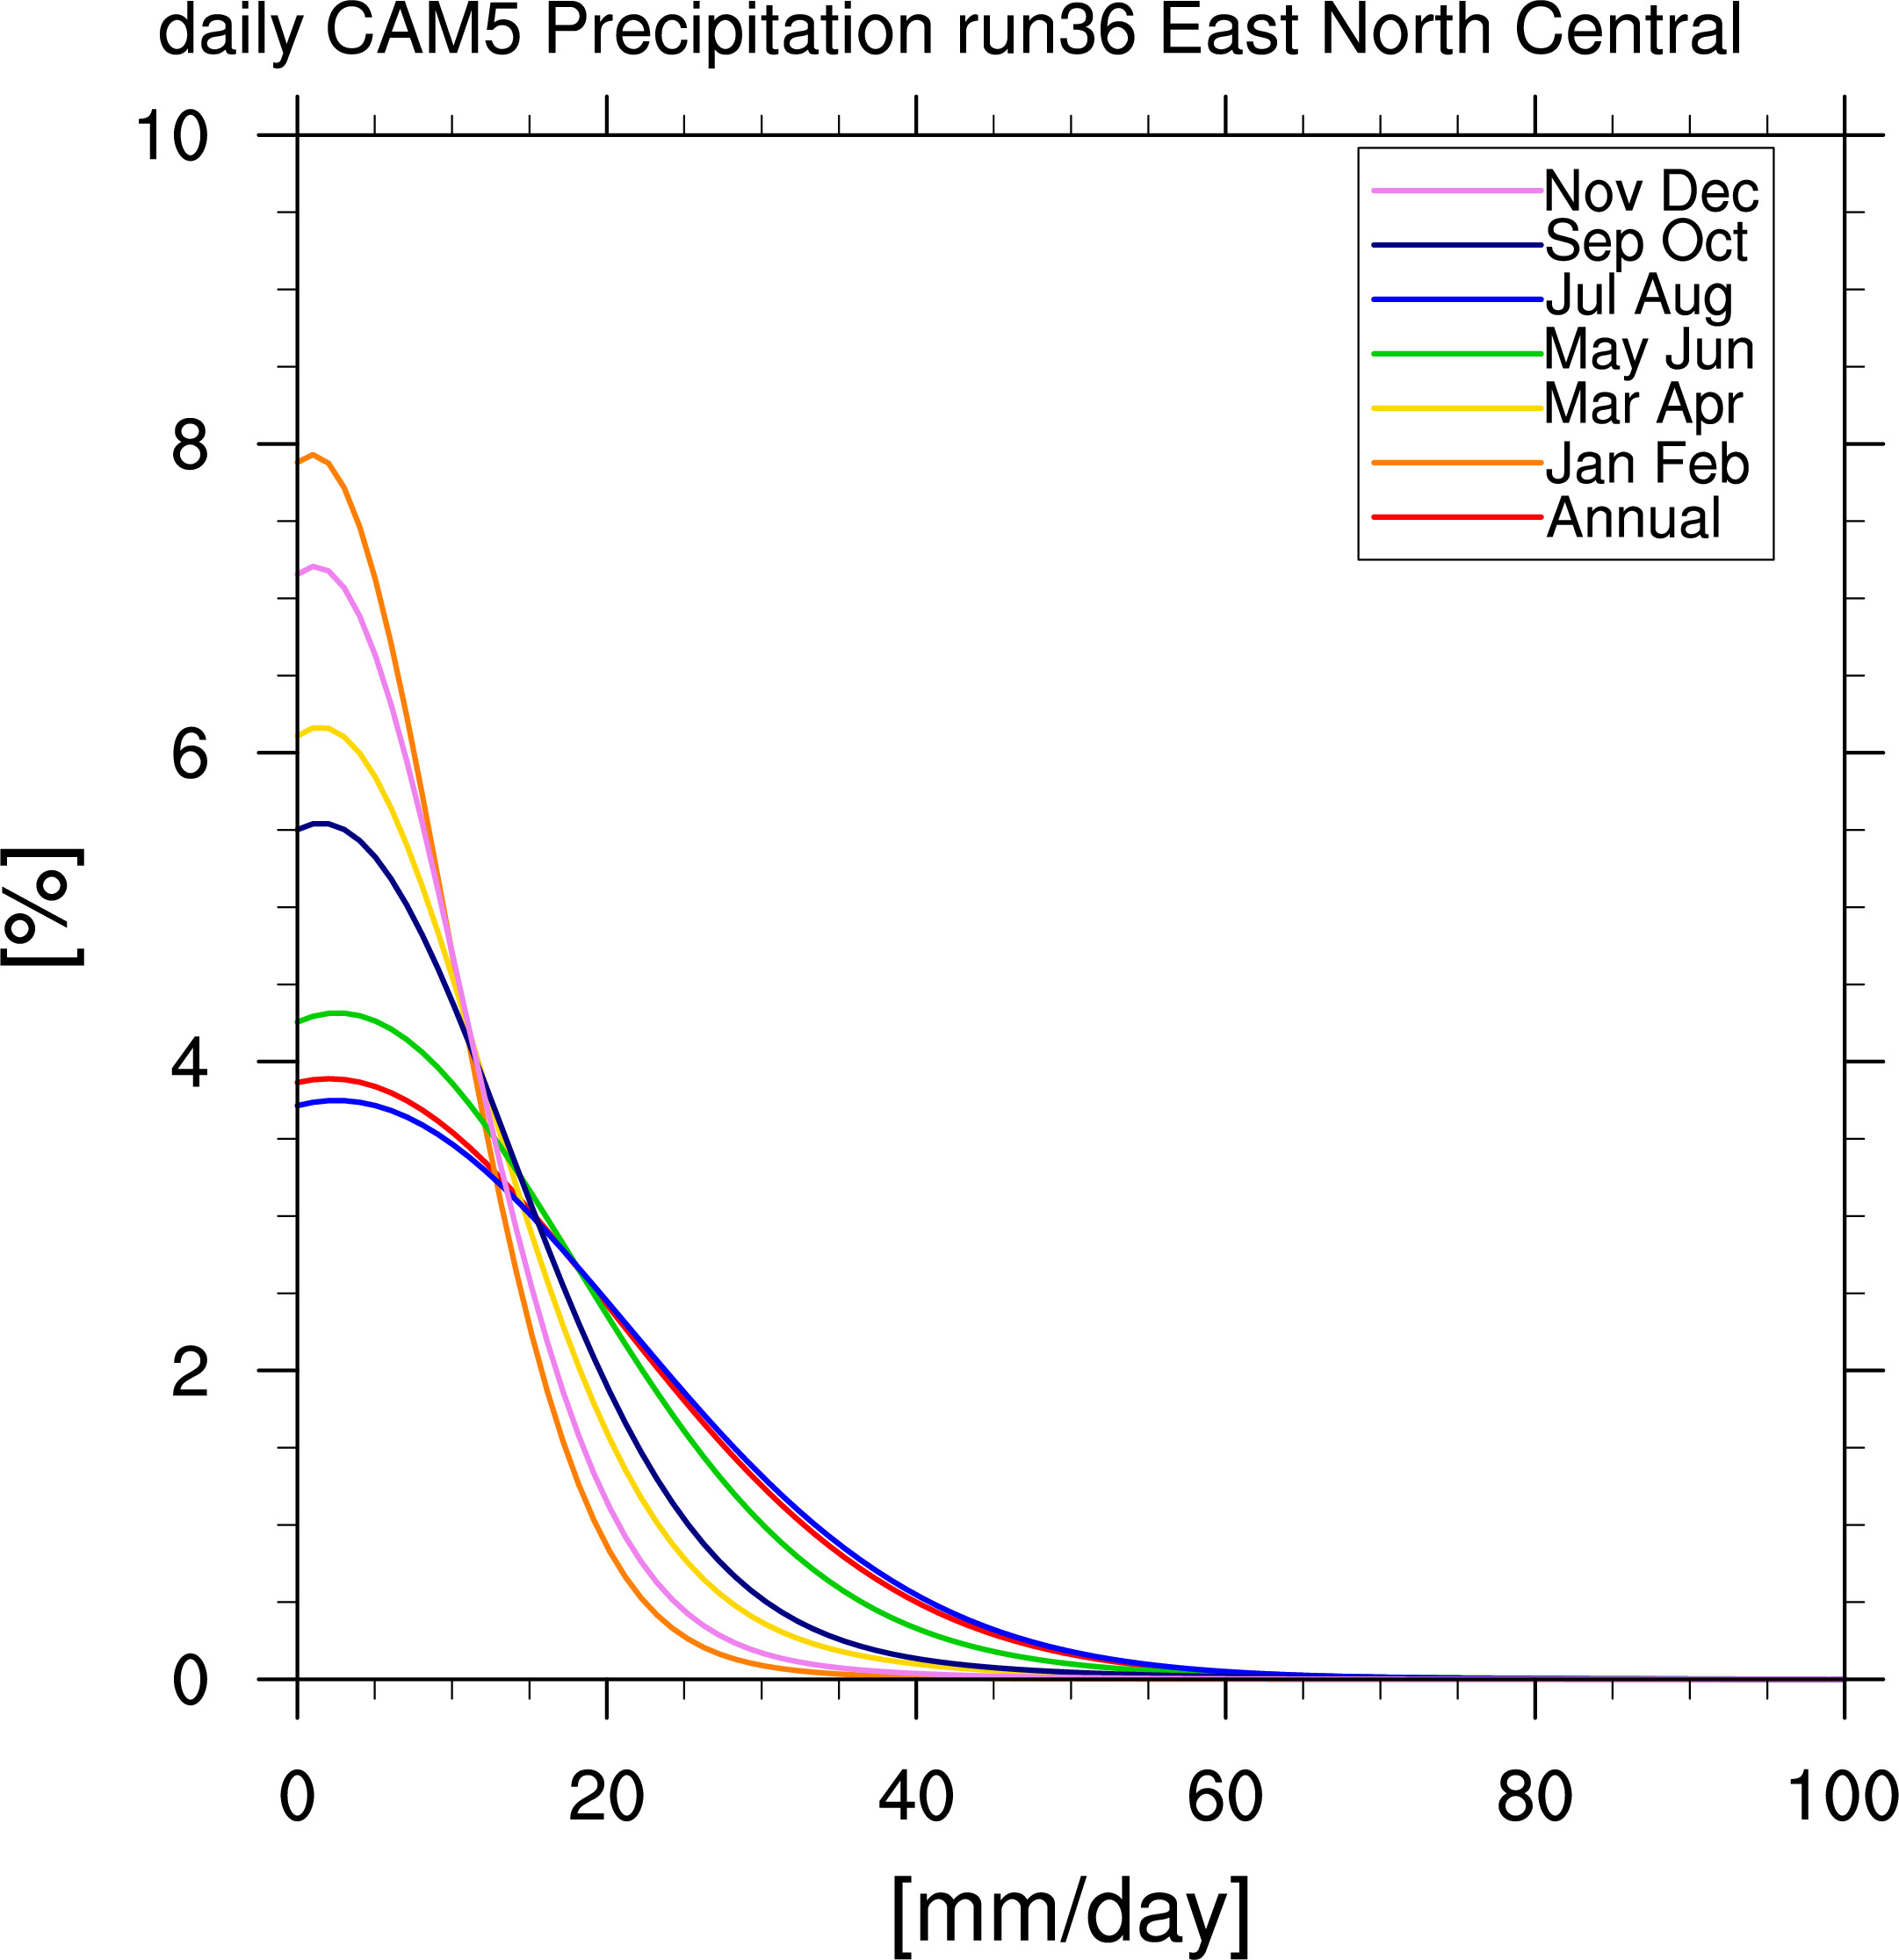
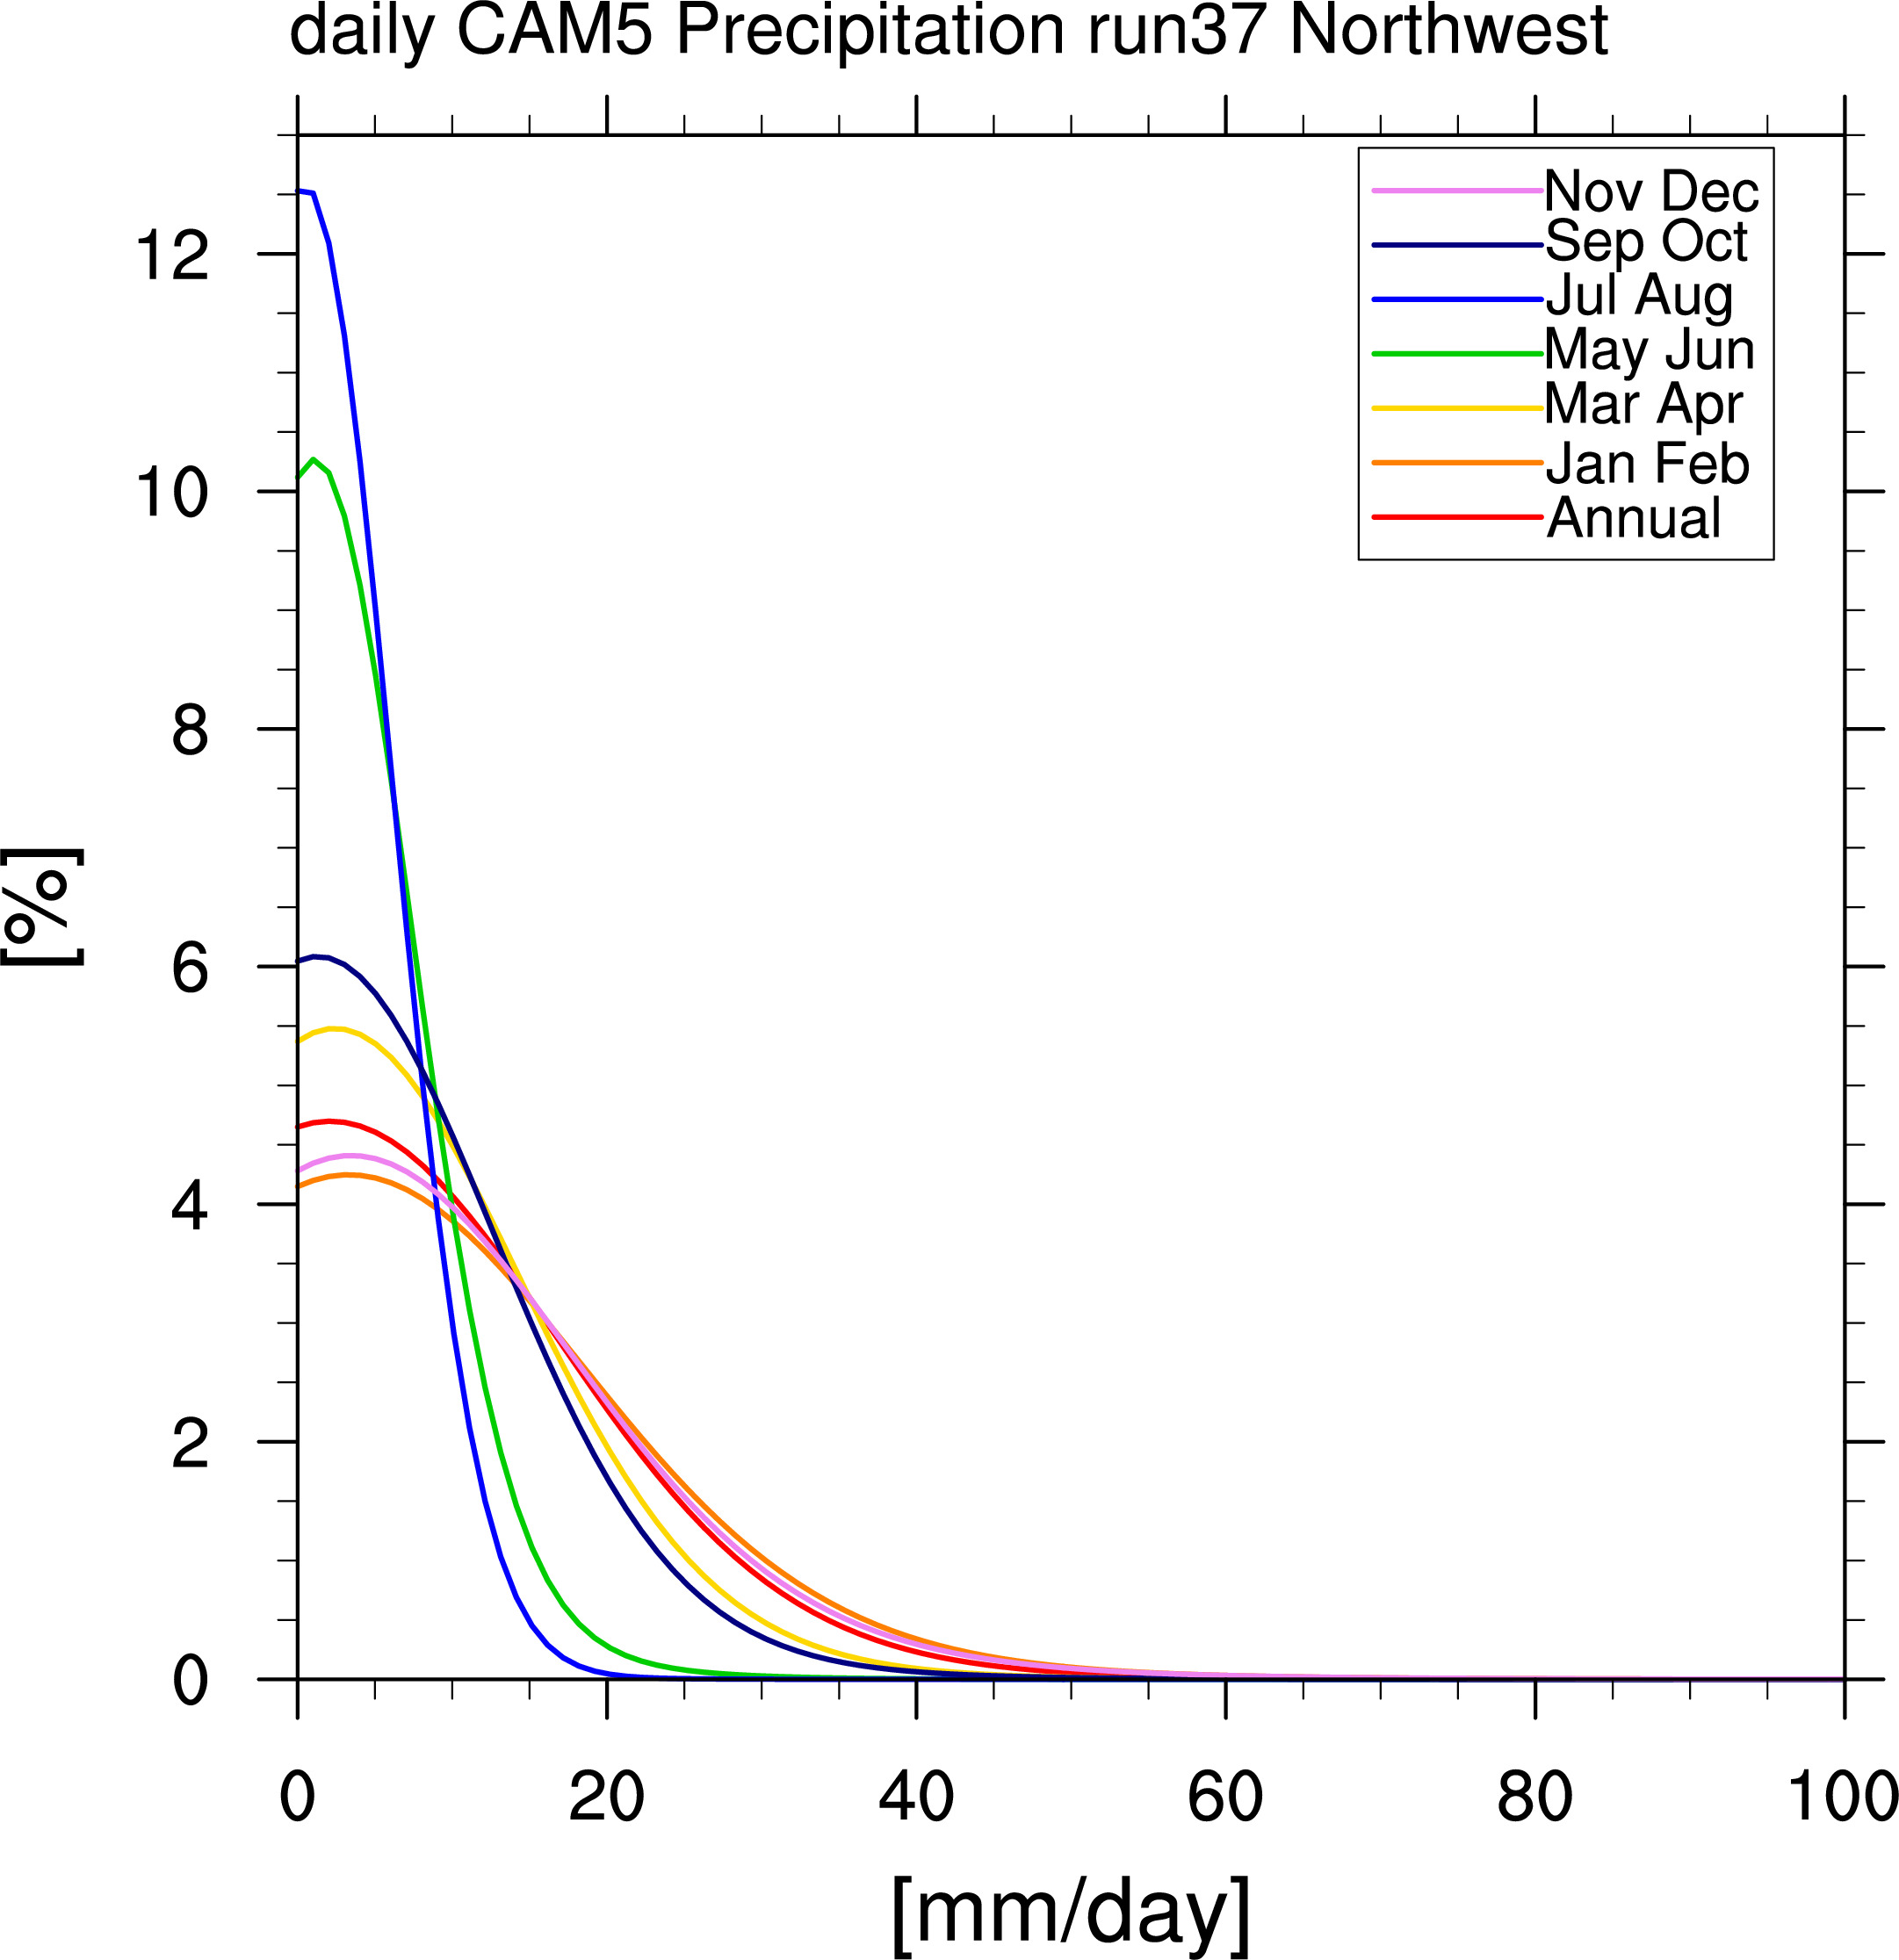
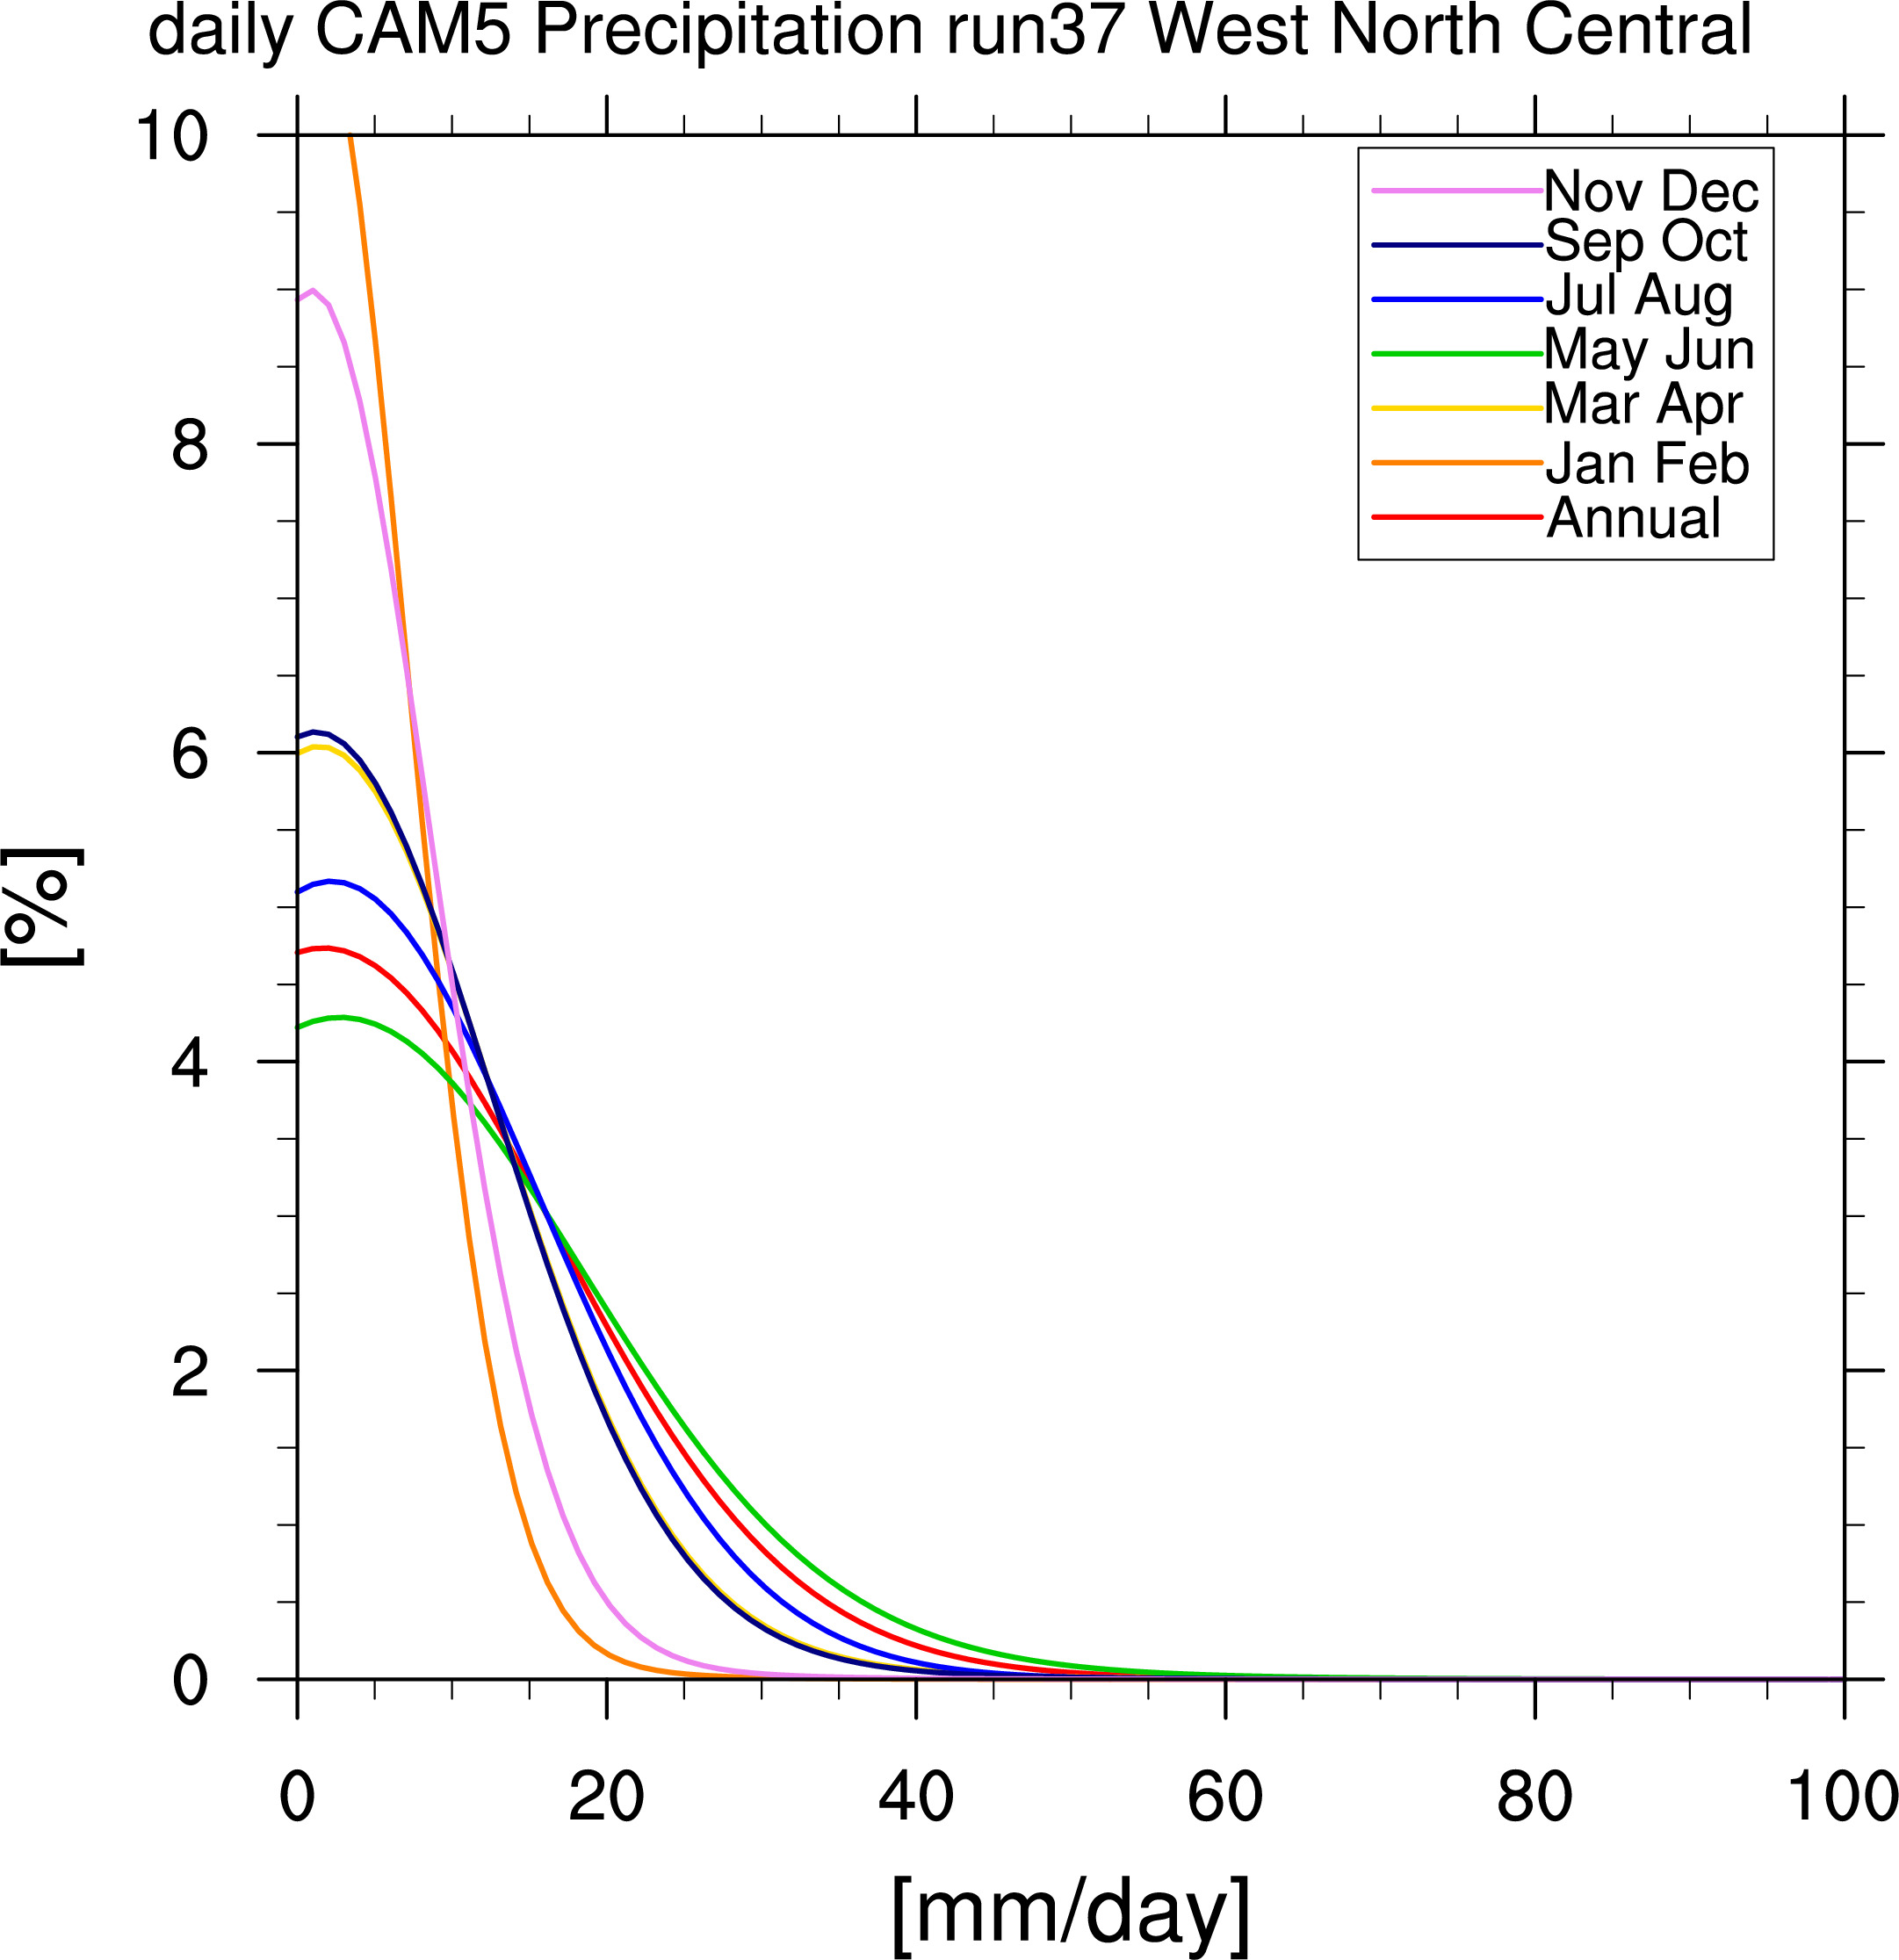
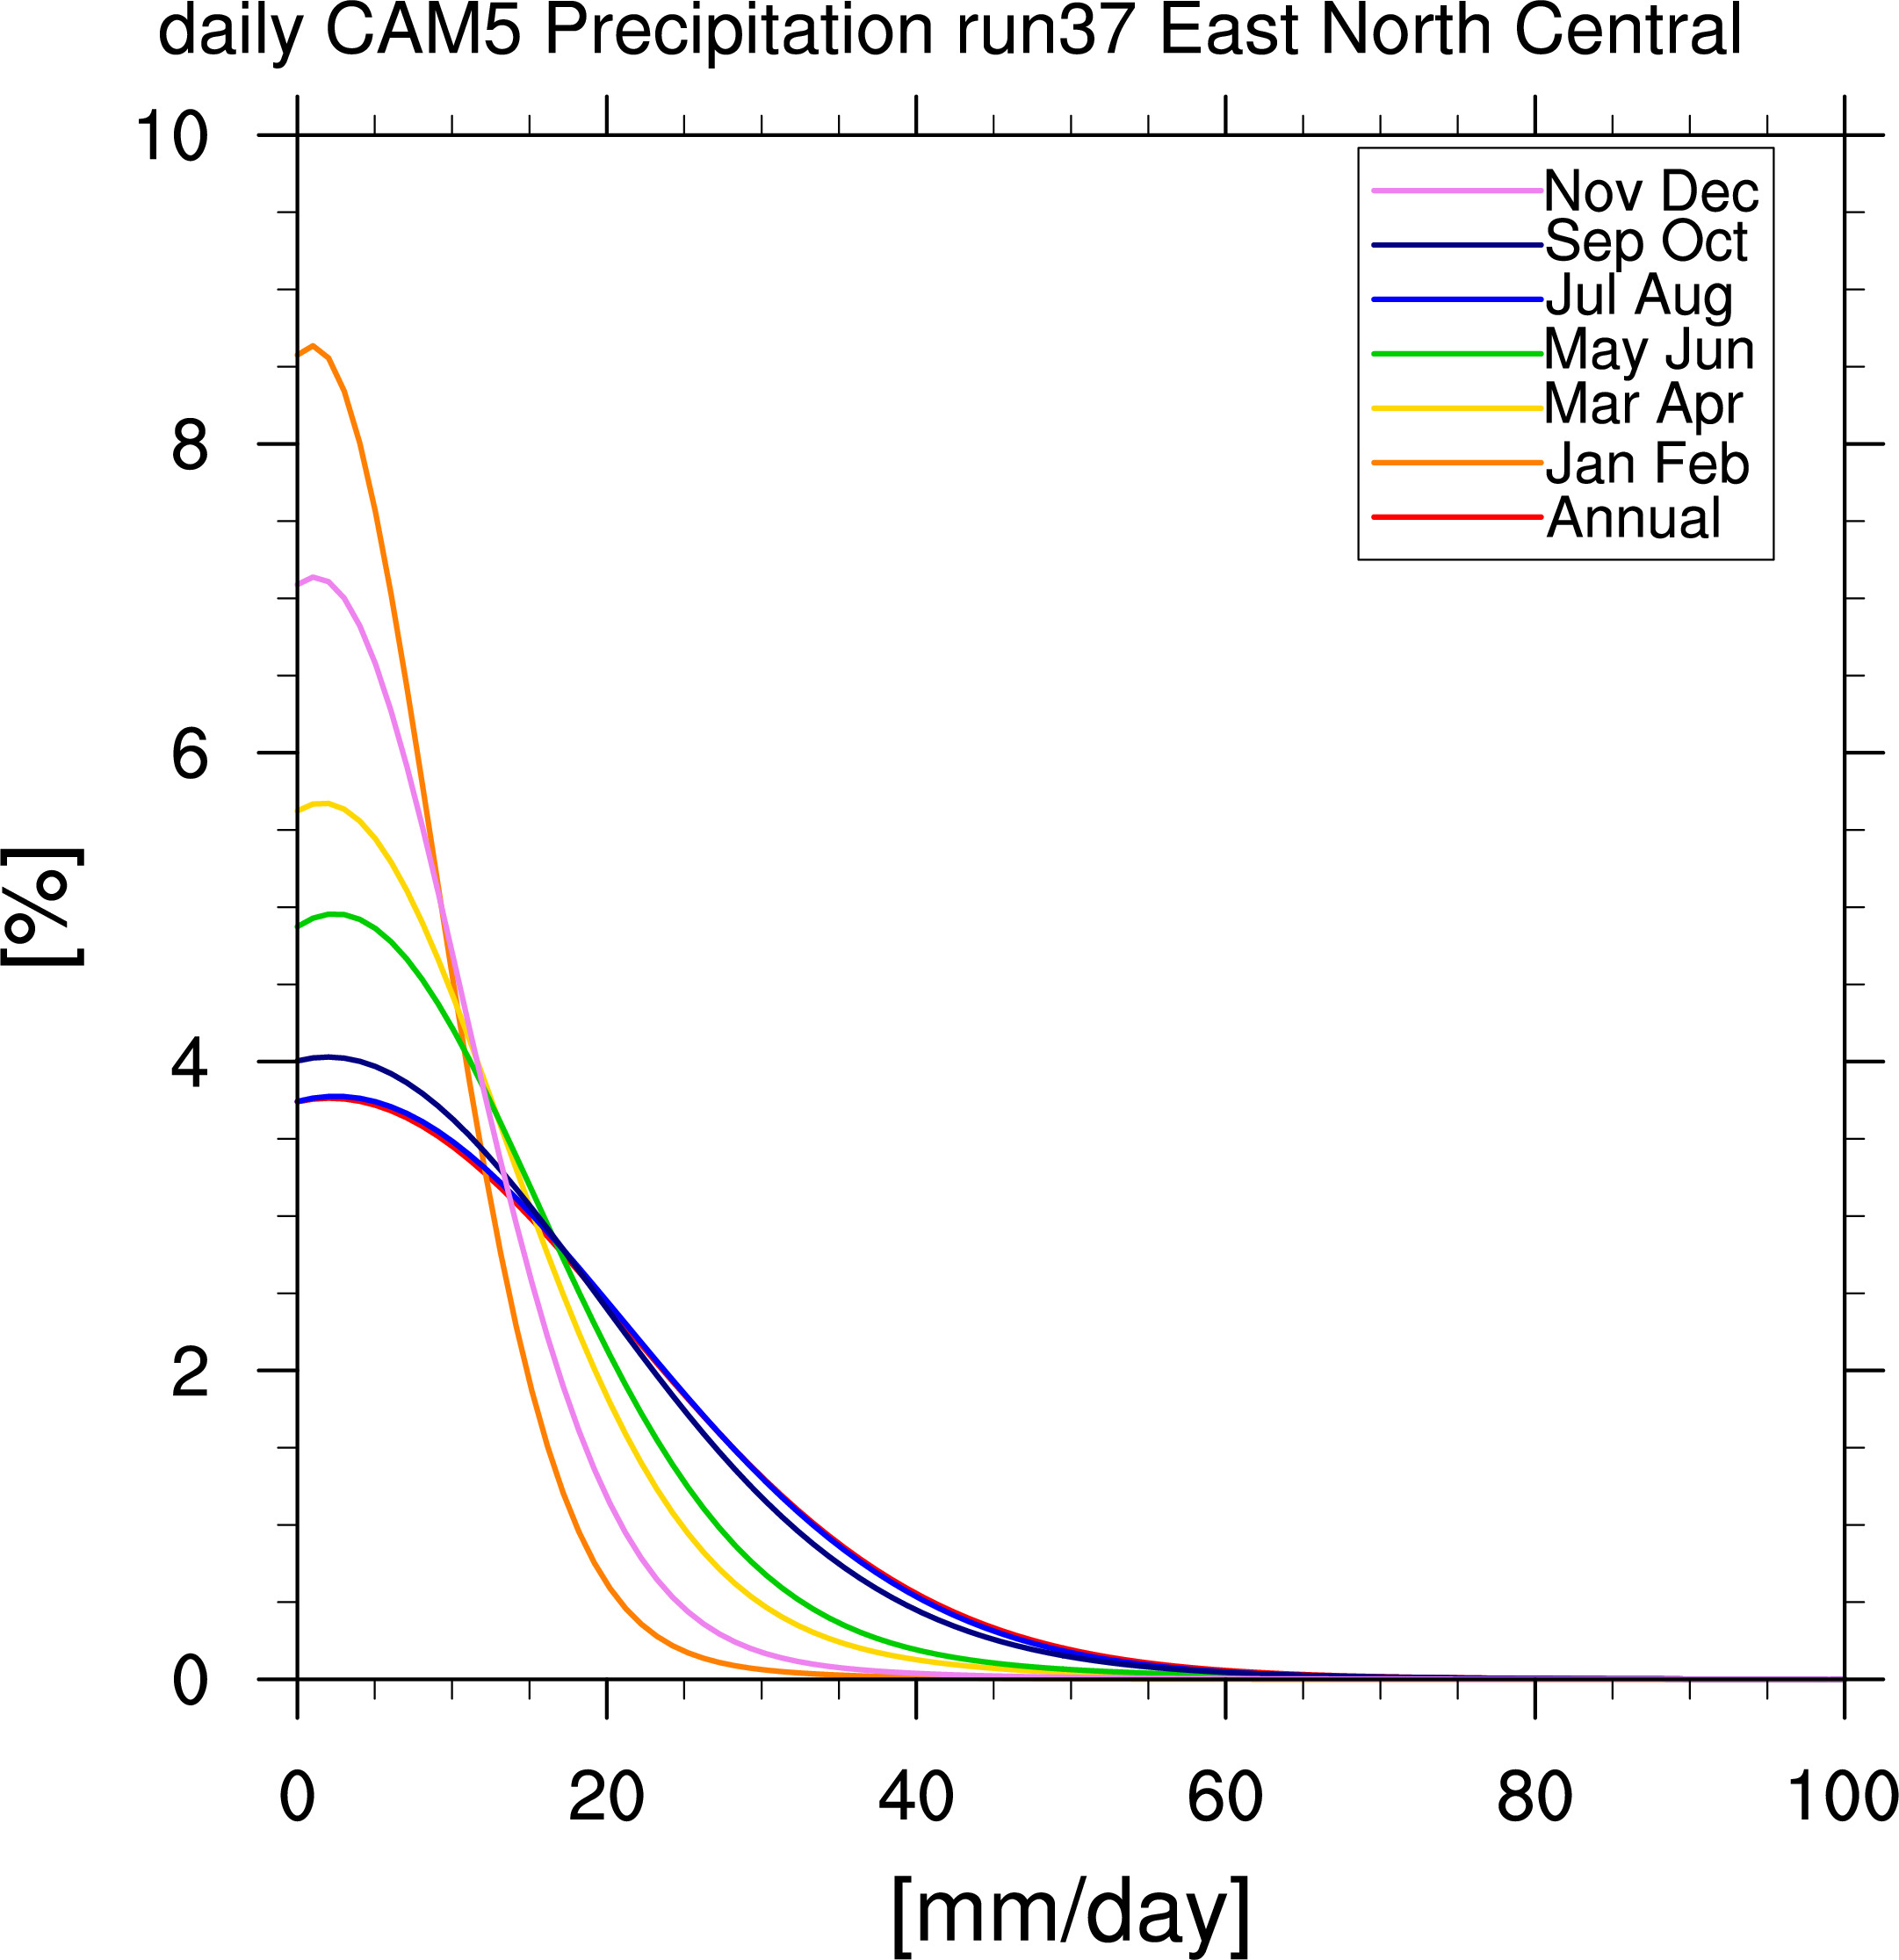
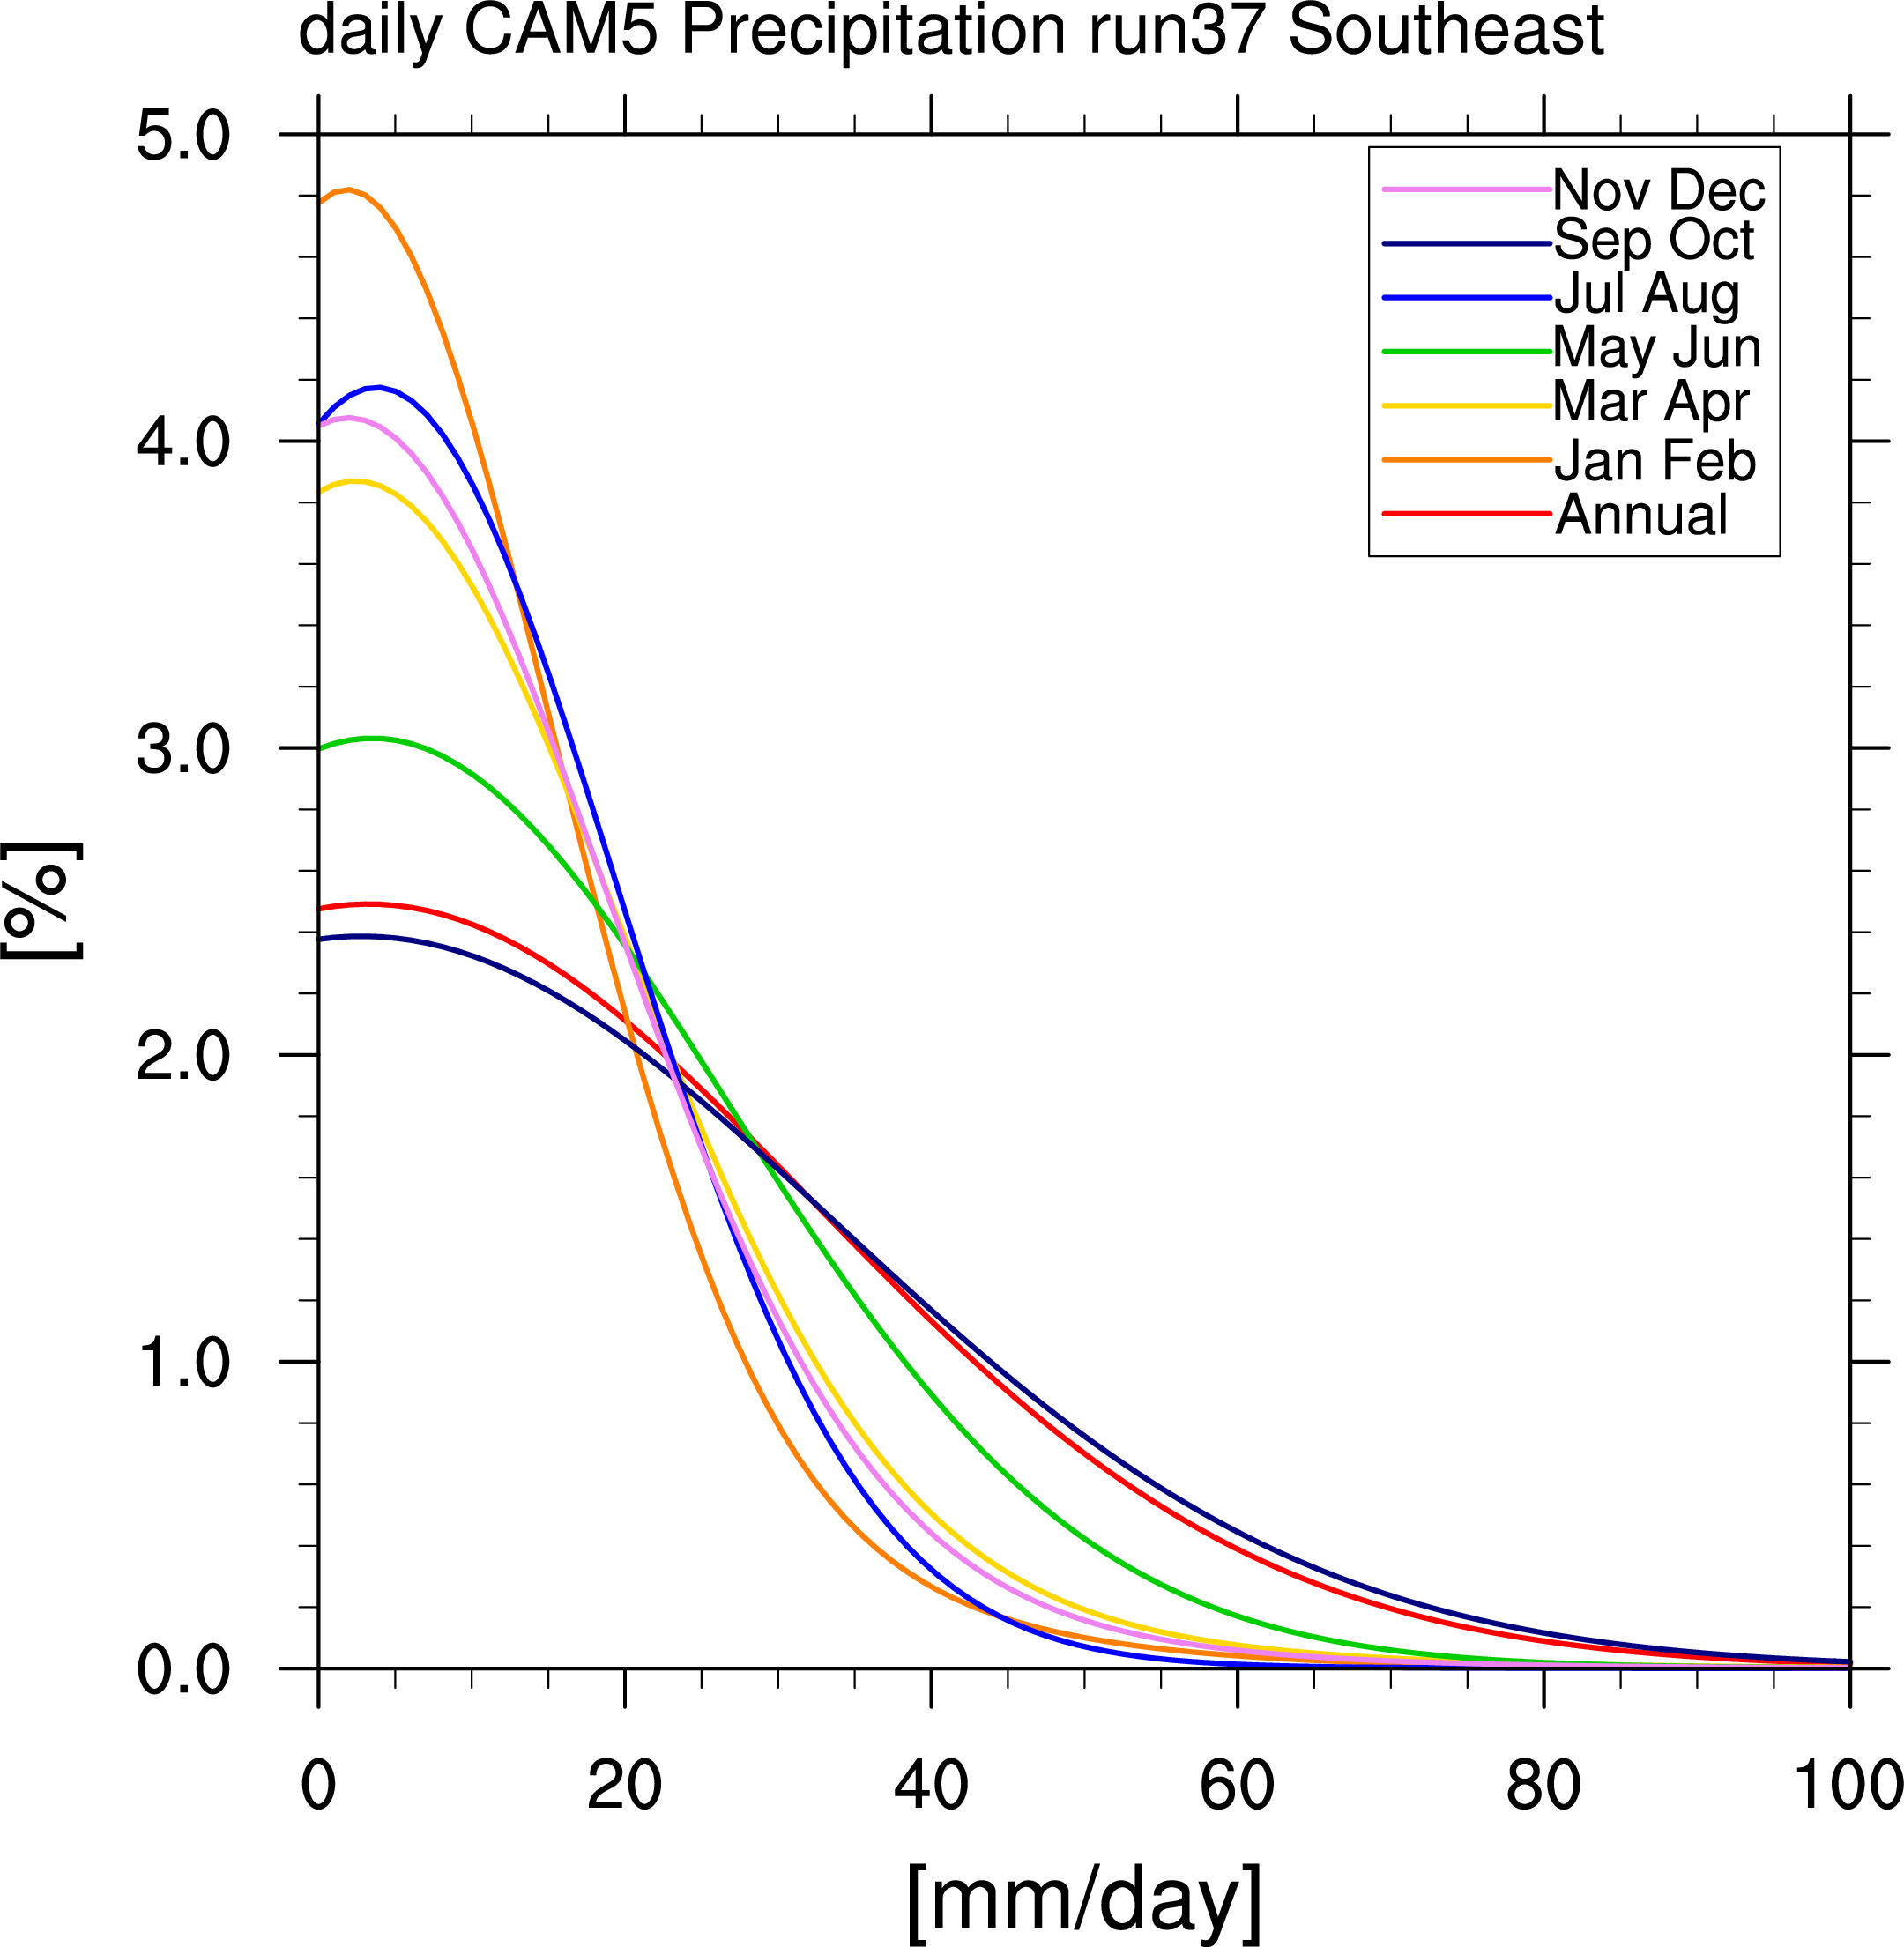
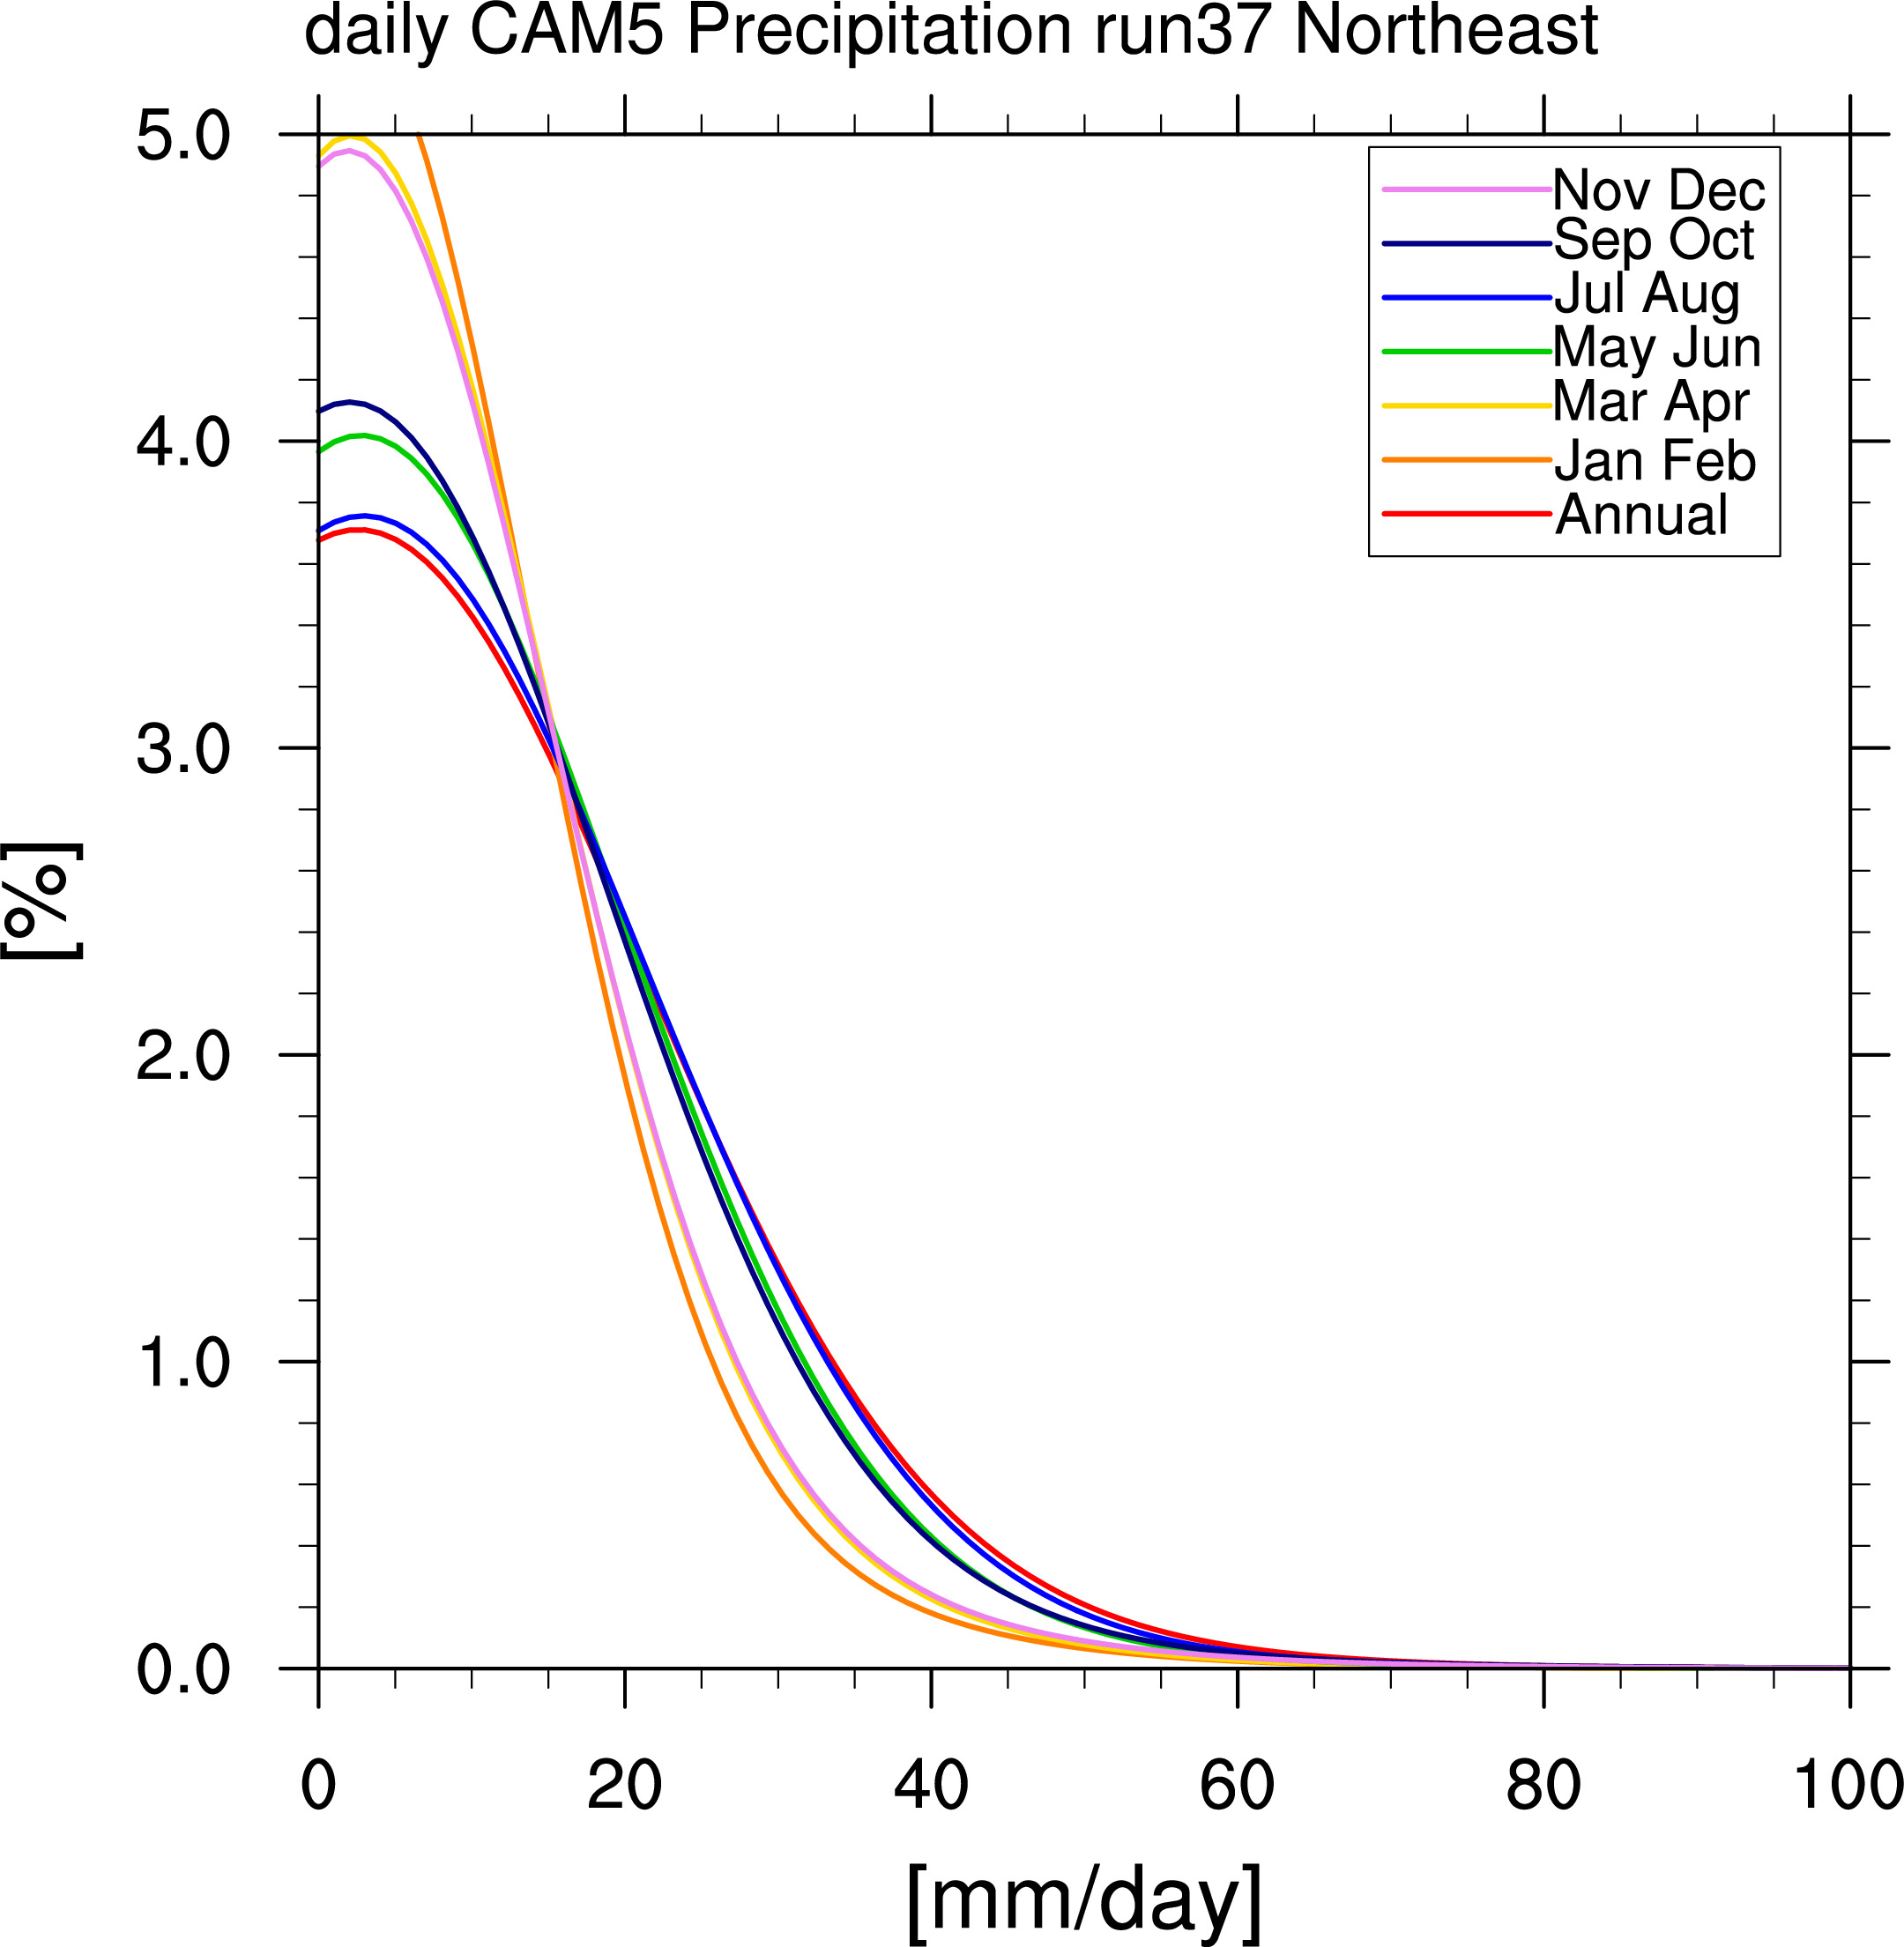
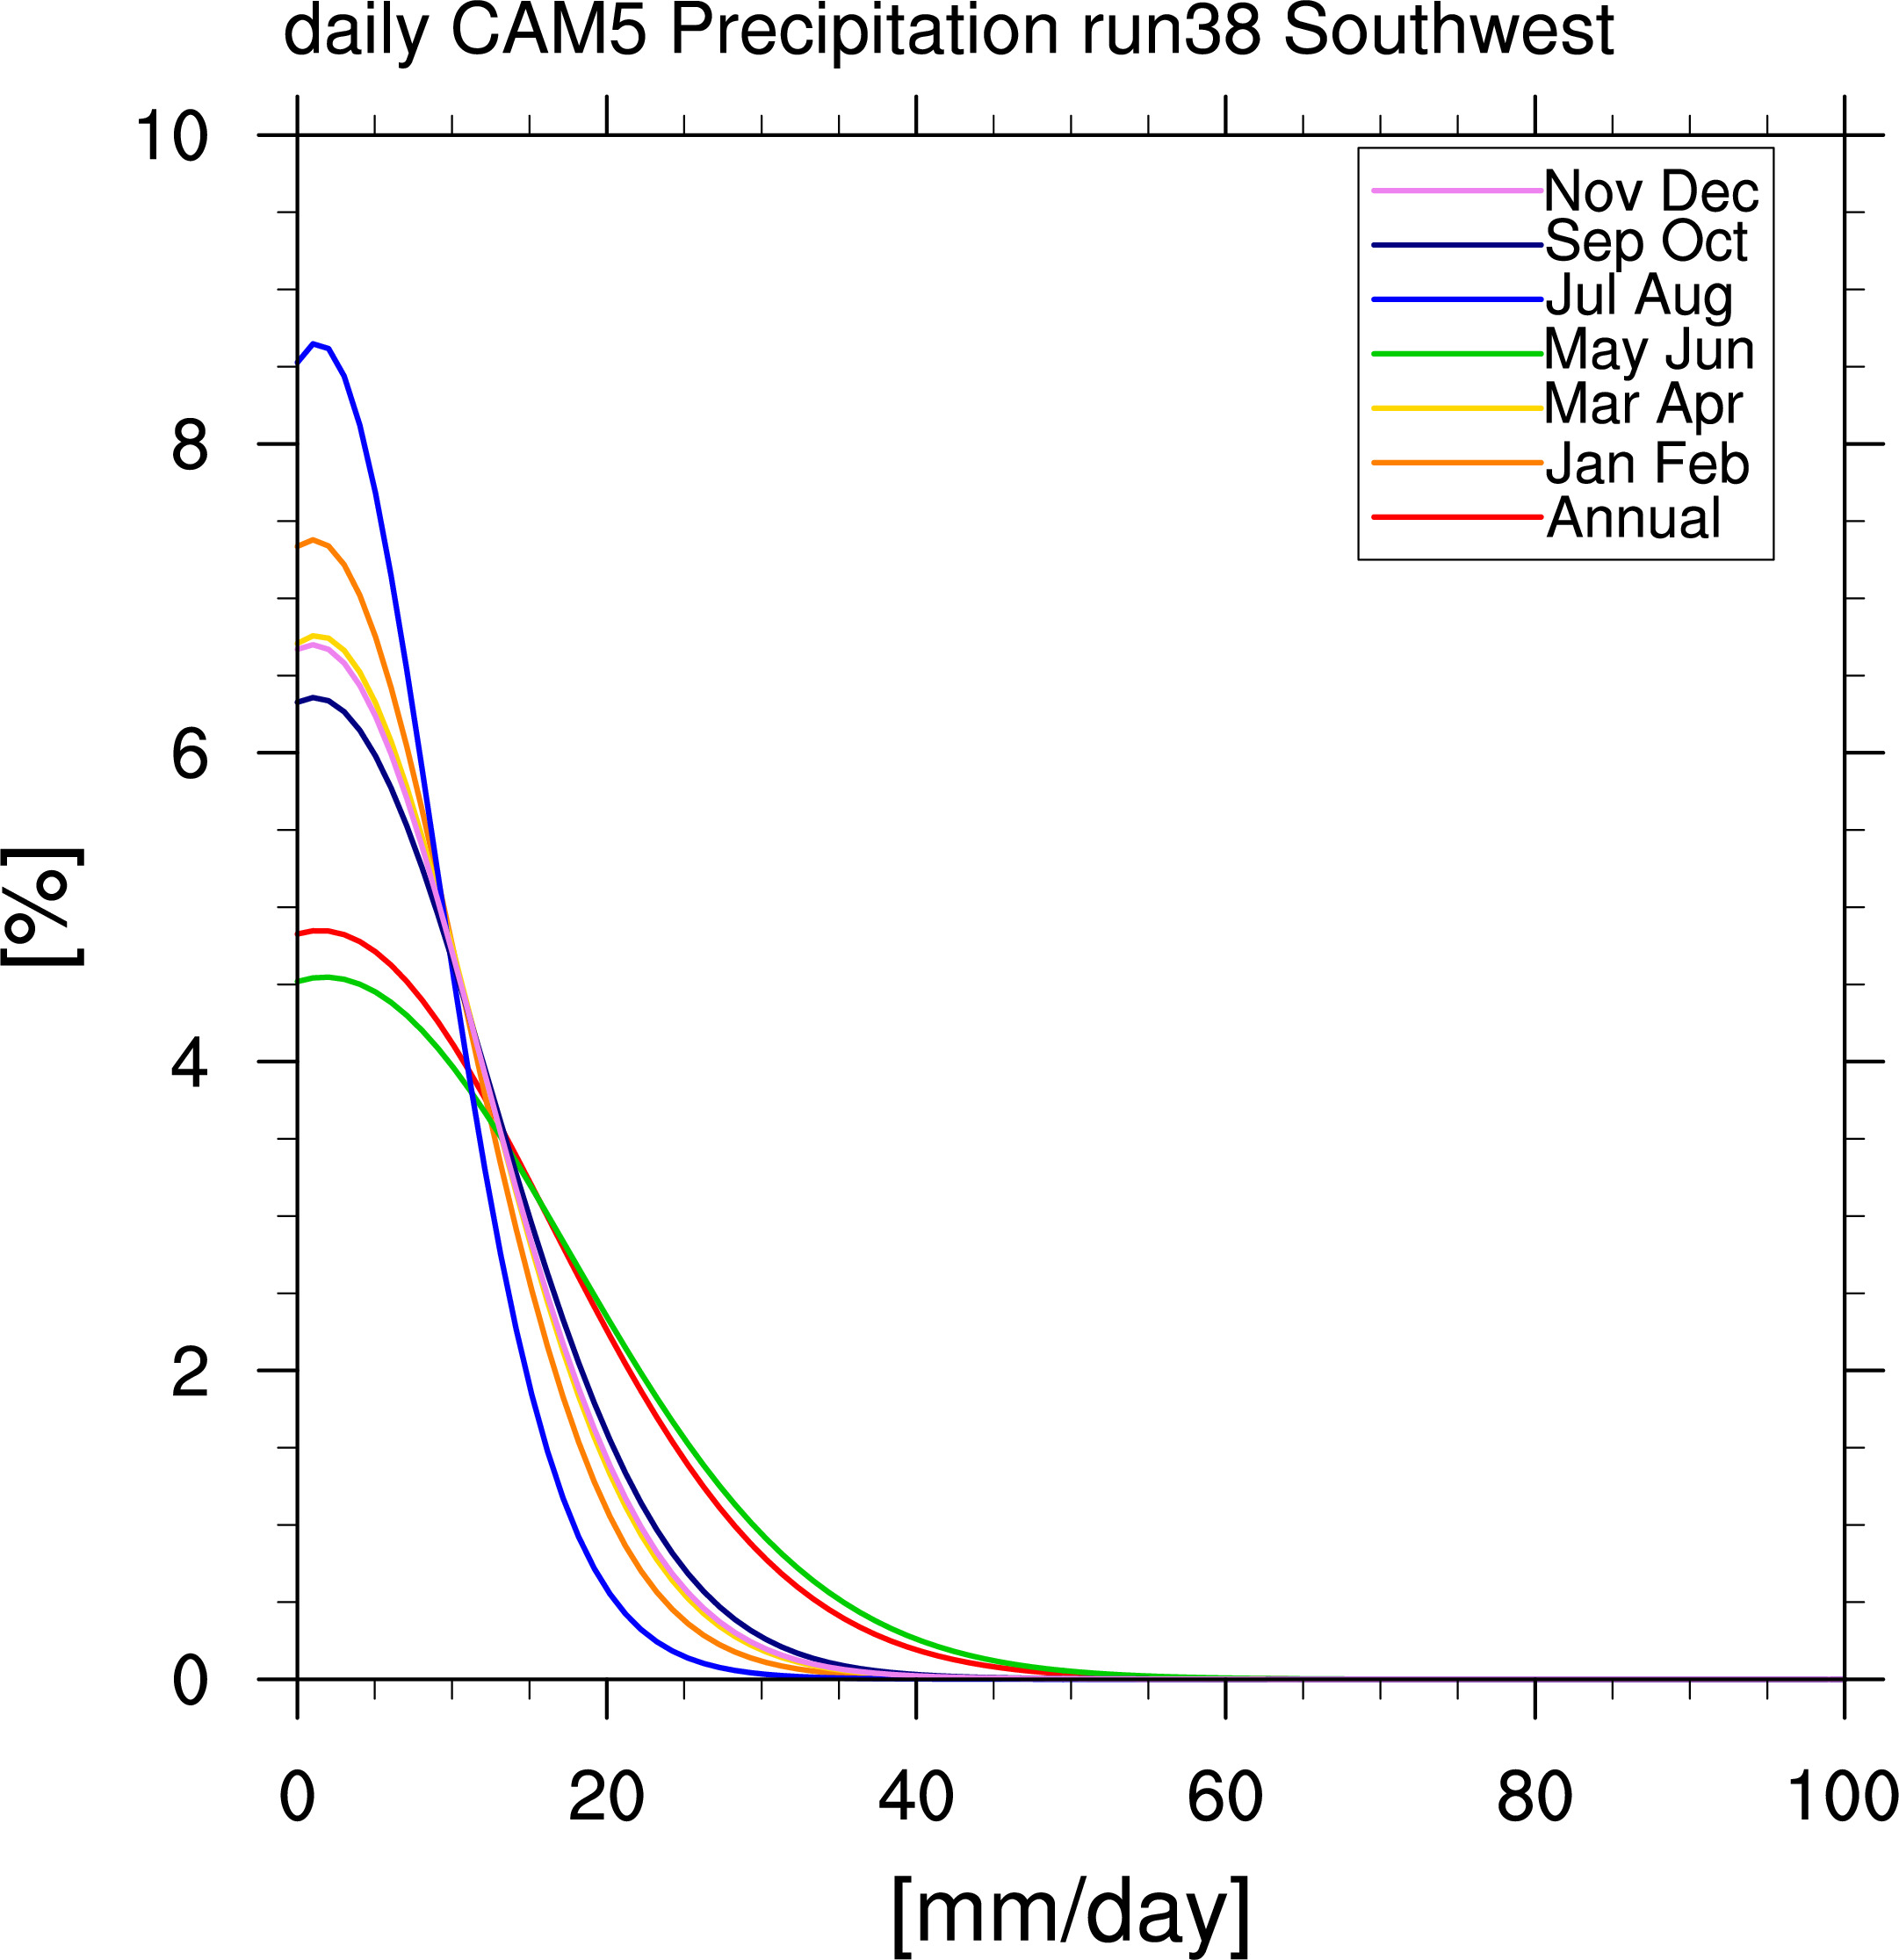
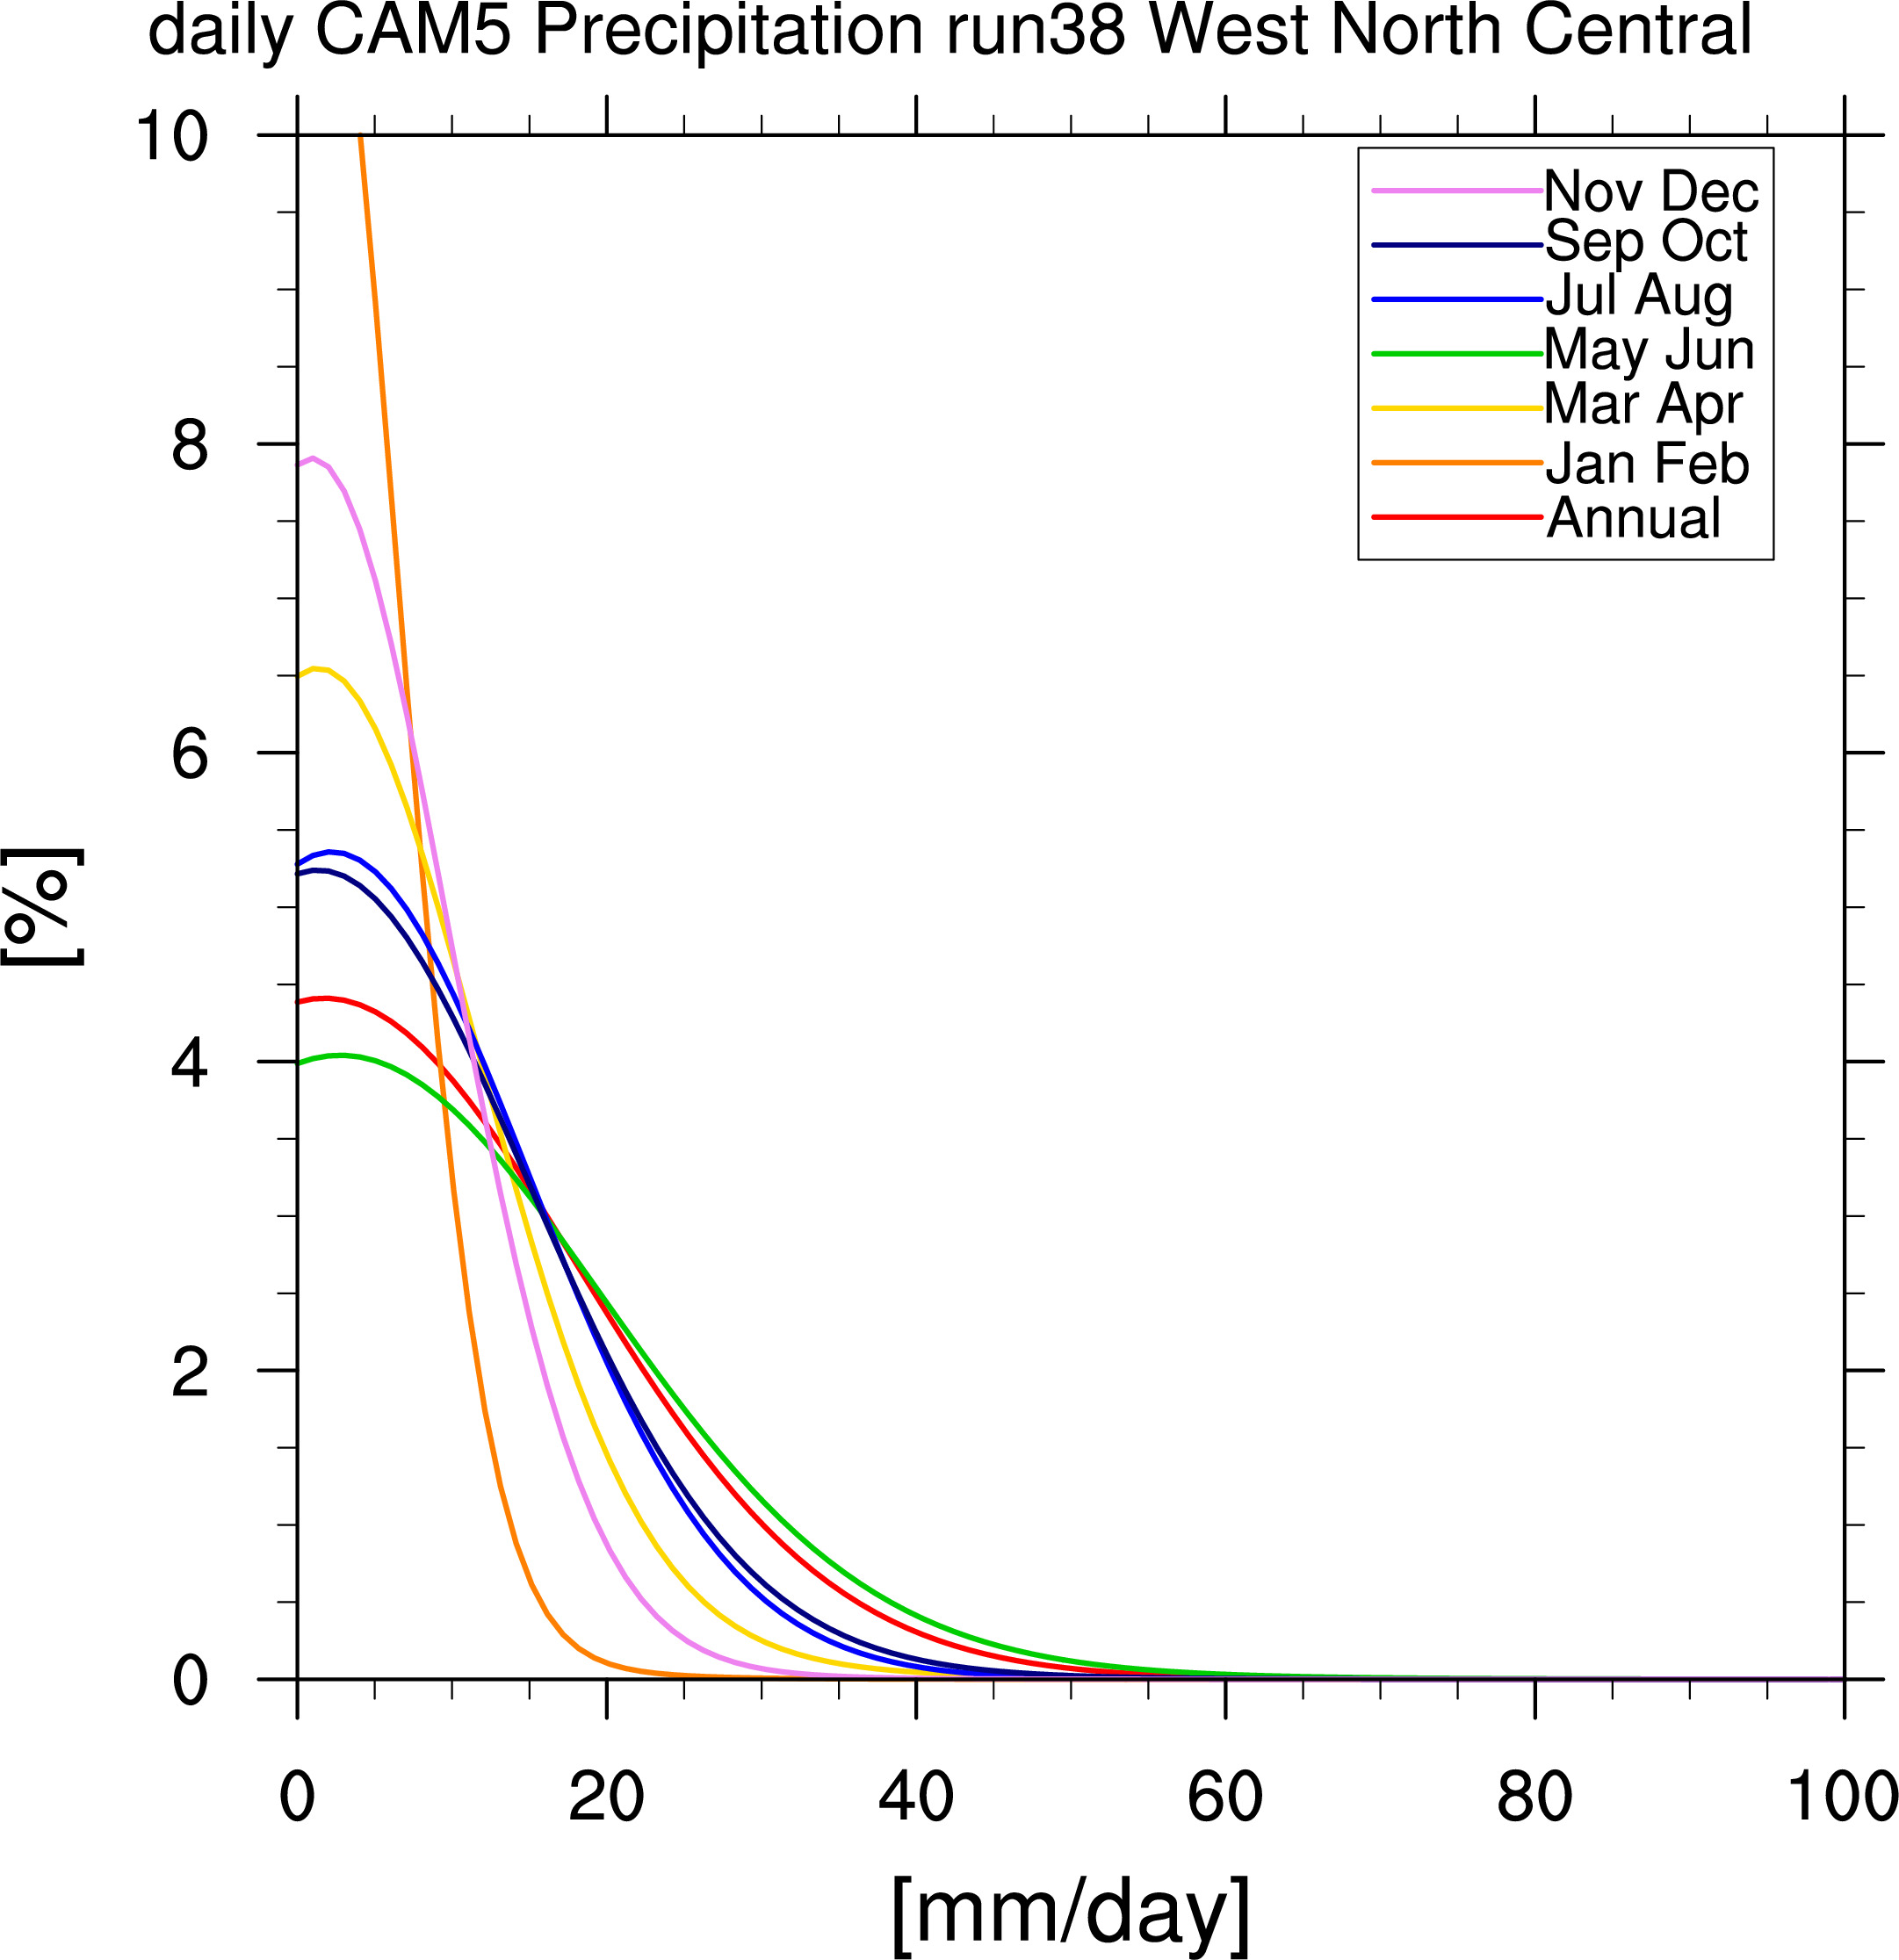
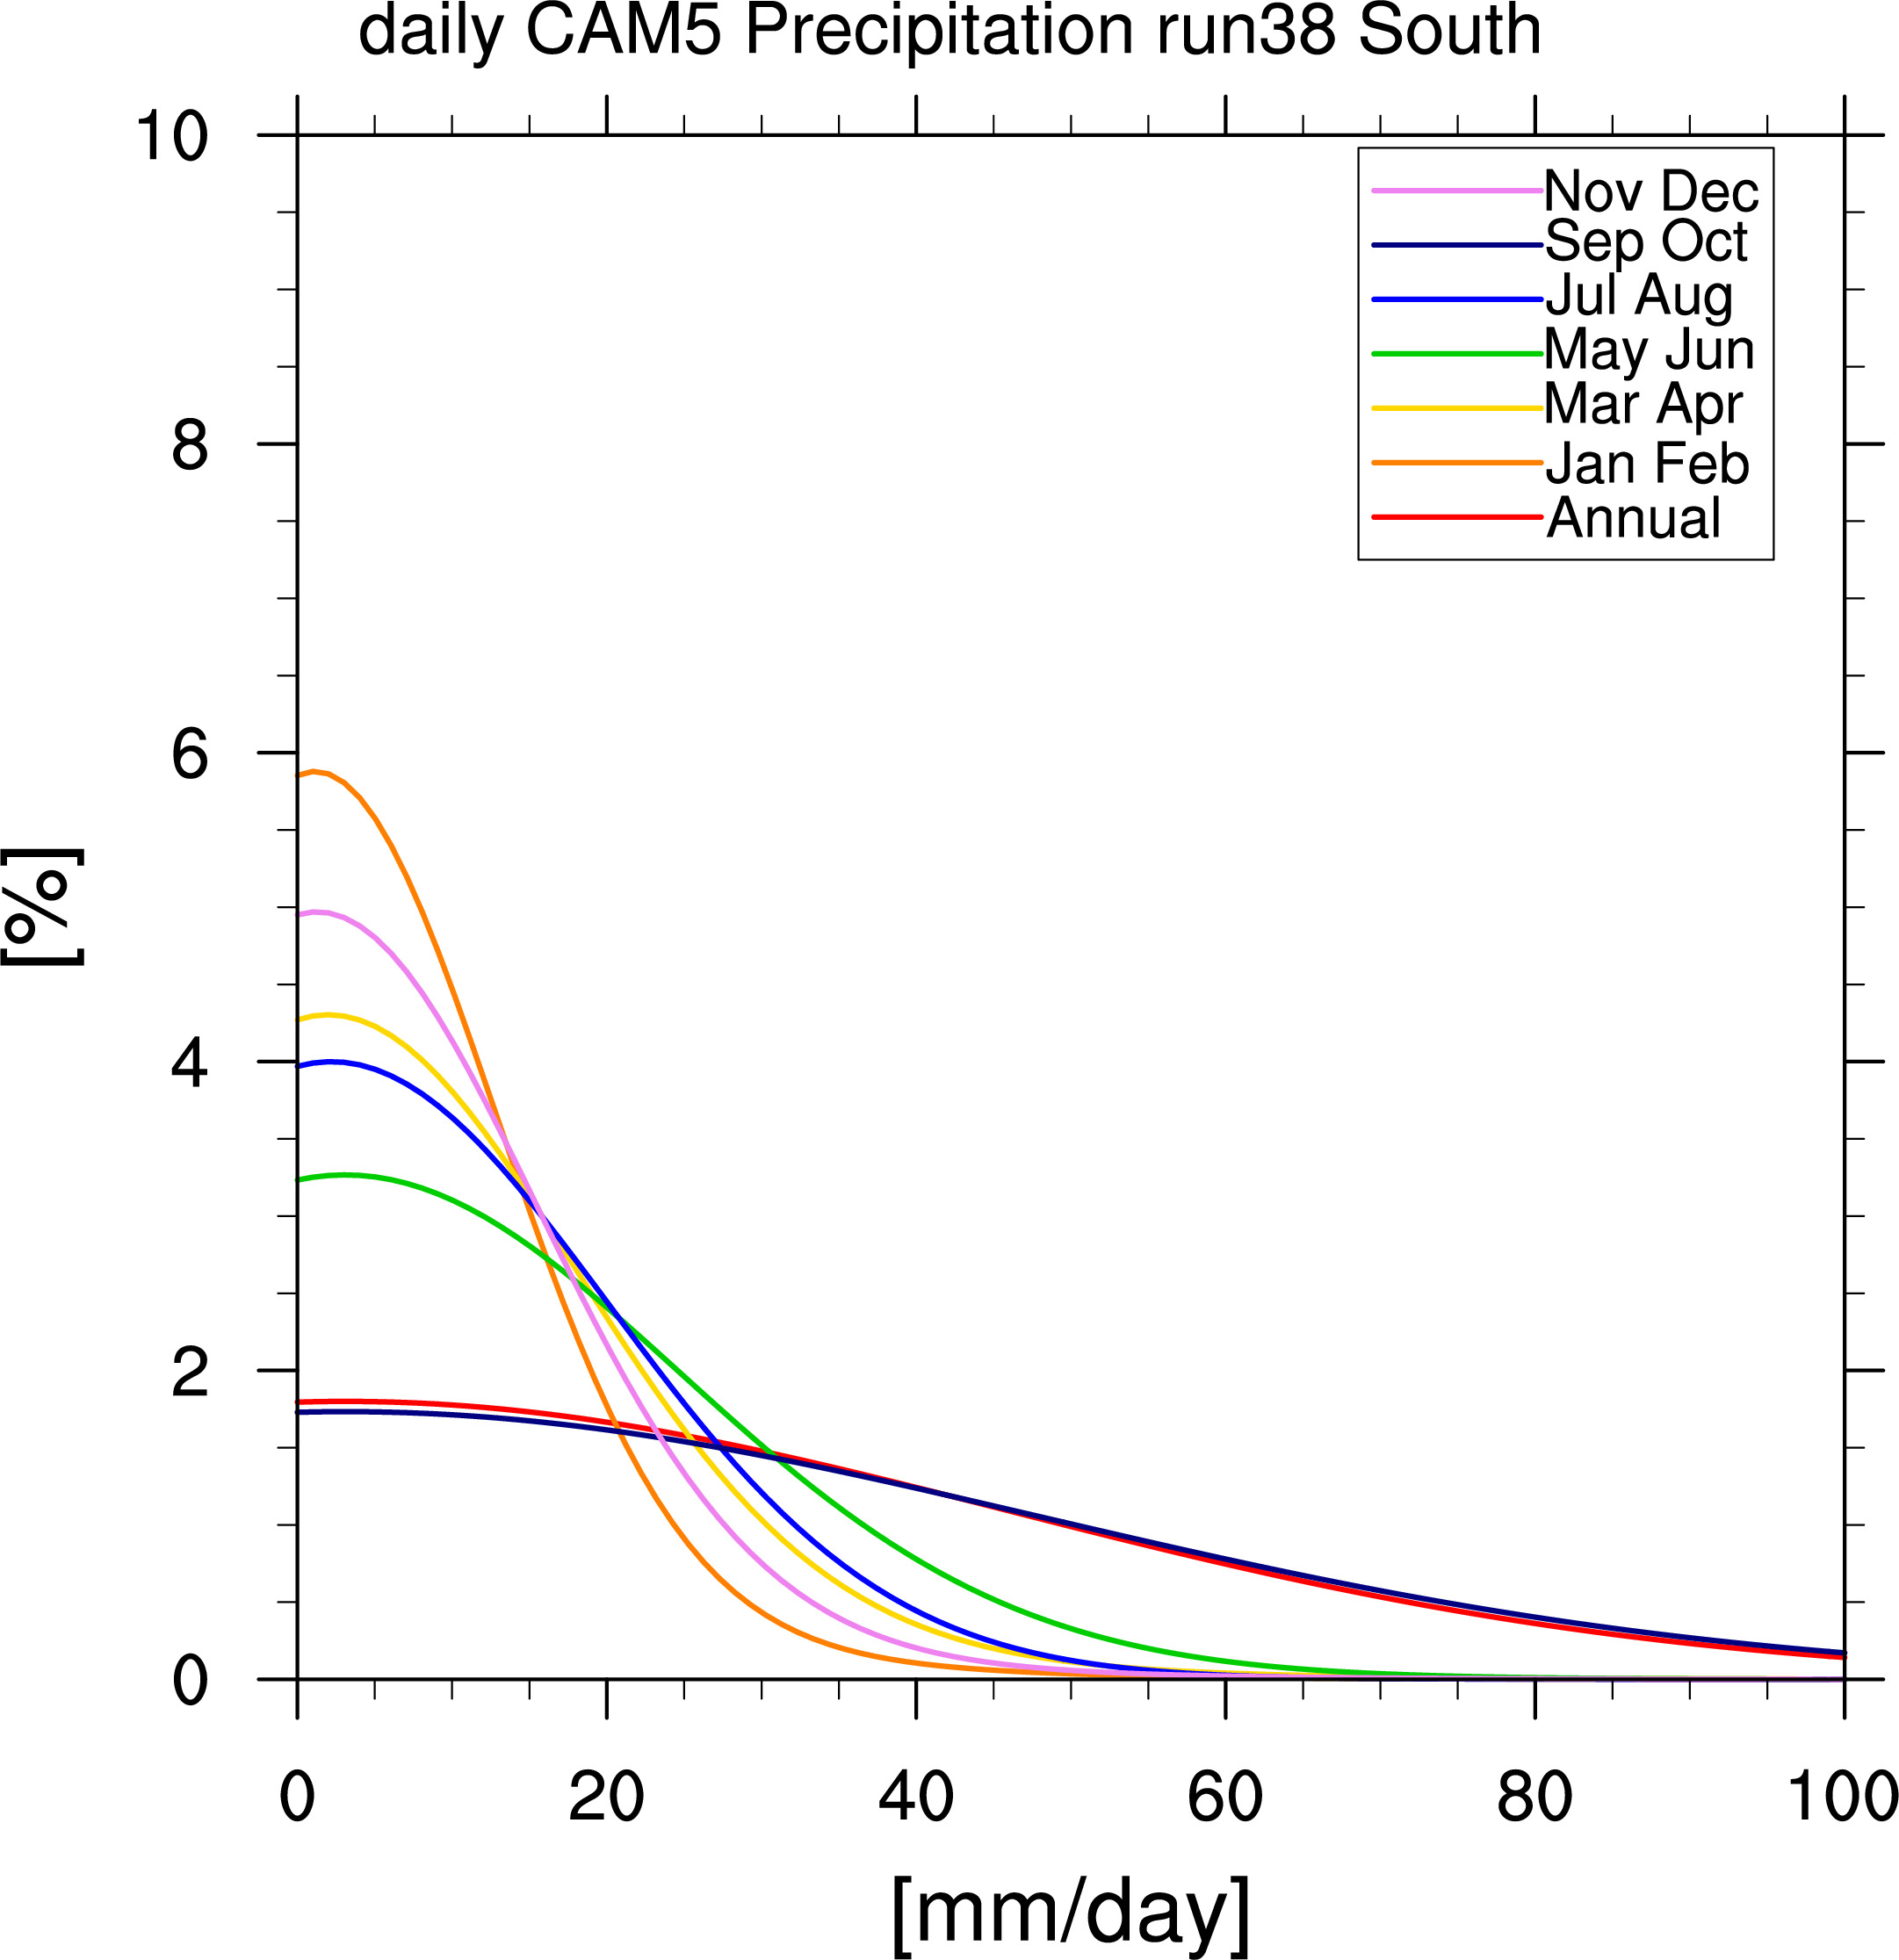
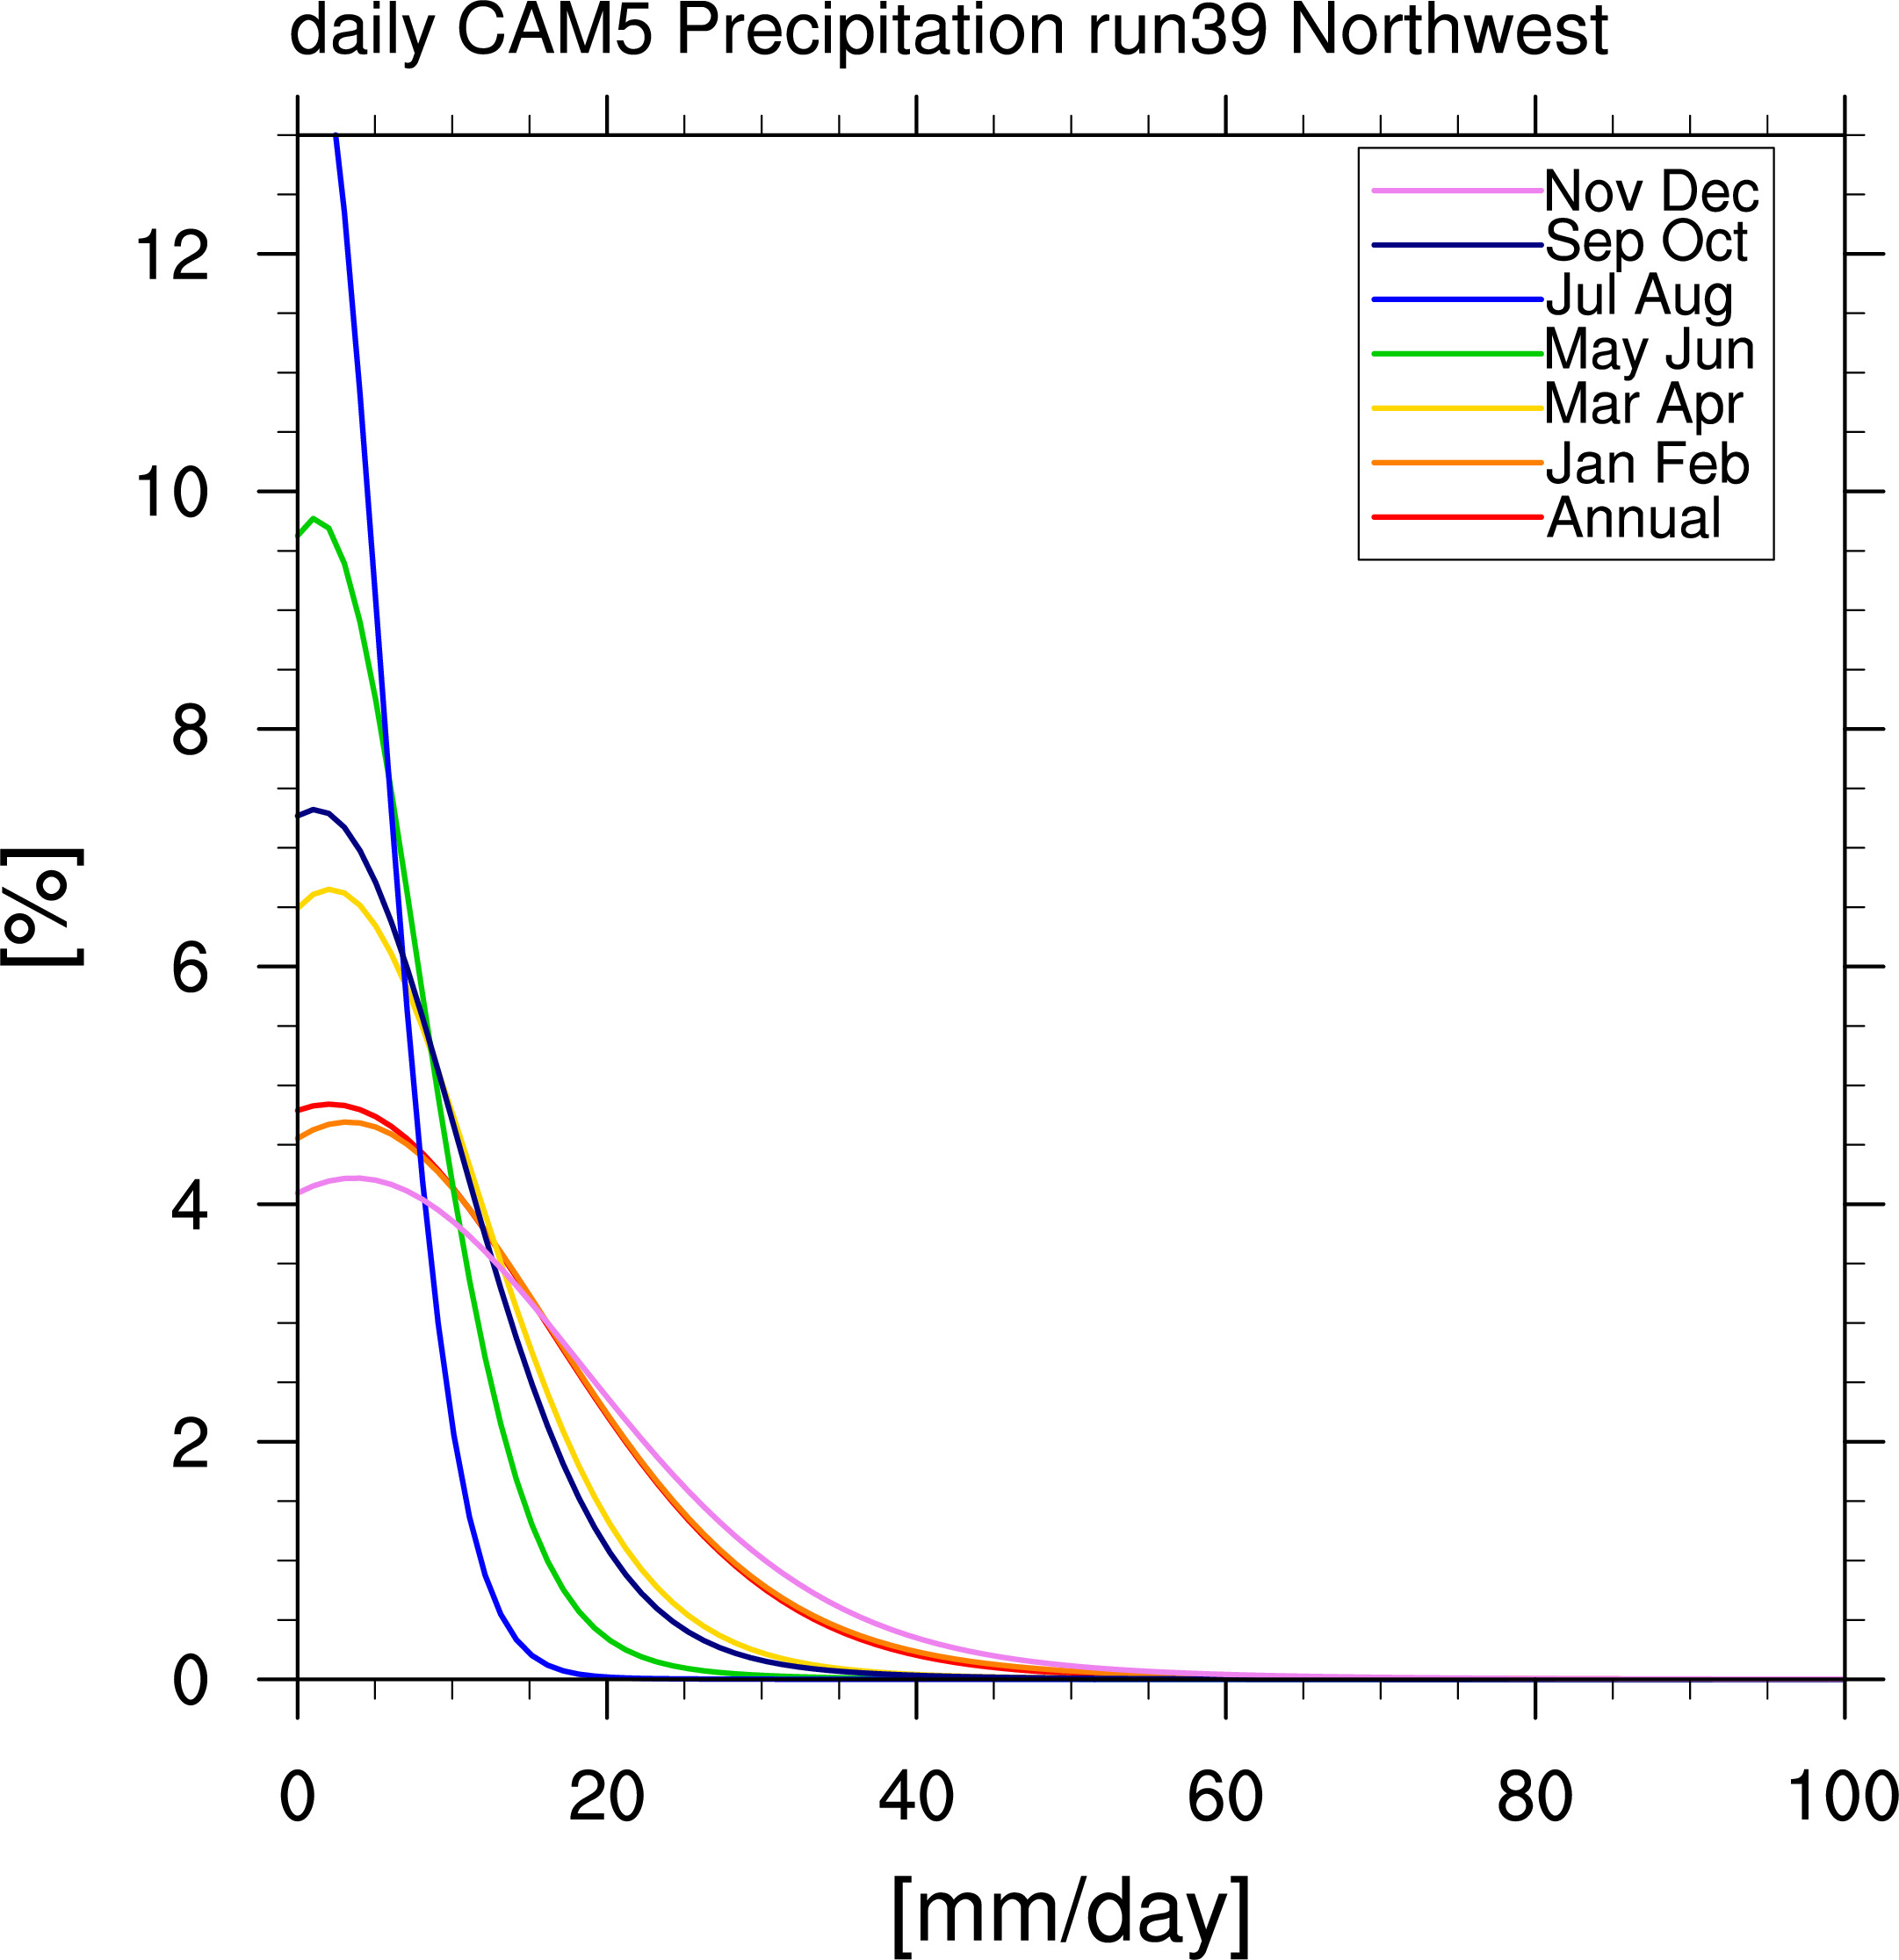
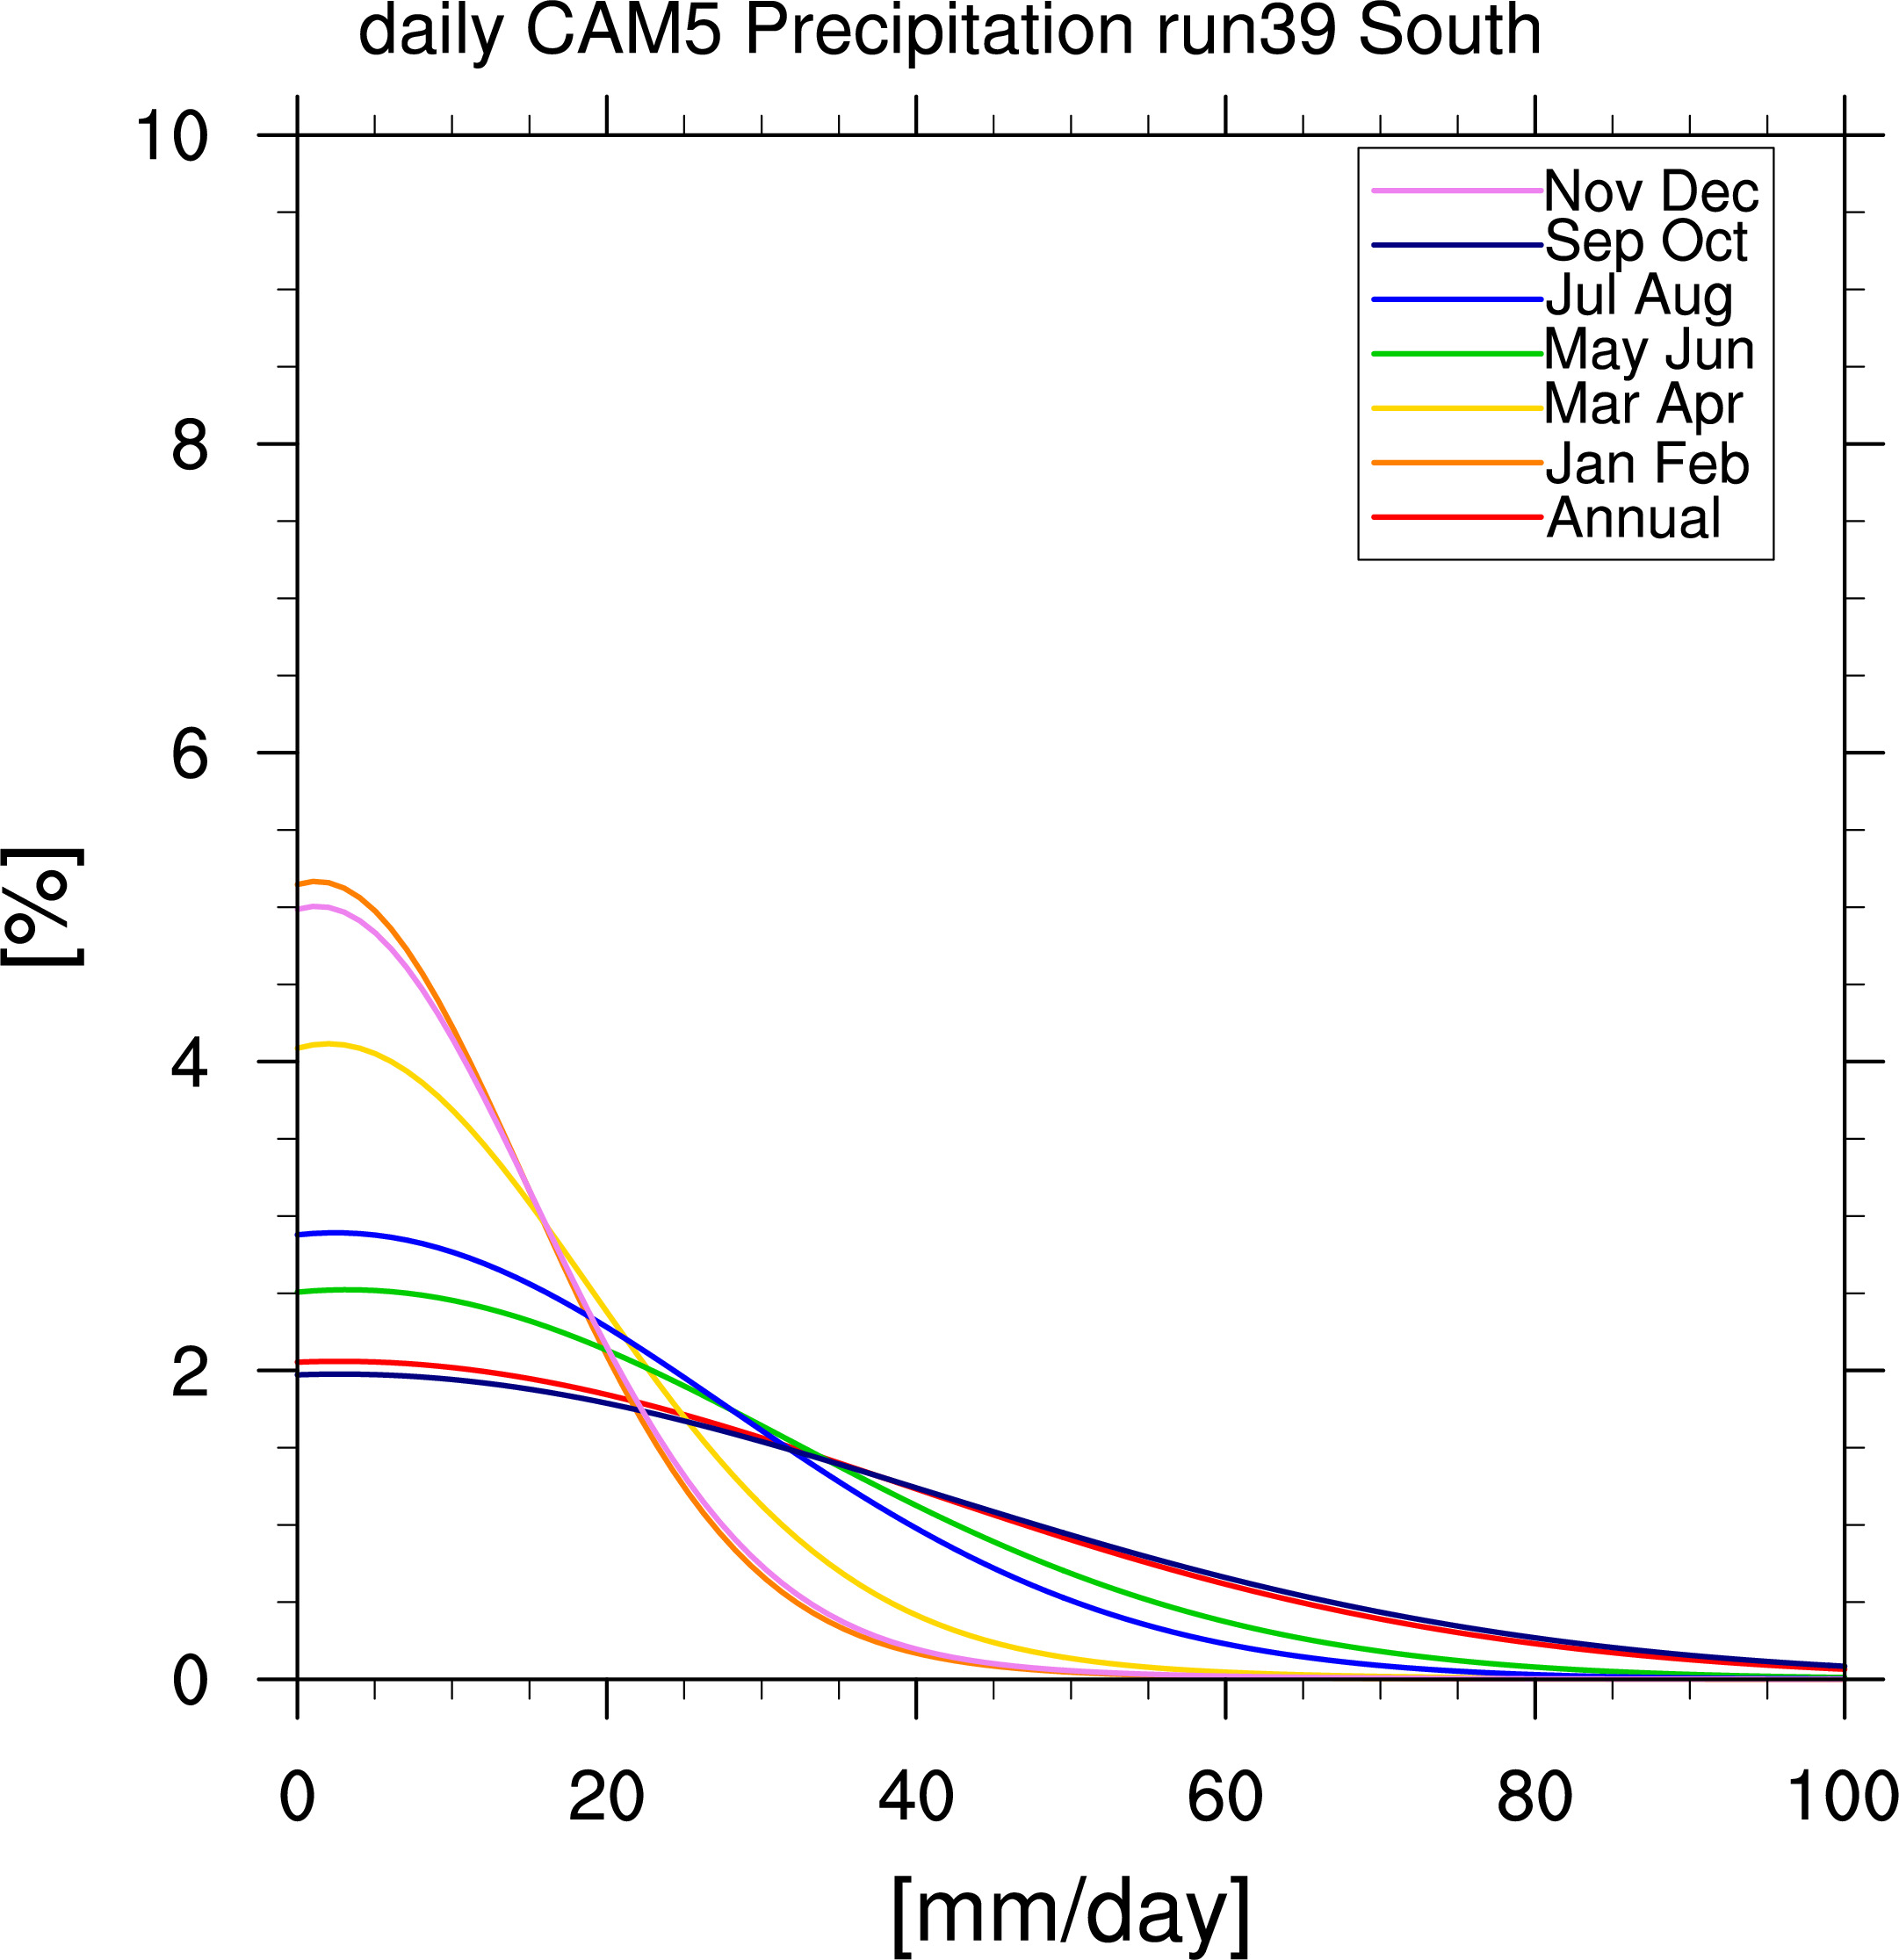
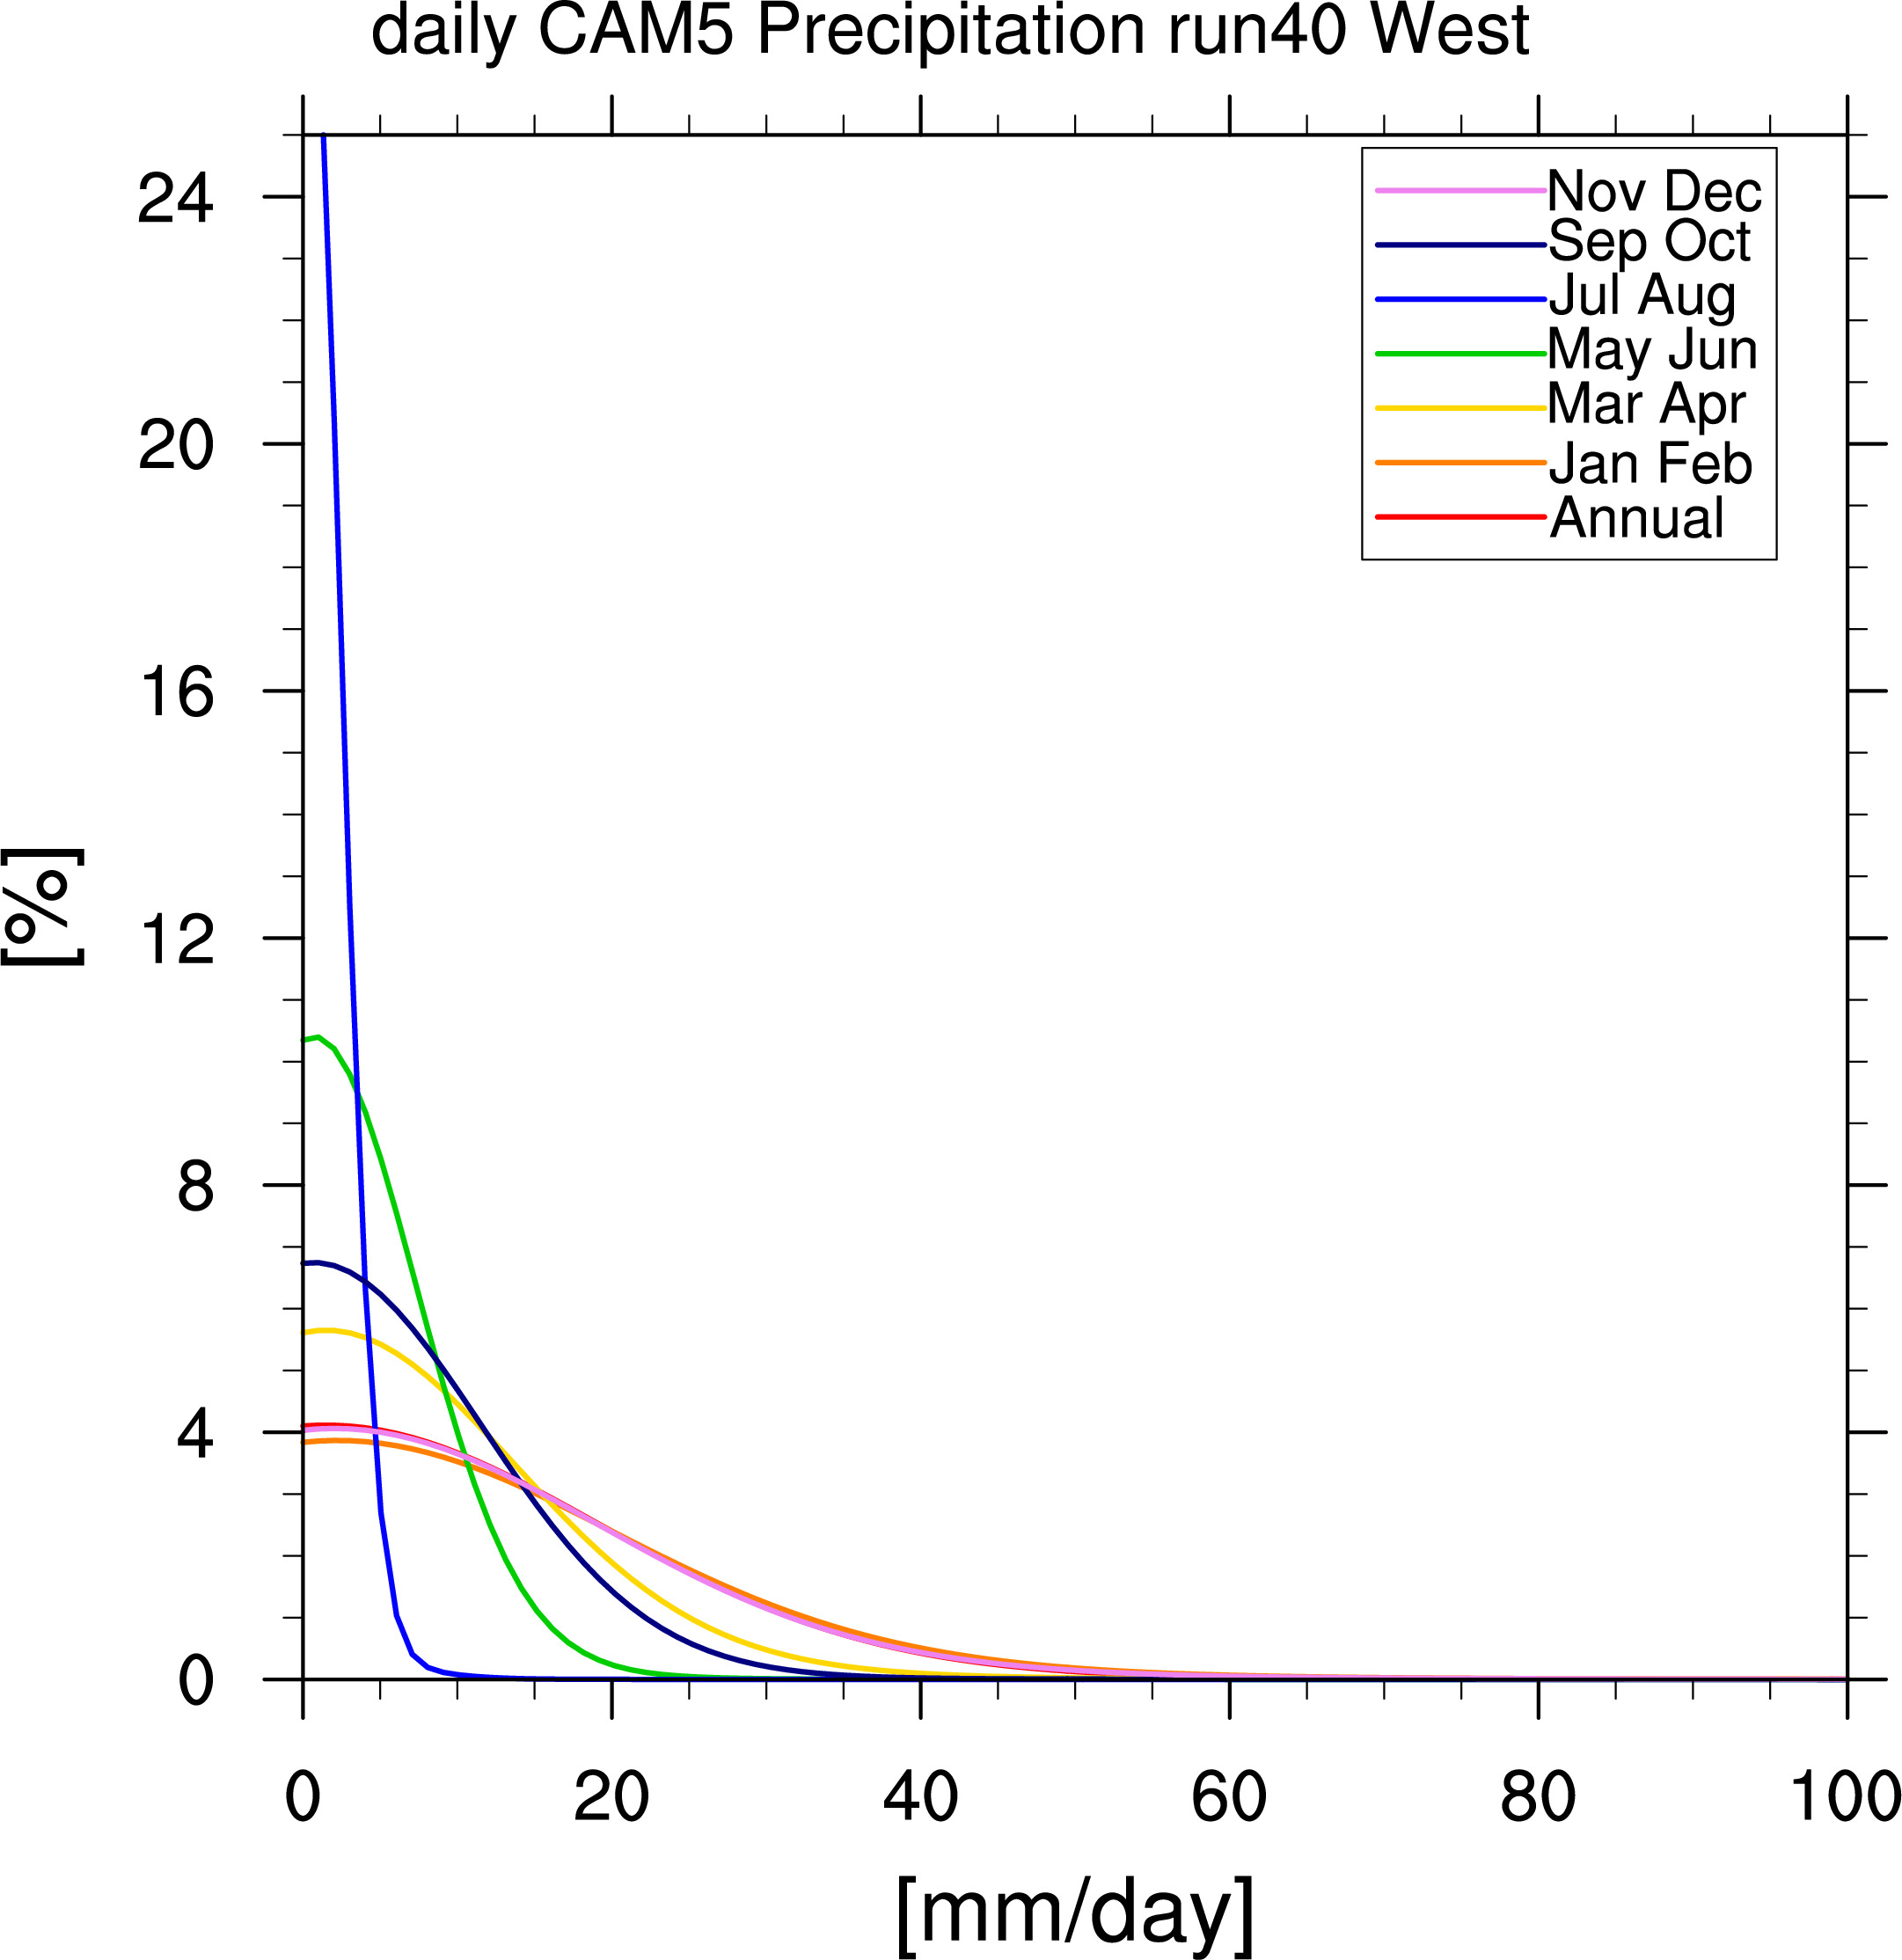
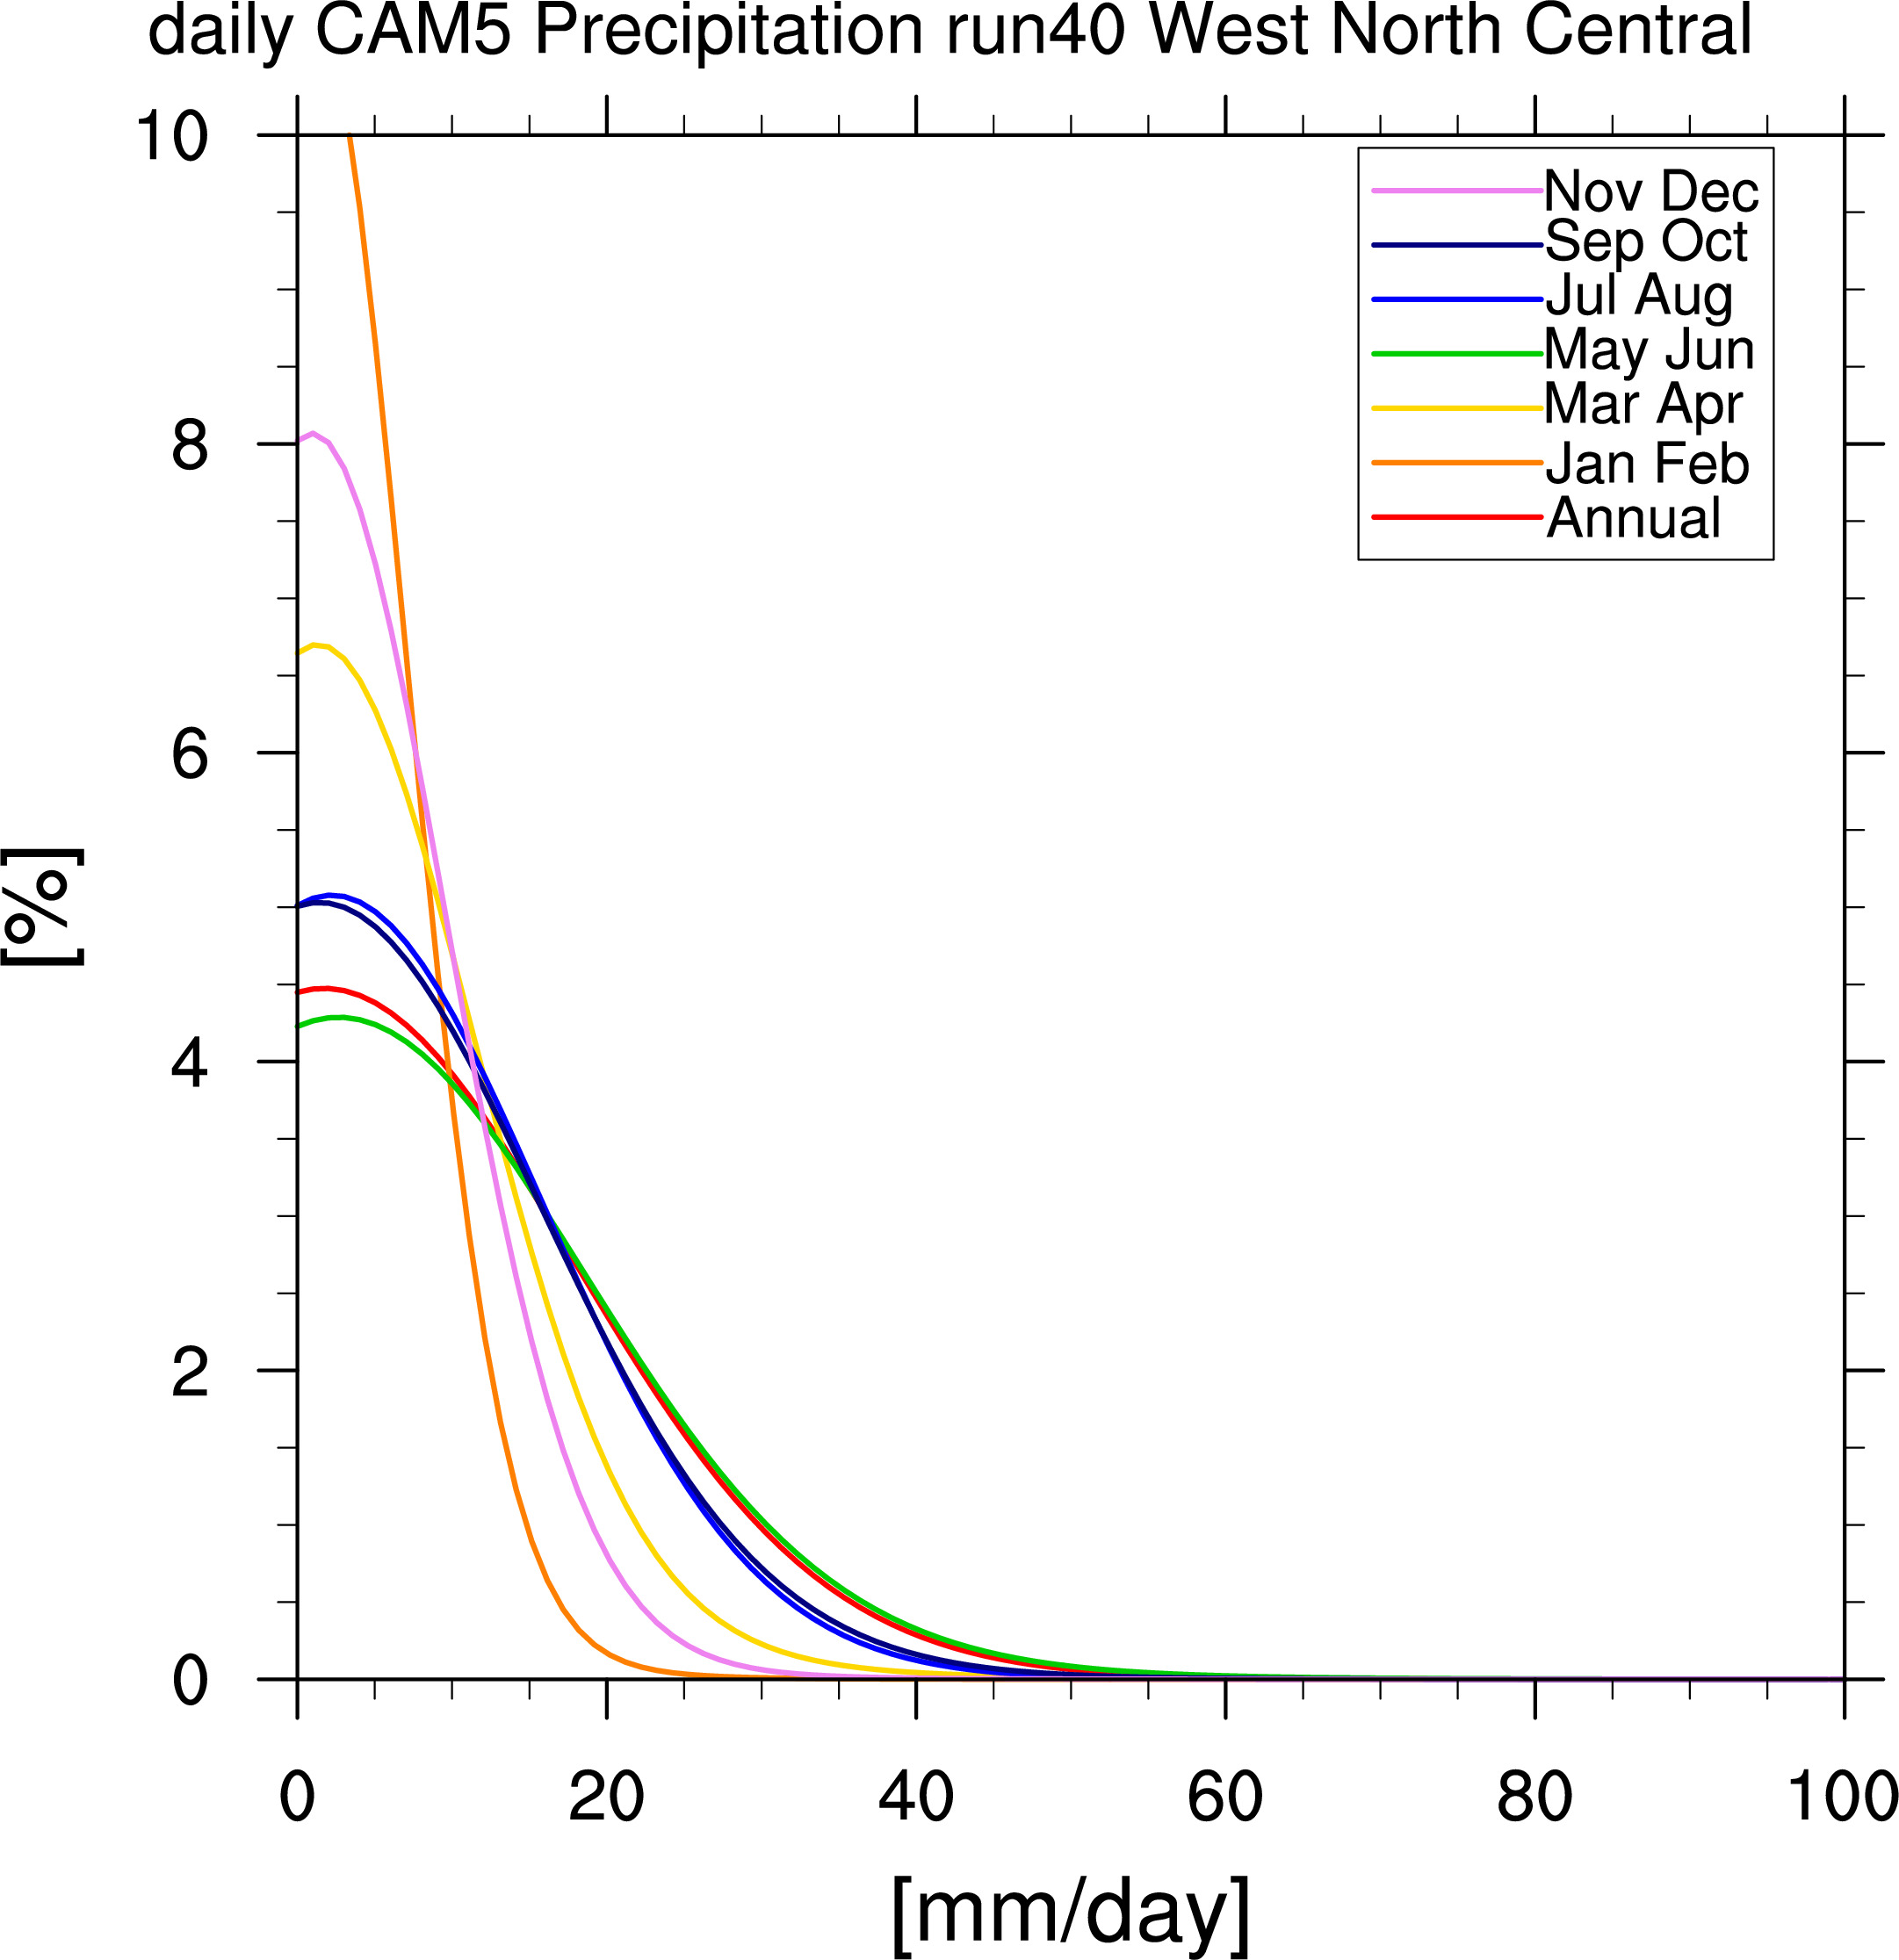
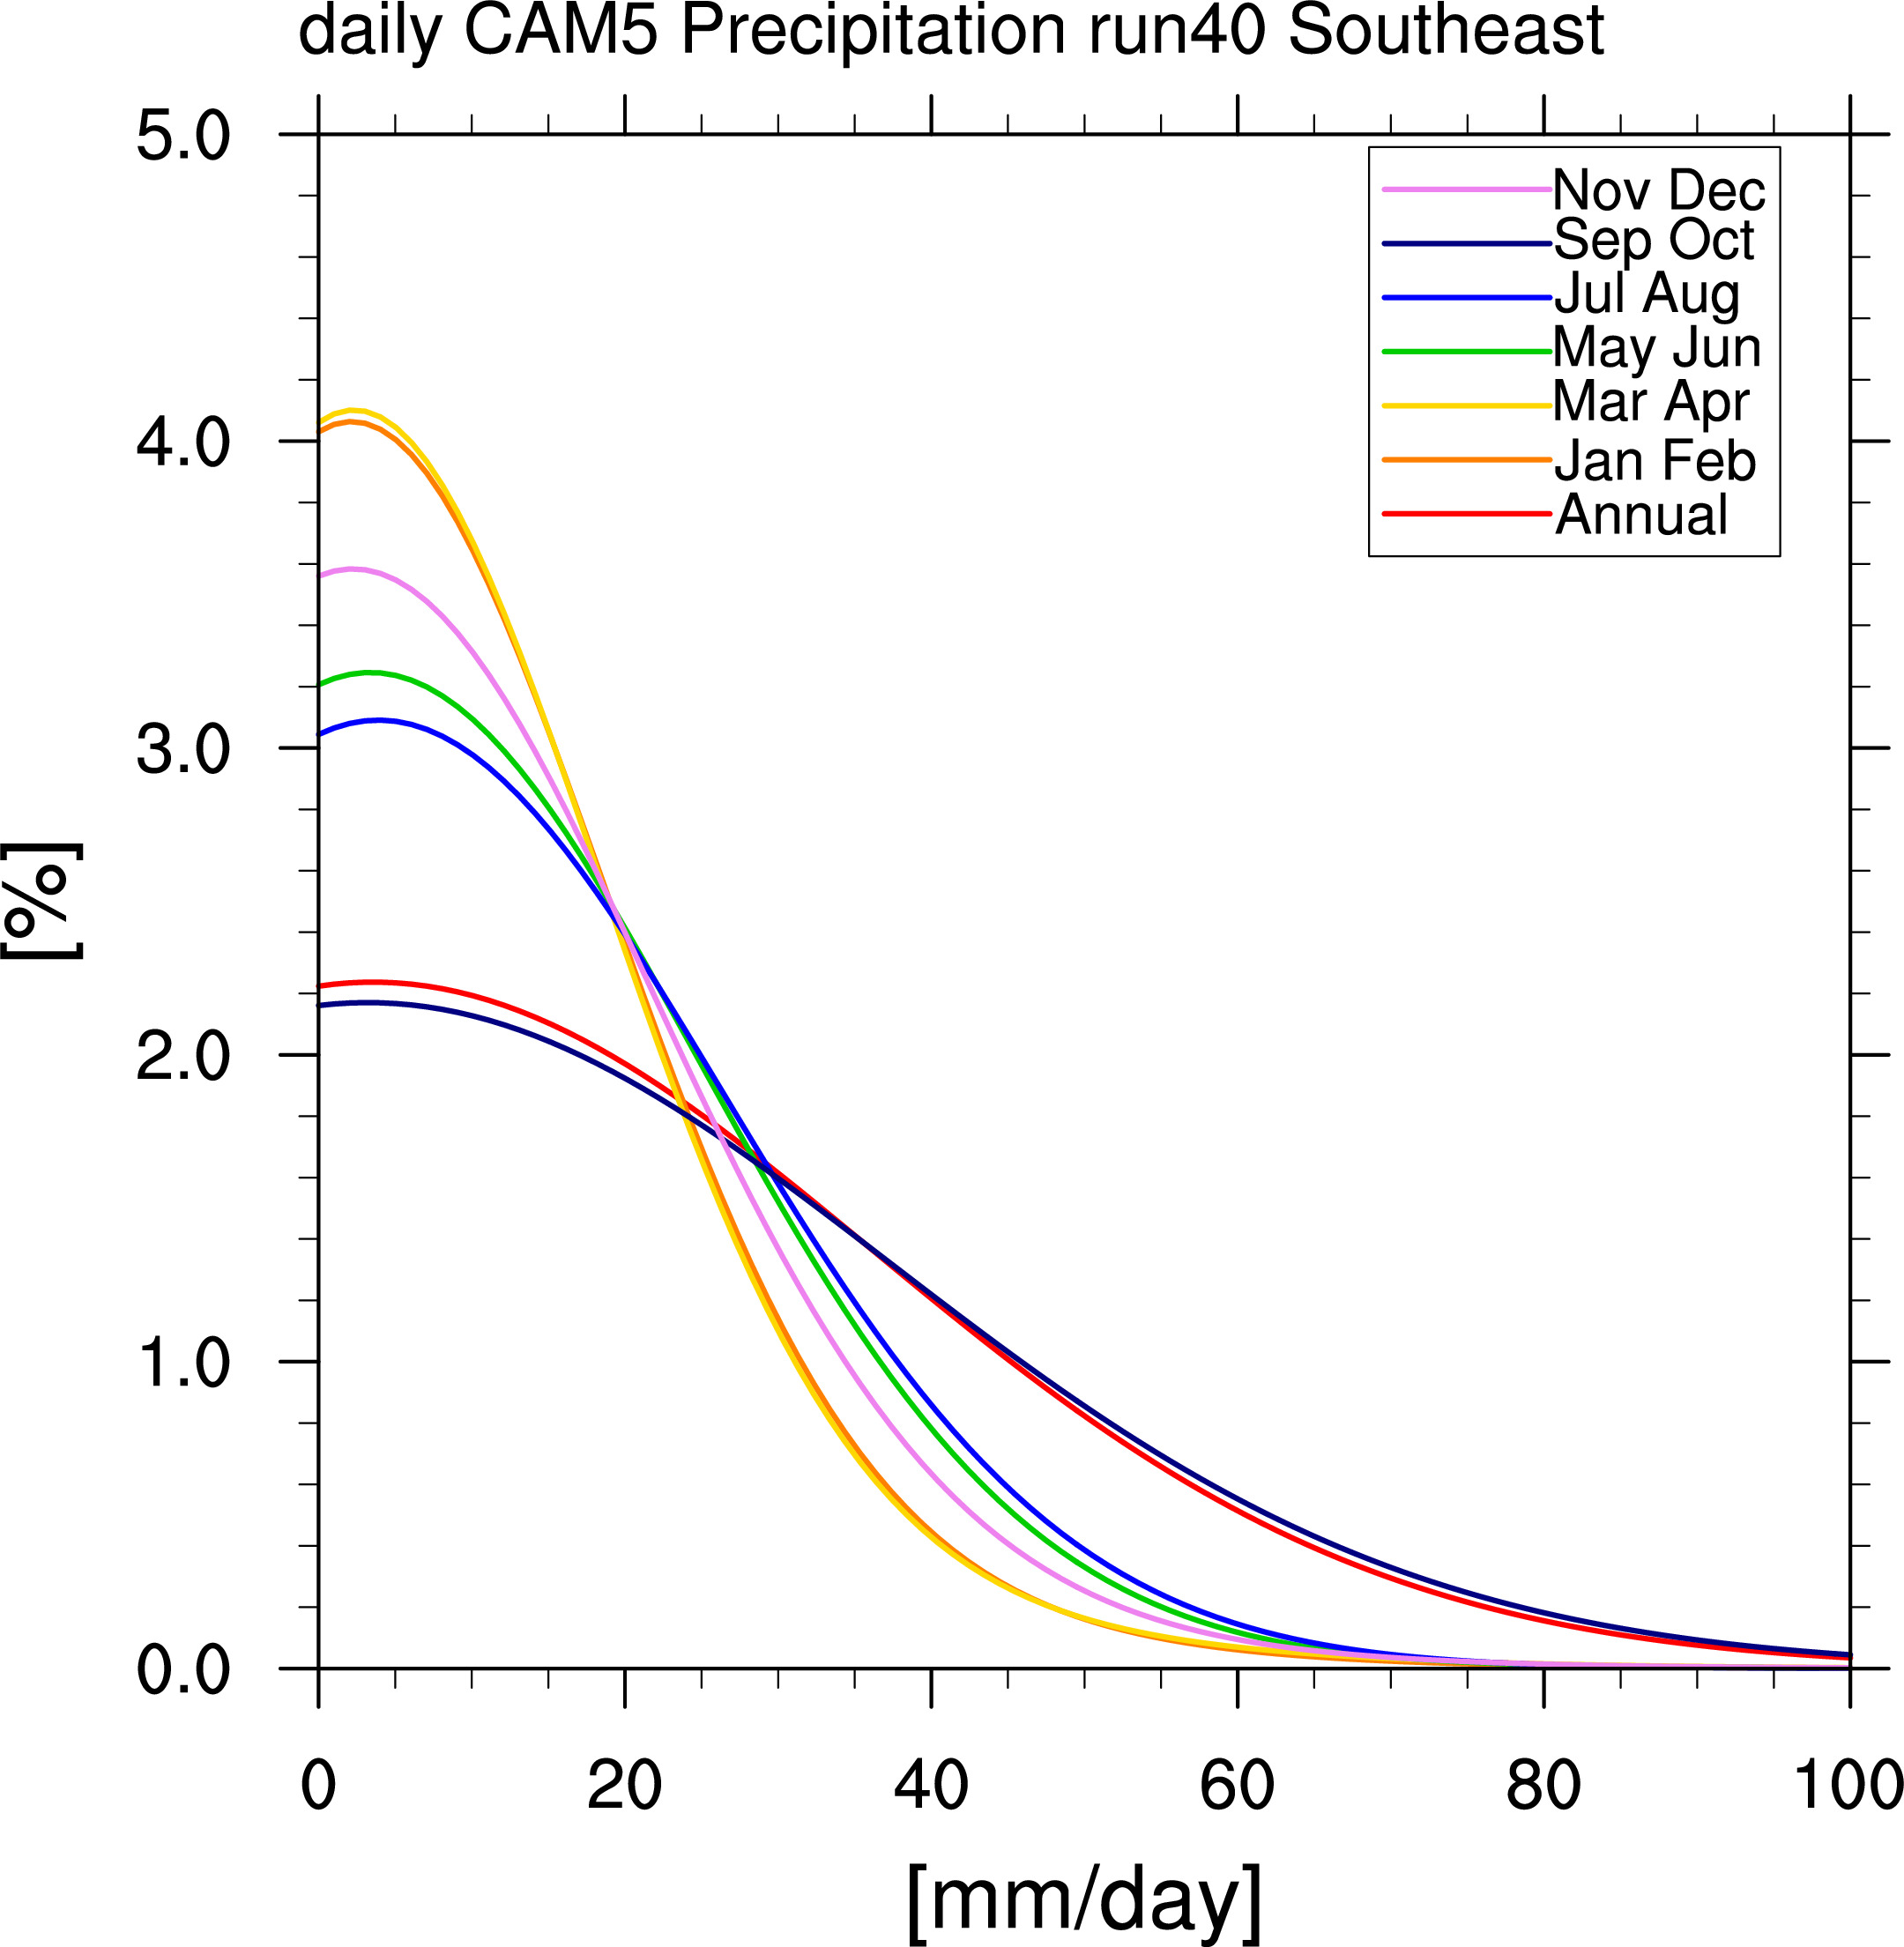
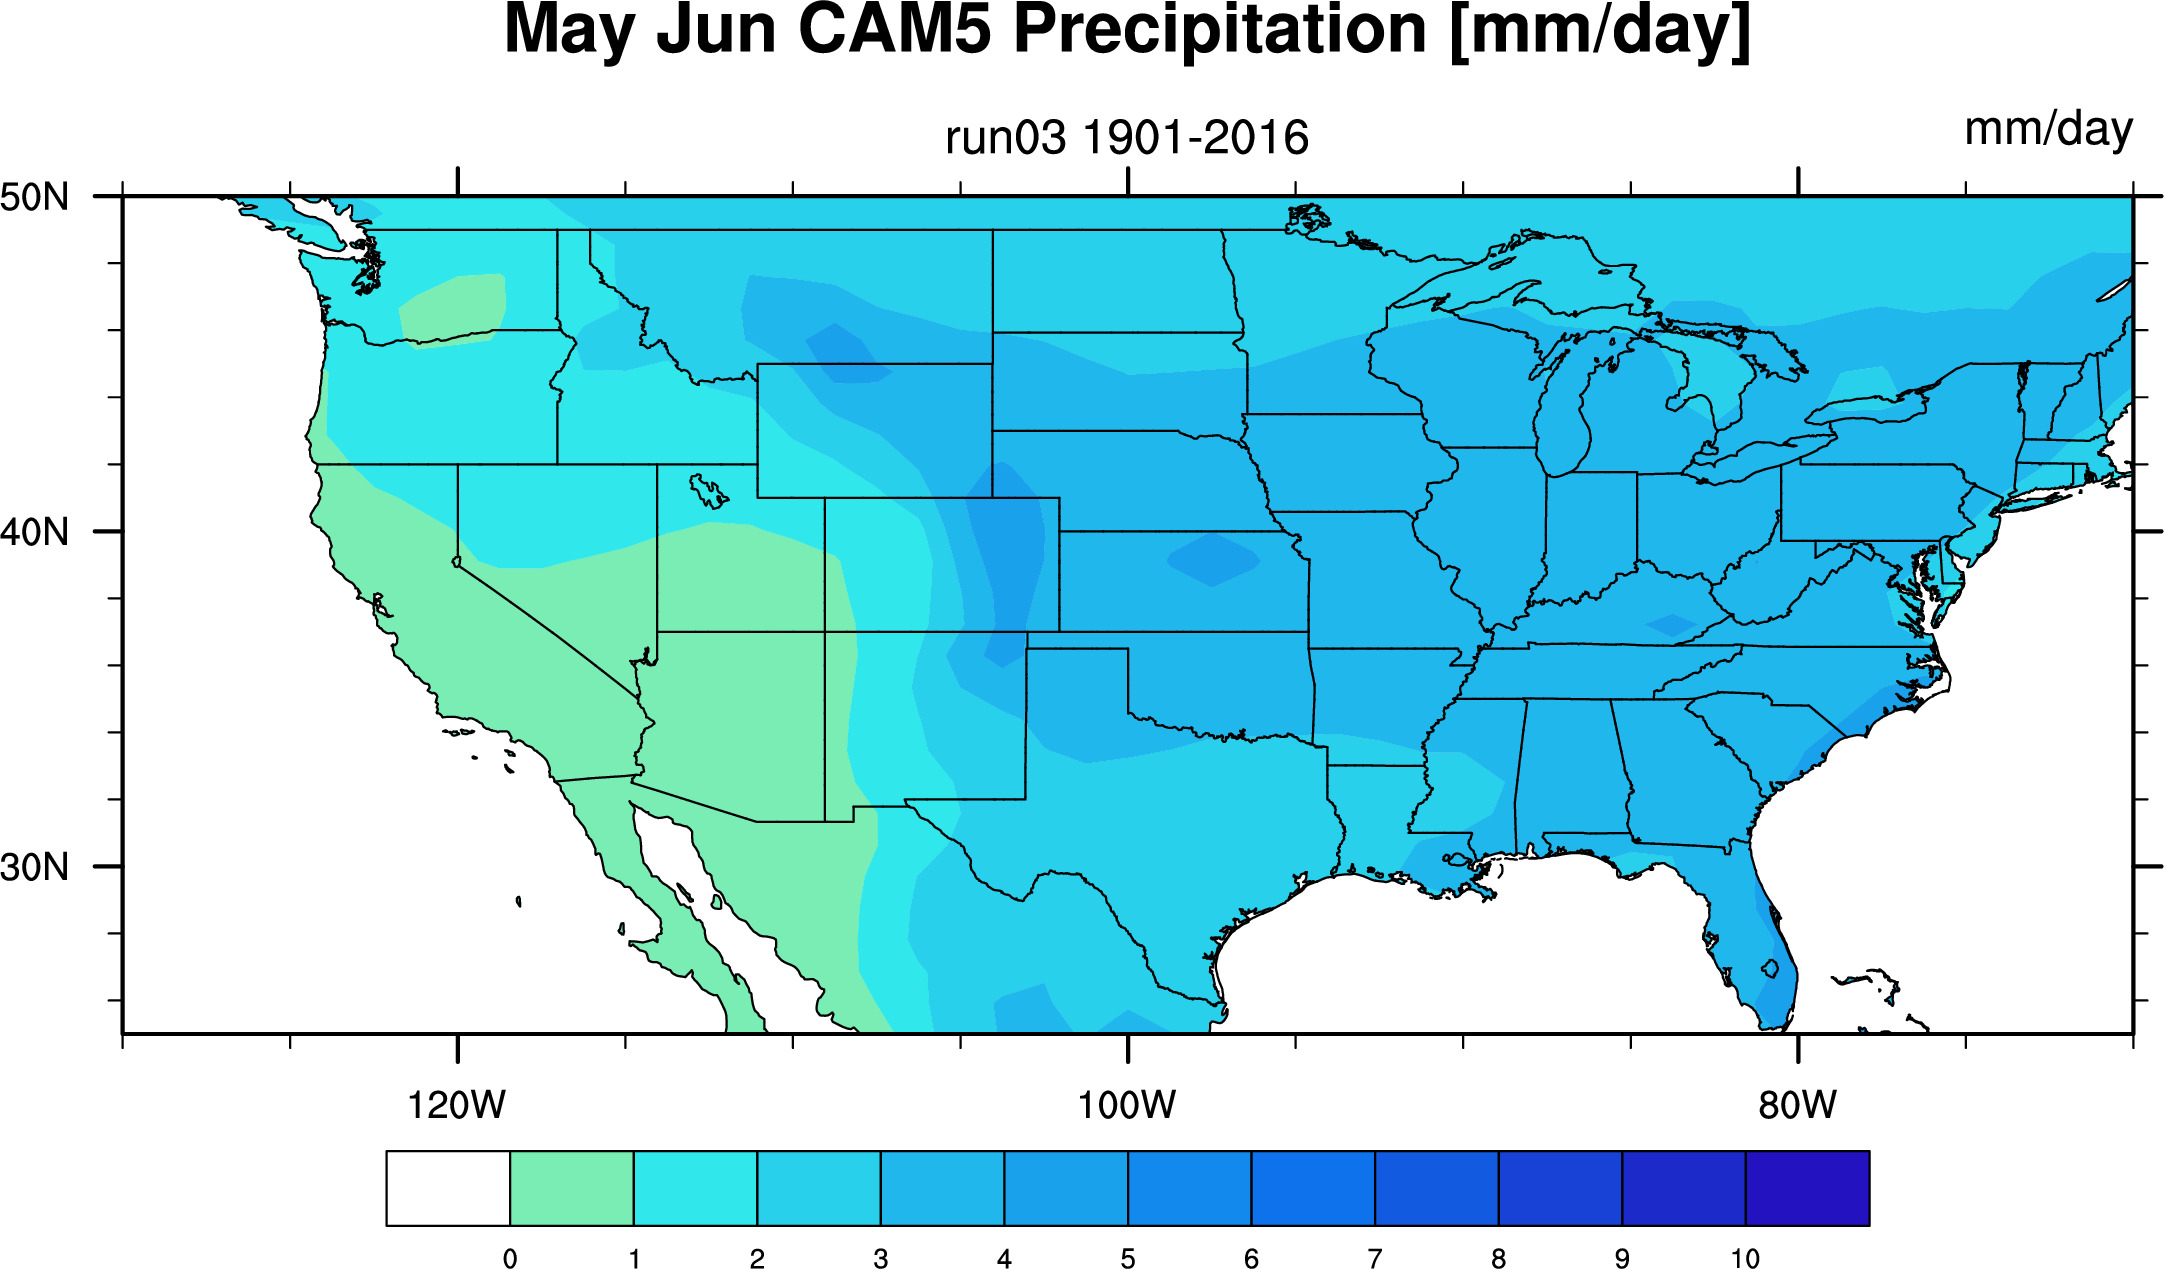
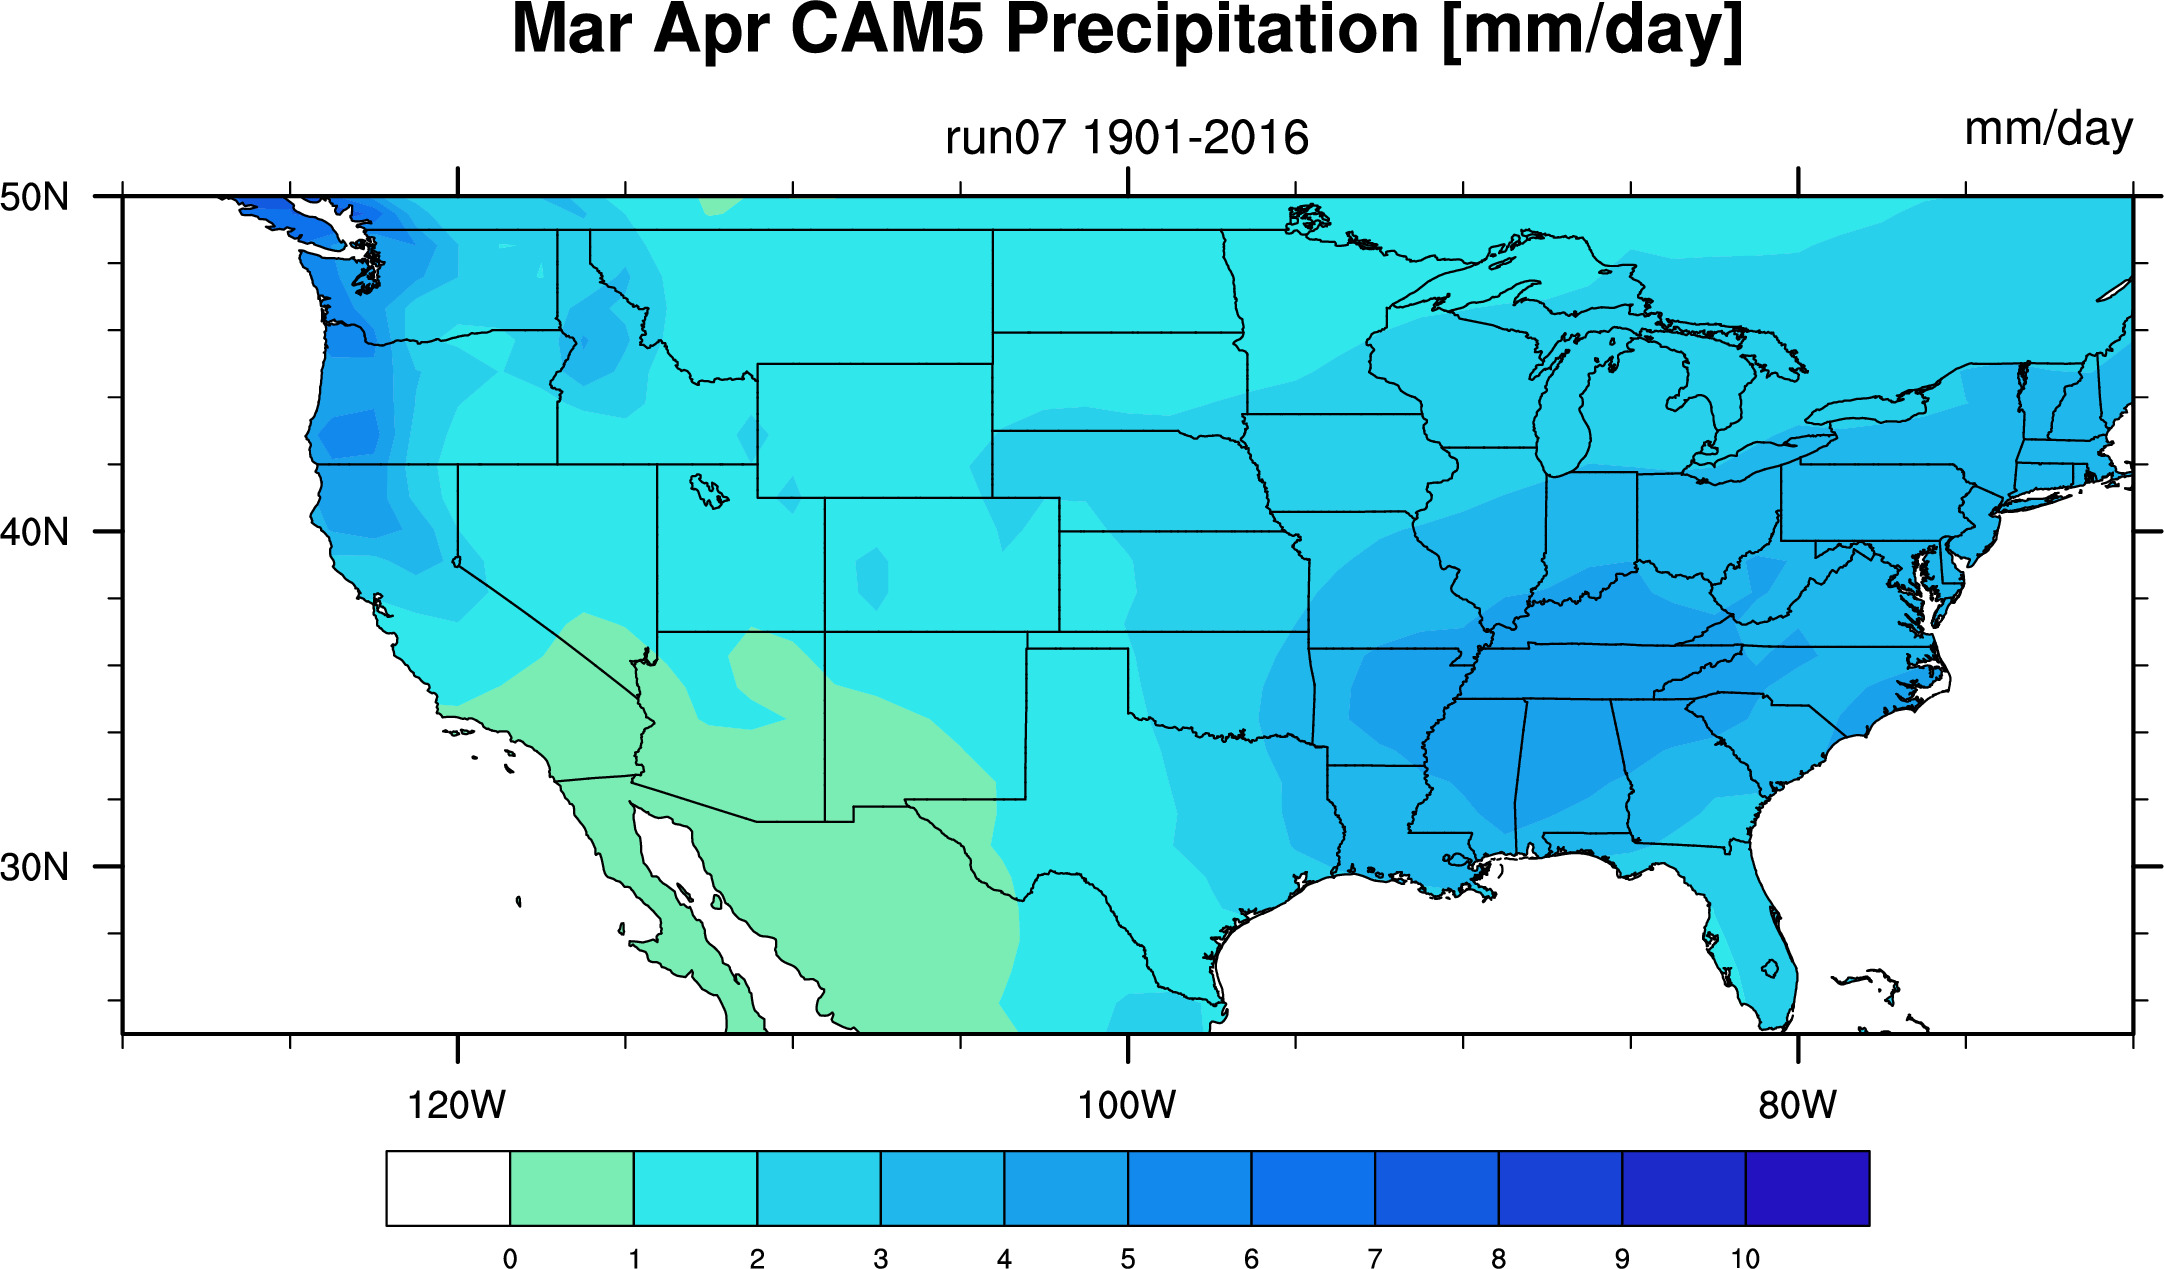
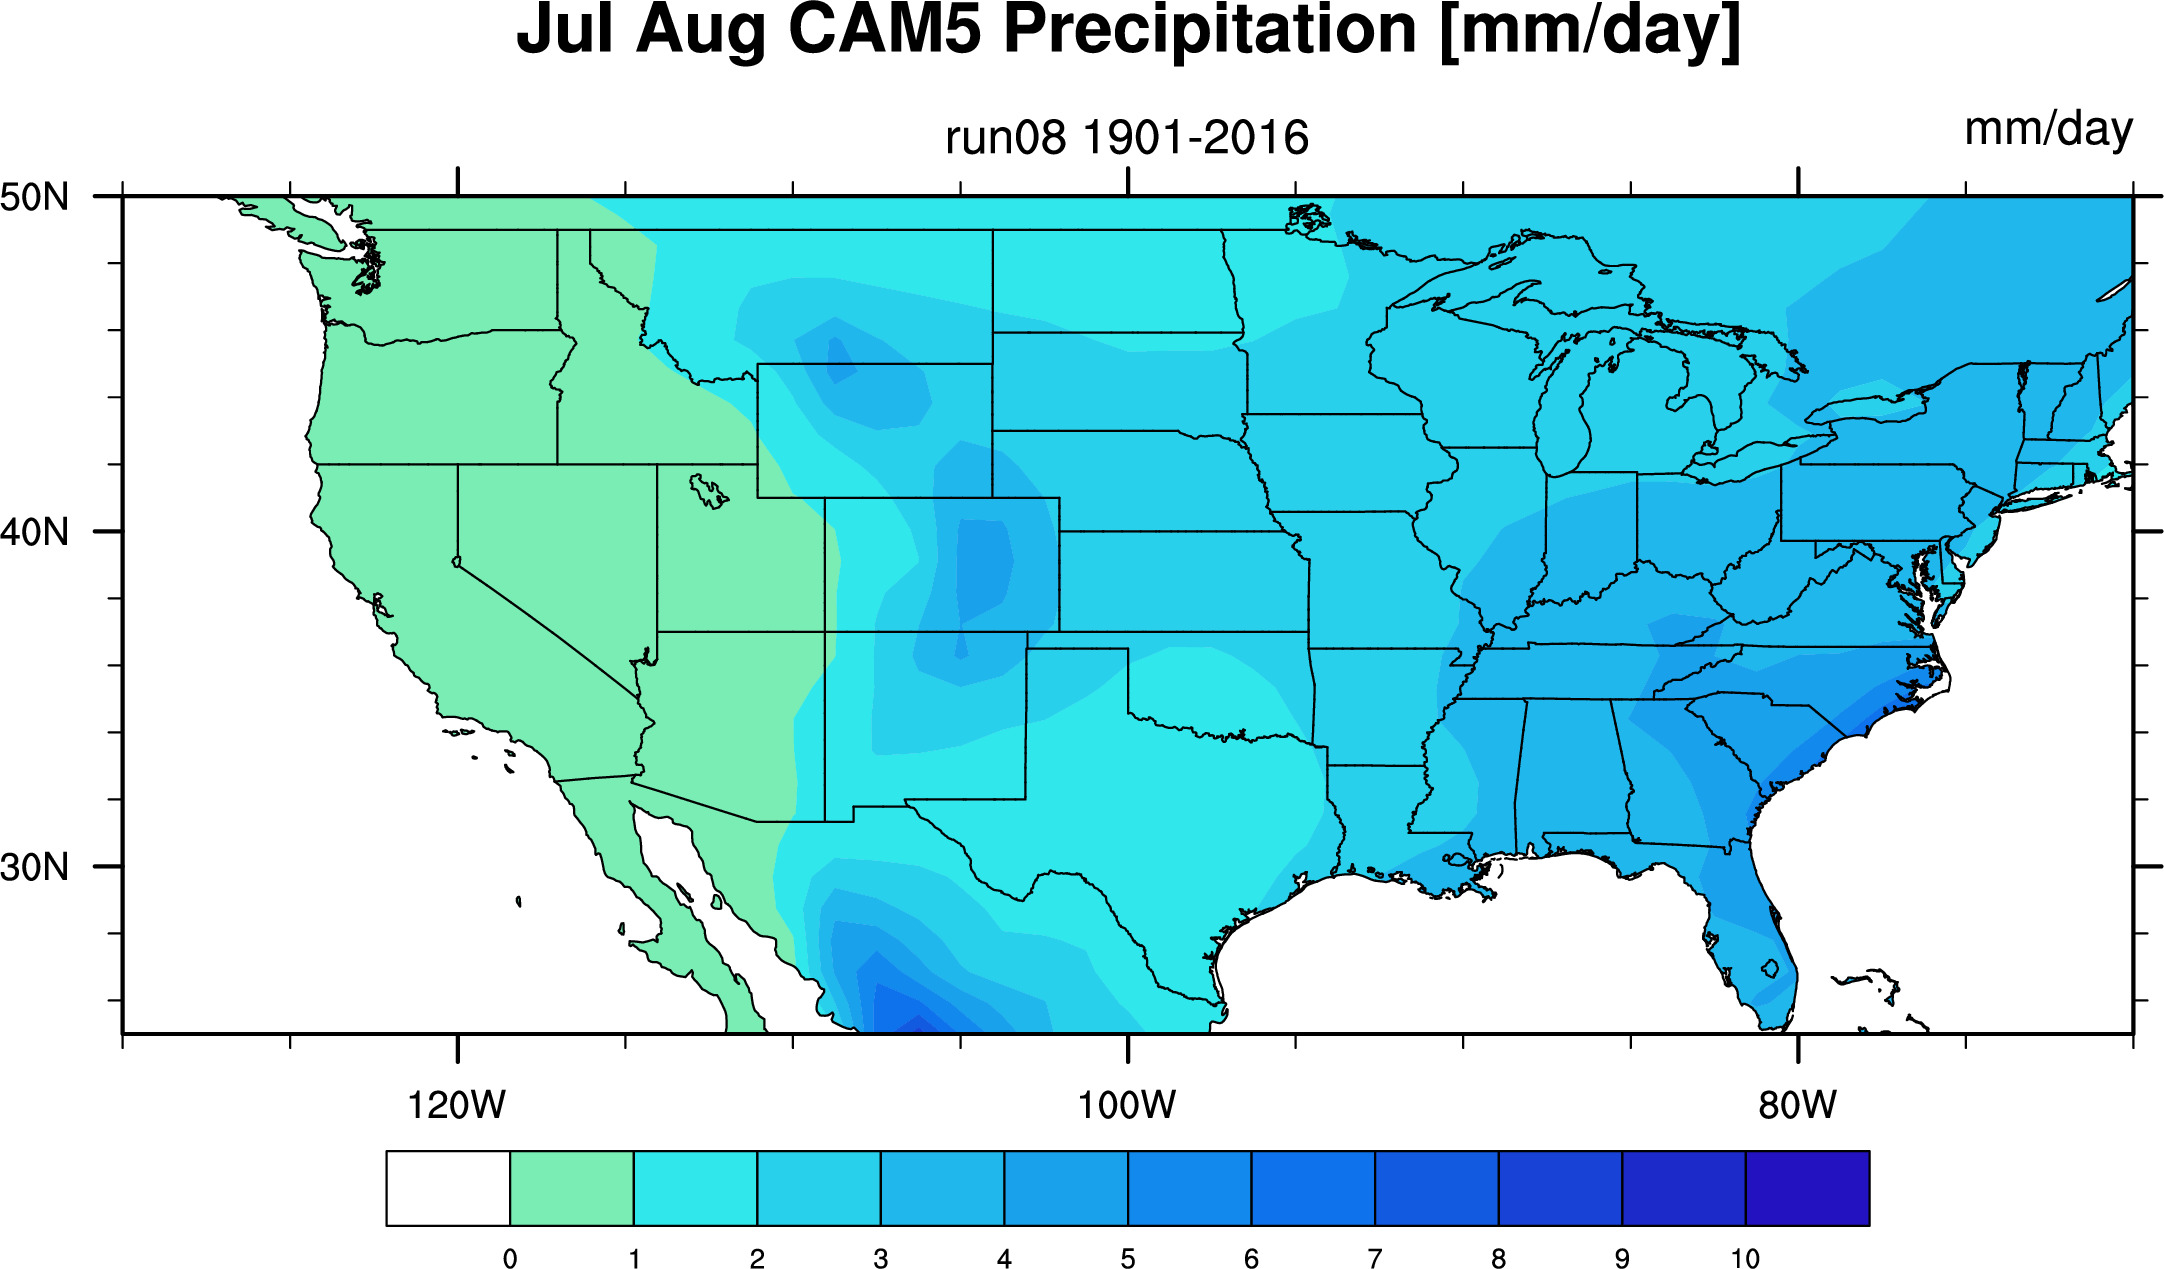
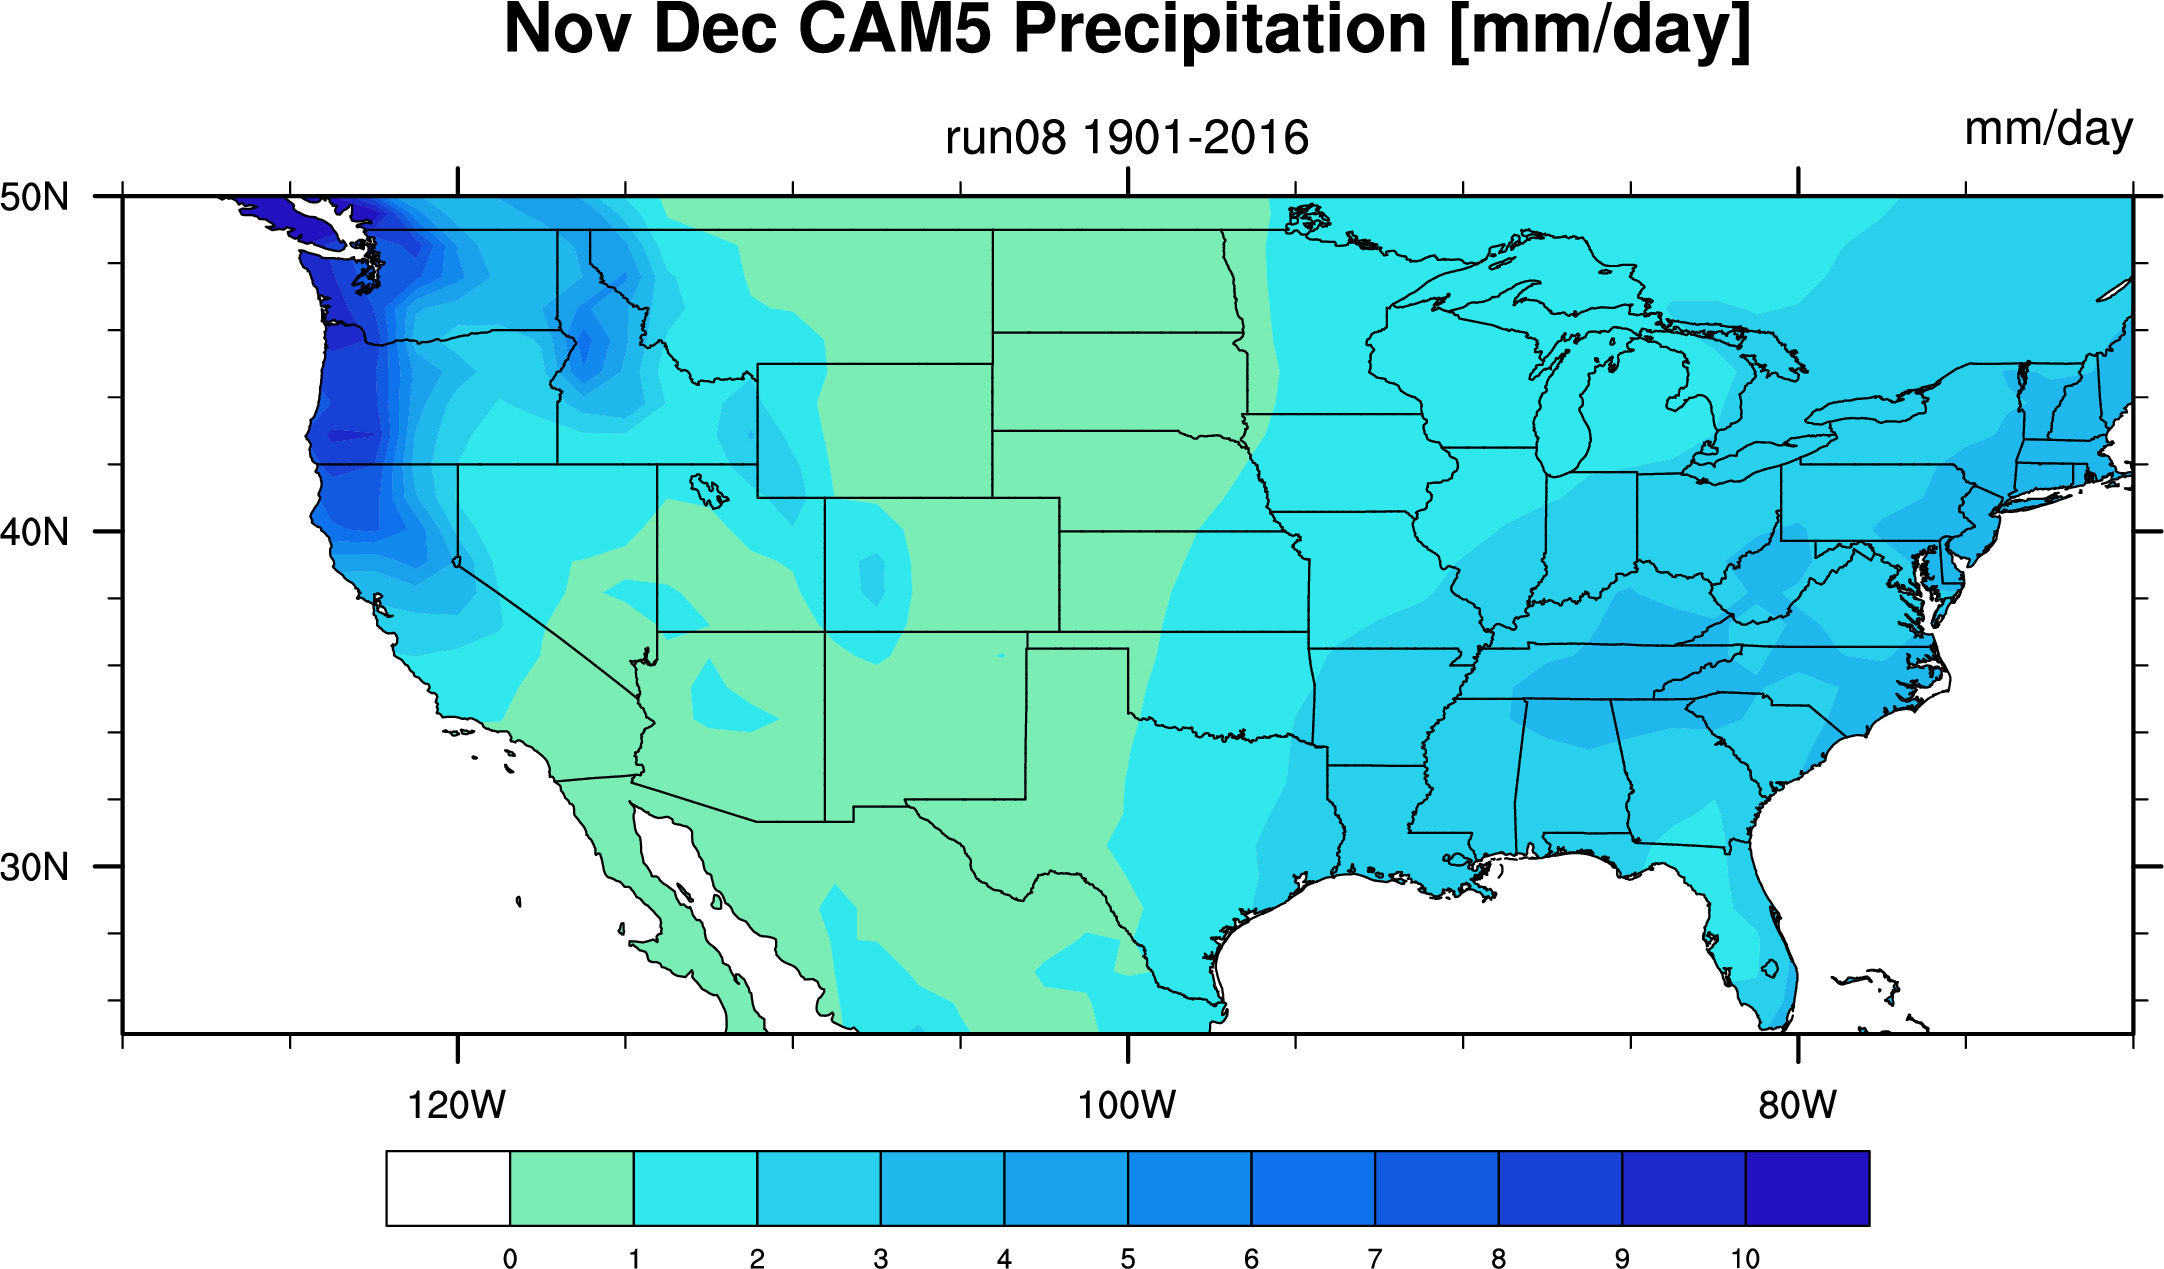
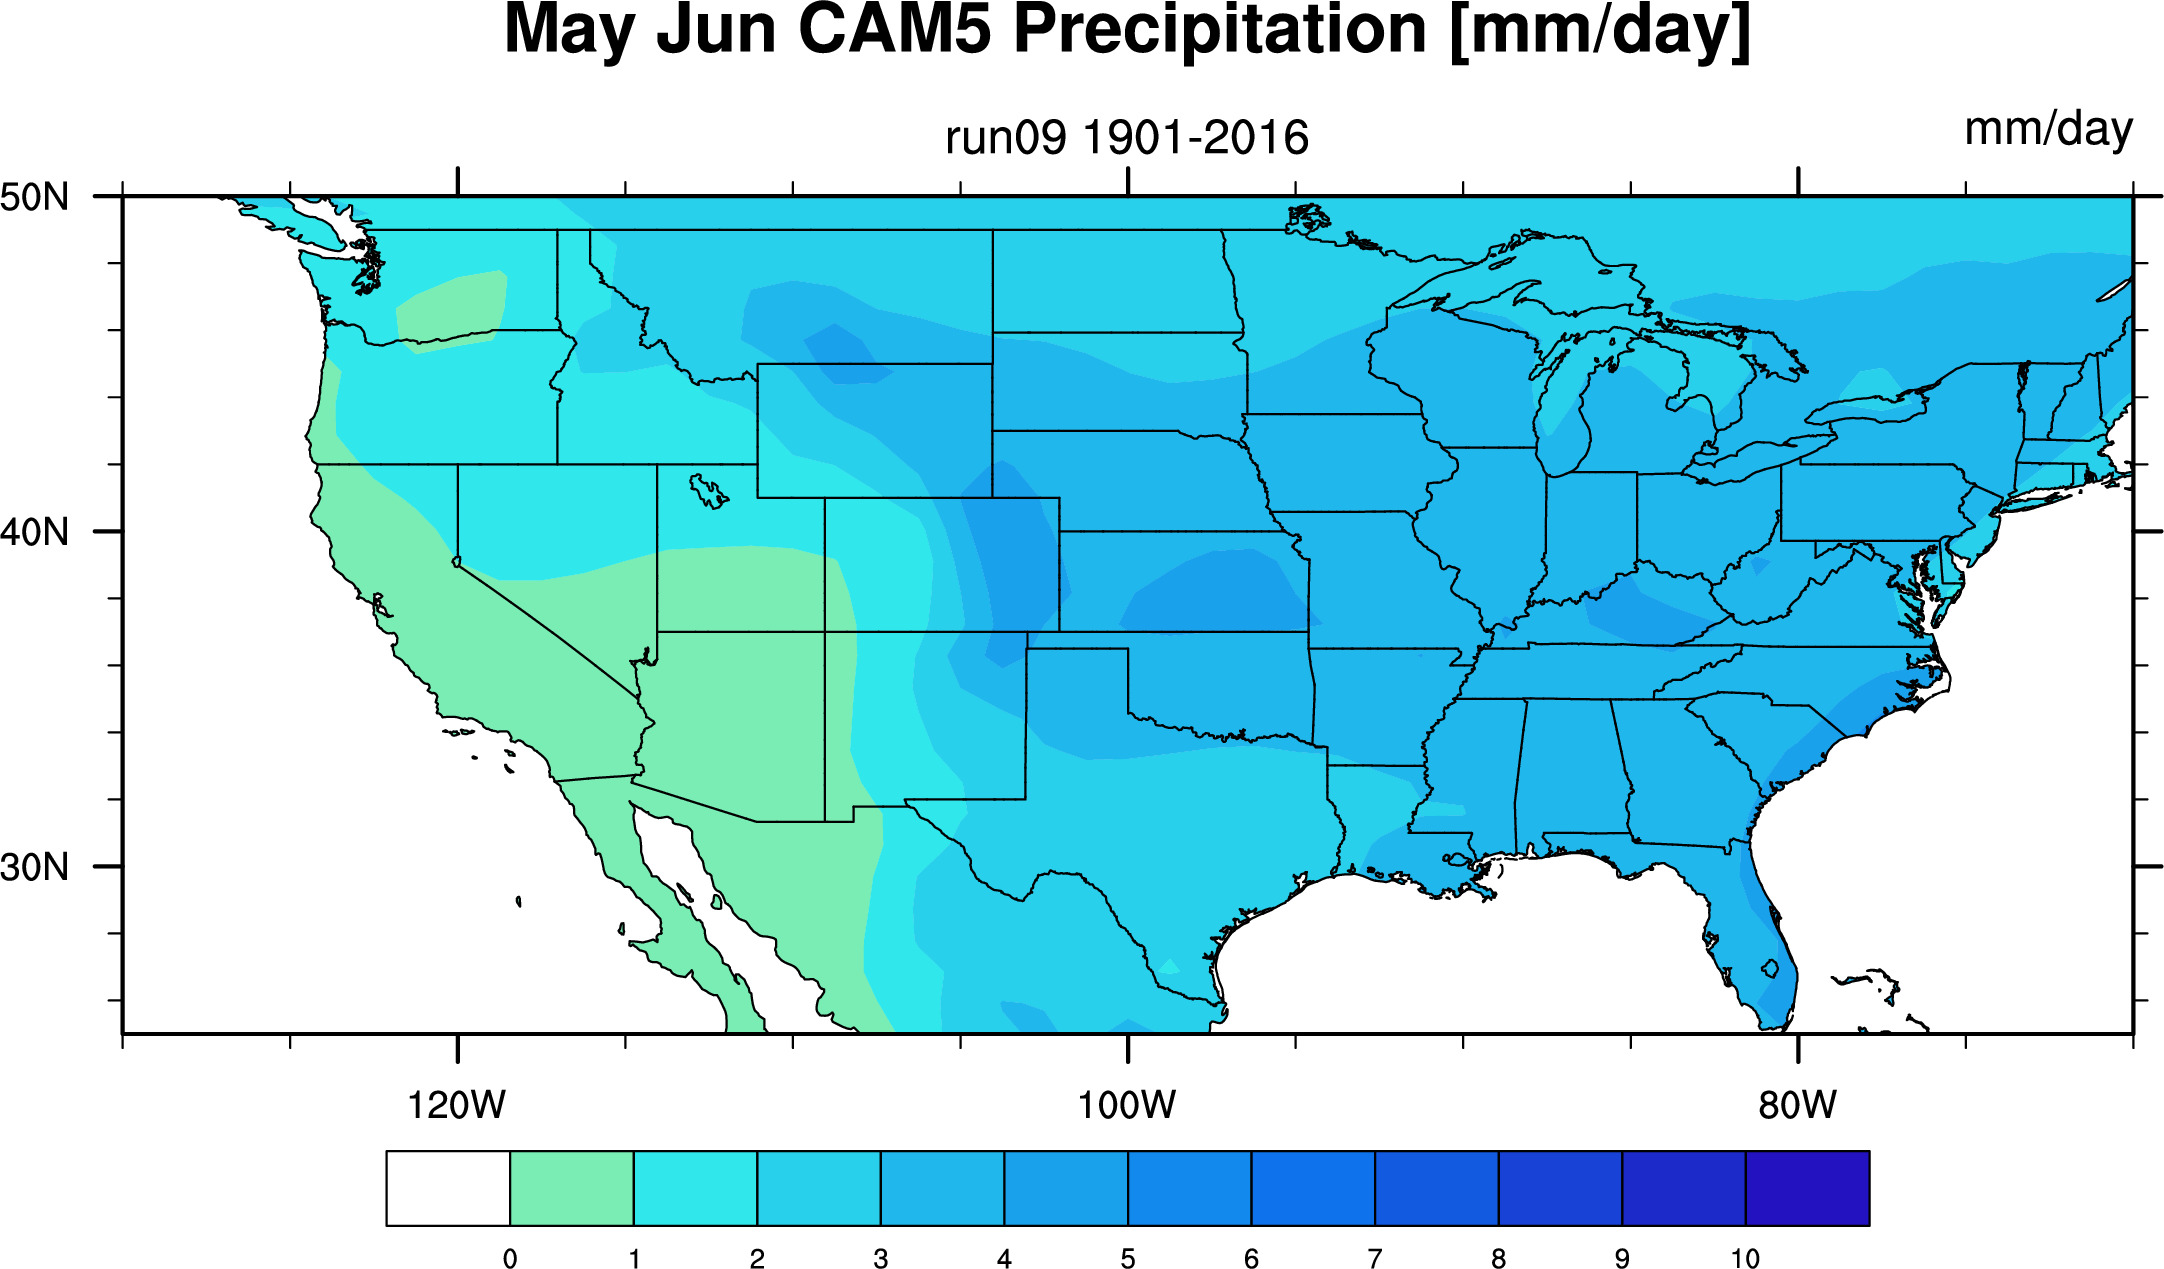
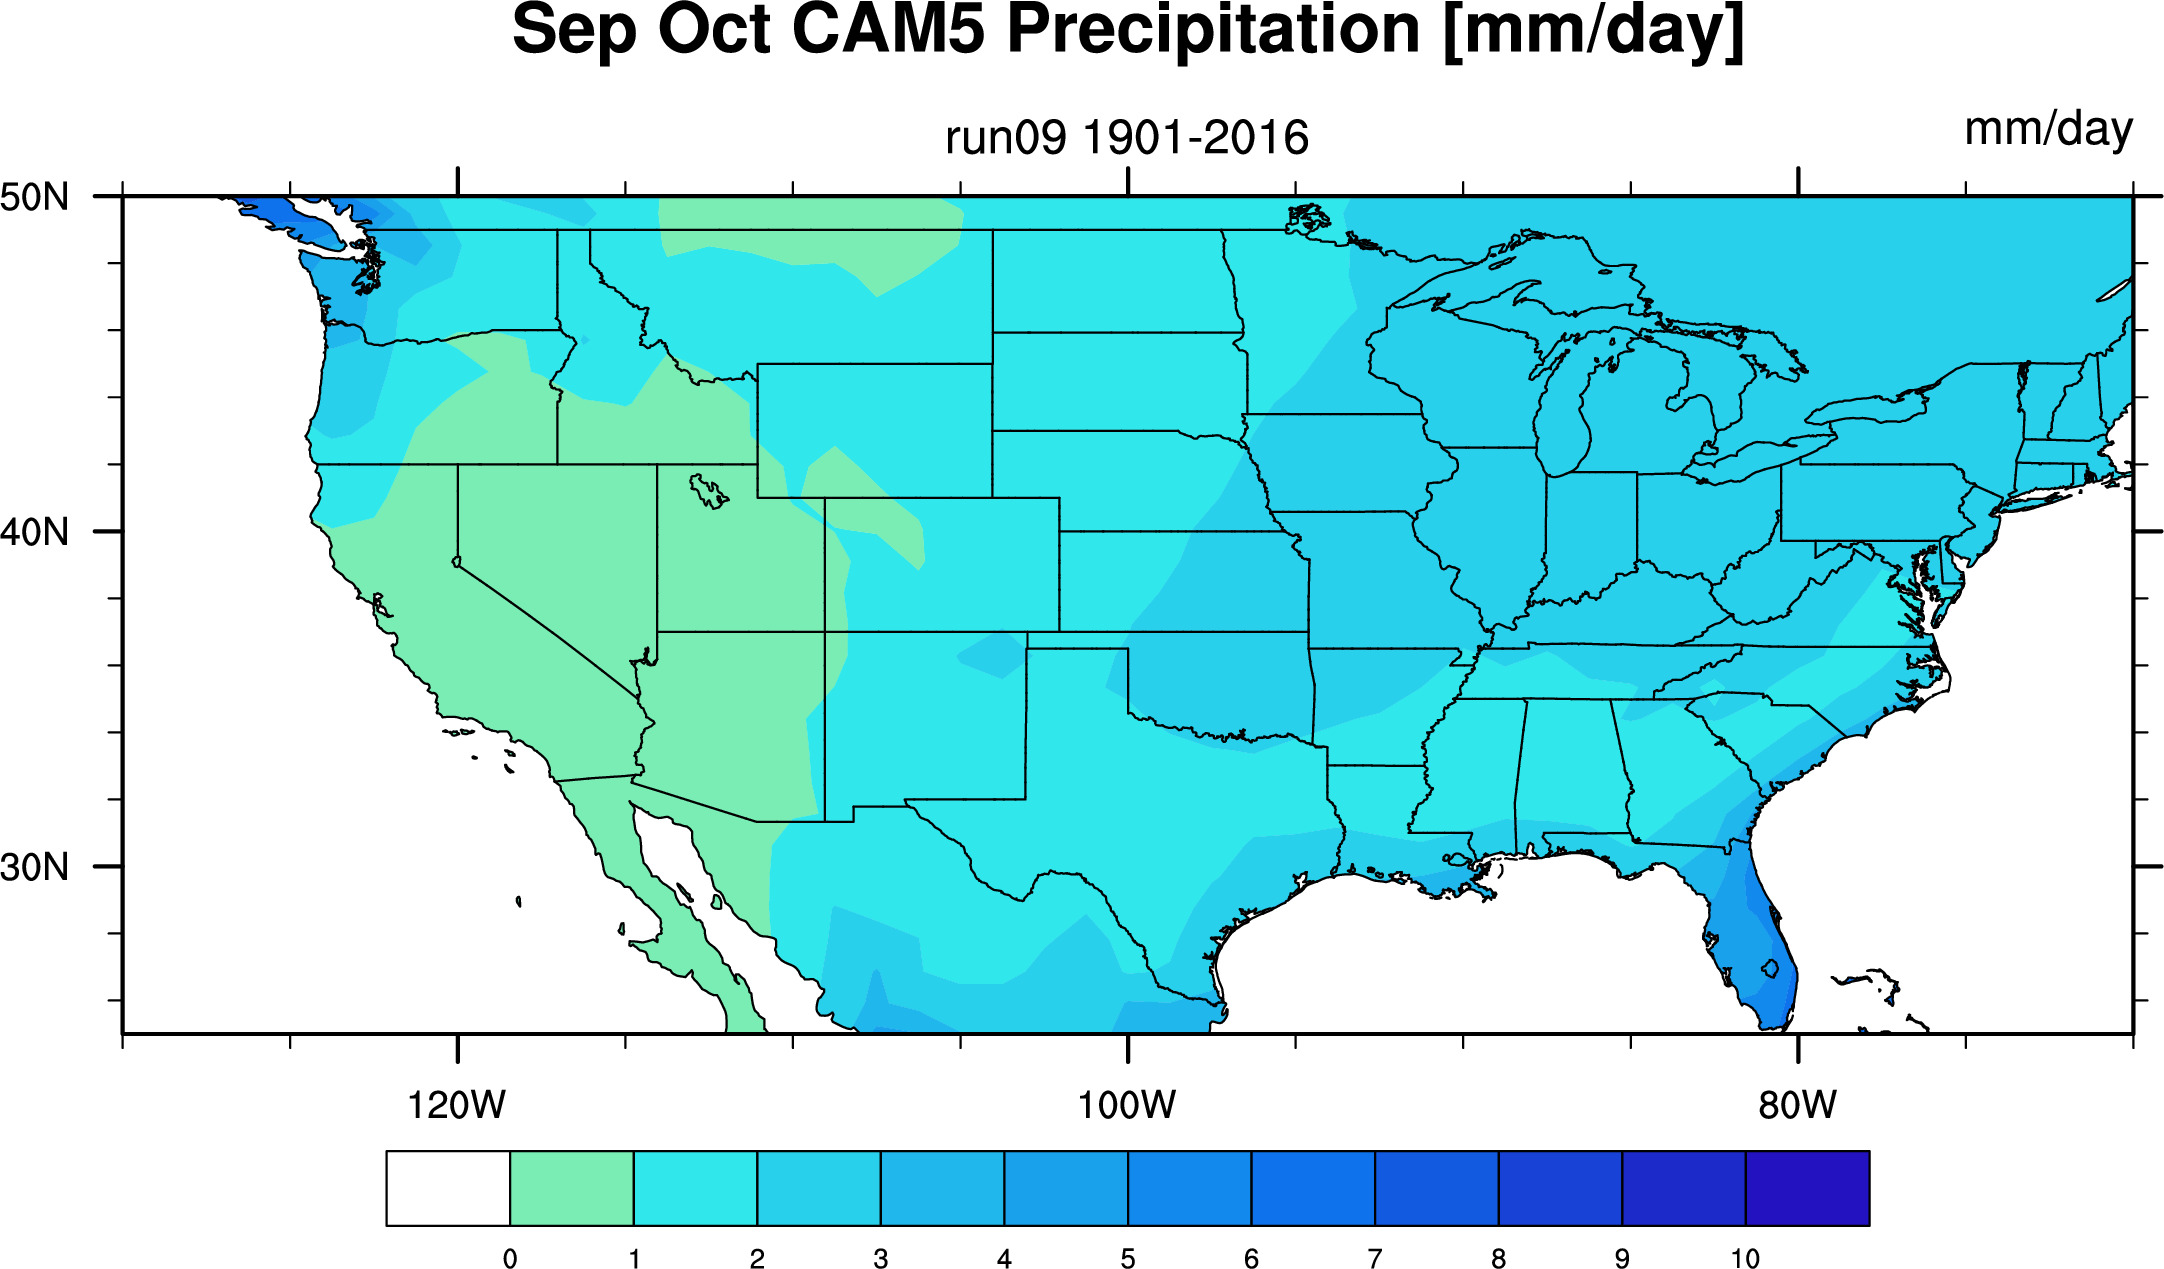
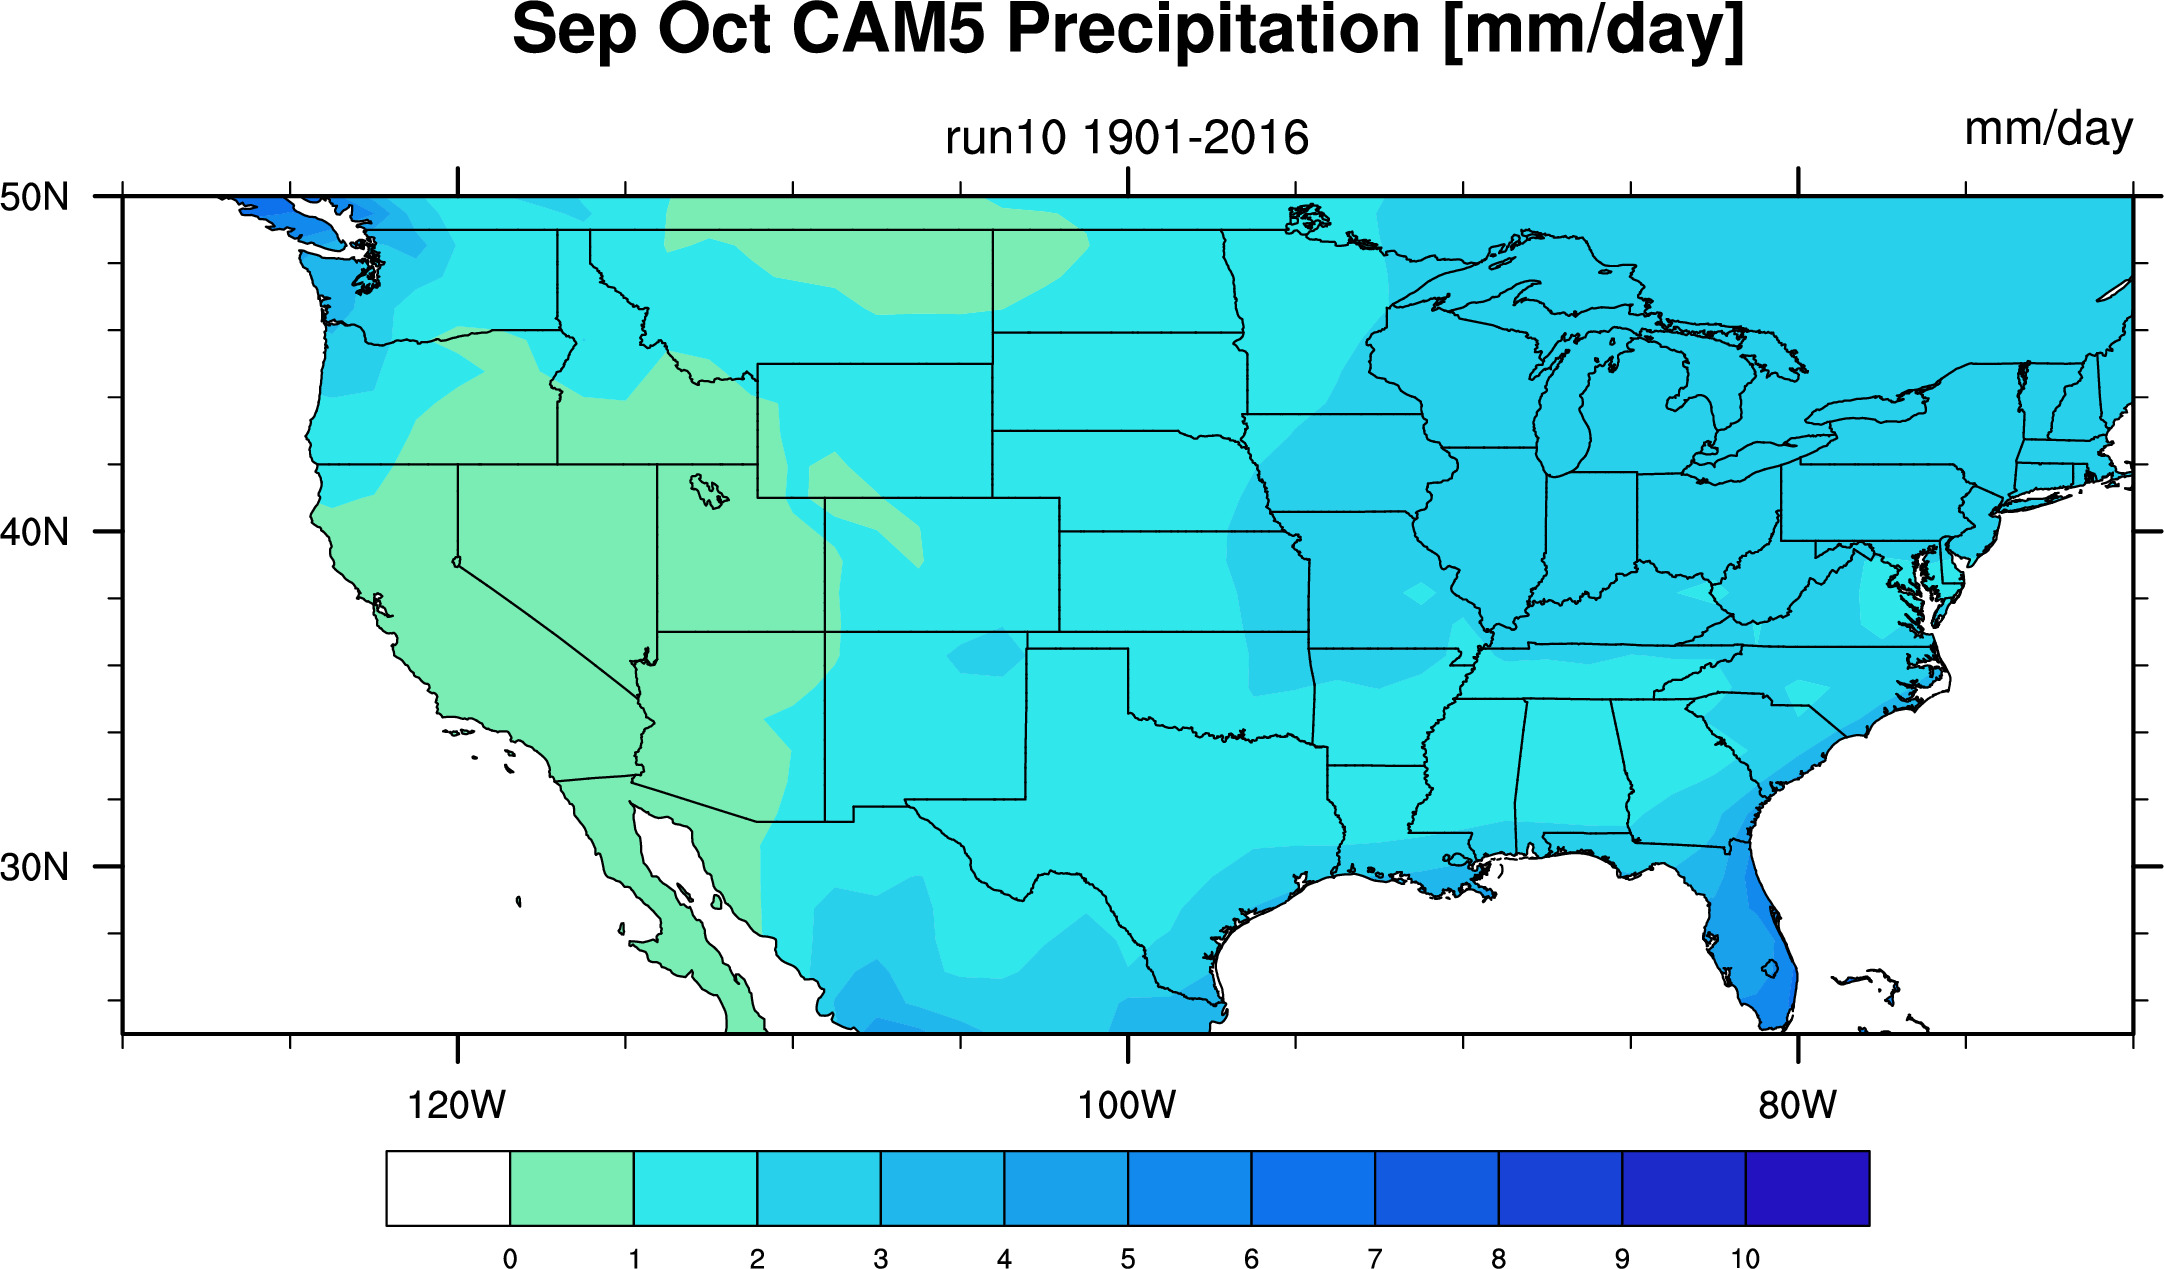
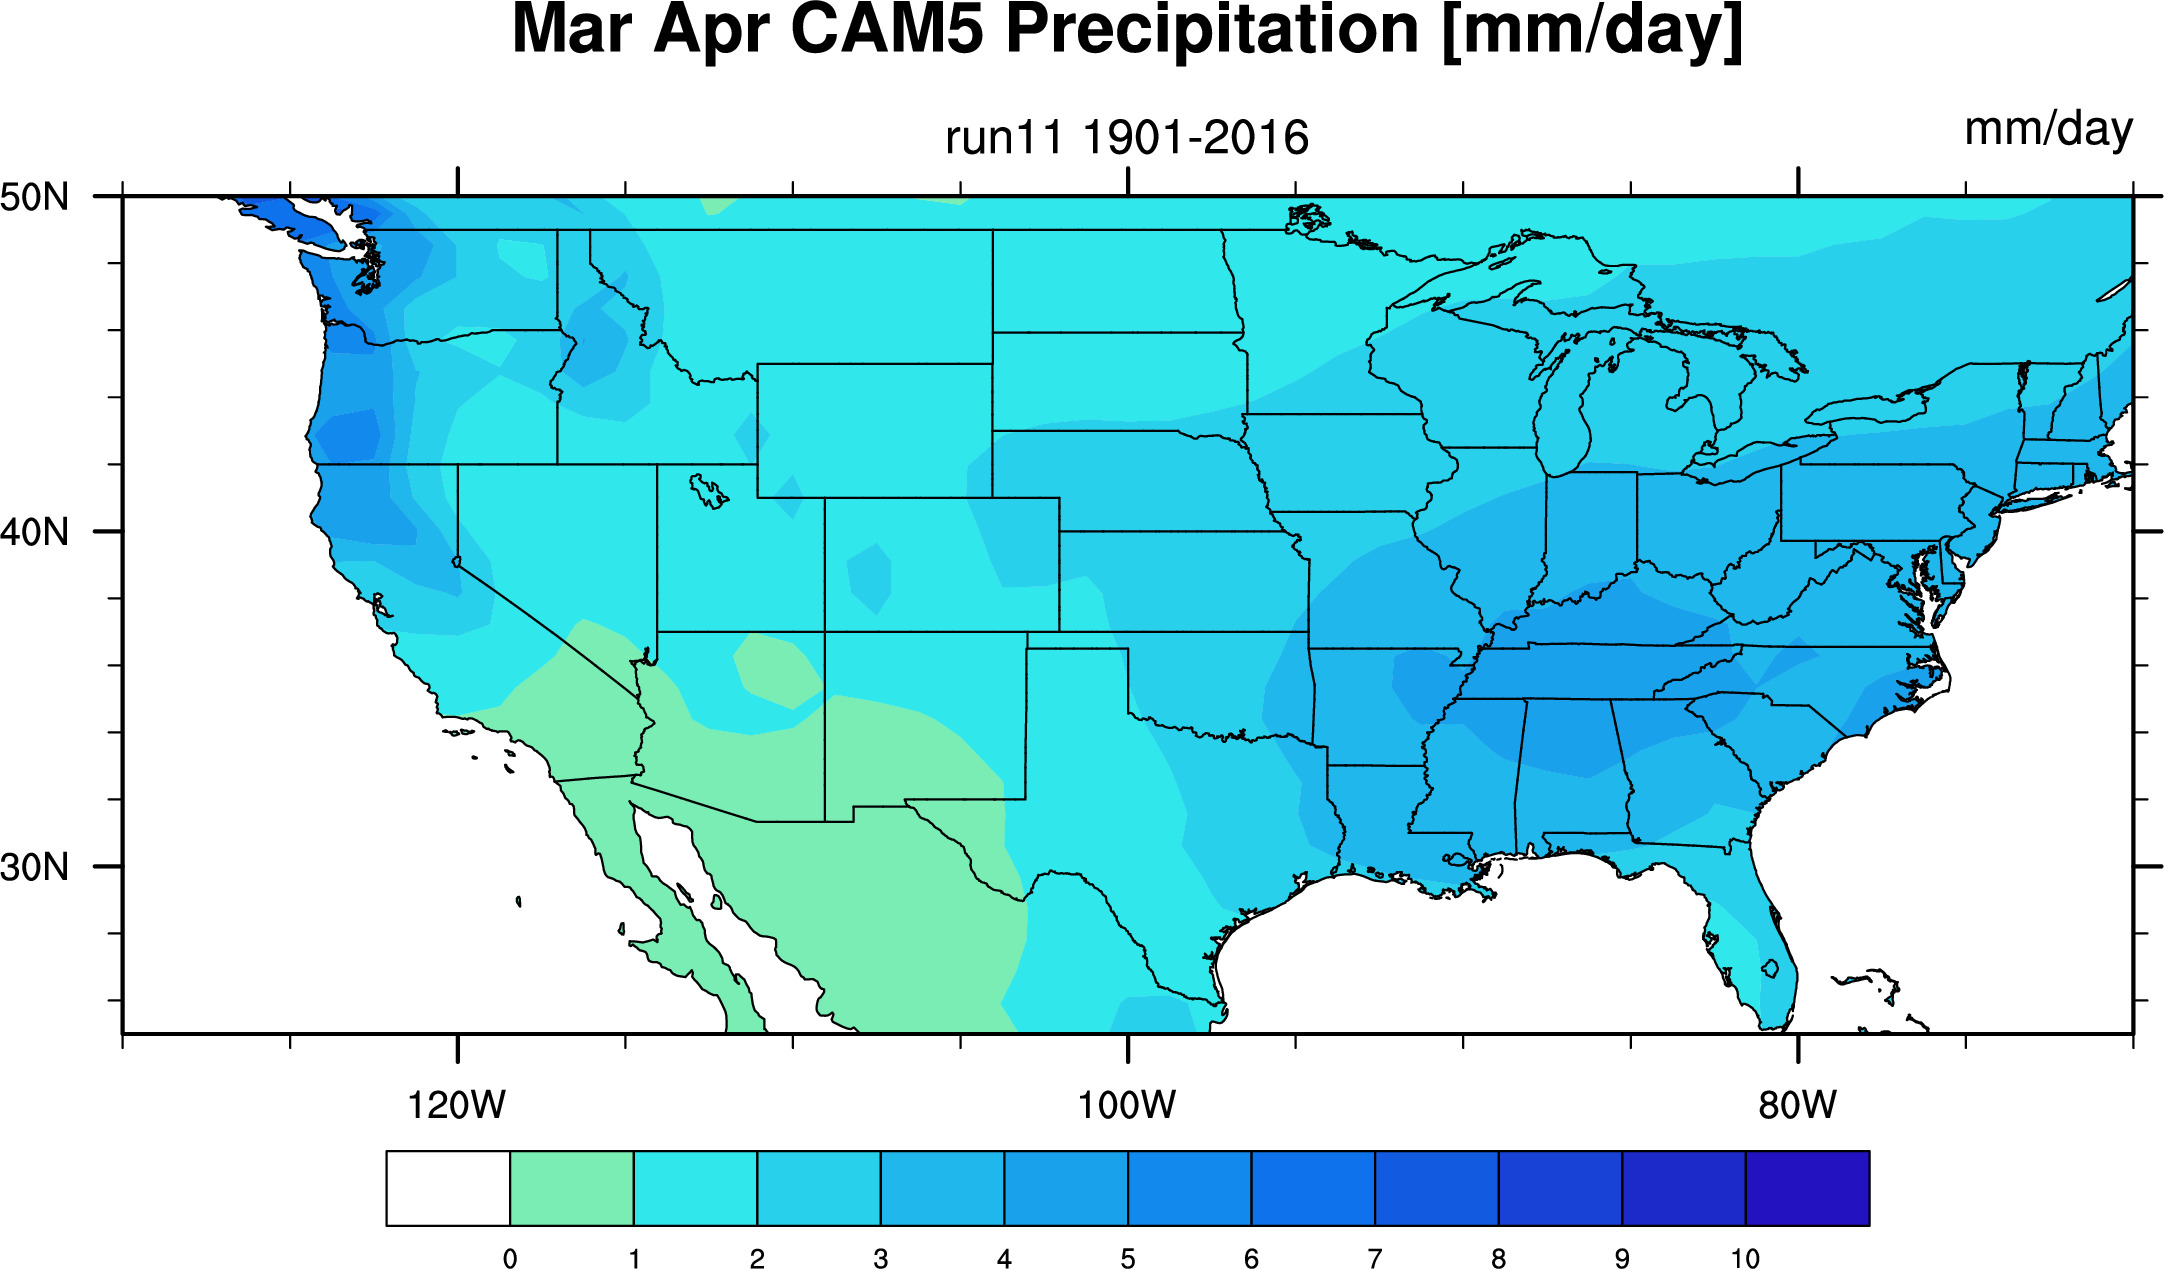
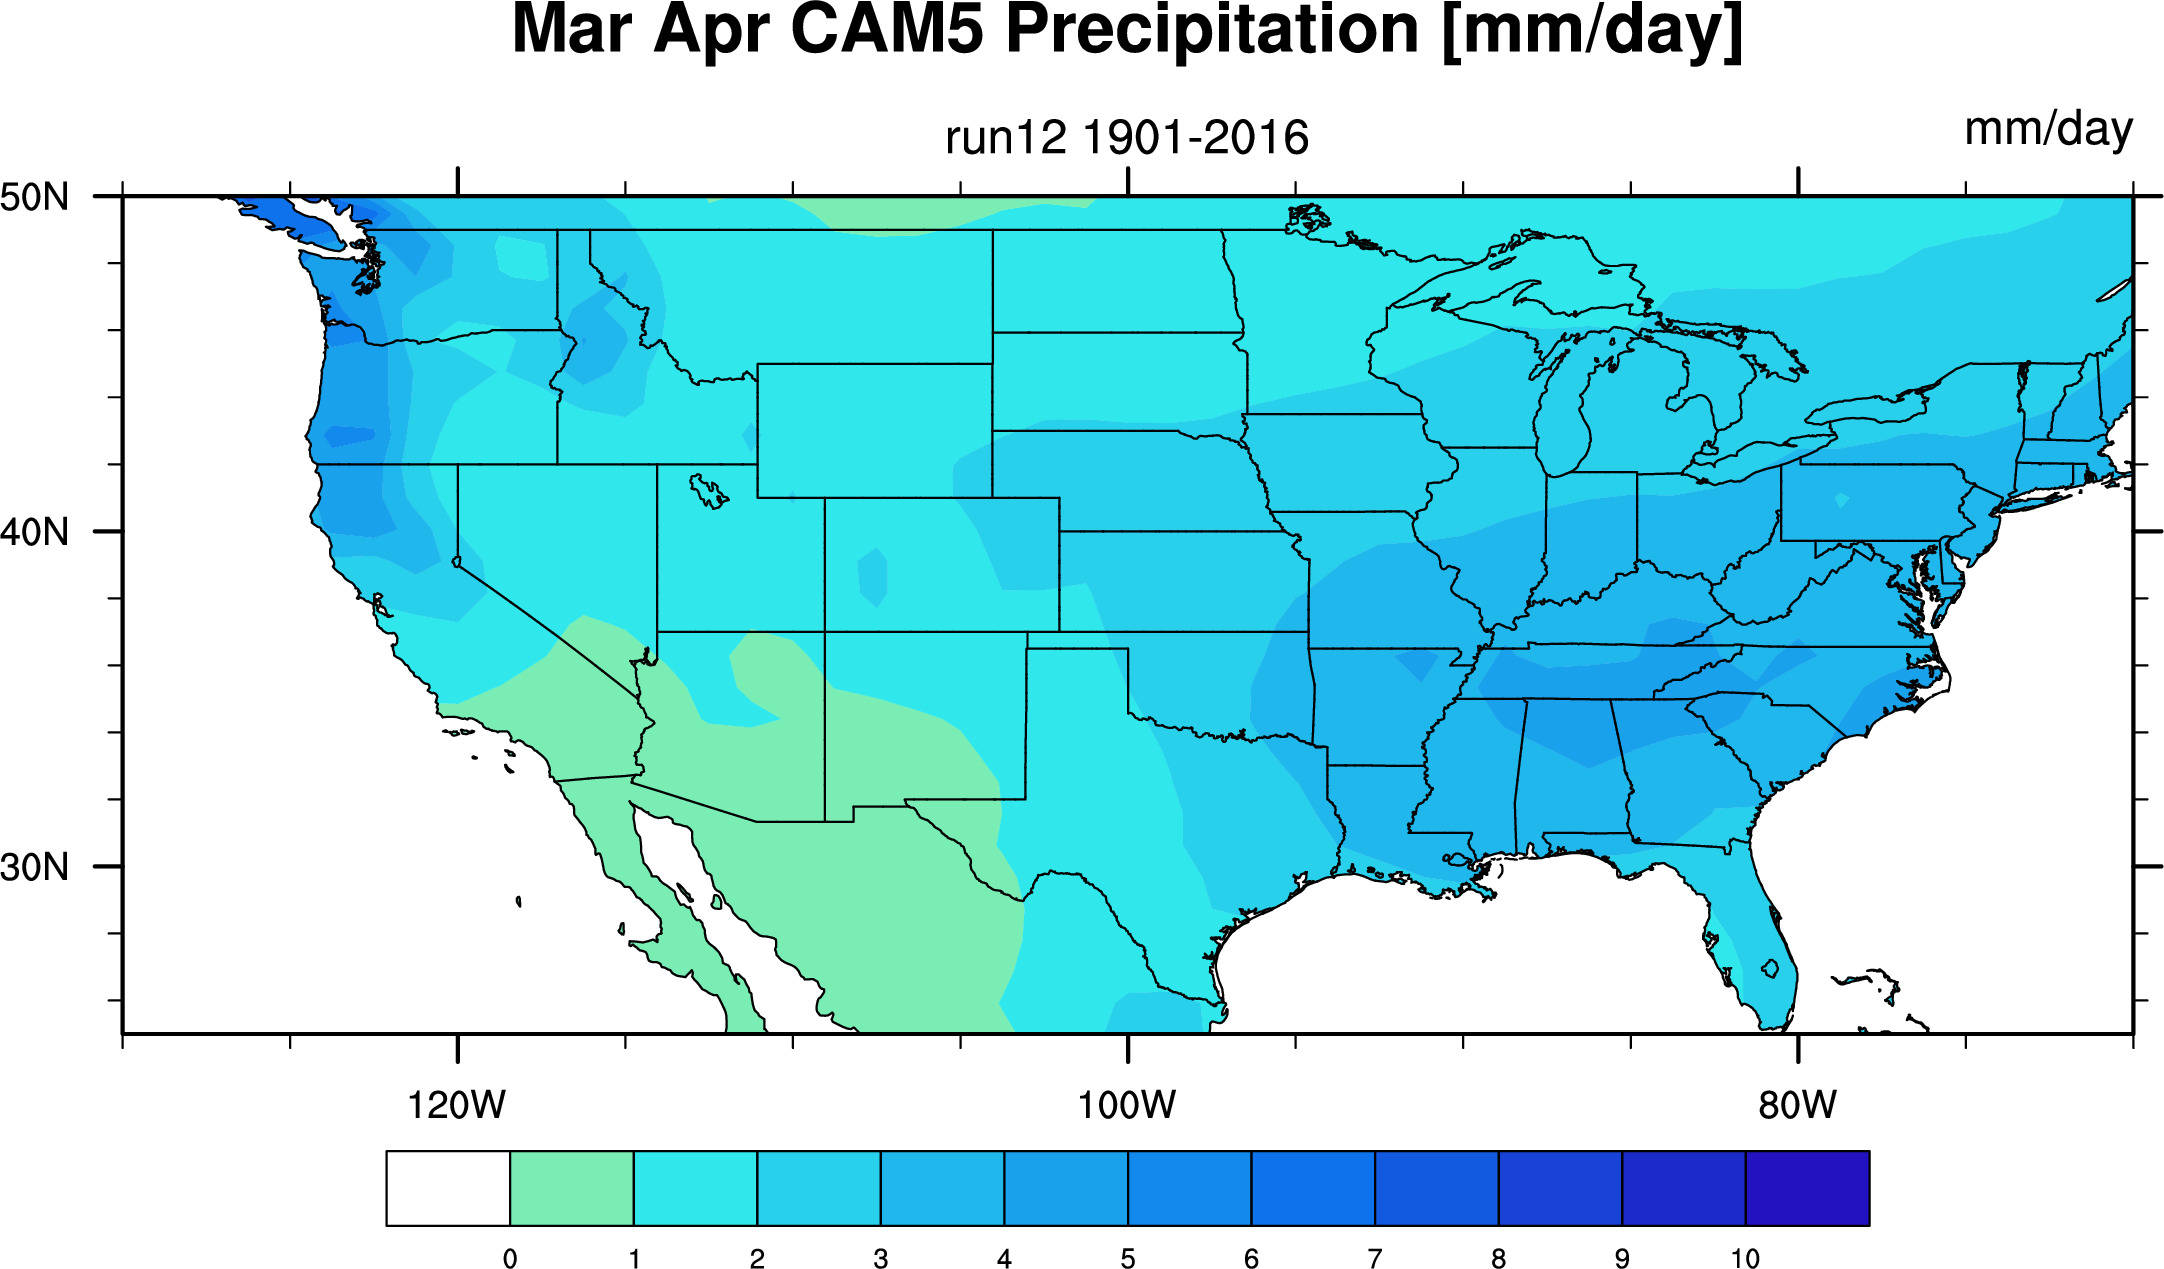
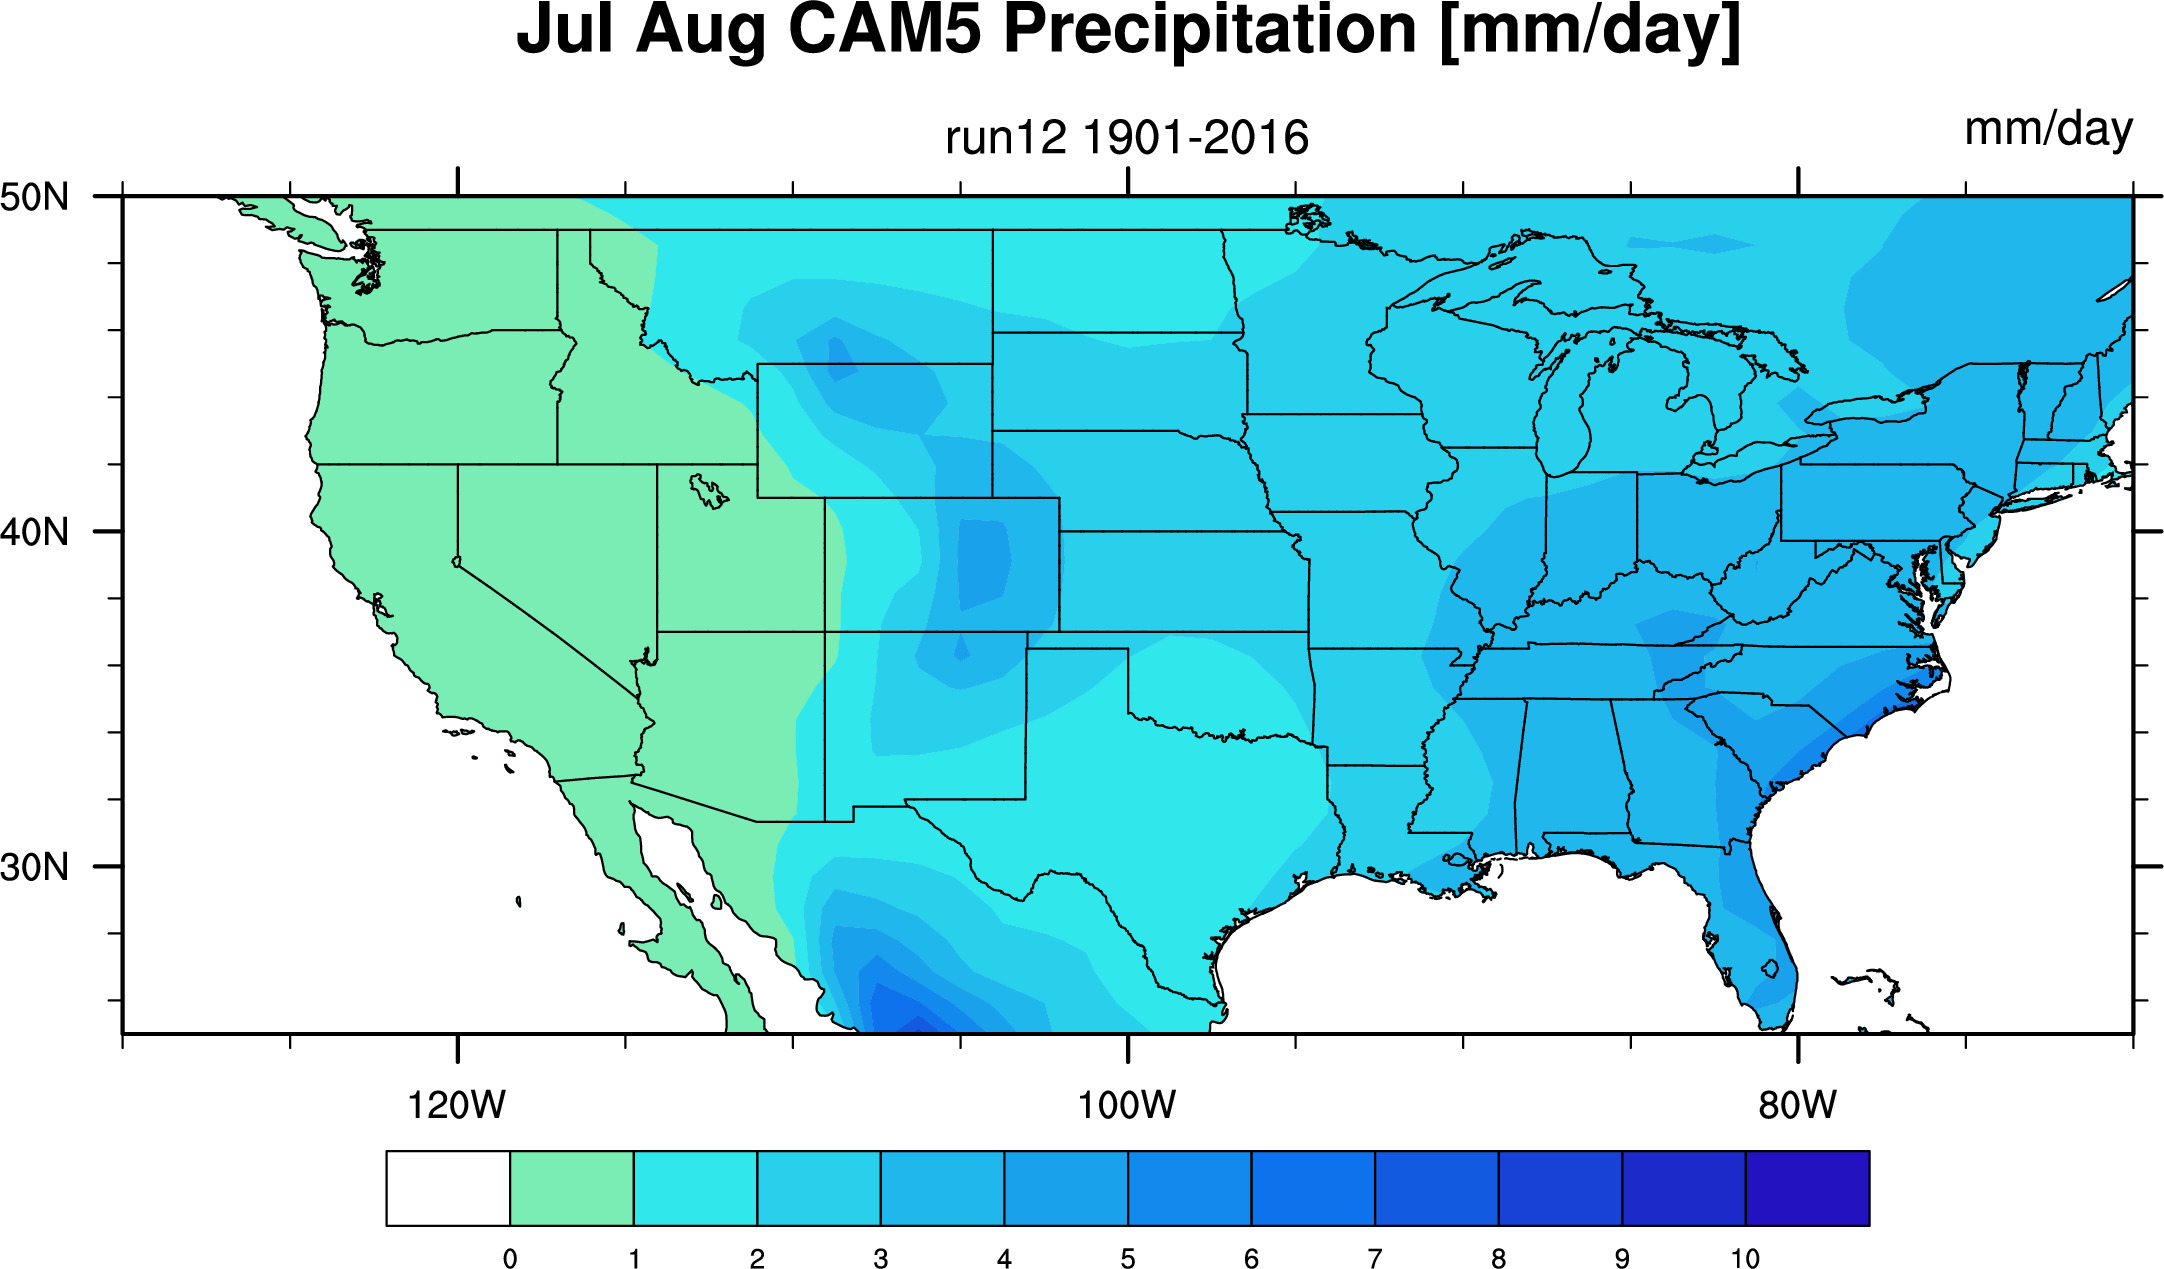
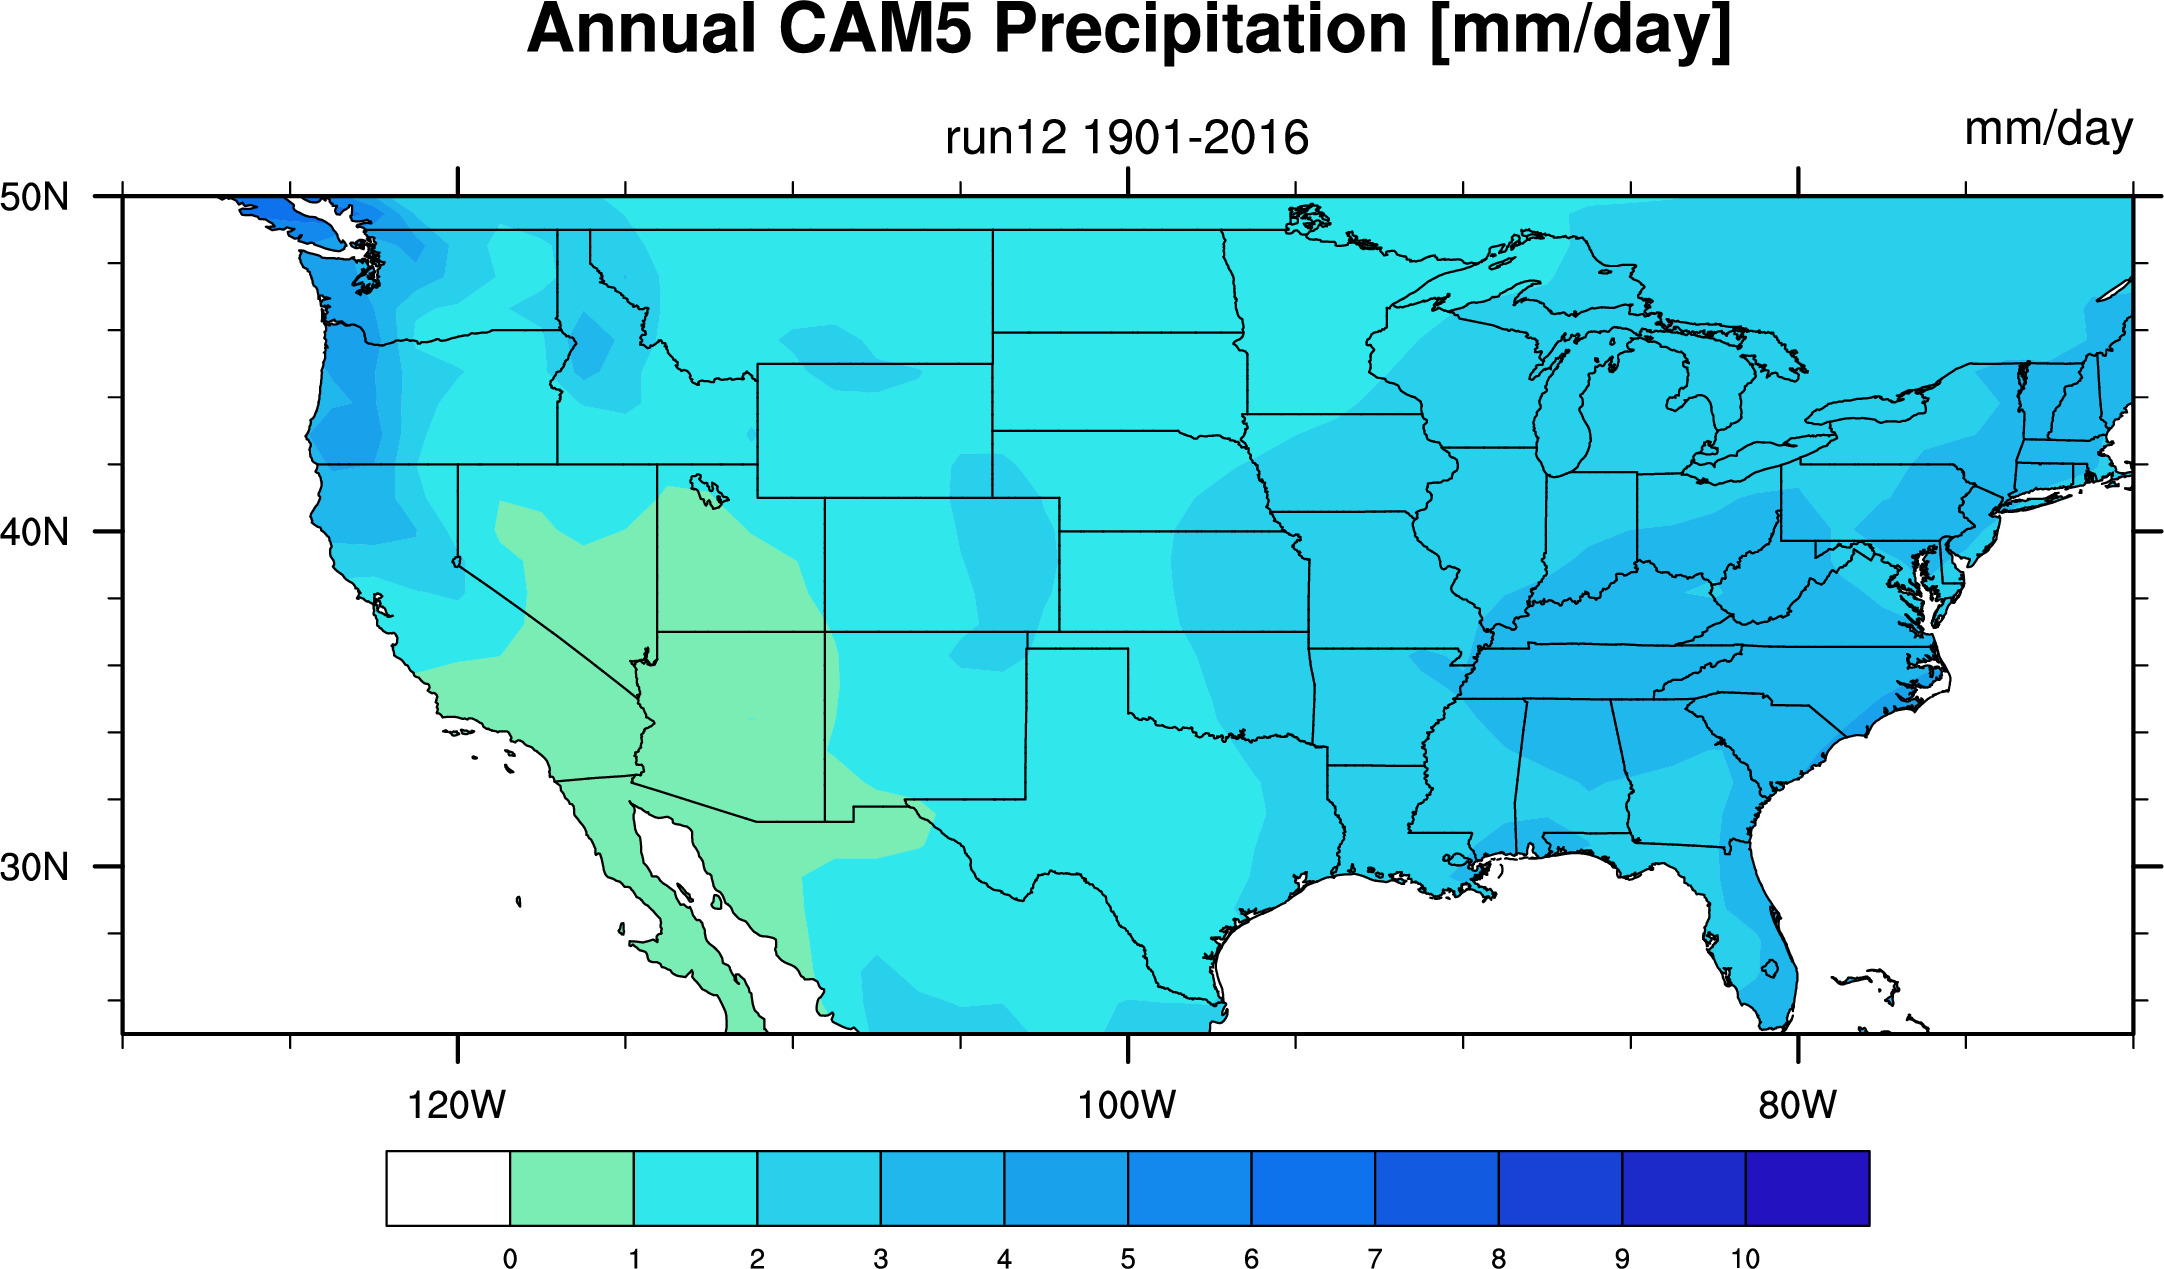
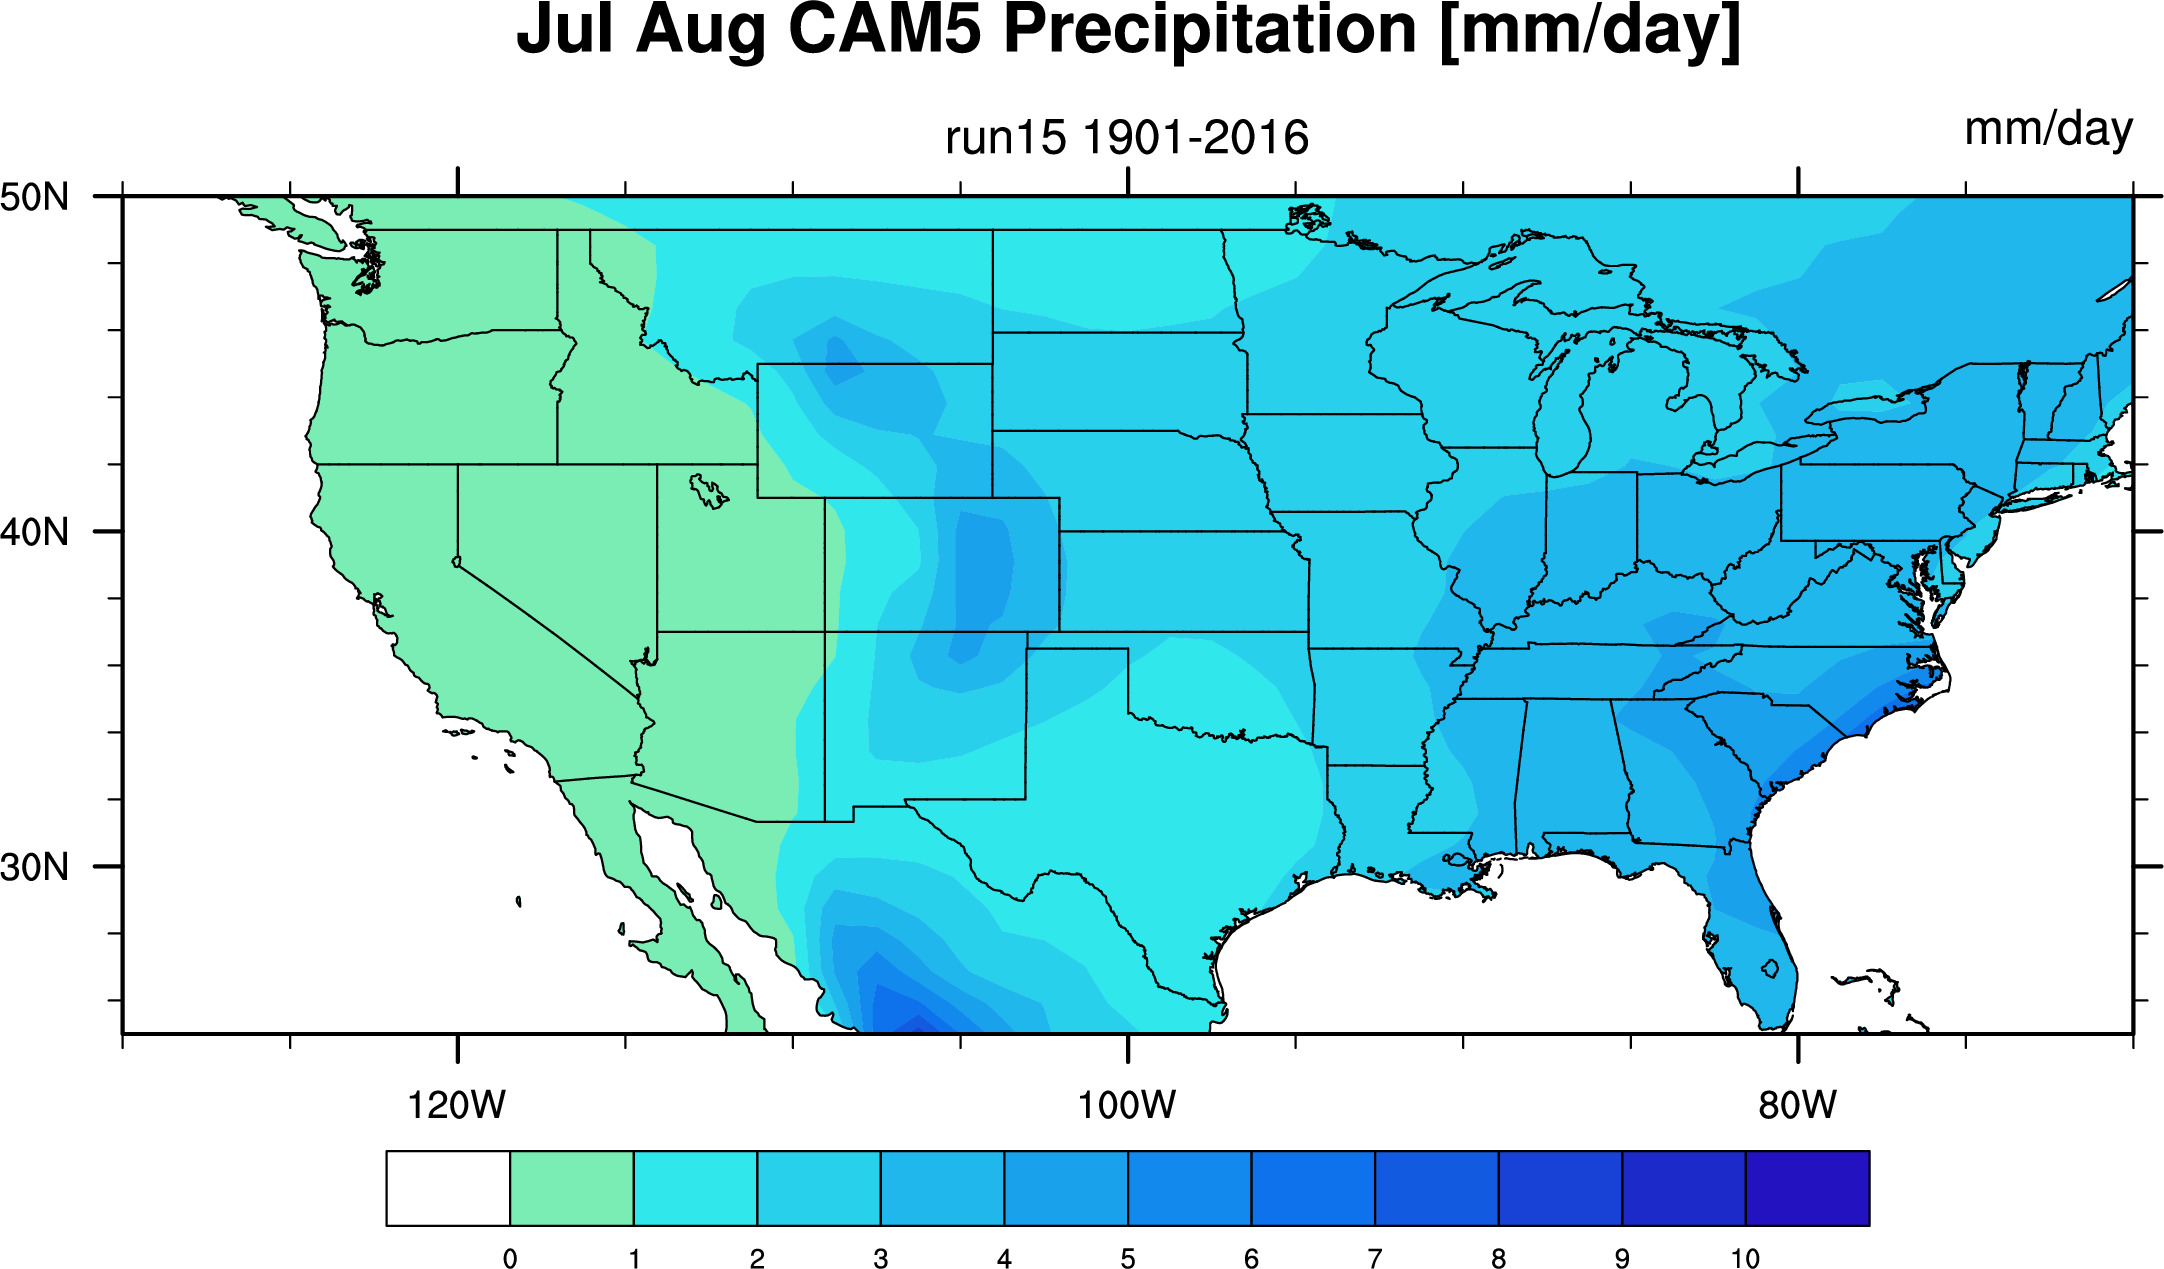
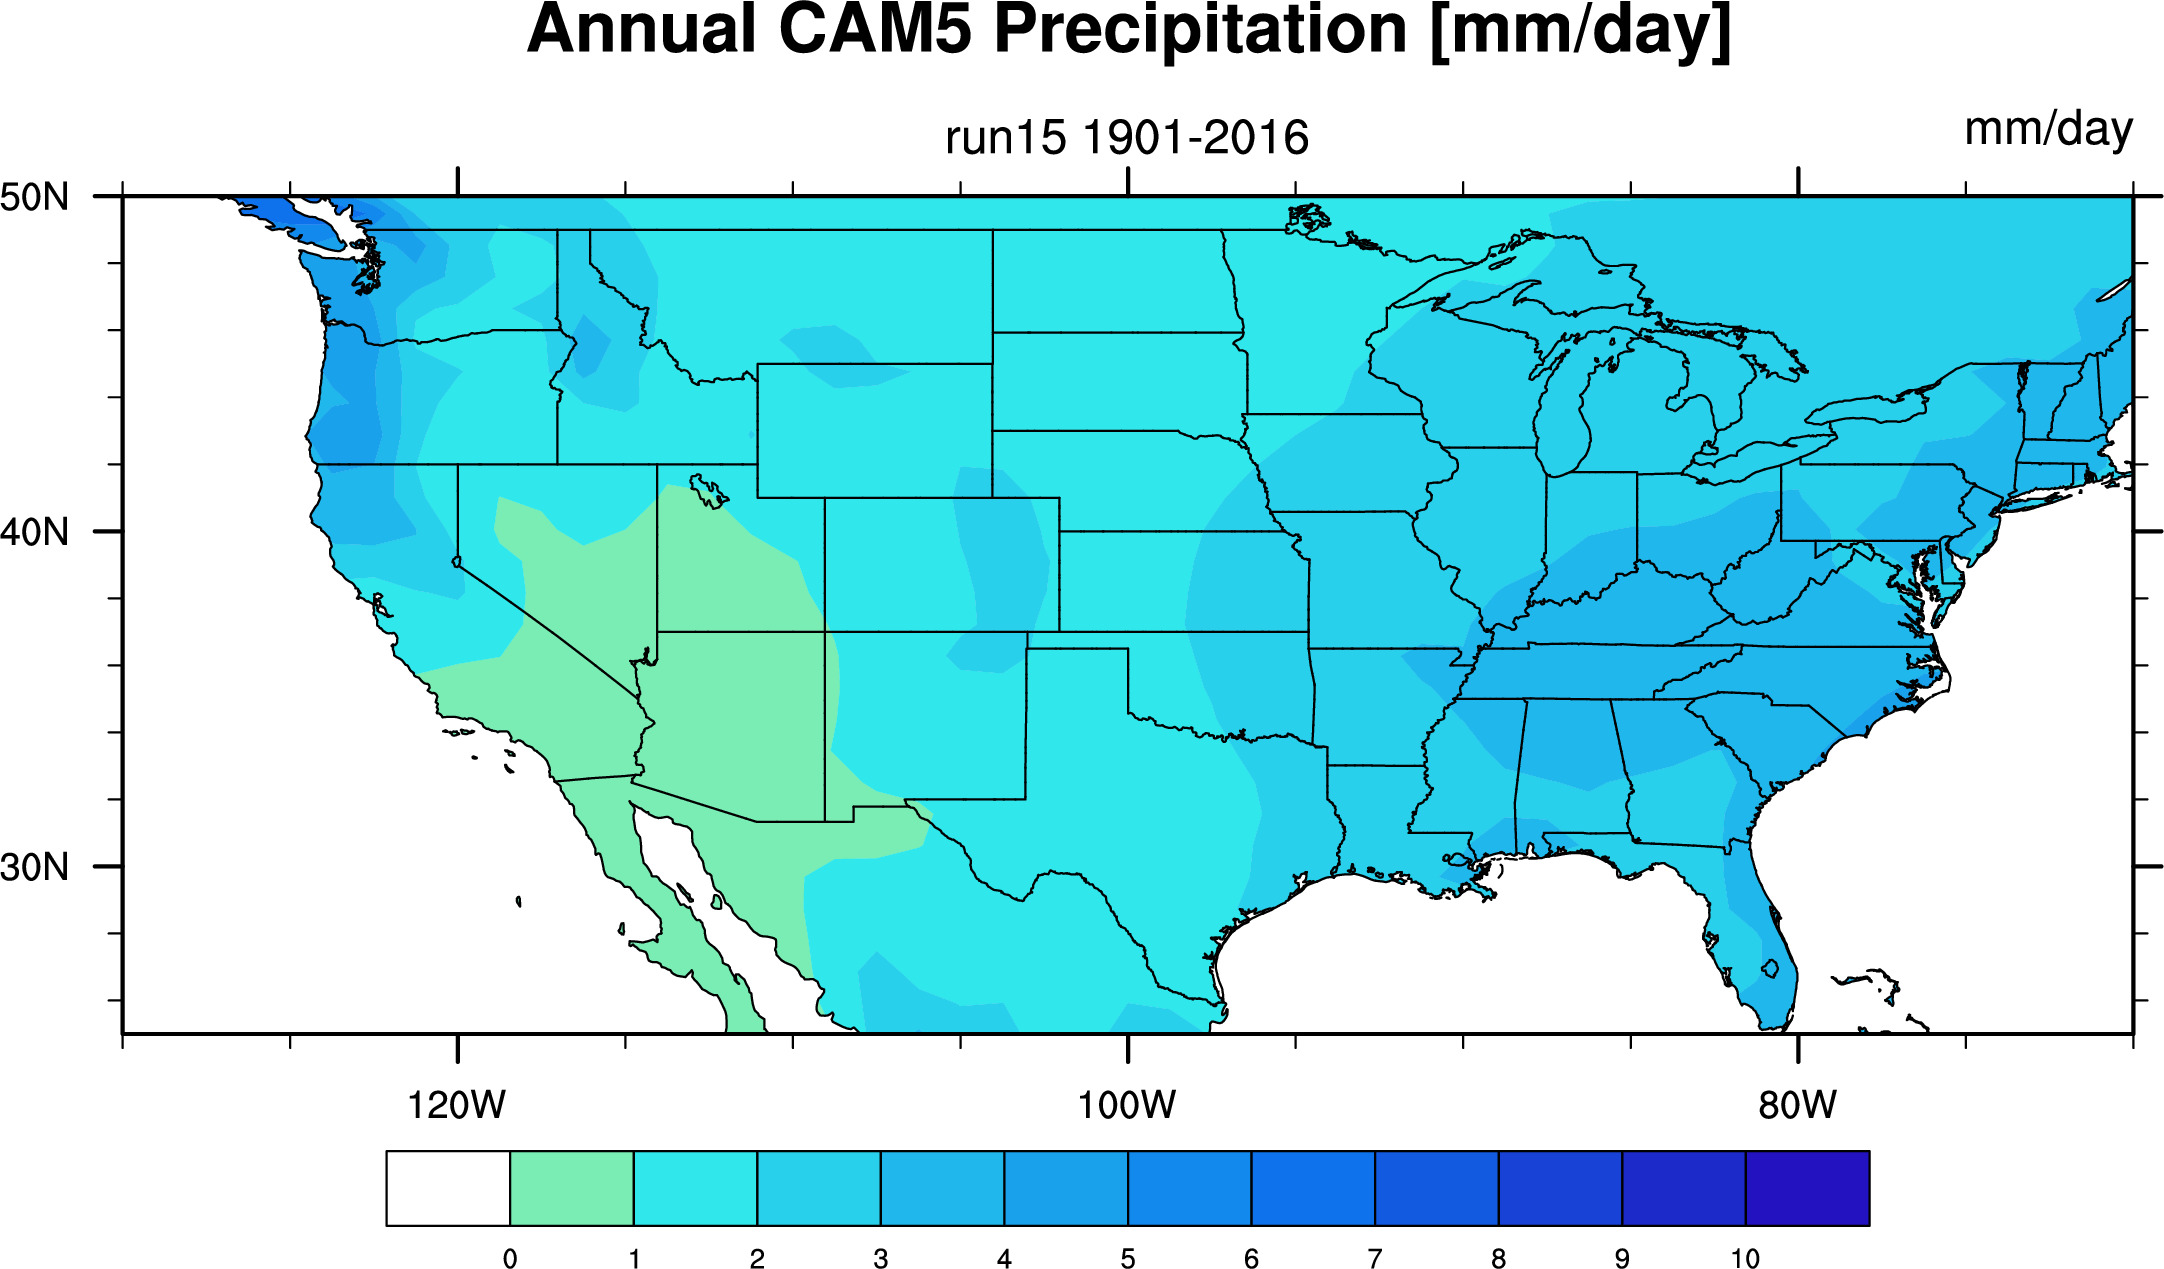
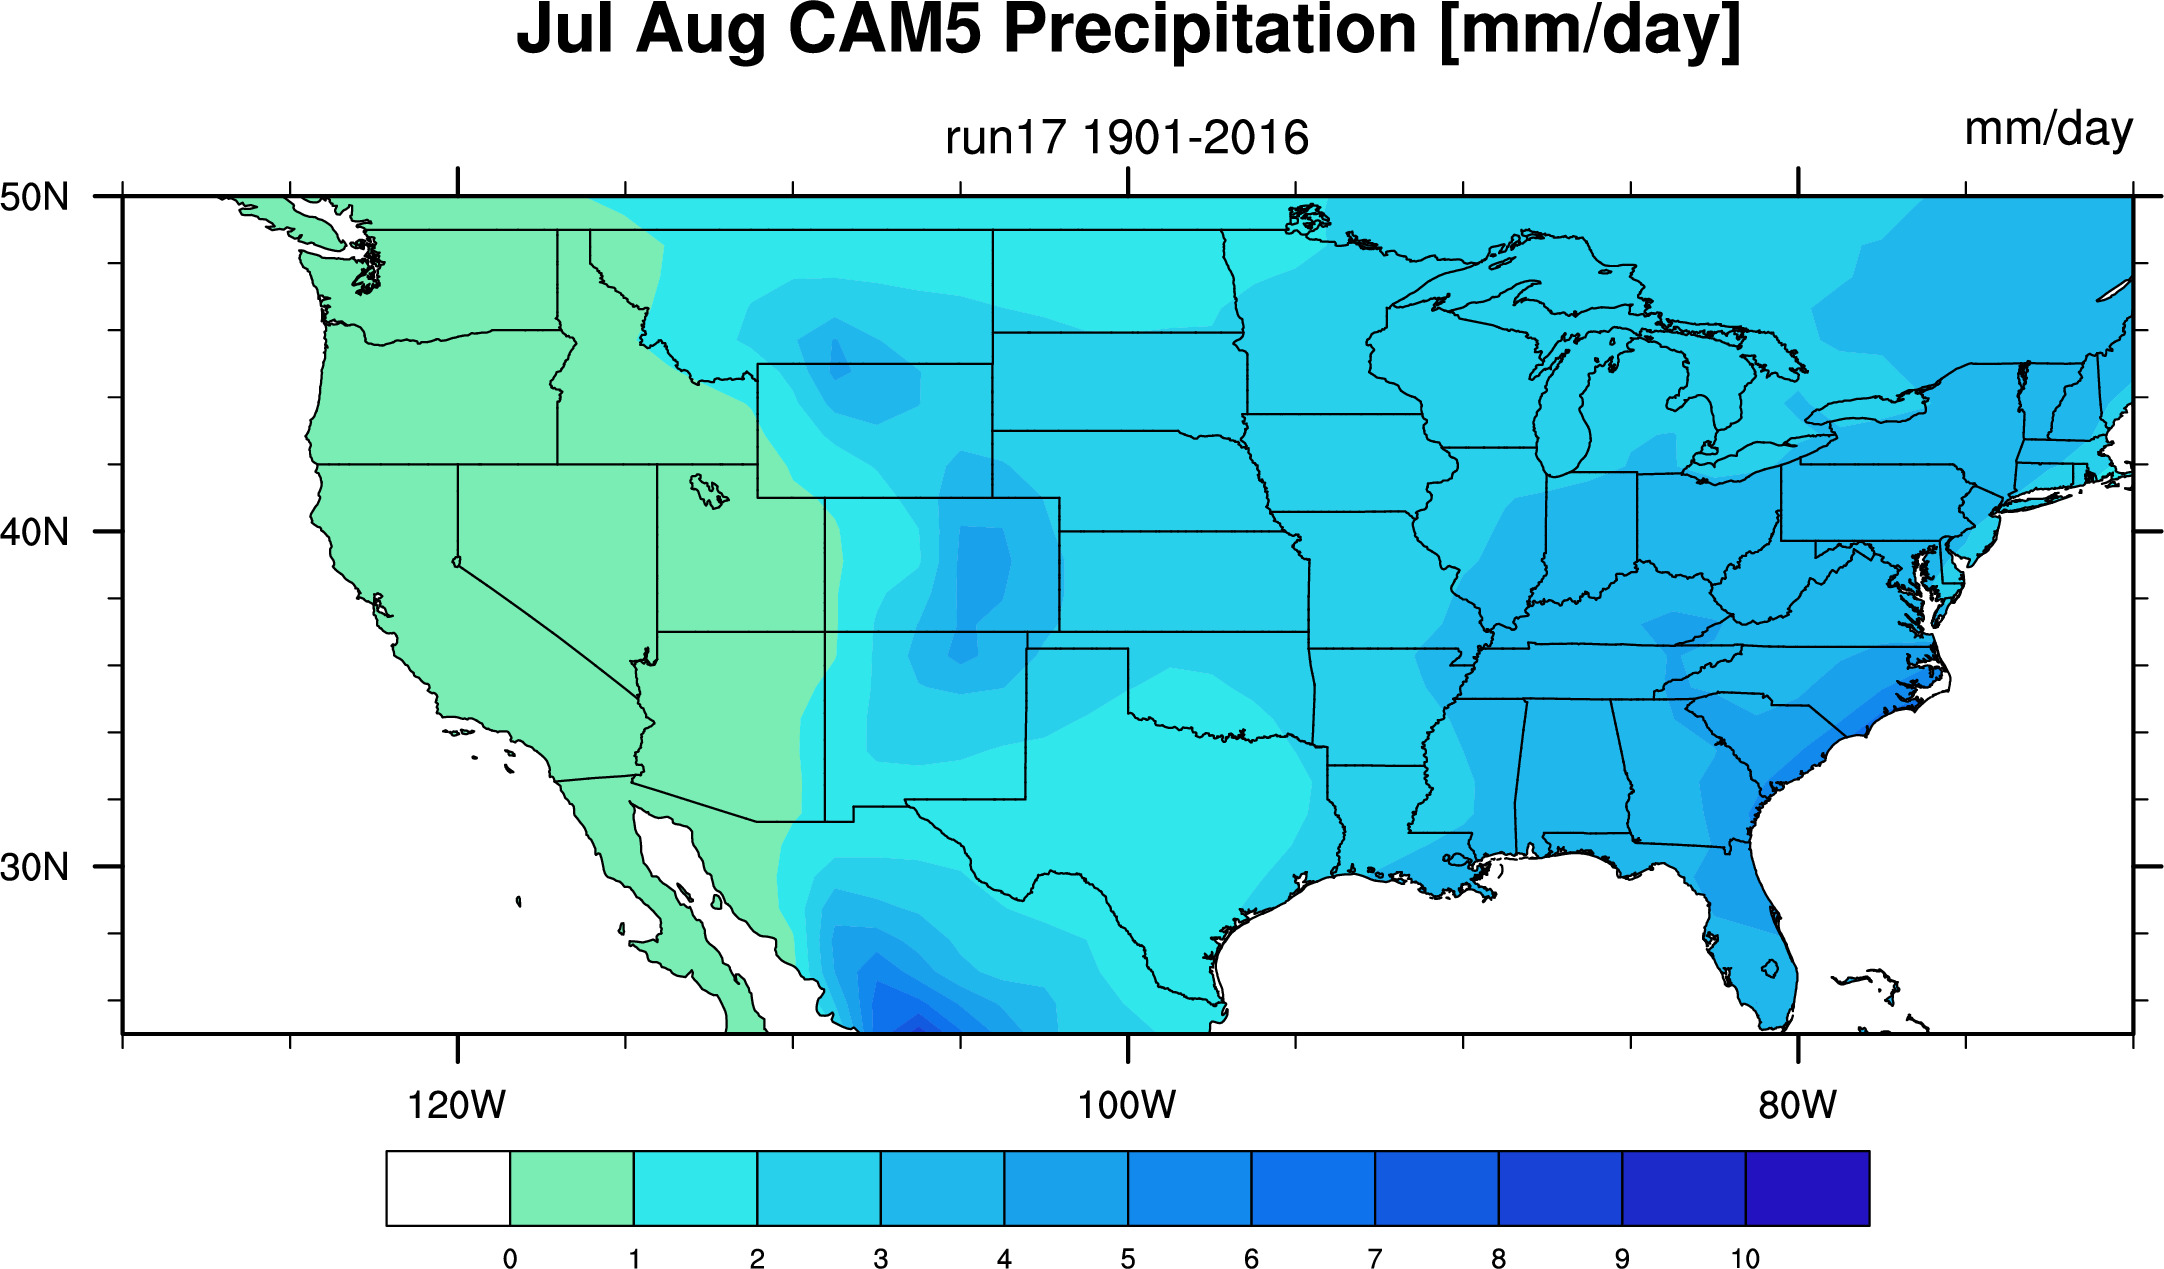
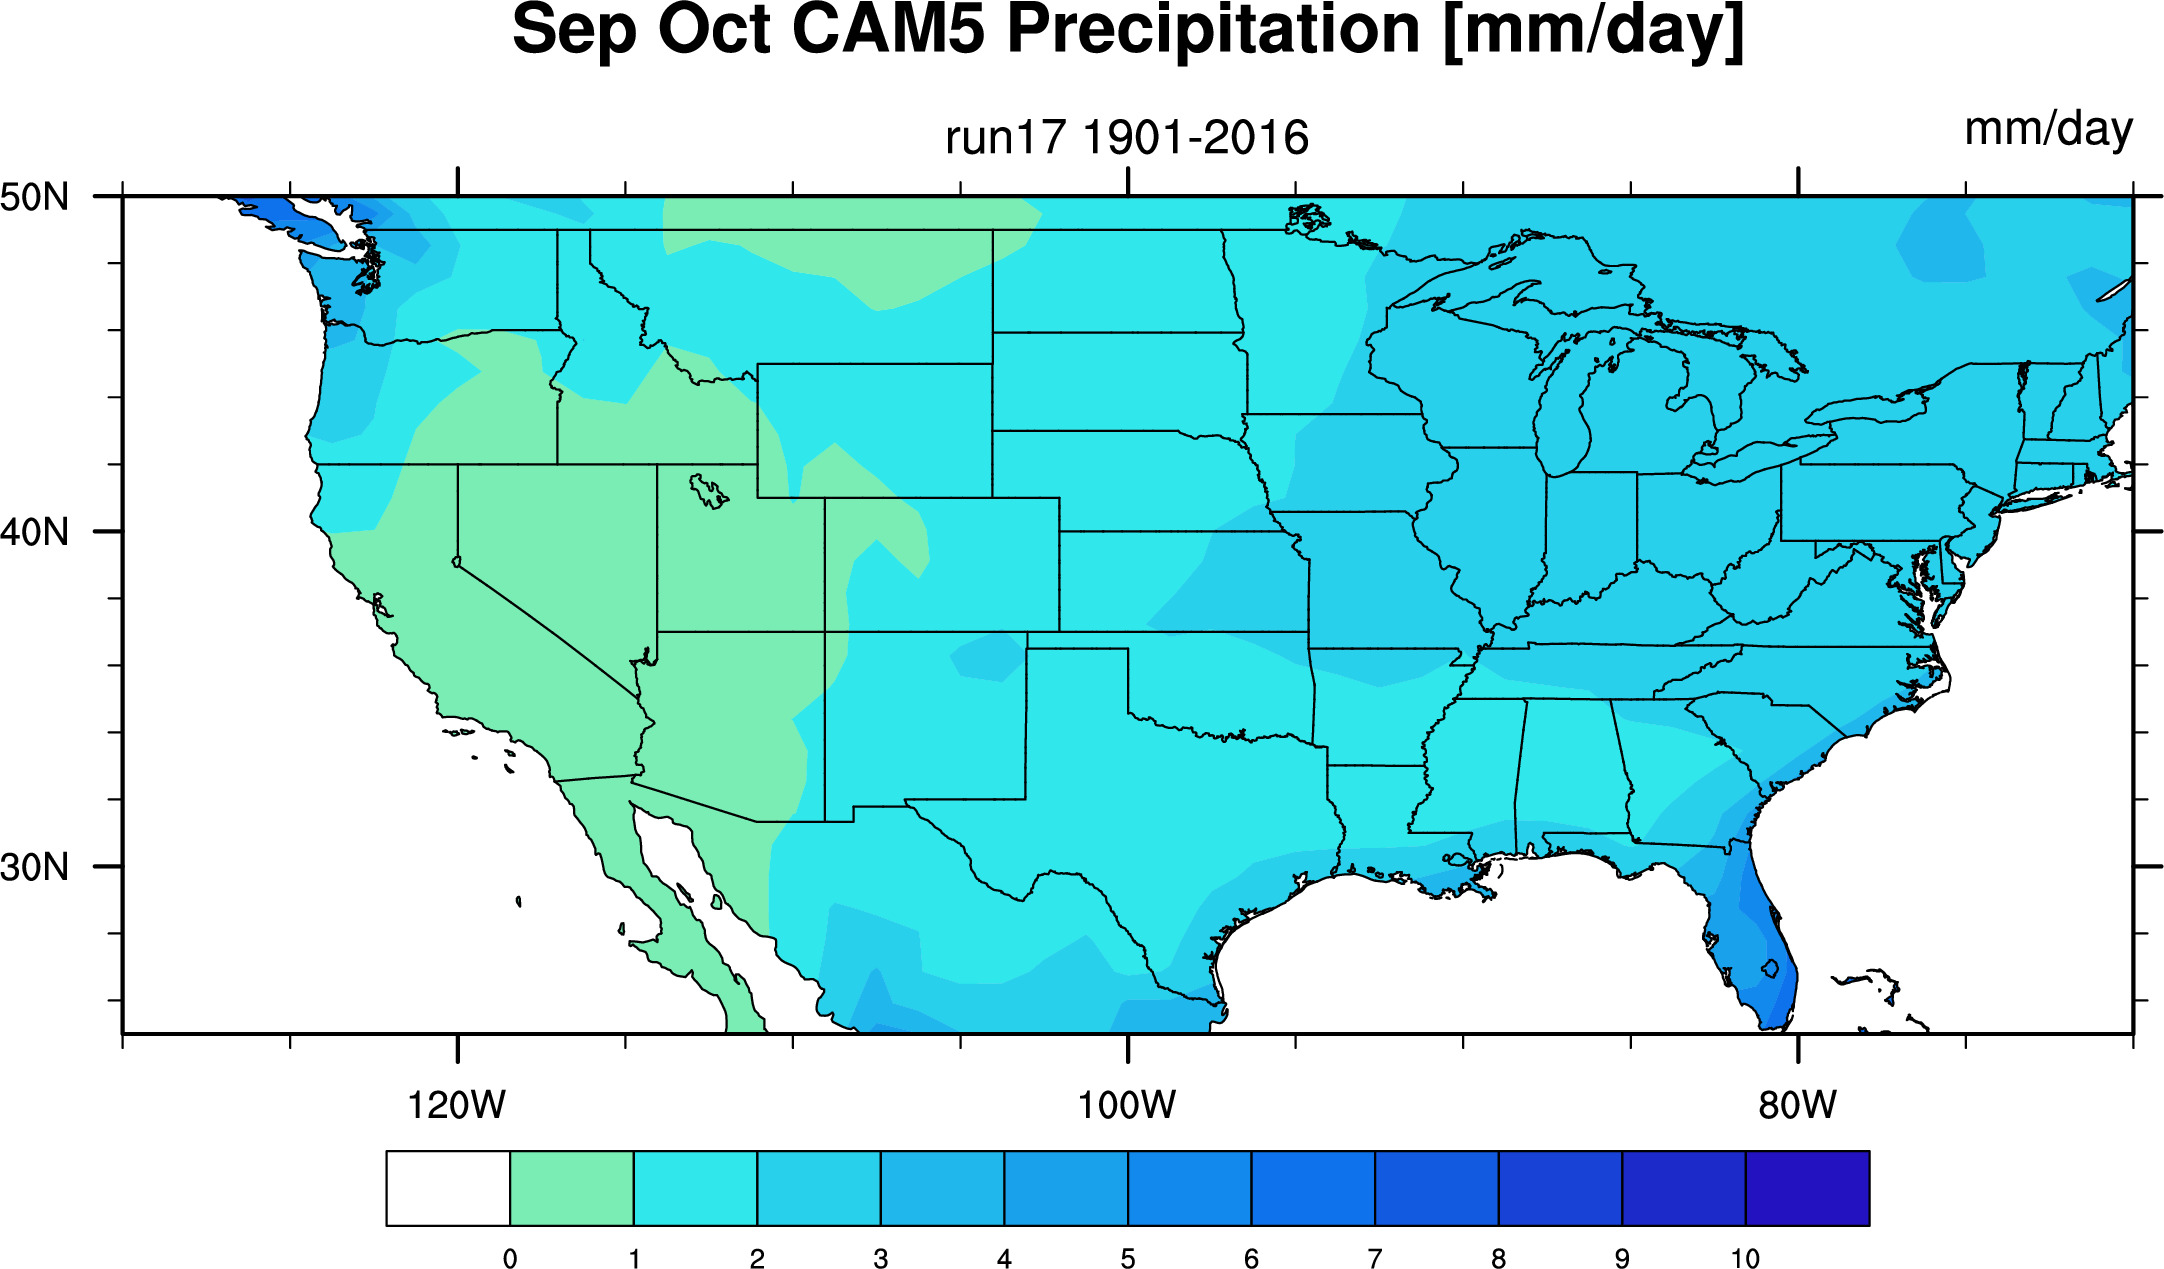
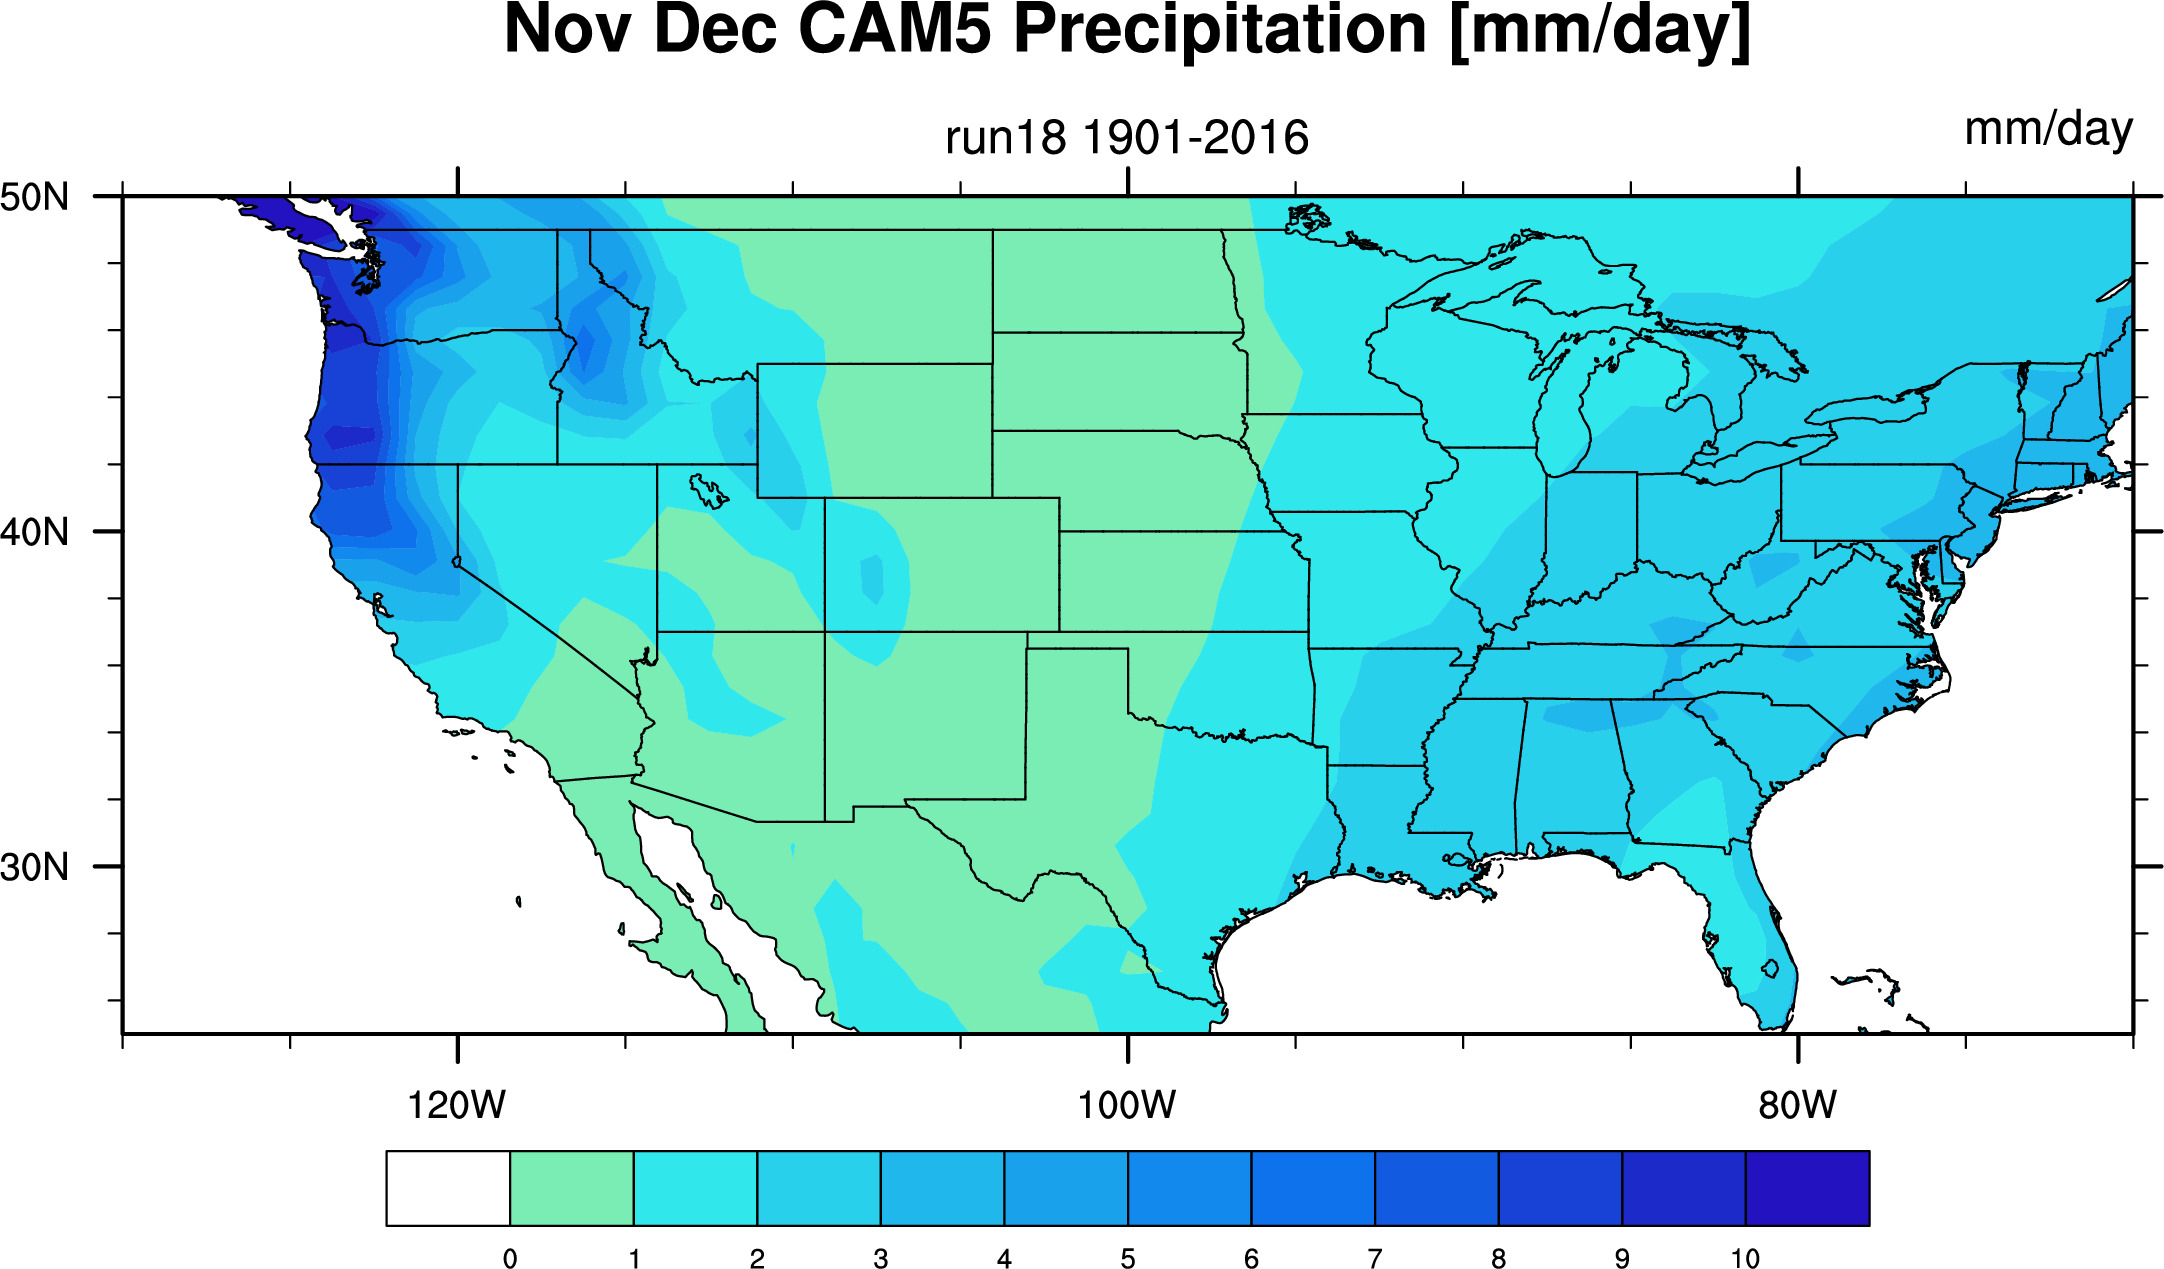
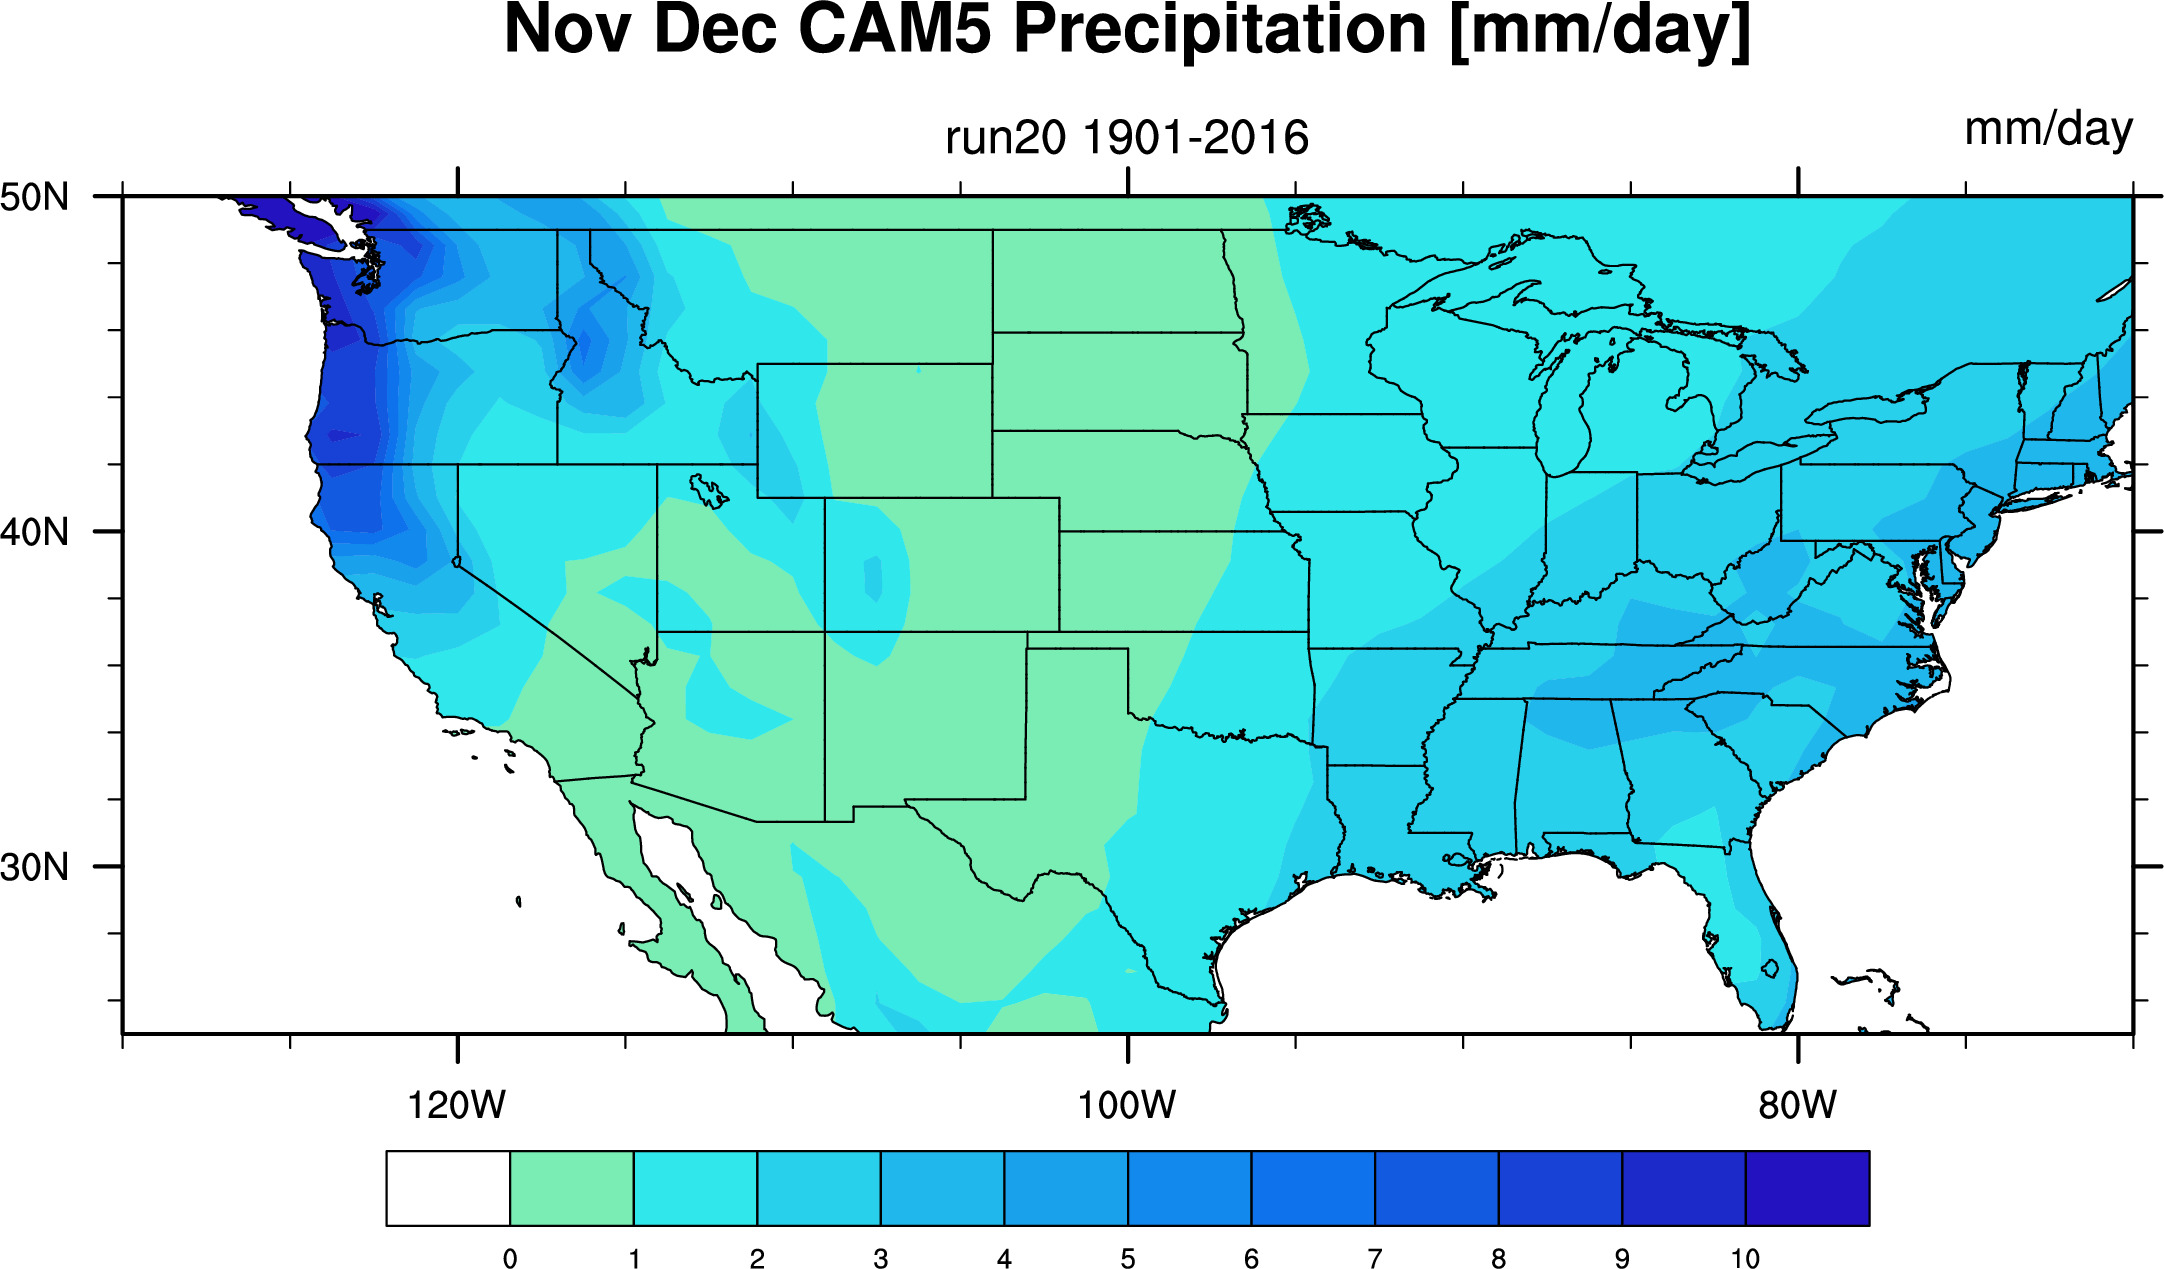
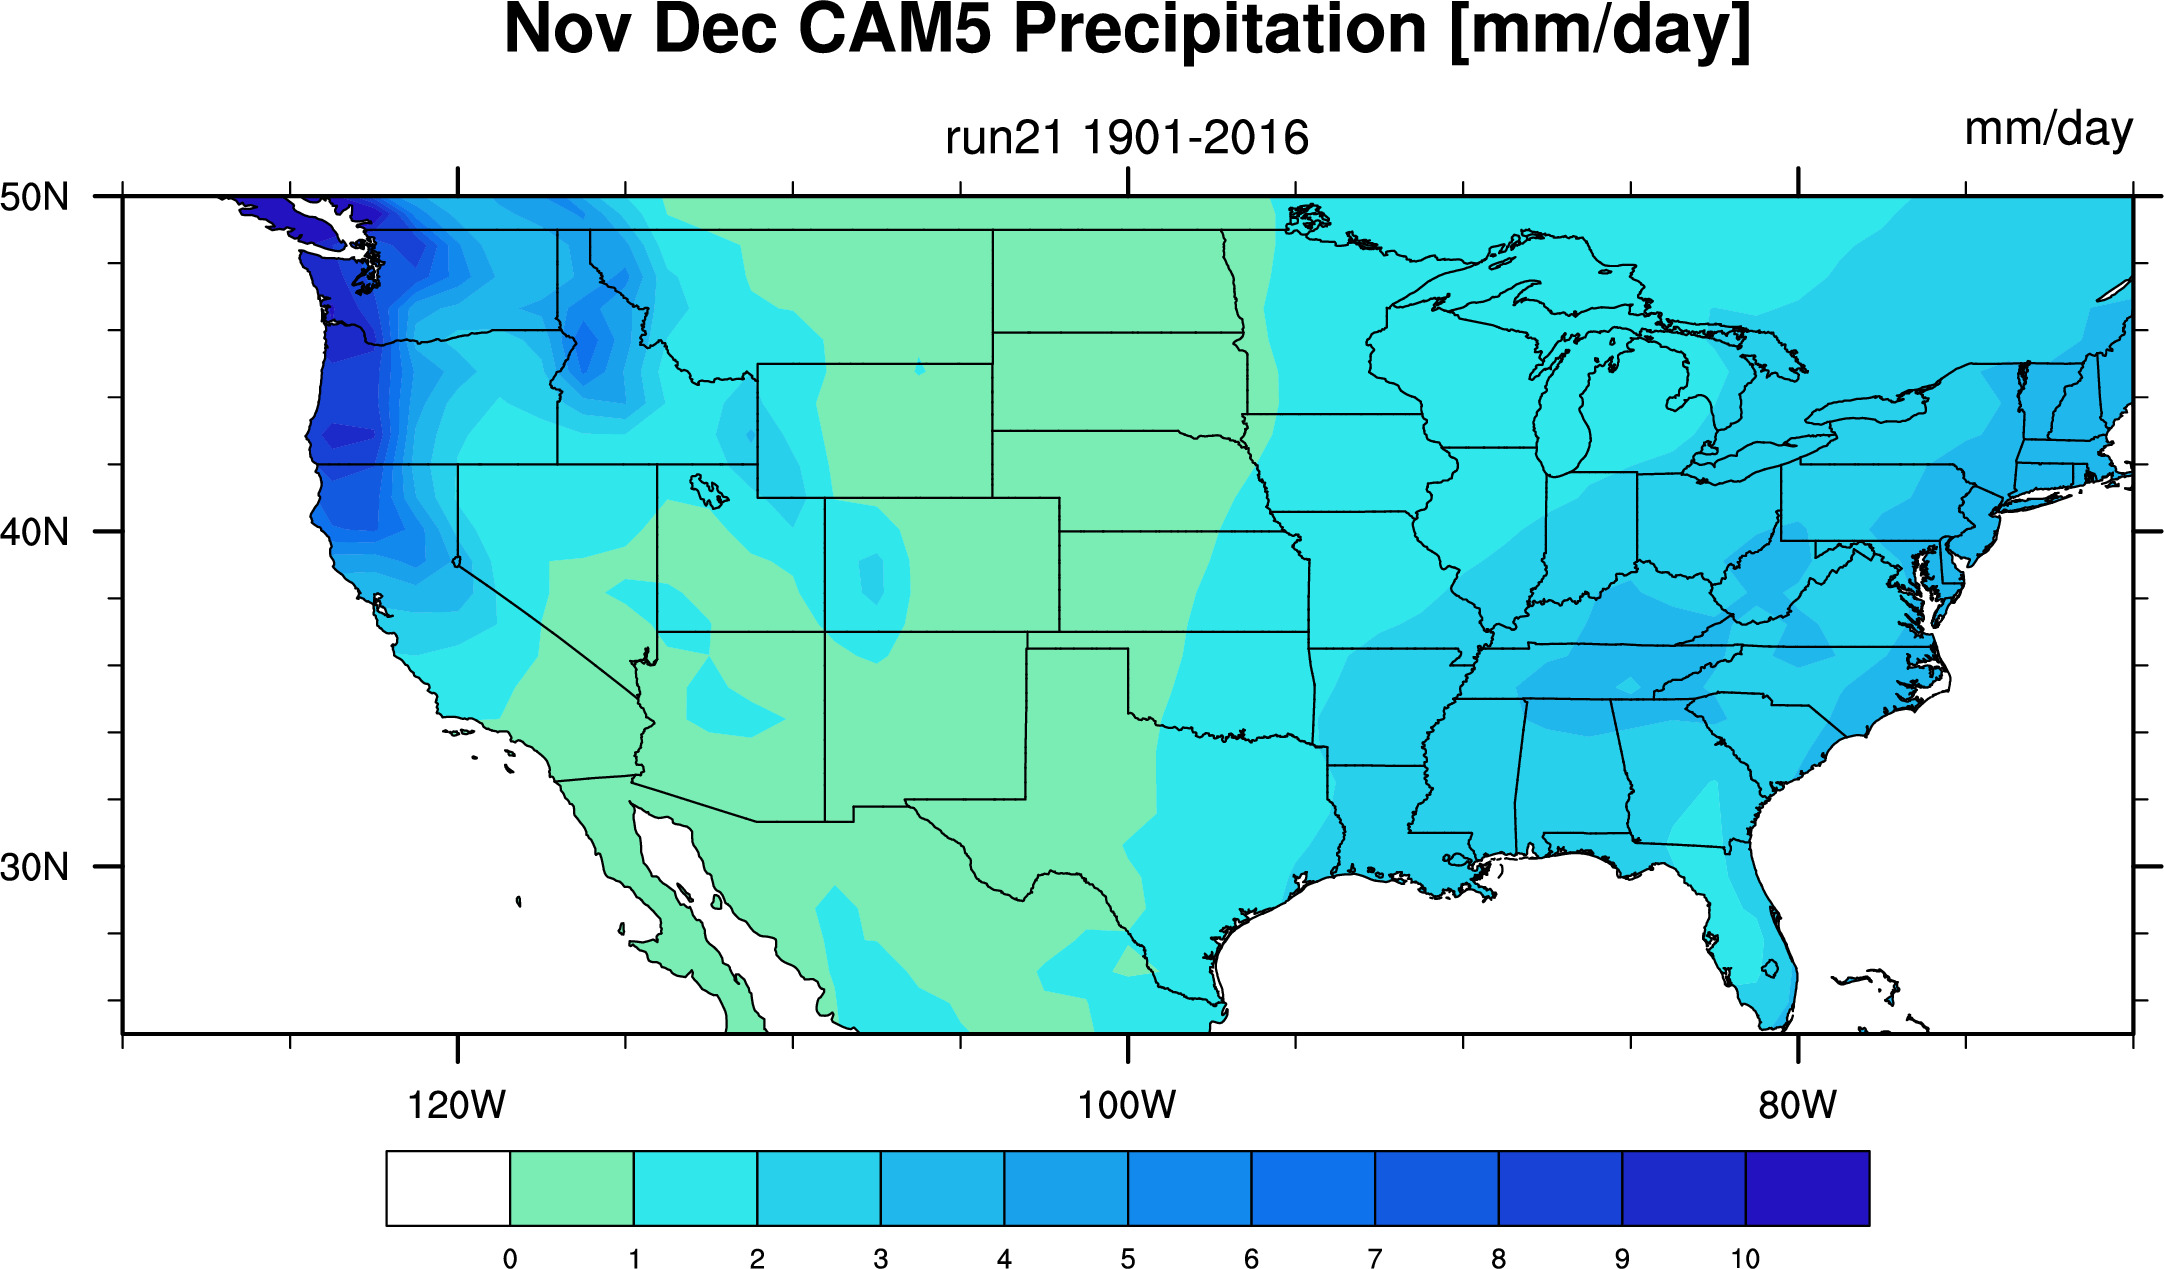
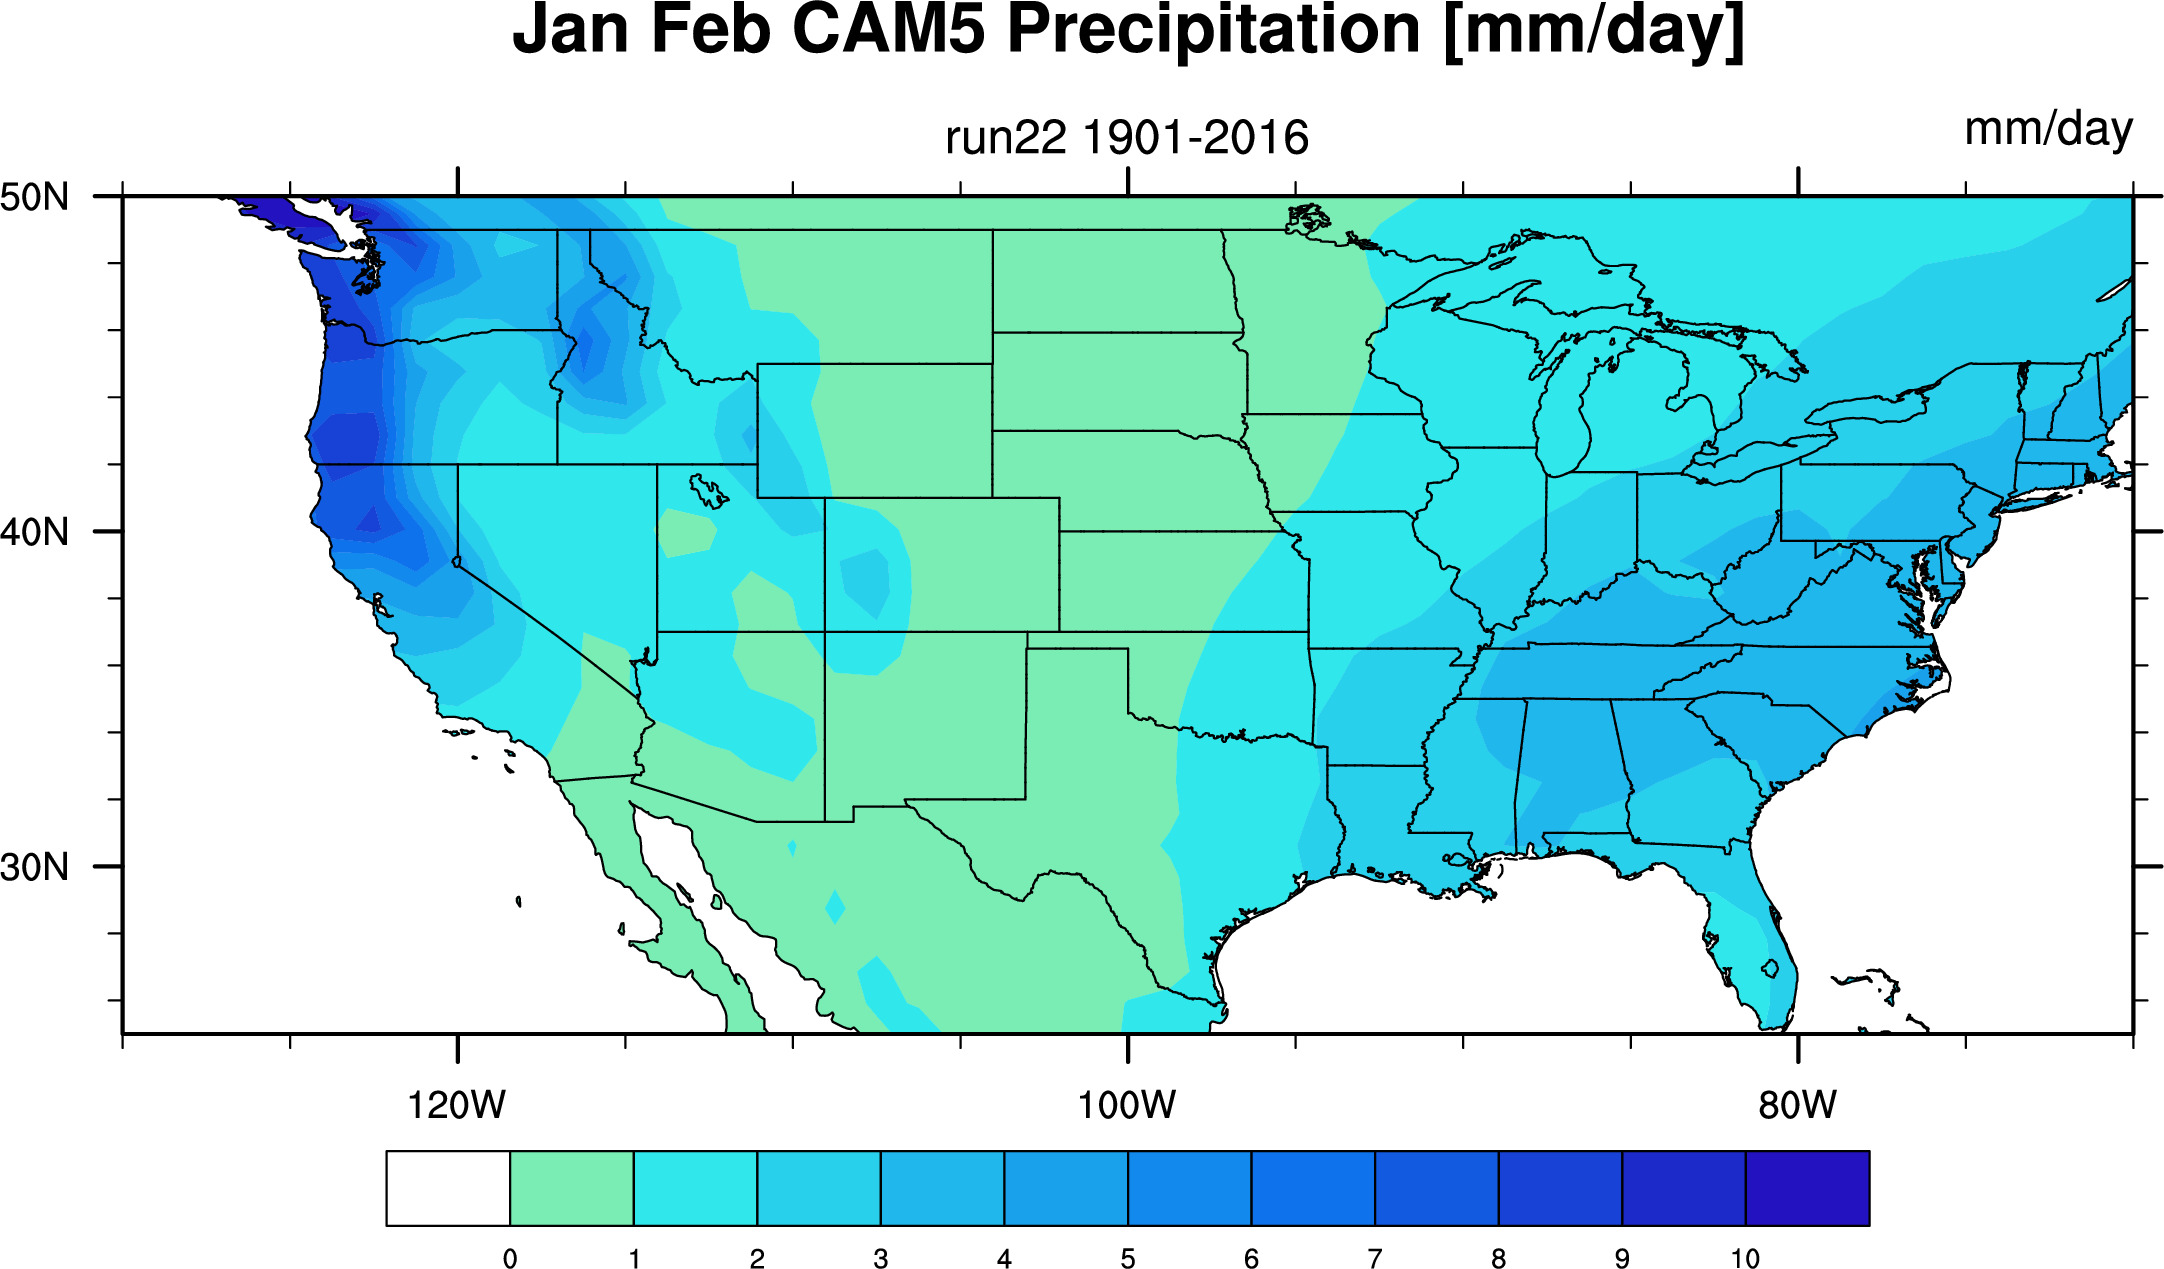
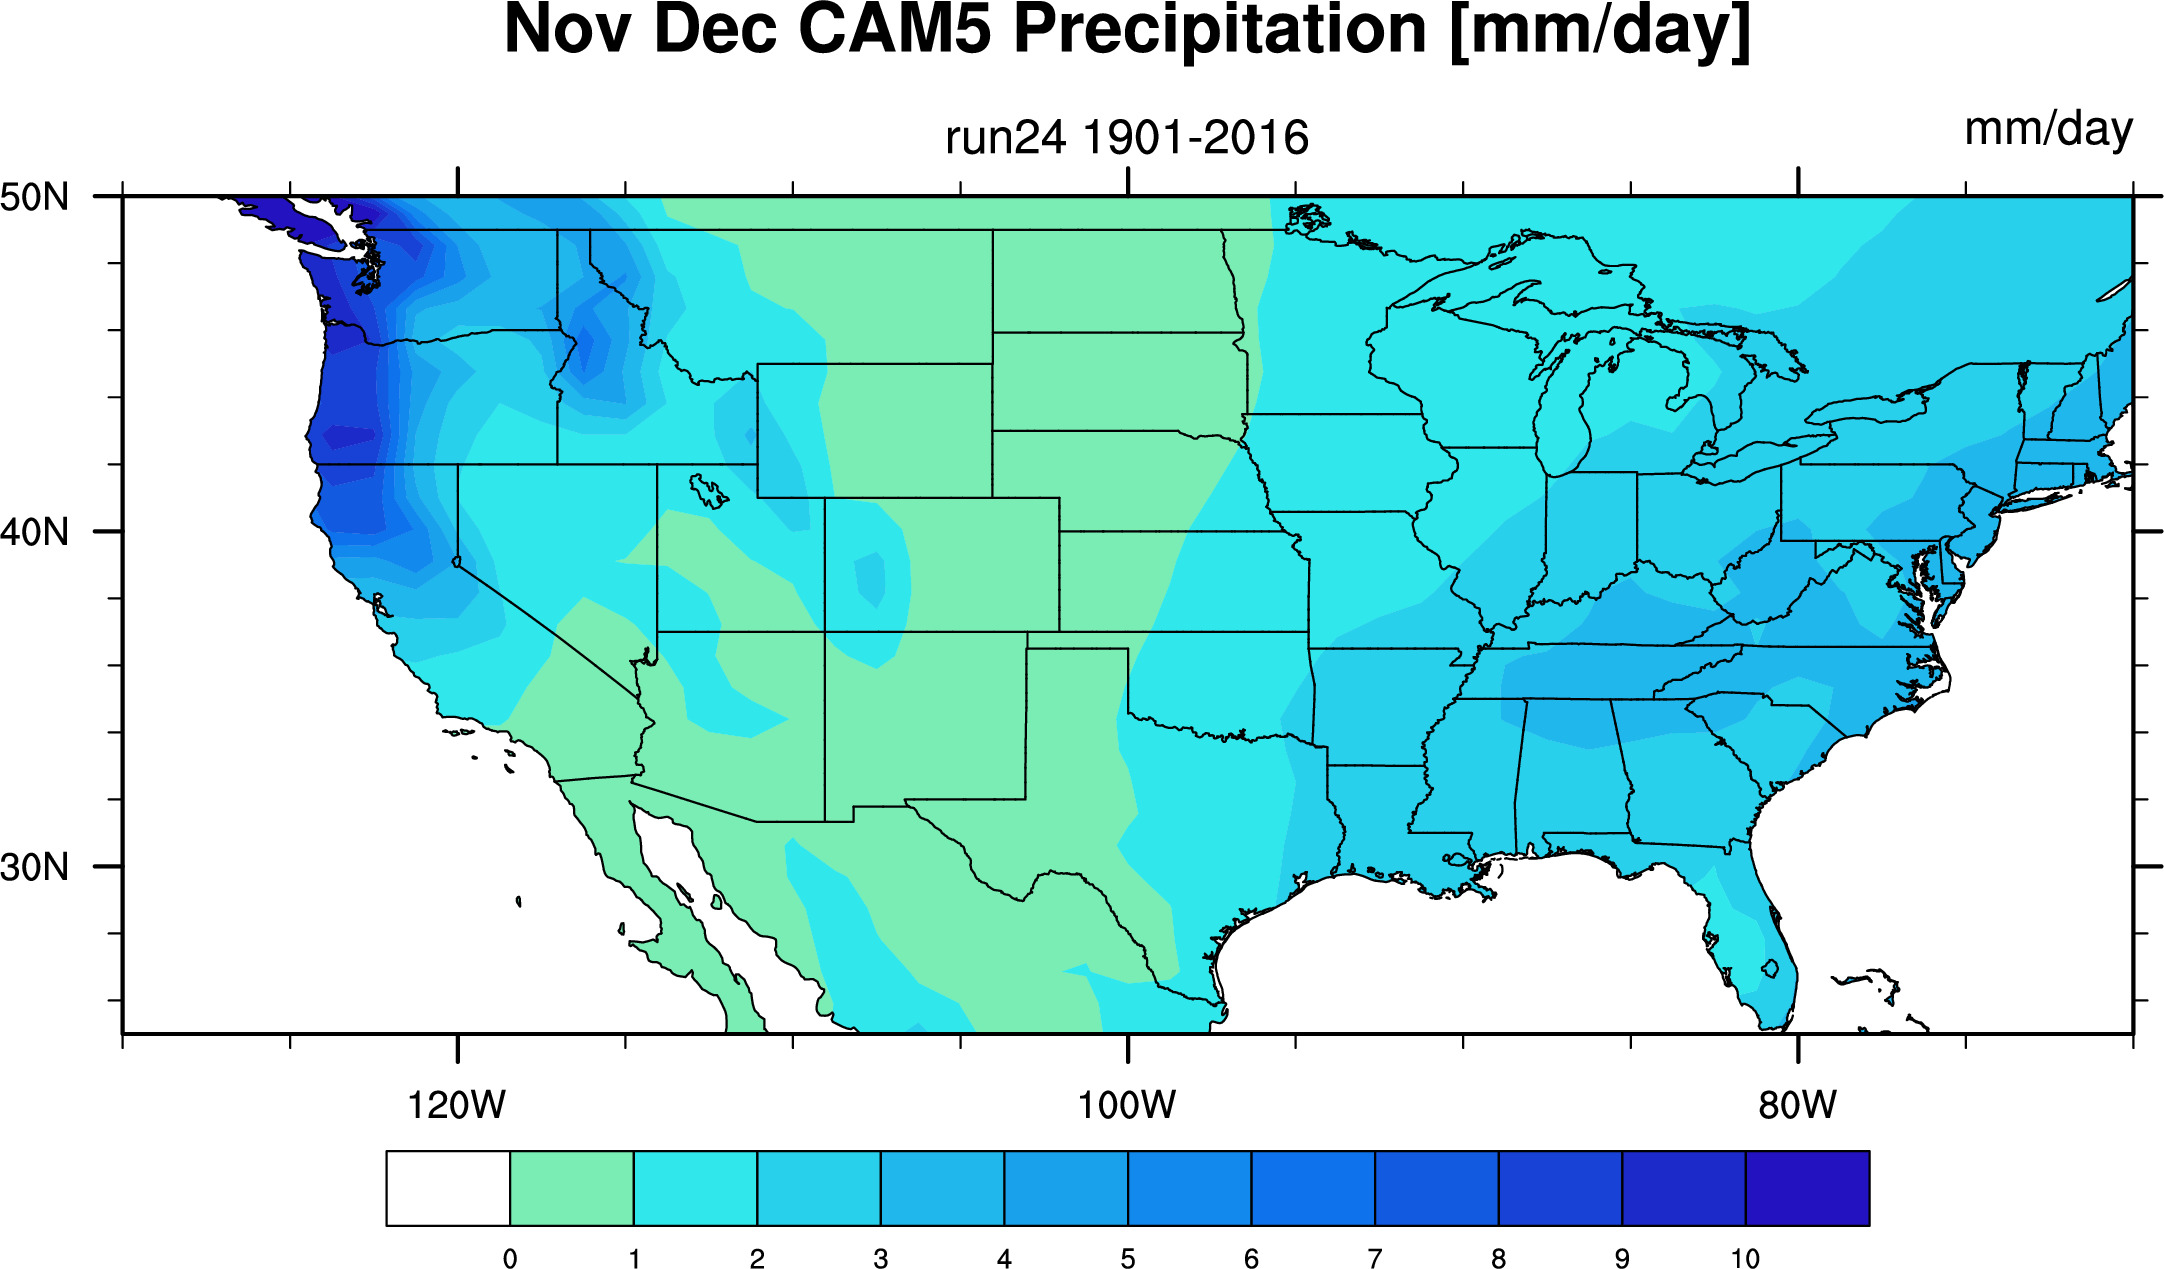
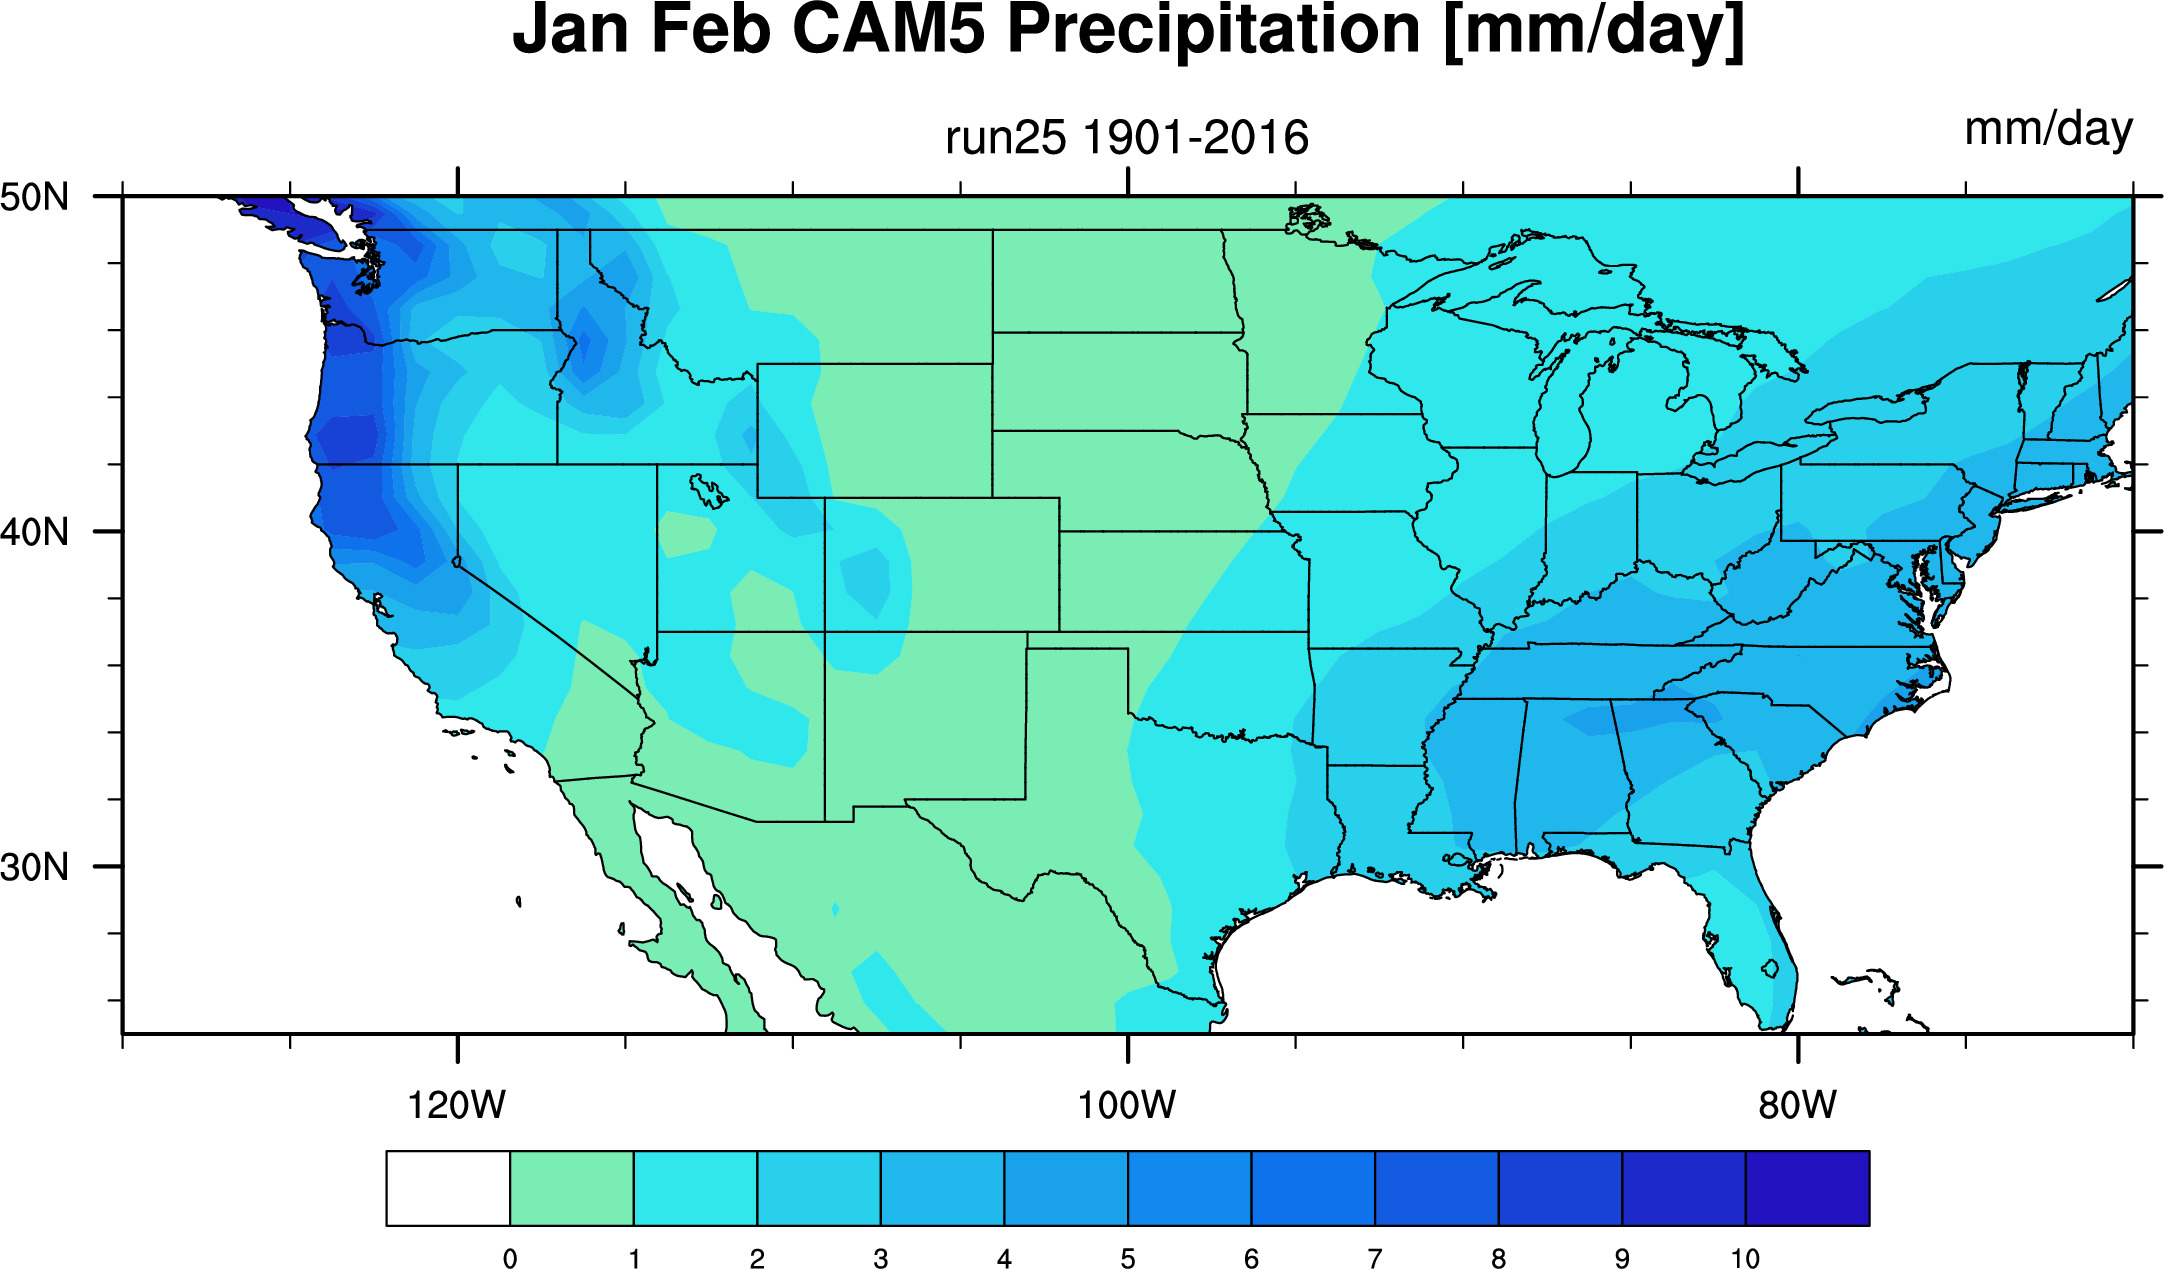
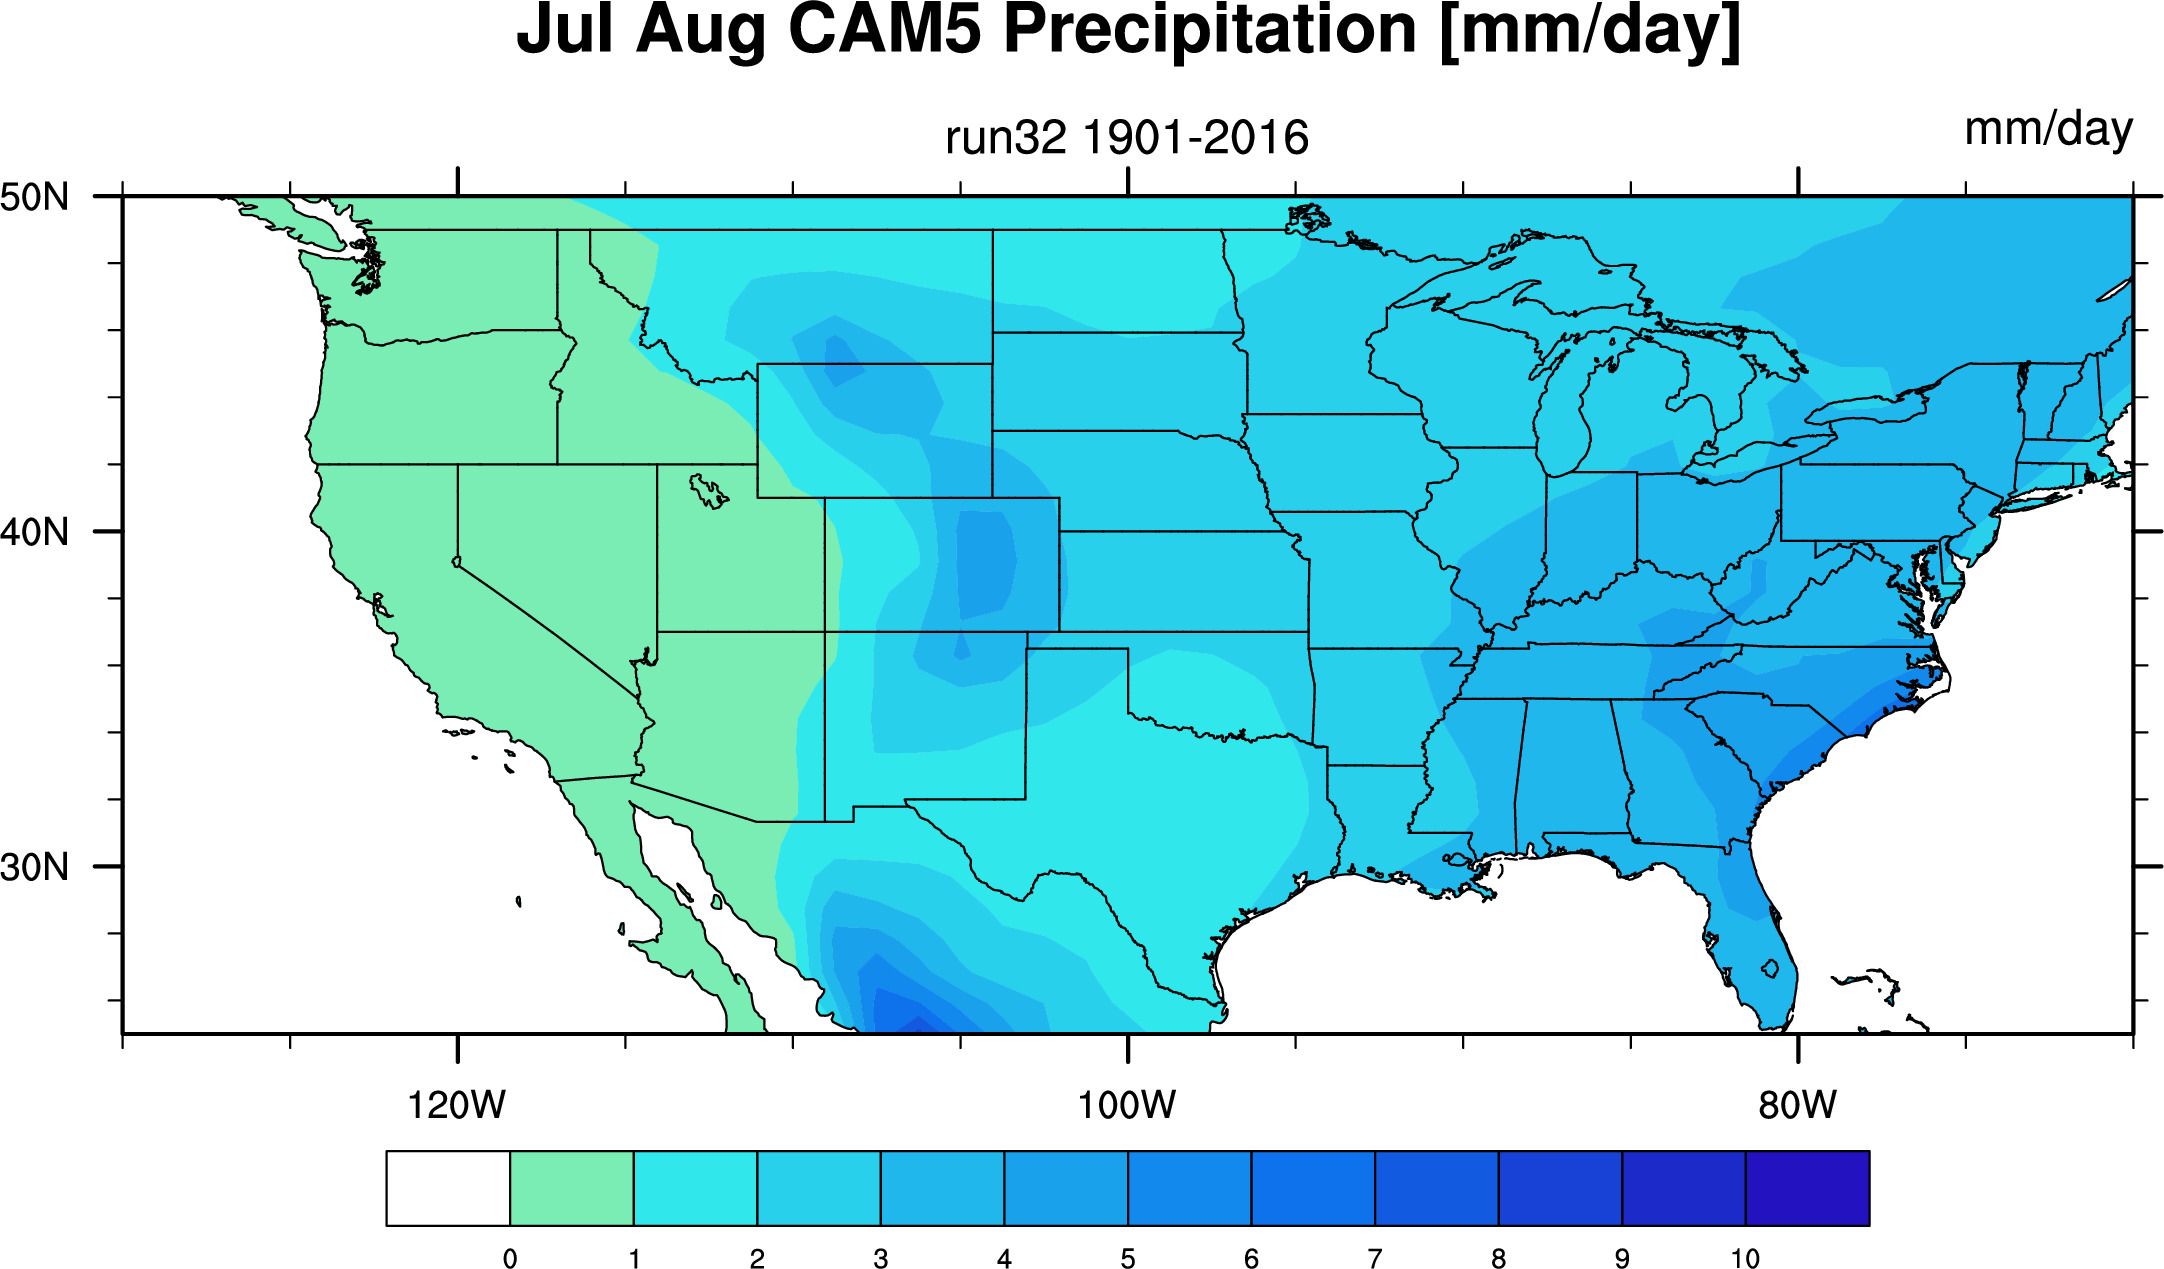
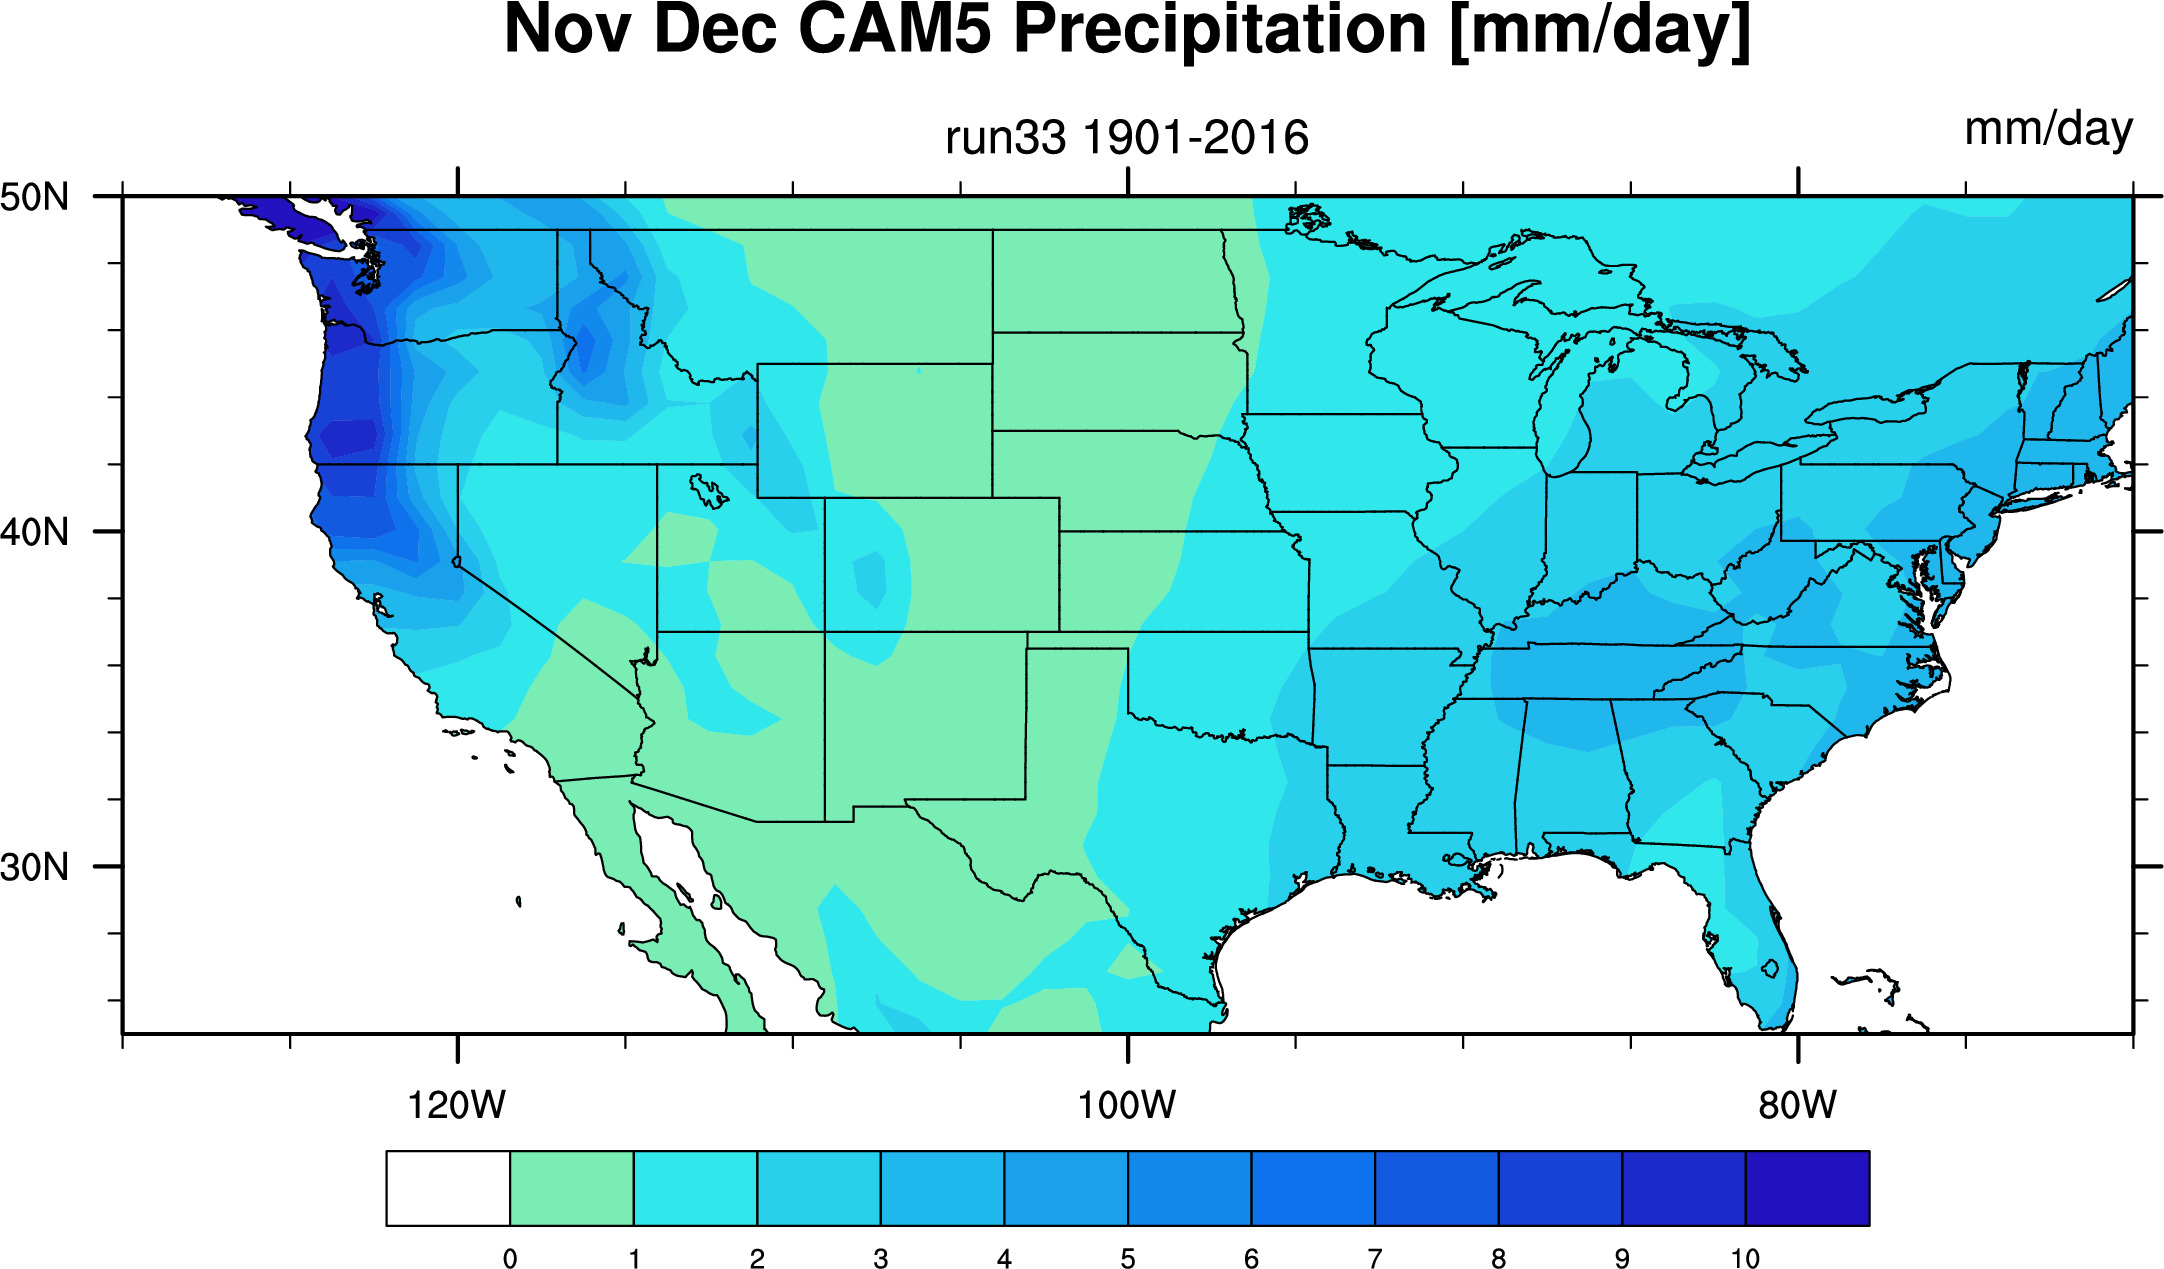
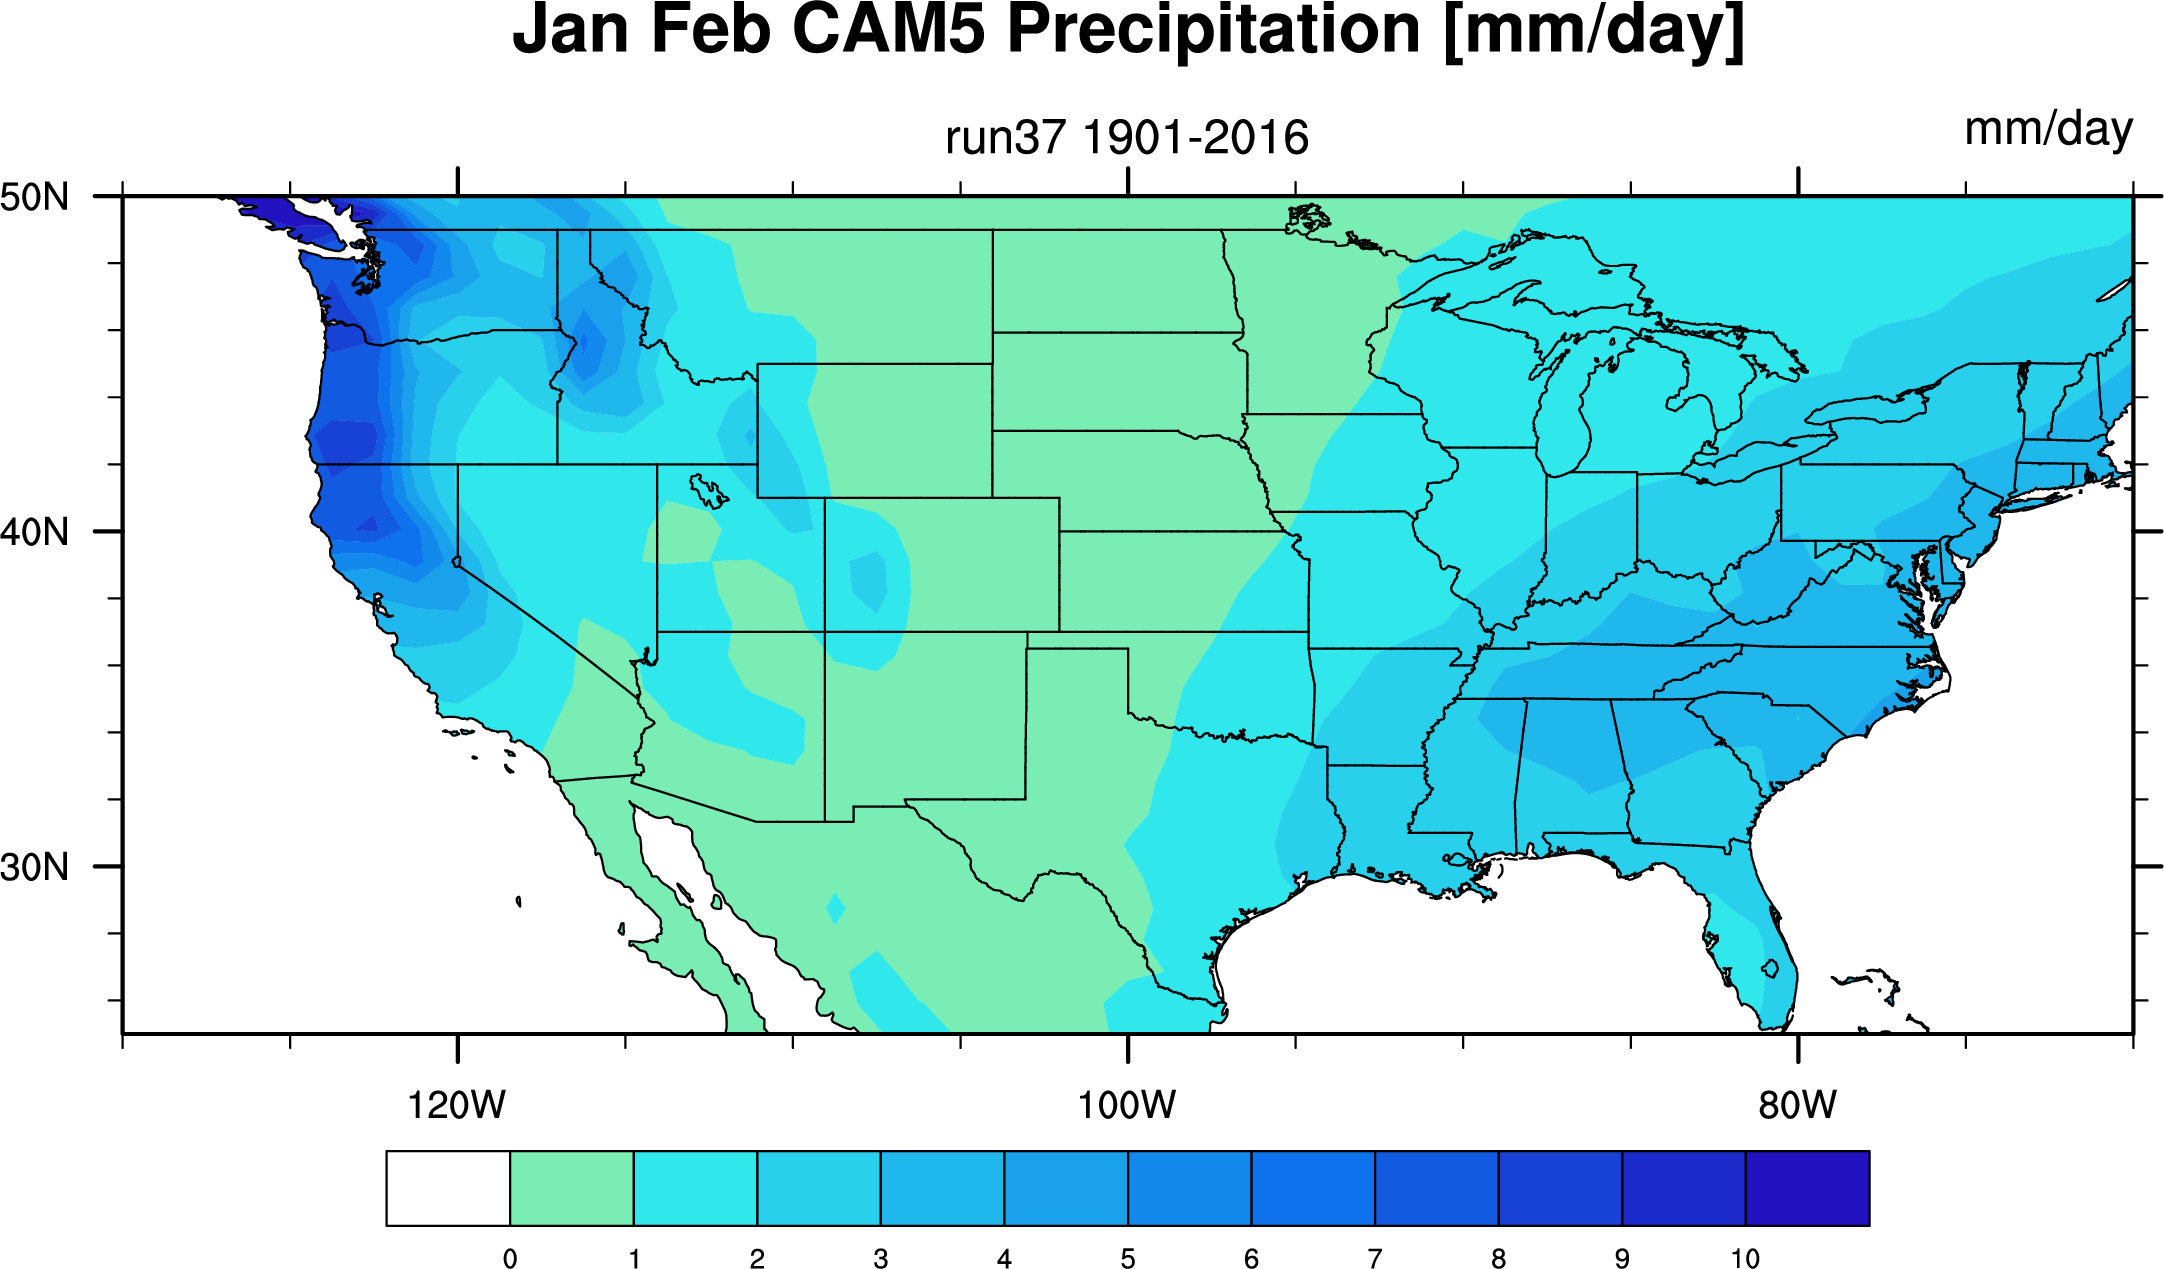
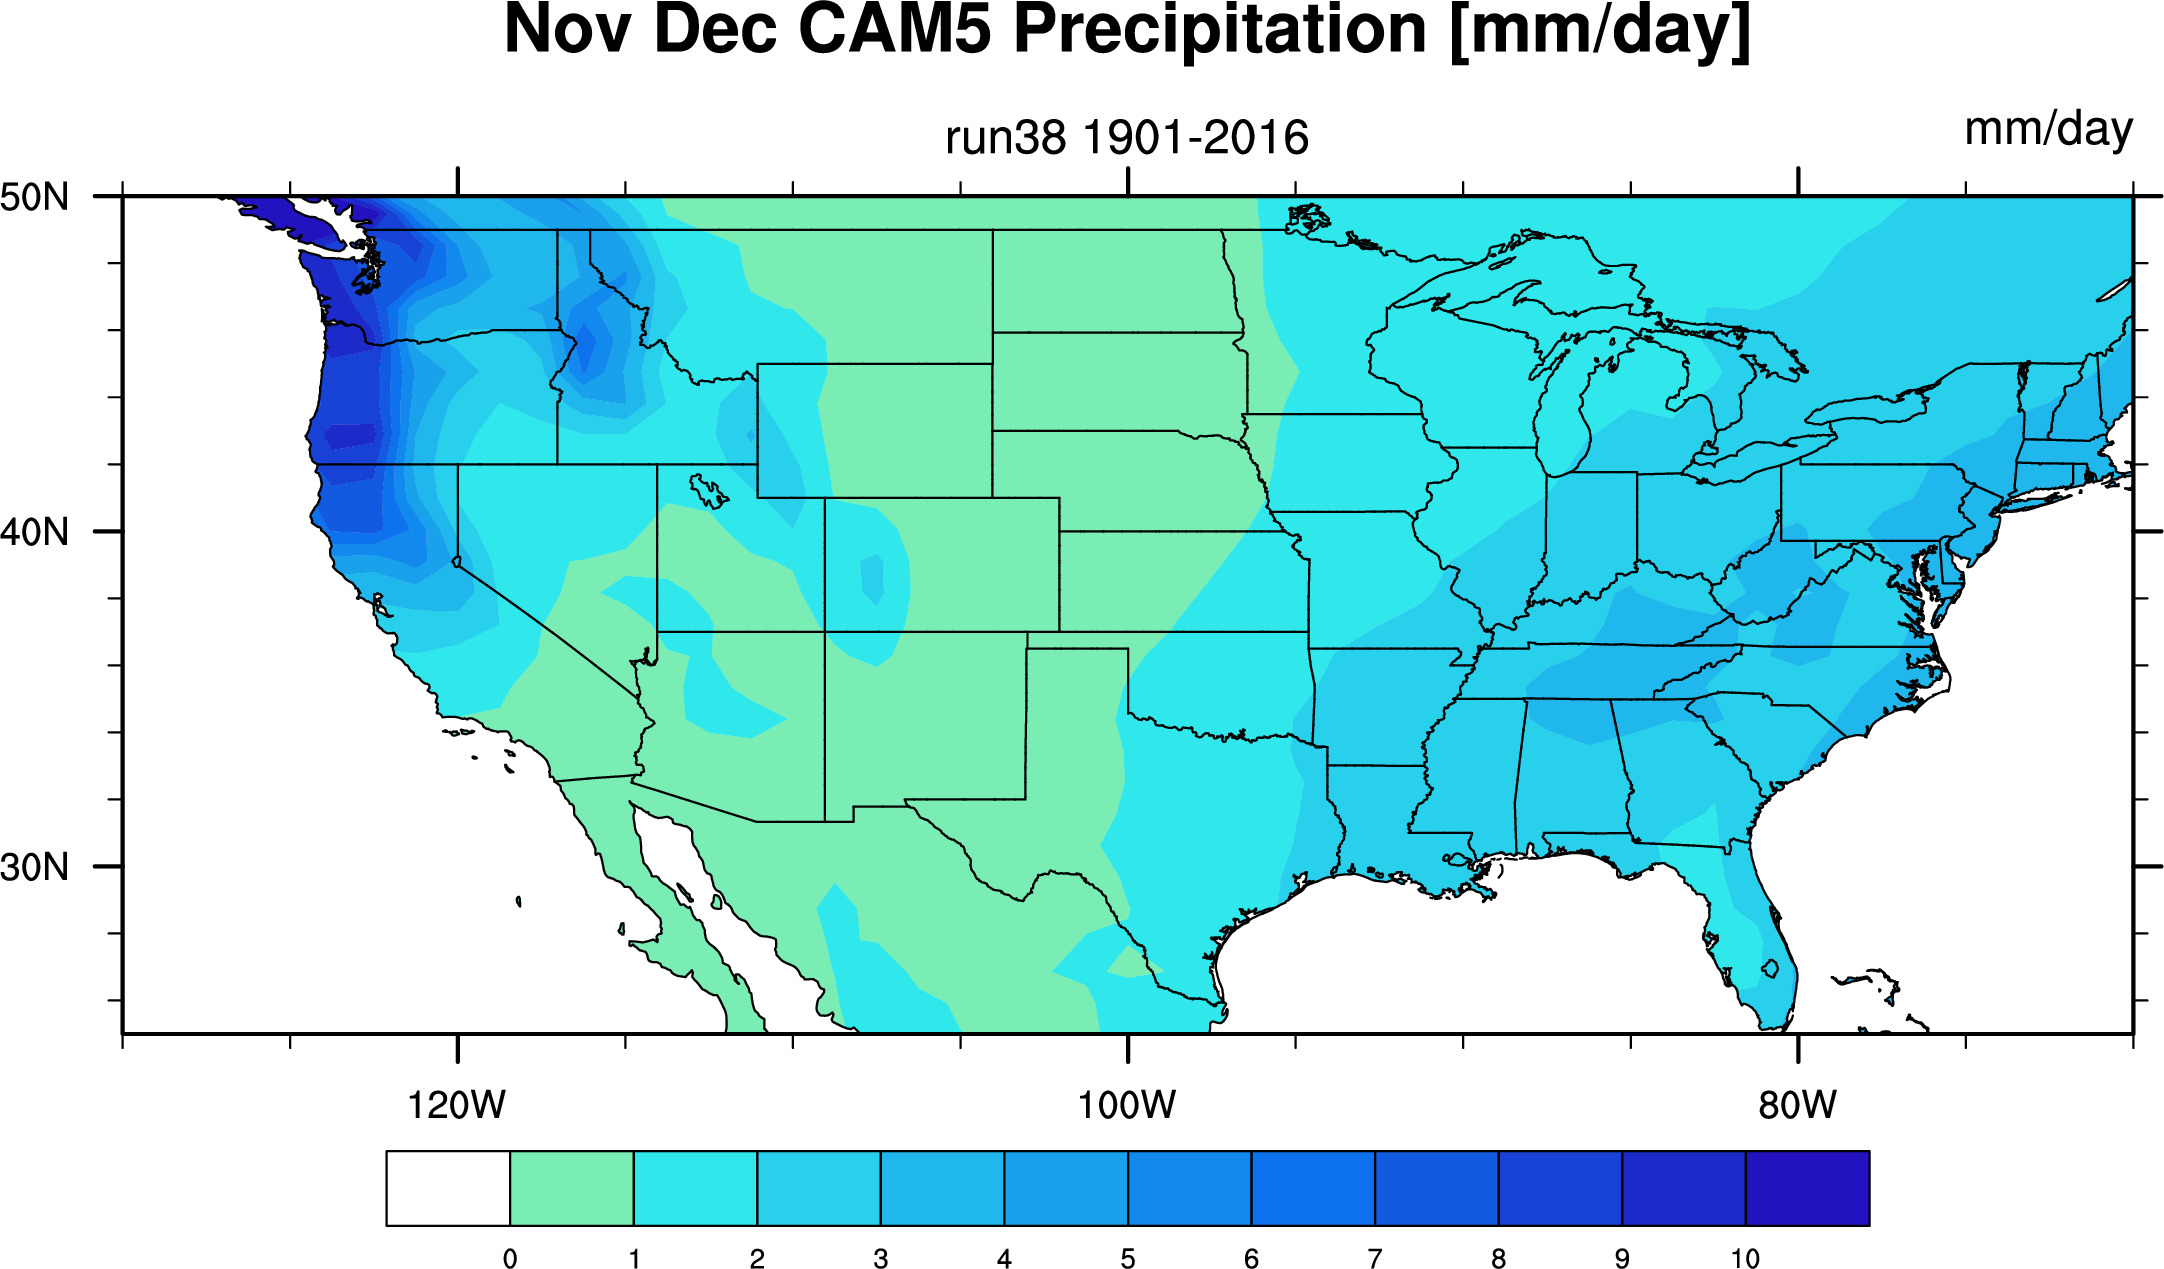
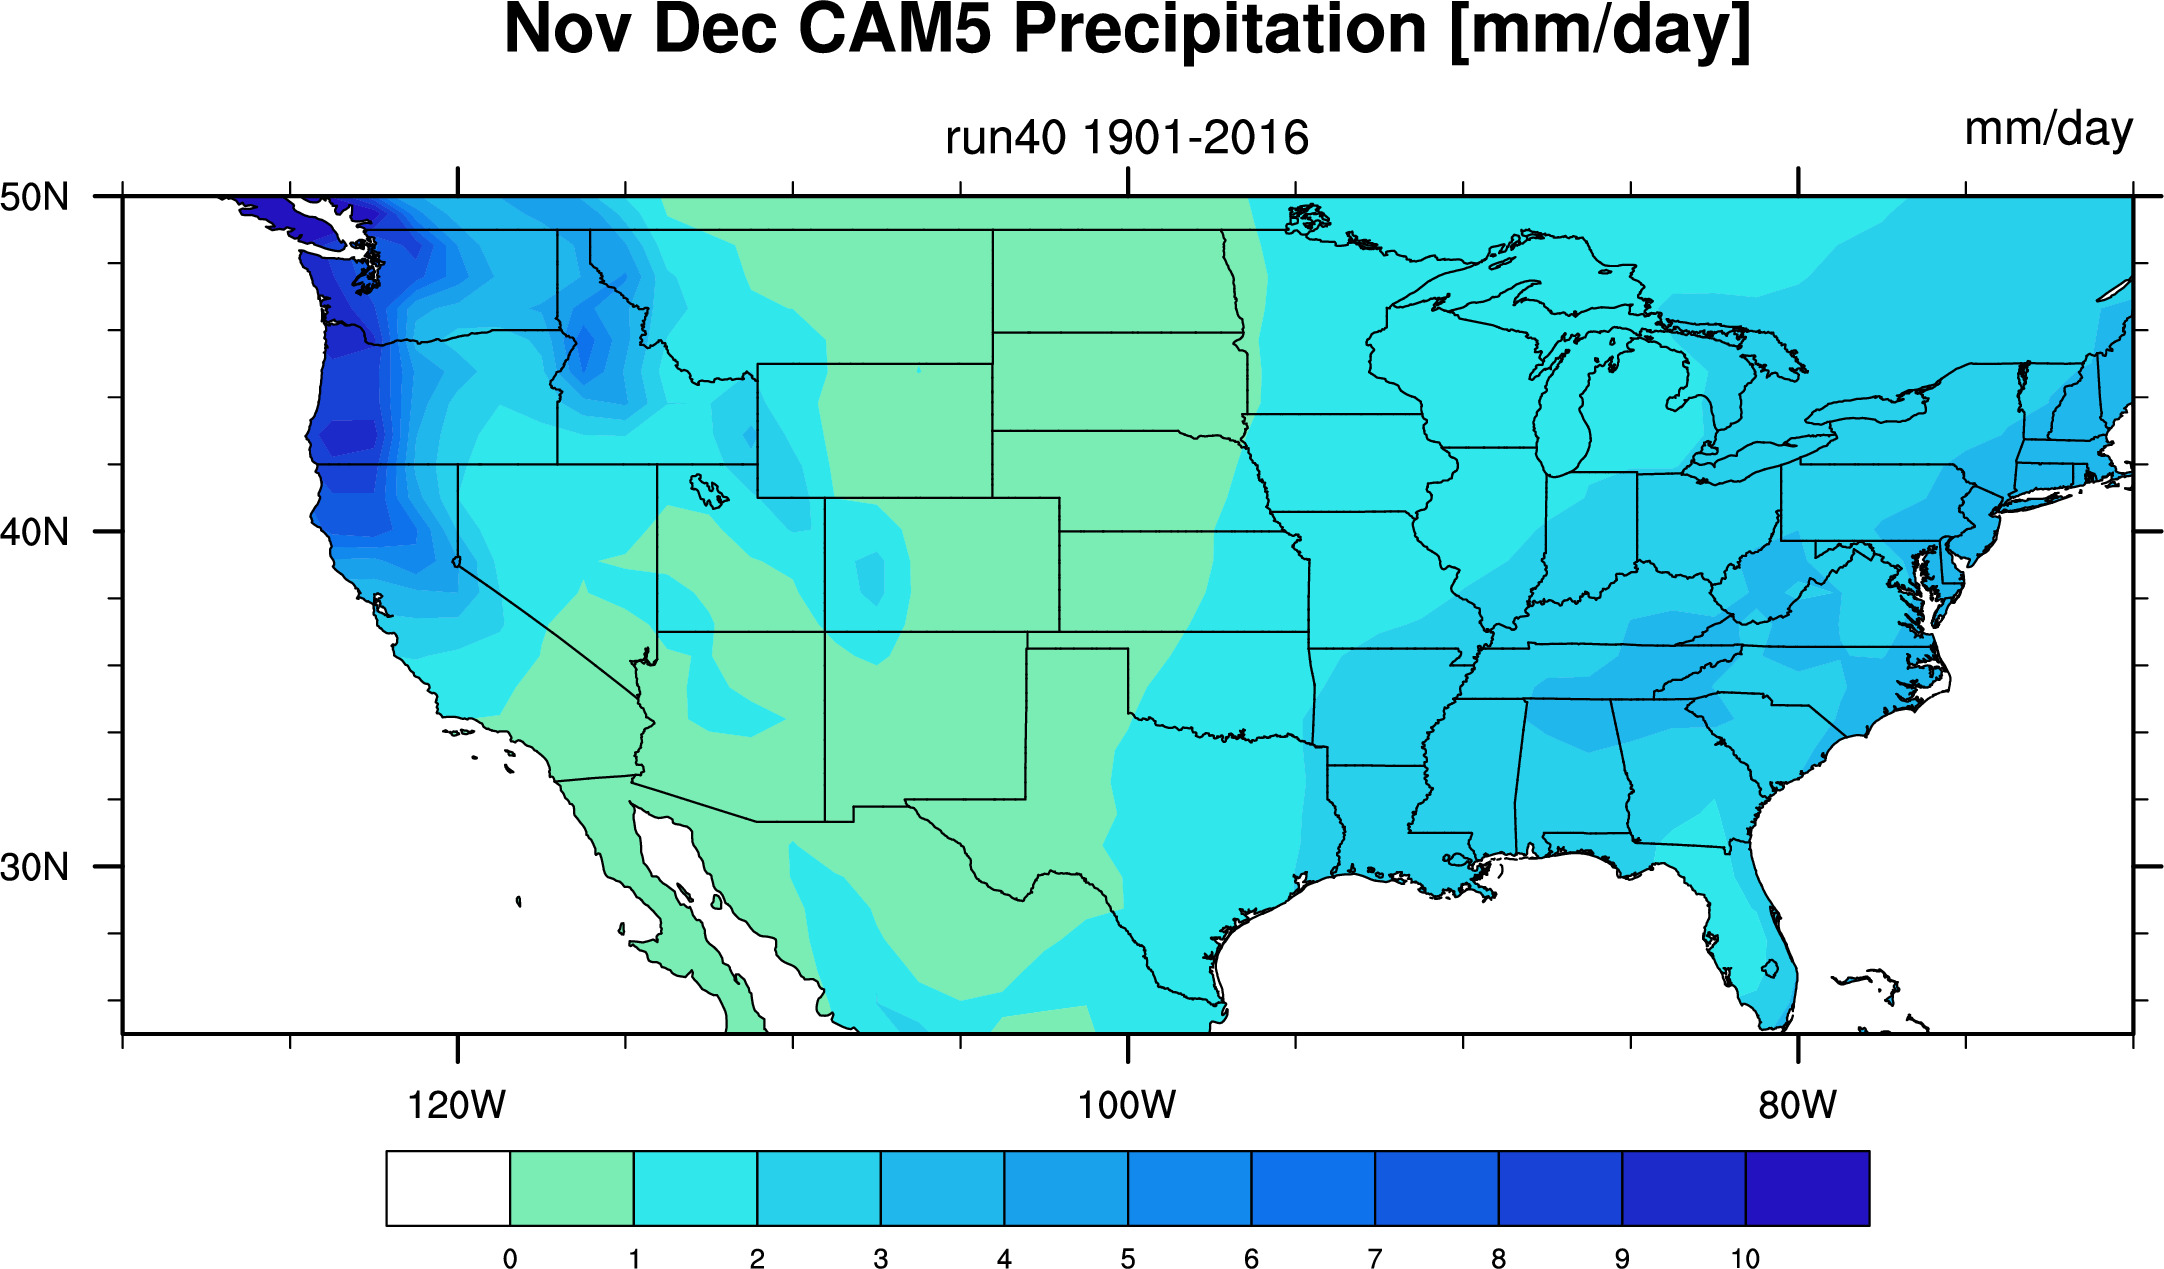
CAM5 Precipitation 1901-2016 40-run ensemble
~1 degree gridClimatologies
one run per row
6 seasons plus annual case per row
right click to see bigger images


----------------------------------------------------------------------------------------------------------------------------------
----------------------------------------------------------------------------------------------------------------------------------
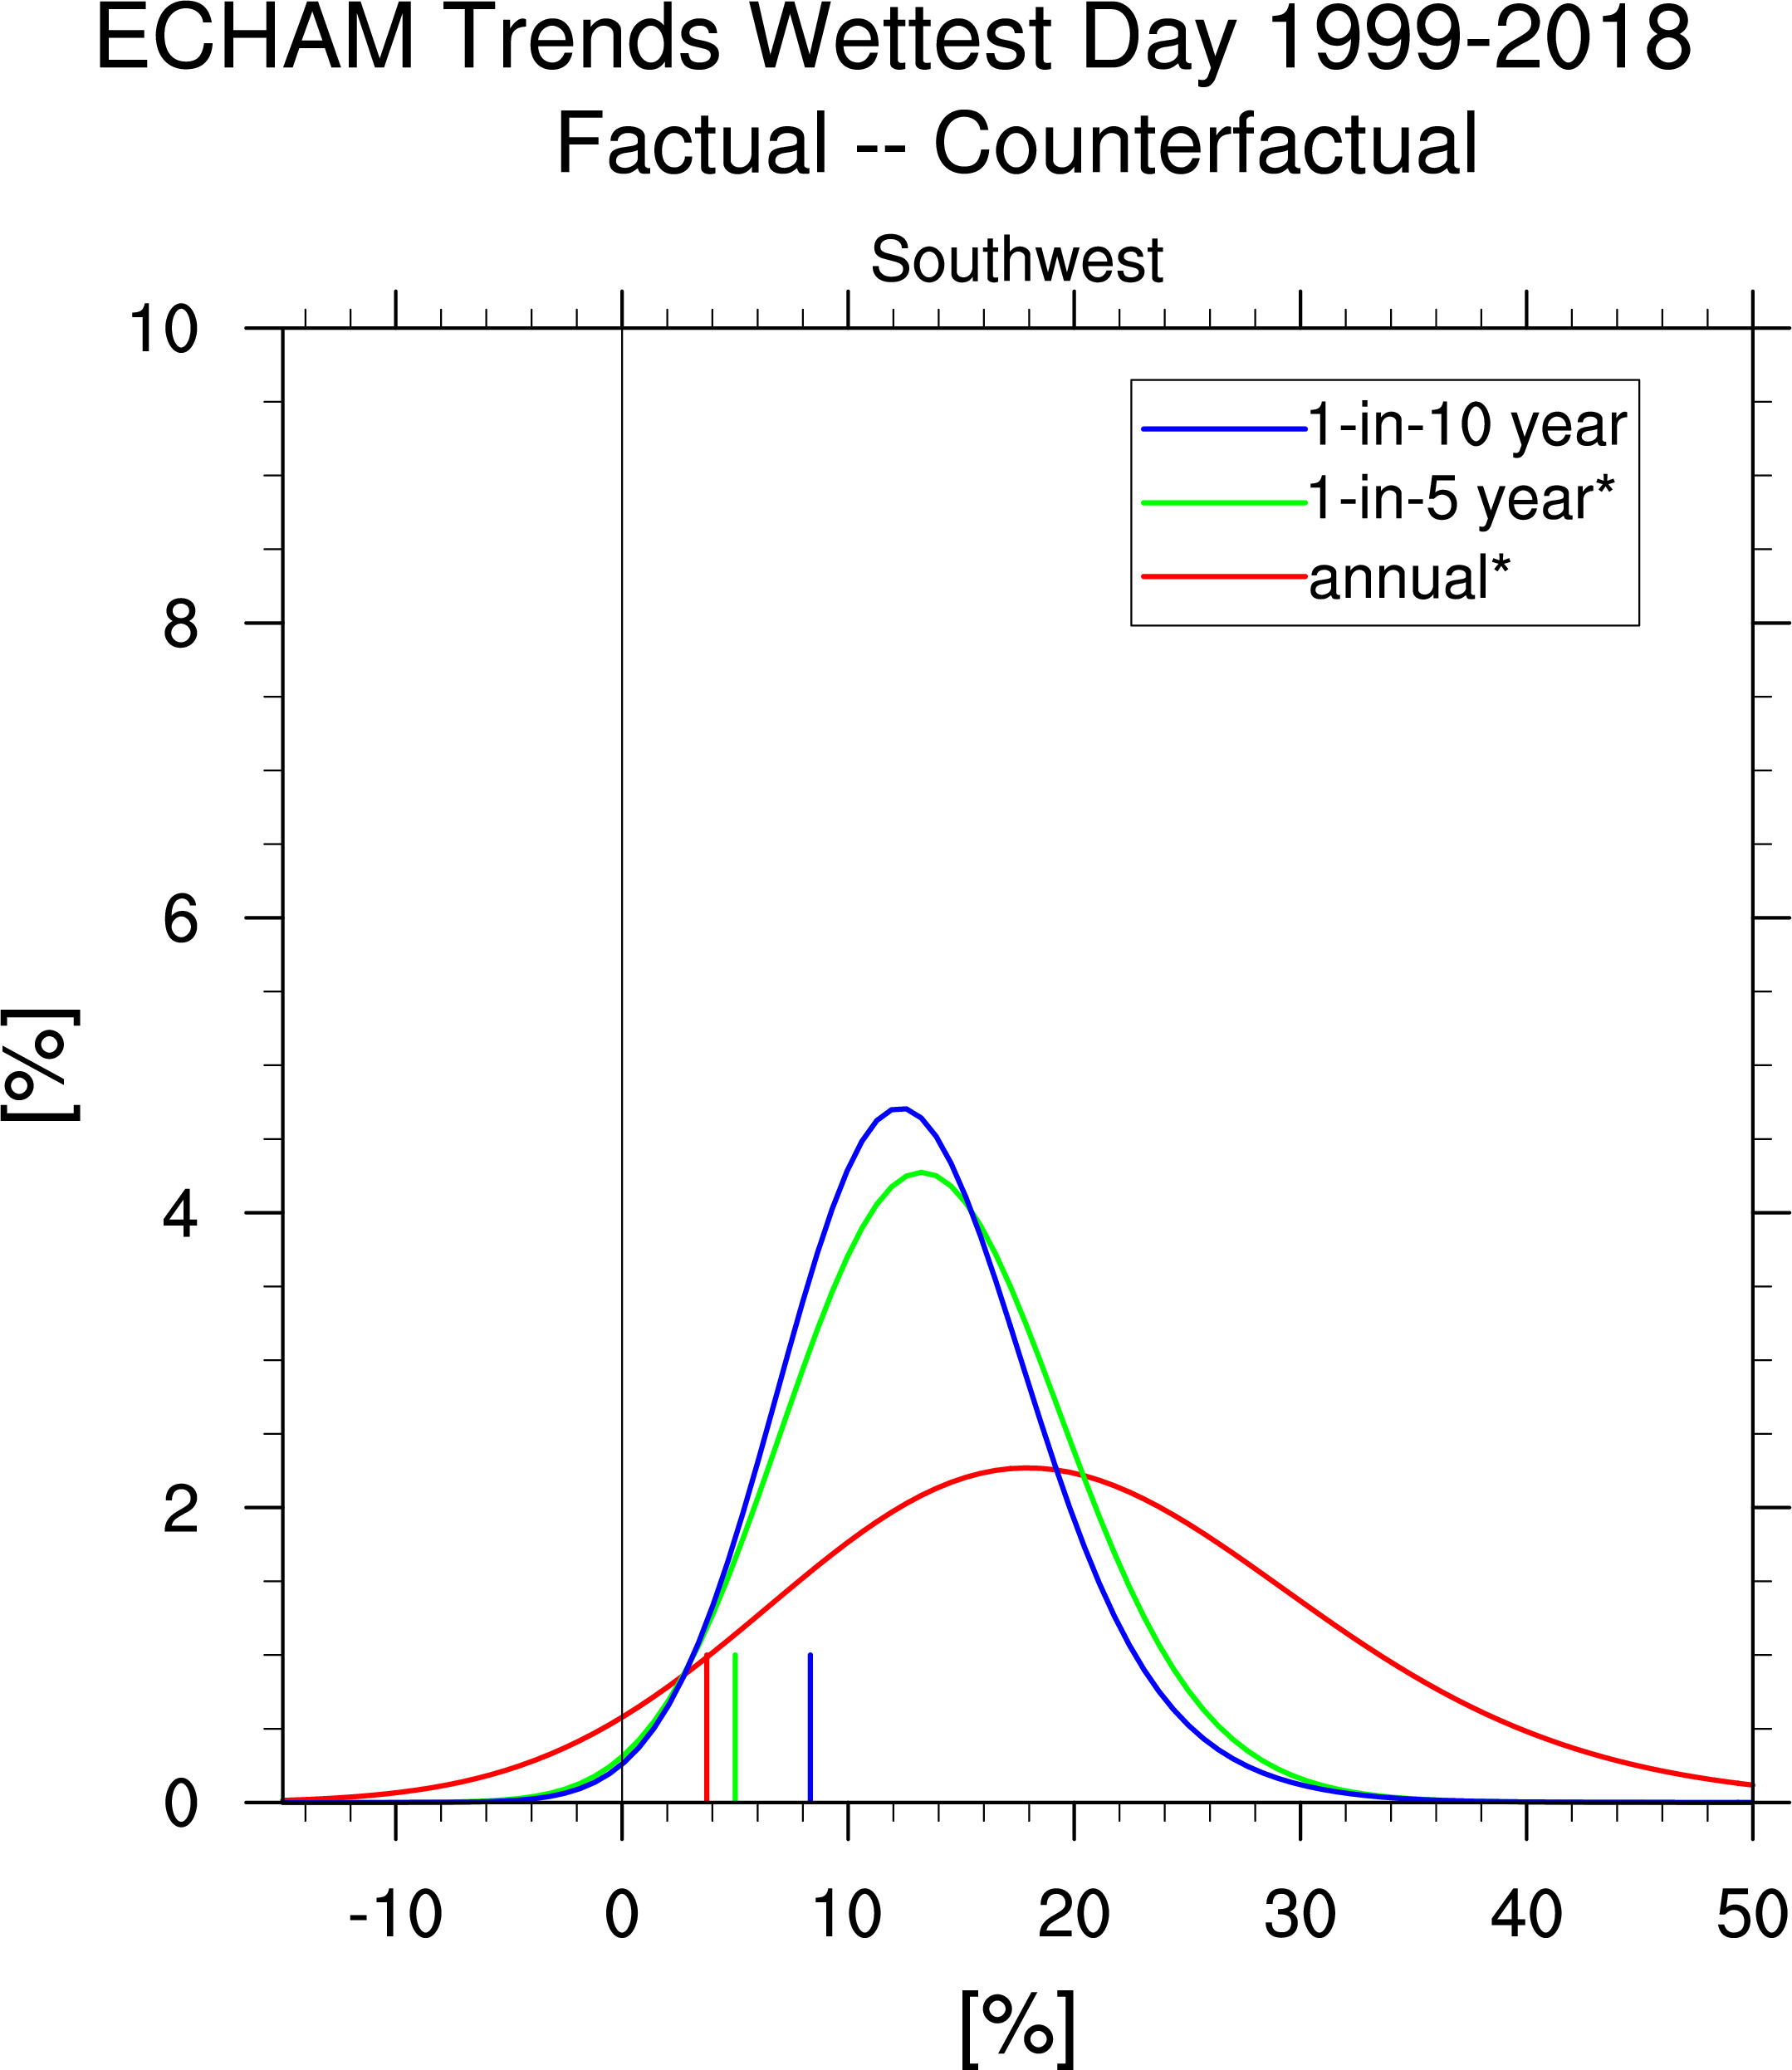
Climate Super-Divisions
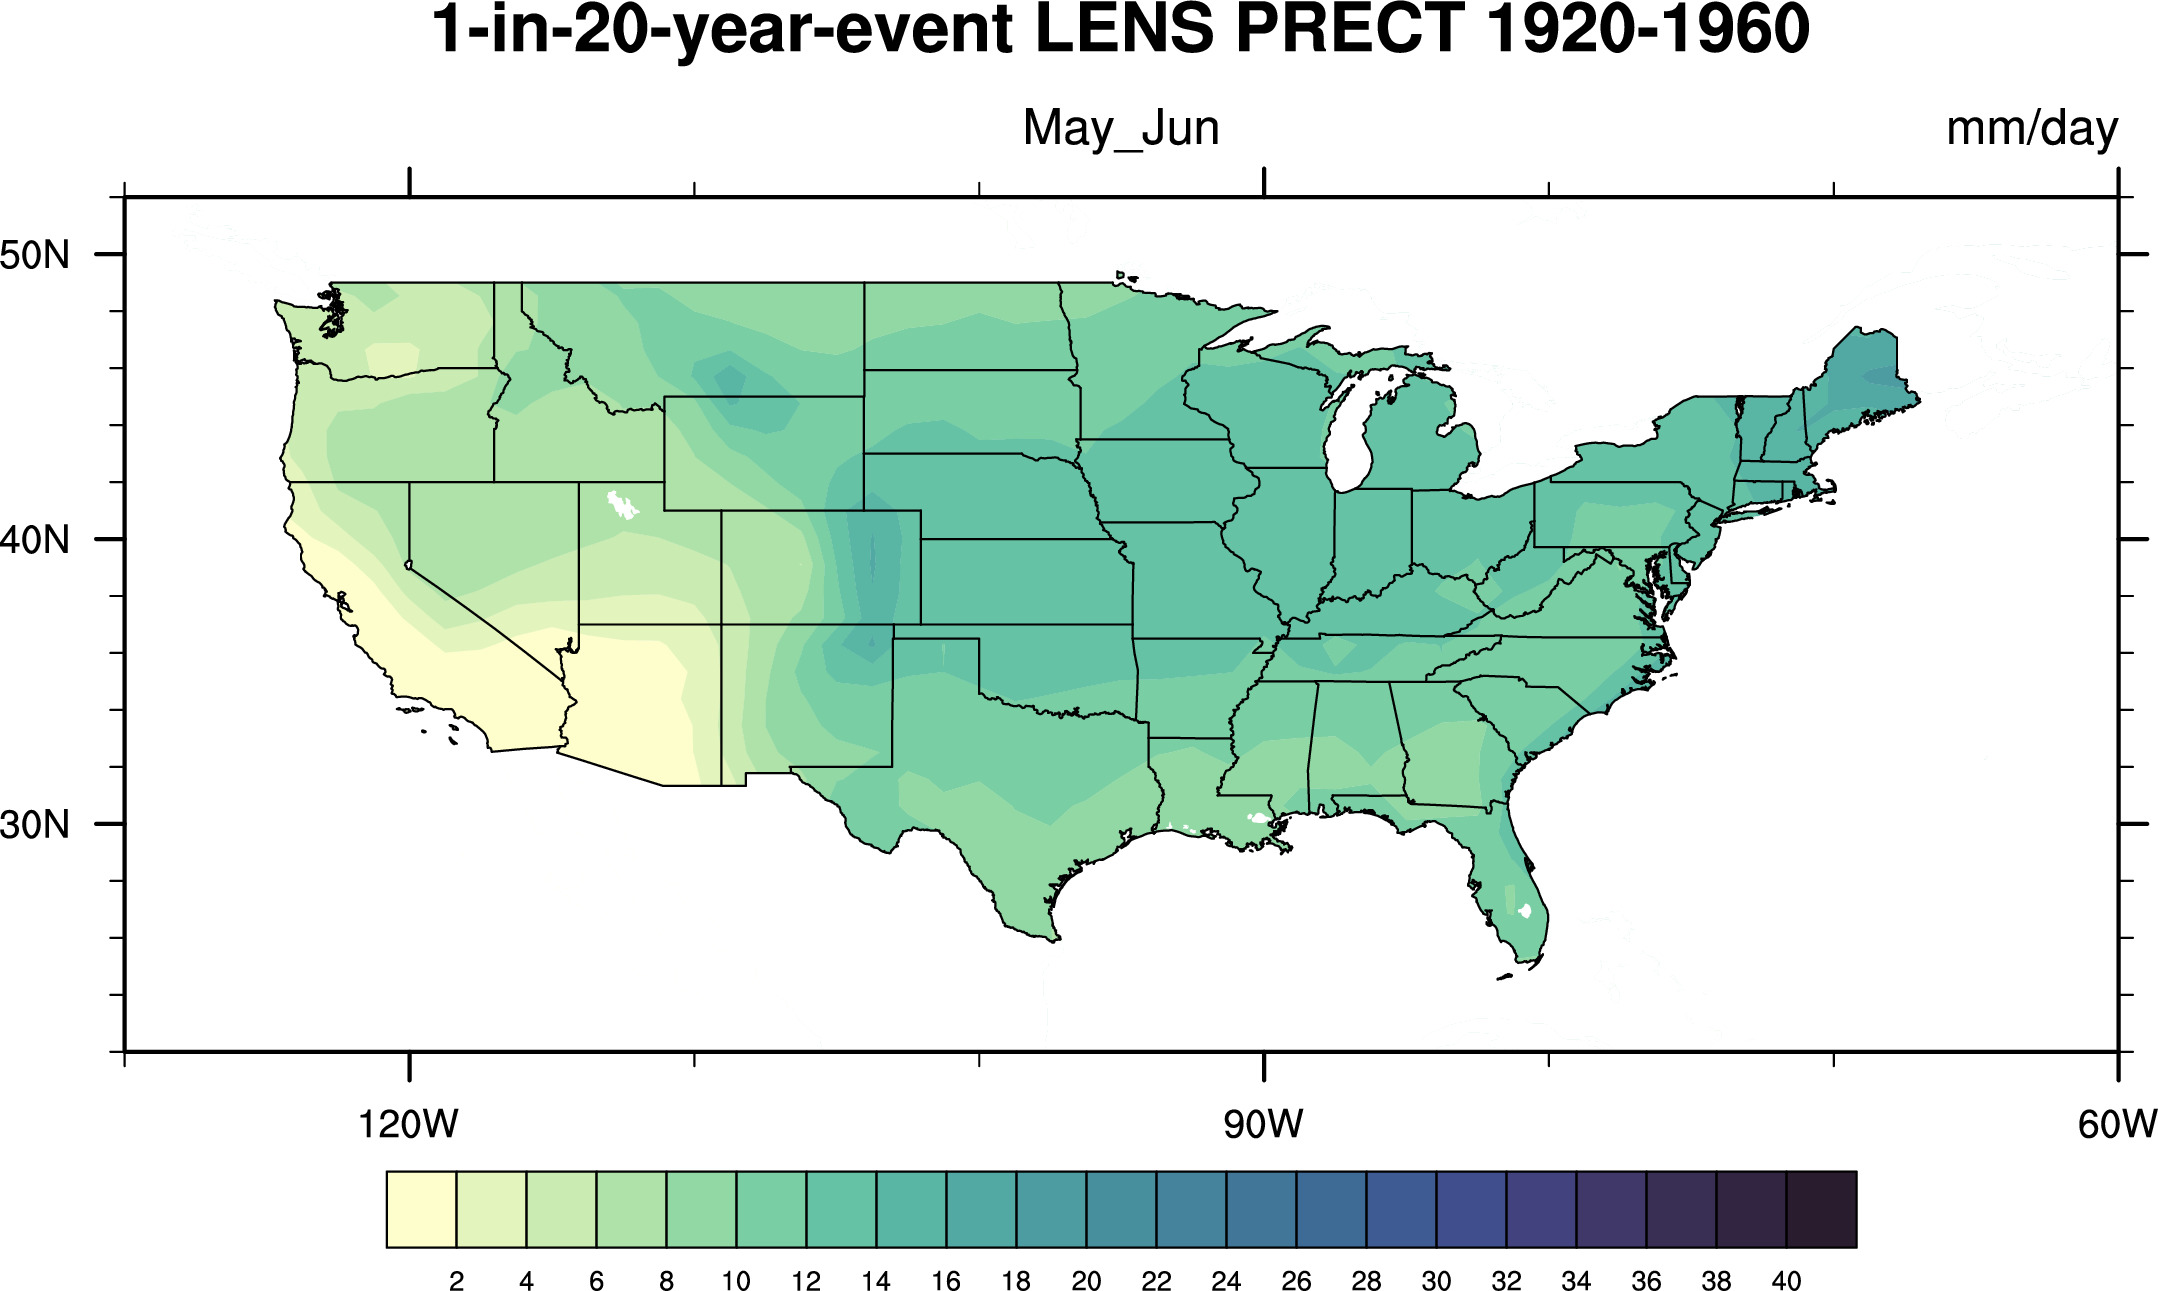
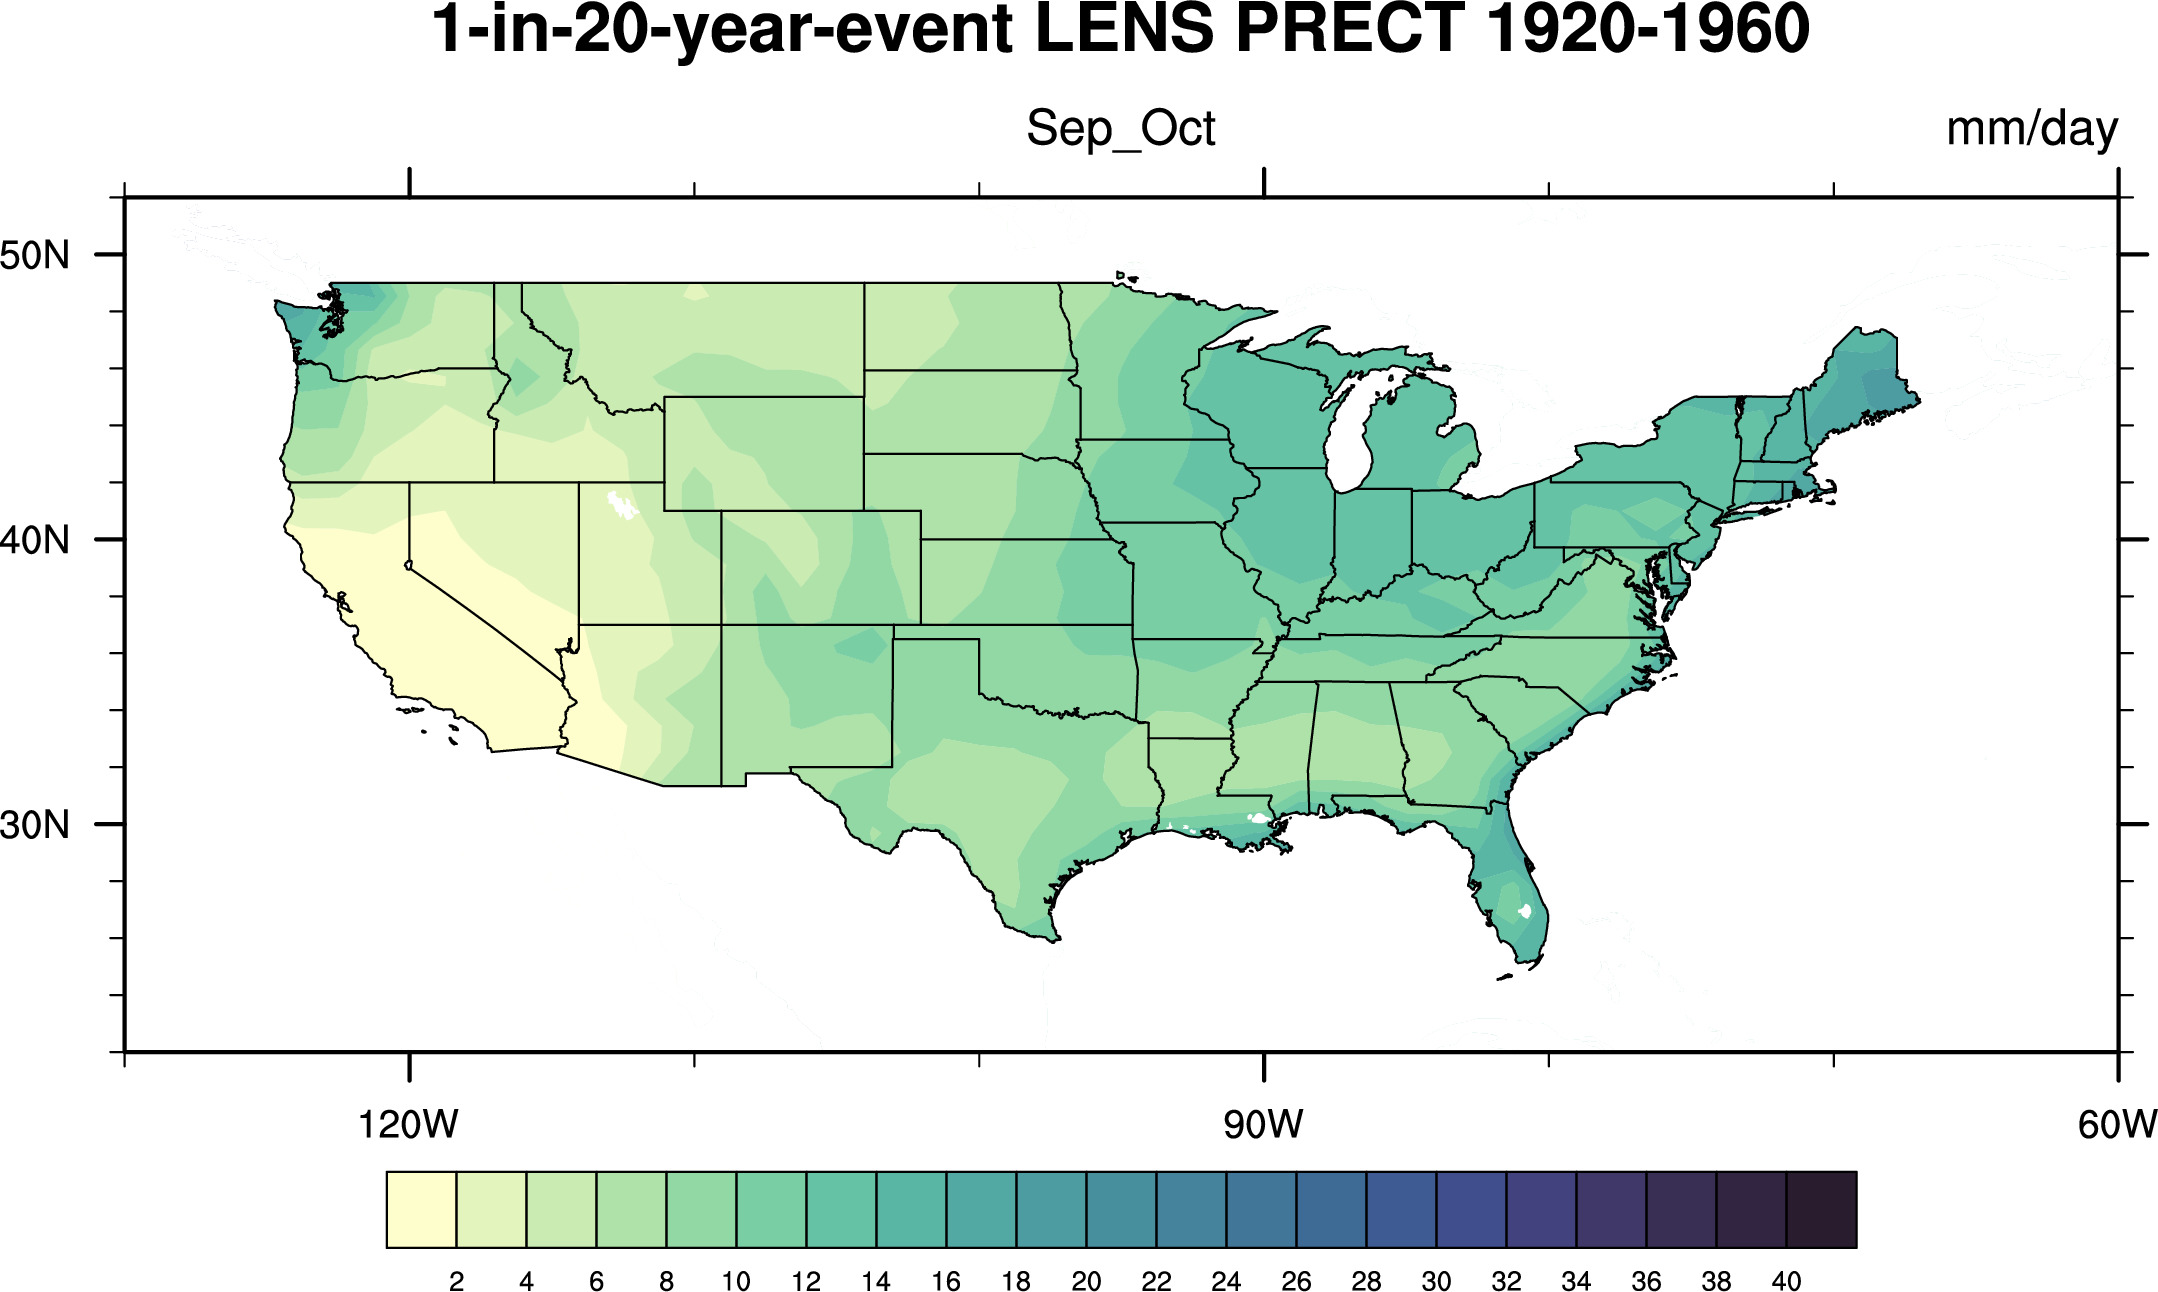
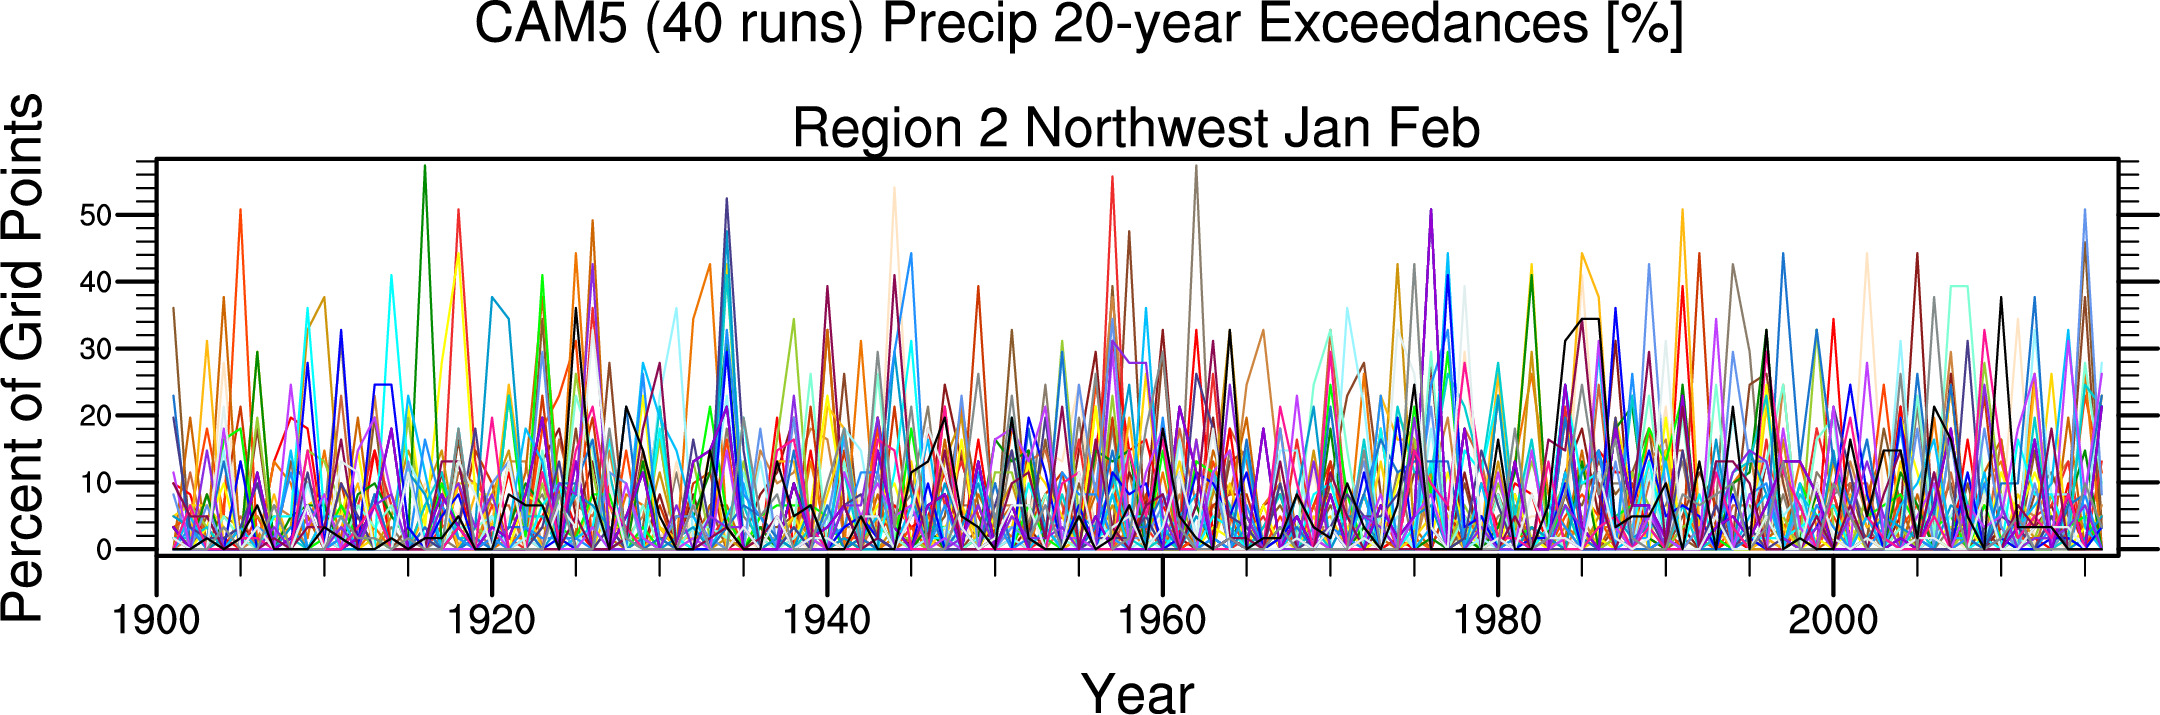
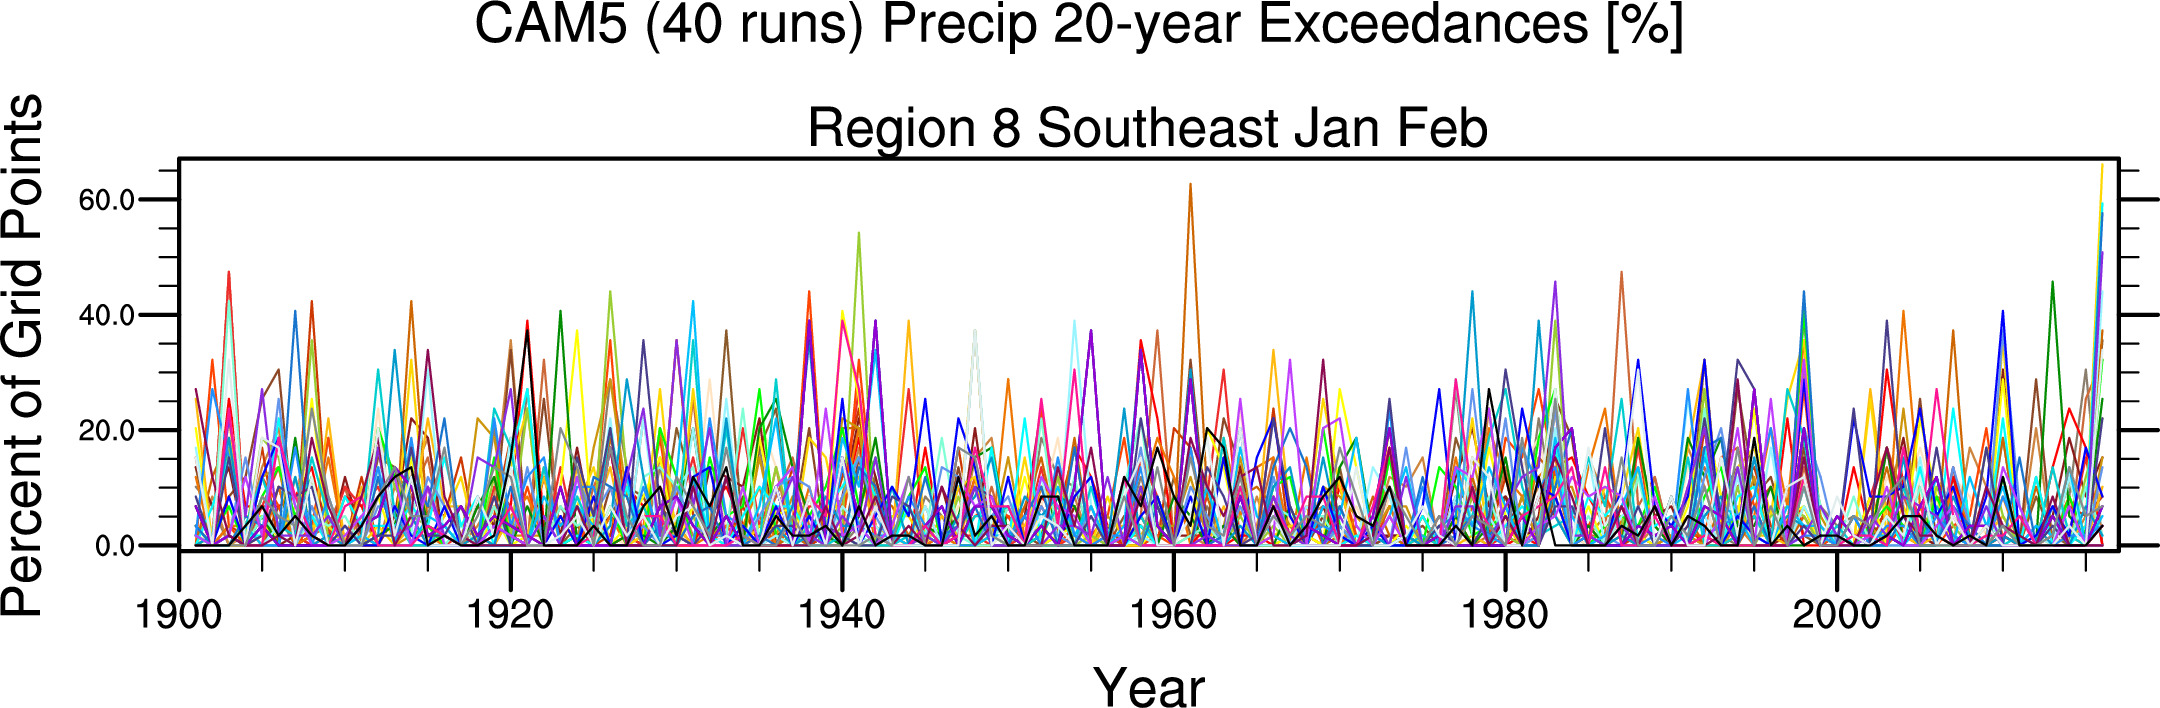
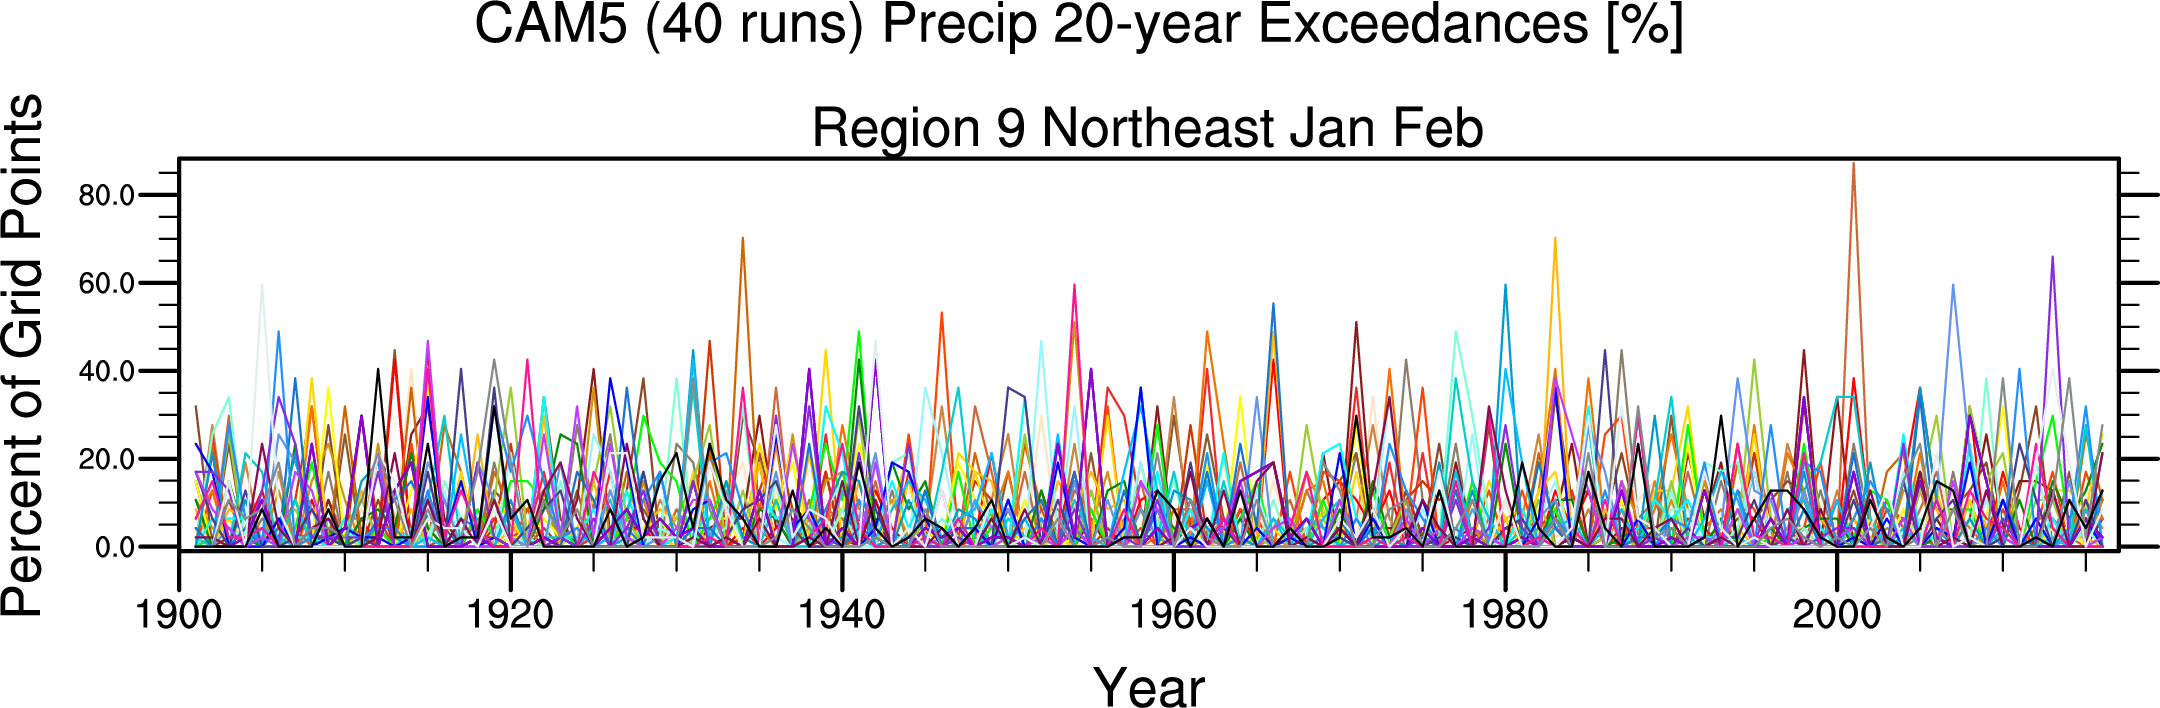
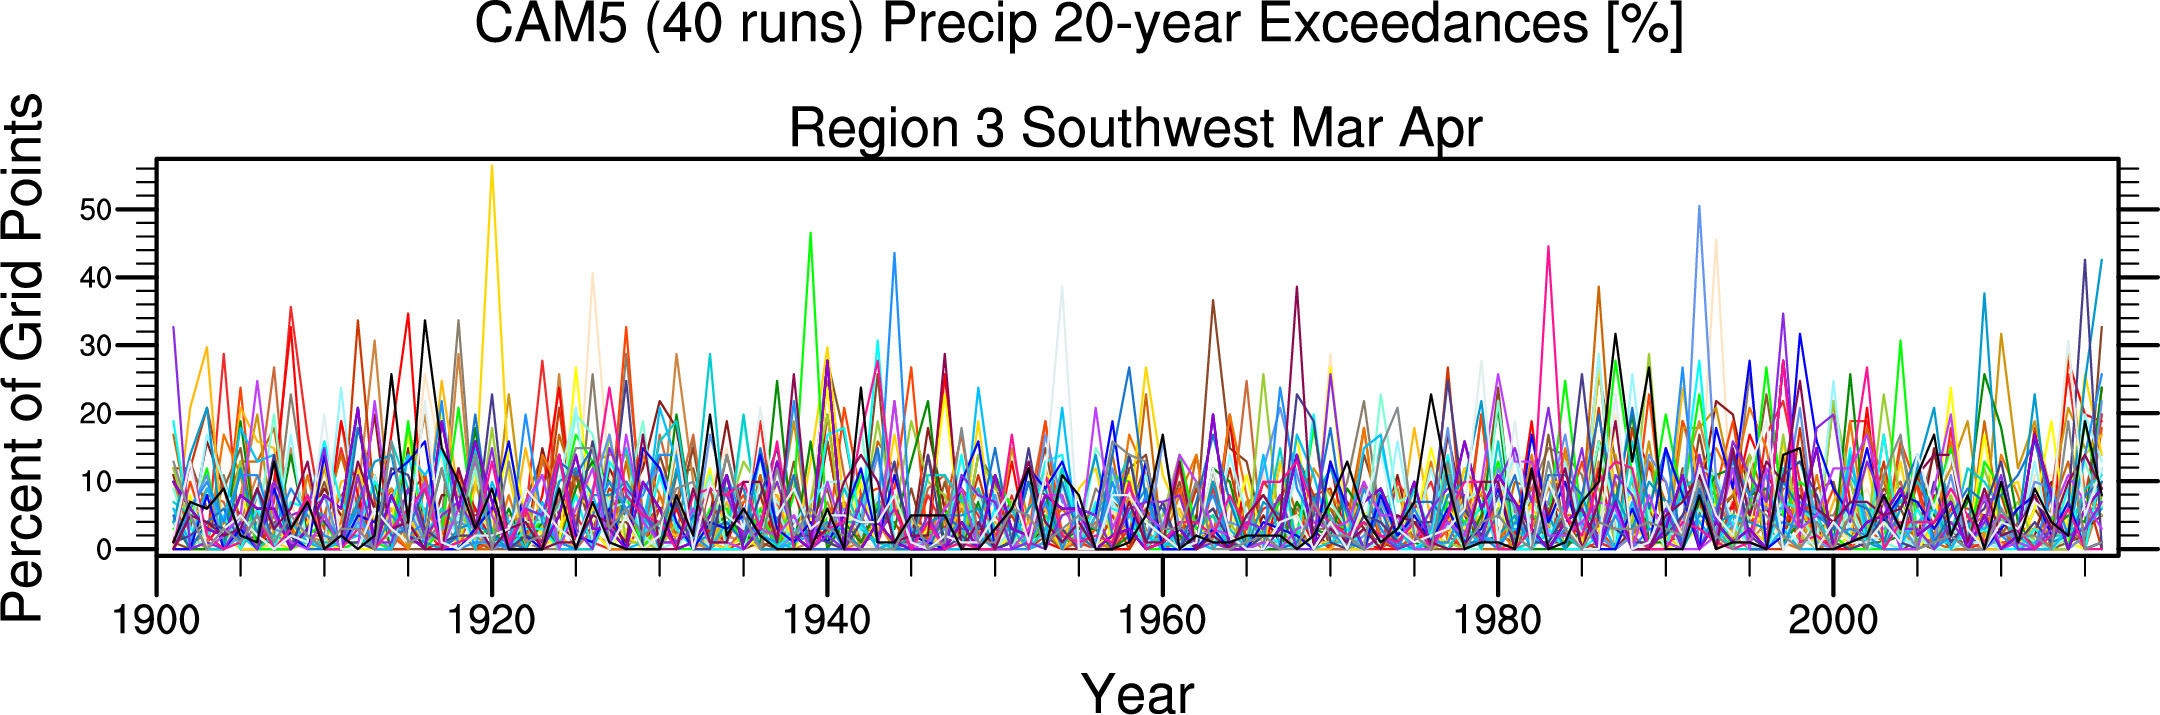
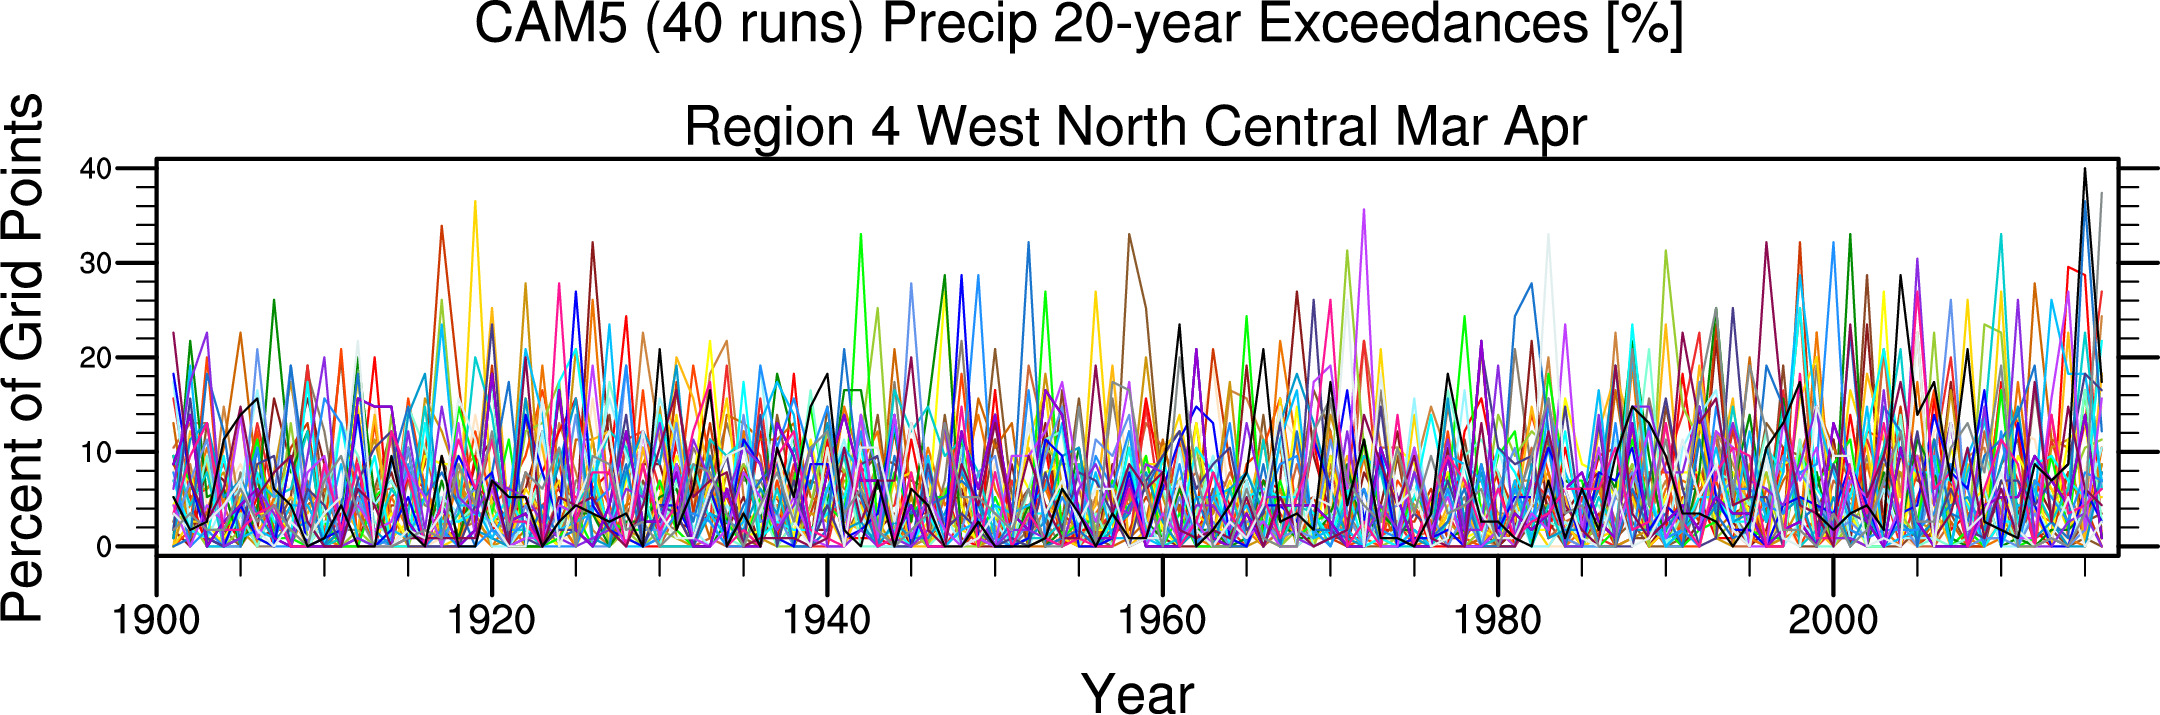
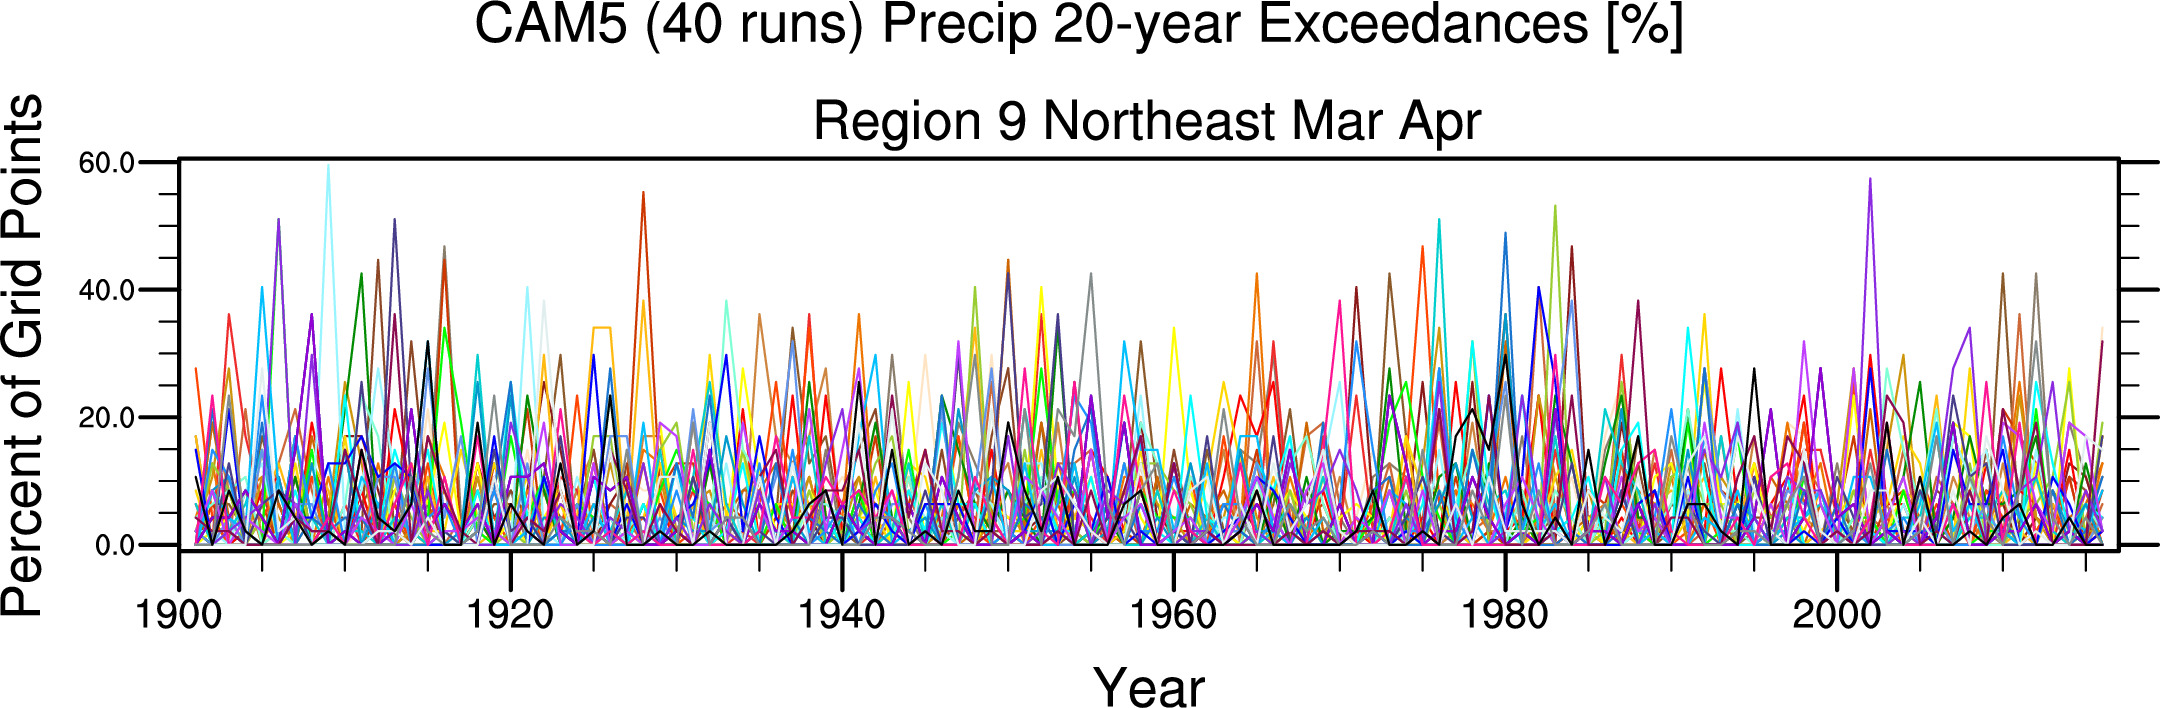
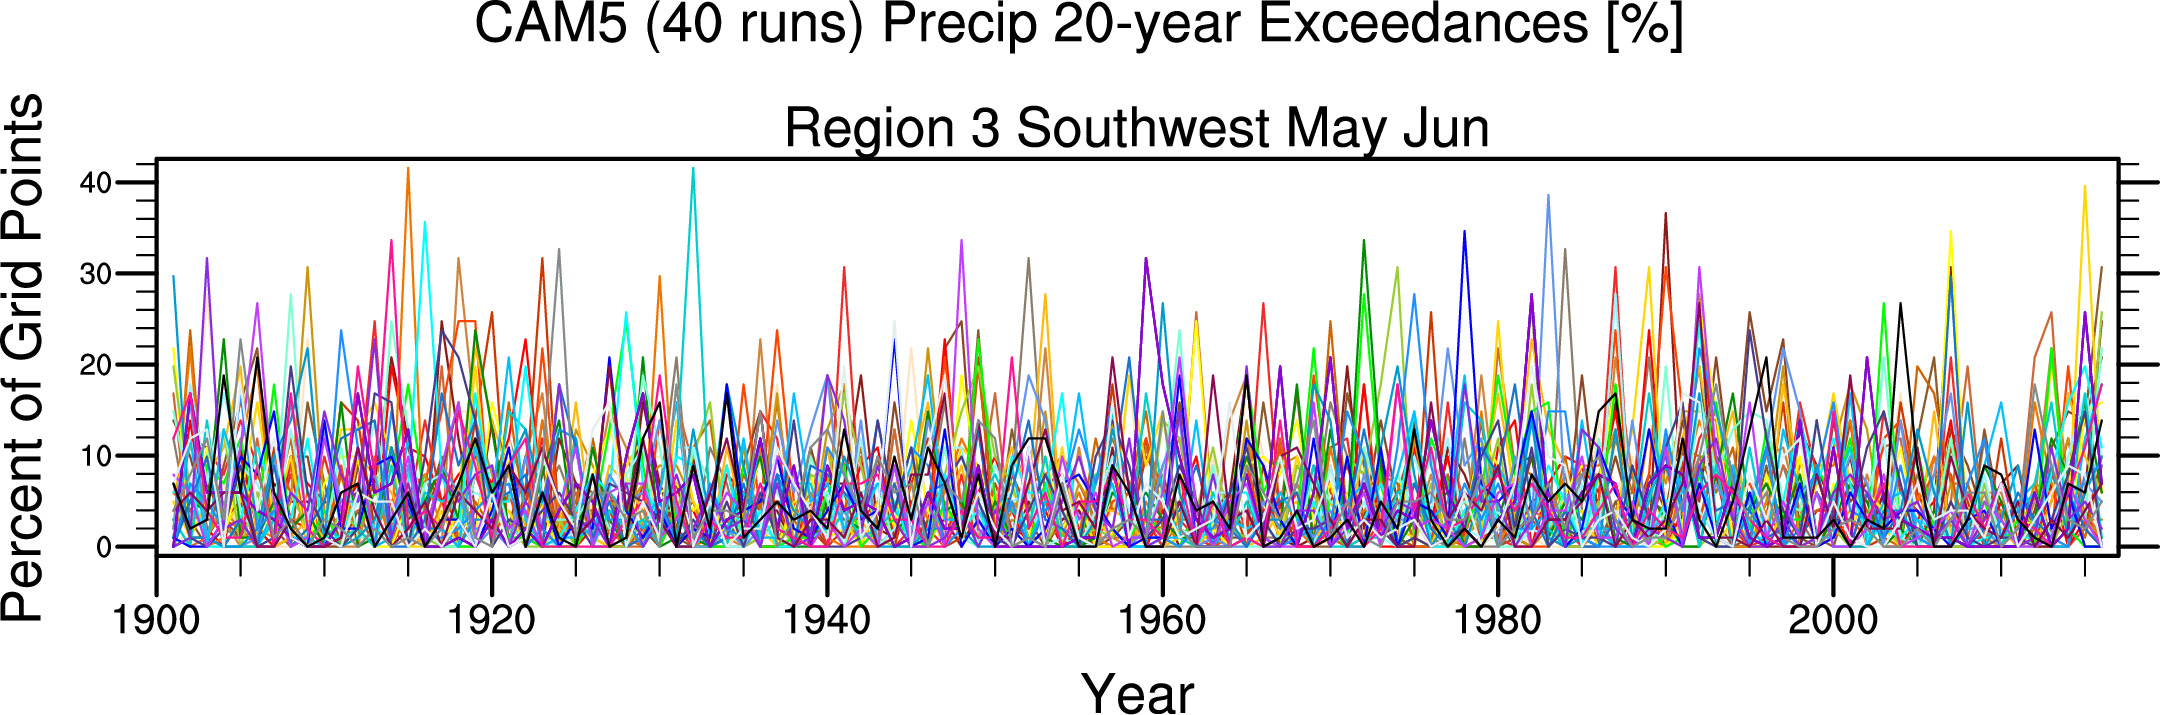
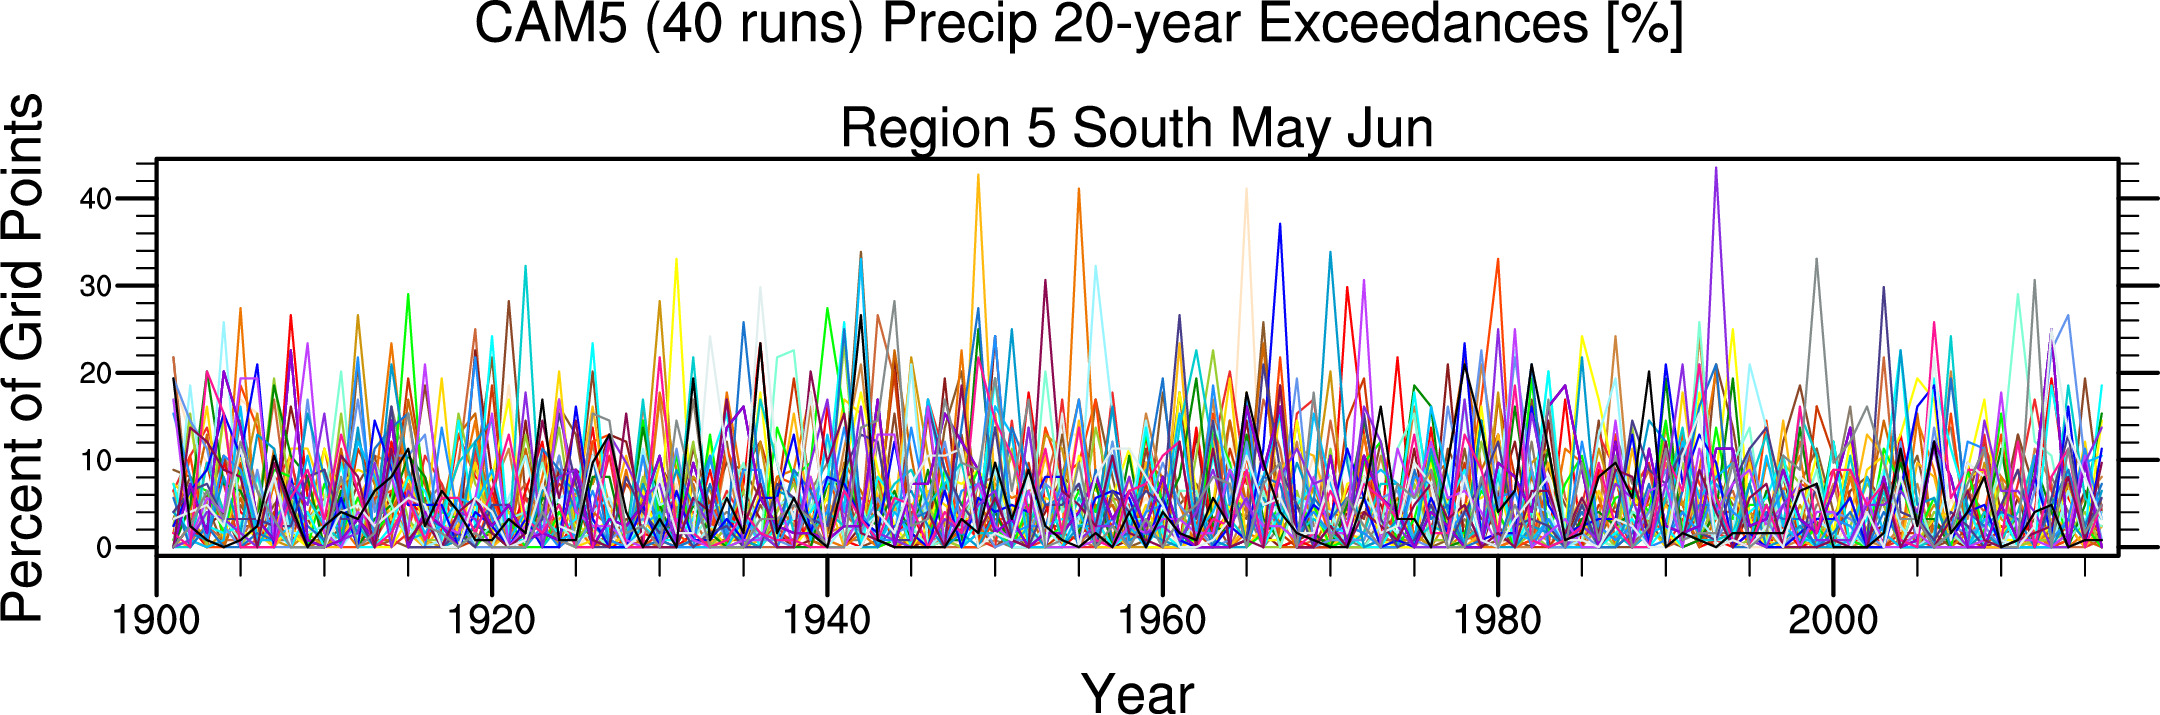
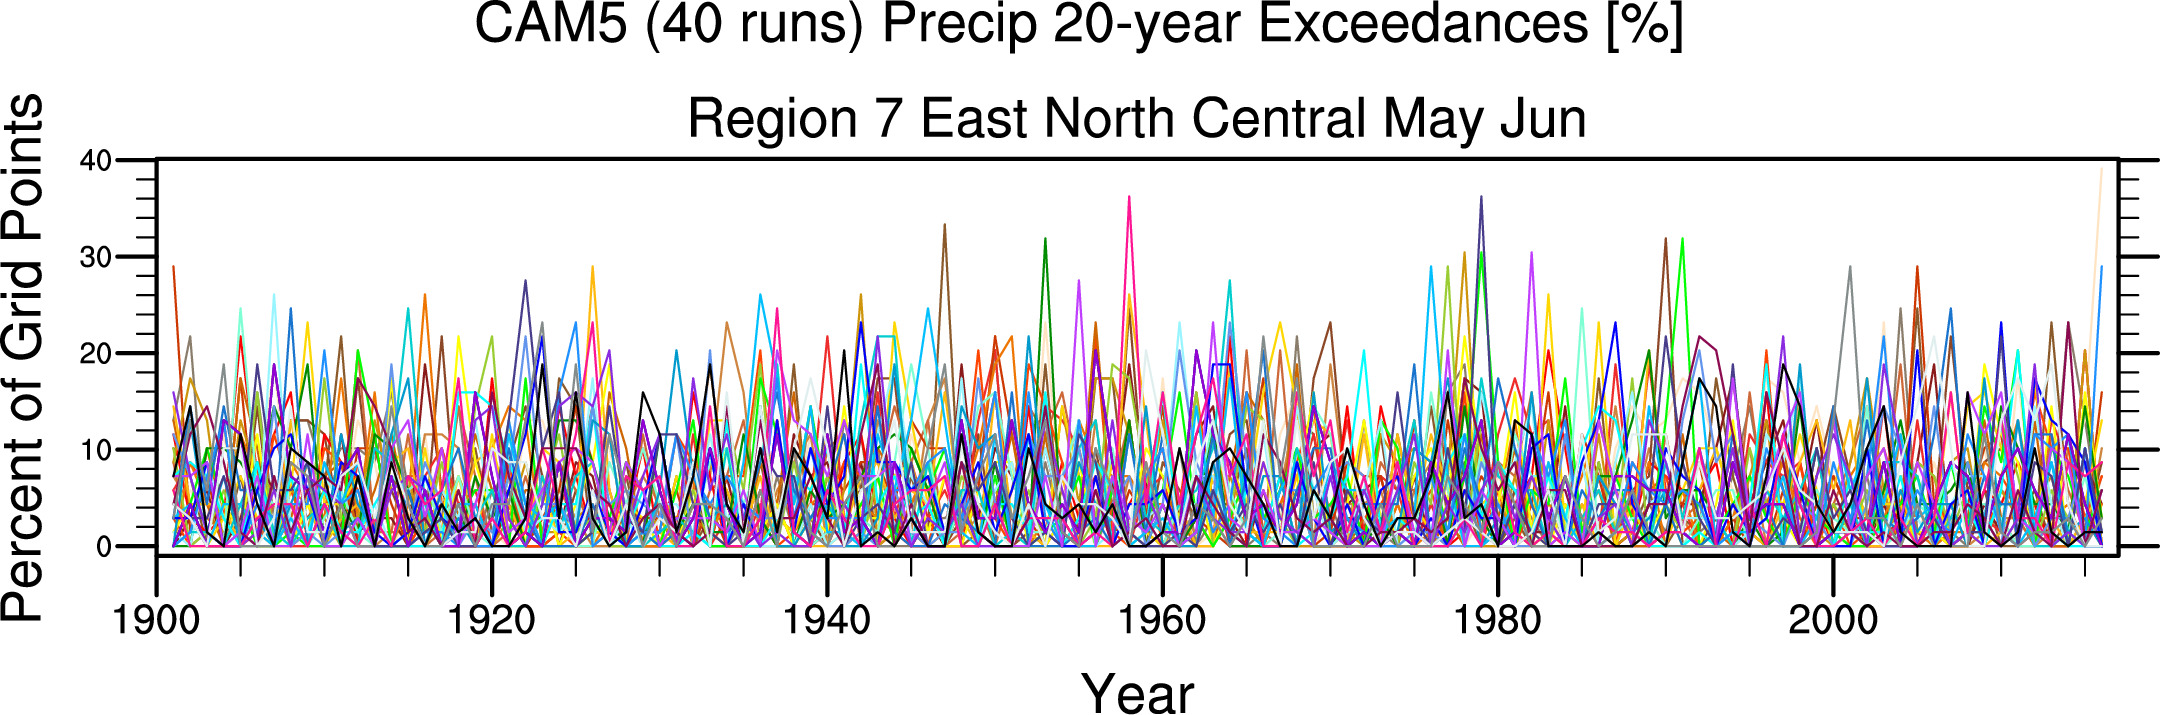
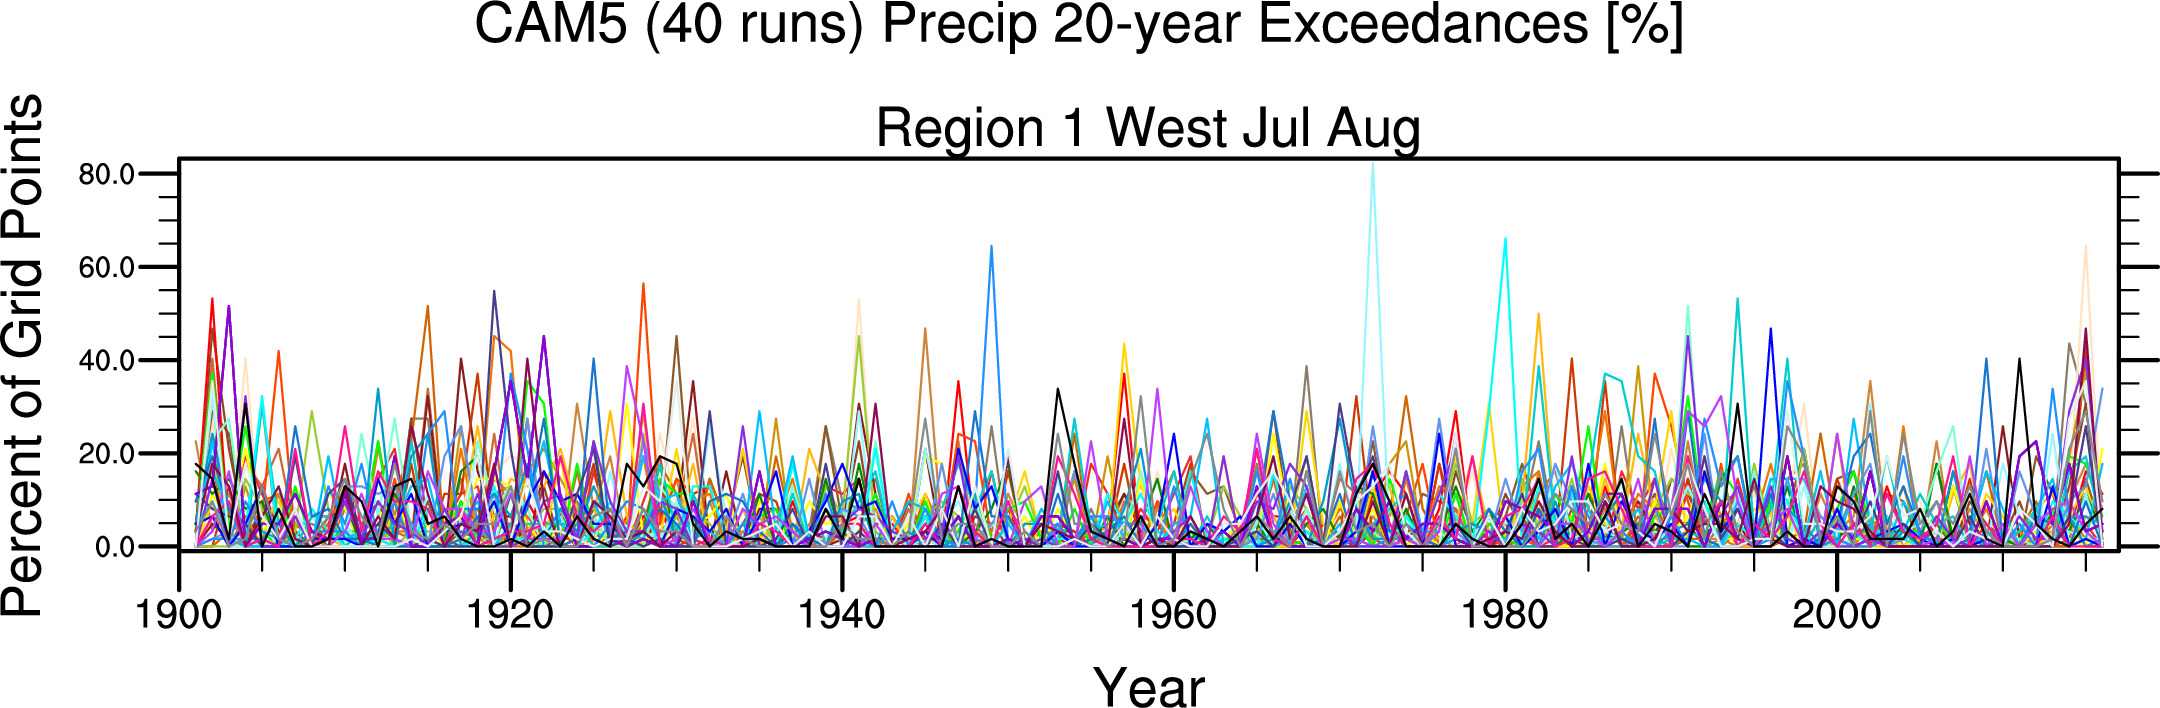
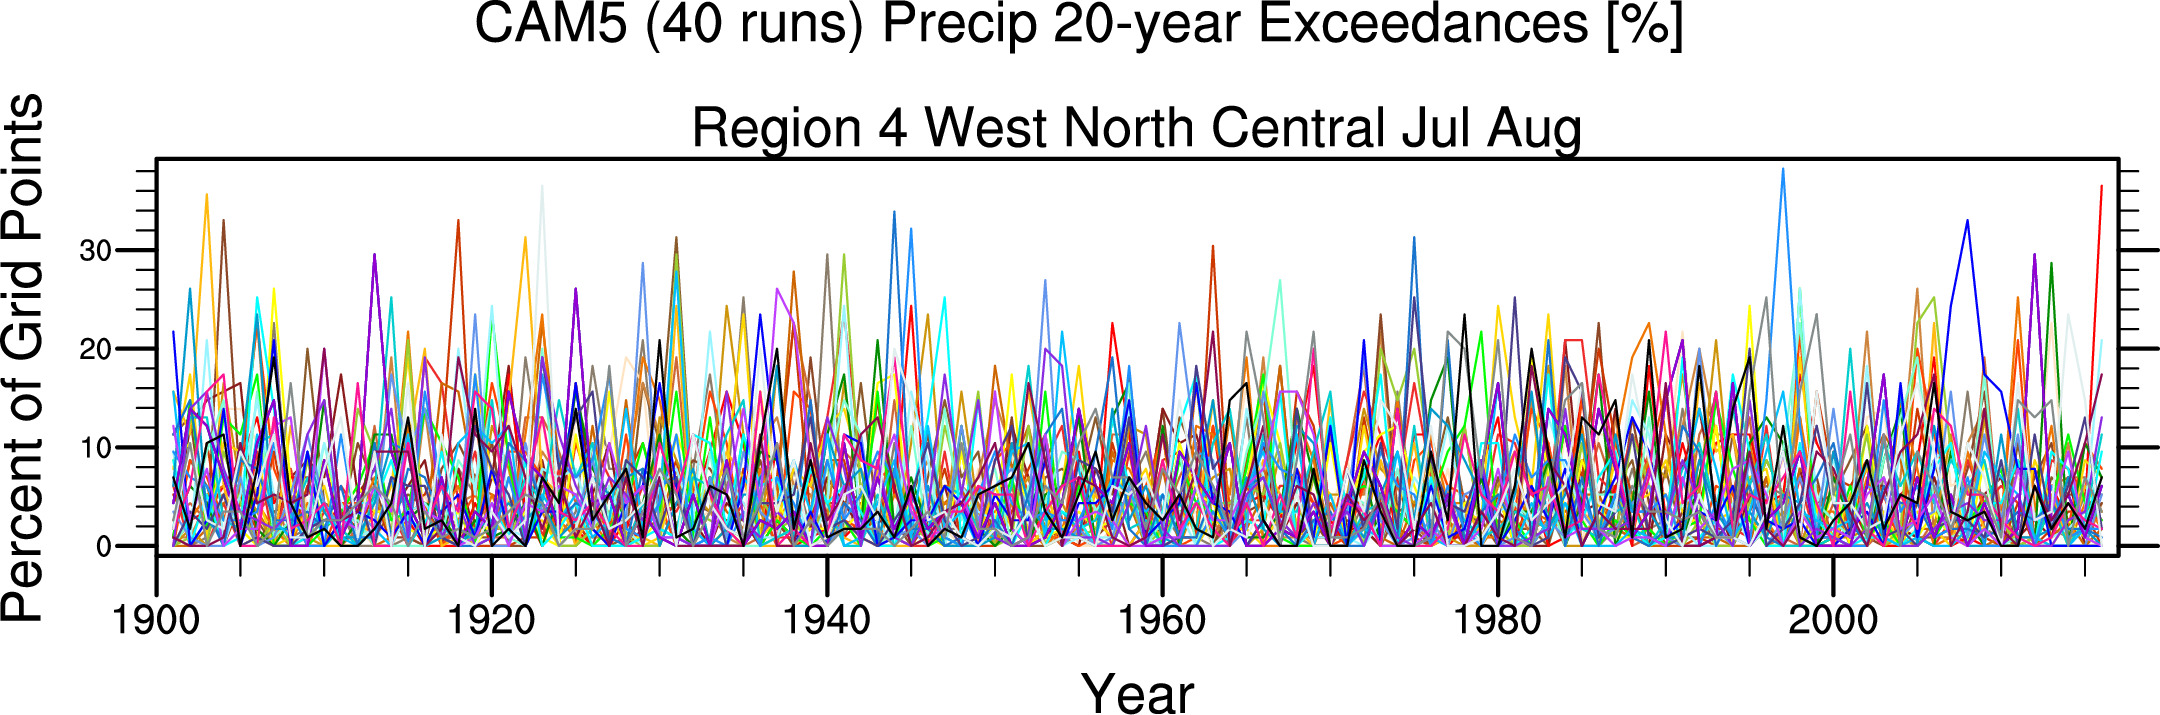
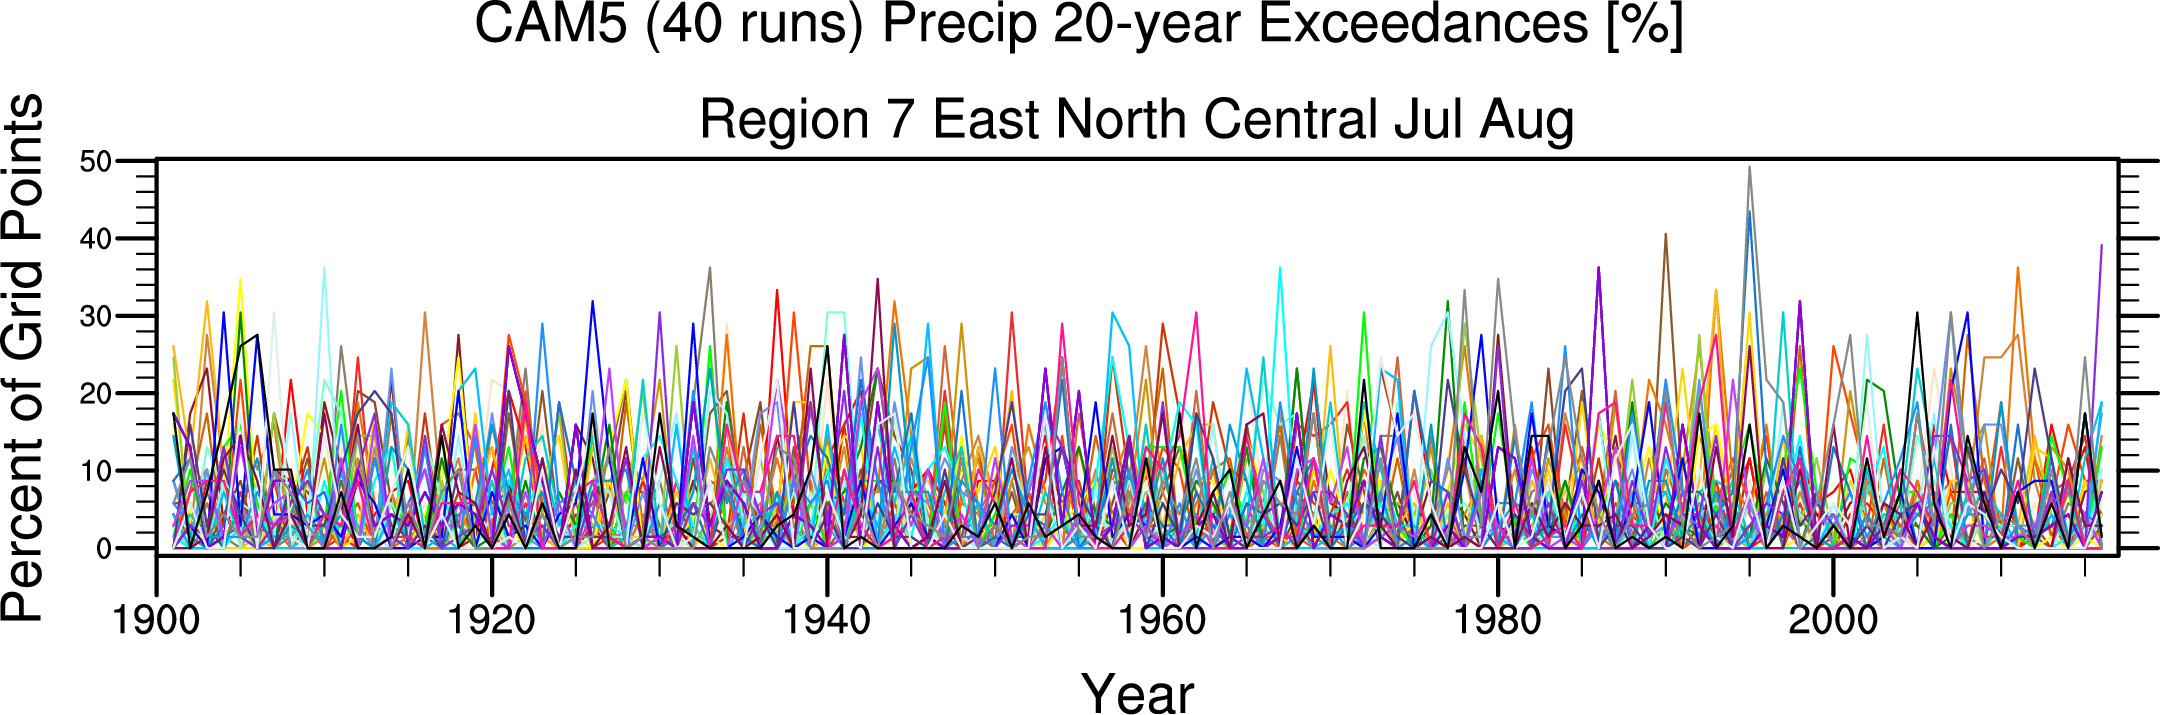
1-in-20-year event exceedances precipitation
In all CAM5 cases below, each run had its own 'cut point'
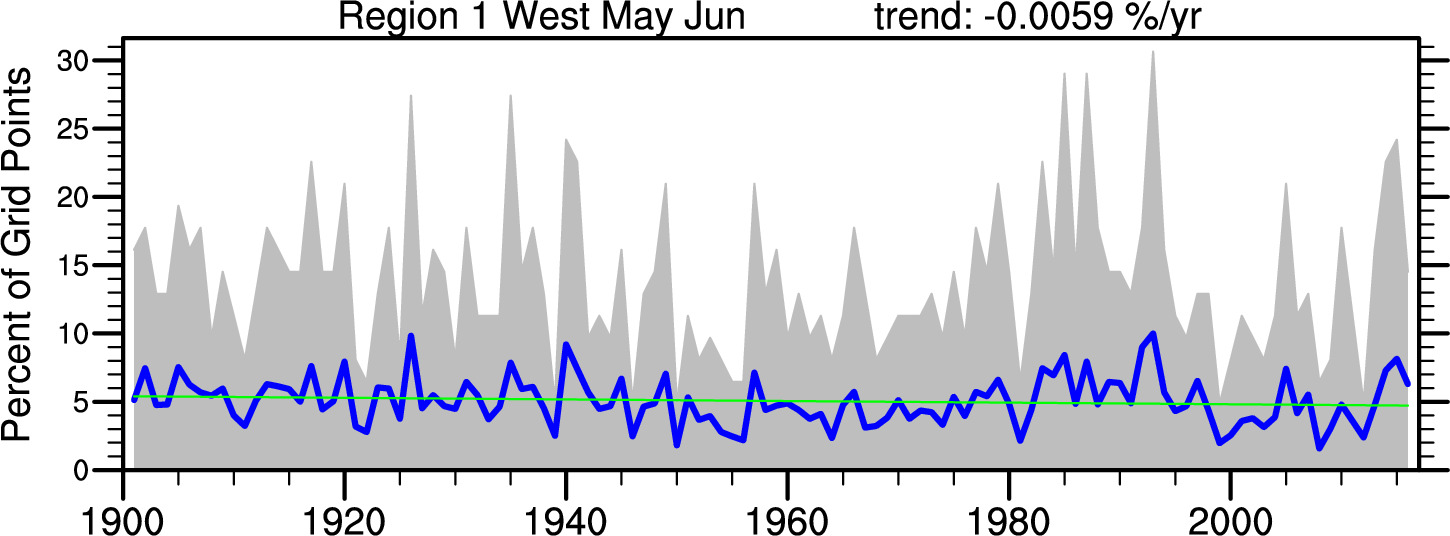
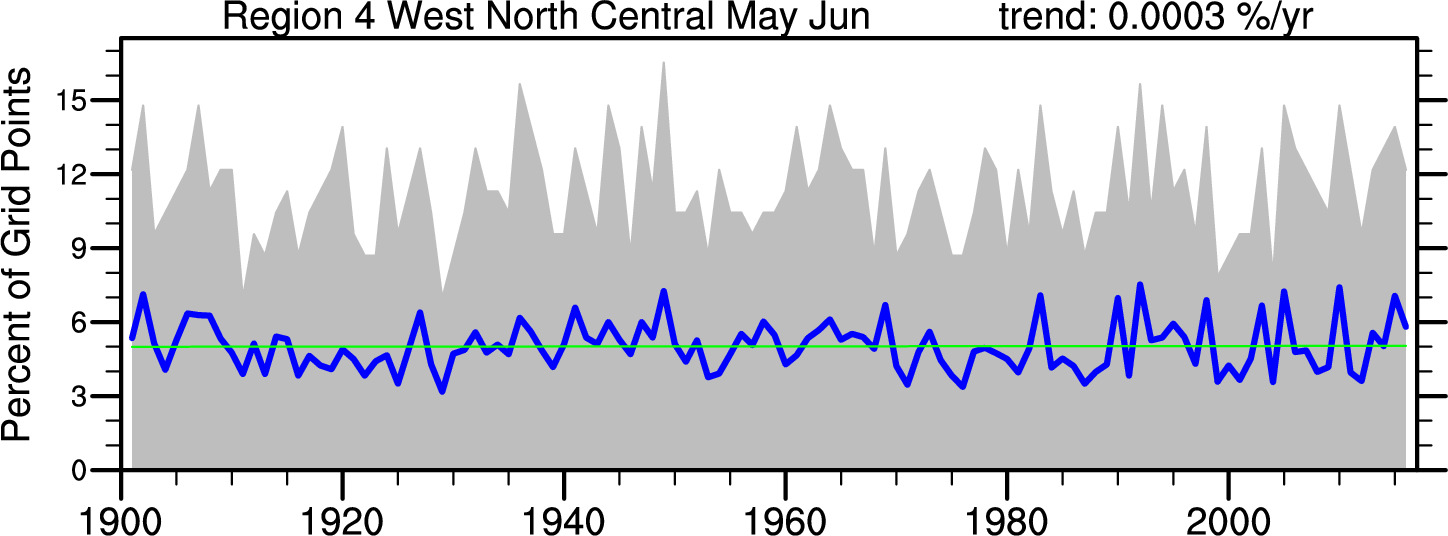
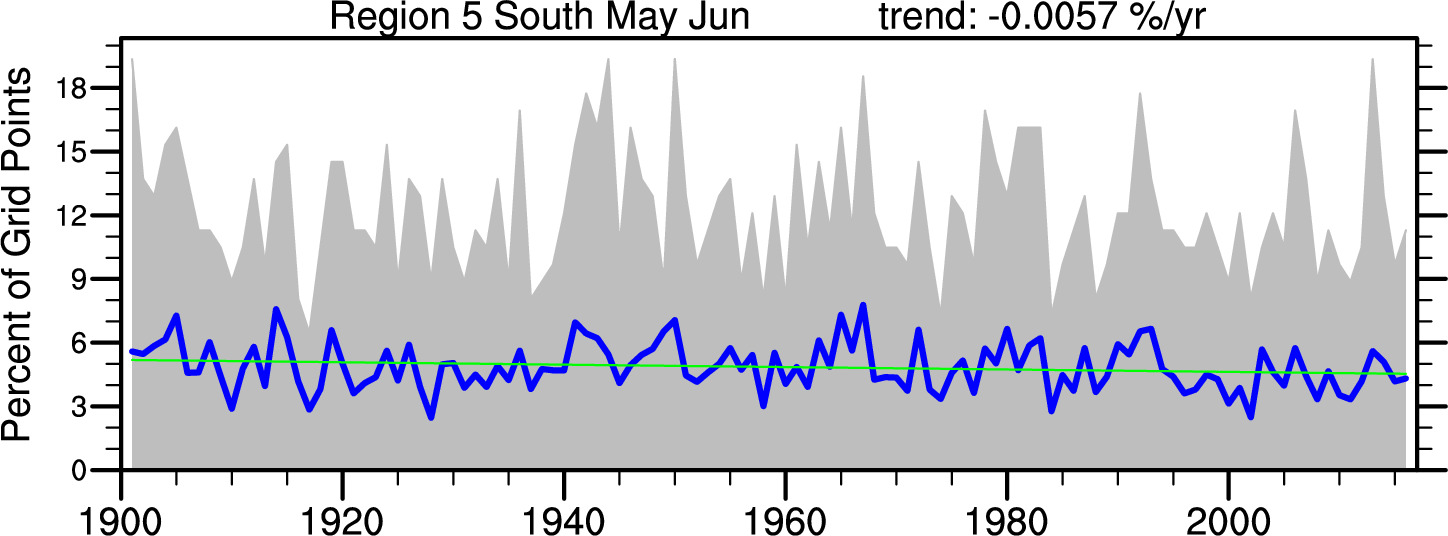
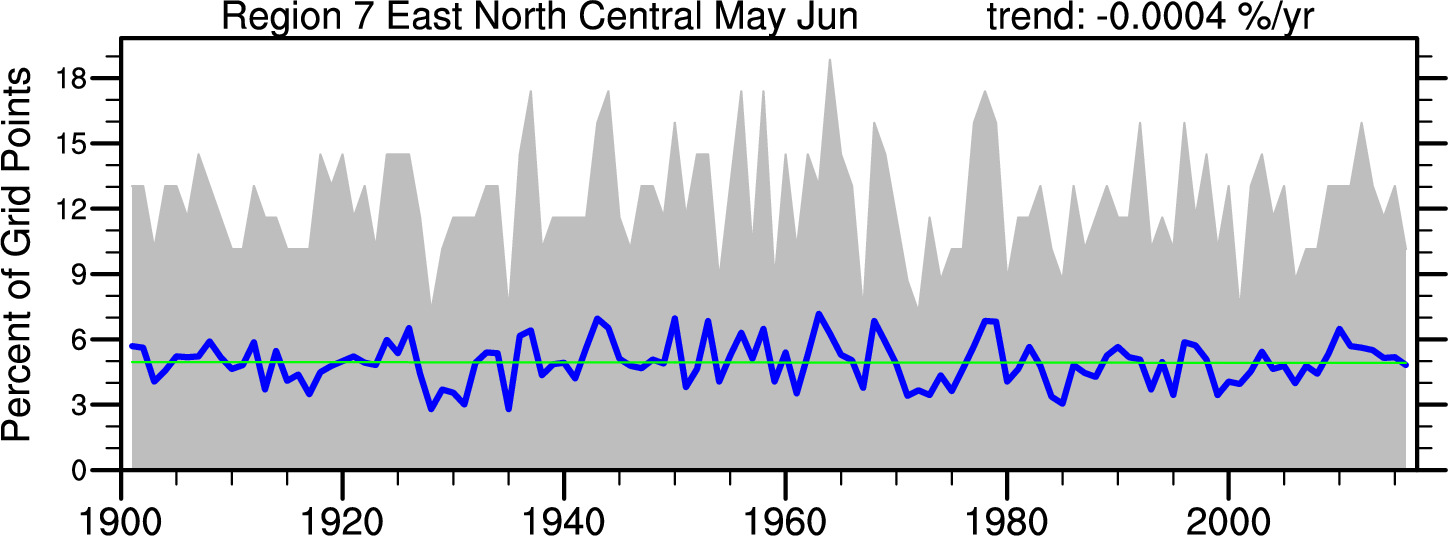
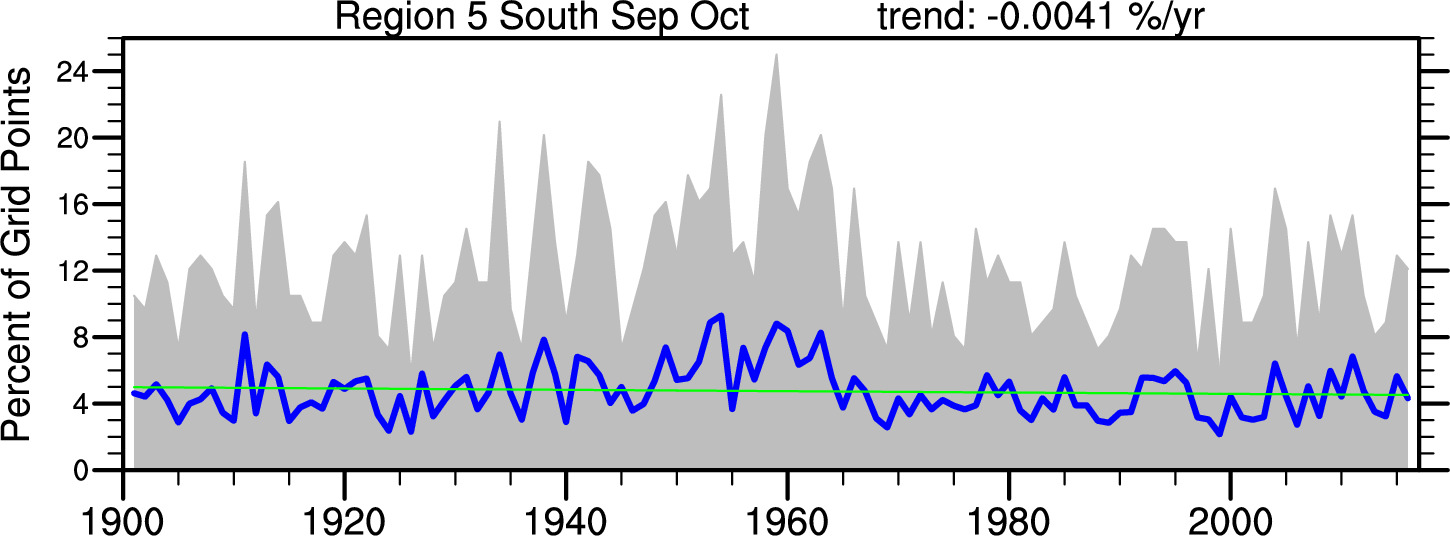
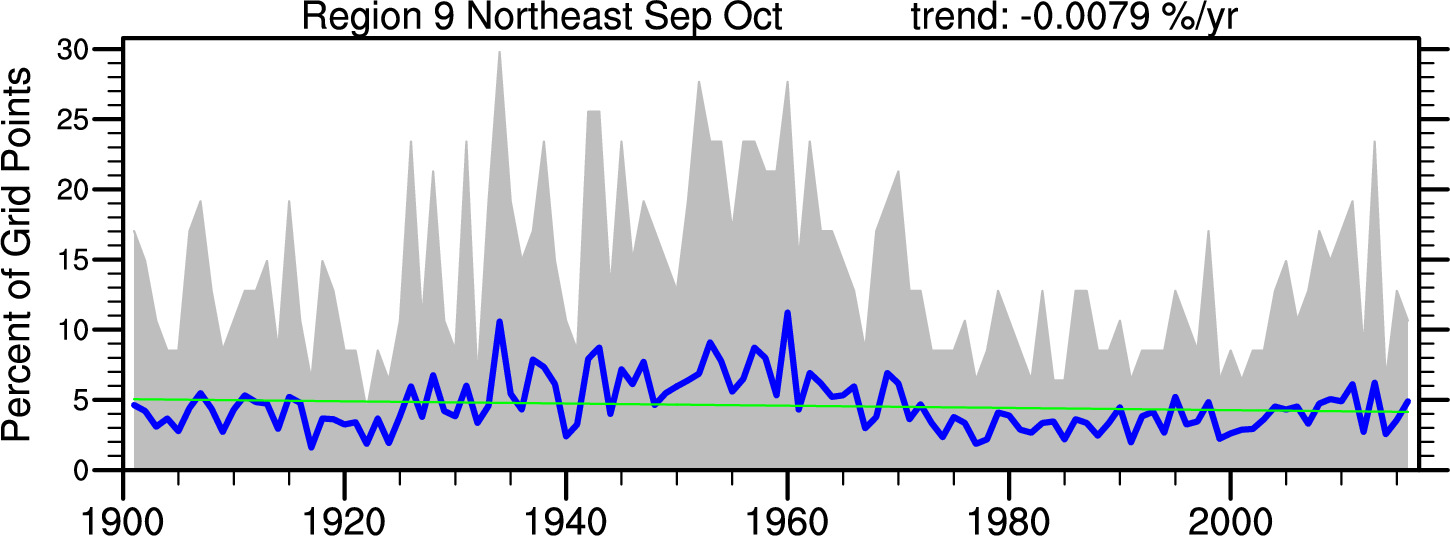
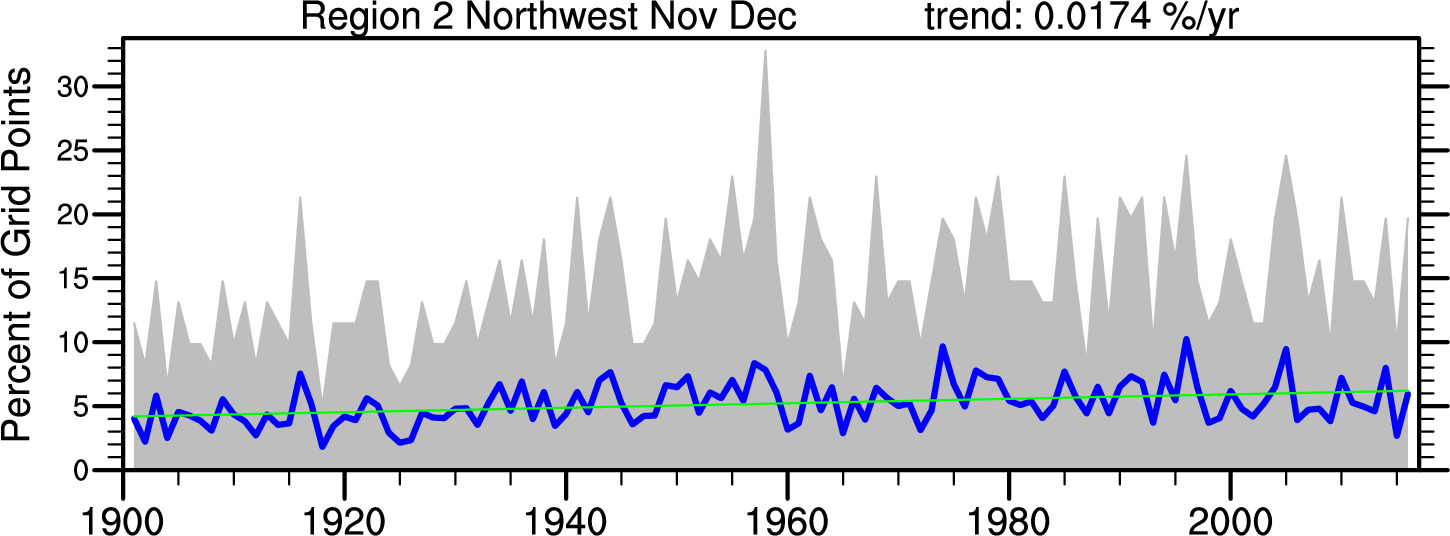
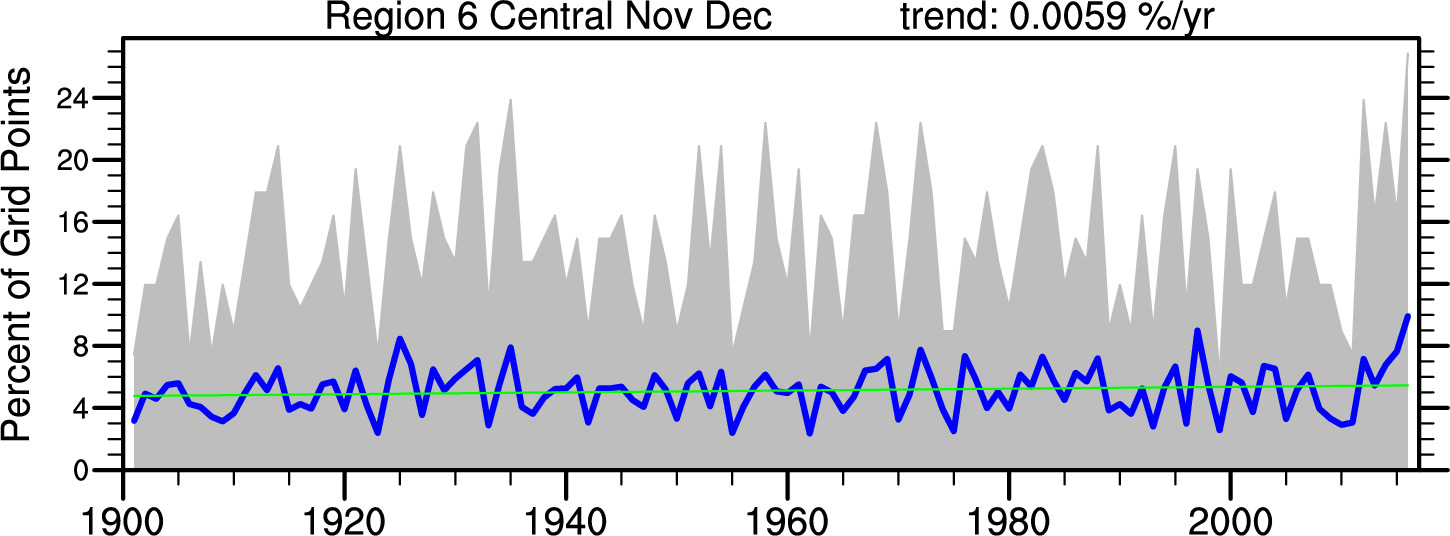
Precip Time Series Trends
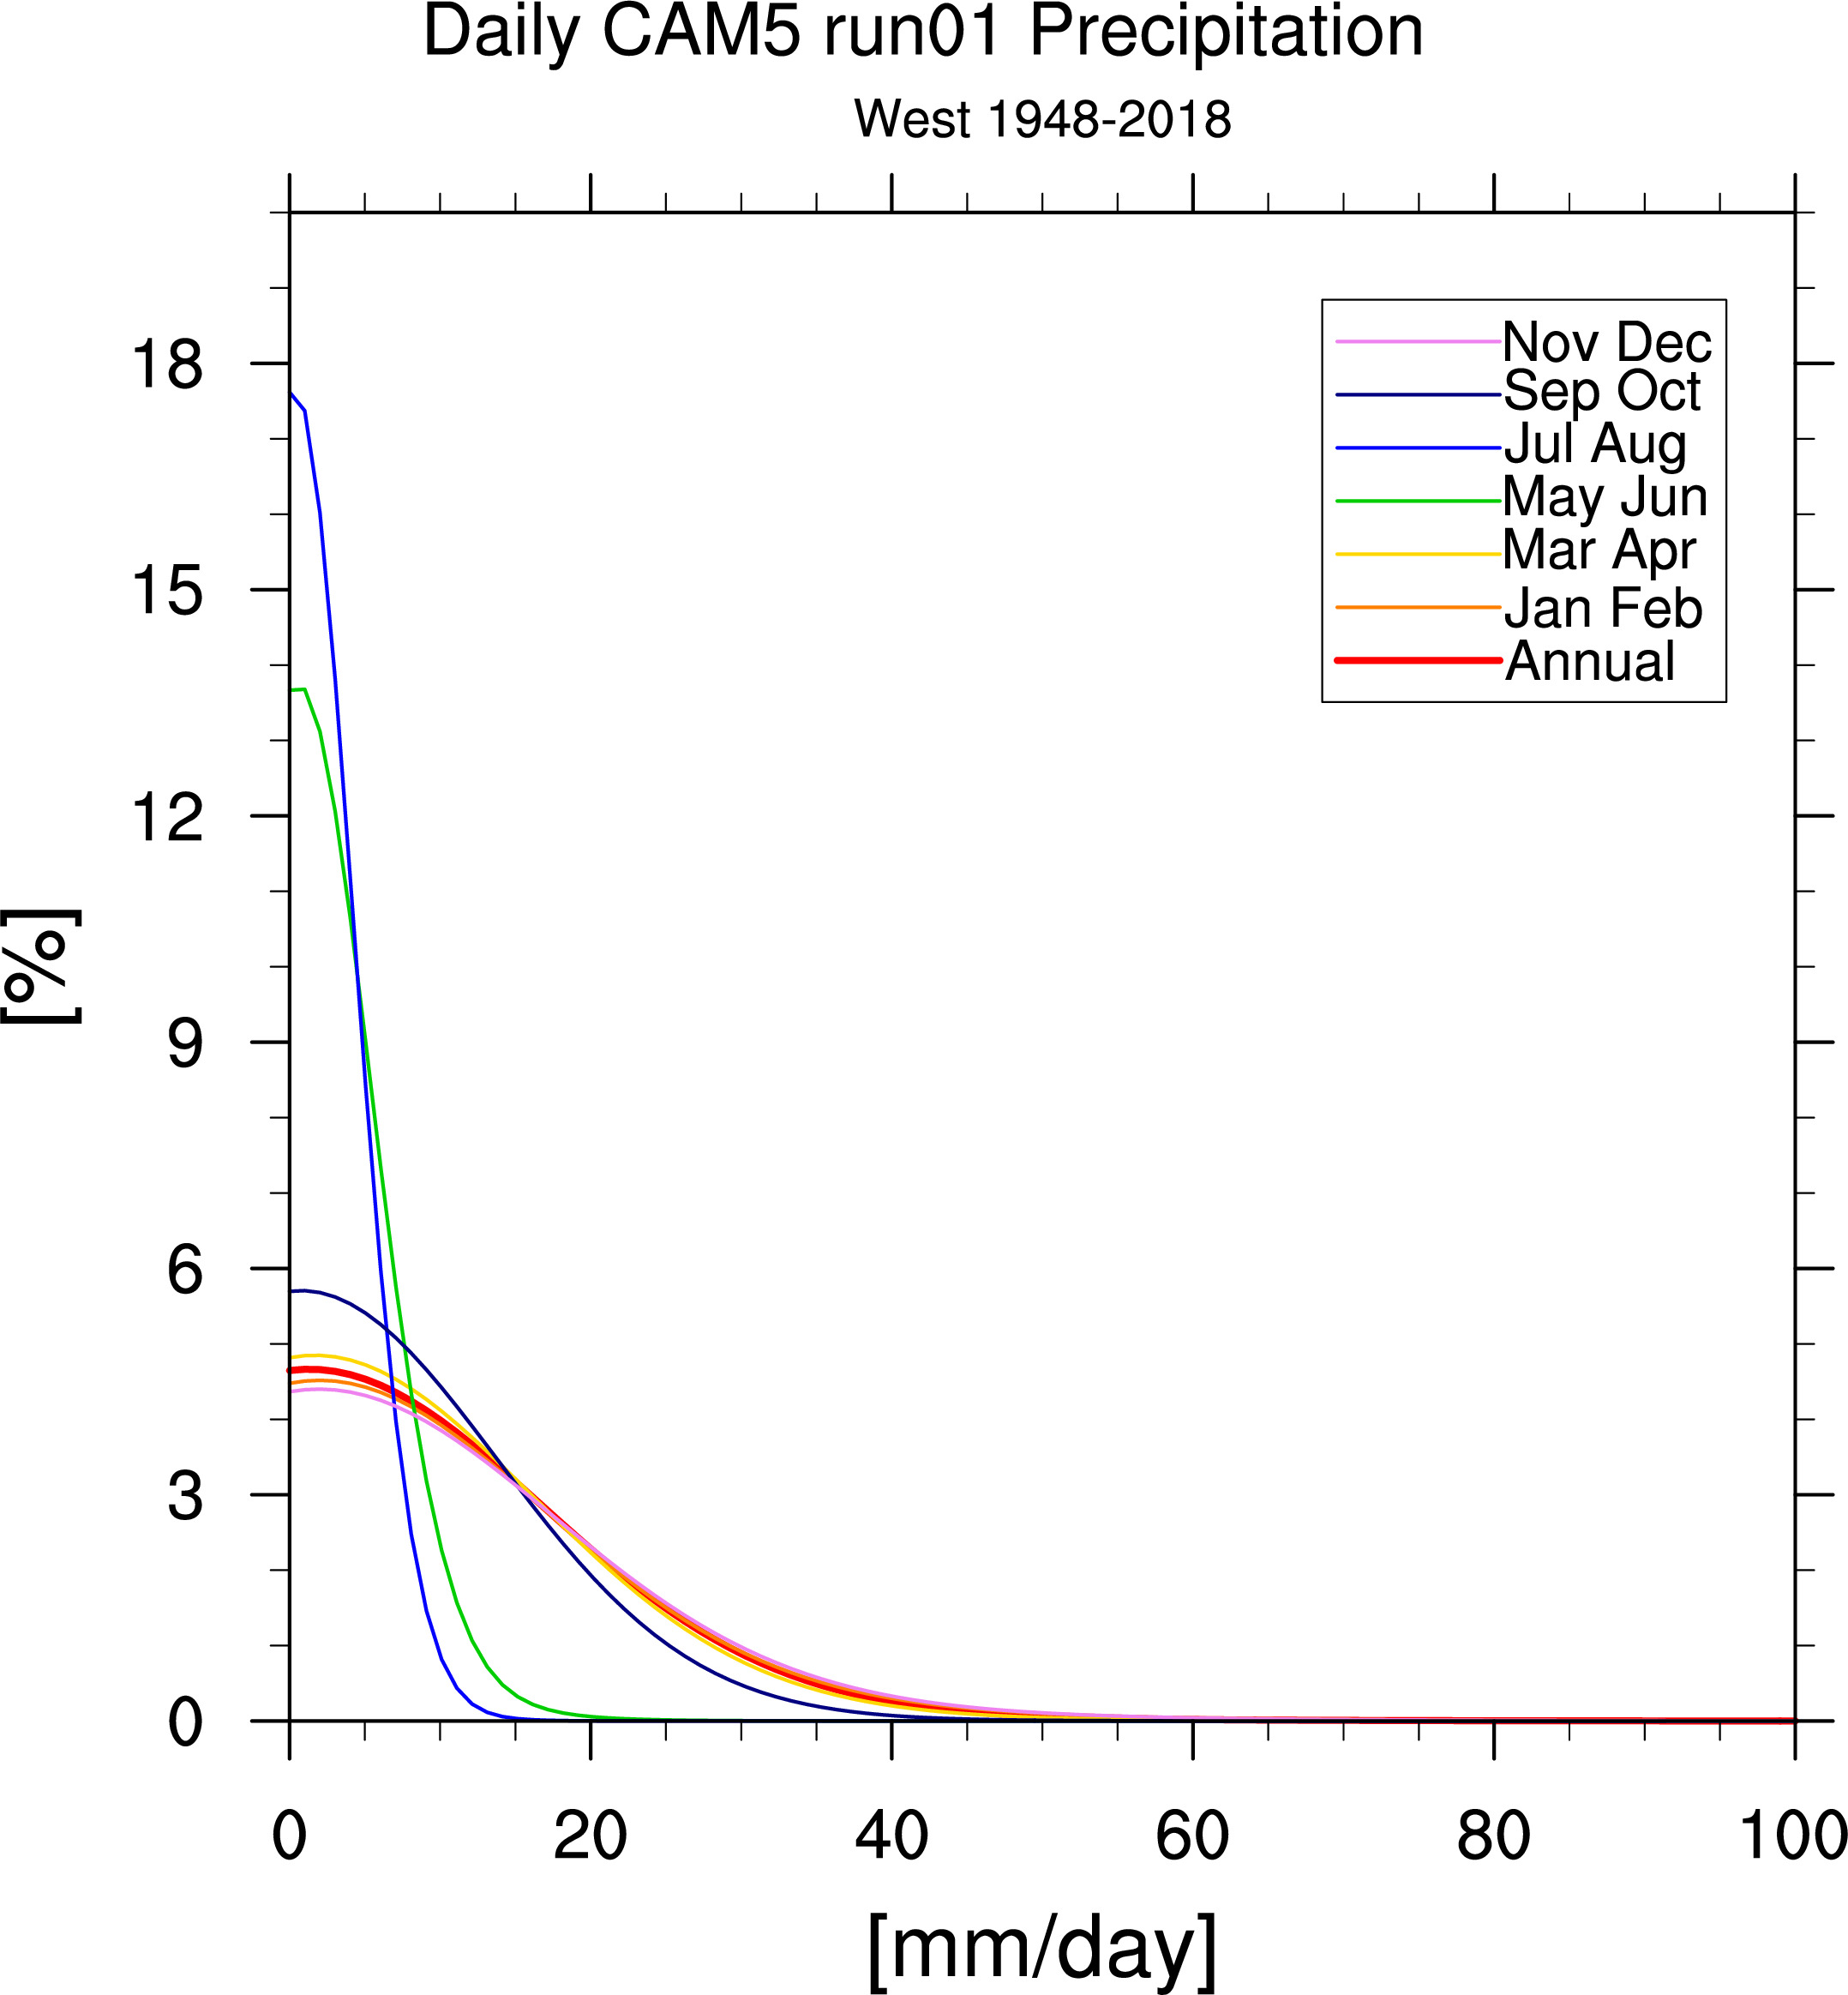
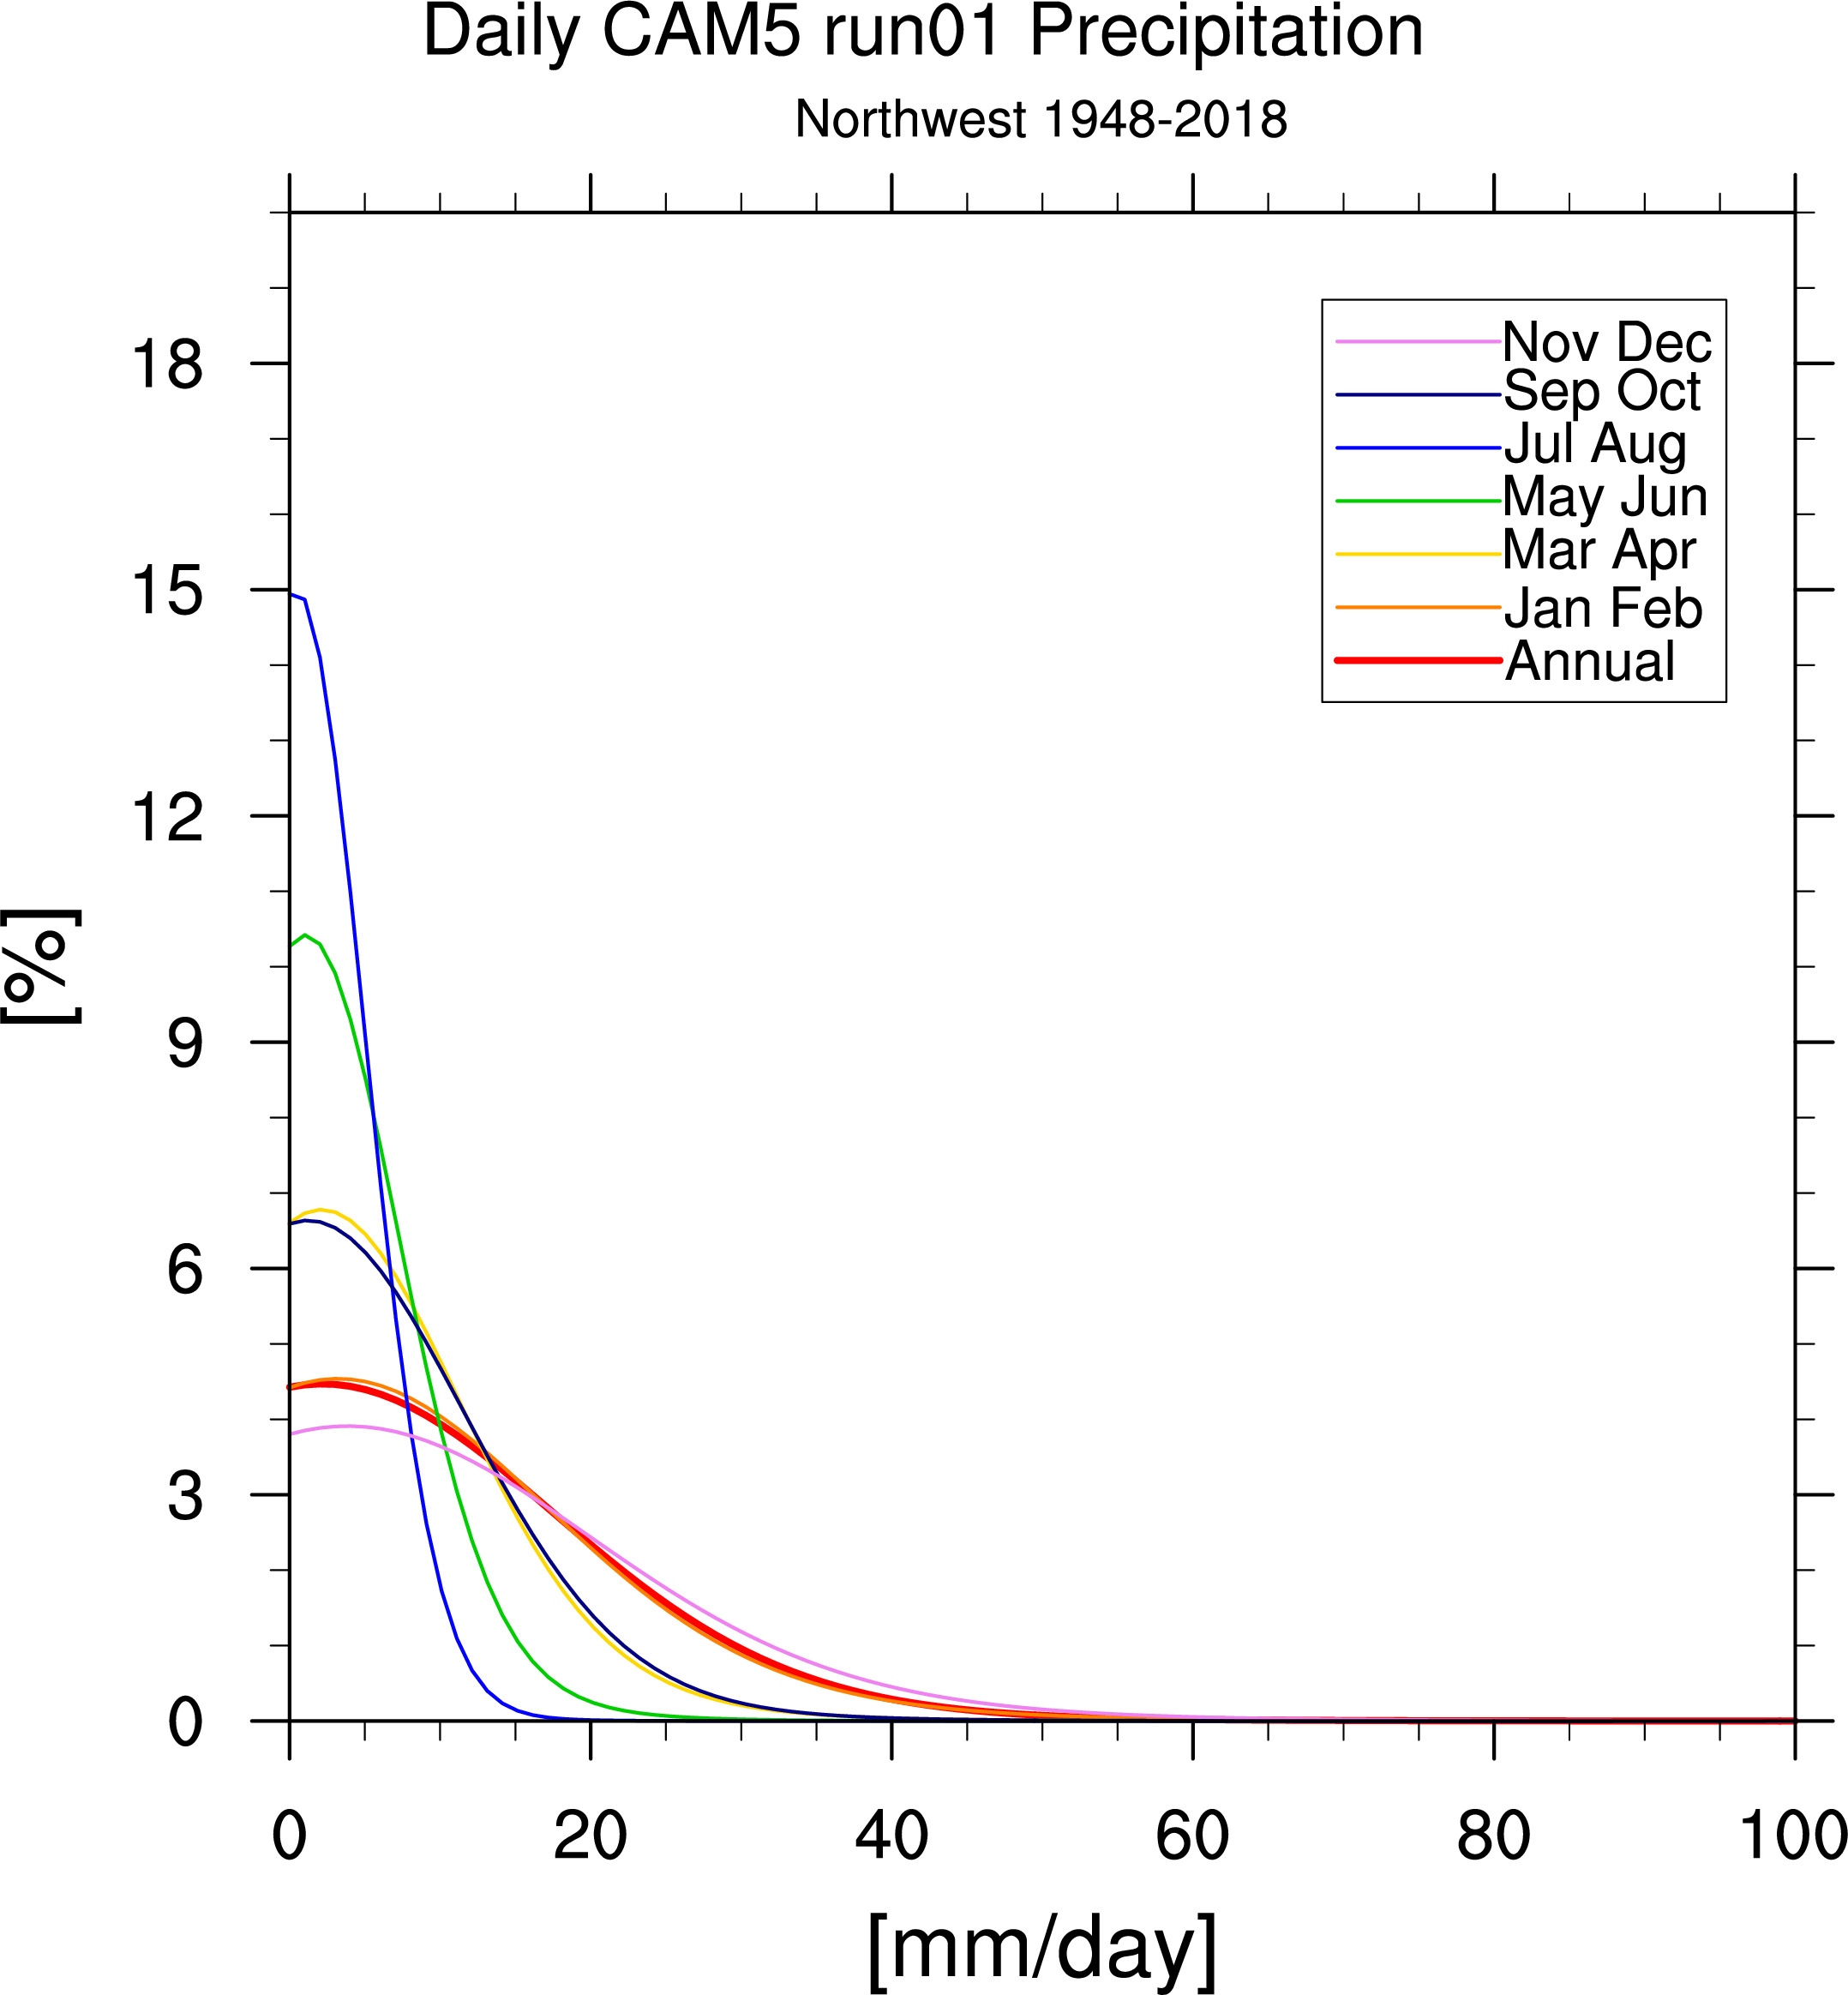
PDFs Annual and 6 2-month seasons
asterisks indicate observational station data

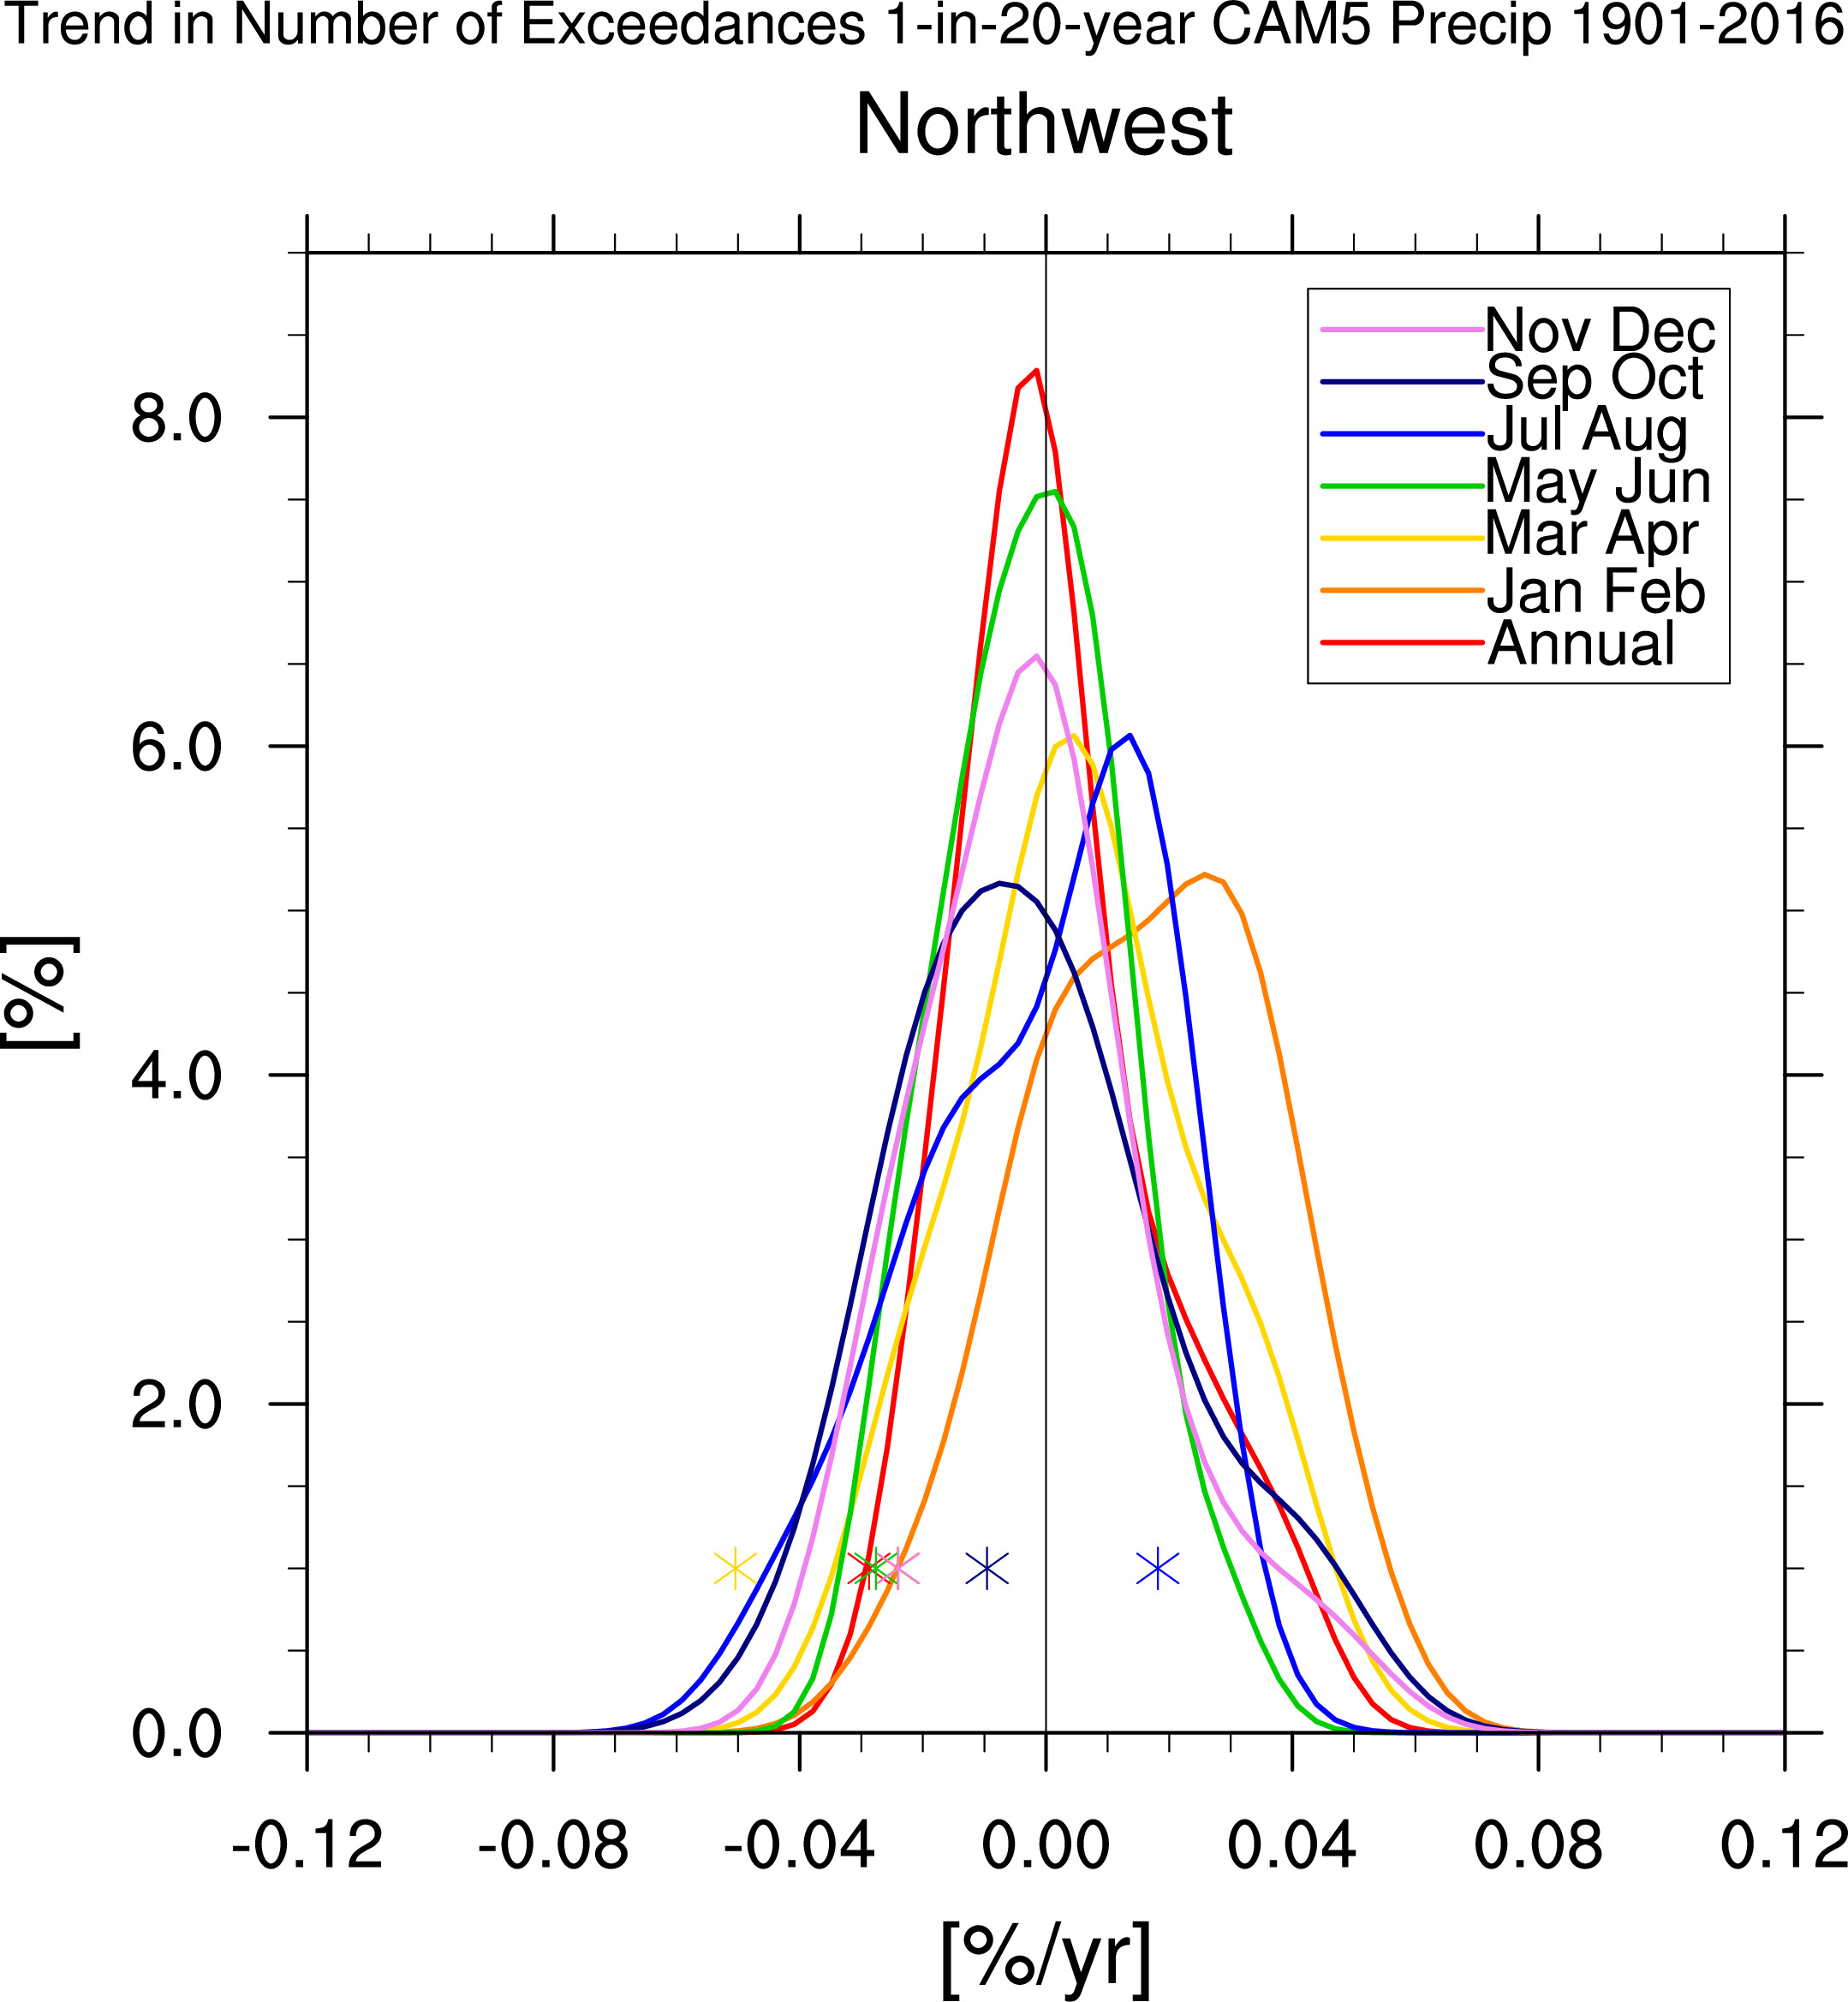


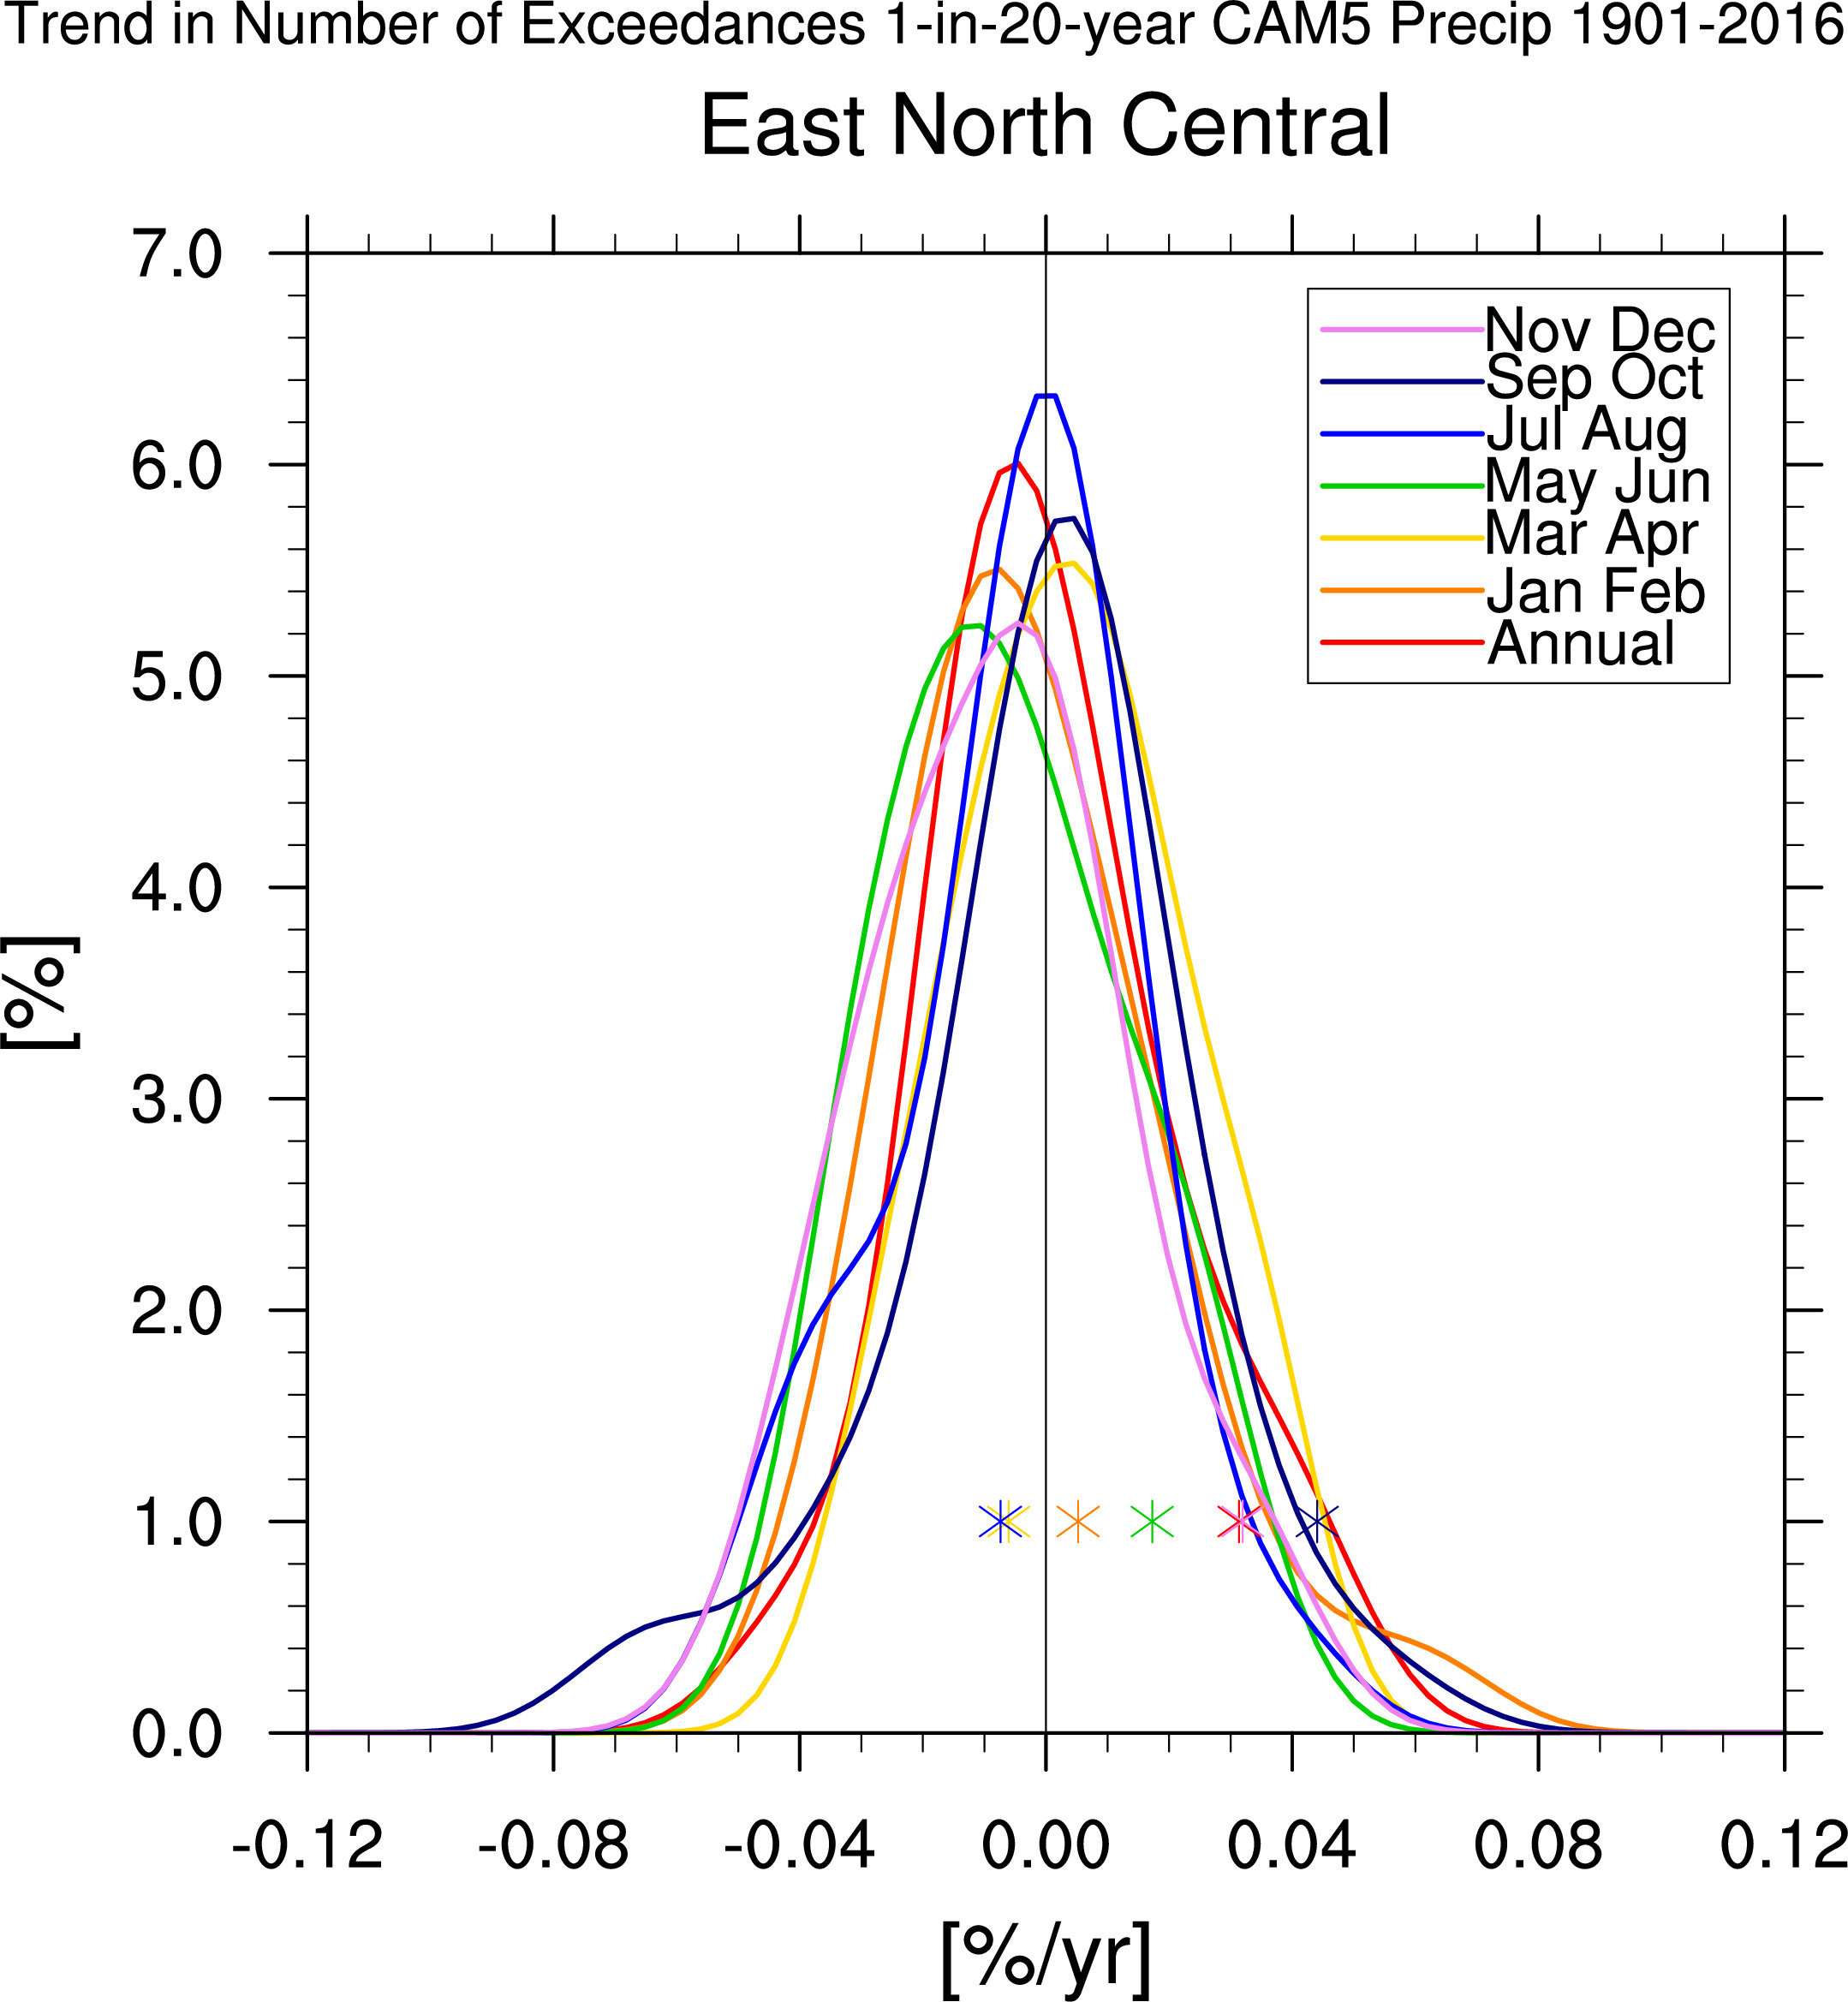

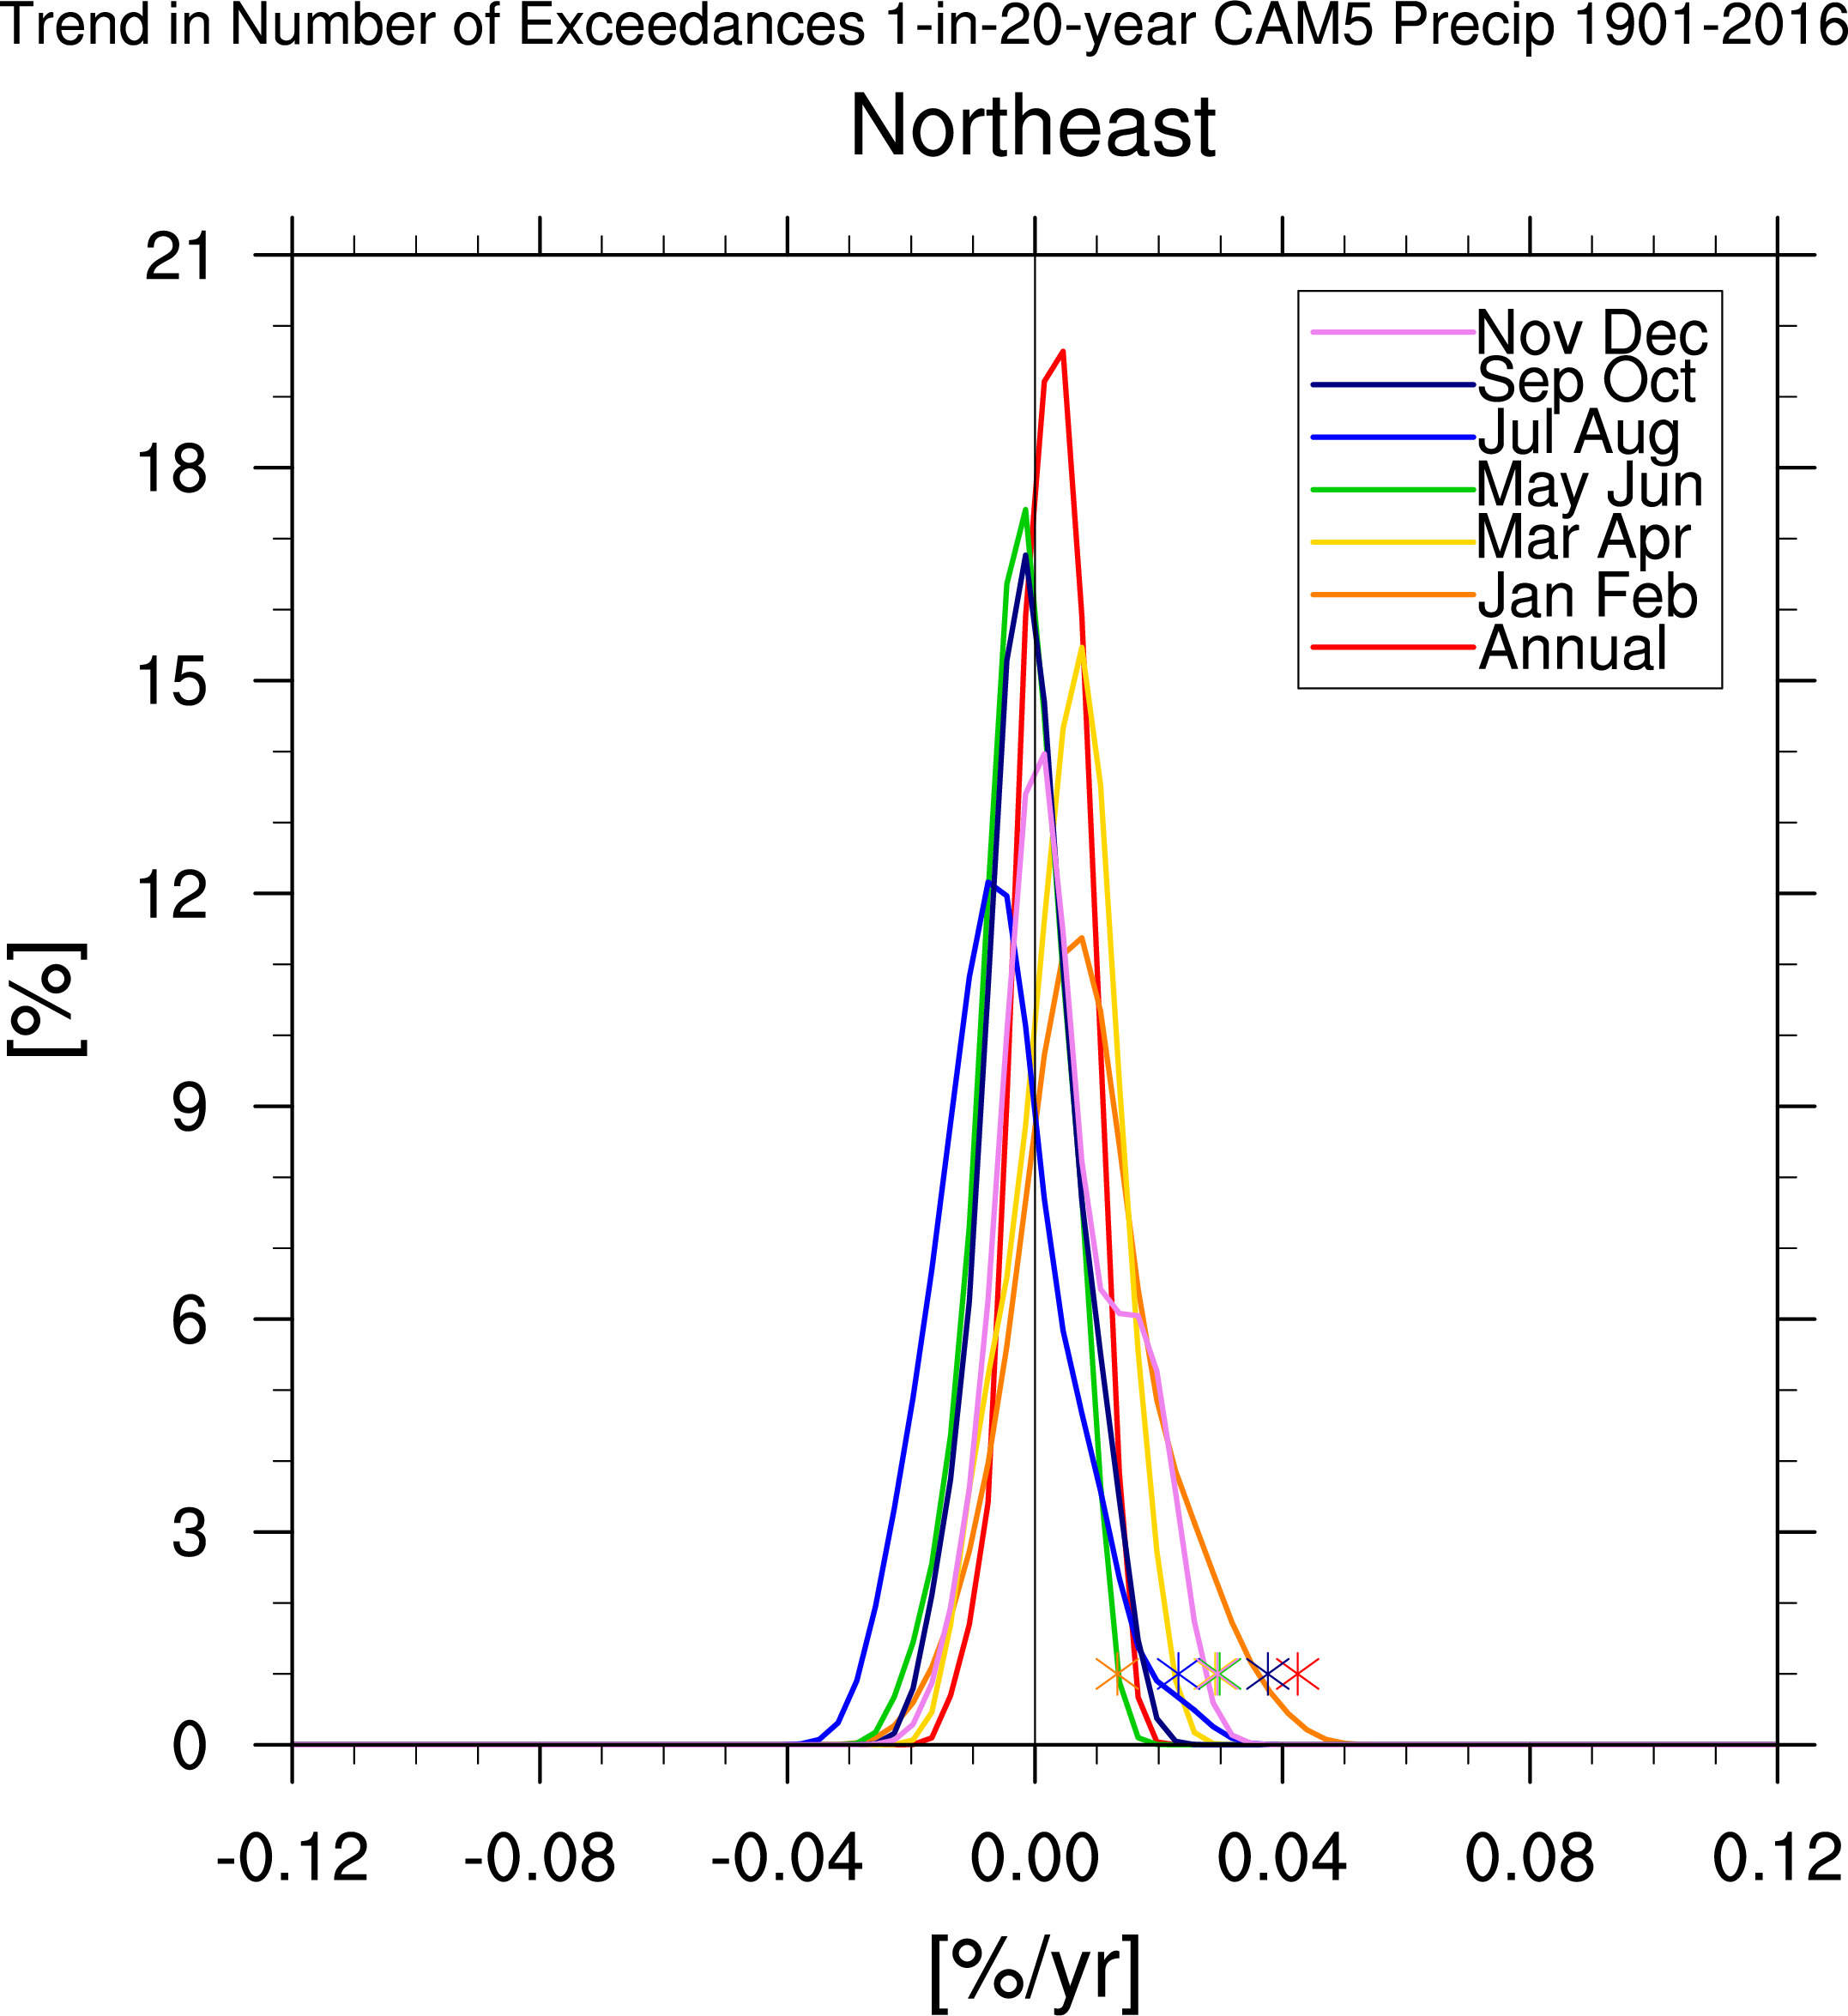

above trends computed from following time series
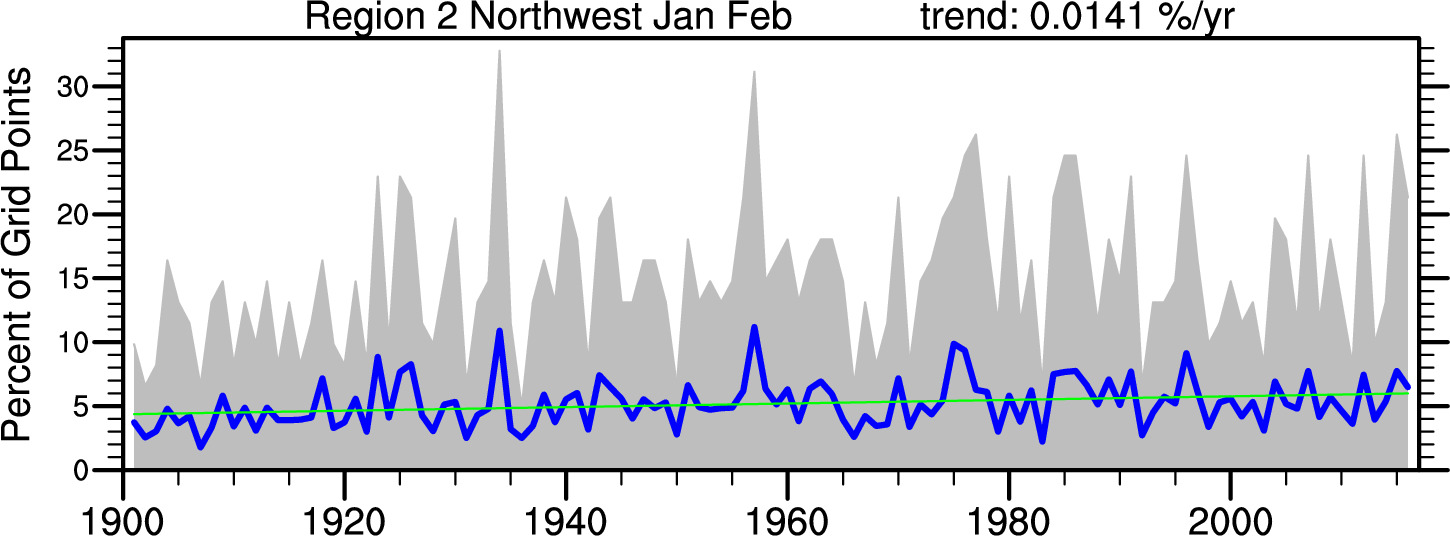
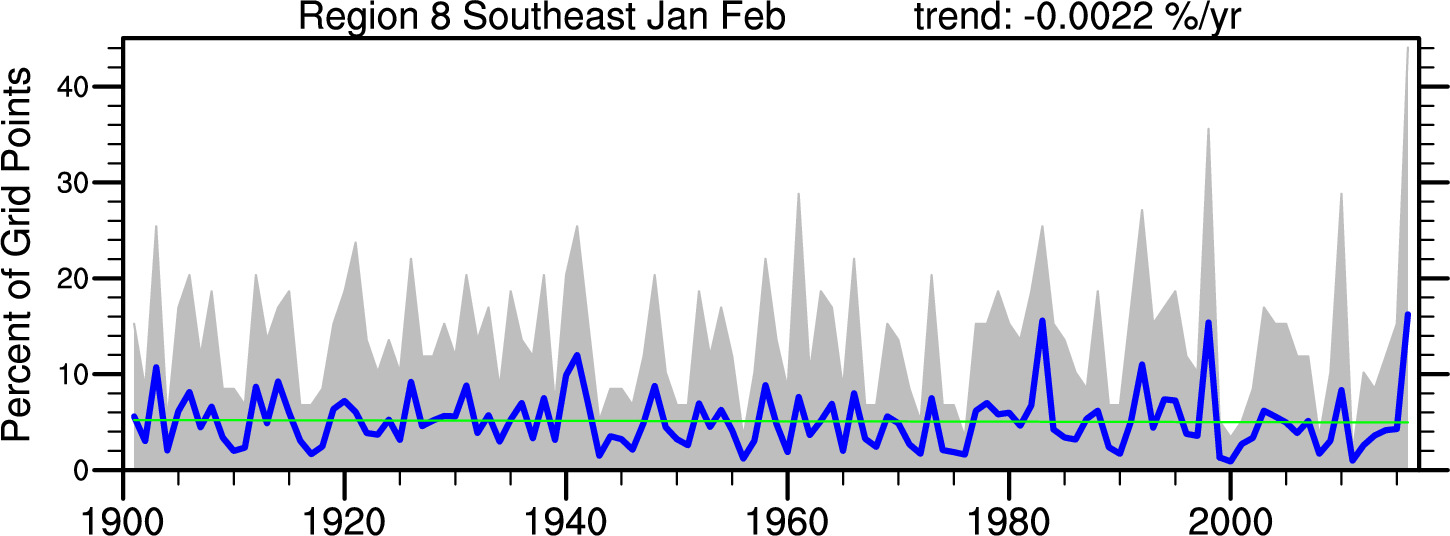
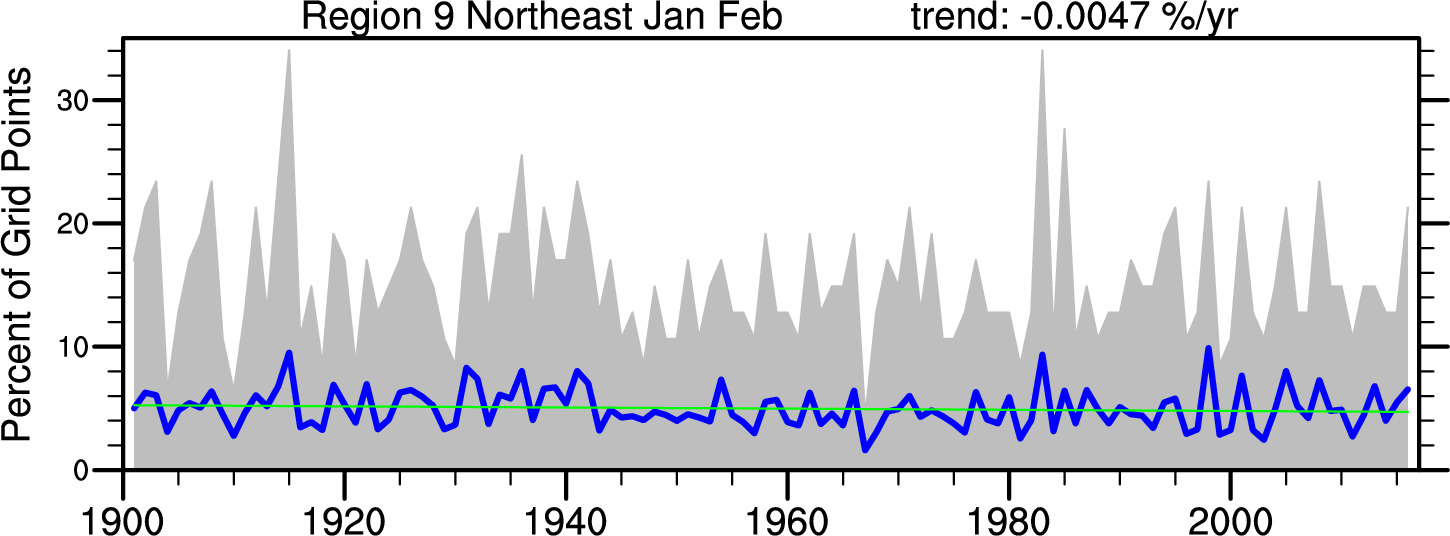
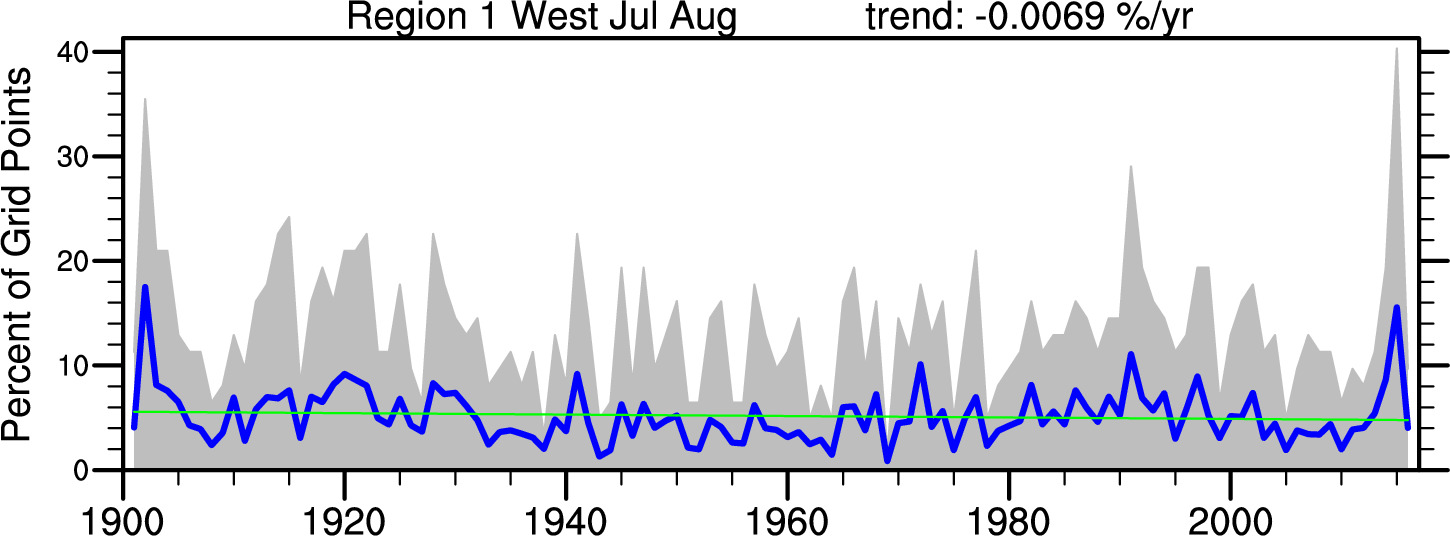
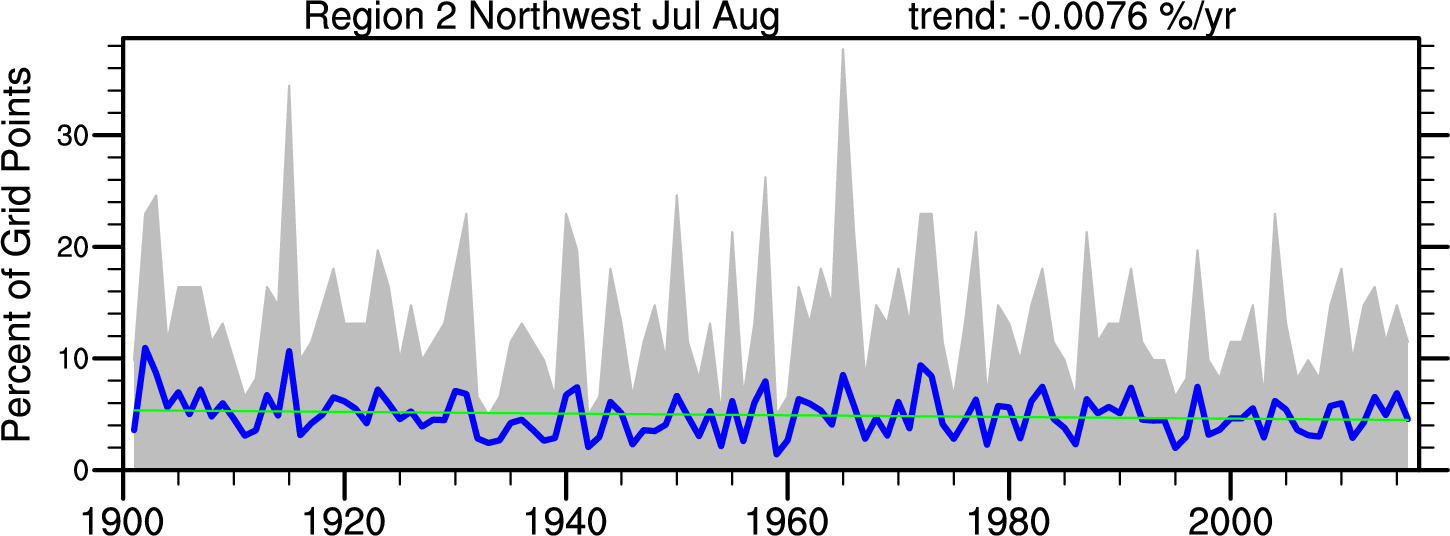
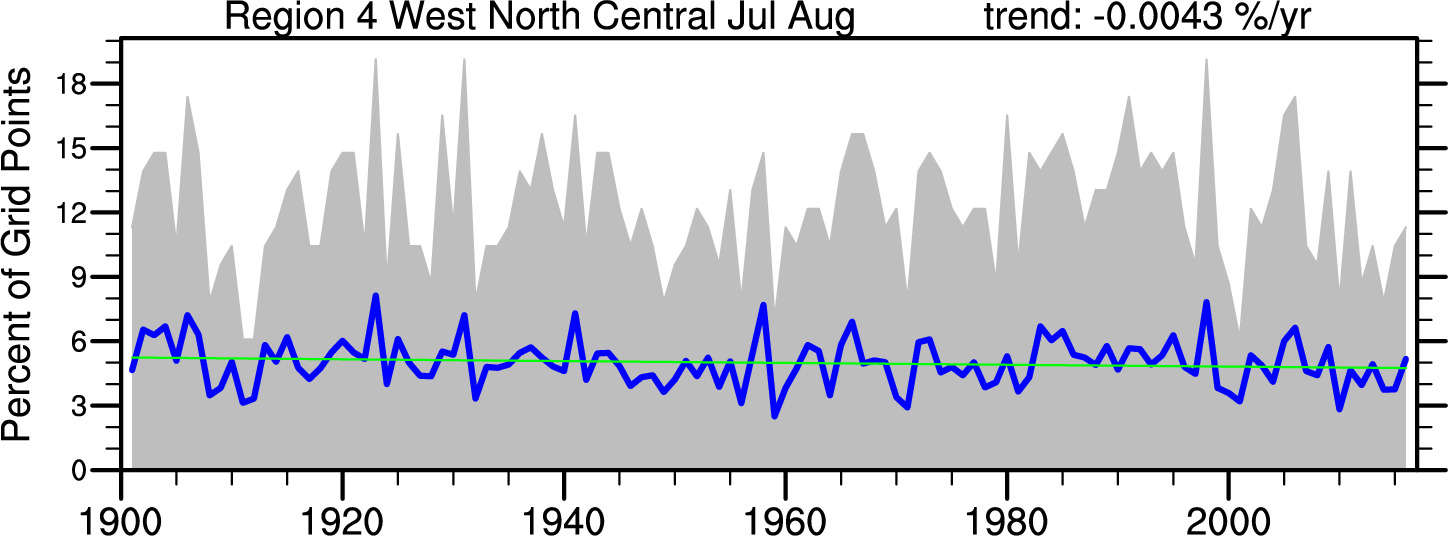
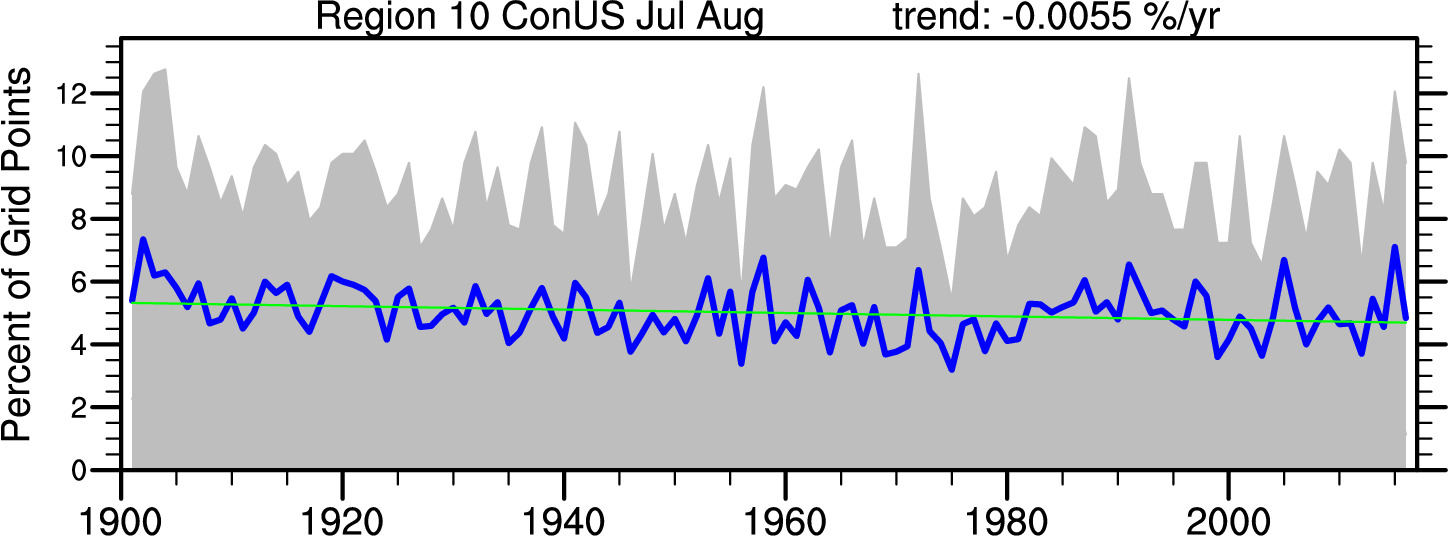
CAM5 Precip Time Series
Gray envelope indicates 10% to 90% ranges. Blue line is mean of 40 ensemble members. Green line is trend line (of mean).
Annual 1-in-20-year events 40 runs


Seasonal 1-in-20-year events 40 runs
2-month: Jan Feb


2-month: Mar Apr


2-month: May Jun


2-month: Jul Aug


2-month: Sep Oct


2-month: Nov Dec


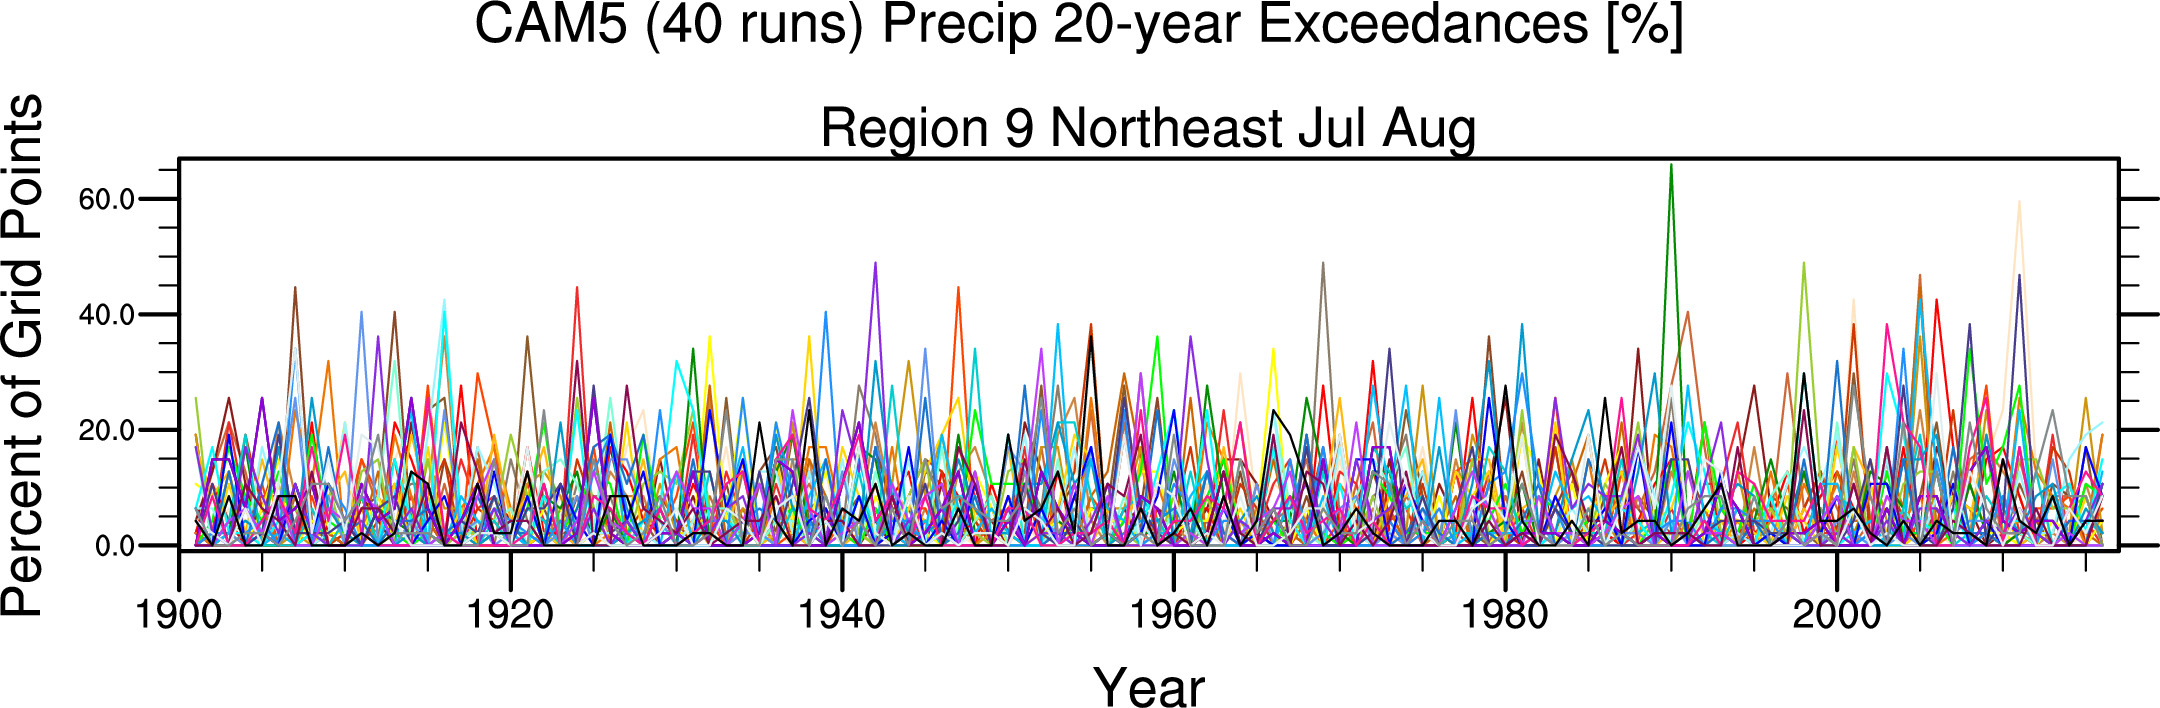
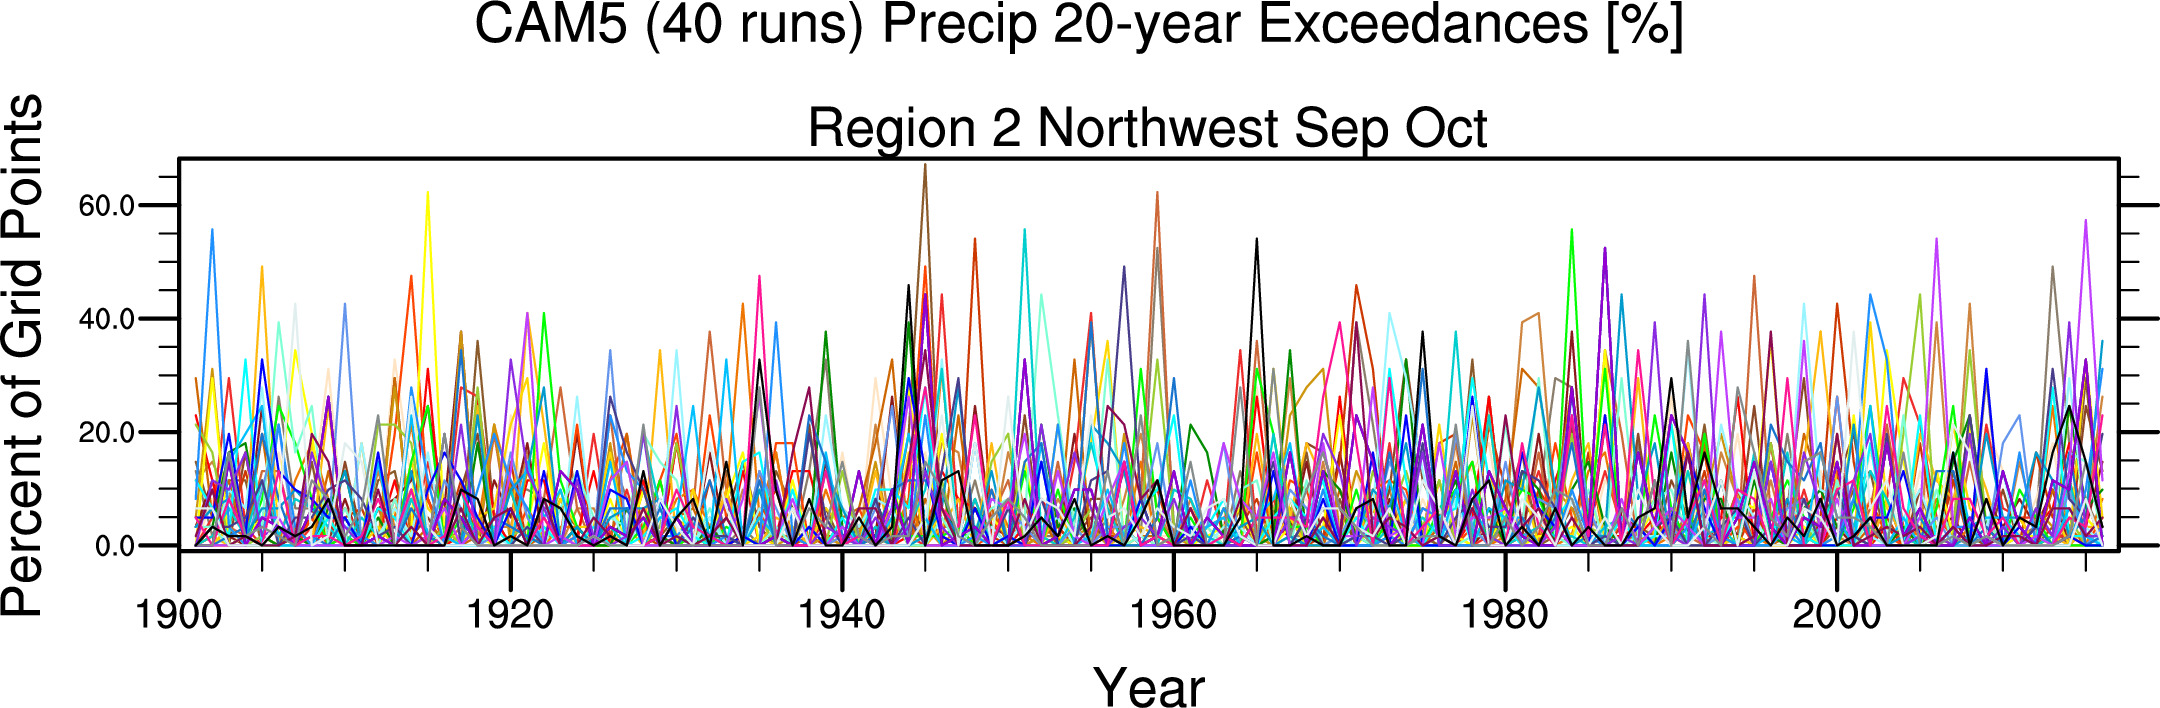
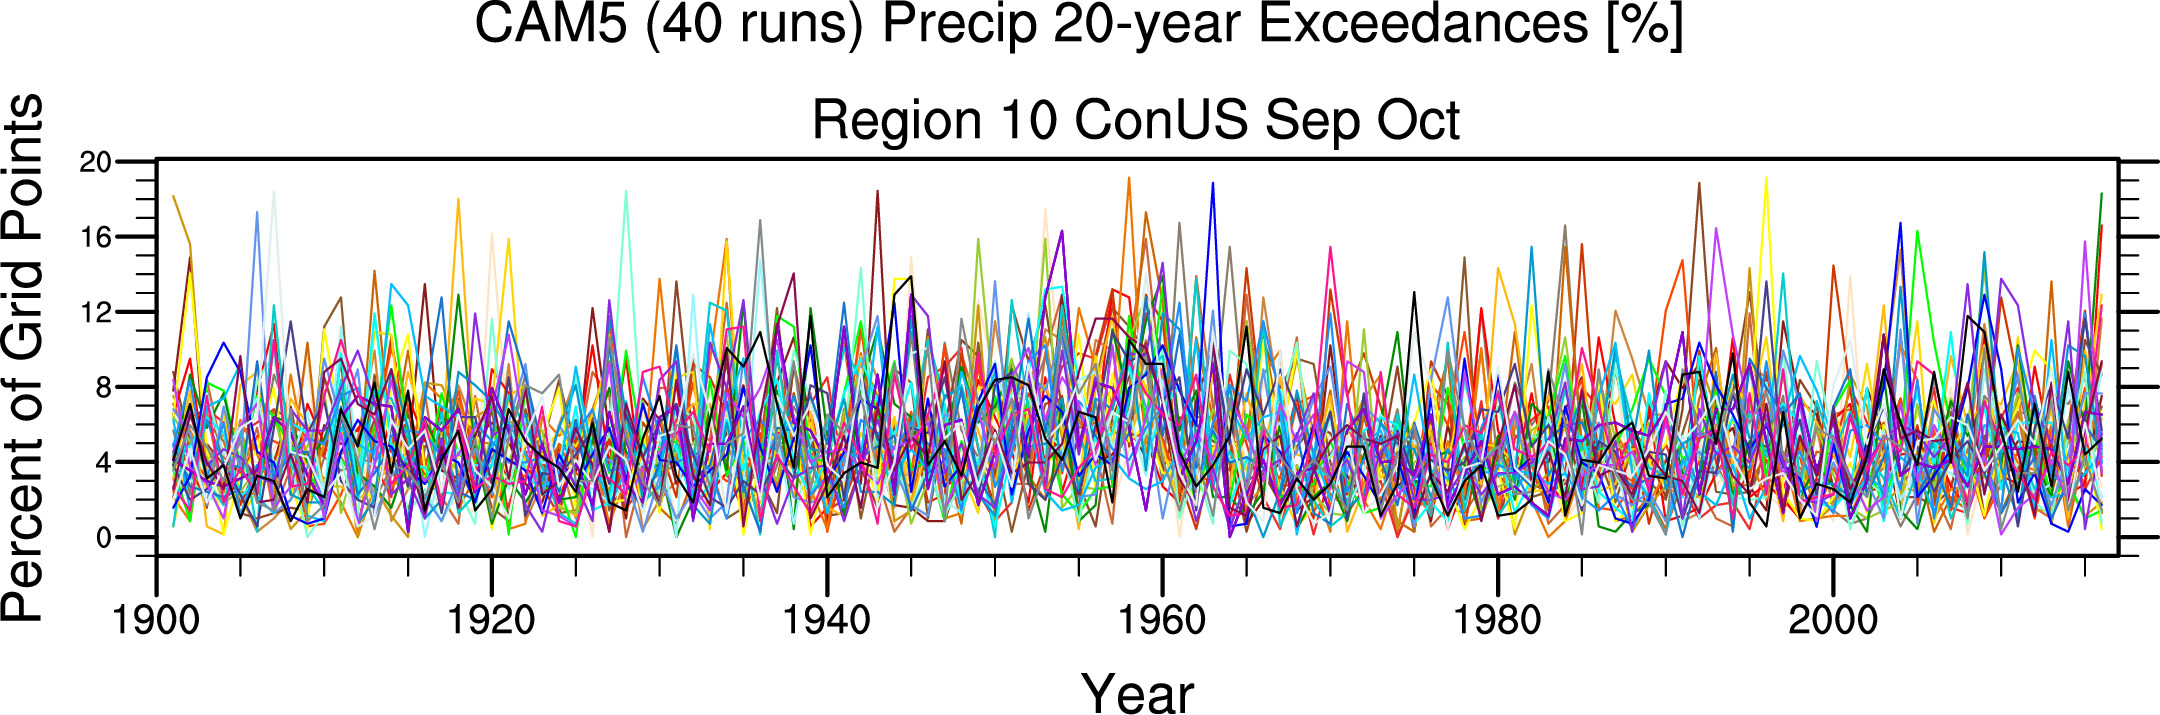
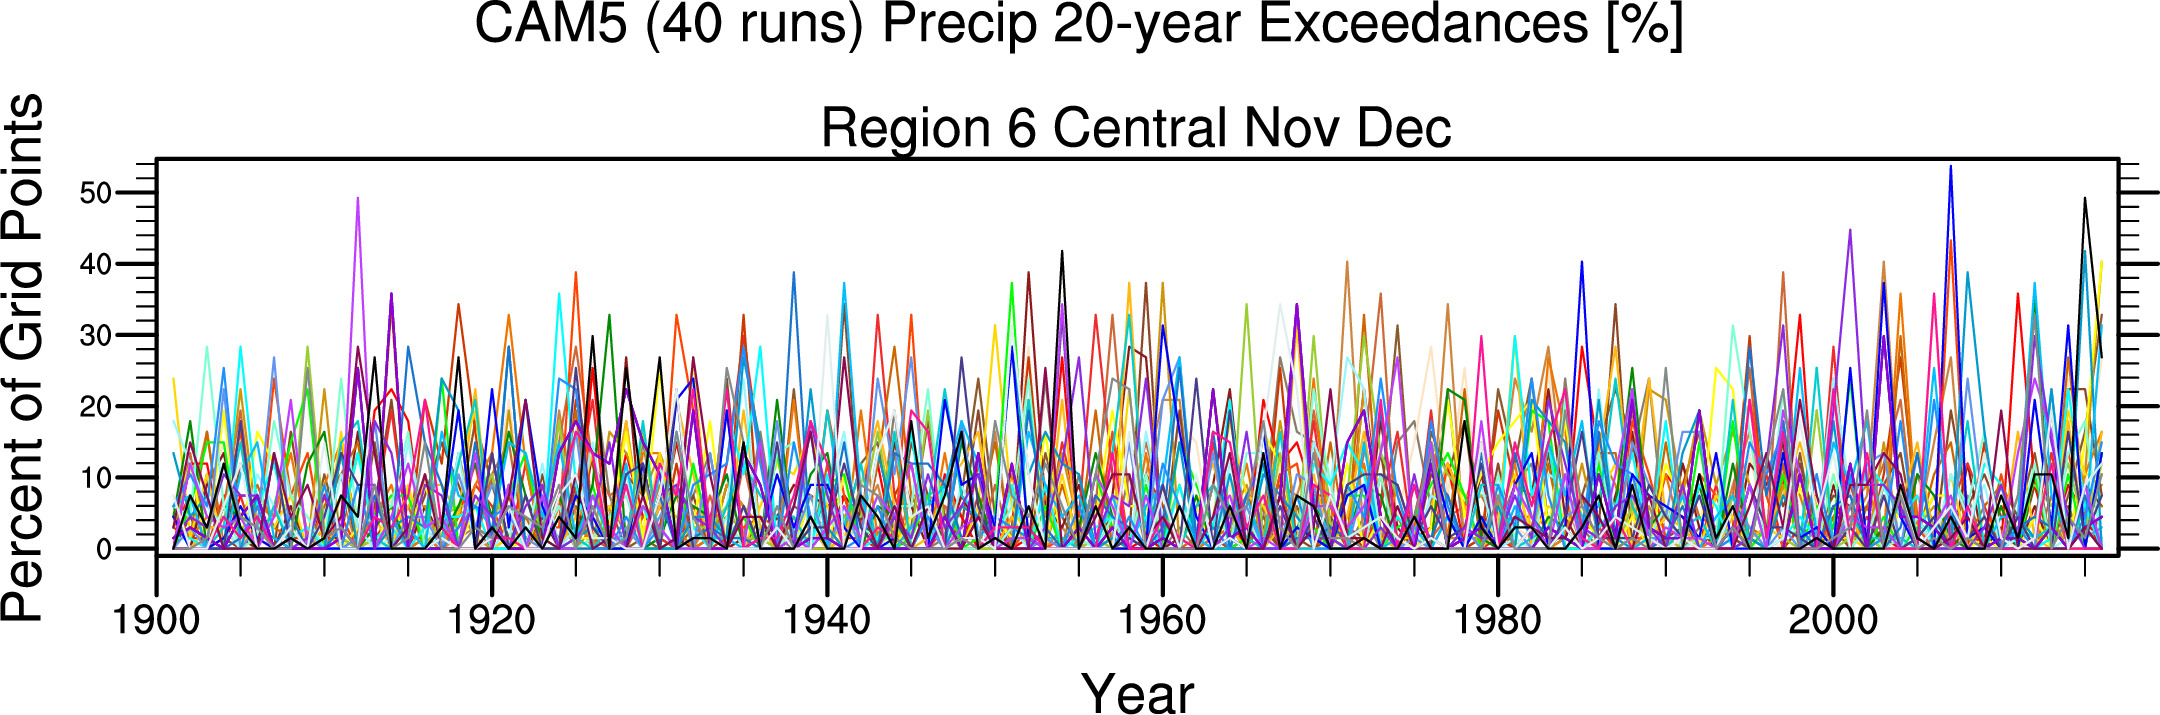
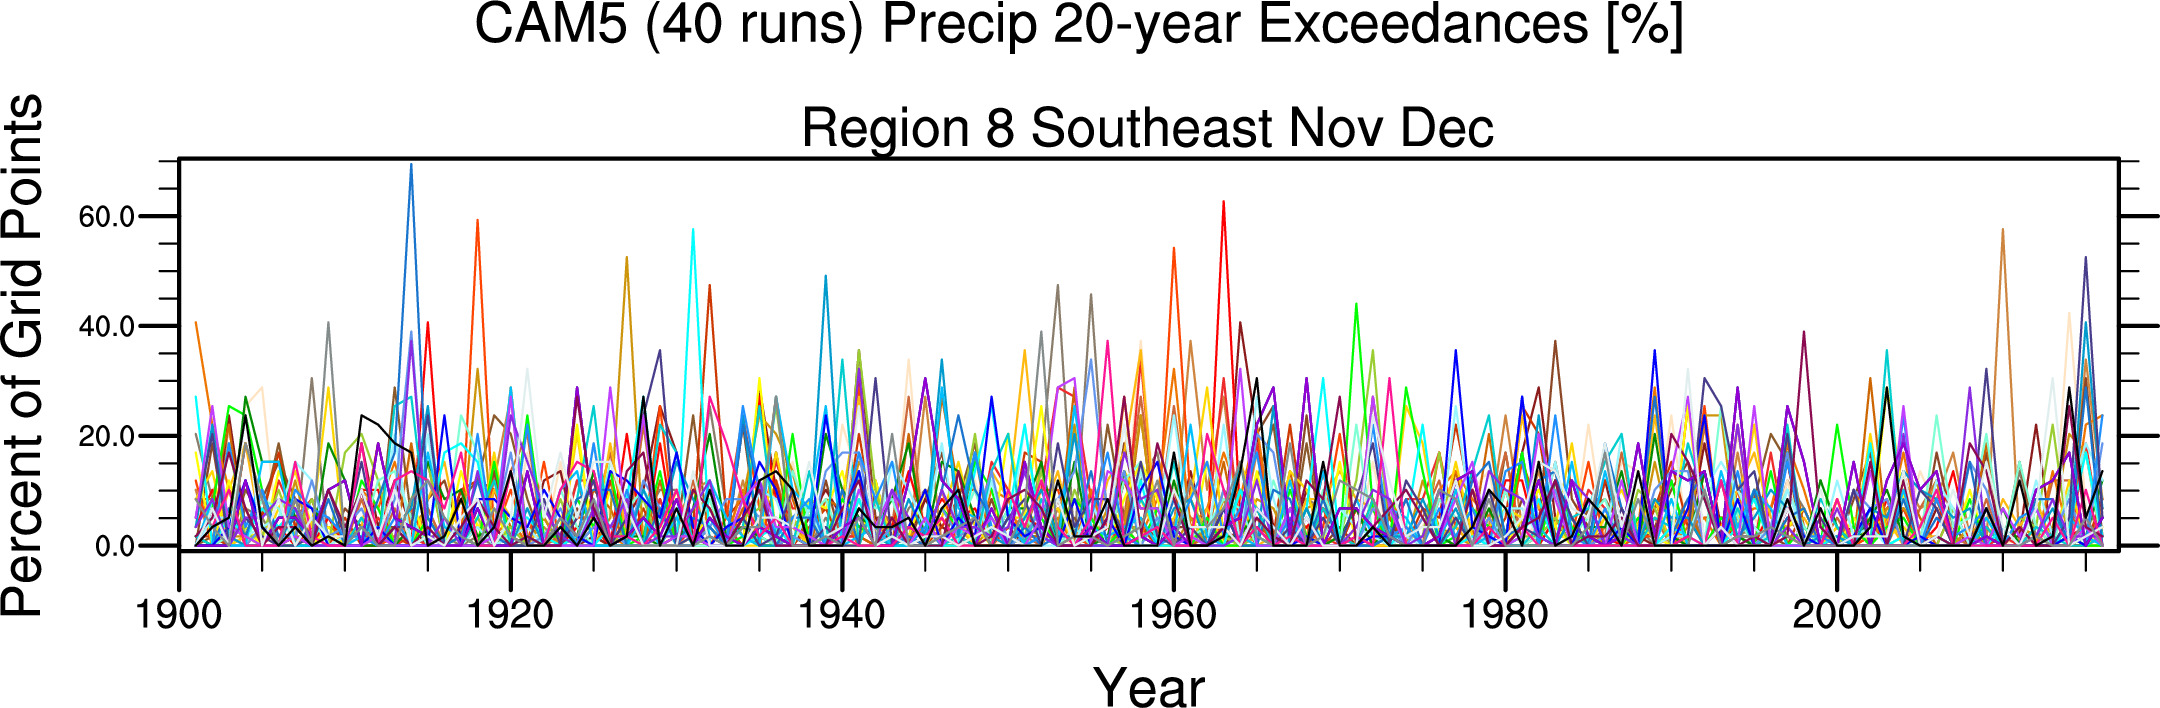
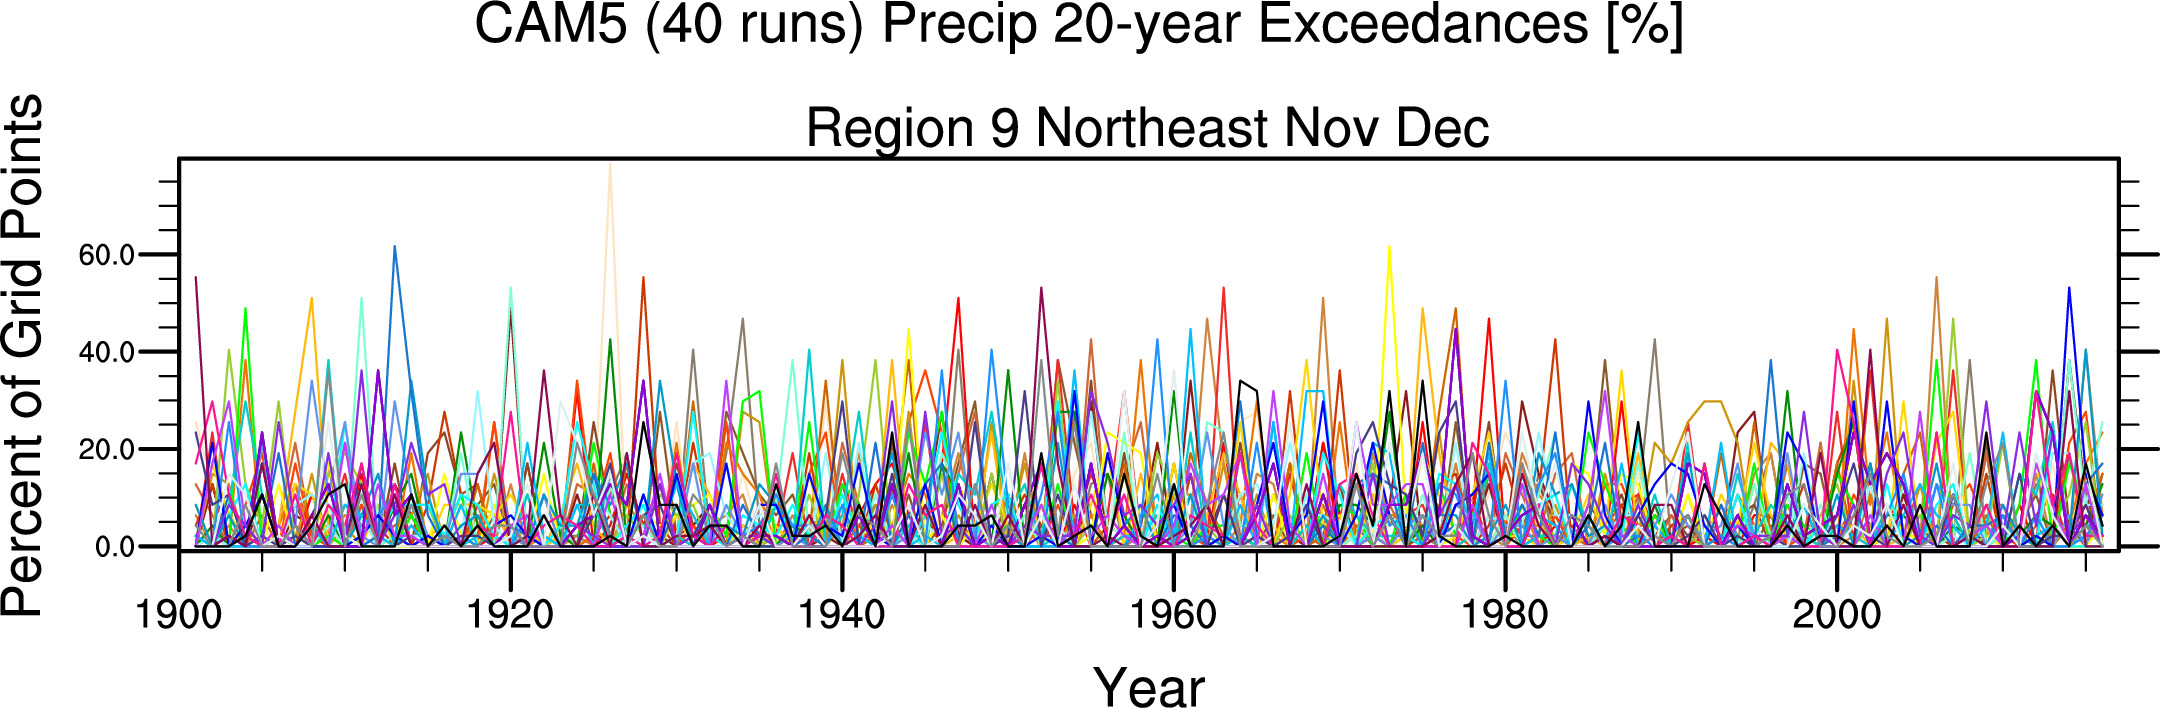
'Spaghetti' plots -- CAM5 Precip Time Series
Annual 1-in-20-year events 40 runs


Seasonal 1-in-20-year events 40 runs
2-month: Jan Feb


2-month: Mar Apr


2-month: May Jun


2-month: Jul Aug


2-month: Sep Oct


2-month: Nov Dec


maps of 1-in-20-year events here
-----------------------------------------------------------------------------------------------------------------------------------------------------------------------
1-IN-5-YEAR CASES
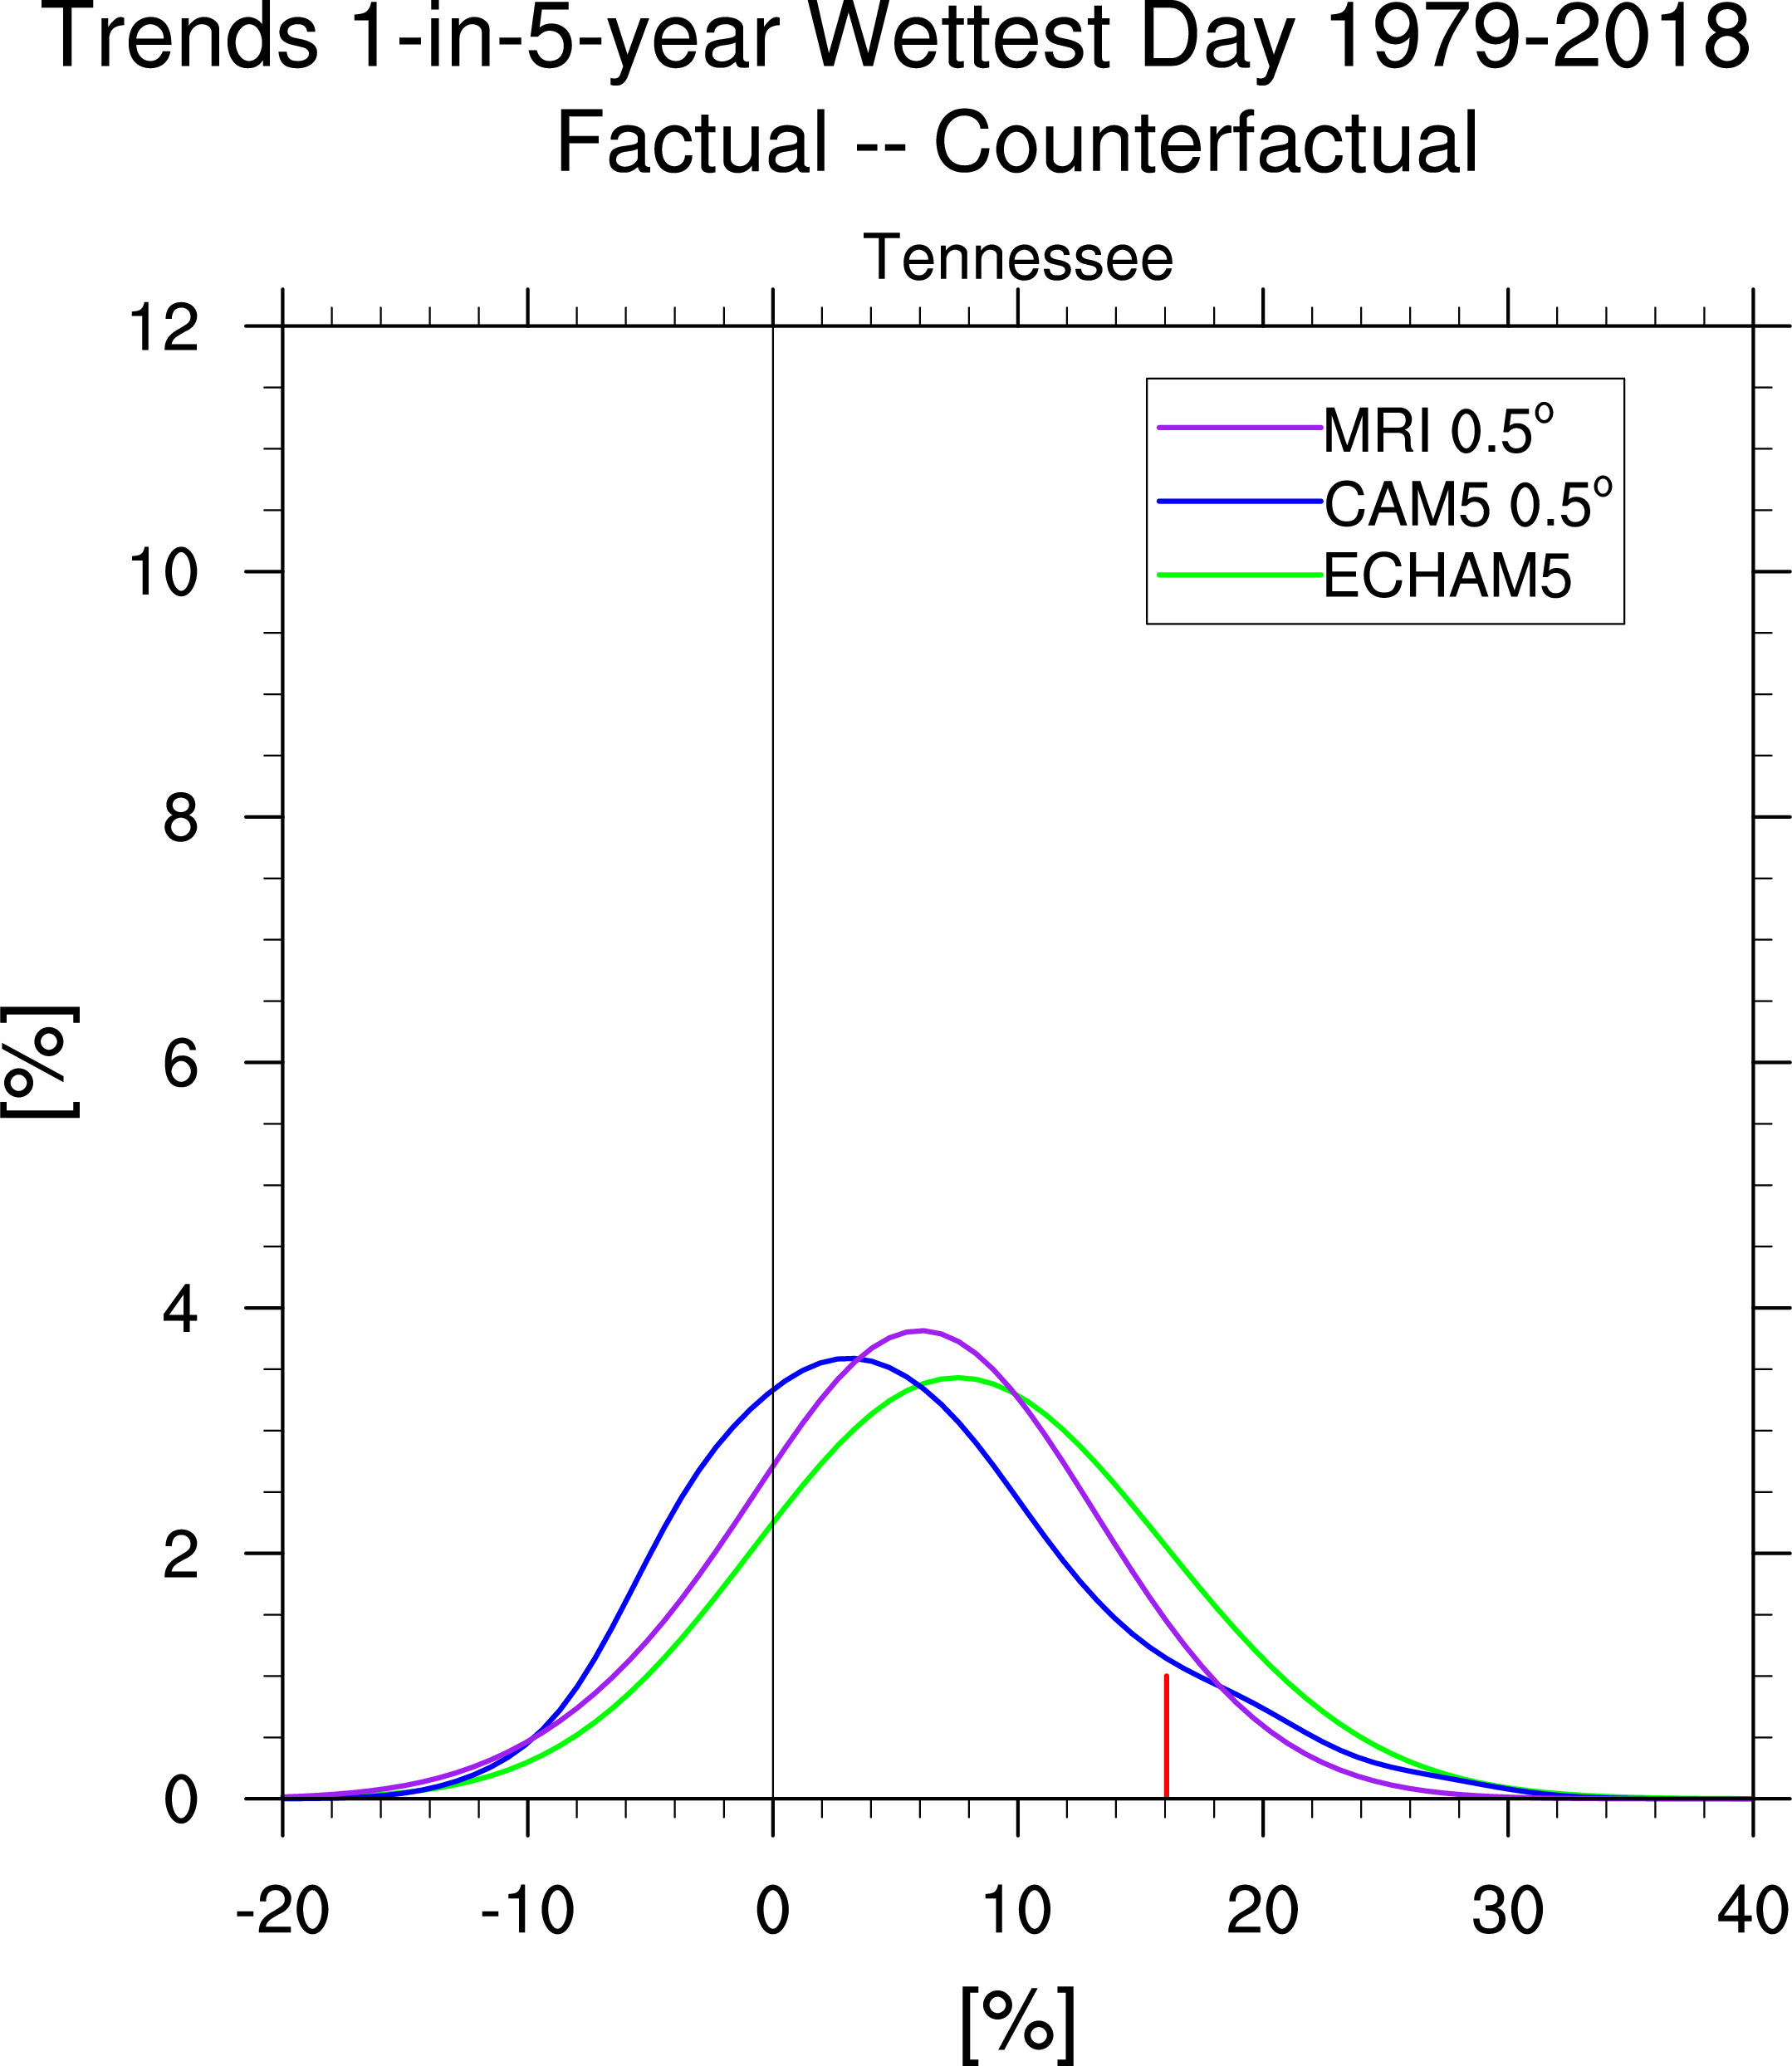
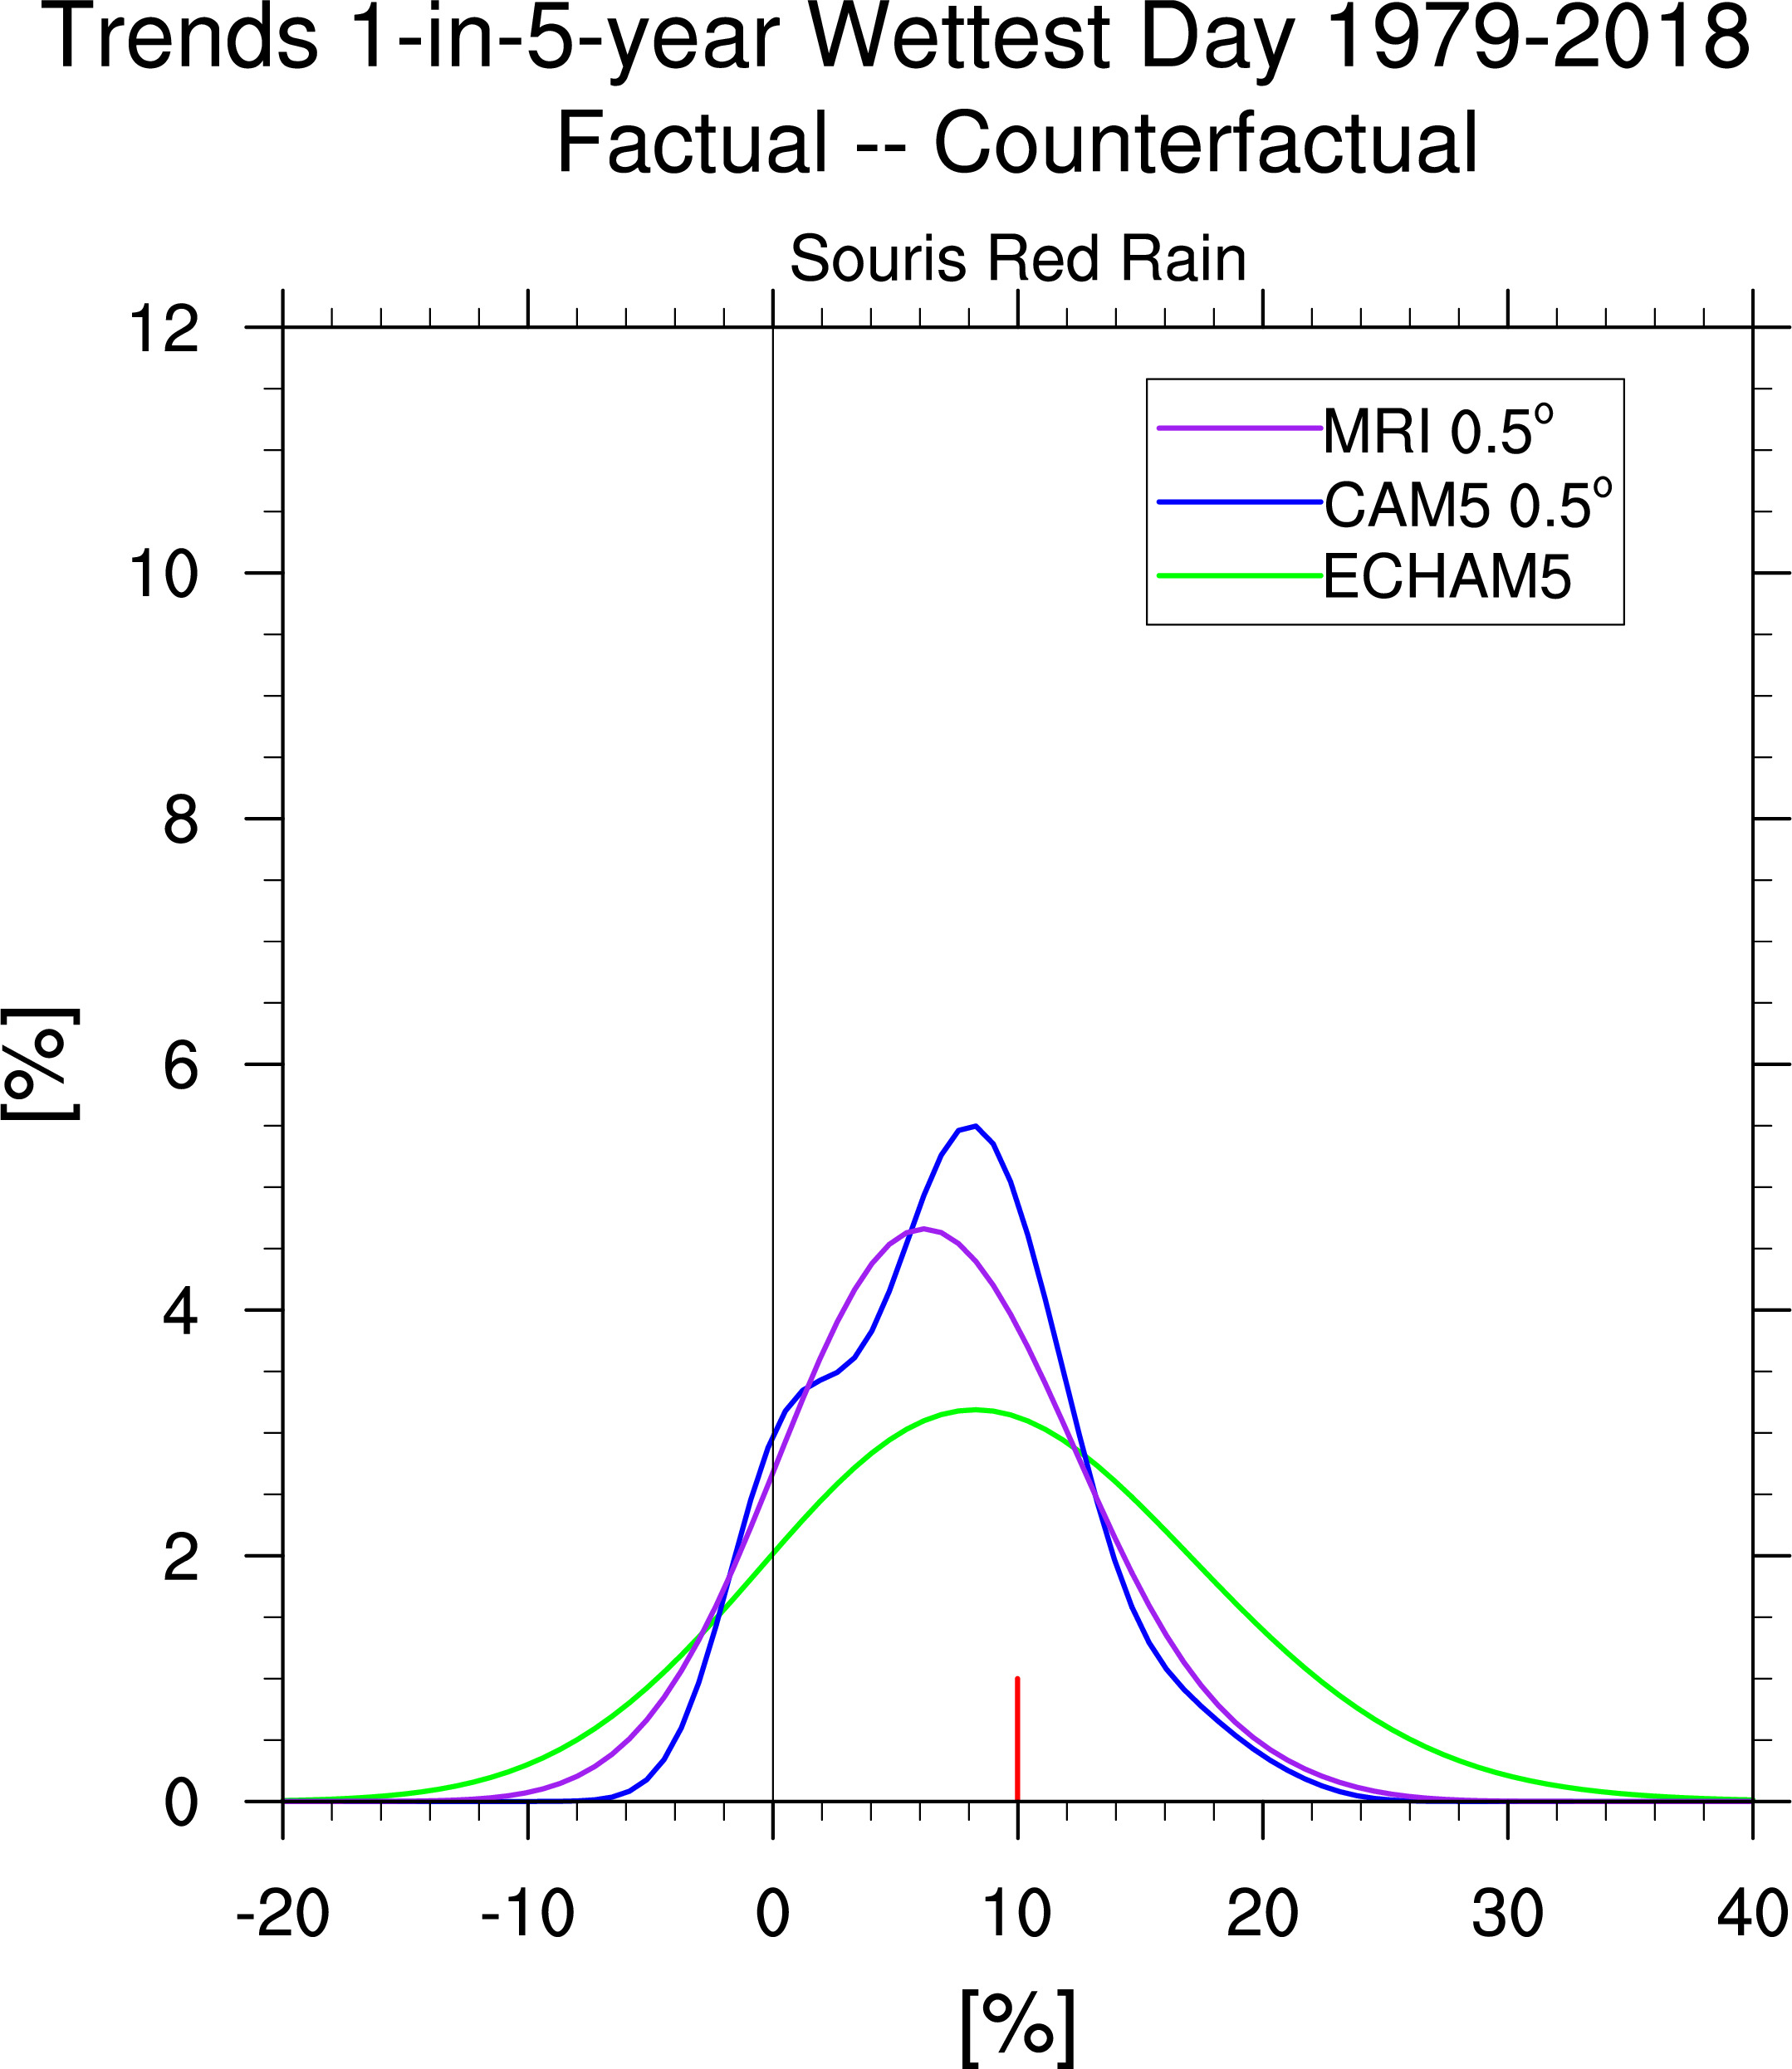
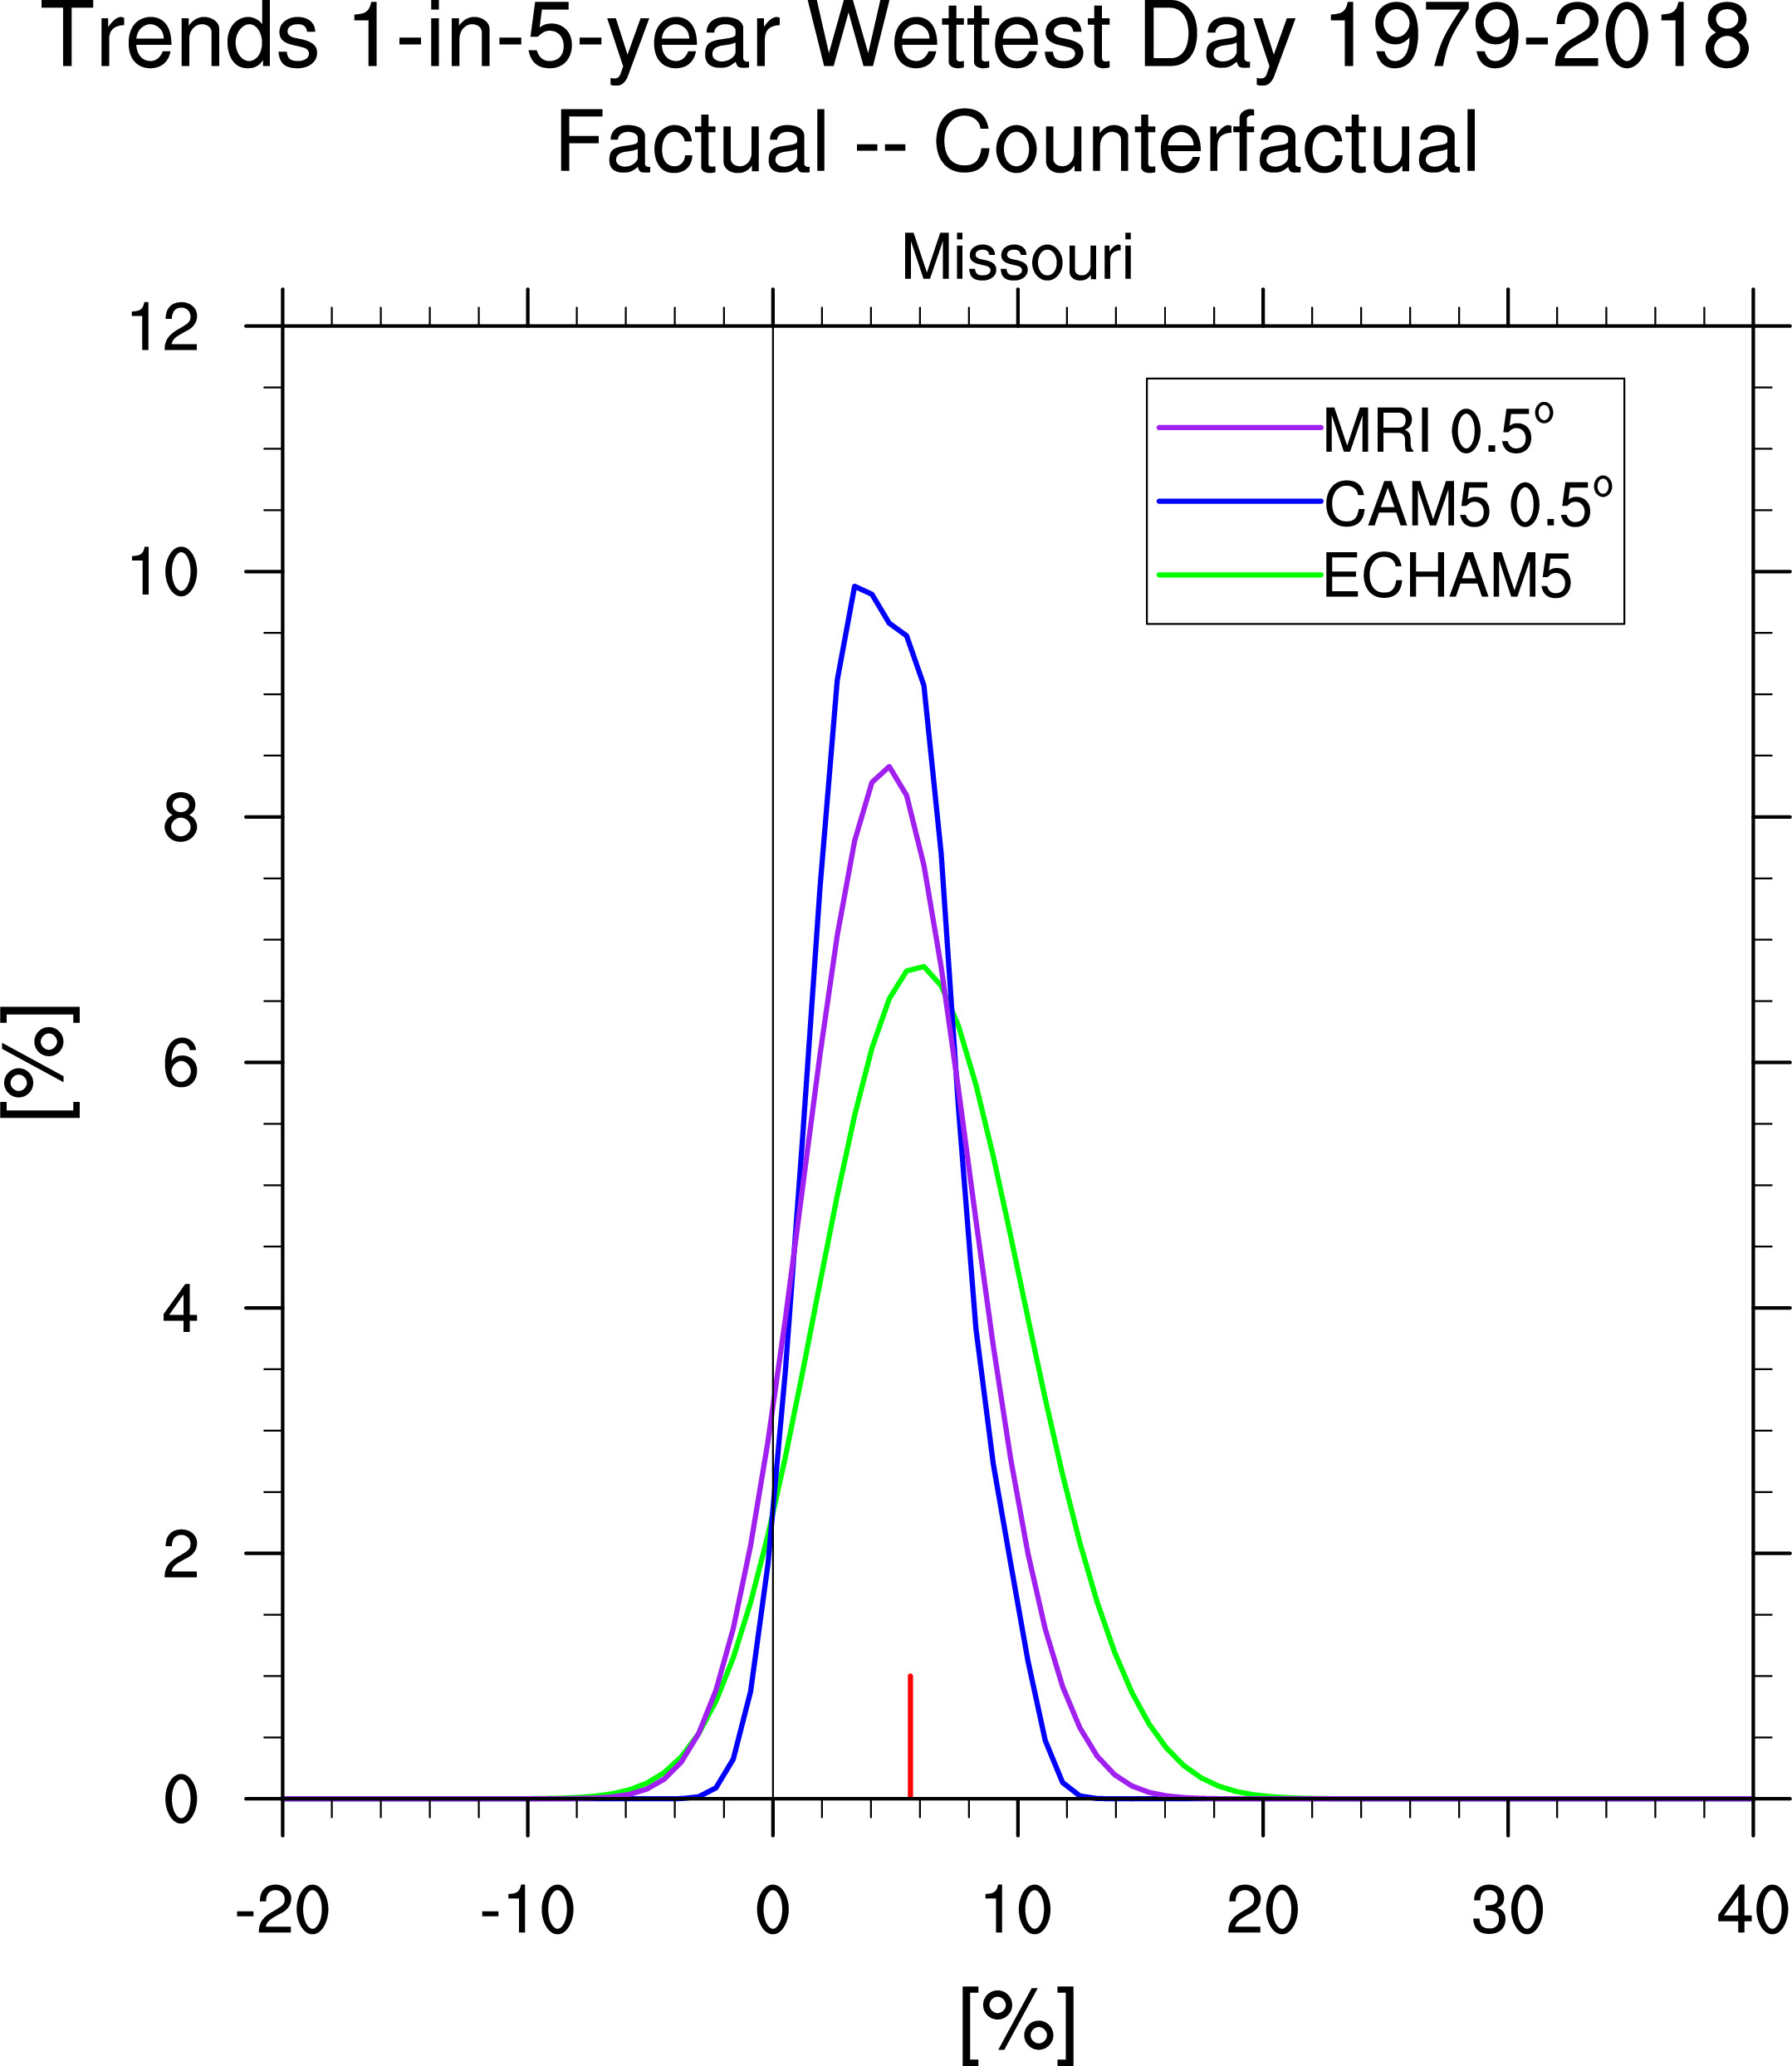
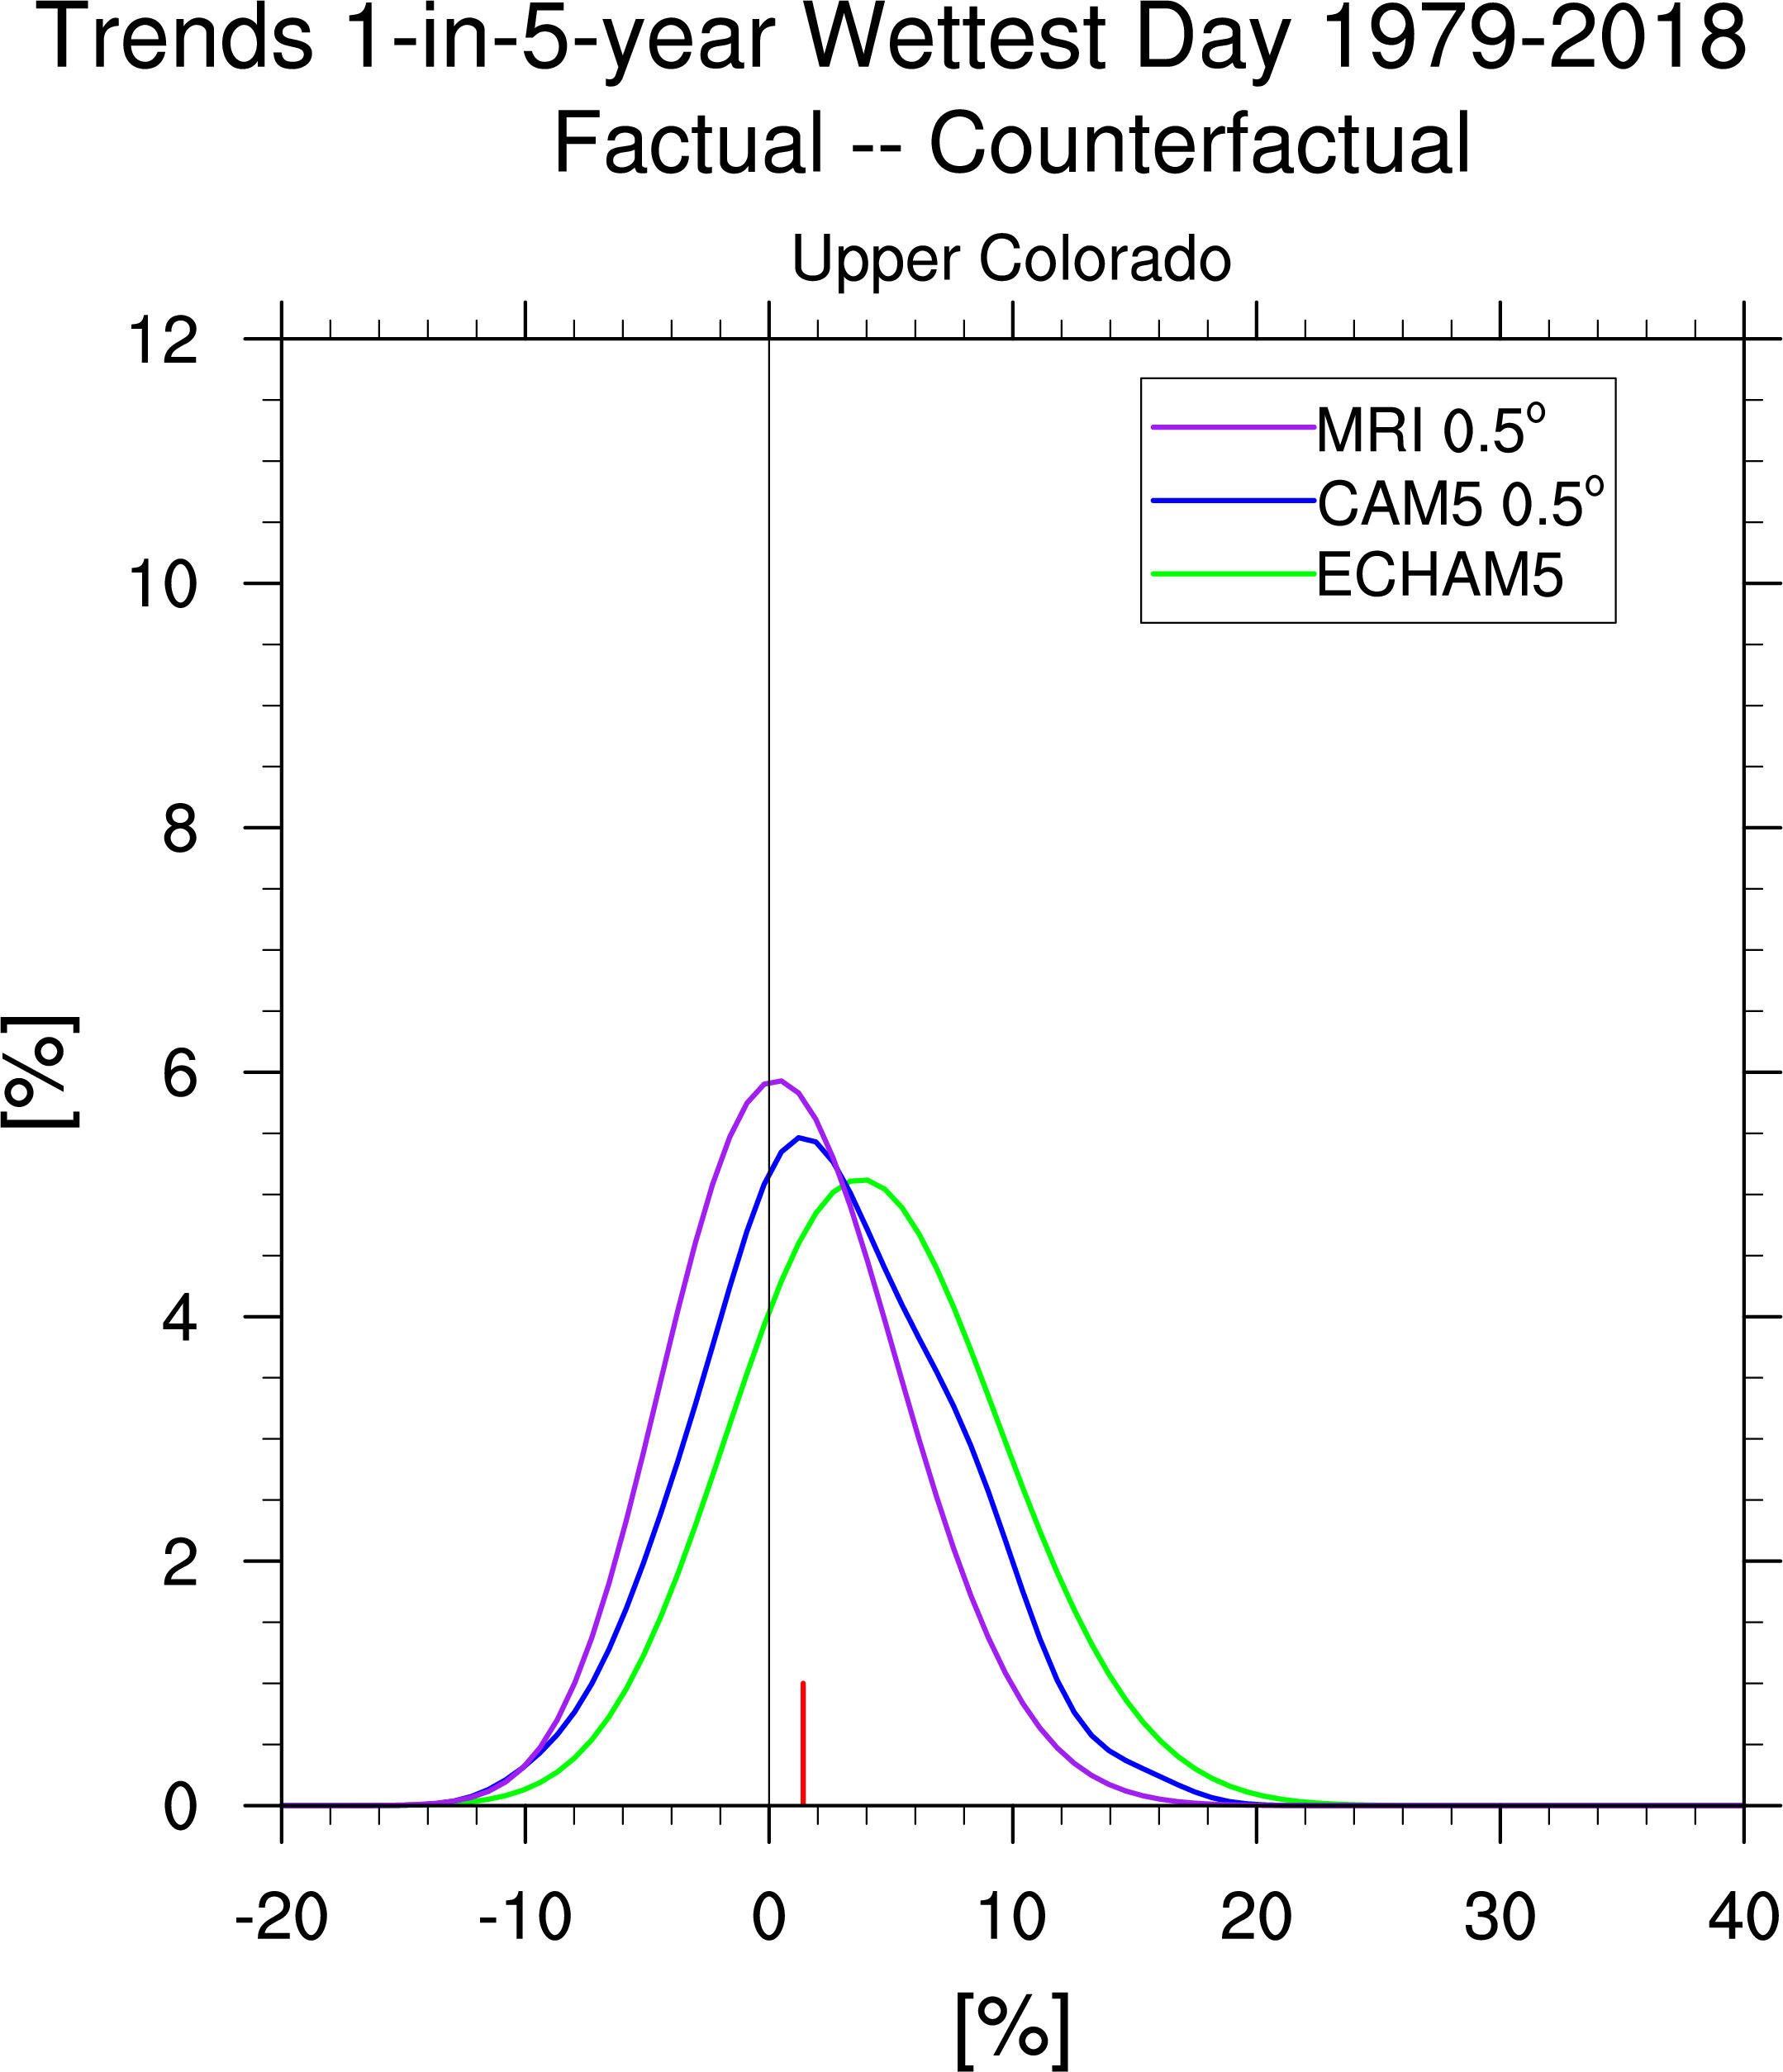
Trend Analysis 1-in-5-year Day of Year Factual versus Counterfactual 1979-2018 yields 8 cases
18 River Basins
Three Models


J. Eischeid

J. Eischeid

J. Eischeid
Observations Extreme Precipitation Climatologies
CPC

Boston: 95.3154 NOLA: 164.241 Denver: 47.8143
---------------------------
Model Extreme Precipitation Climatologies 1981-2010
CAM

5y: Boston: 95.1109 NOLA: 142.336 Denver: 57.4552


5-yr Factual: Boston: 96.4559 NOLA: 145.394 Denver: 58.1137 nbsp; 5-yr CounterFactual: Boston: 93.7658 NOLA: 139.279 Denver: 56.7967

5y: Boston: 81.5097 NOLA: 88.825 Denver: 37.9505


5-yr Factual: Boston: 82.3597 NOLA: 89.5845 Denver: 37.7499 5-yr CounterFactual: Boston: 80.6597 NOLA: 88.0655 Denver: 38.1511
ECHAM

5y: Boston: 97.459 NOLA: 119.871 Denver: 54.4421


5-yr Factual: Boston: 98.8441 NOLA: 124.95 Denver: 54.7565 5-yr CounterFactual: Boston: 96.074 NOLA: 114.793 Denver: 54.1278
----------------------------------------------------------------------------------
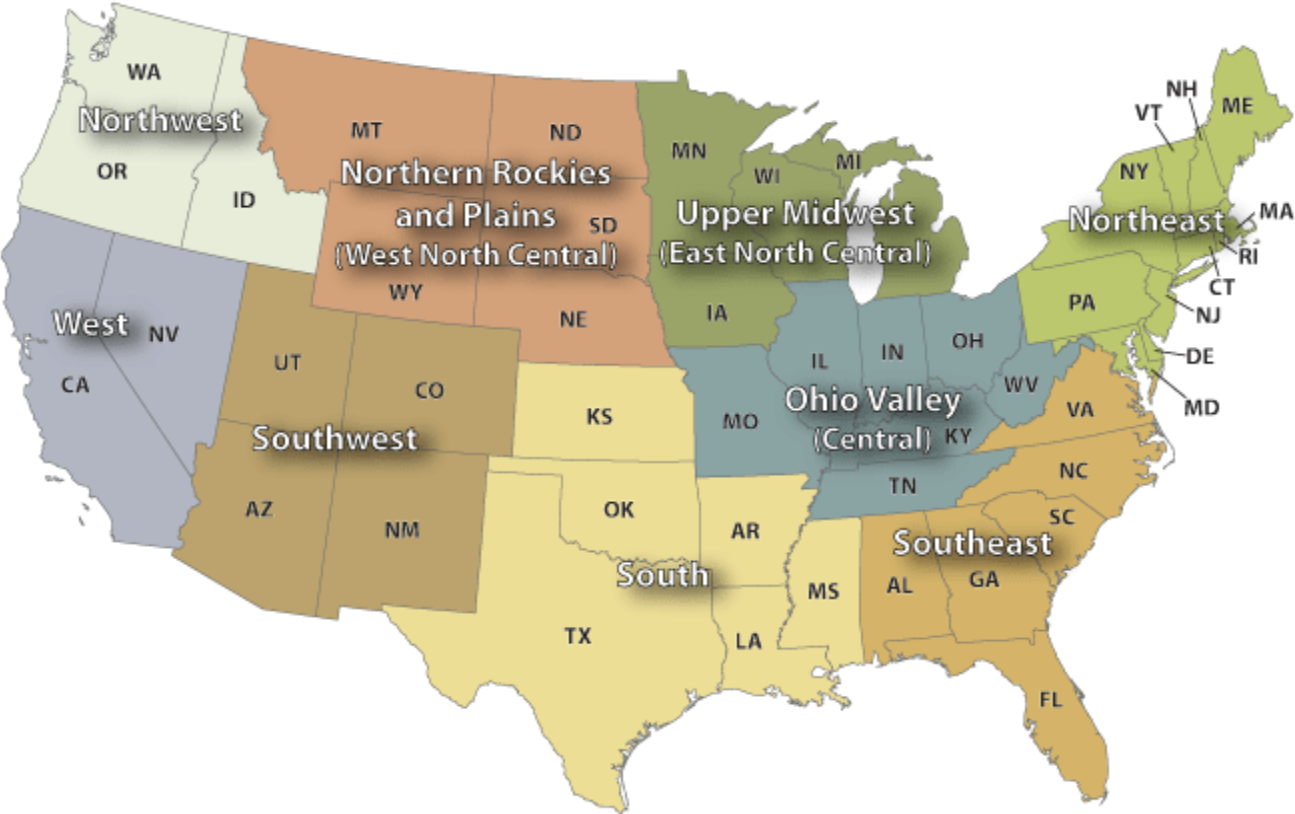
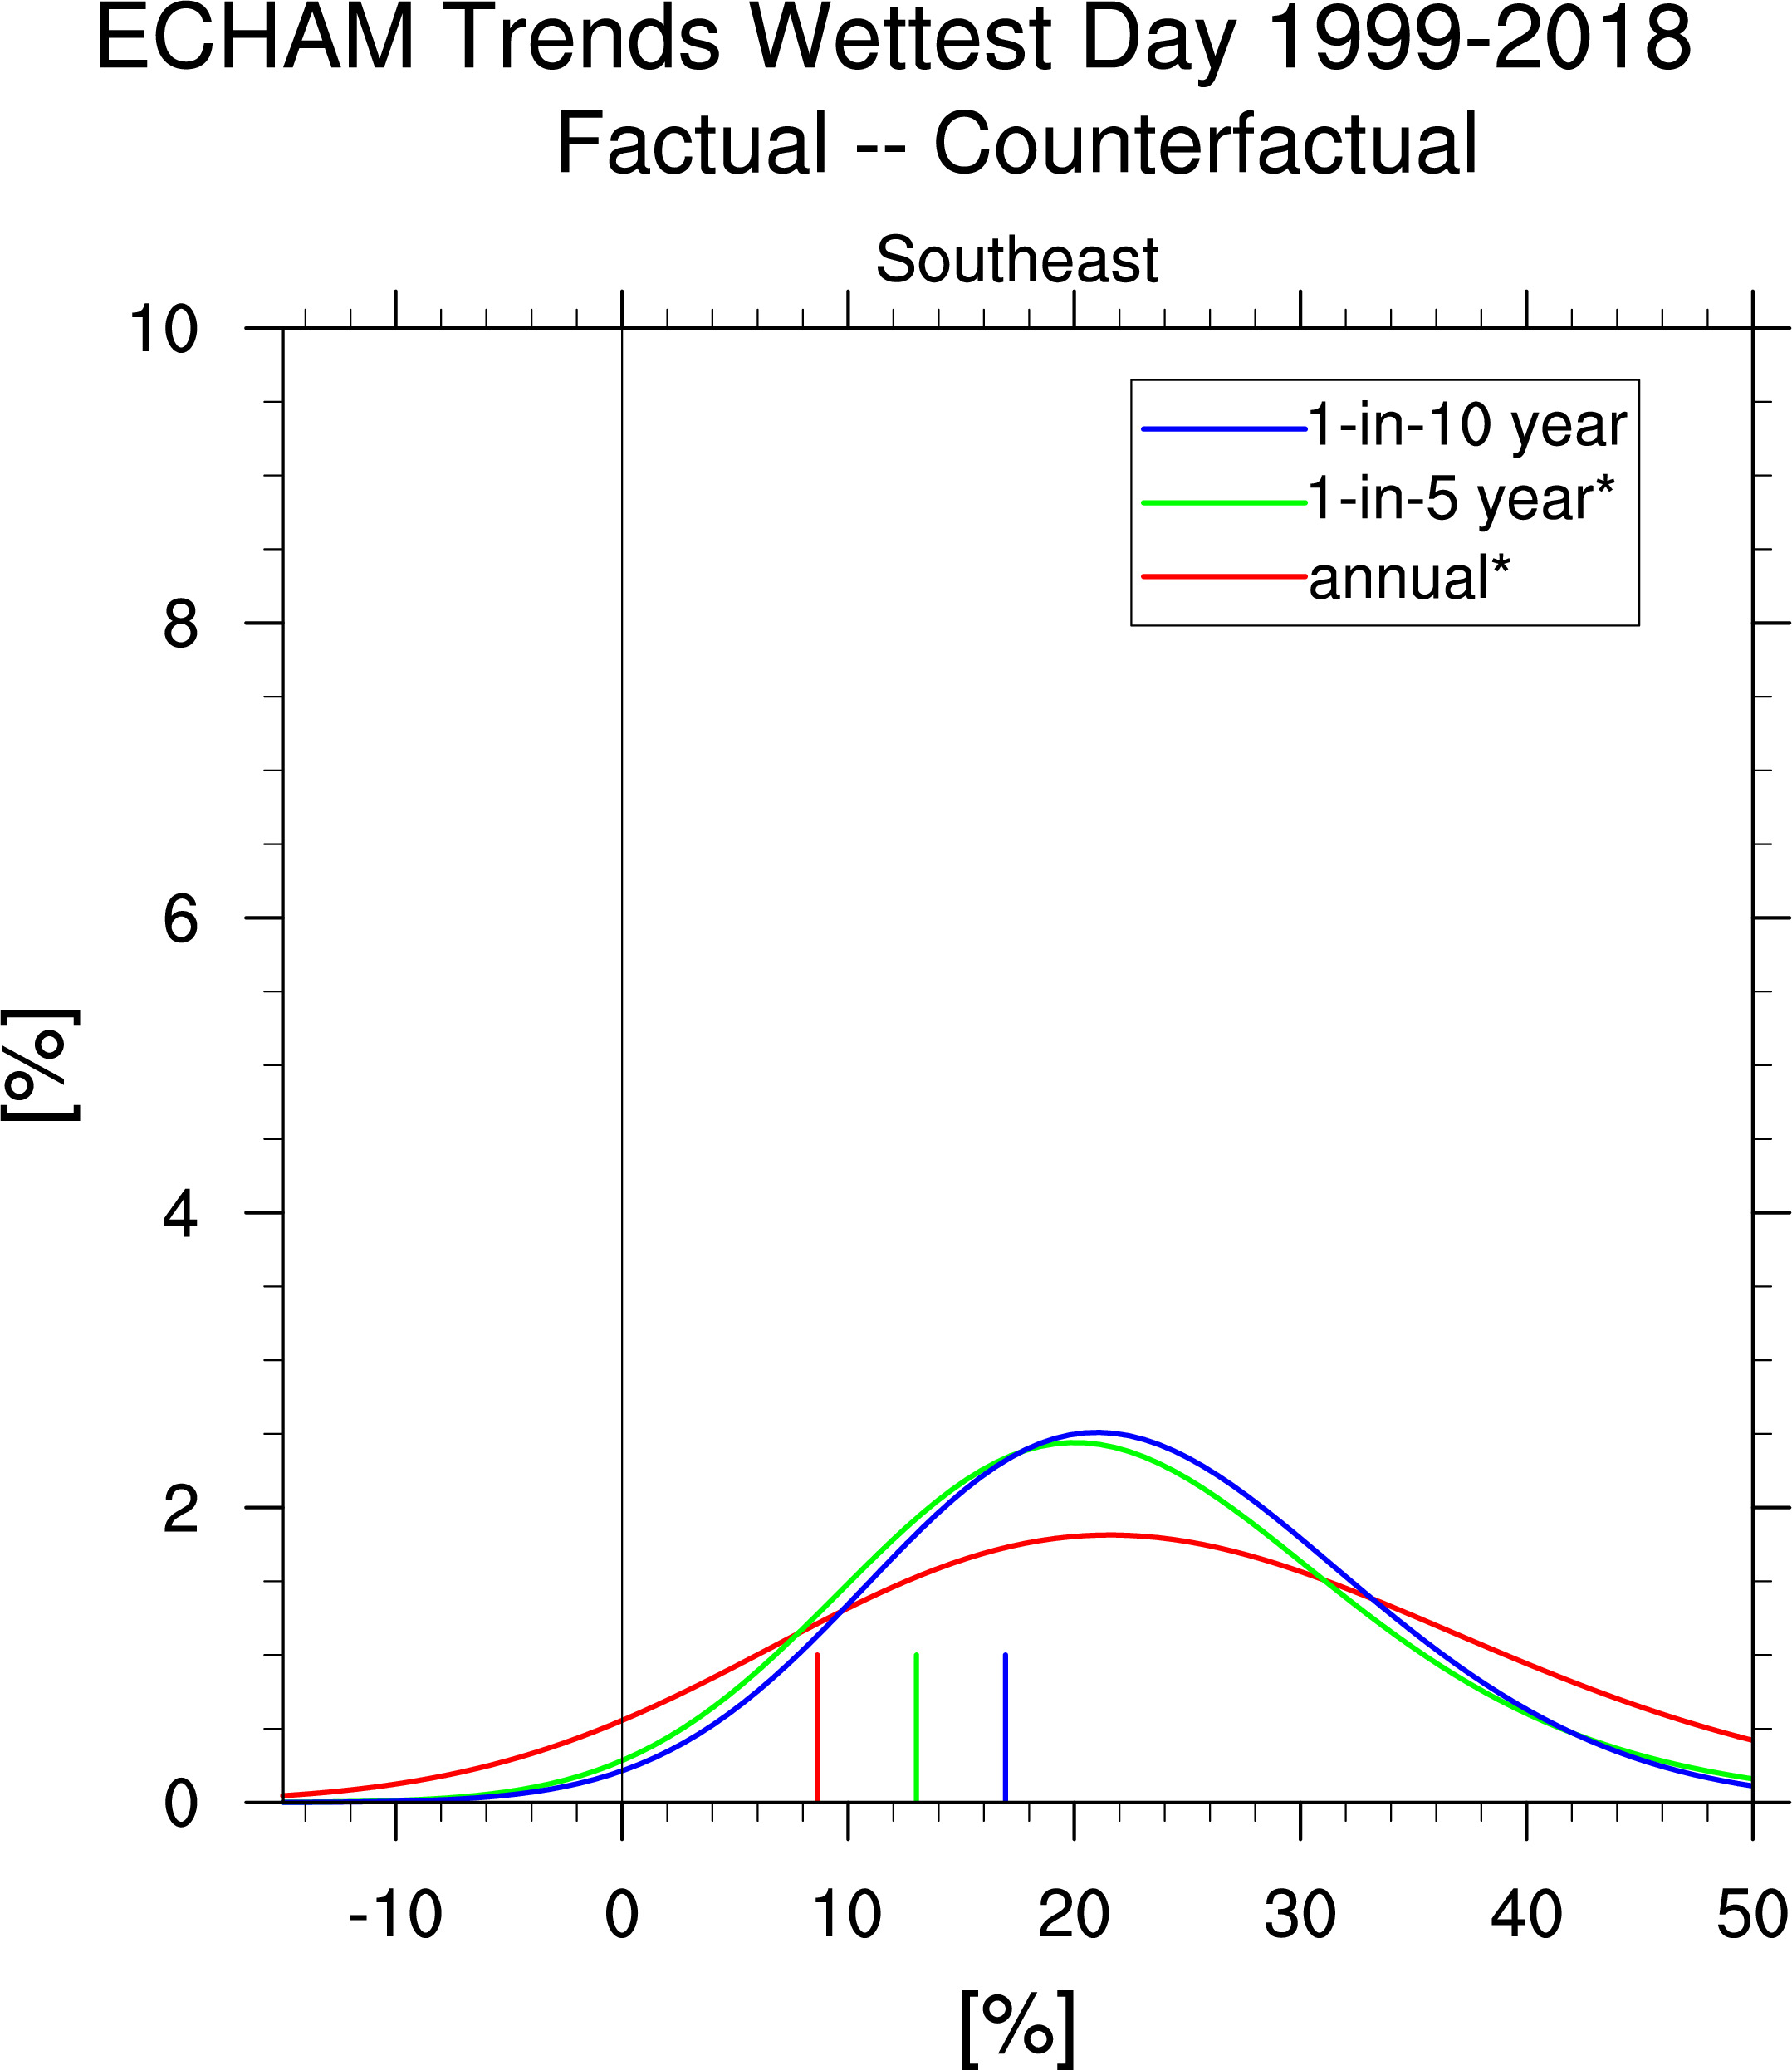
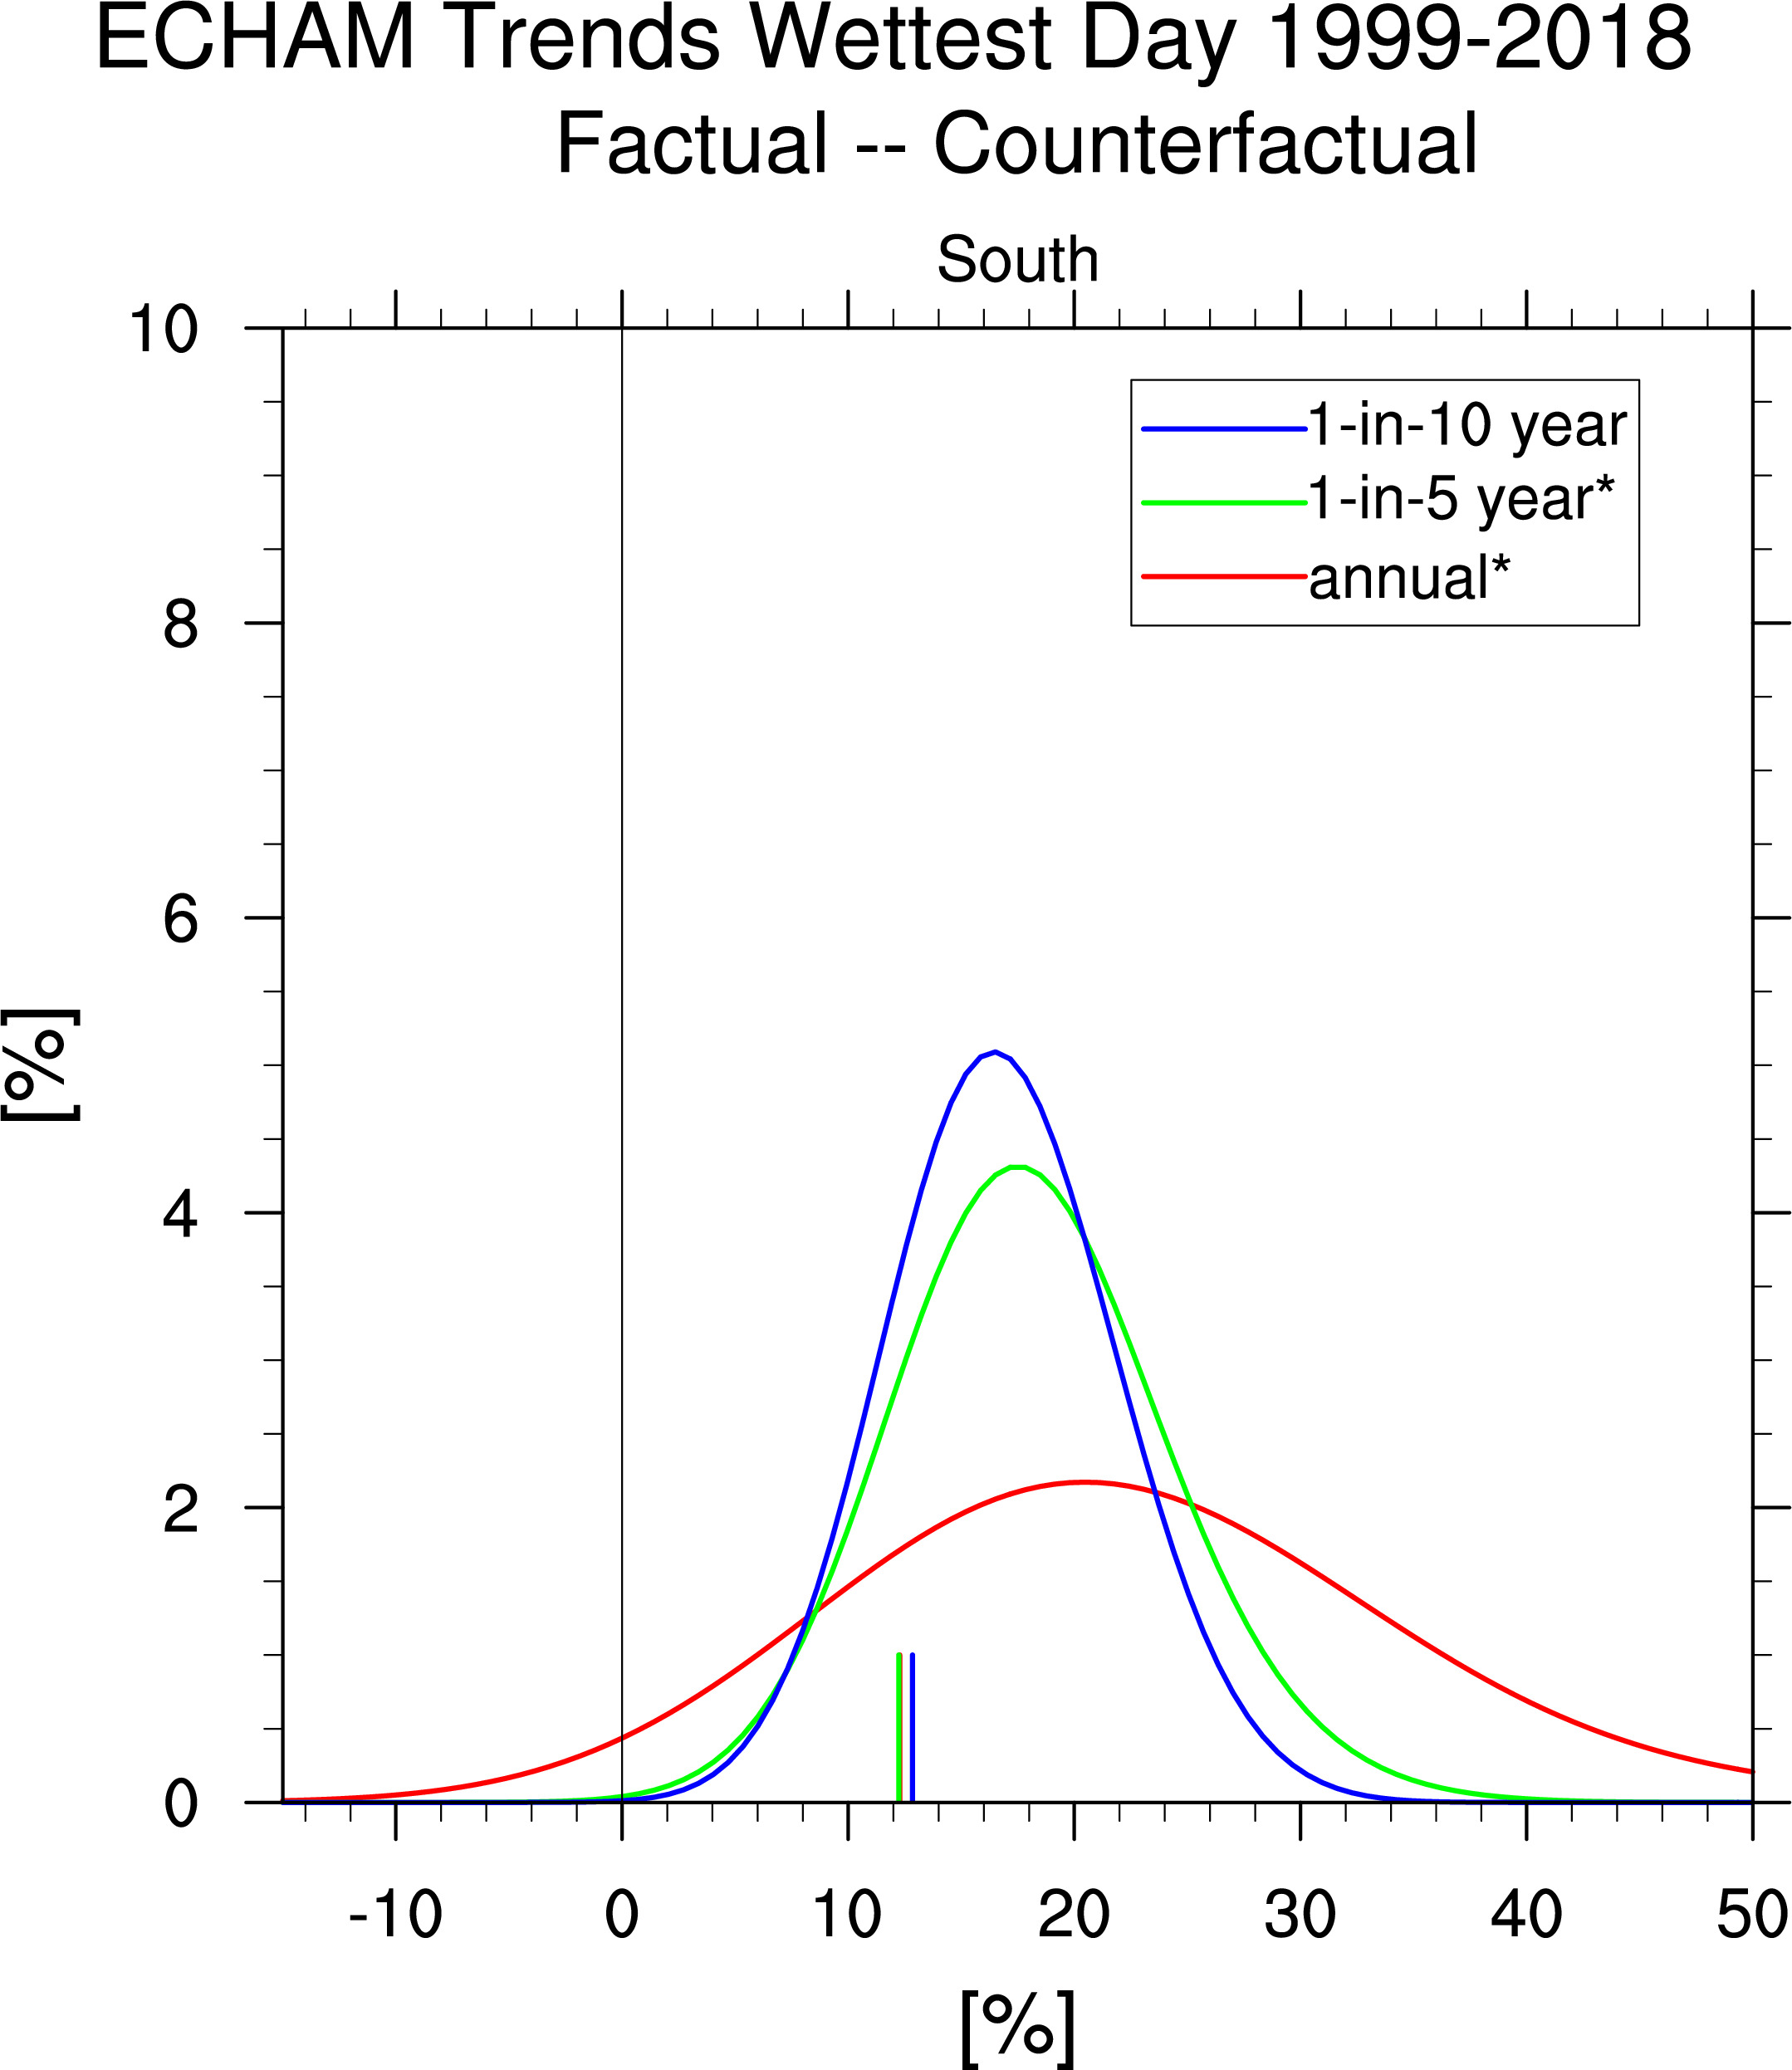
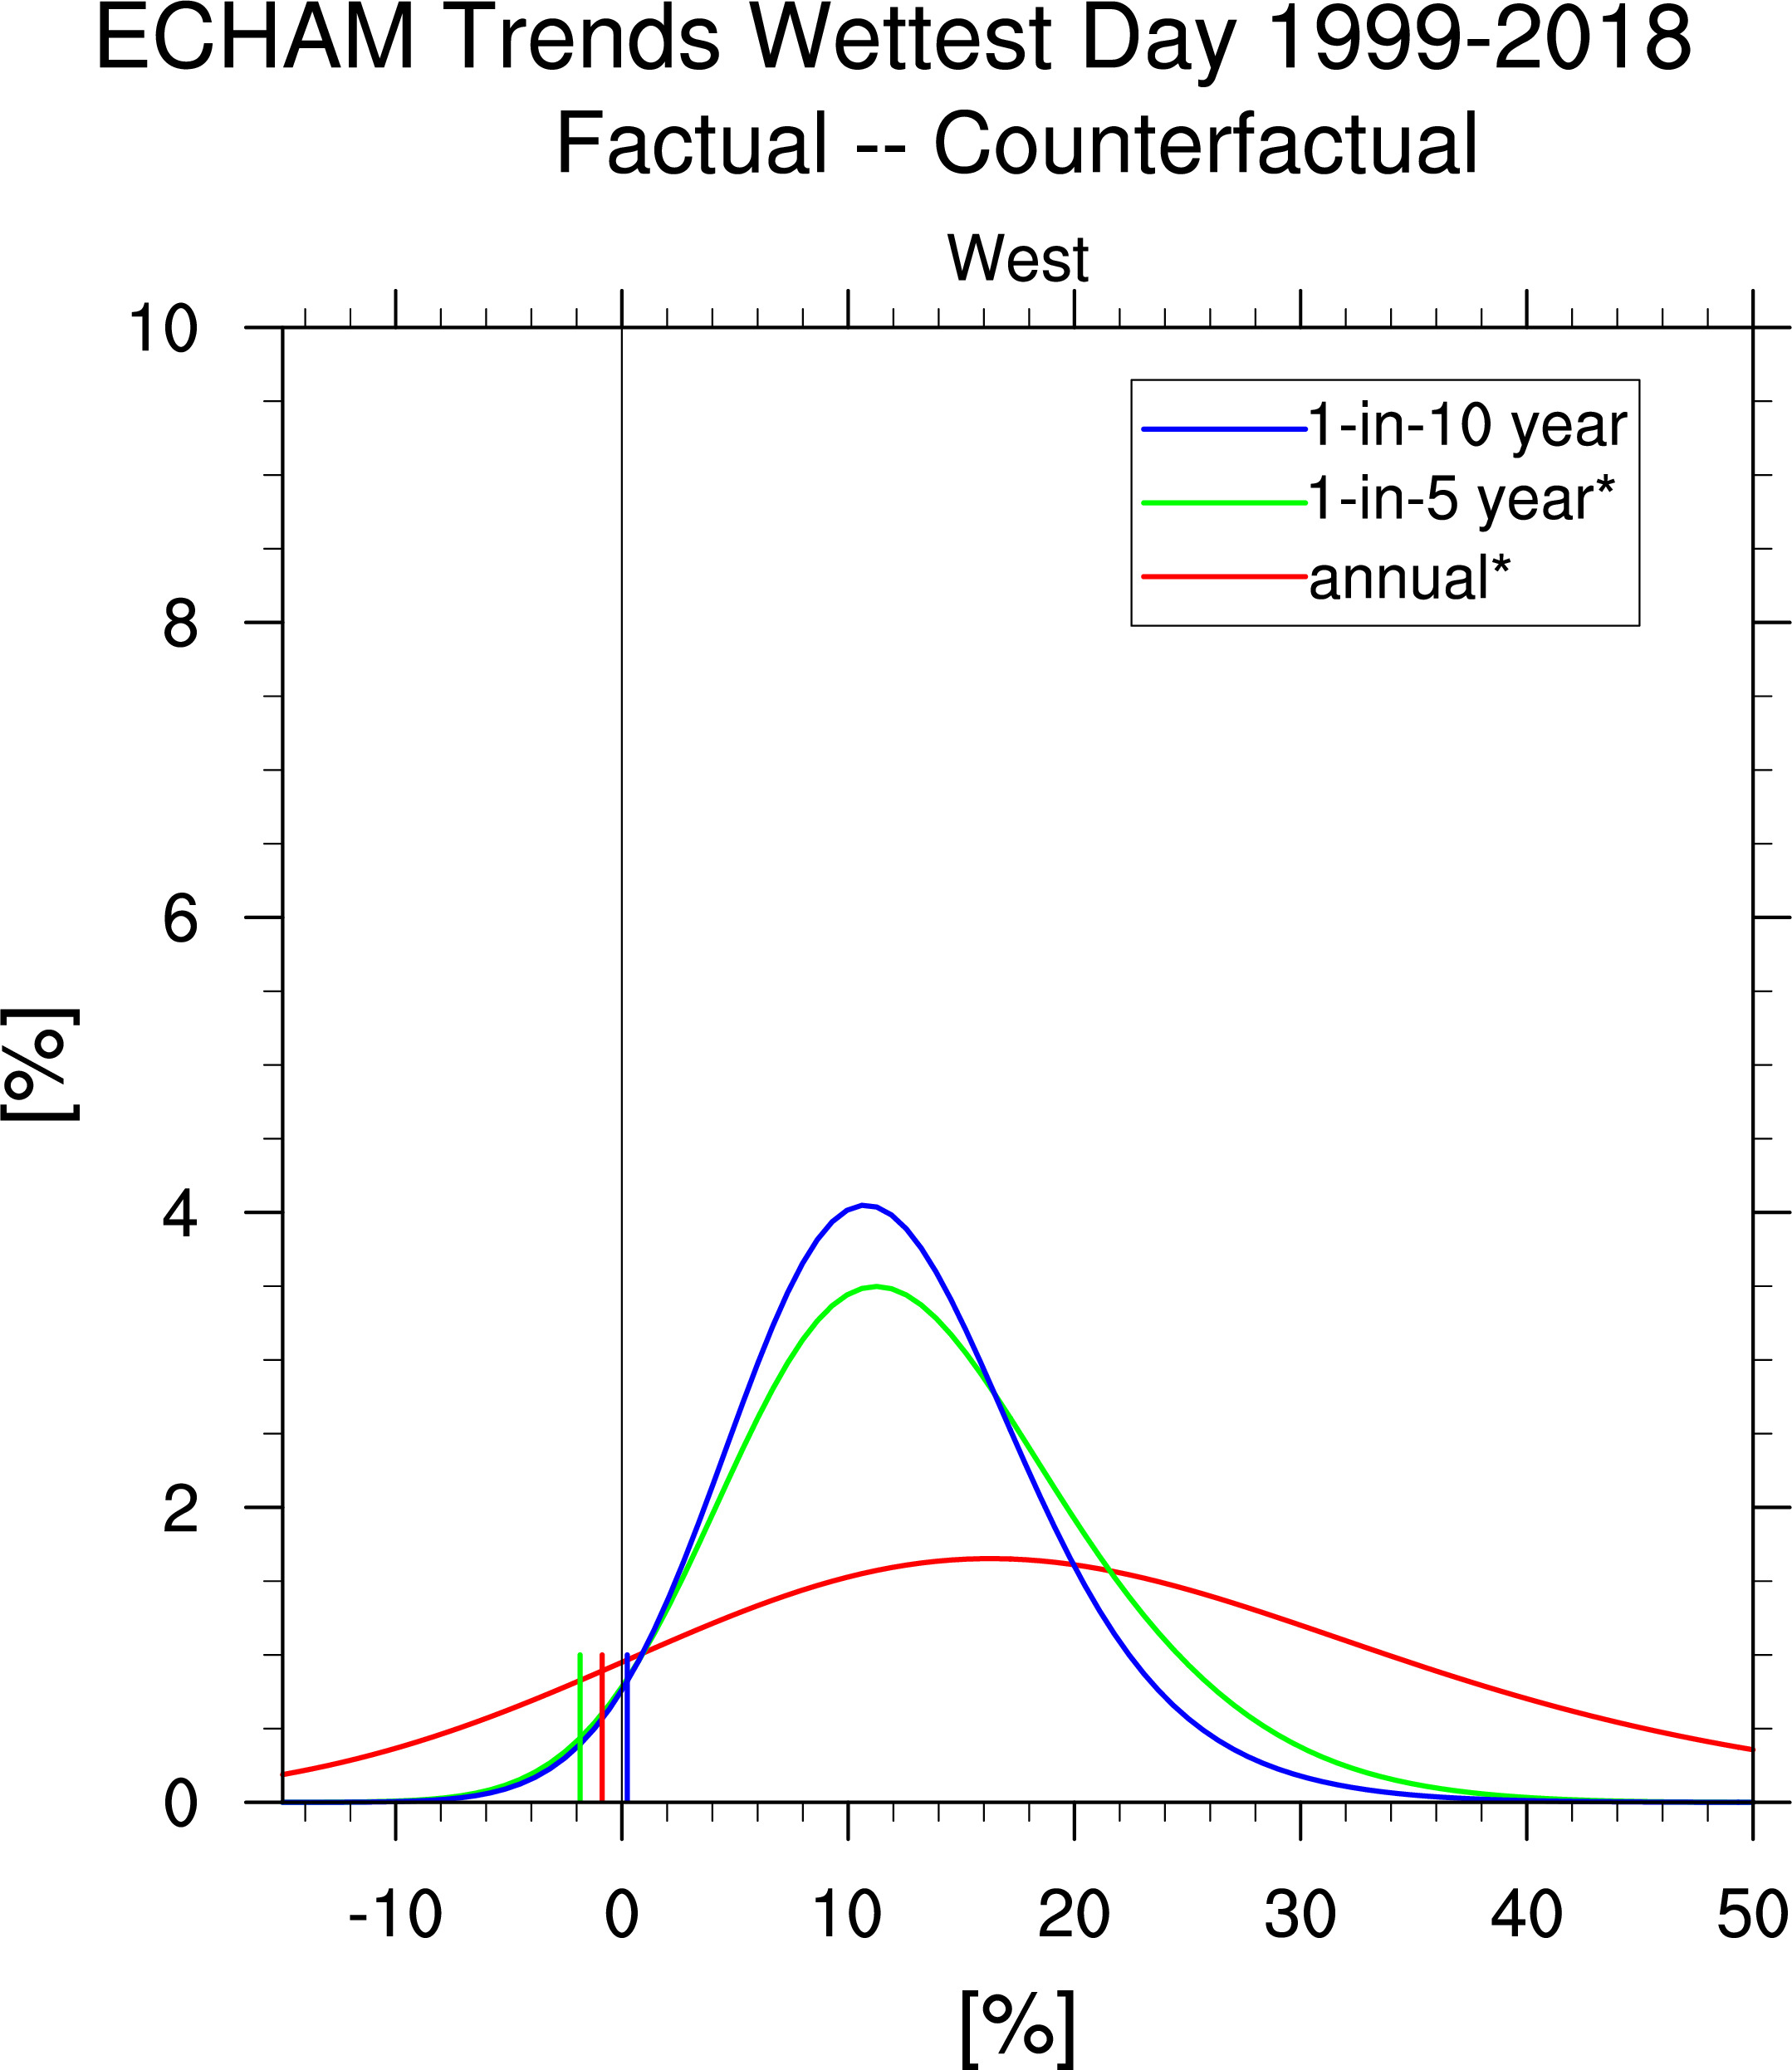
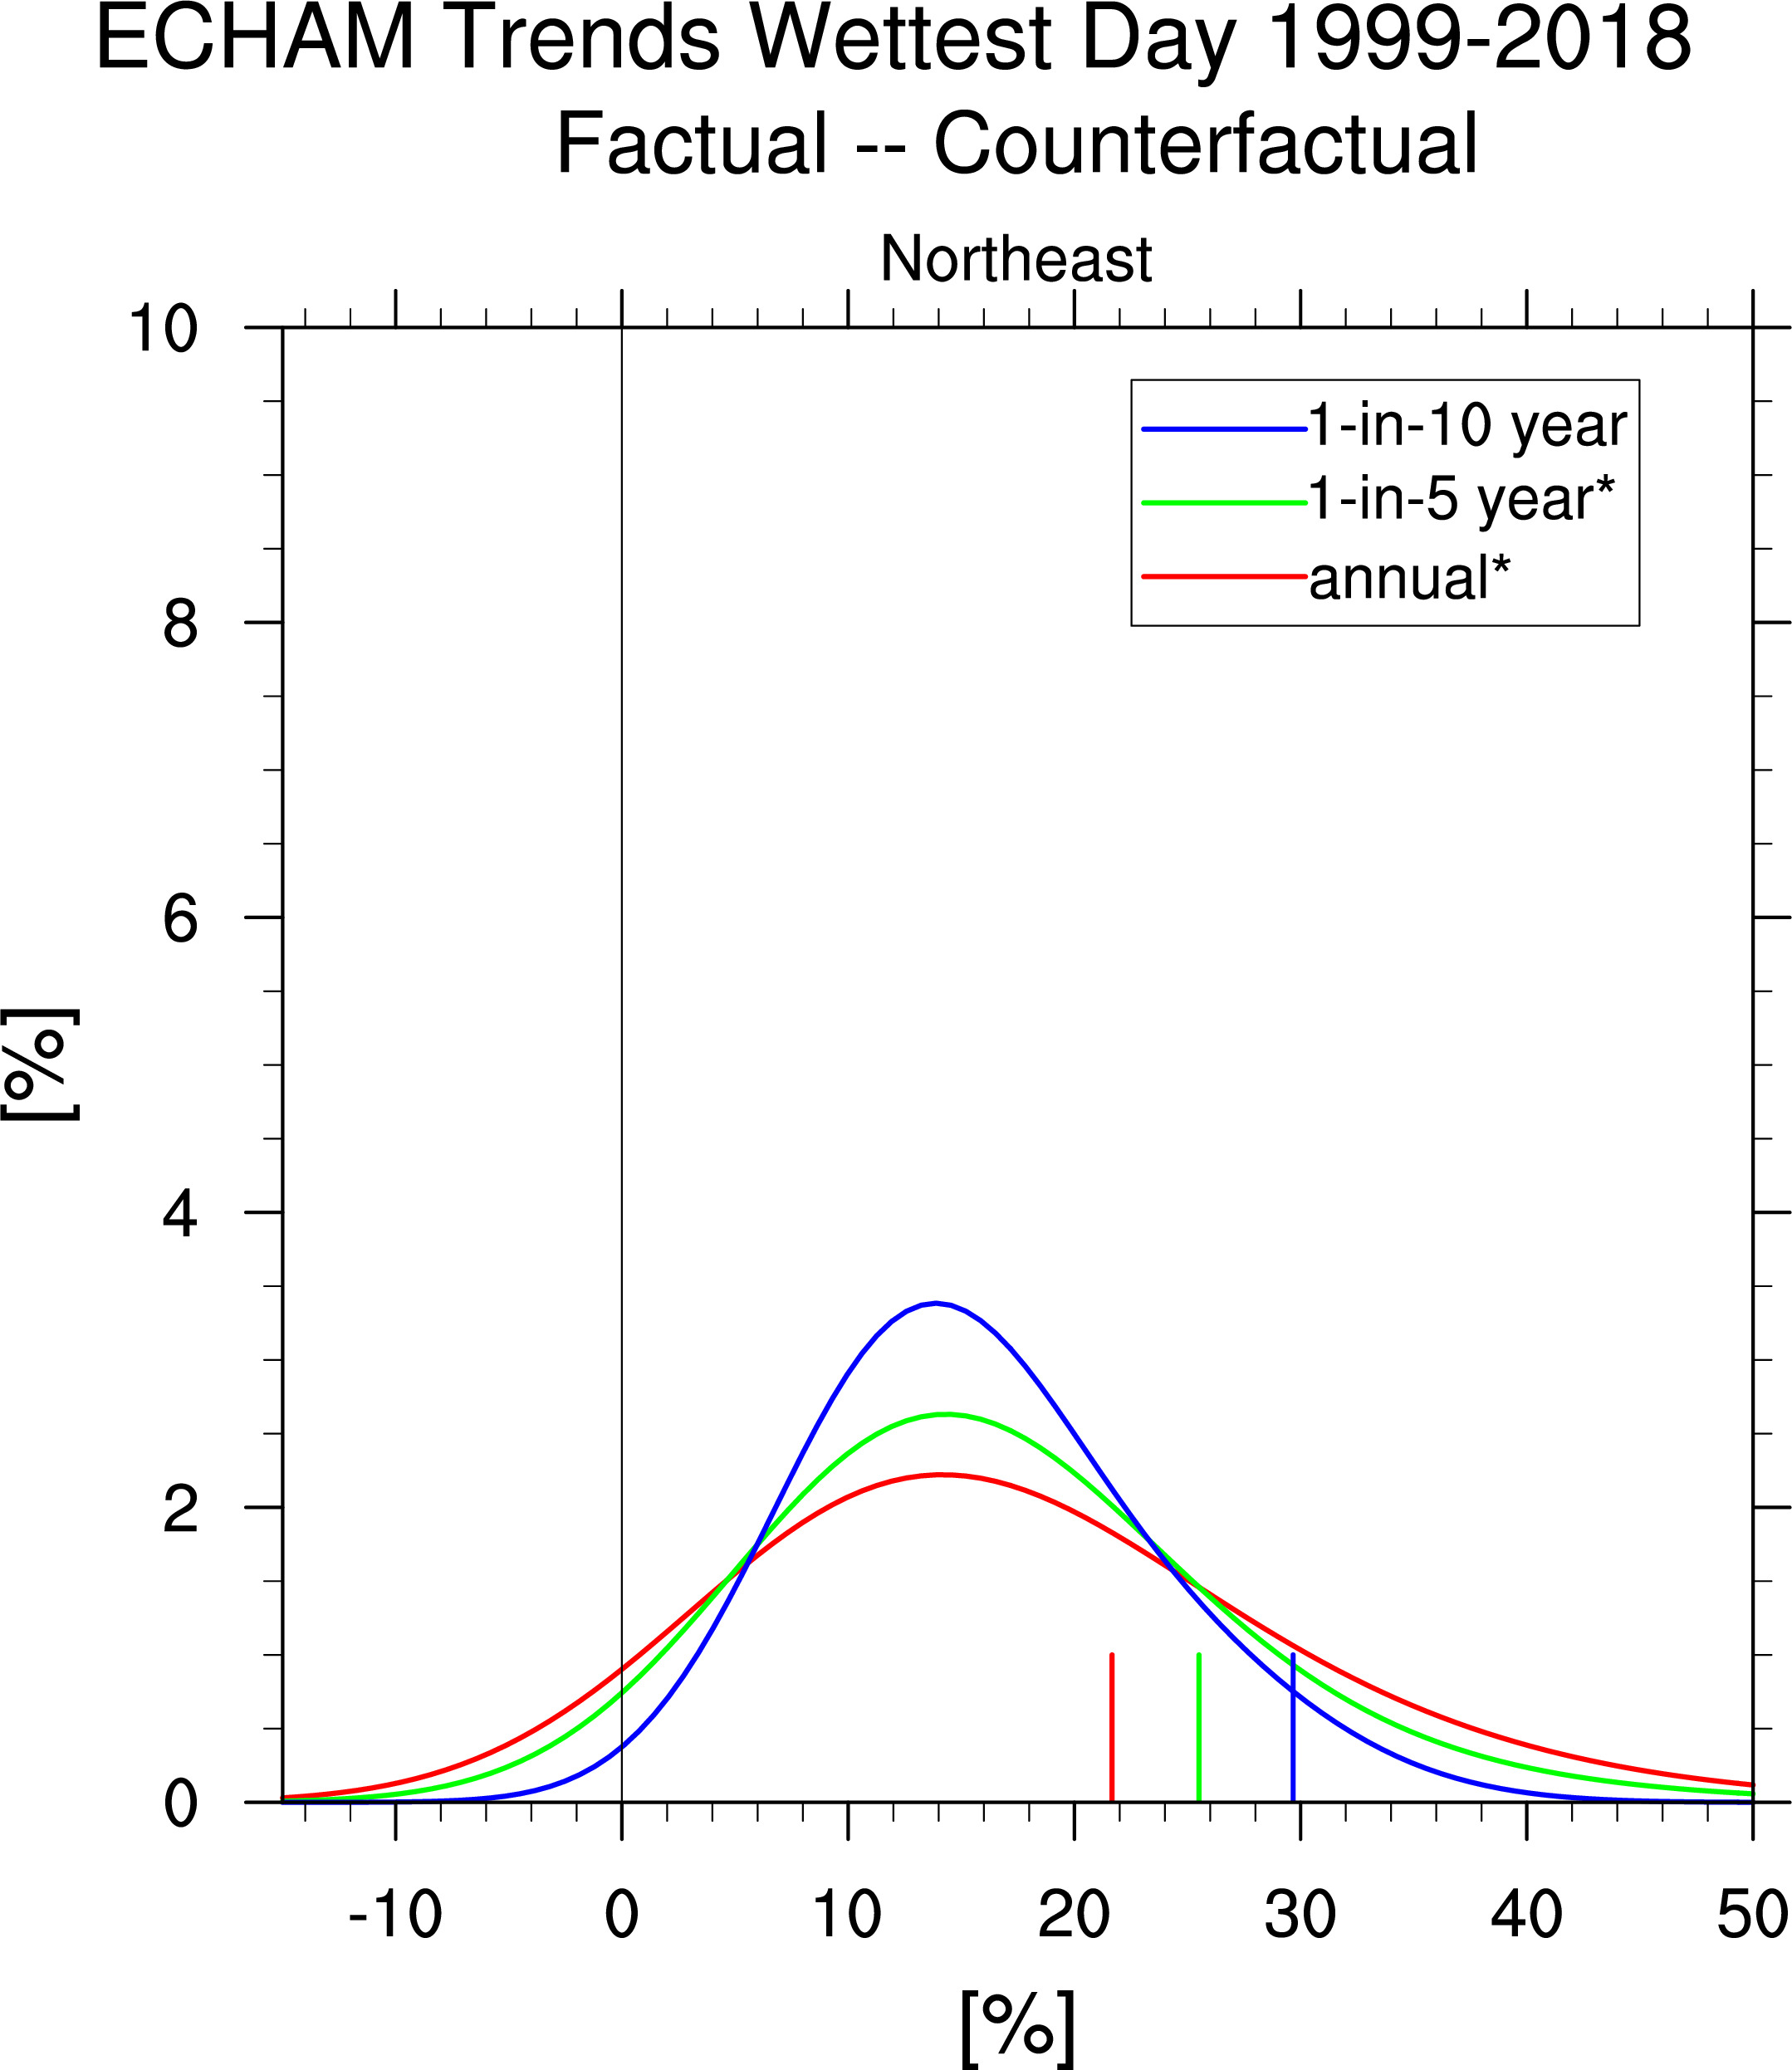
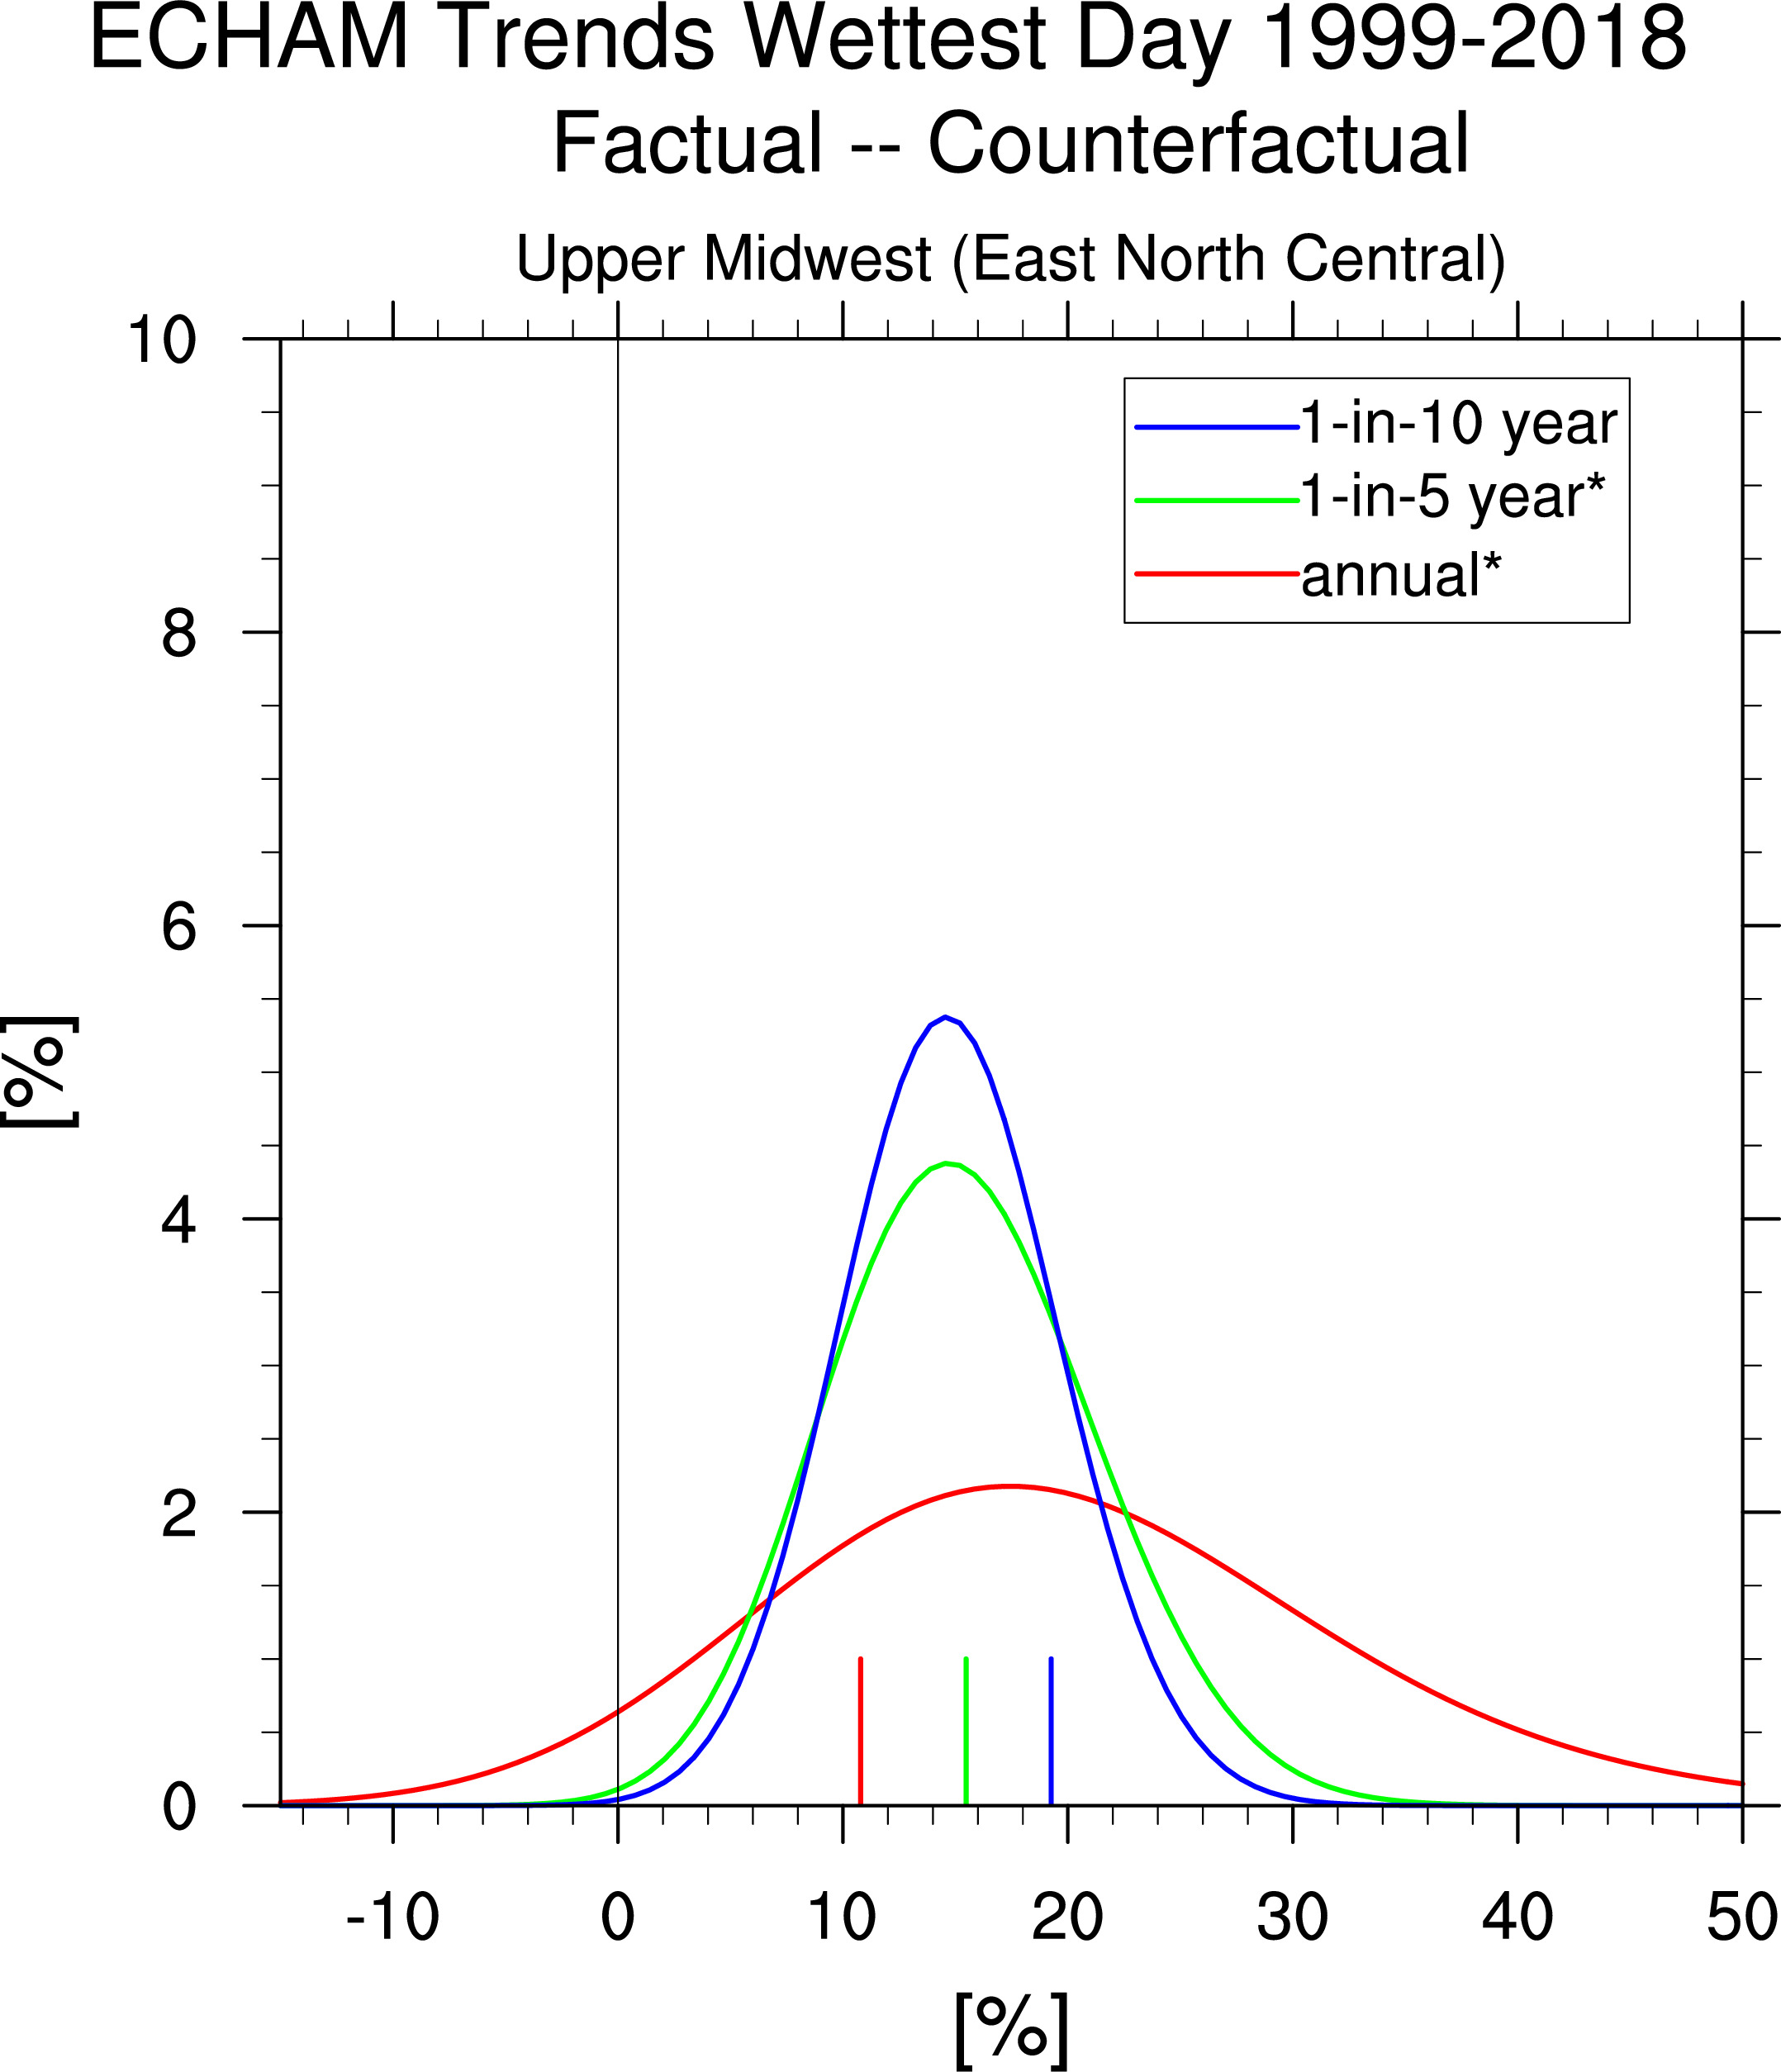
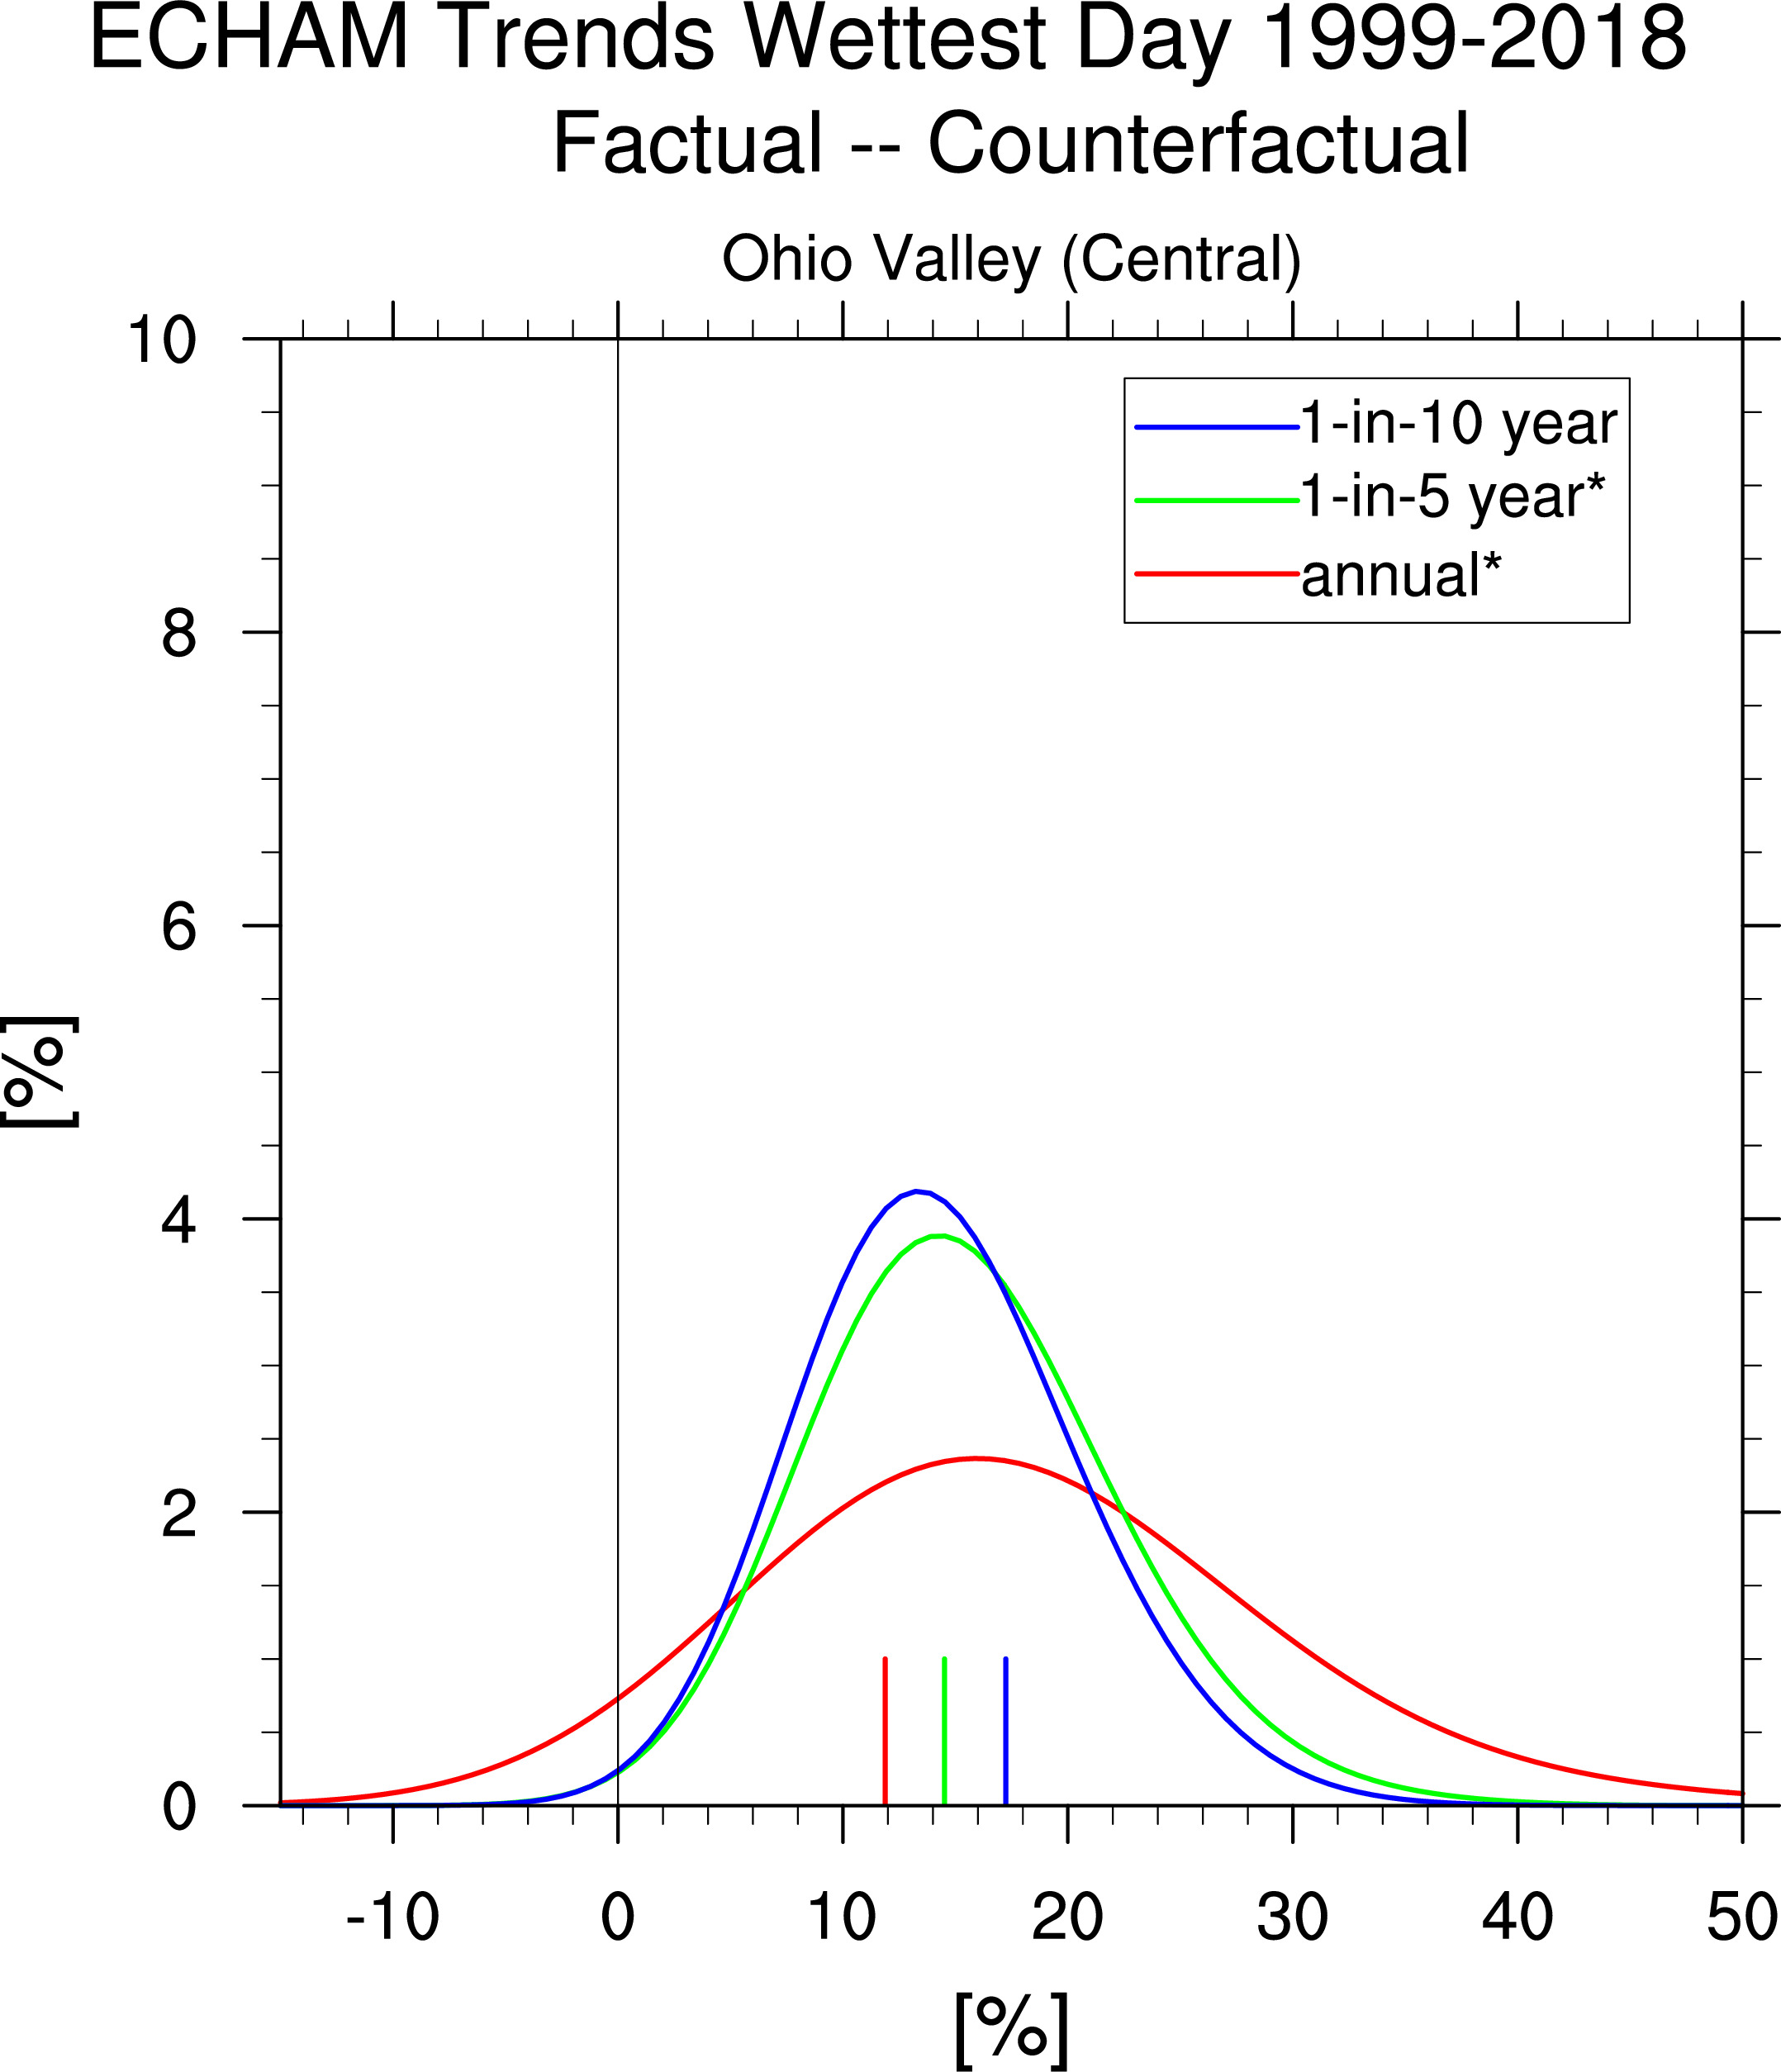
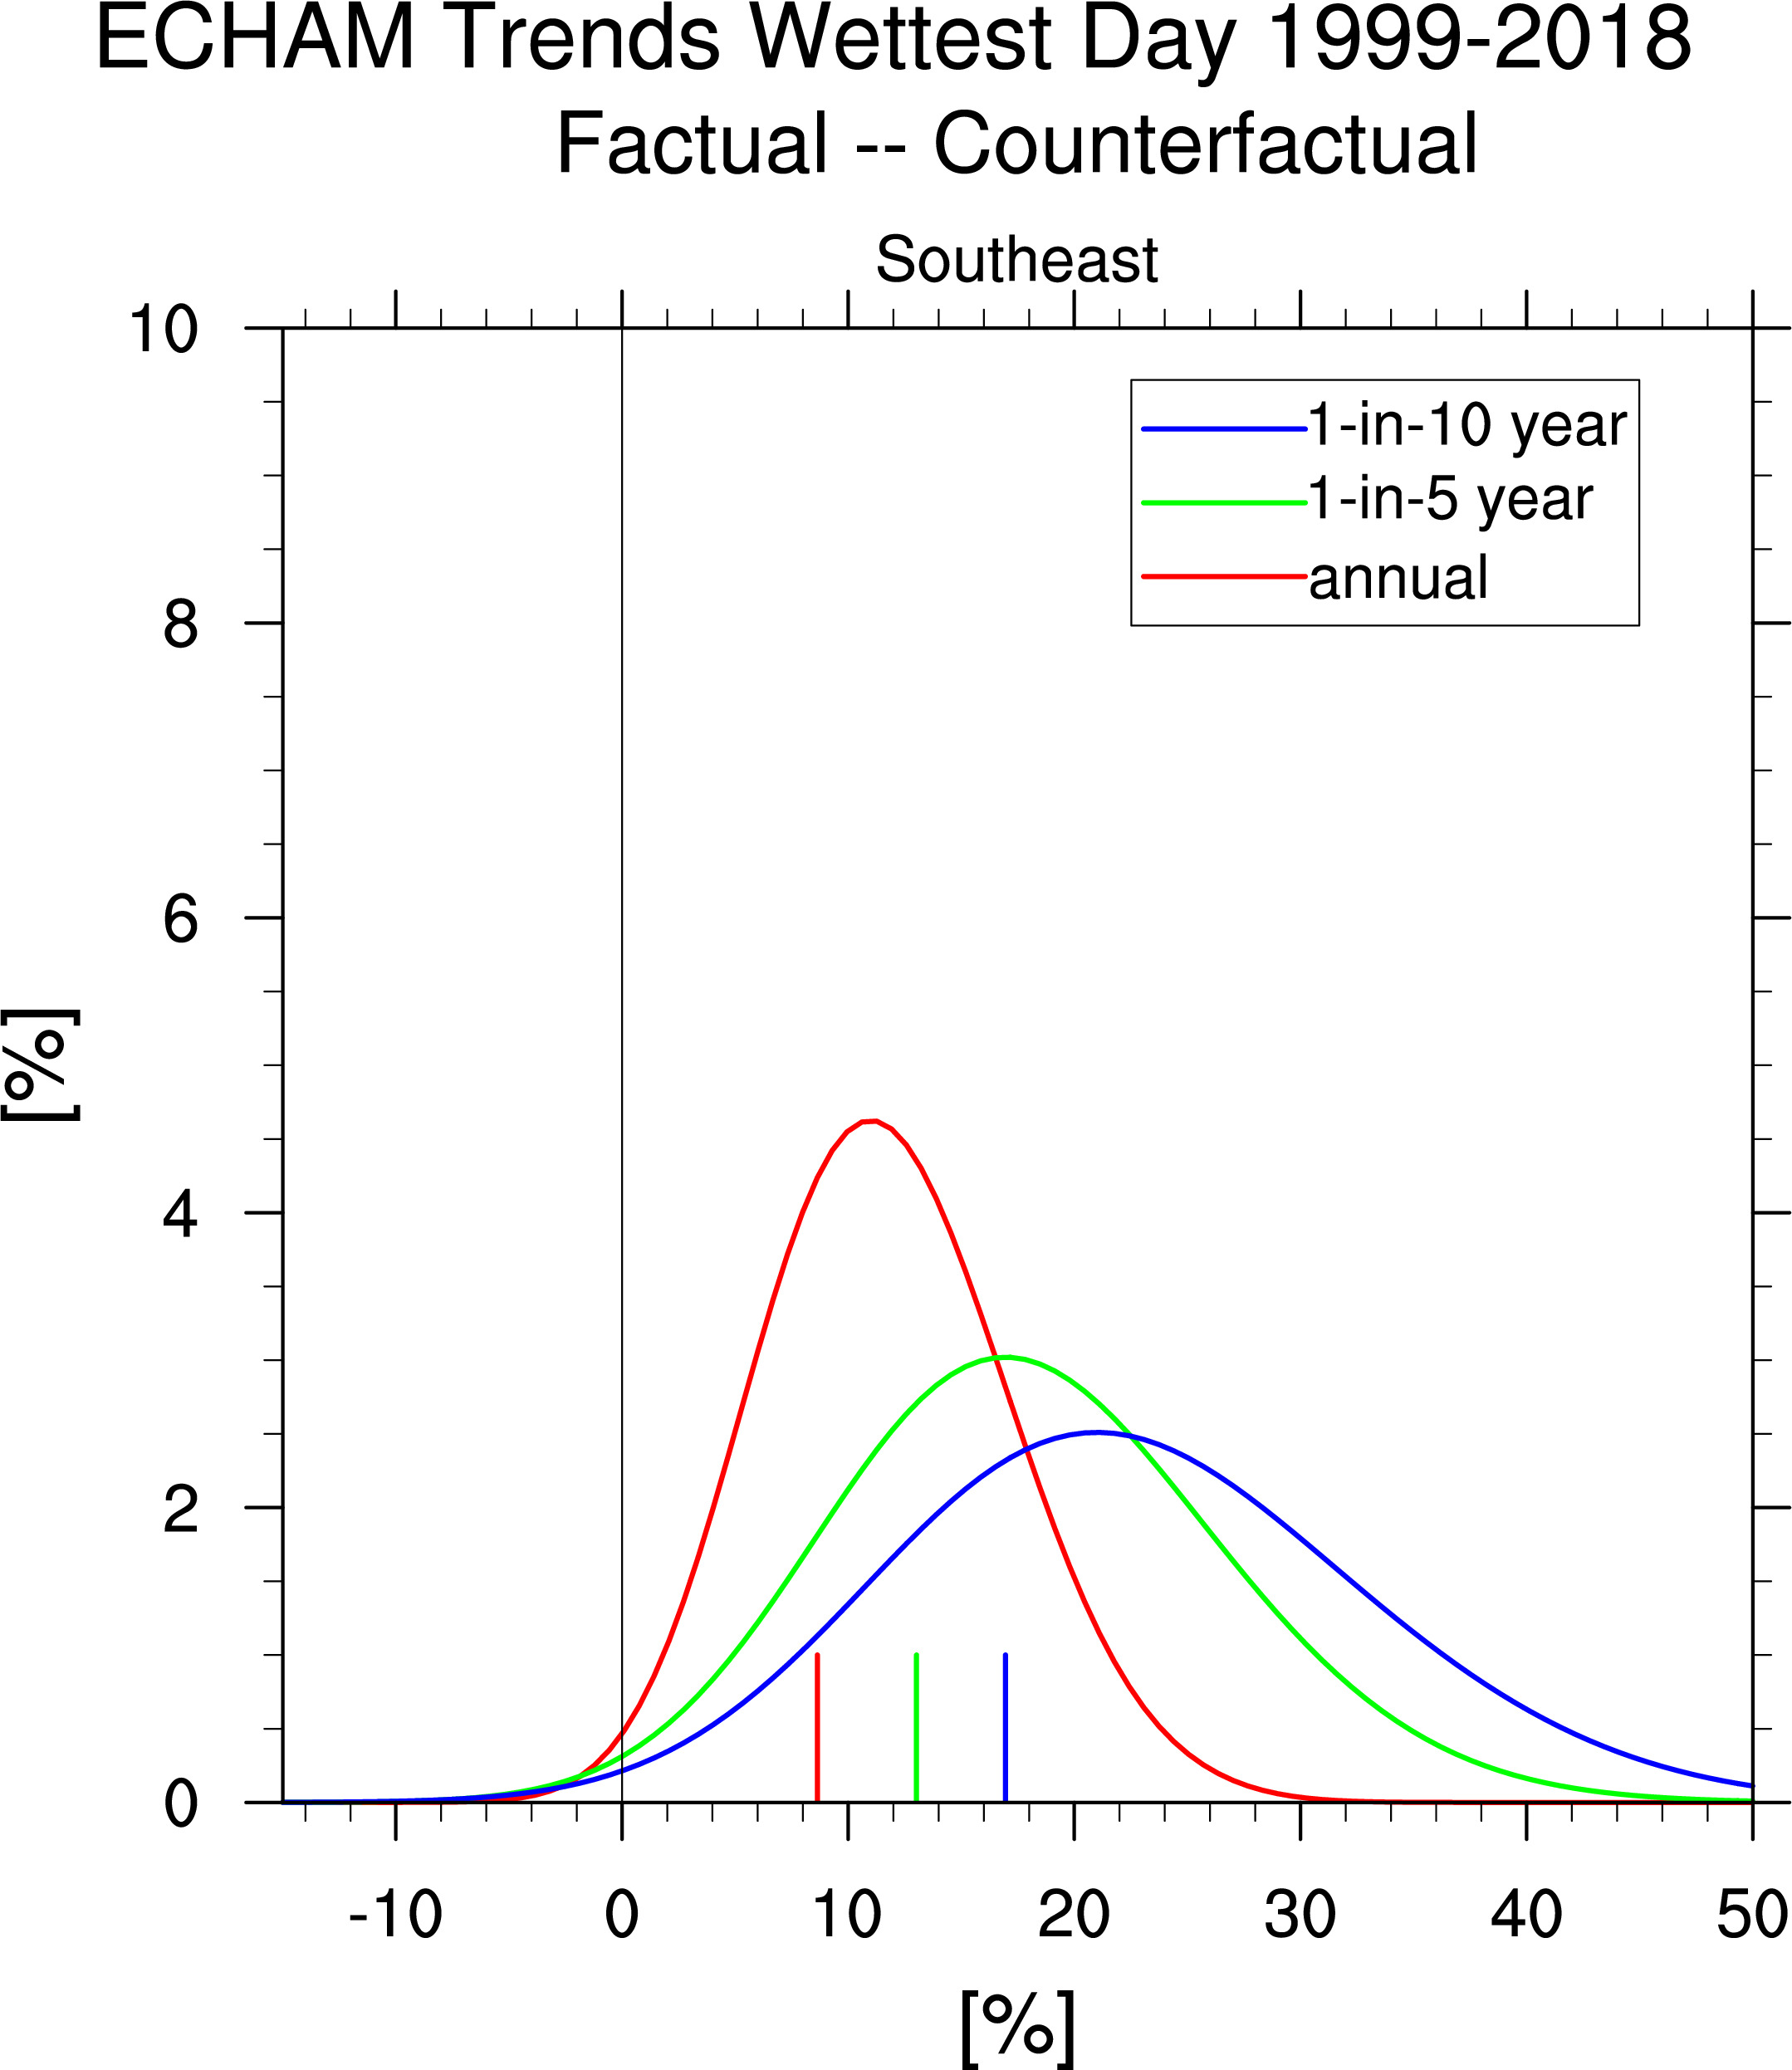
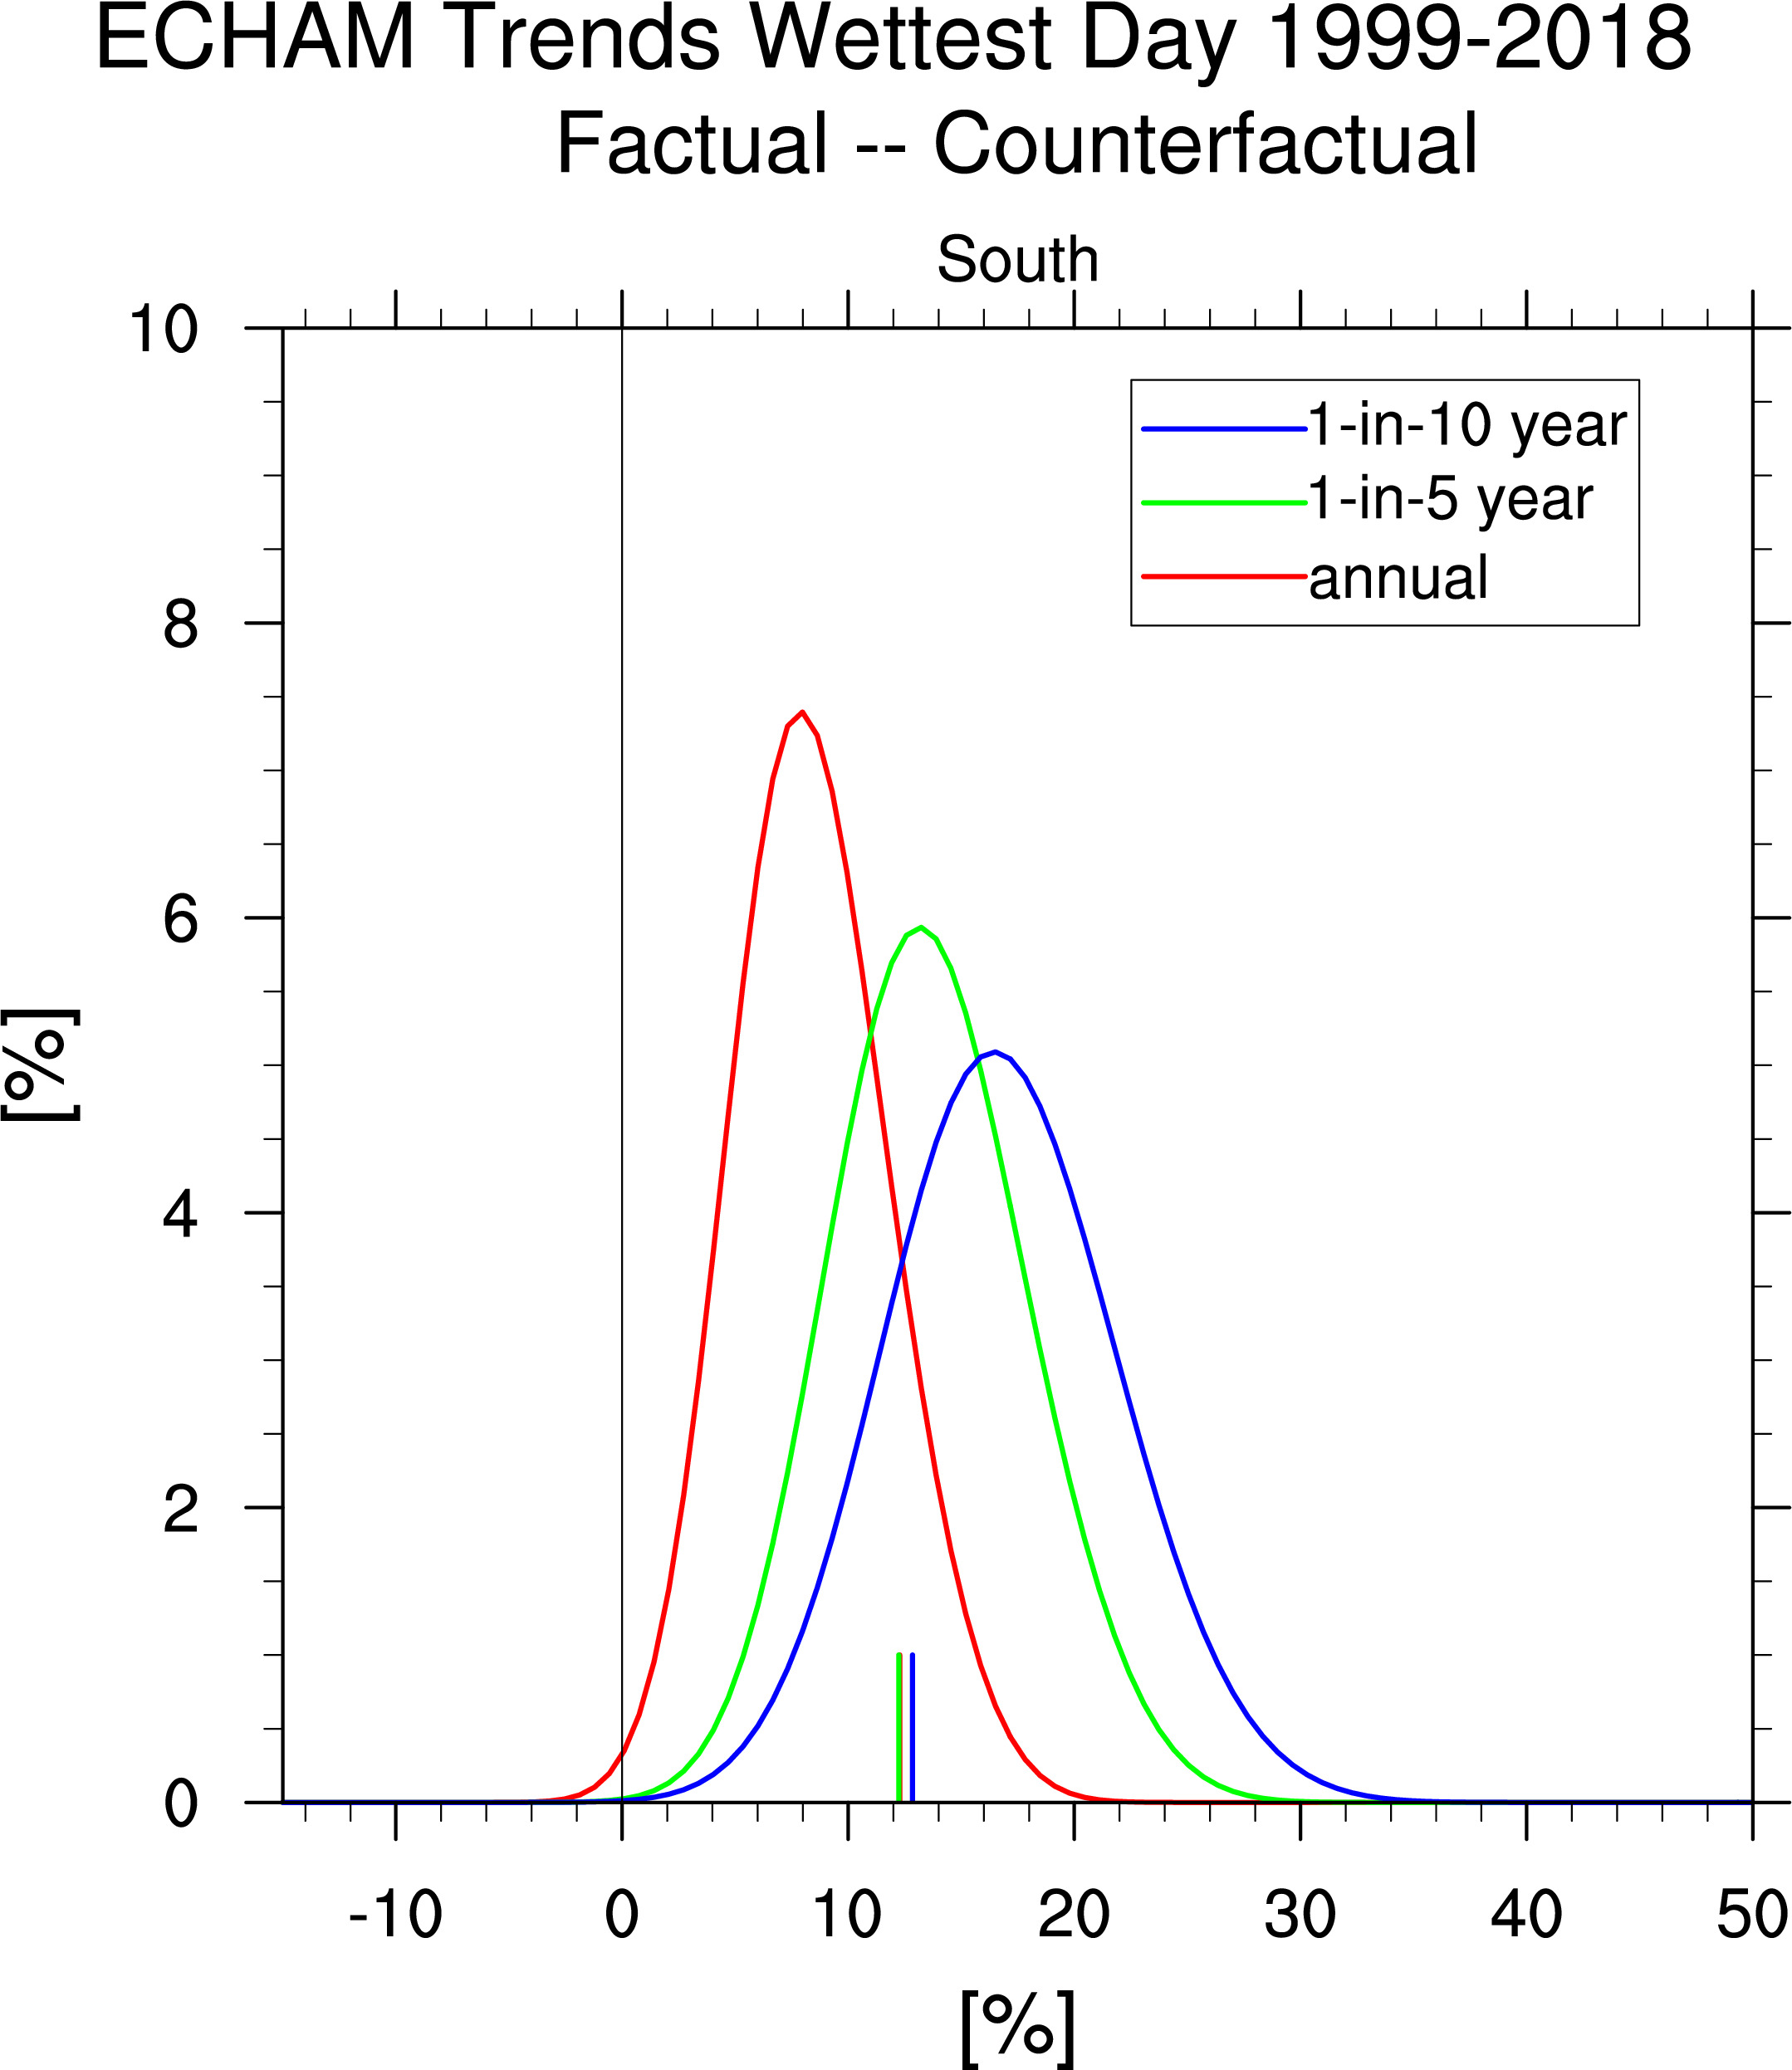
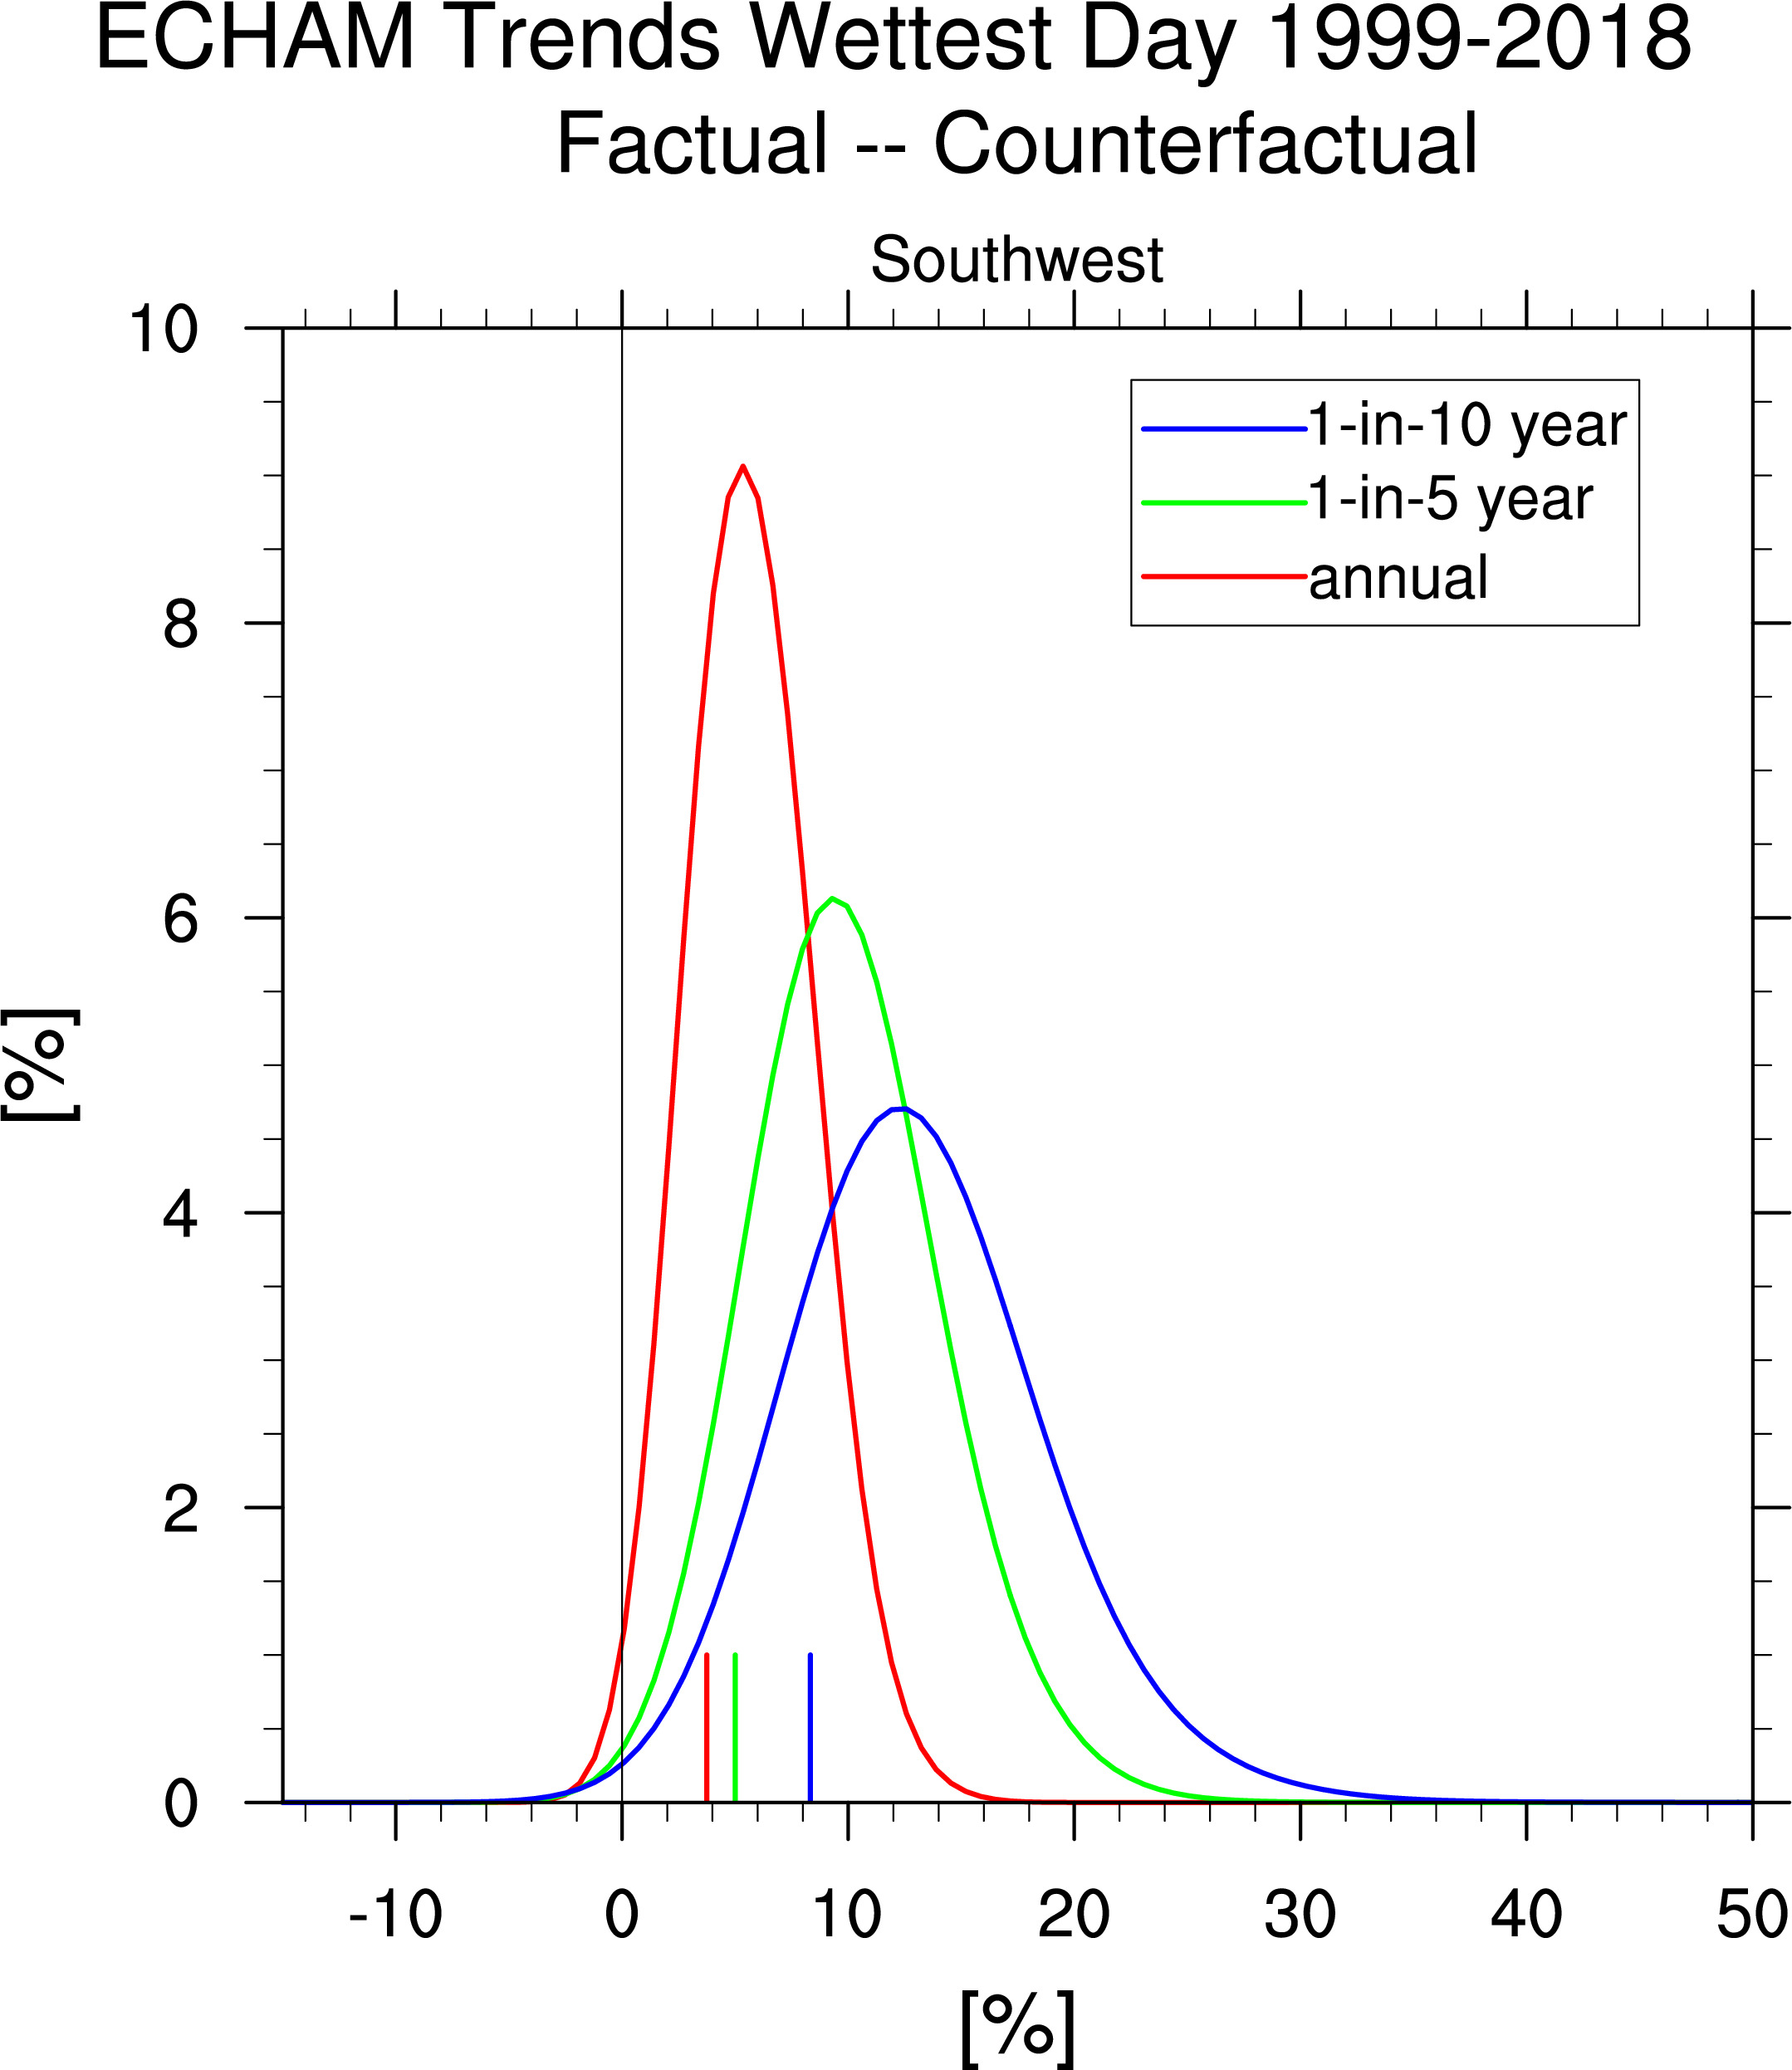
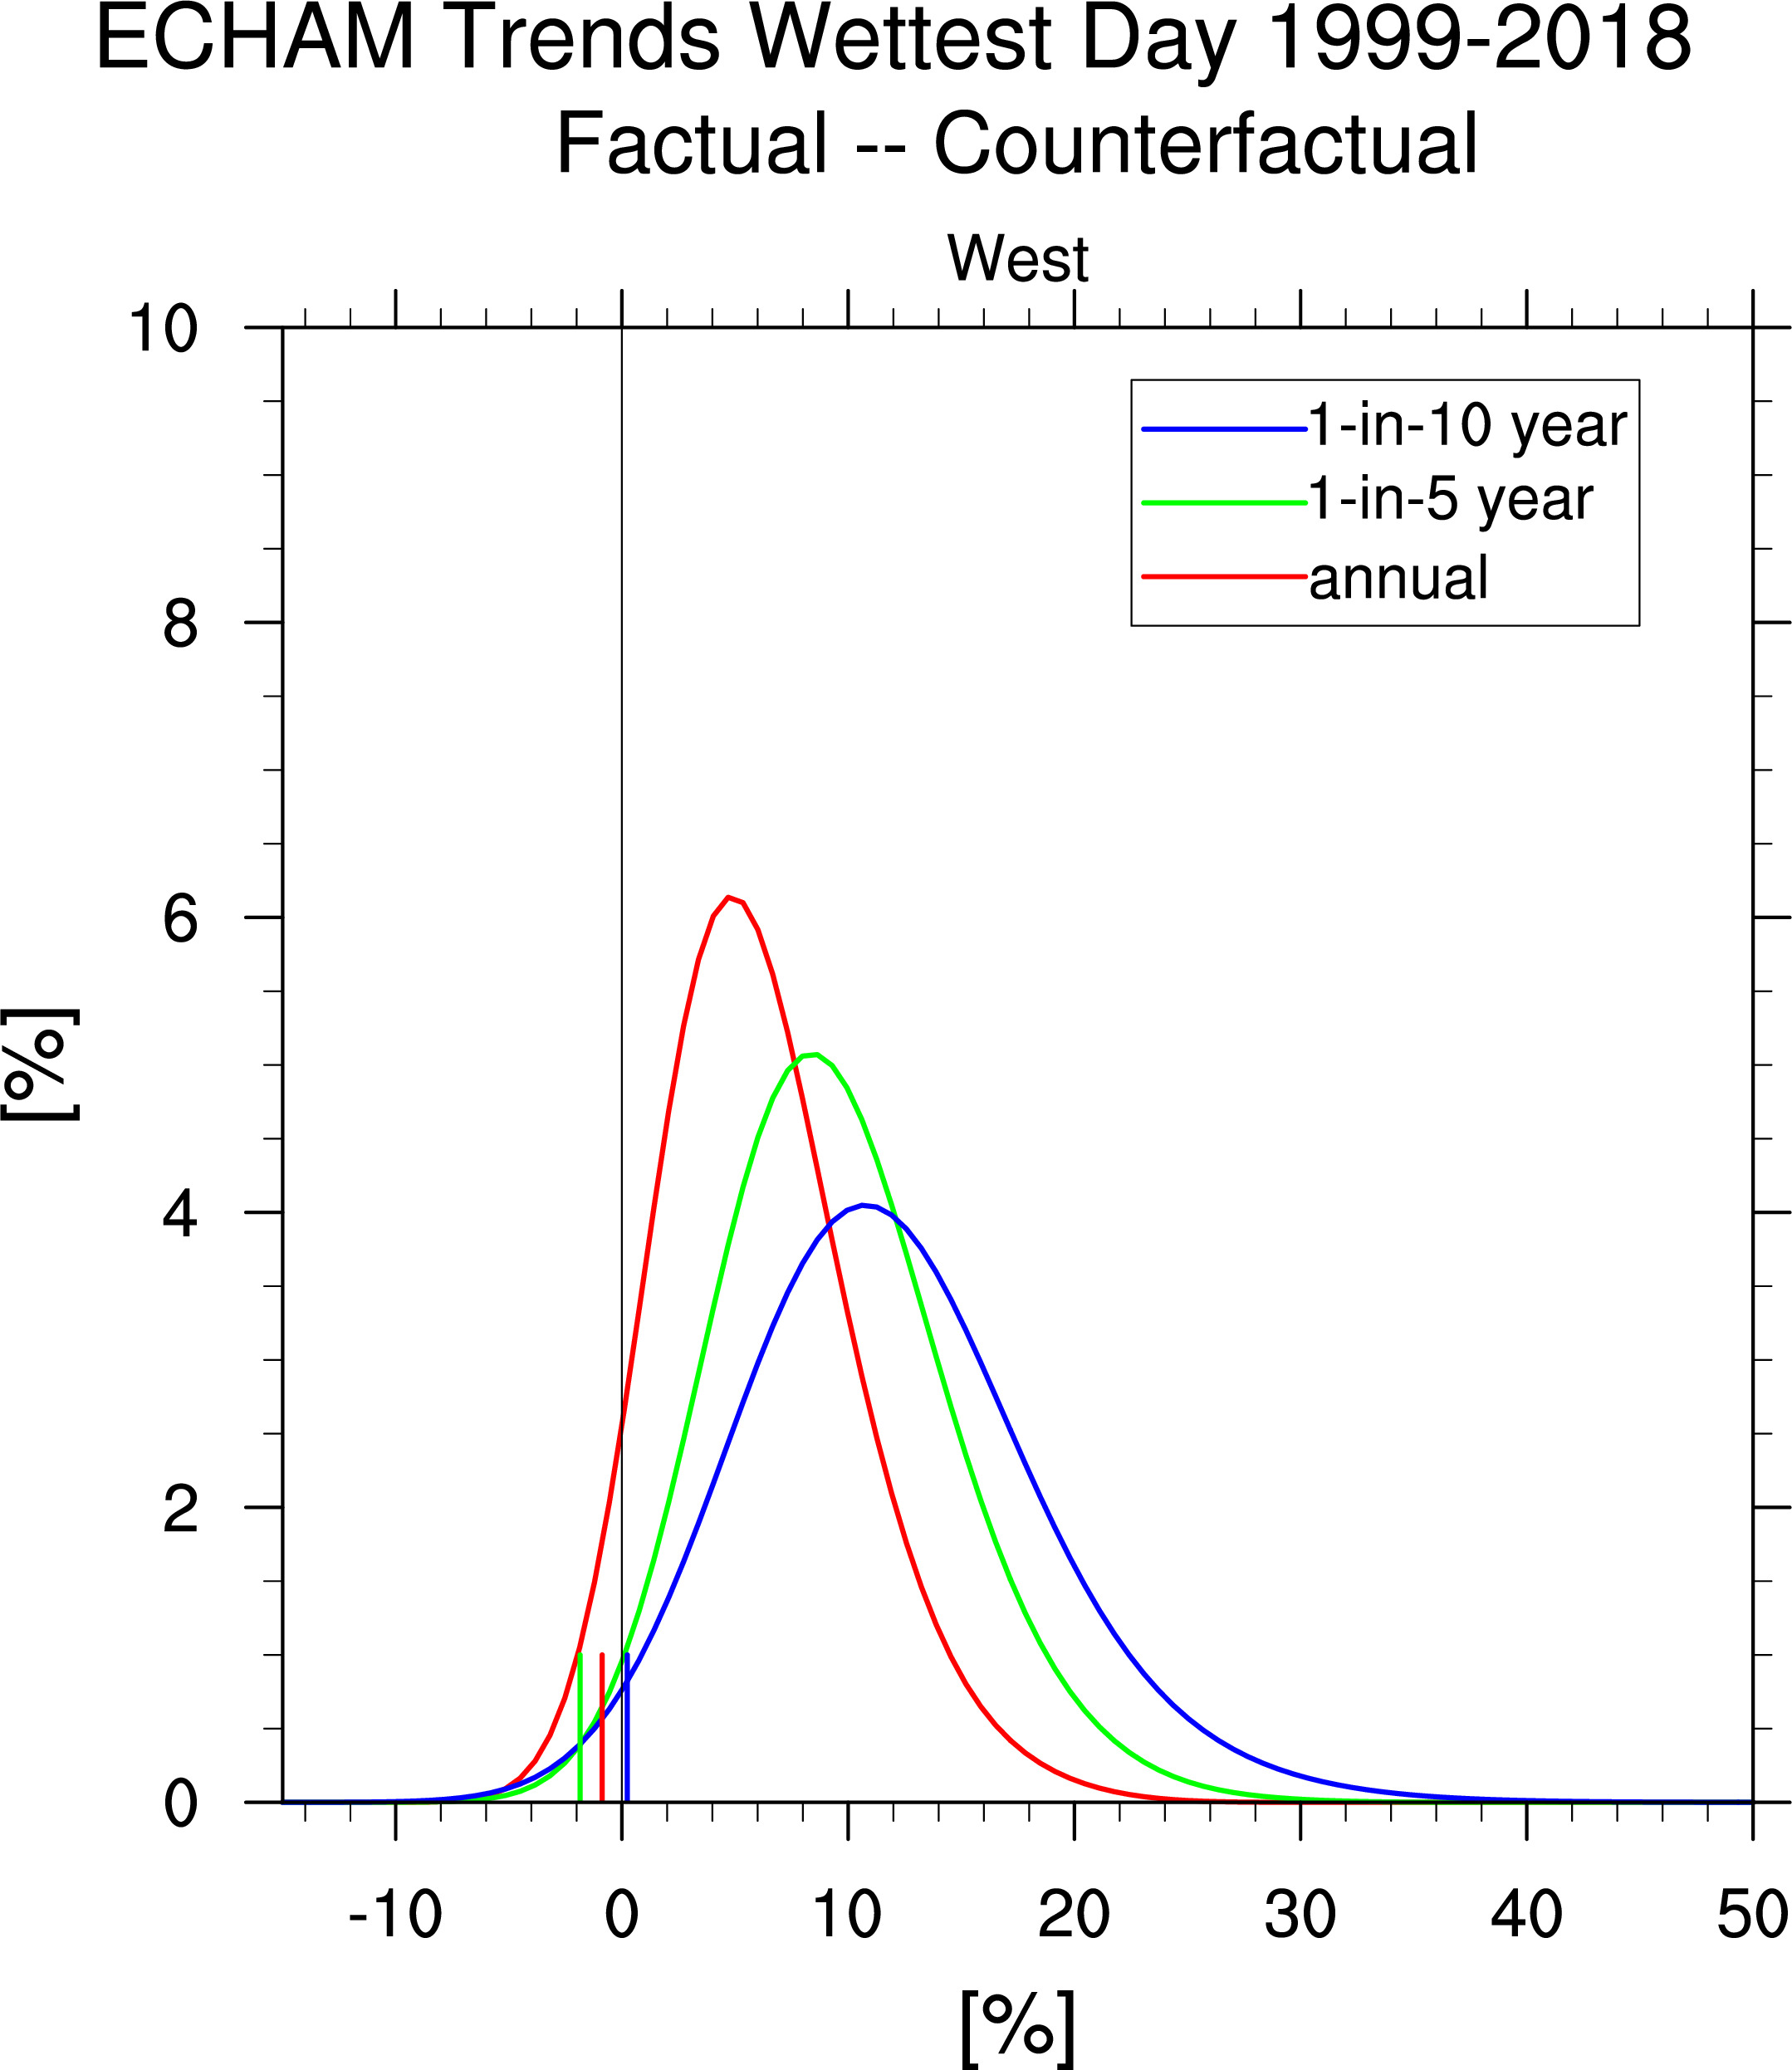
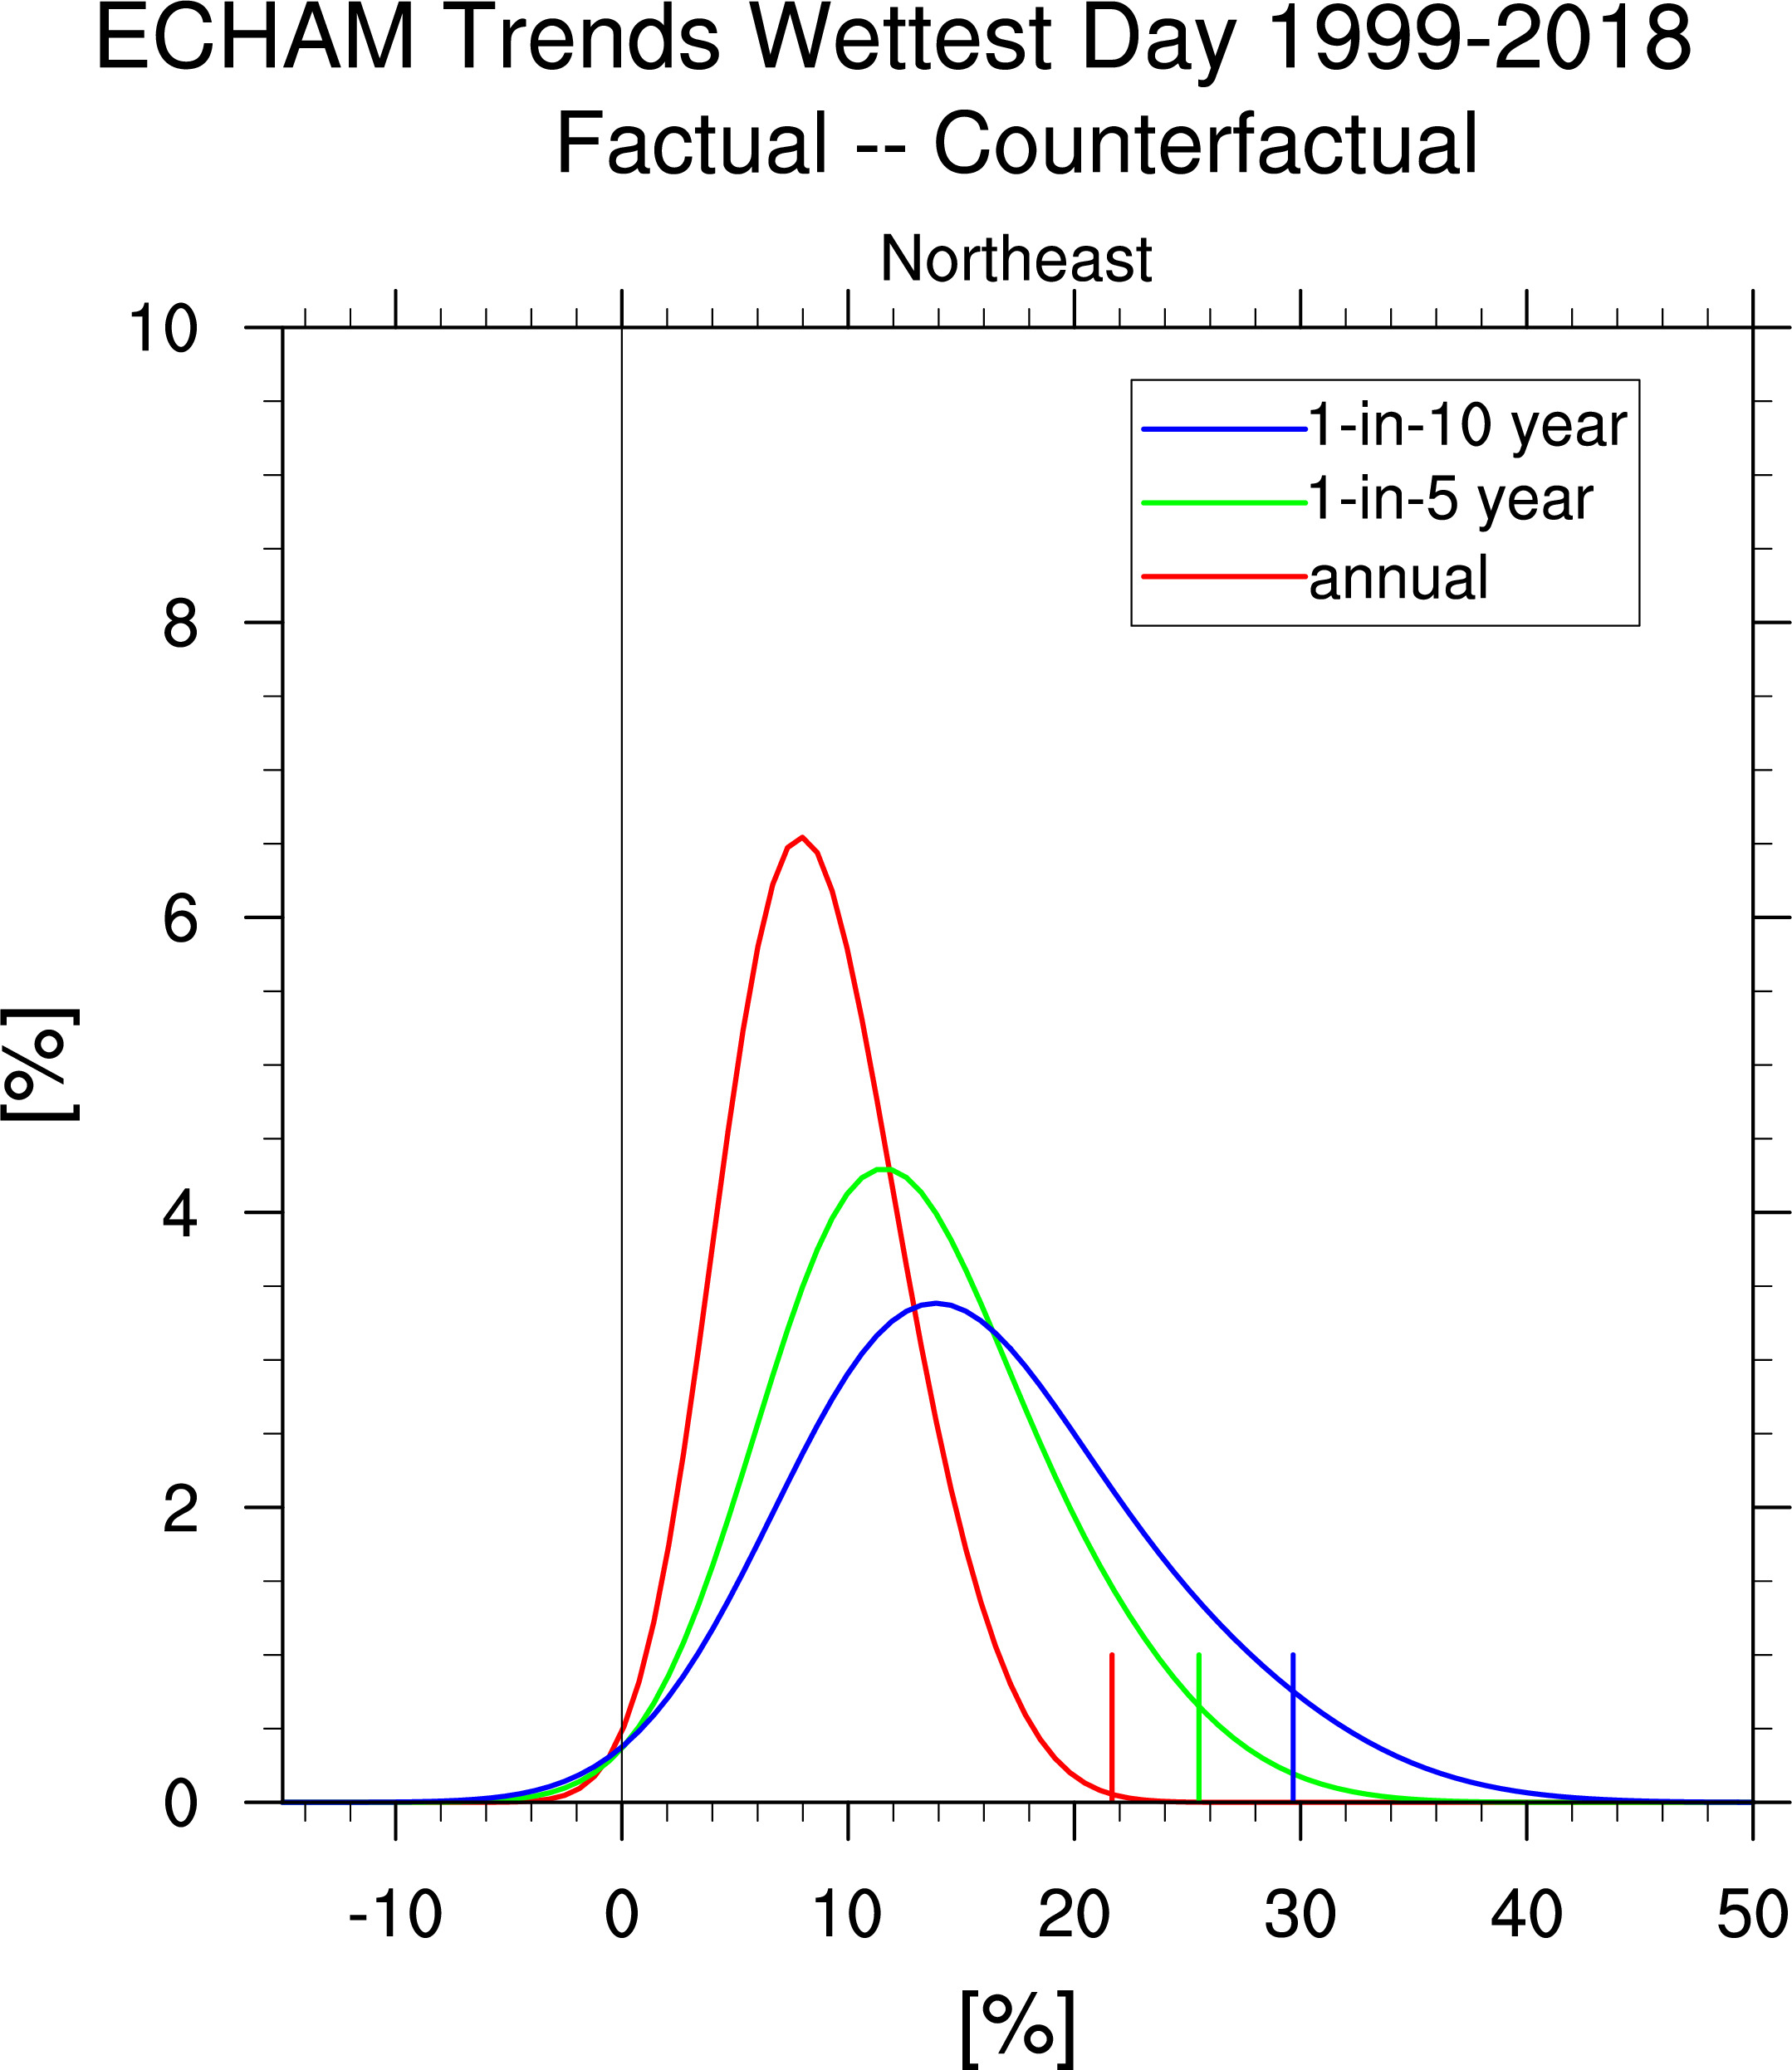
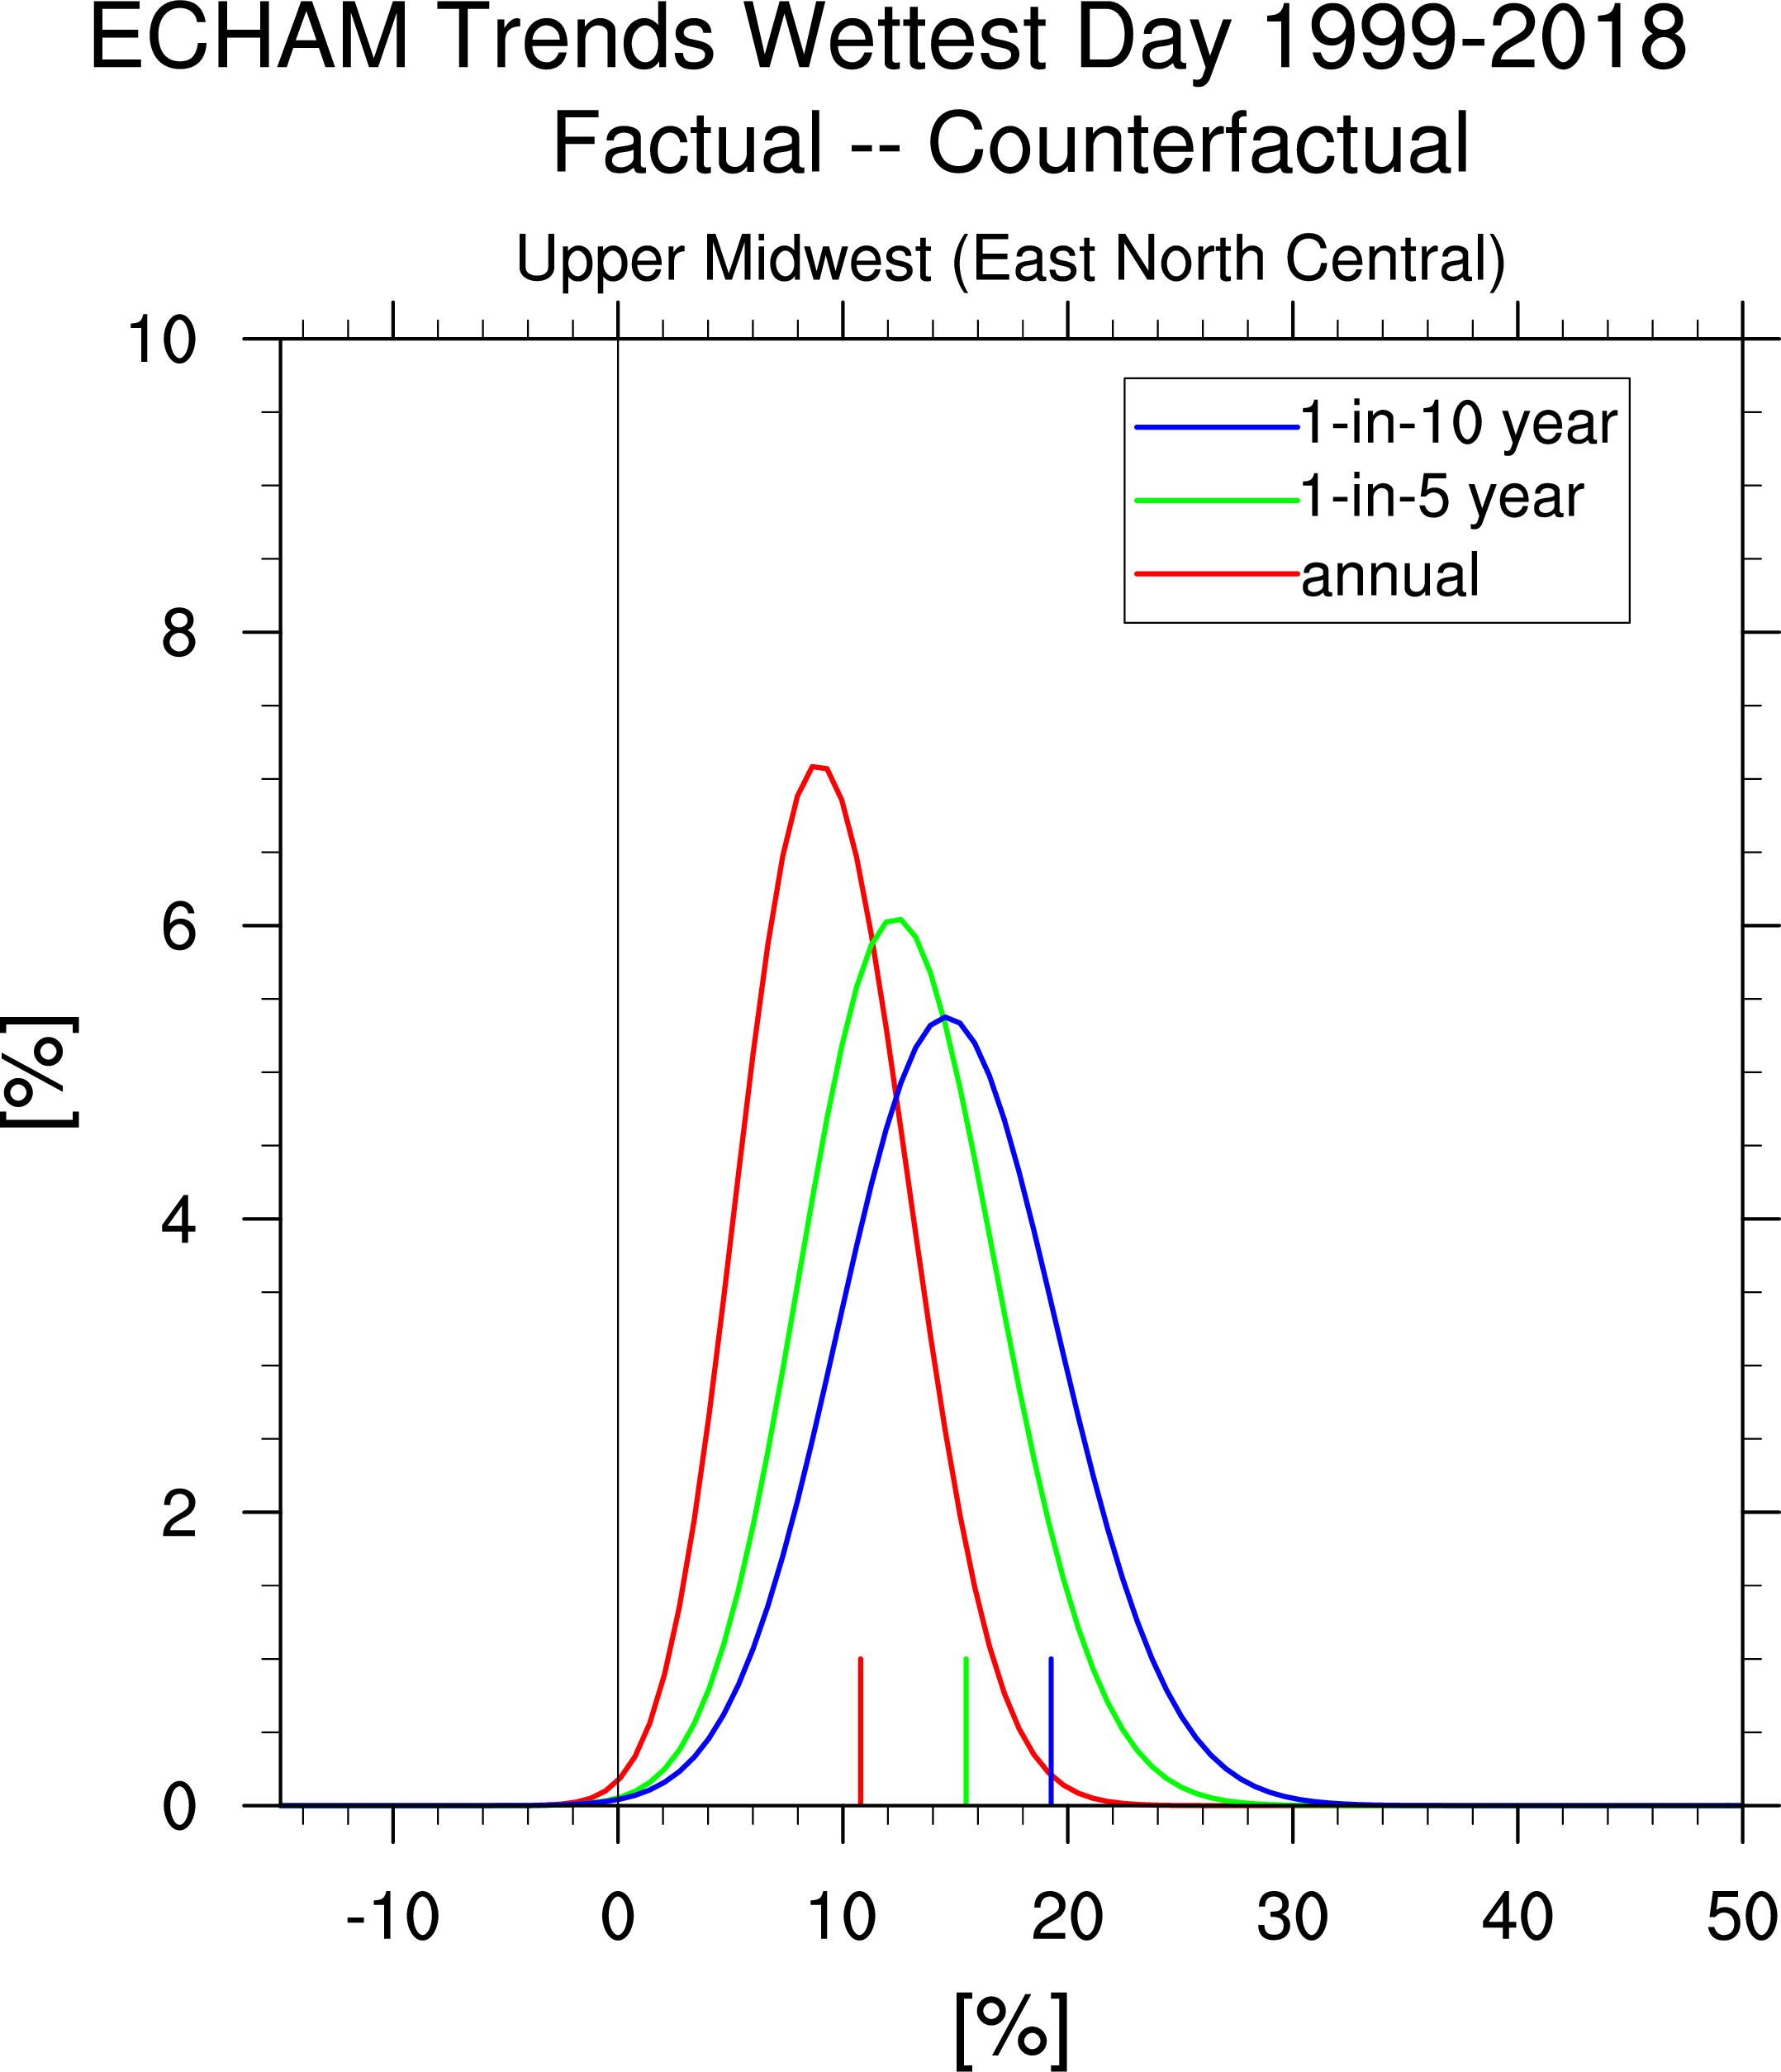
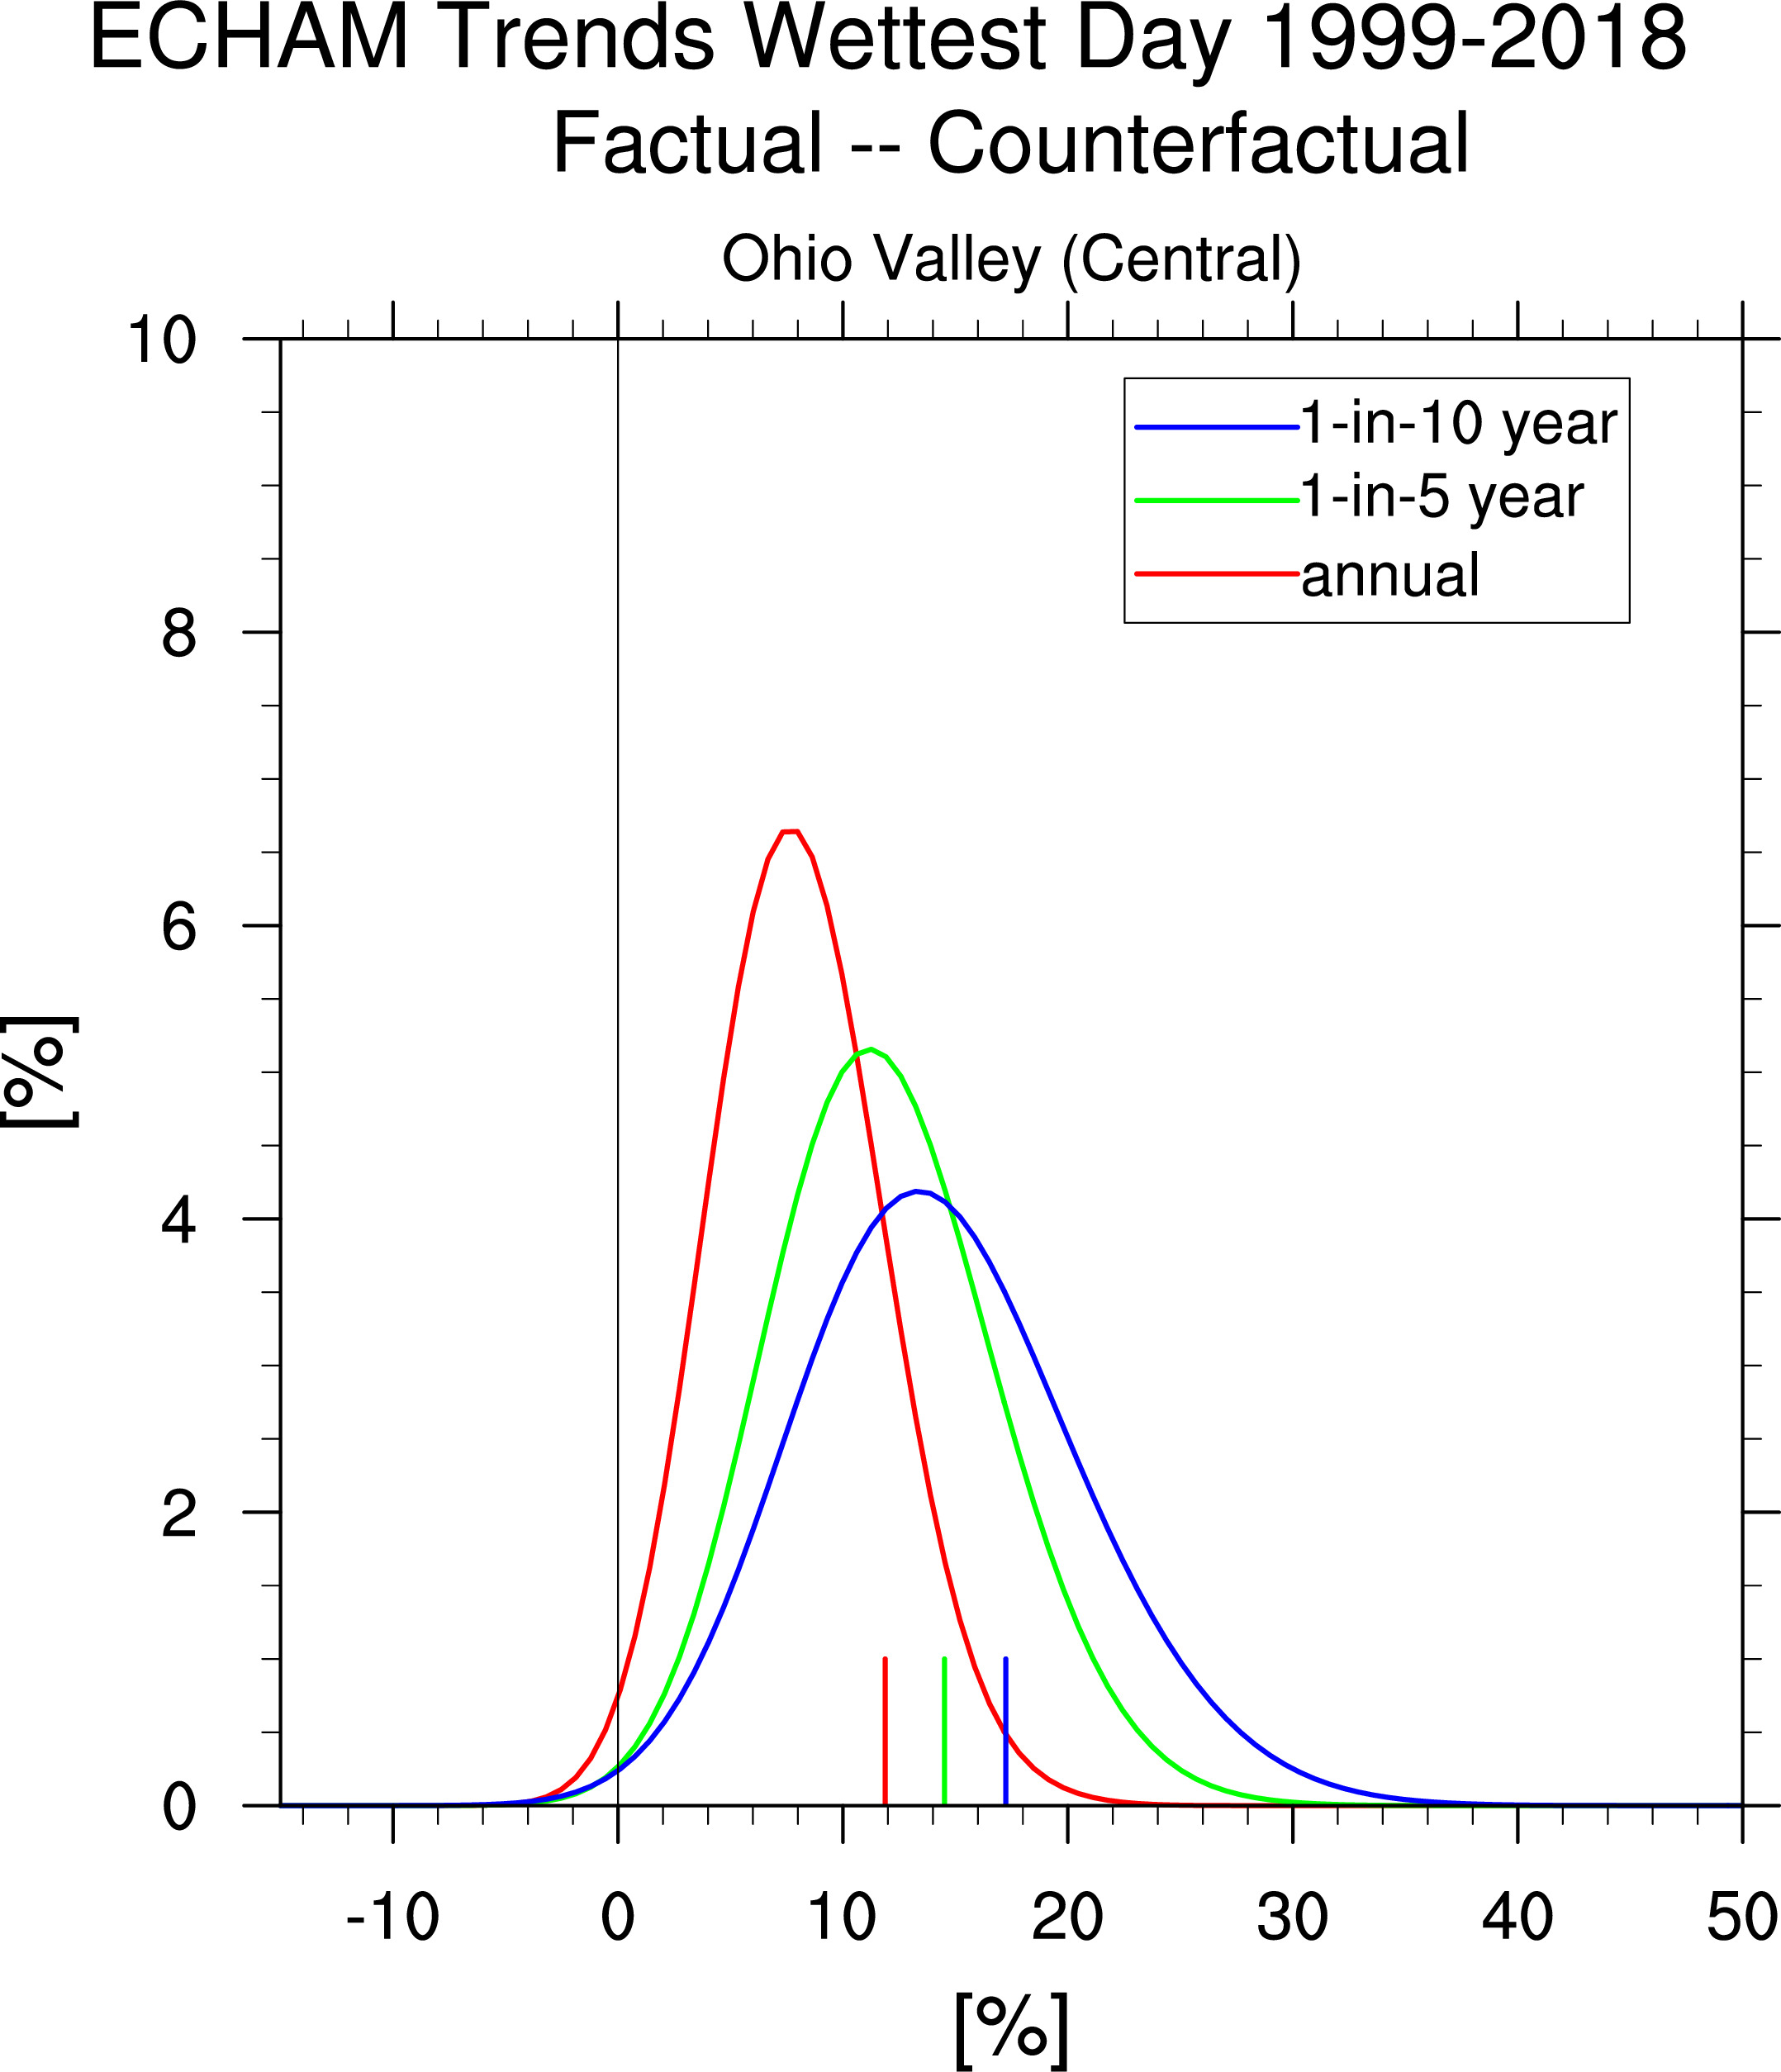
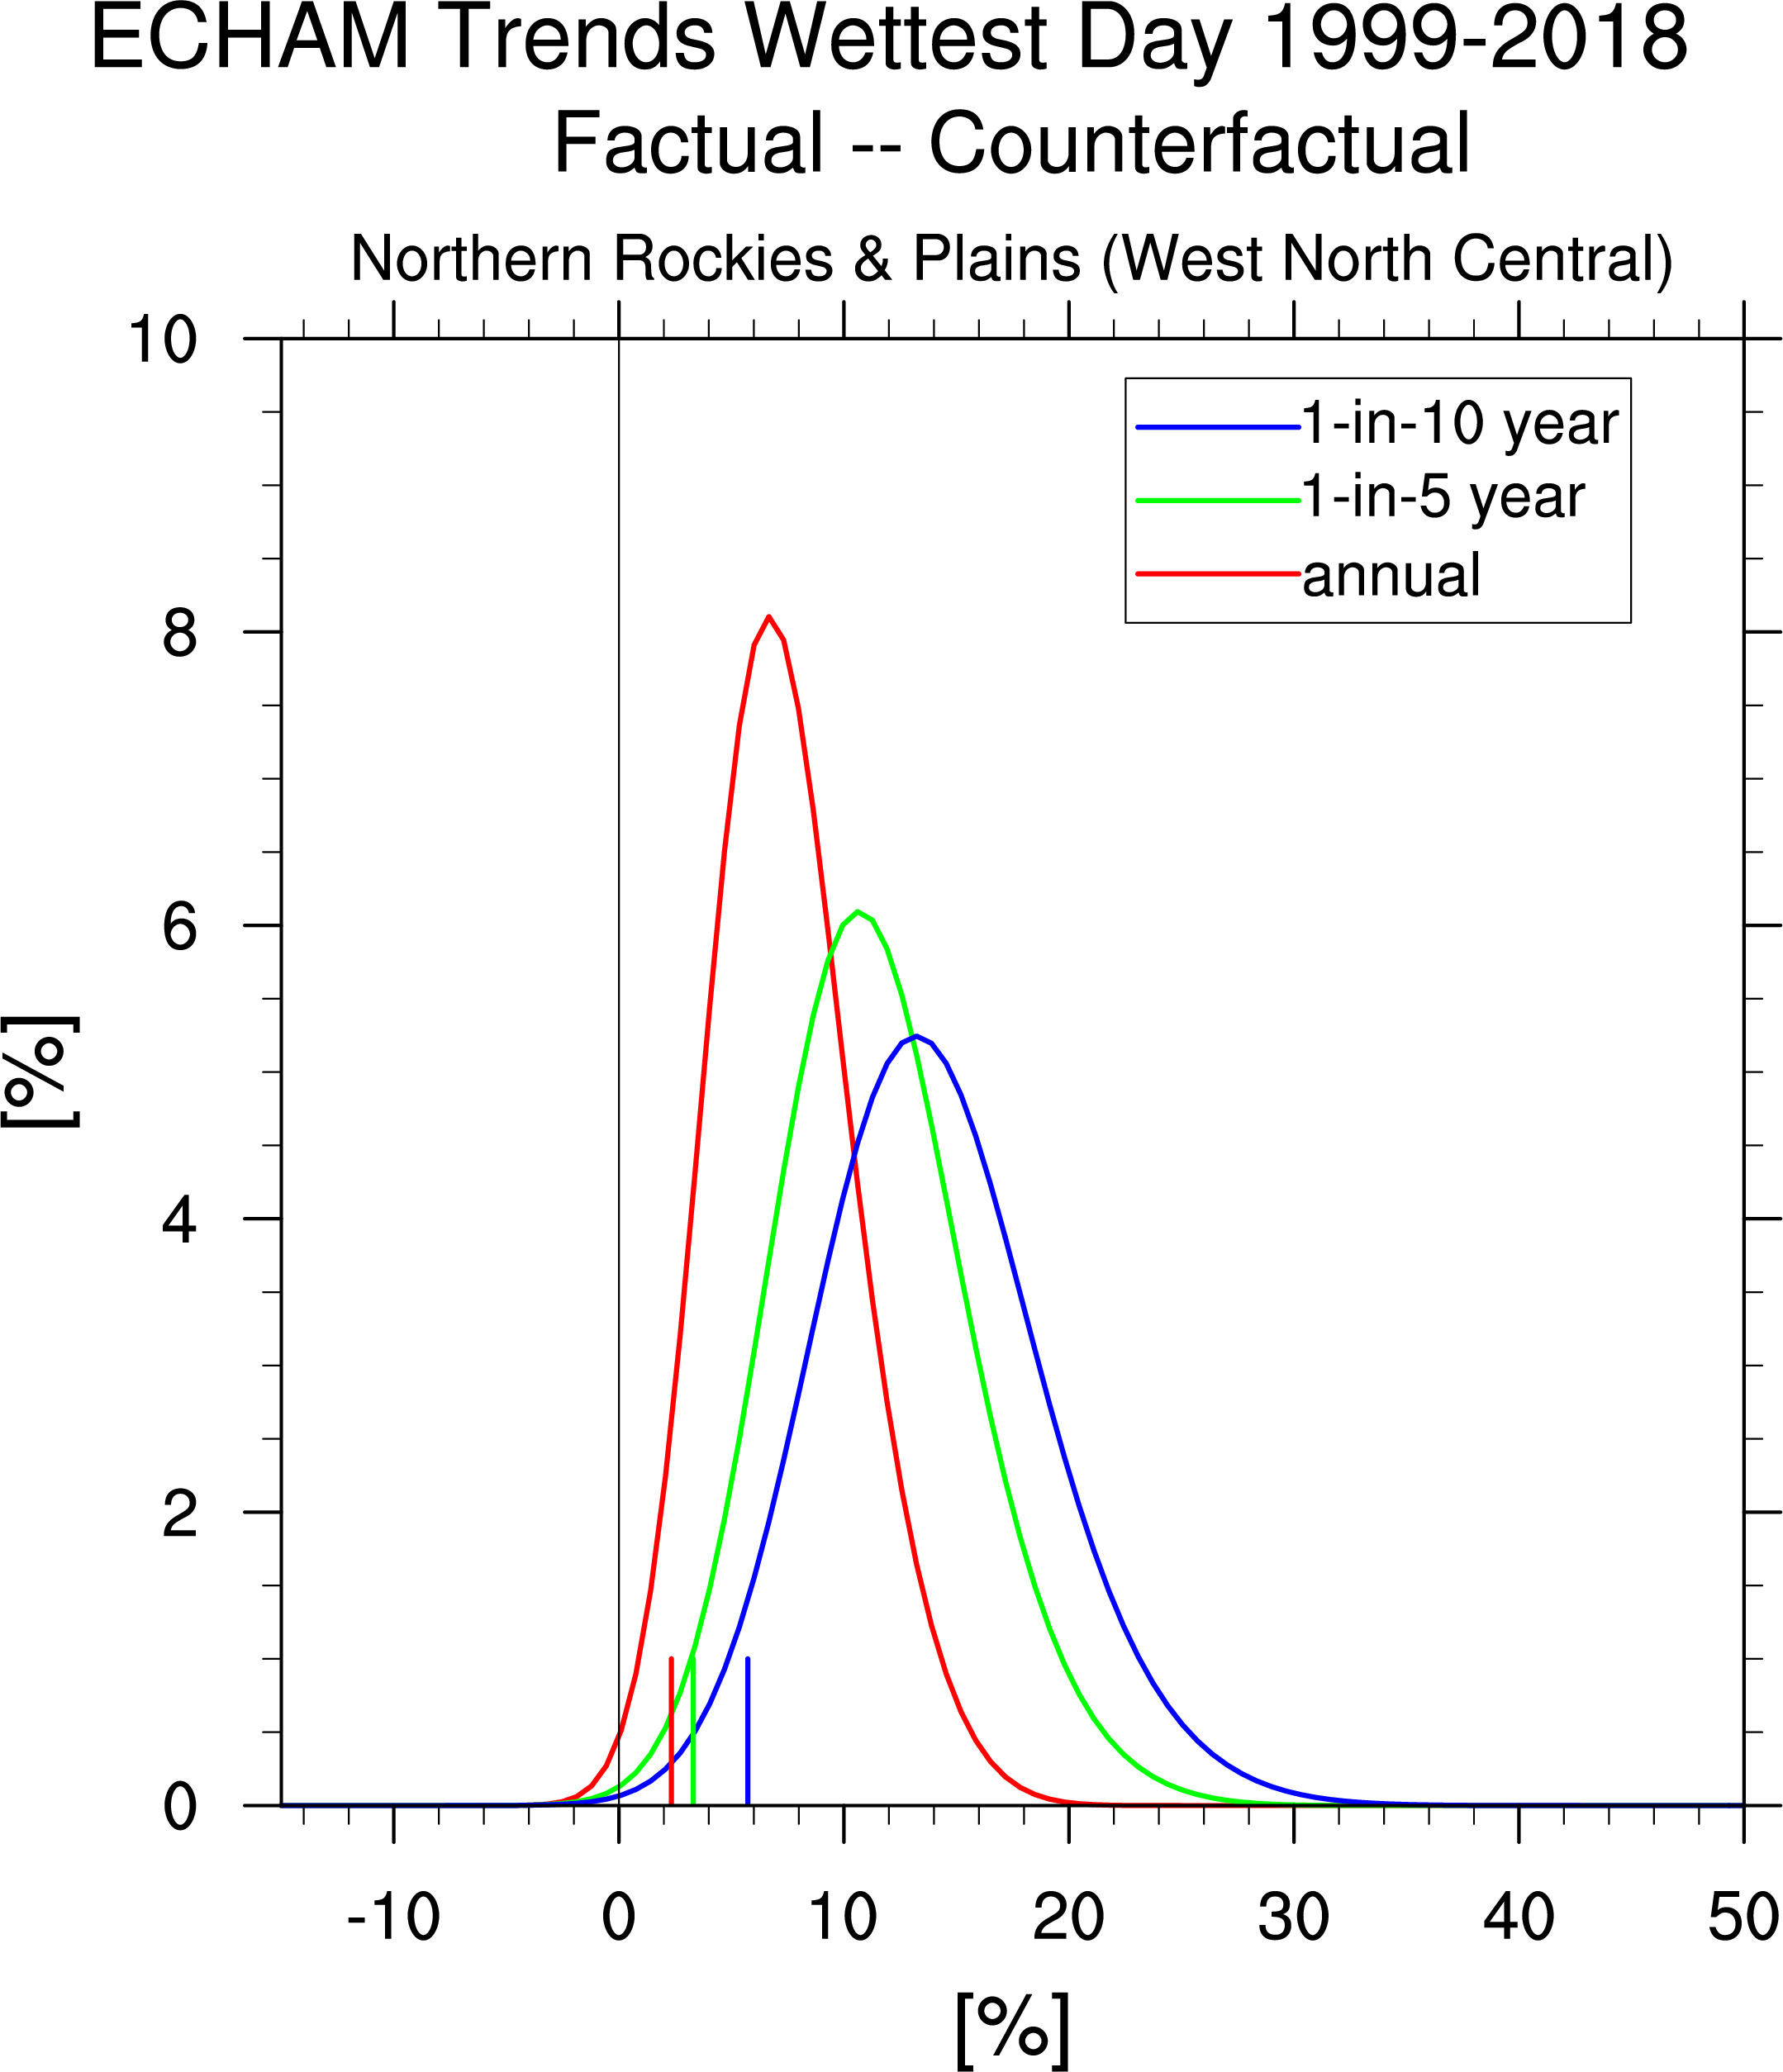
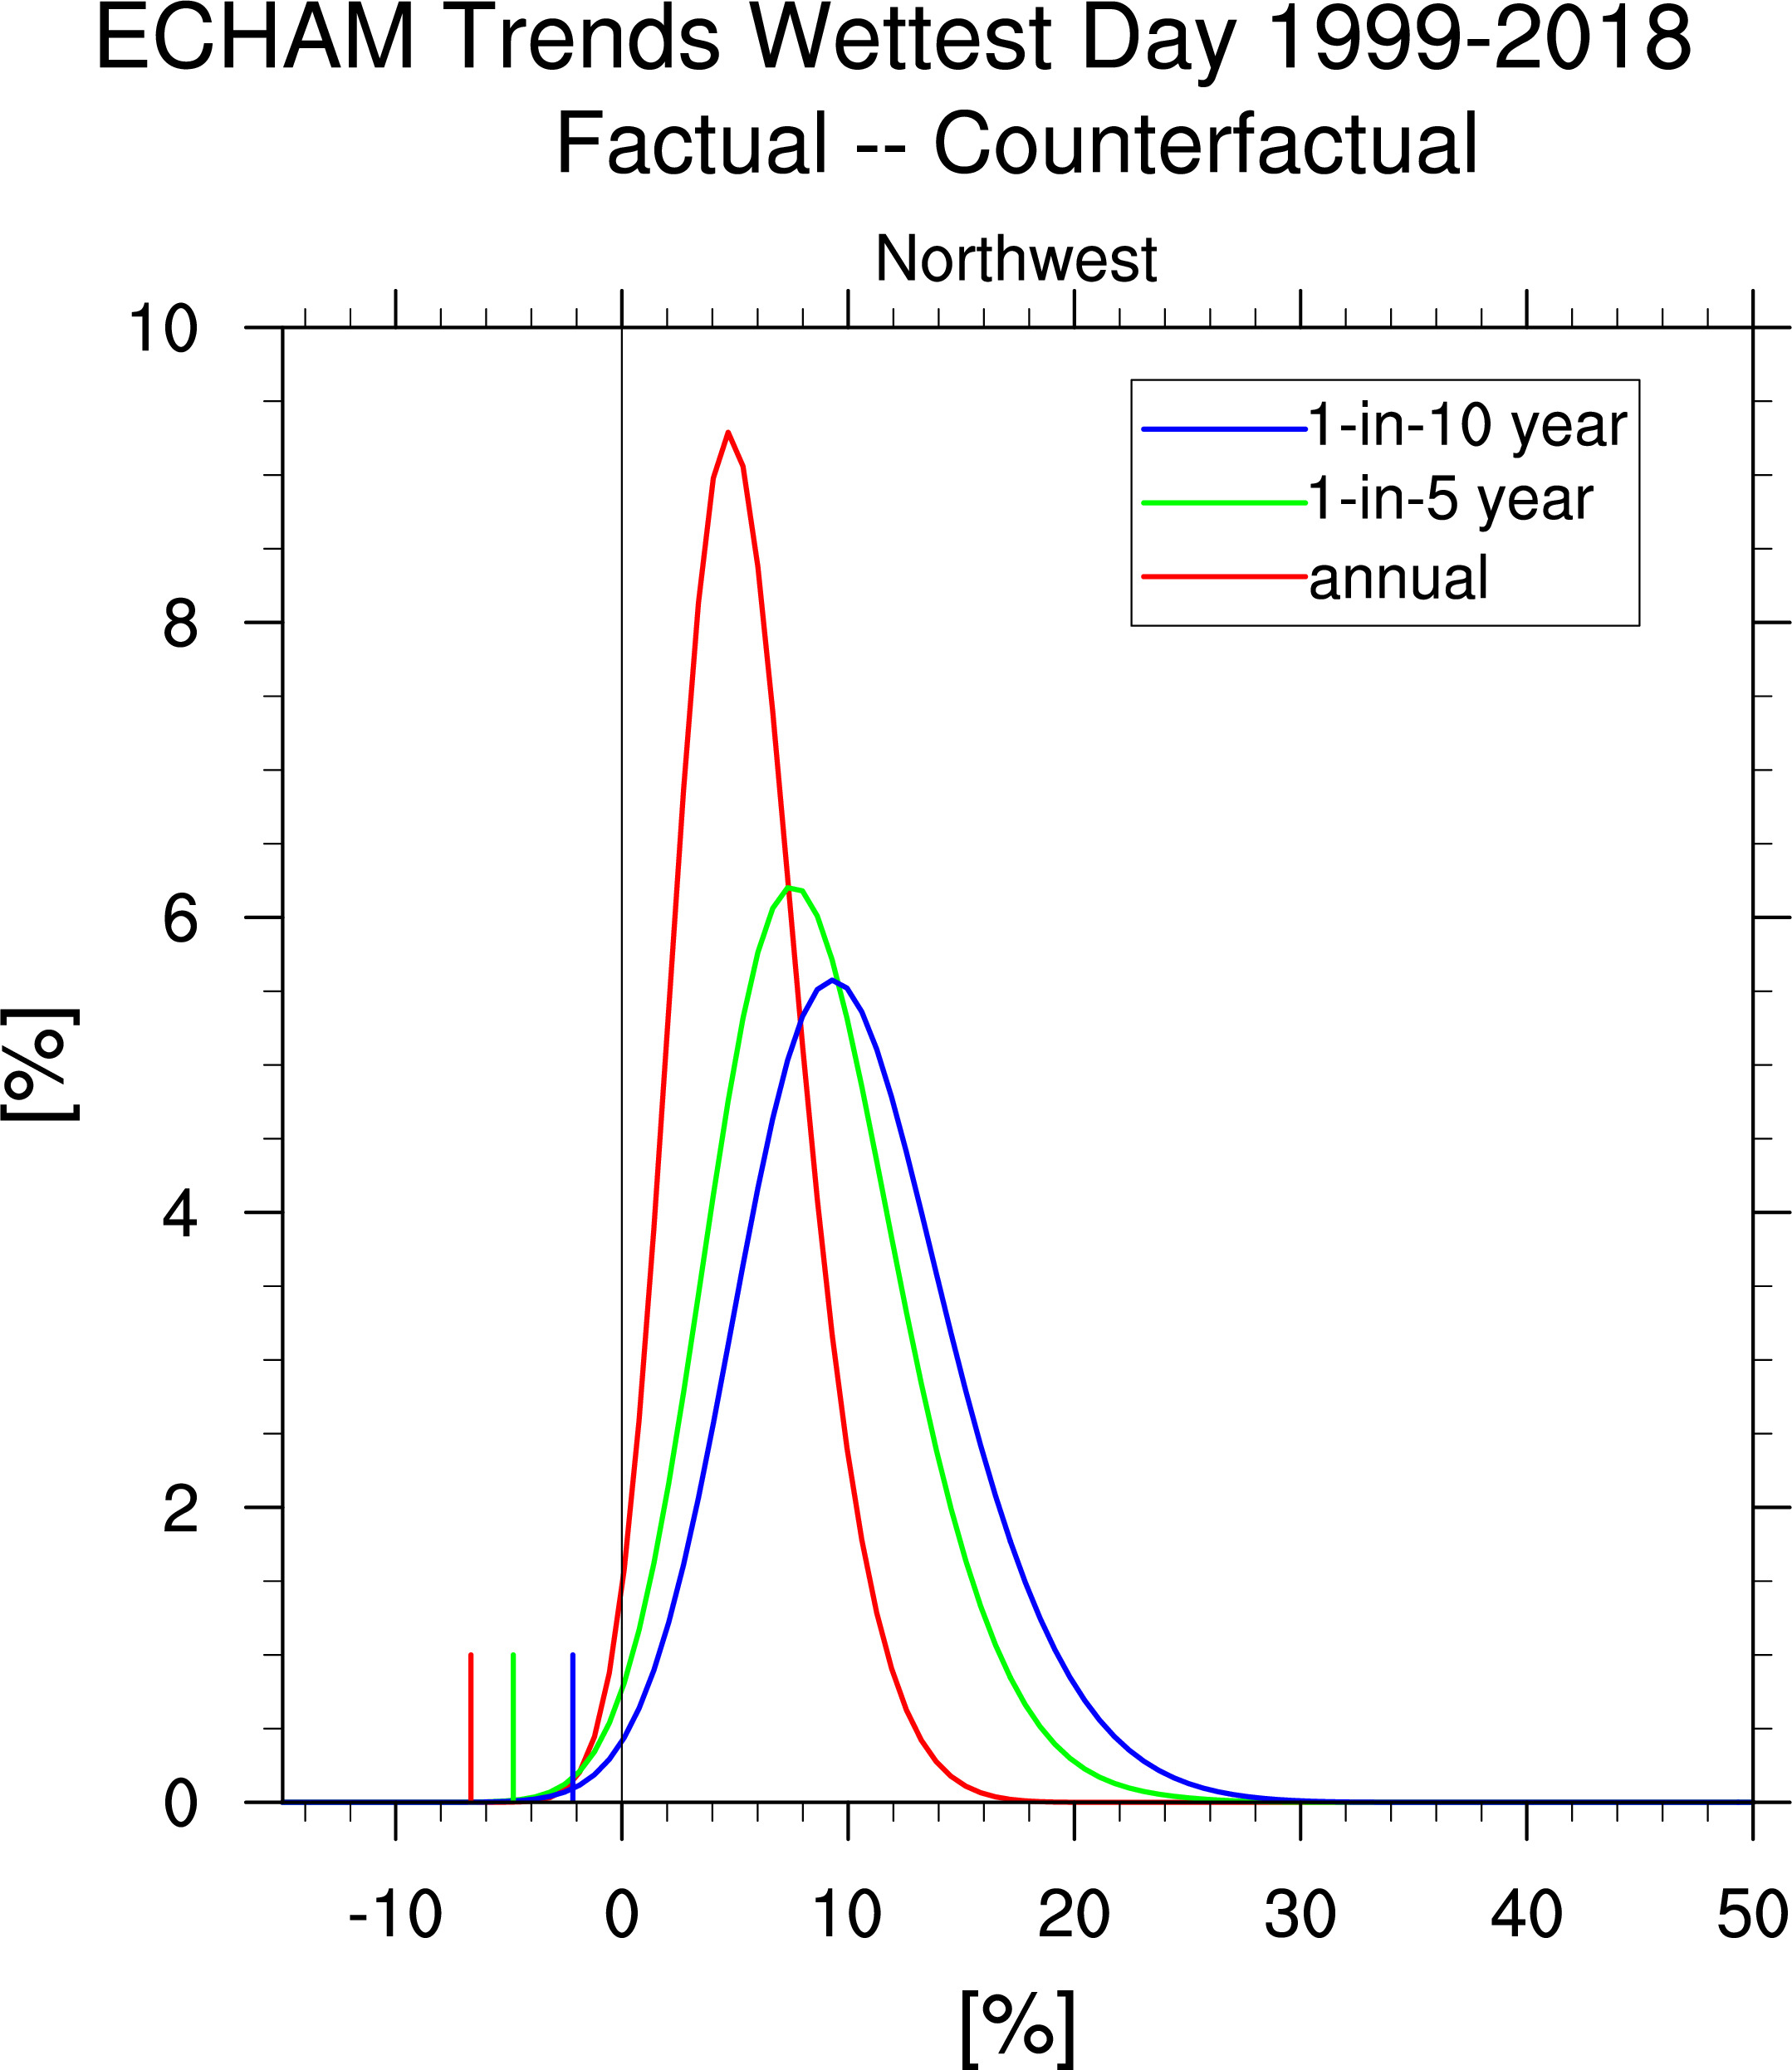
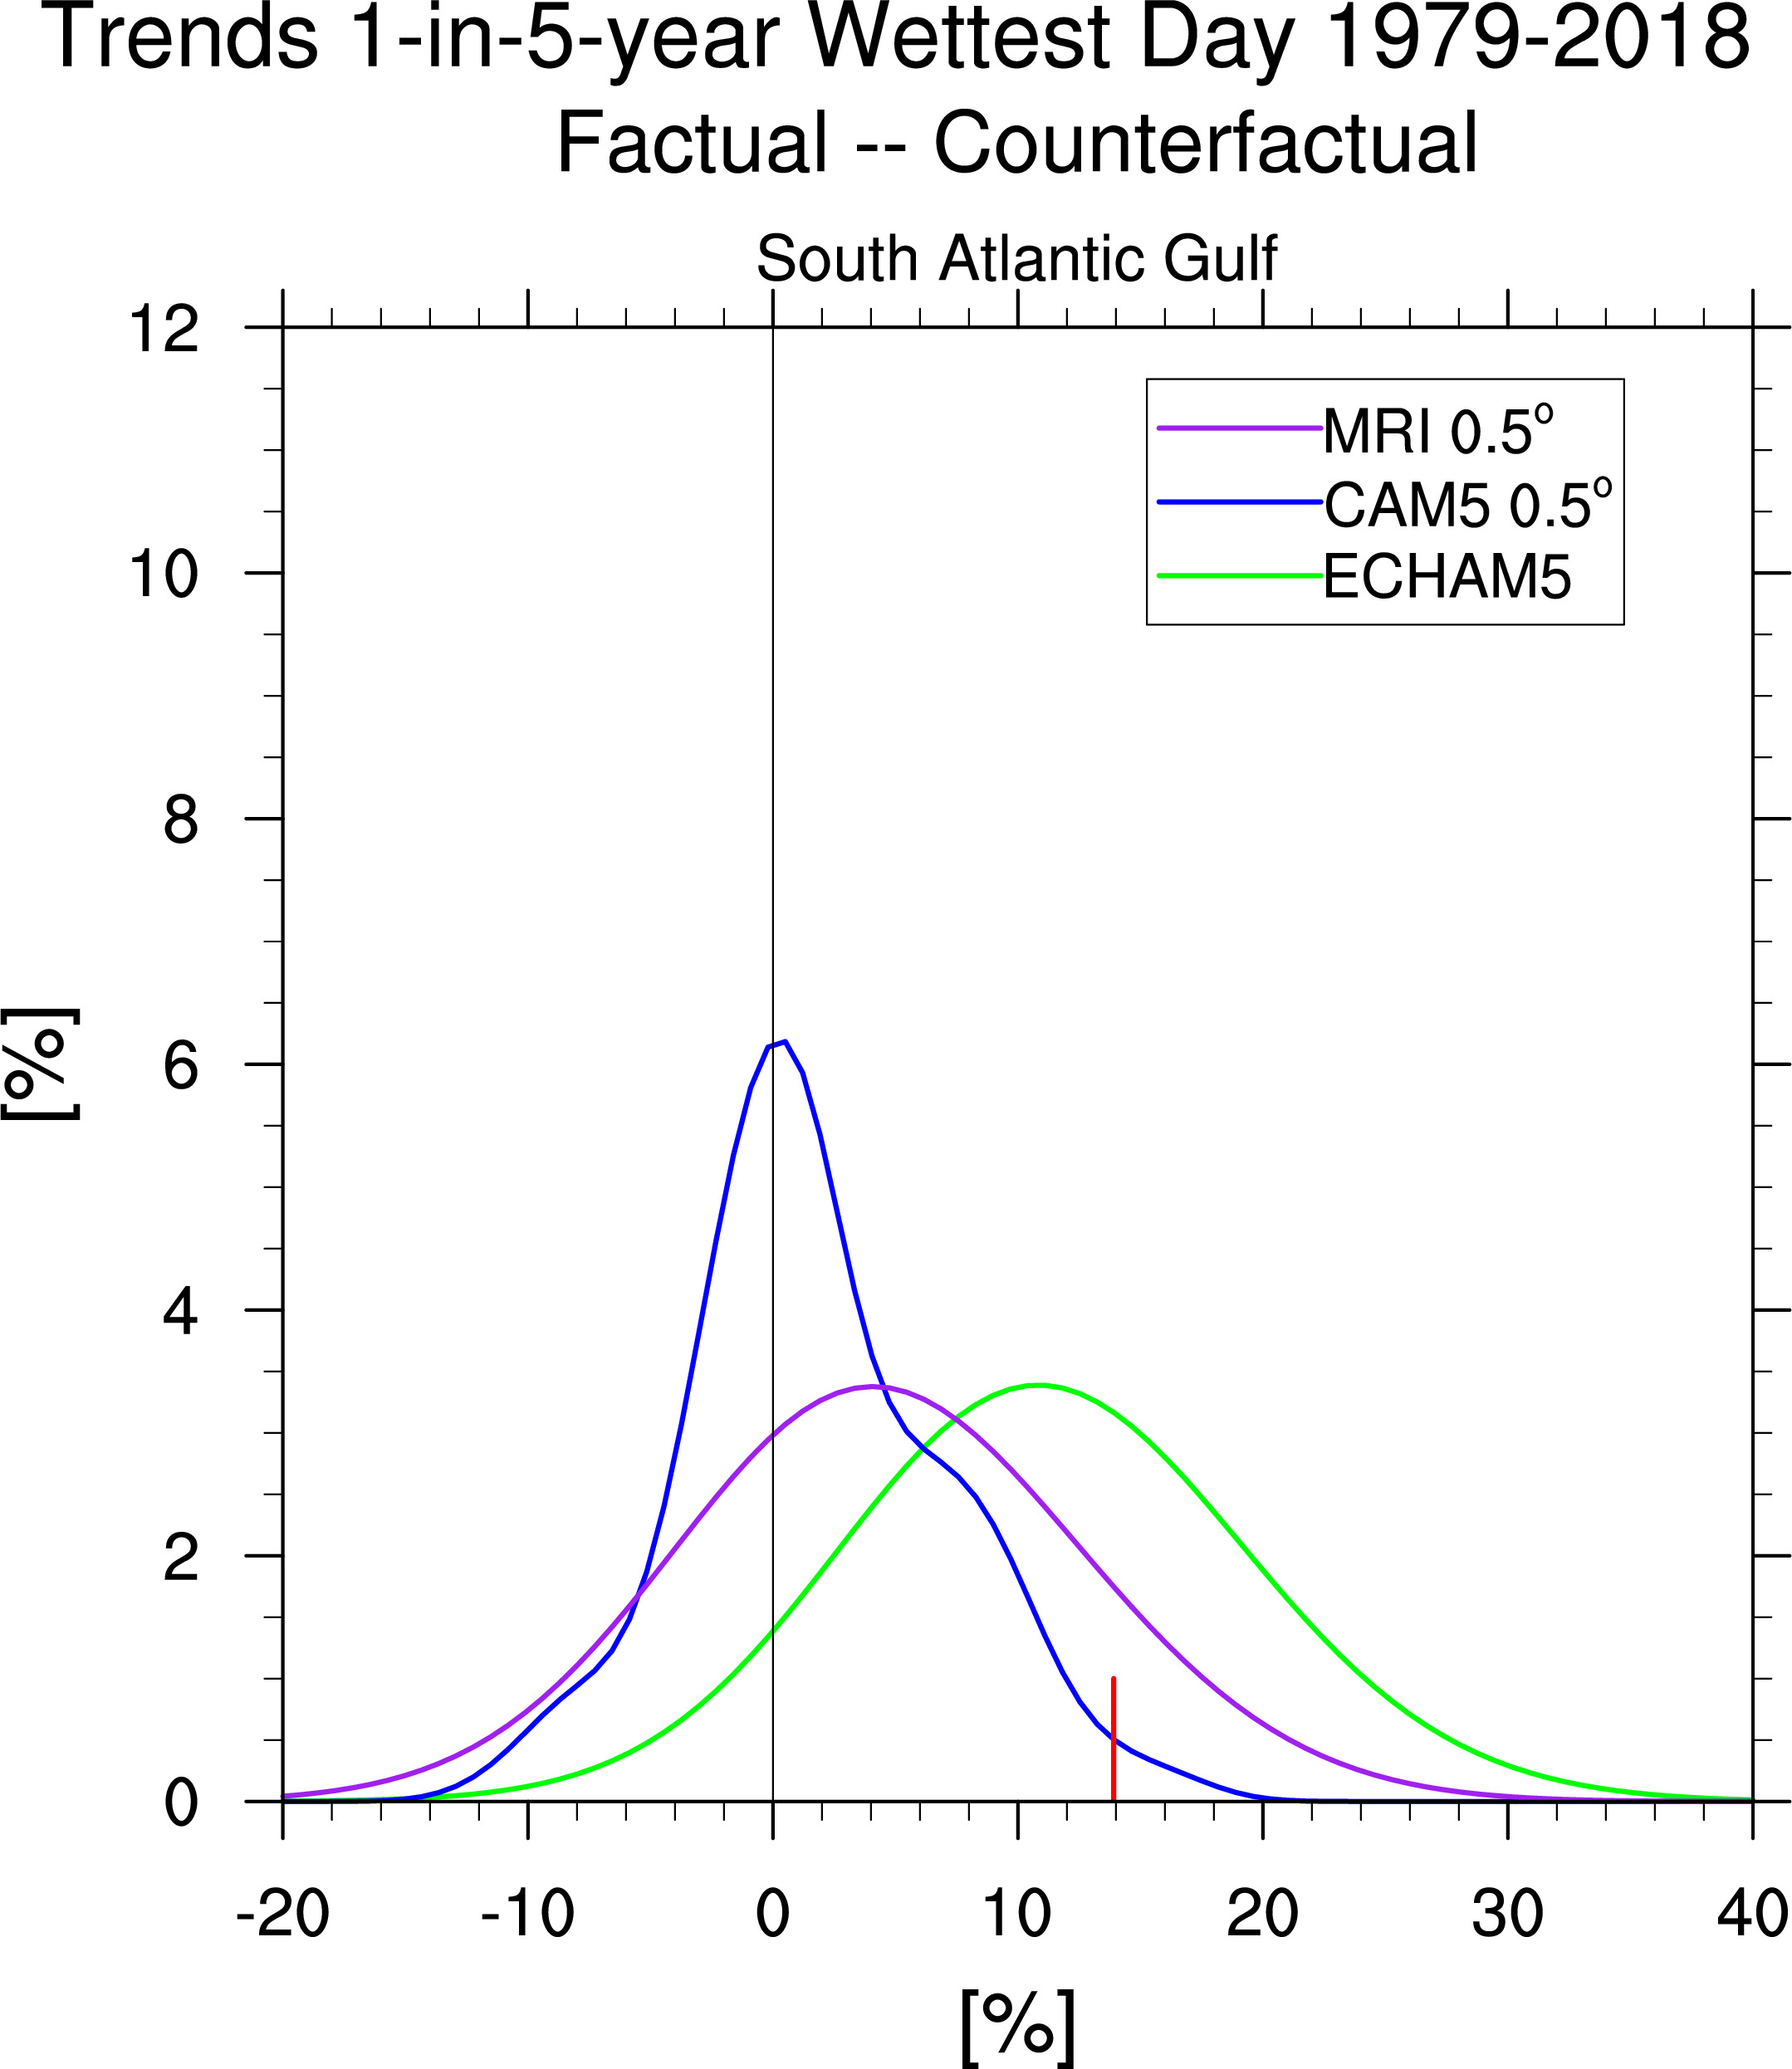
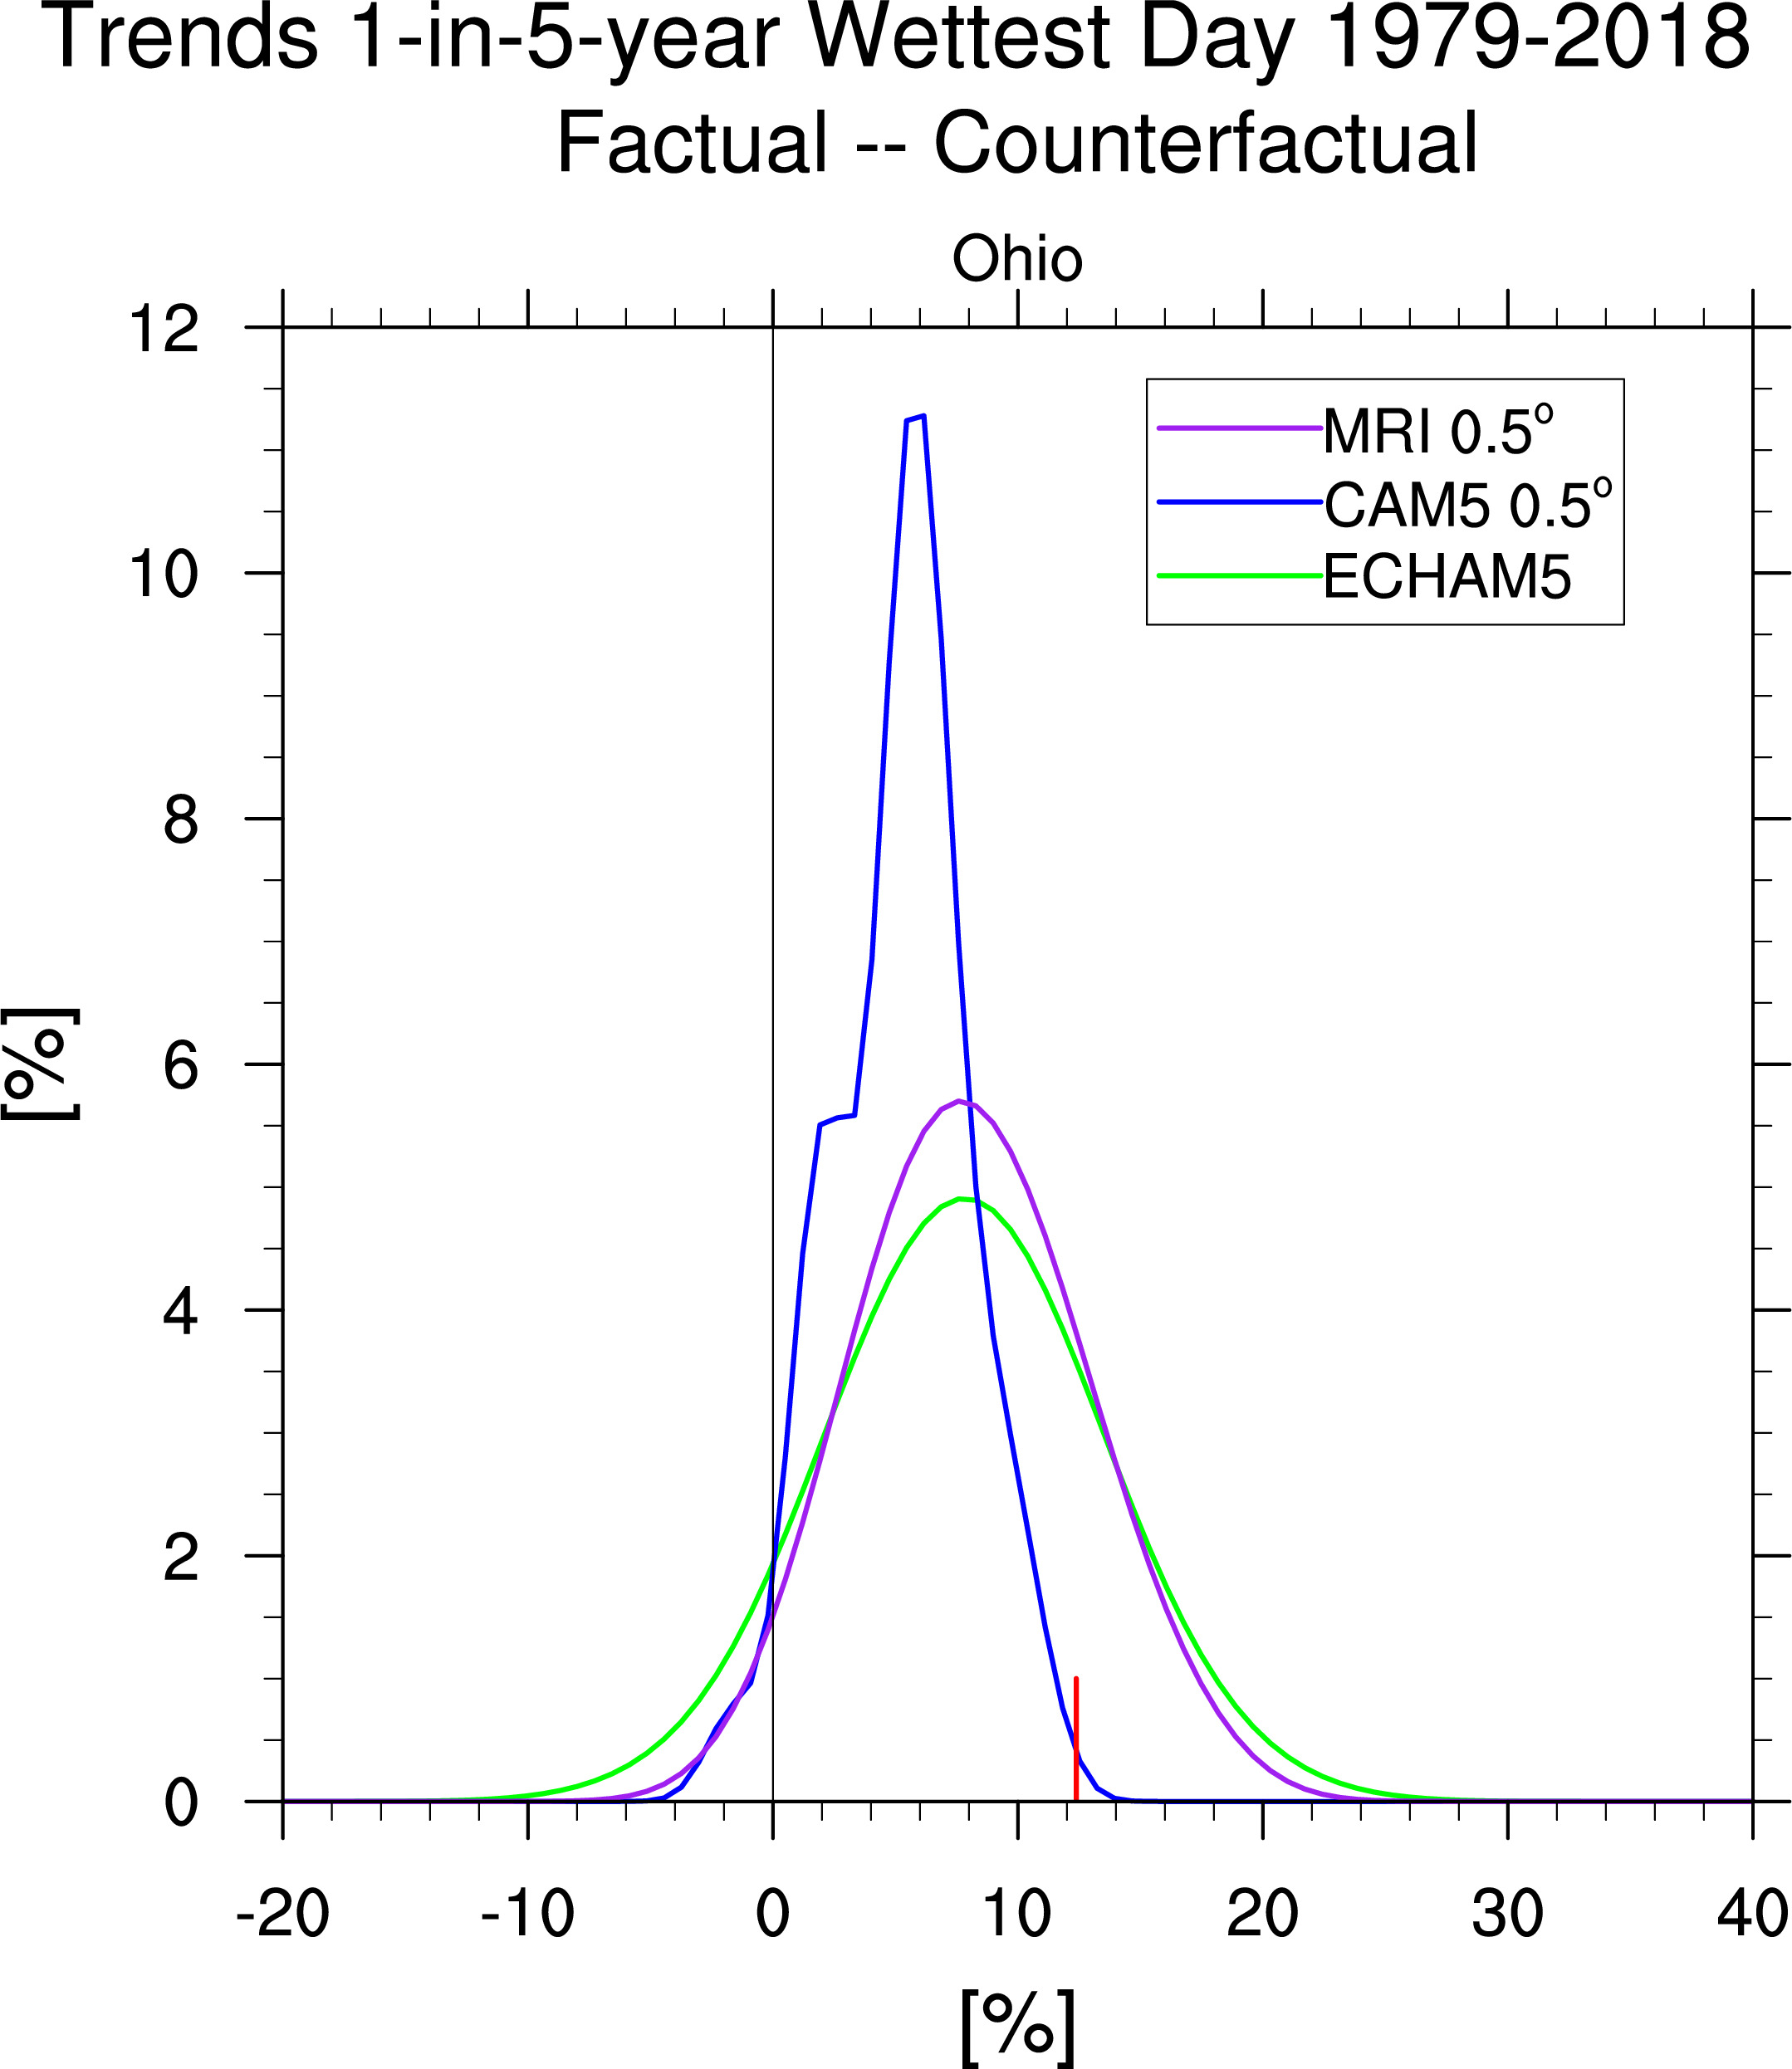
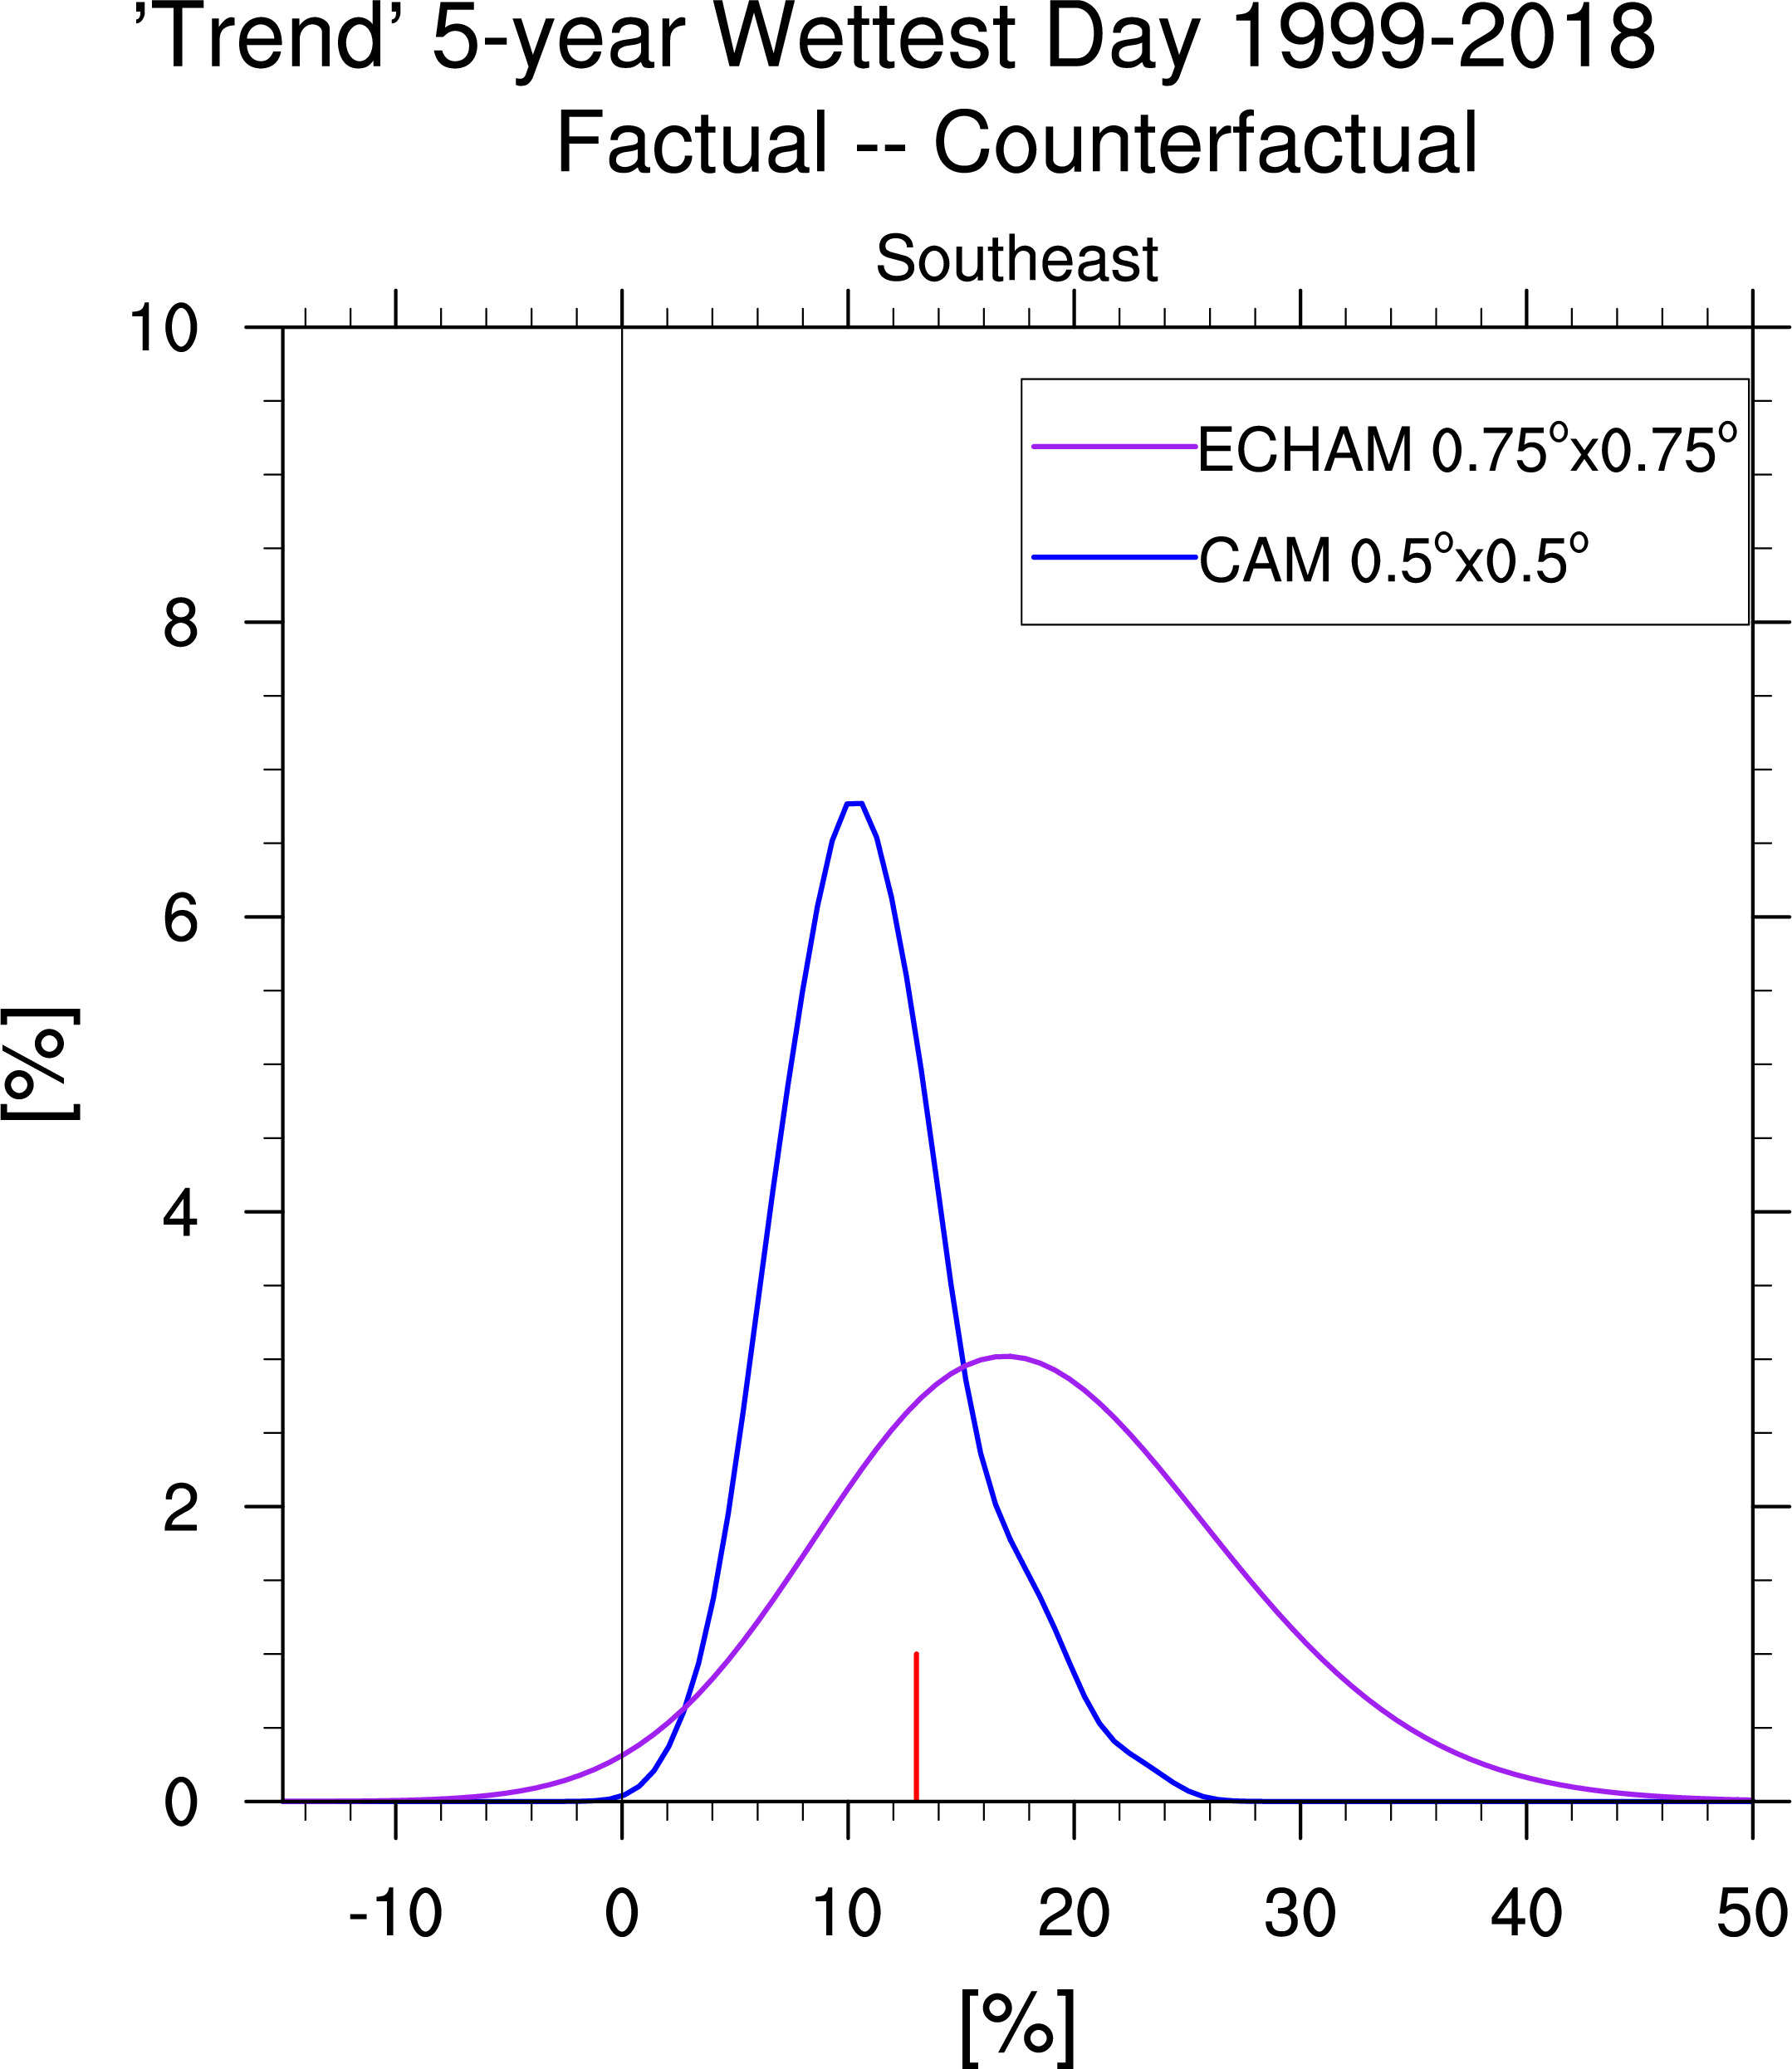
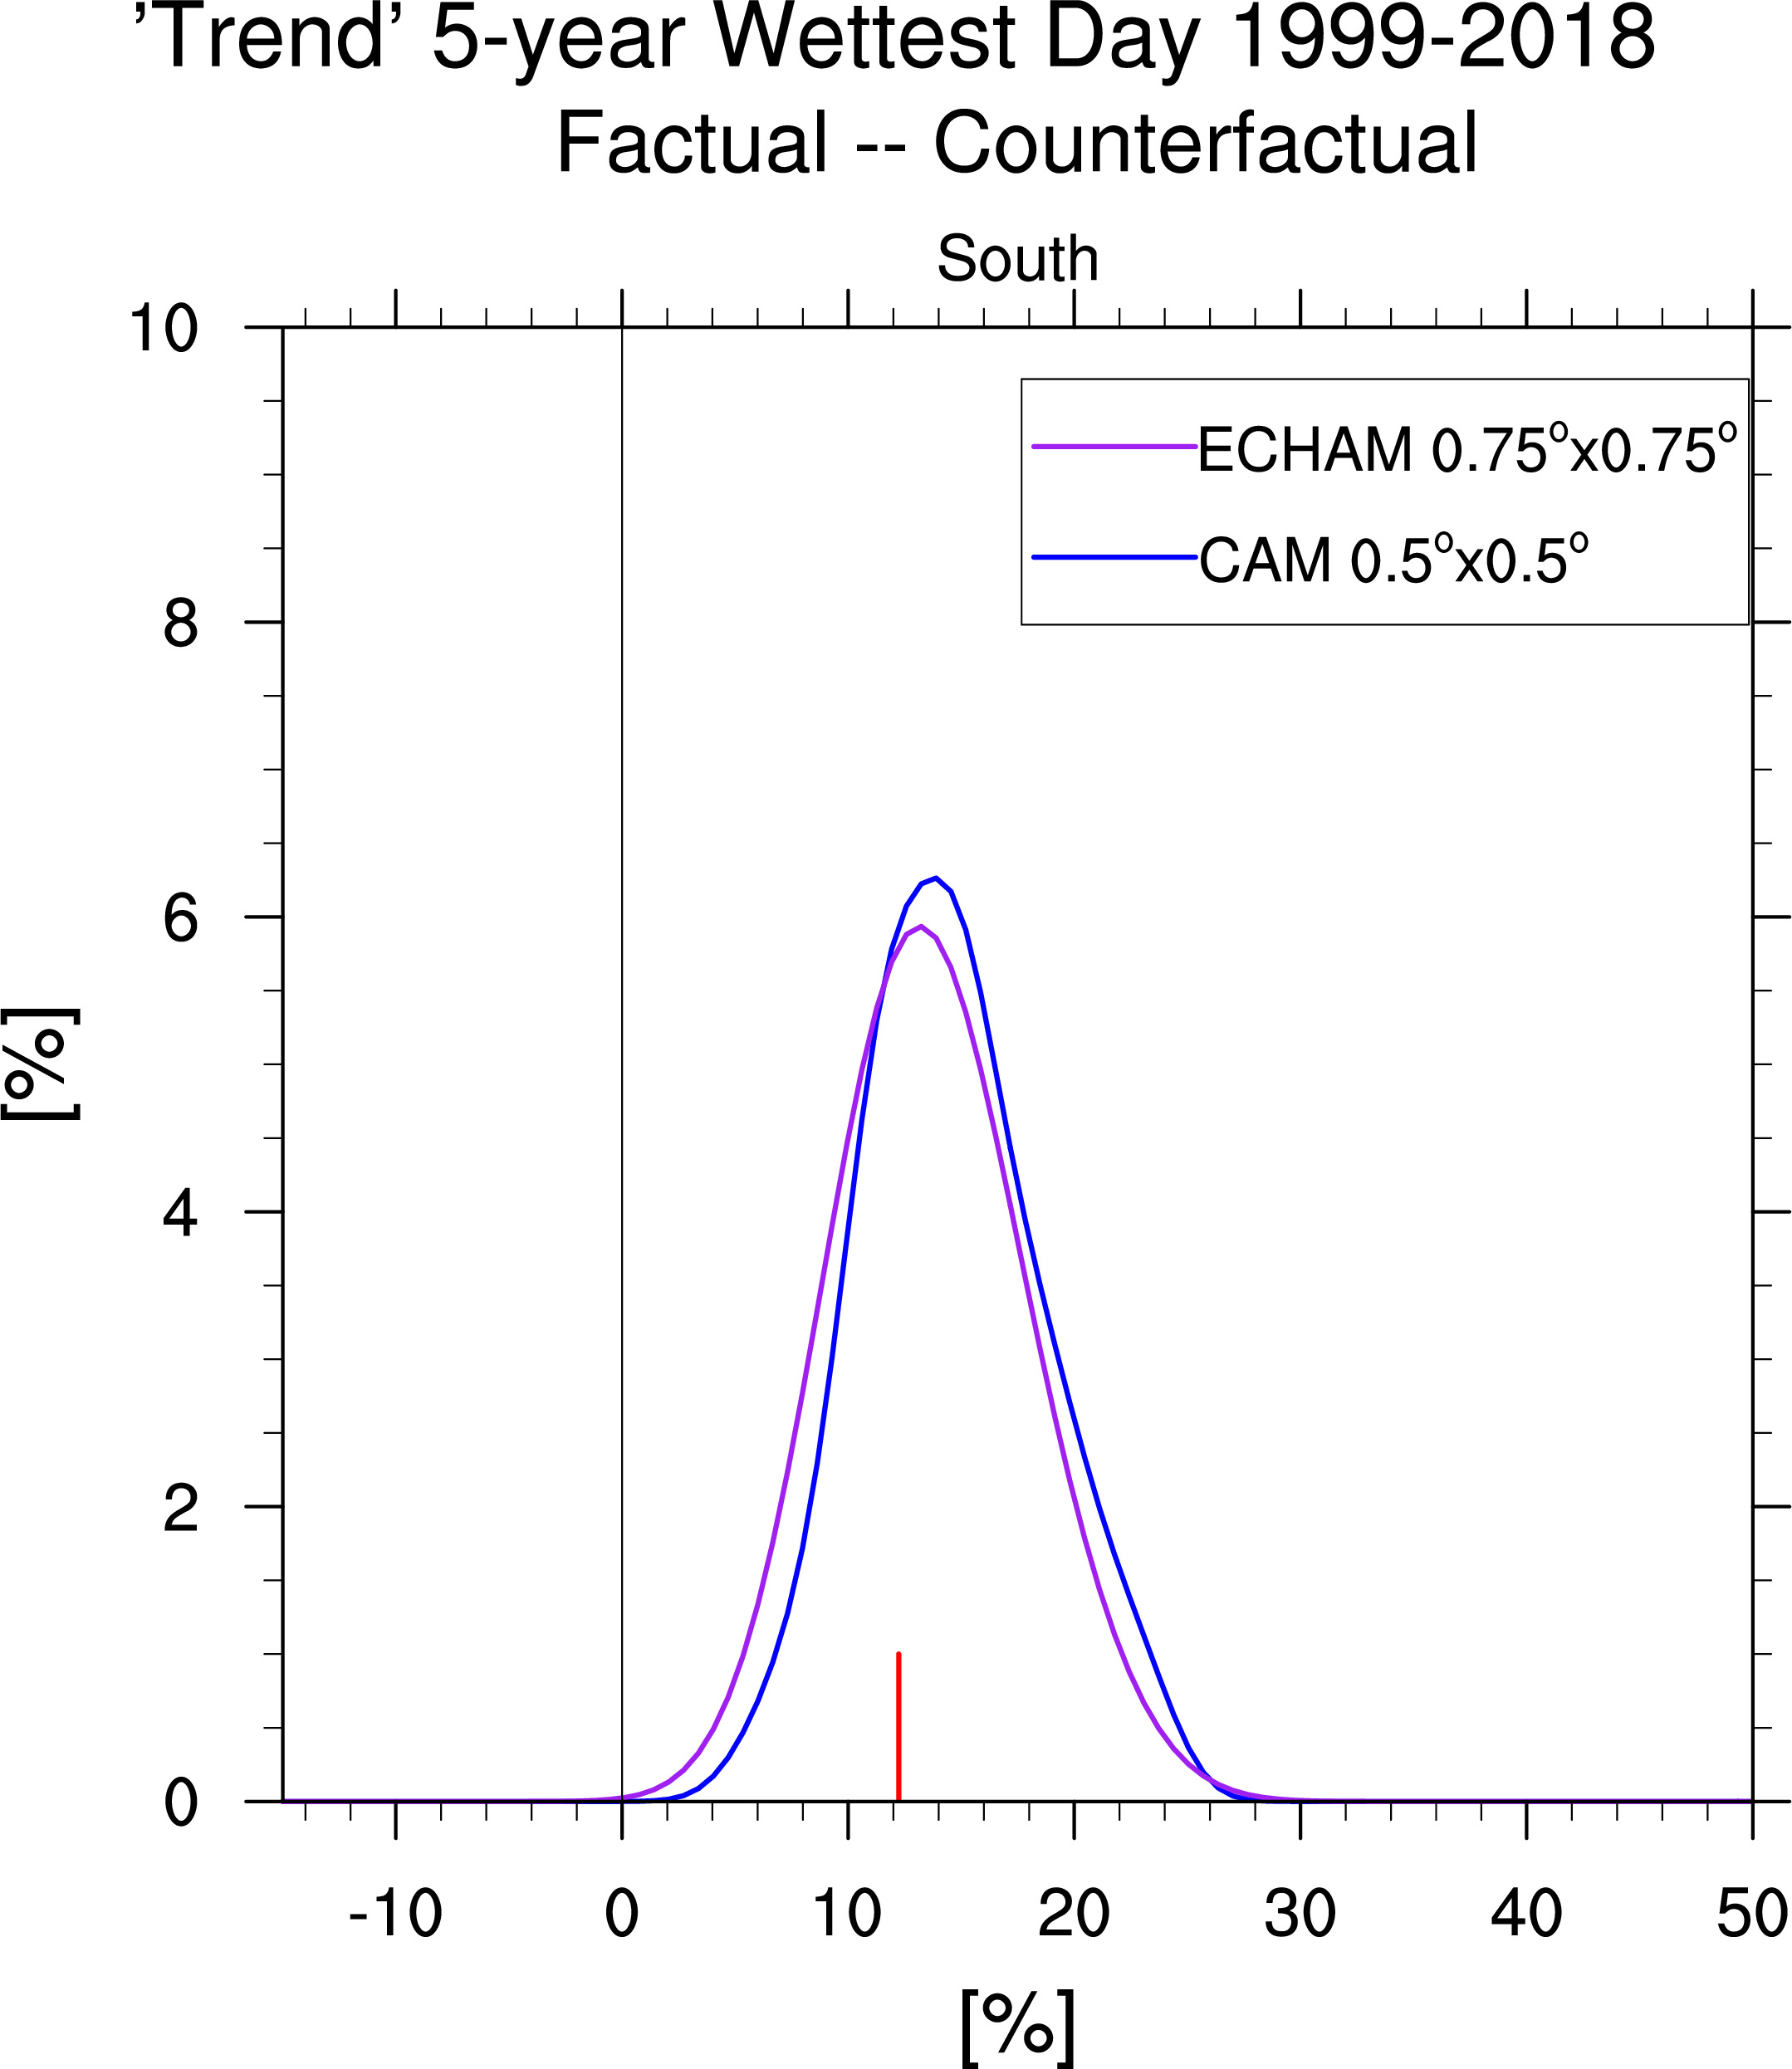
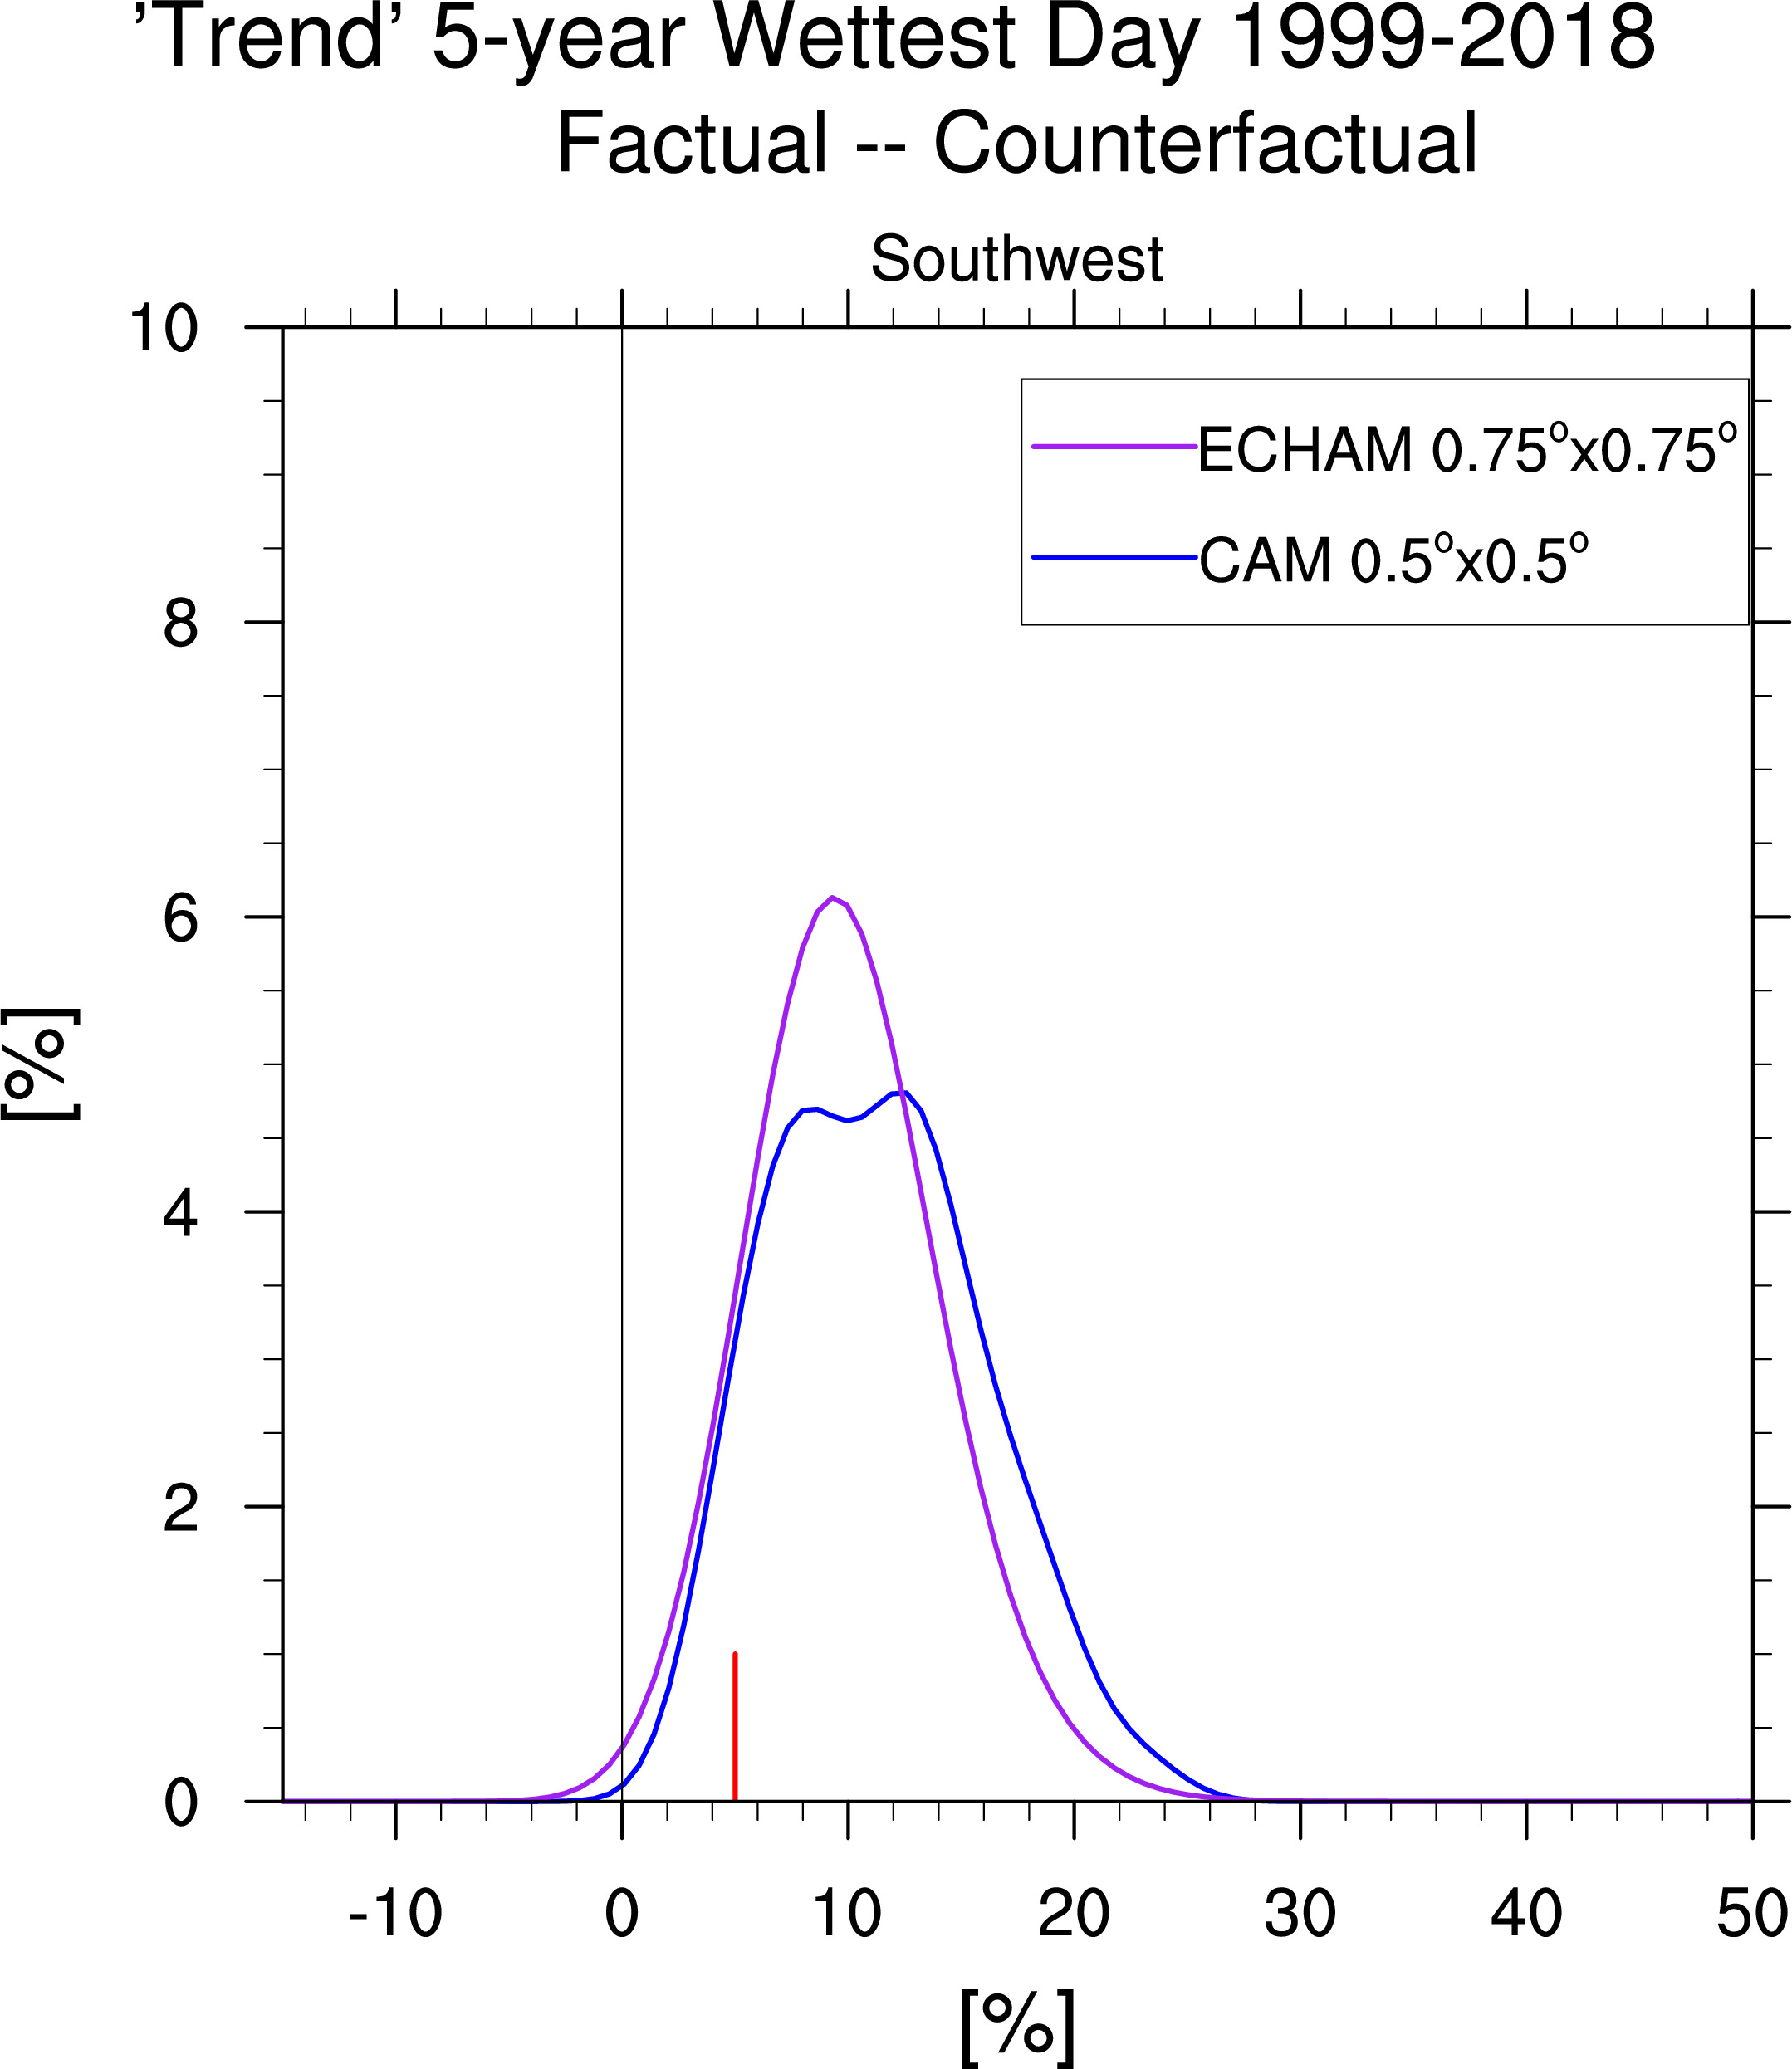
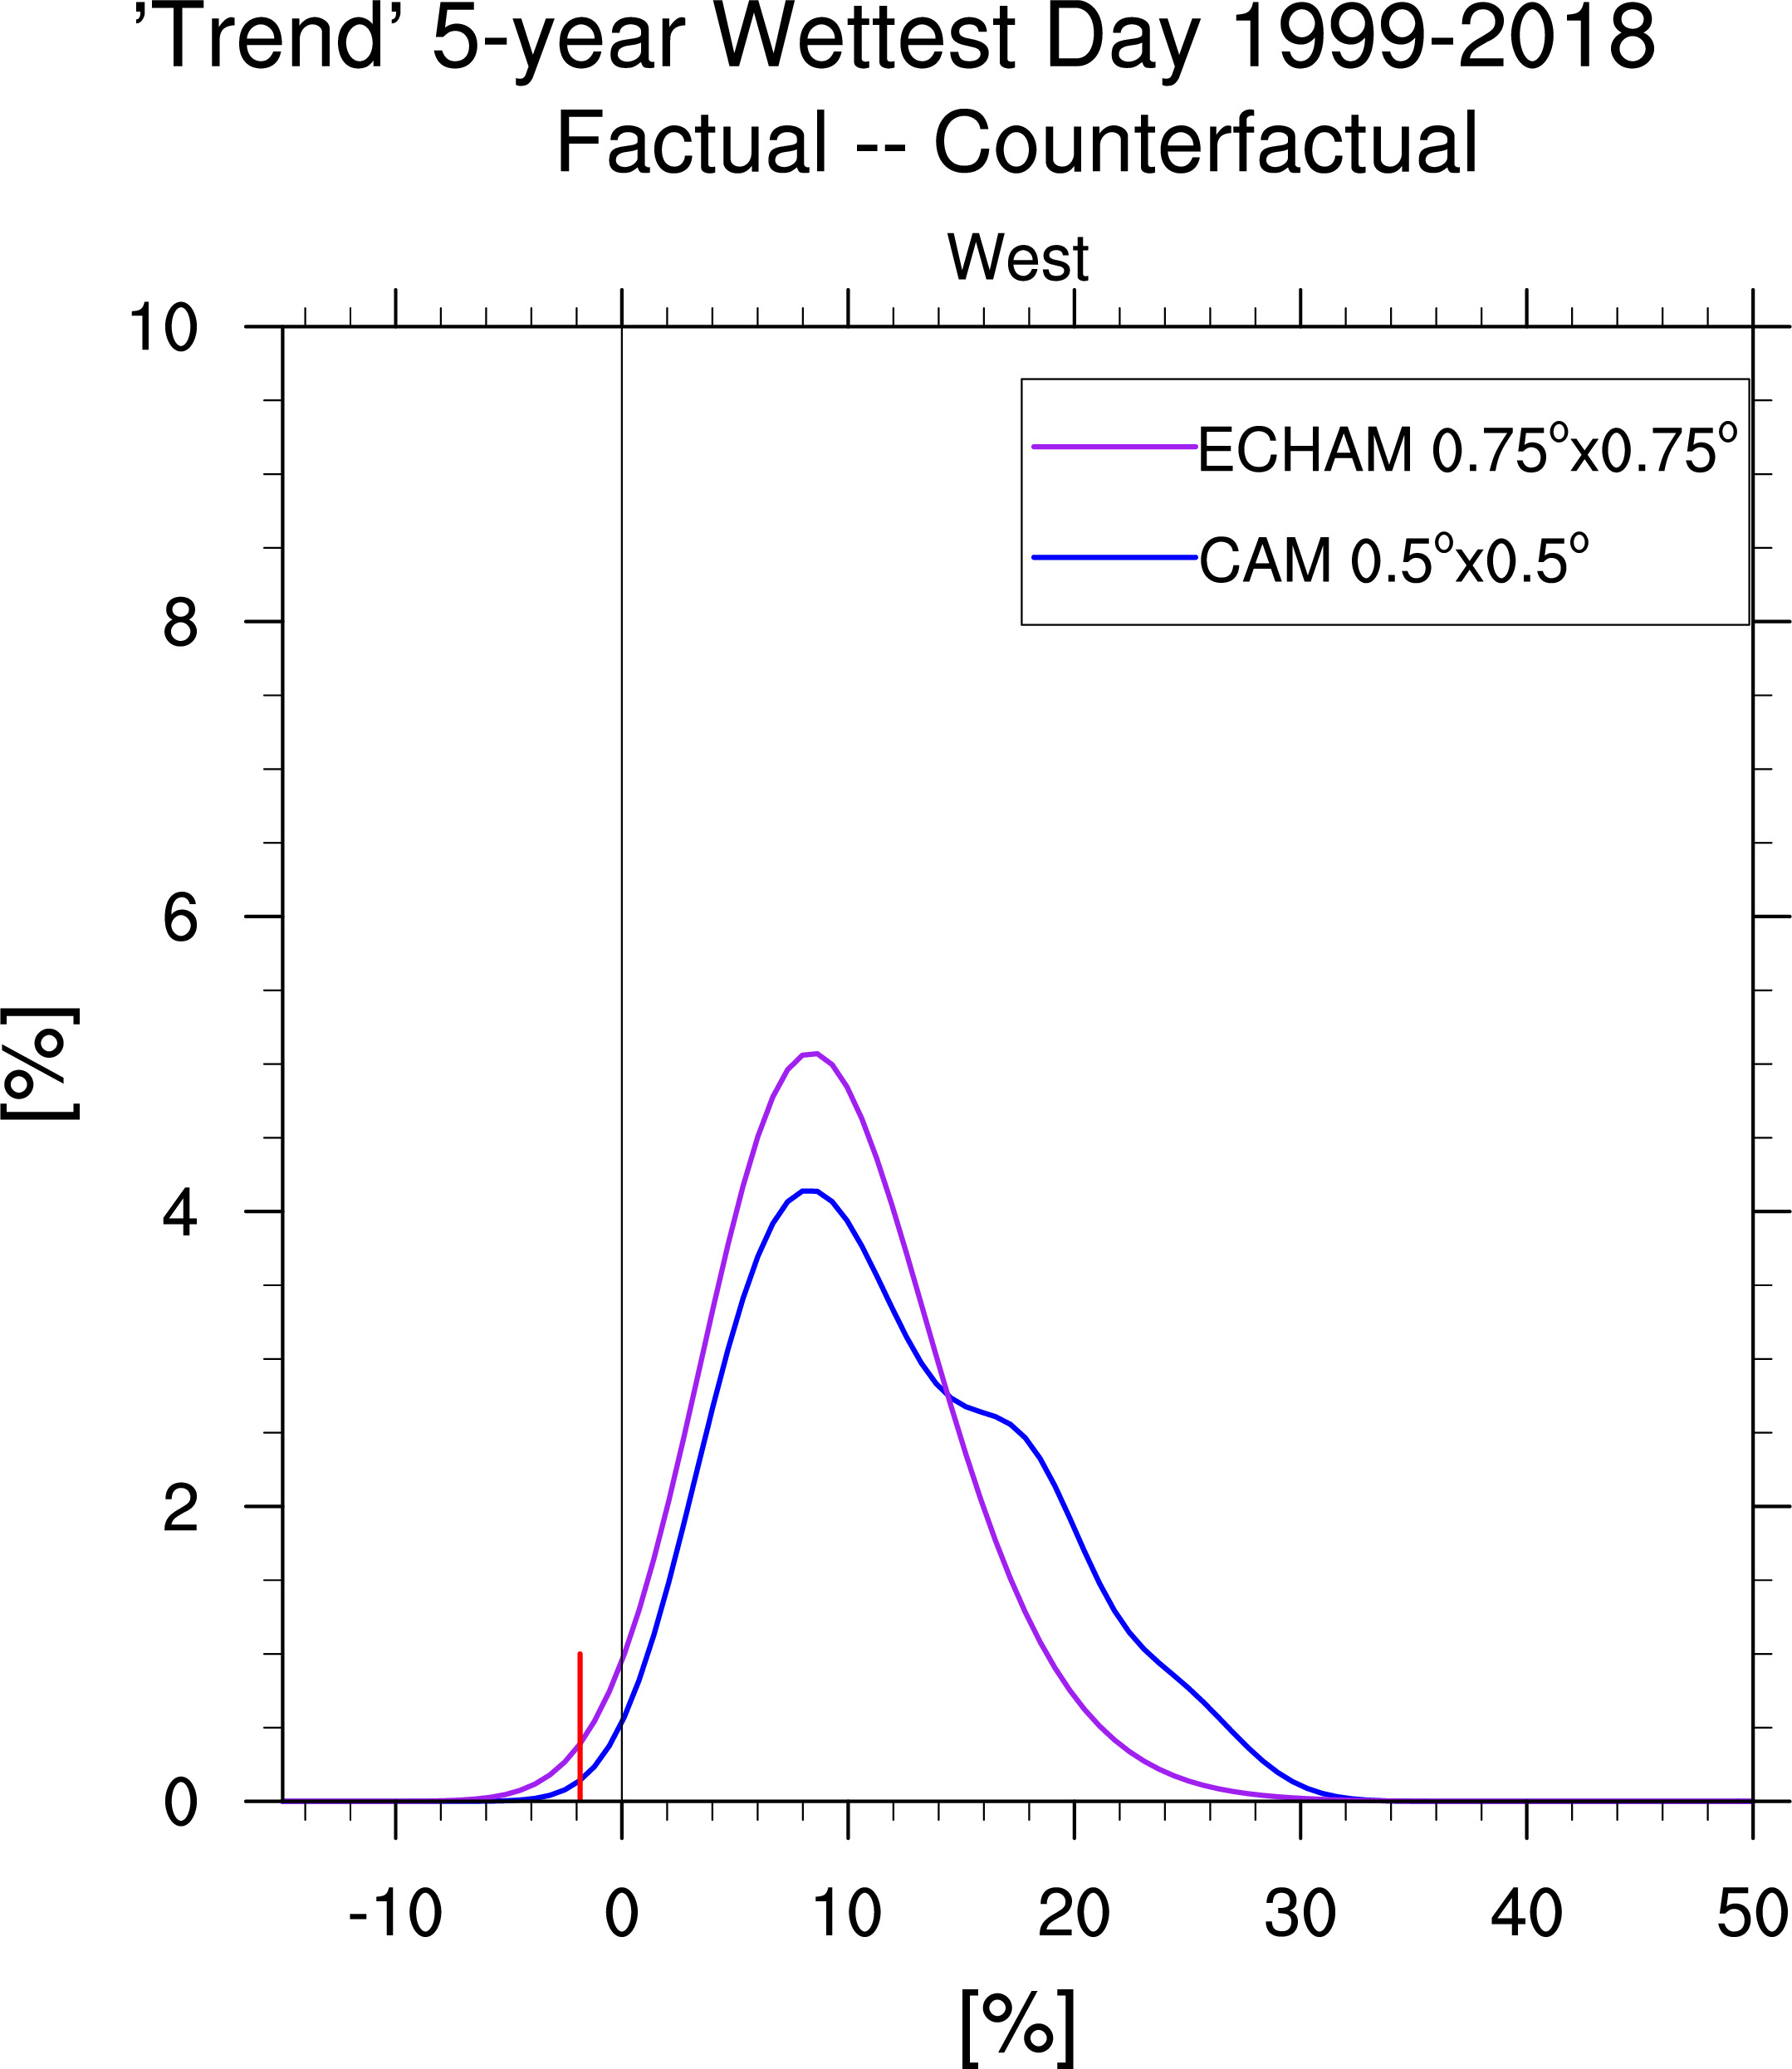
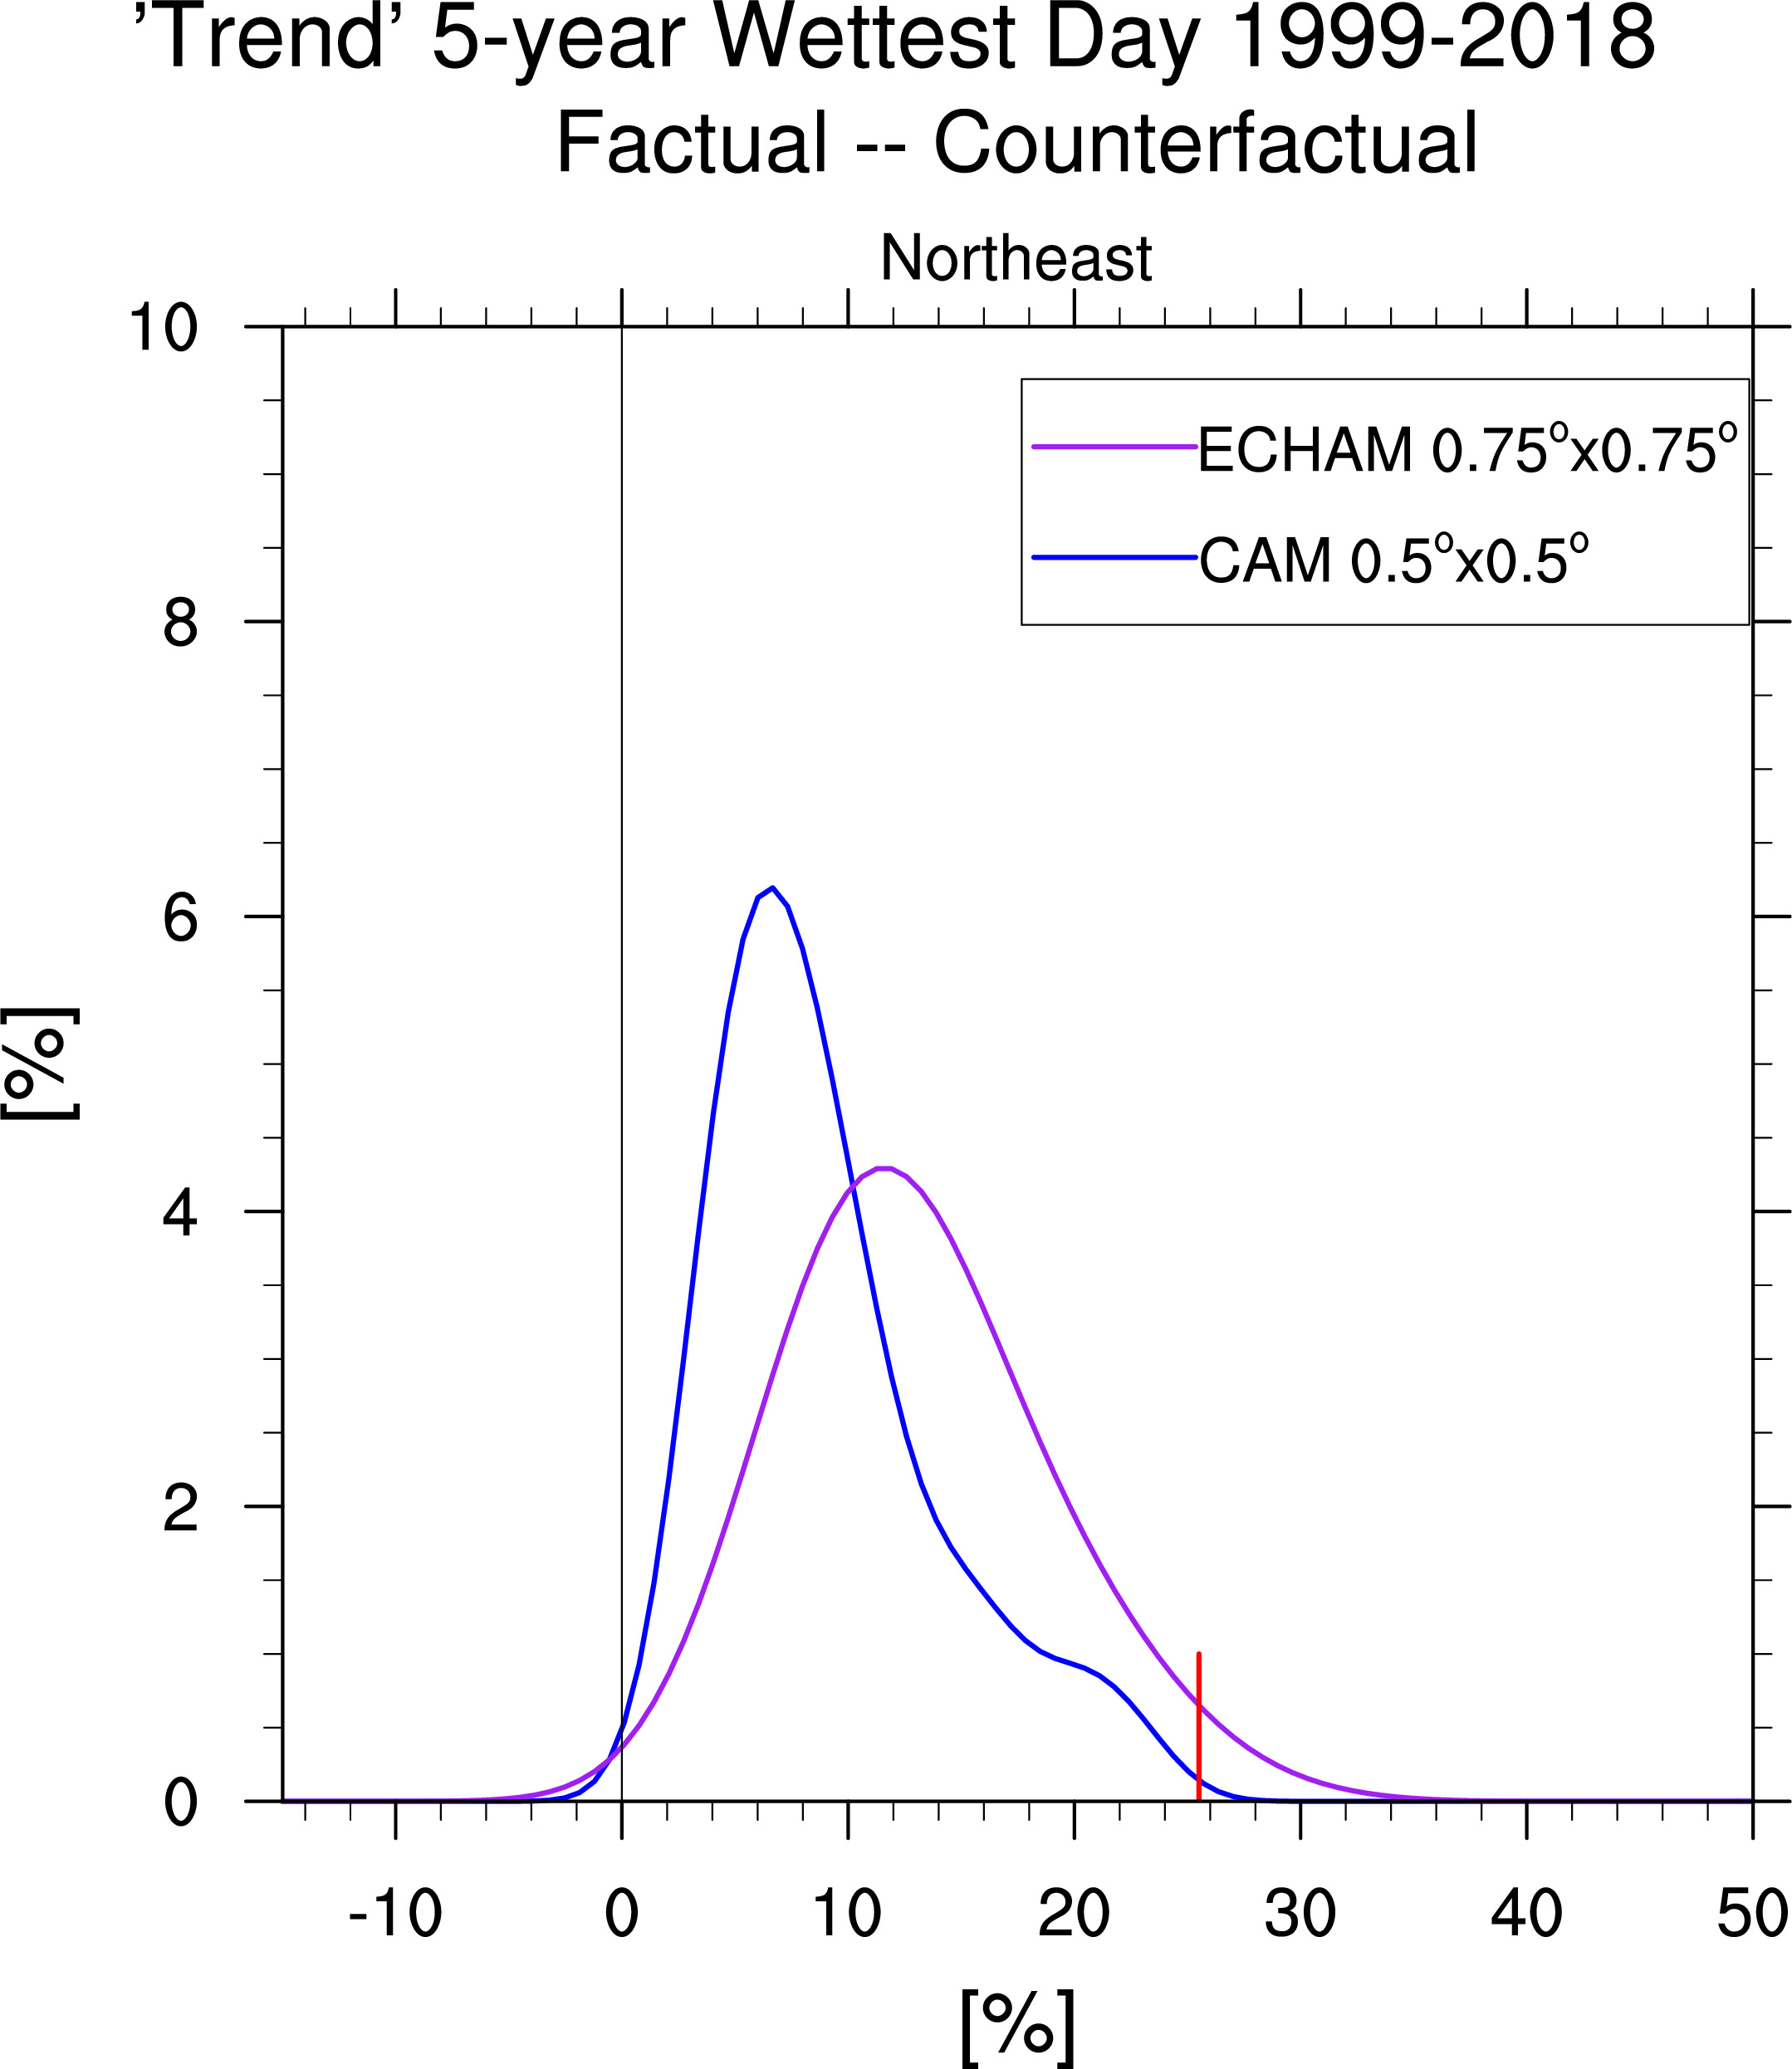
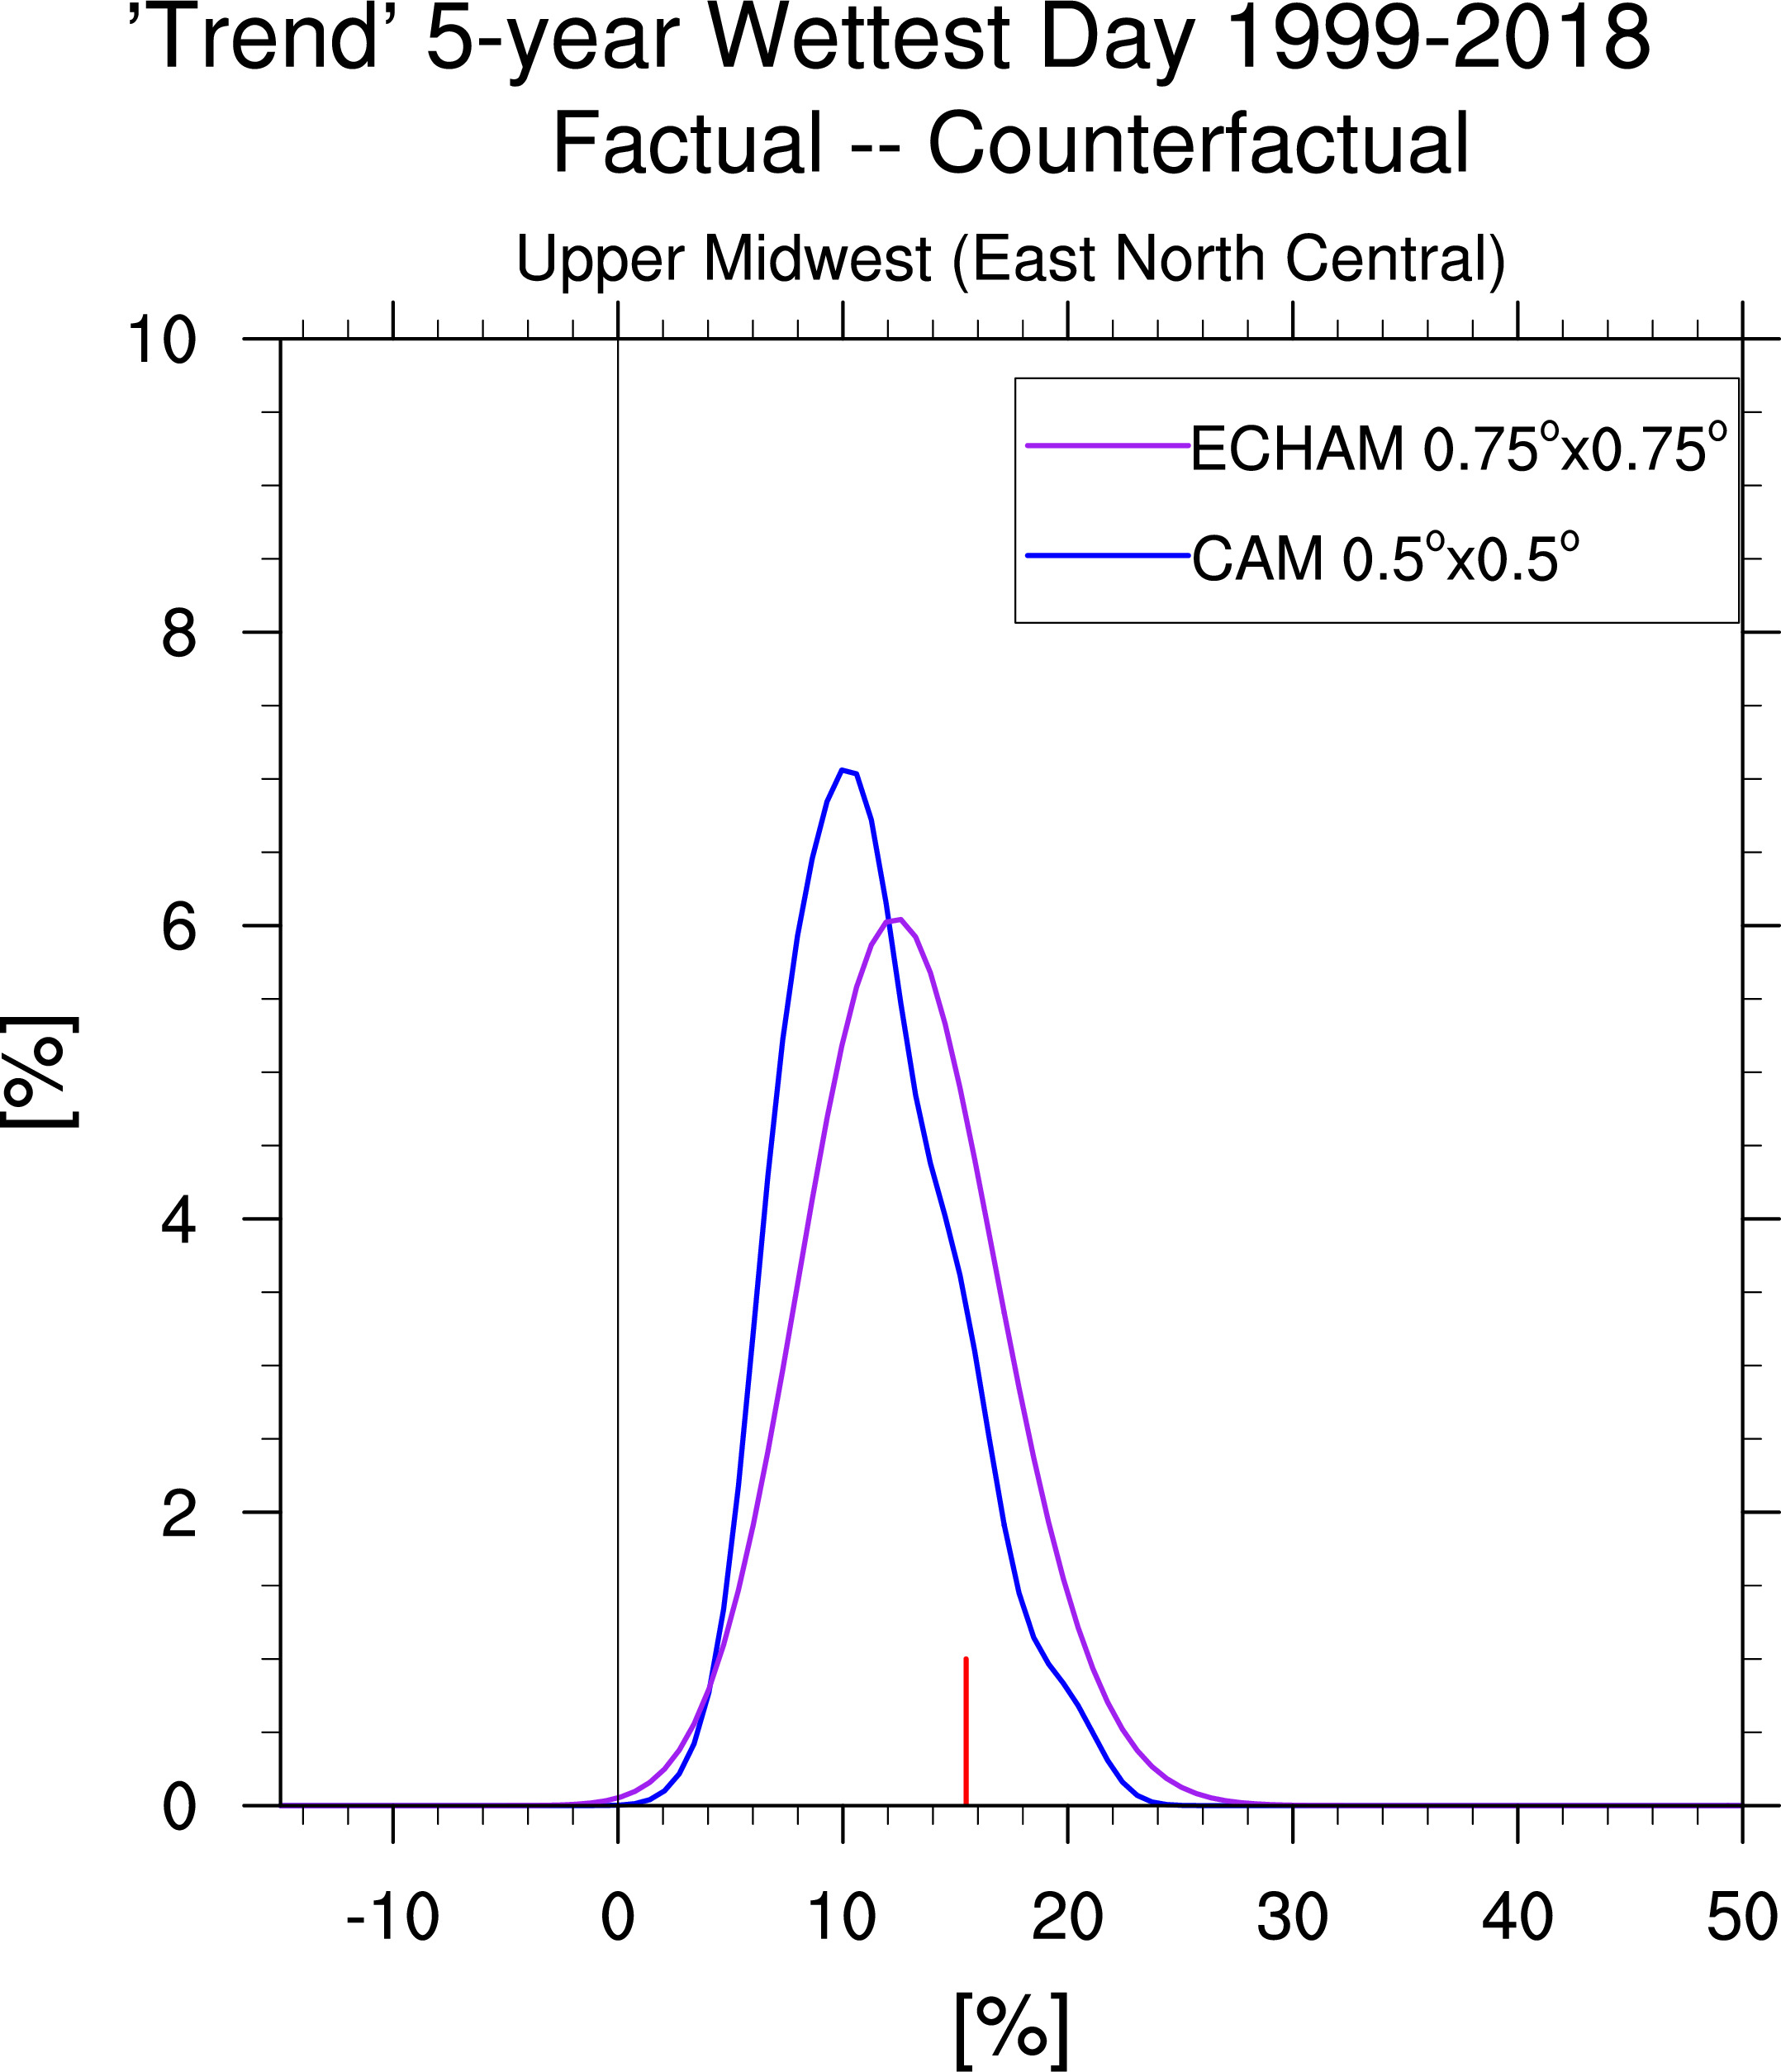
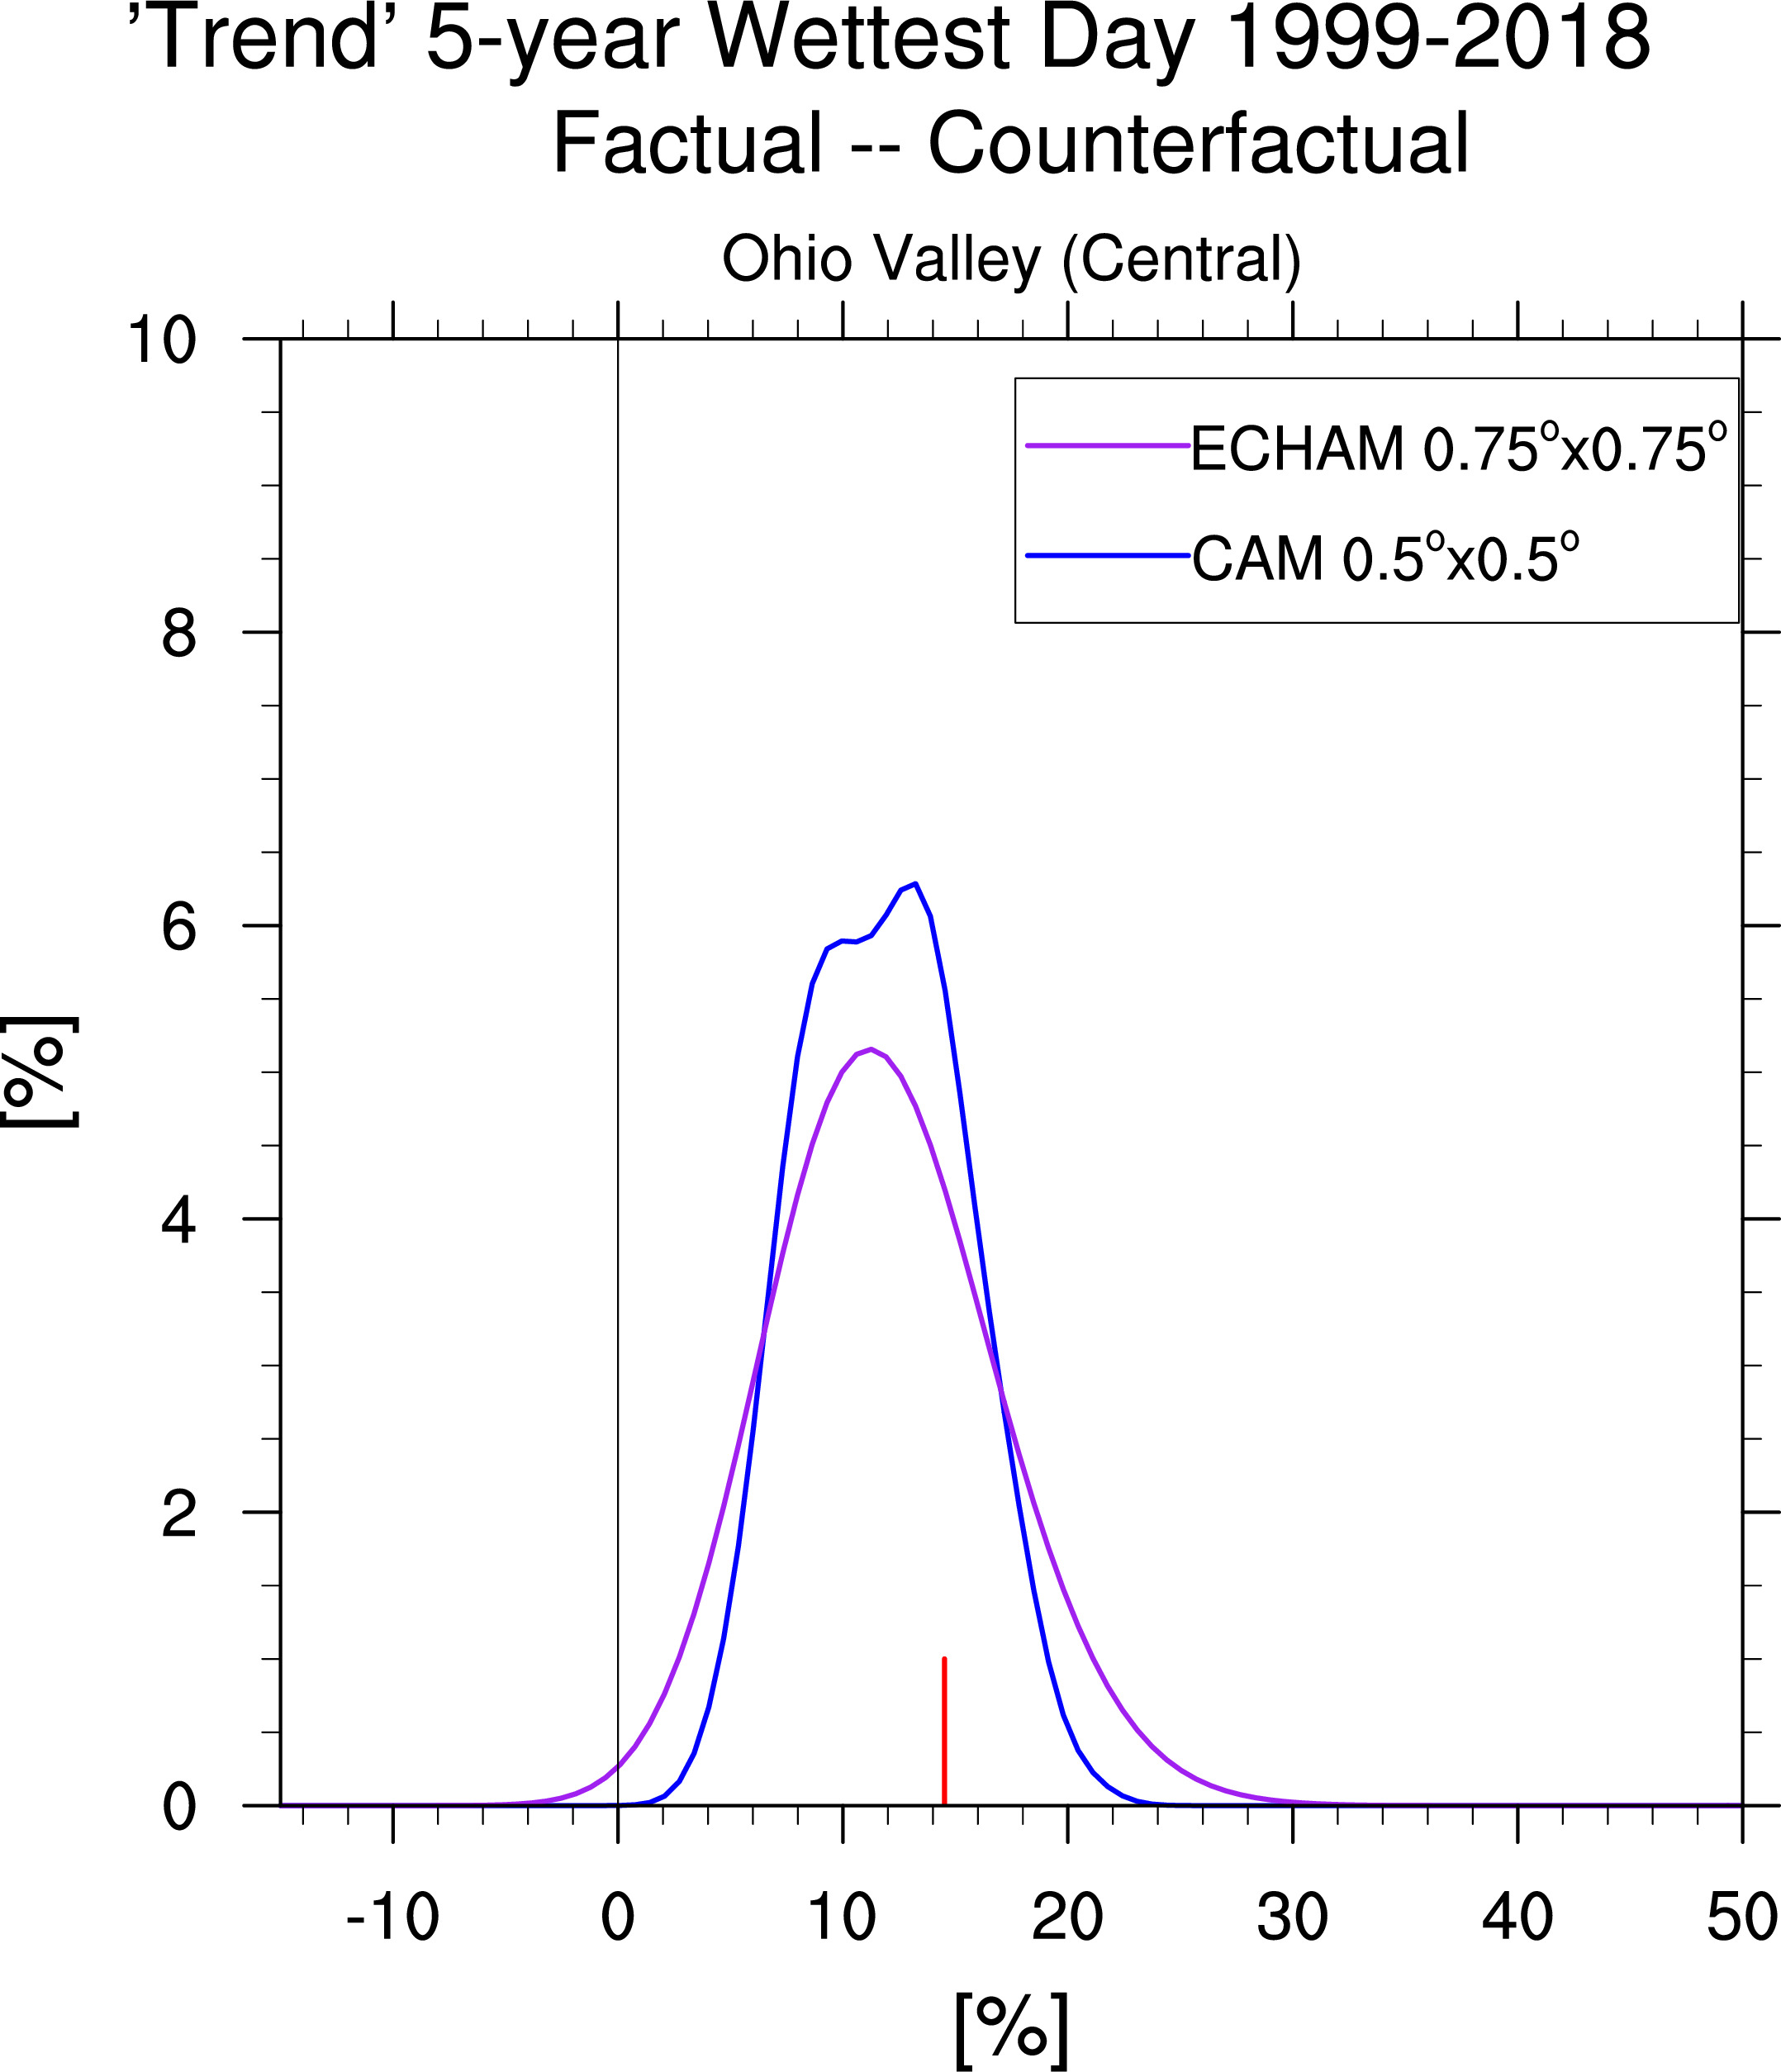
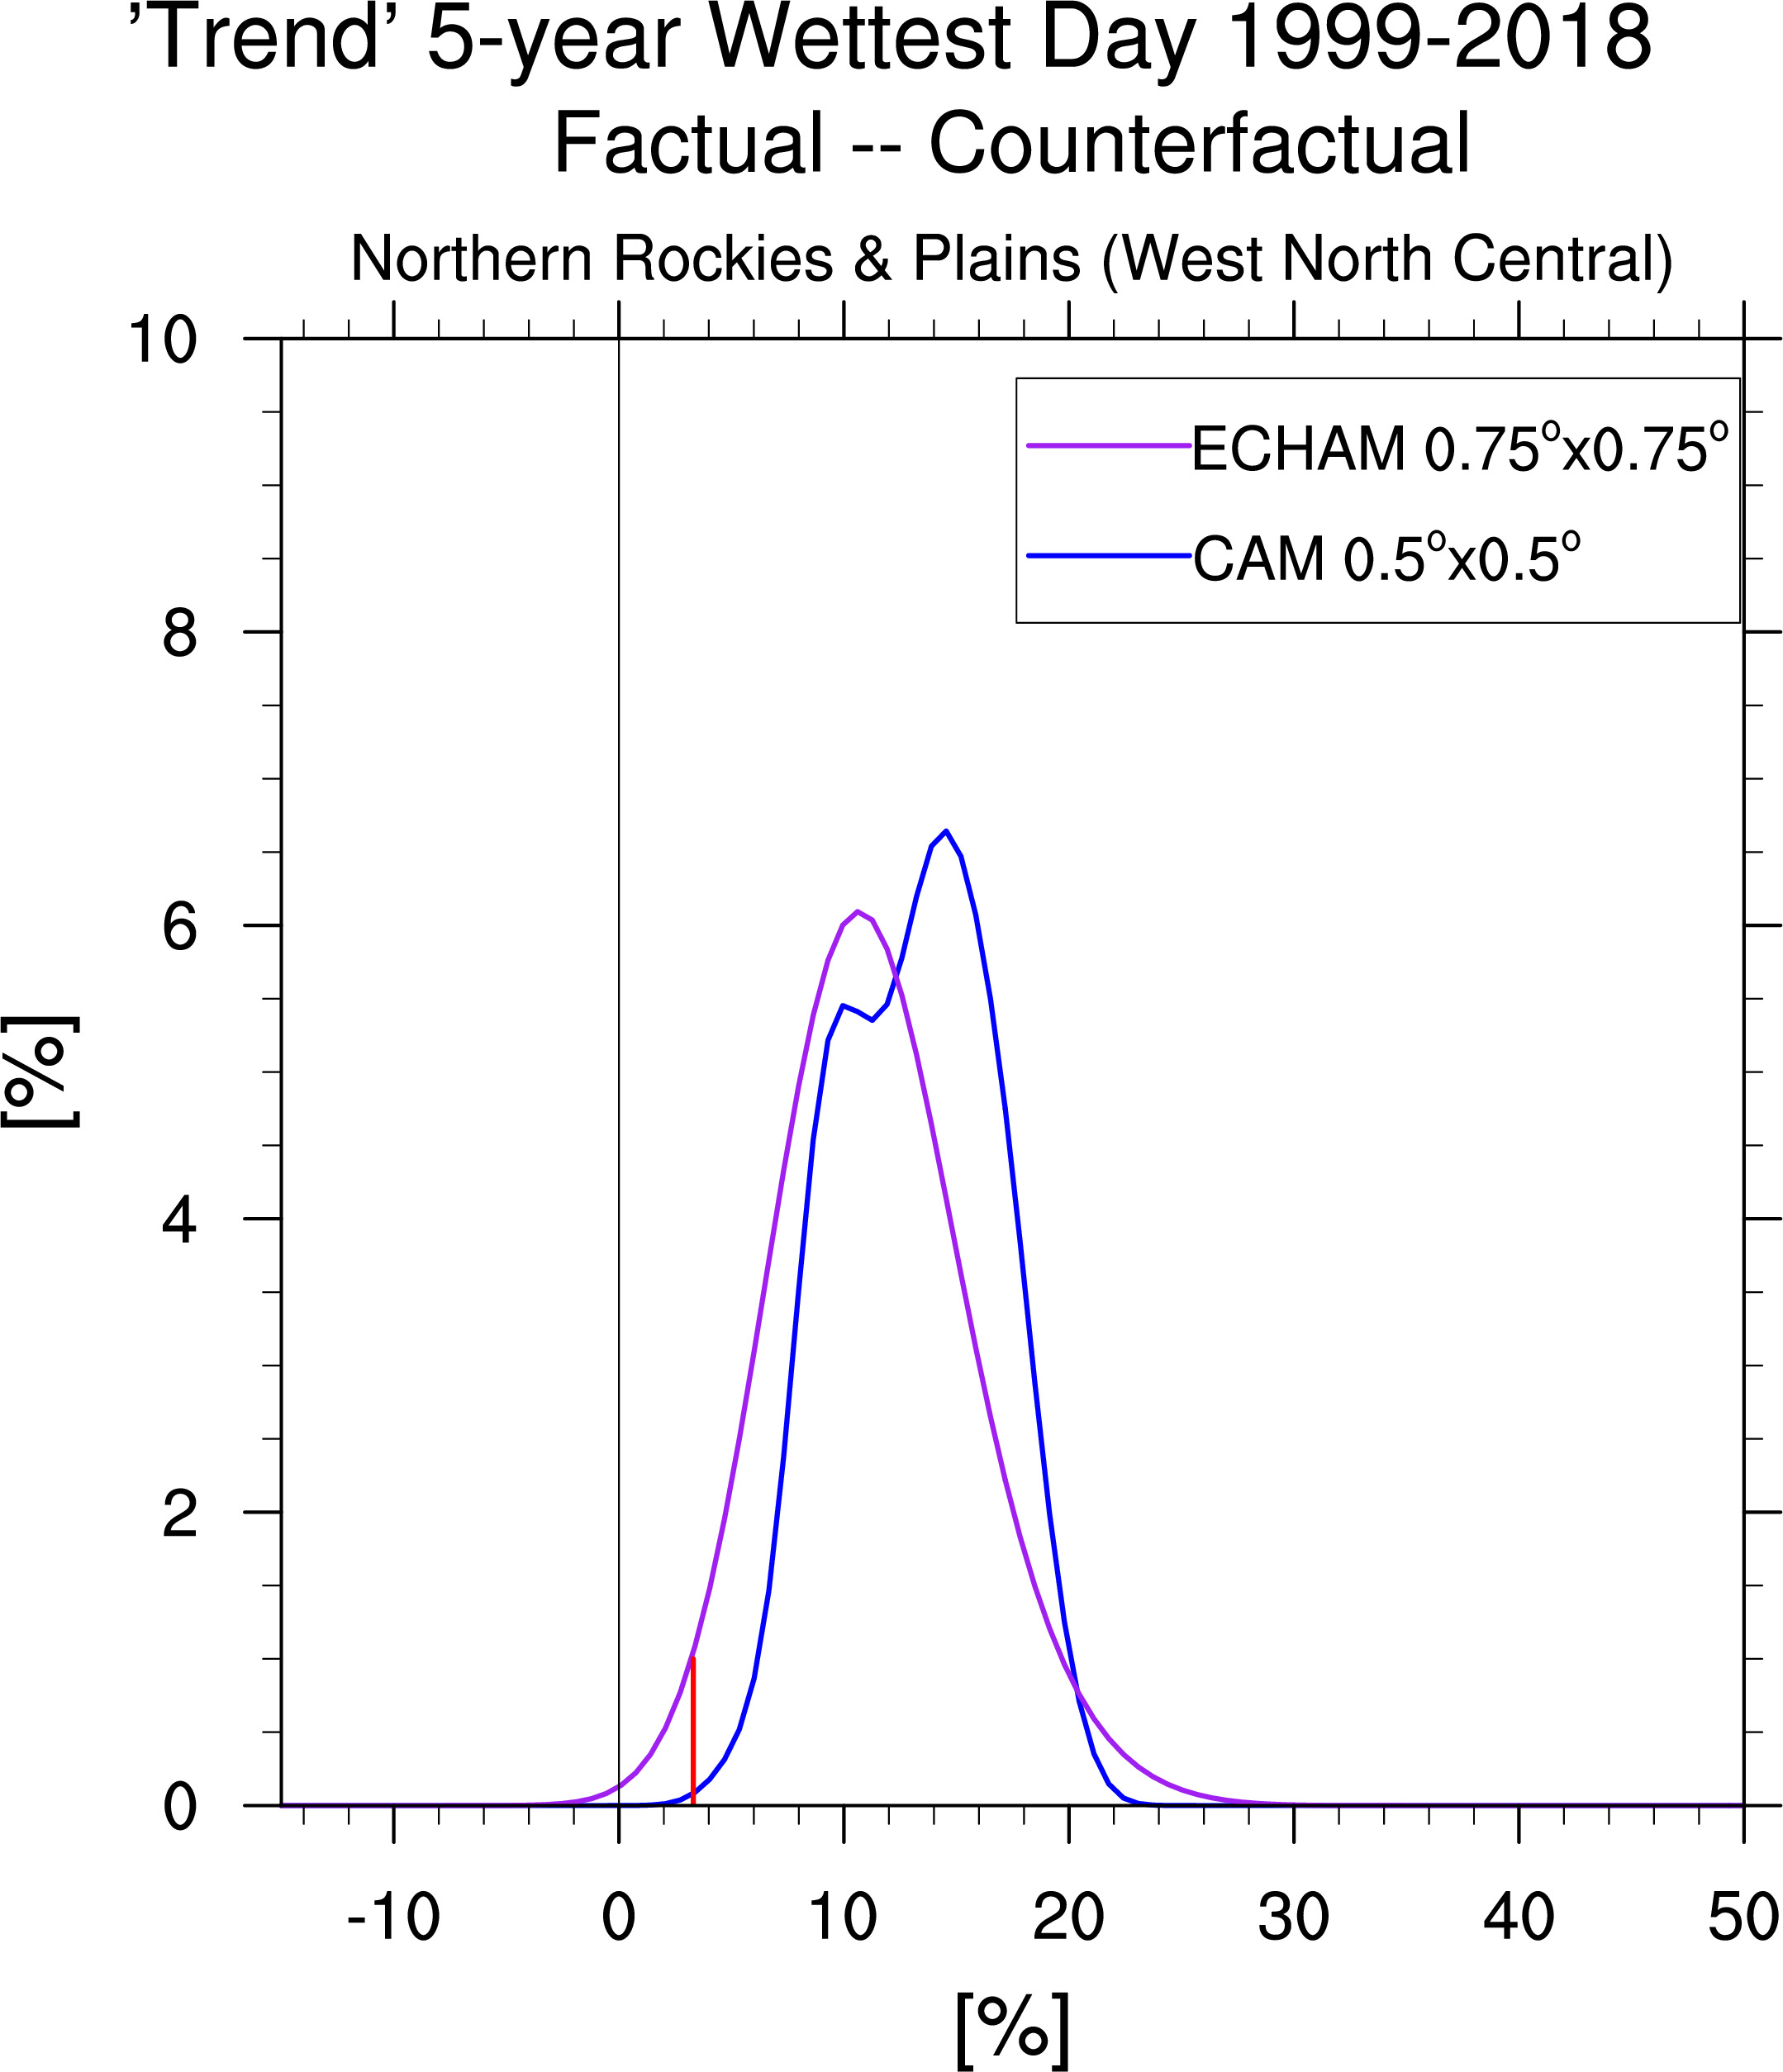
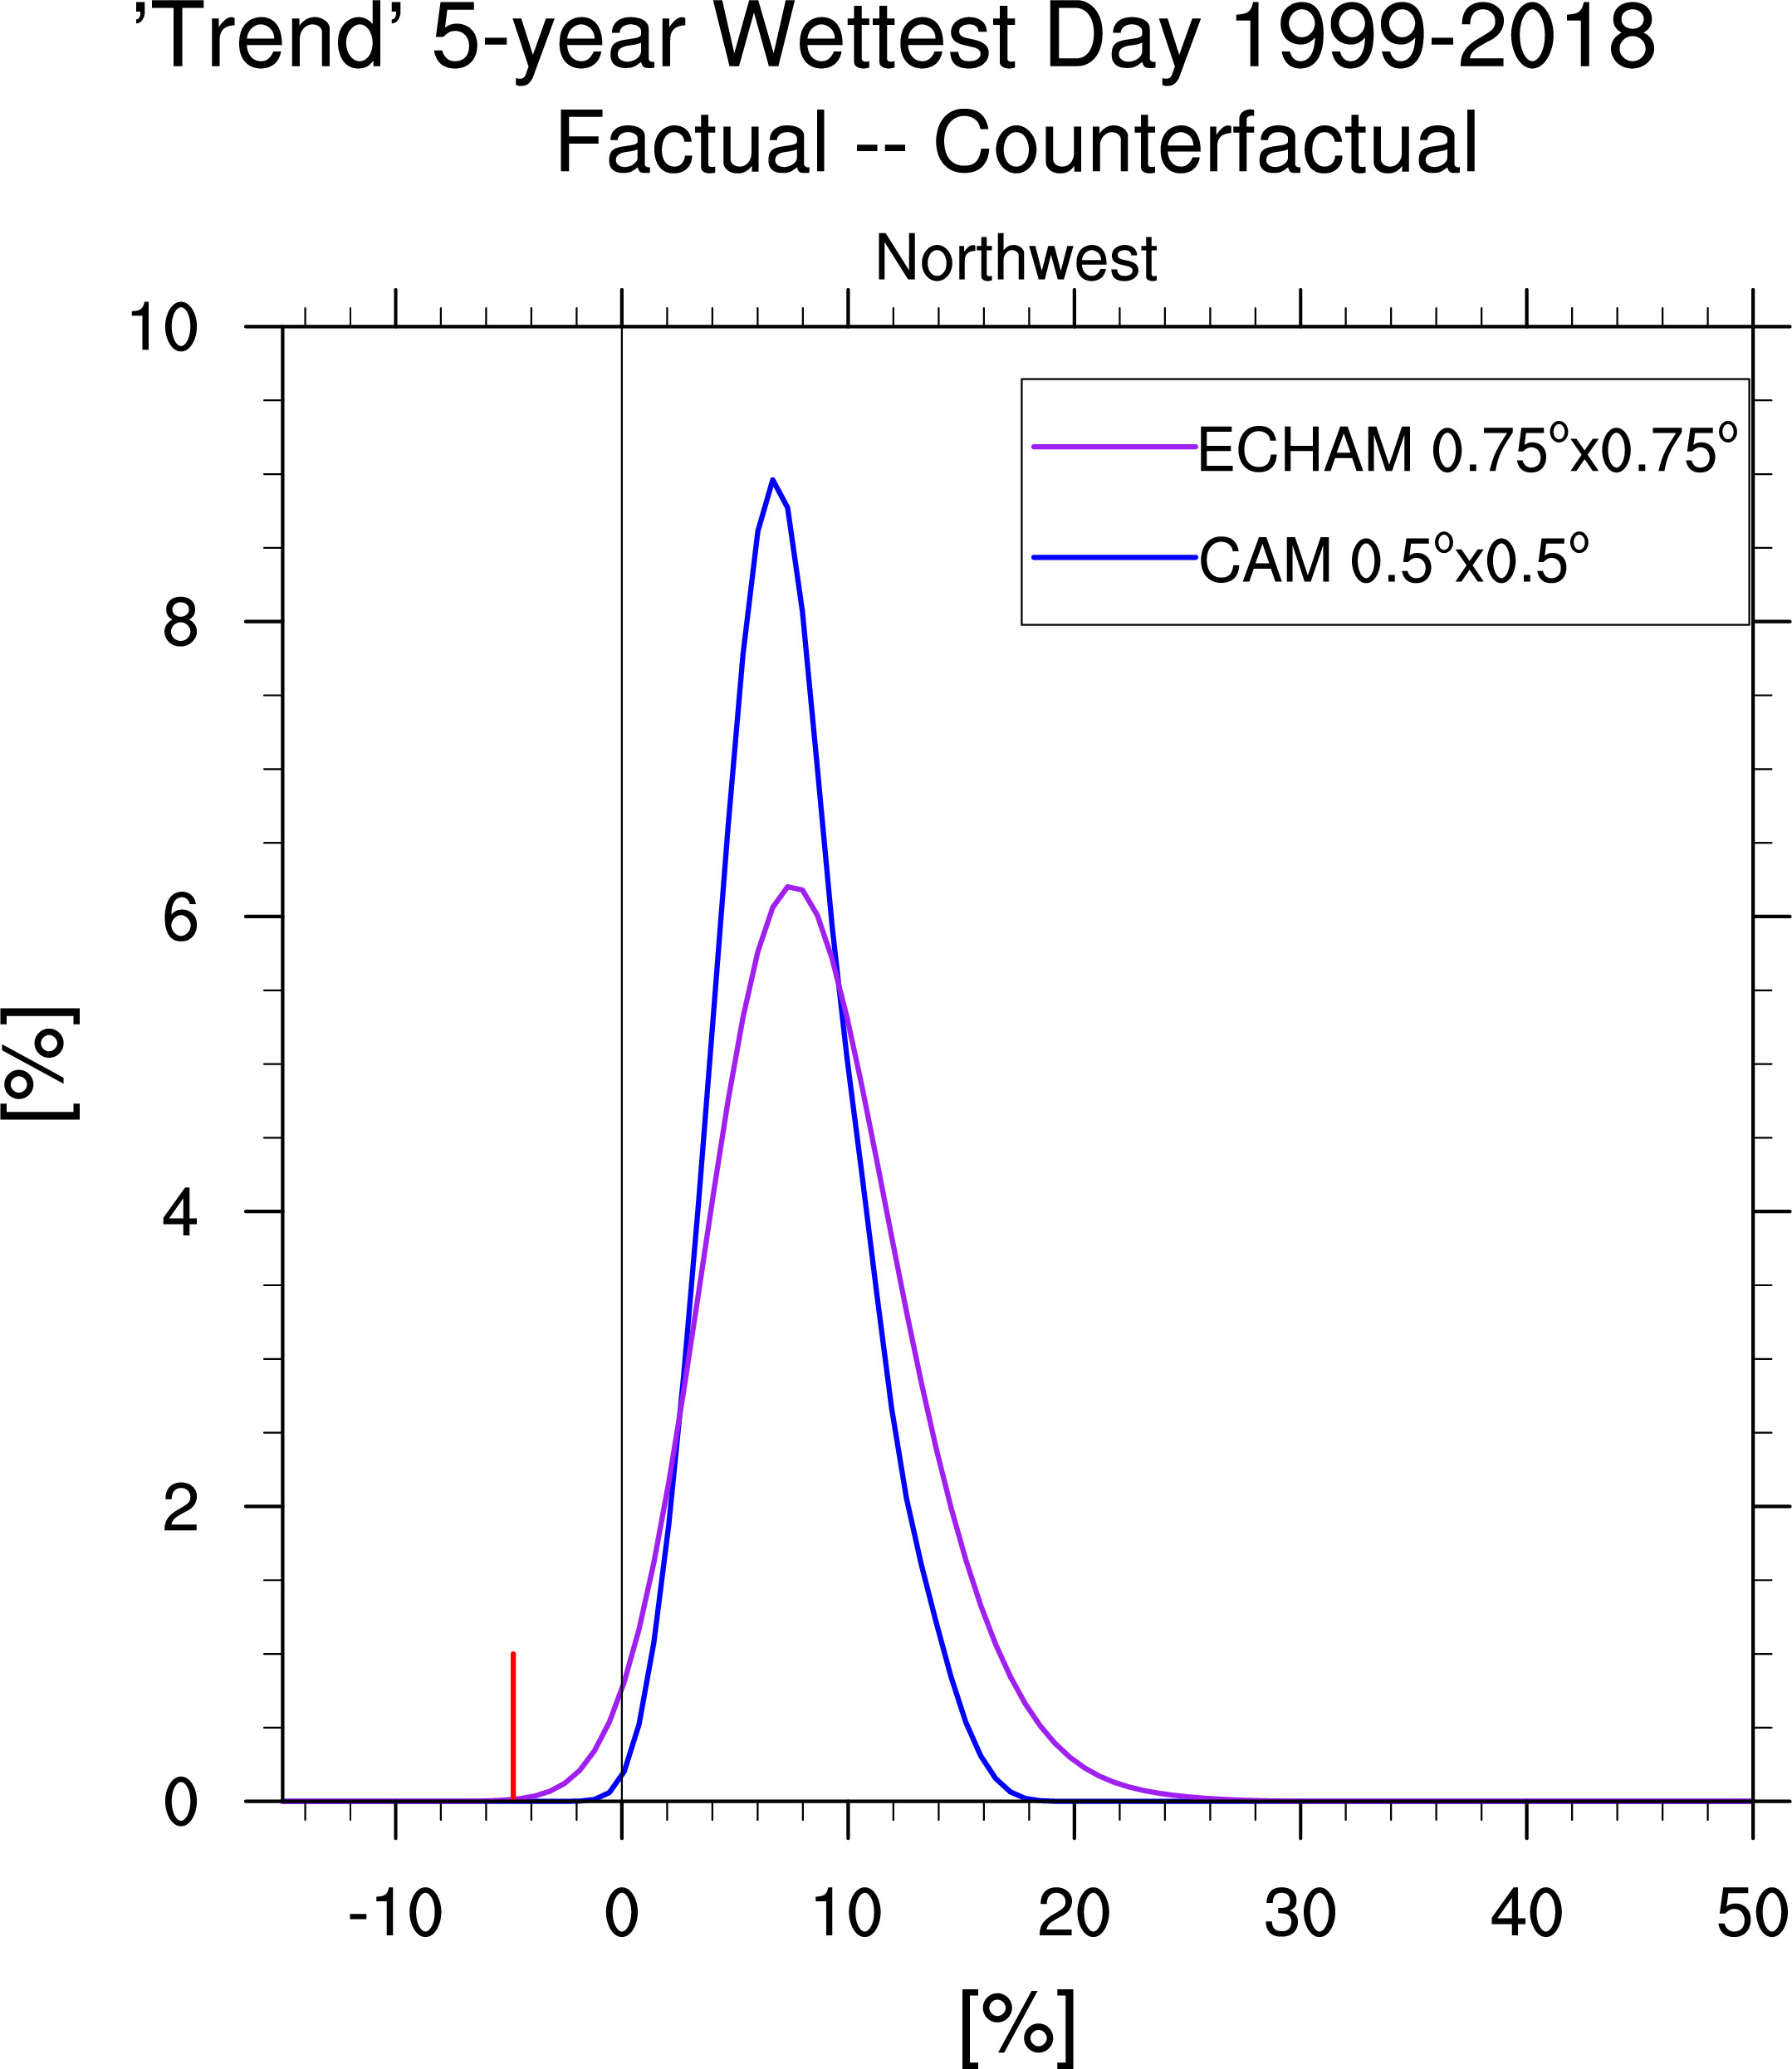
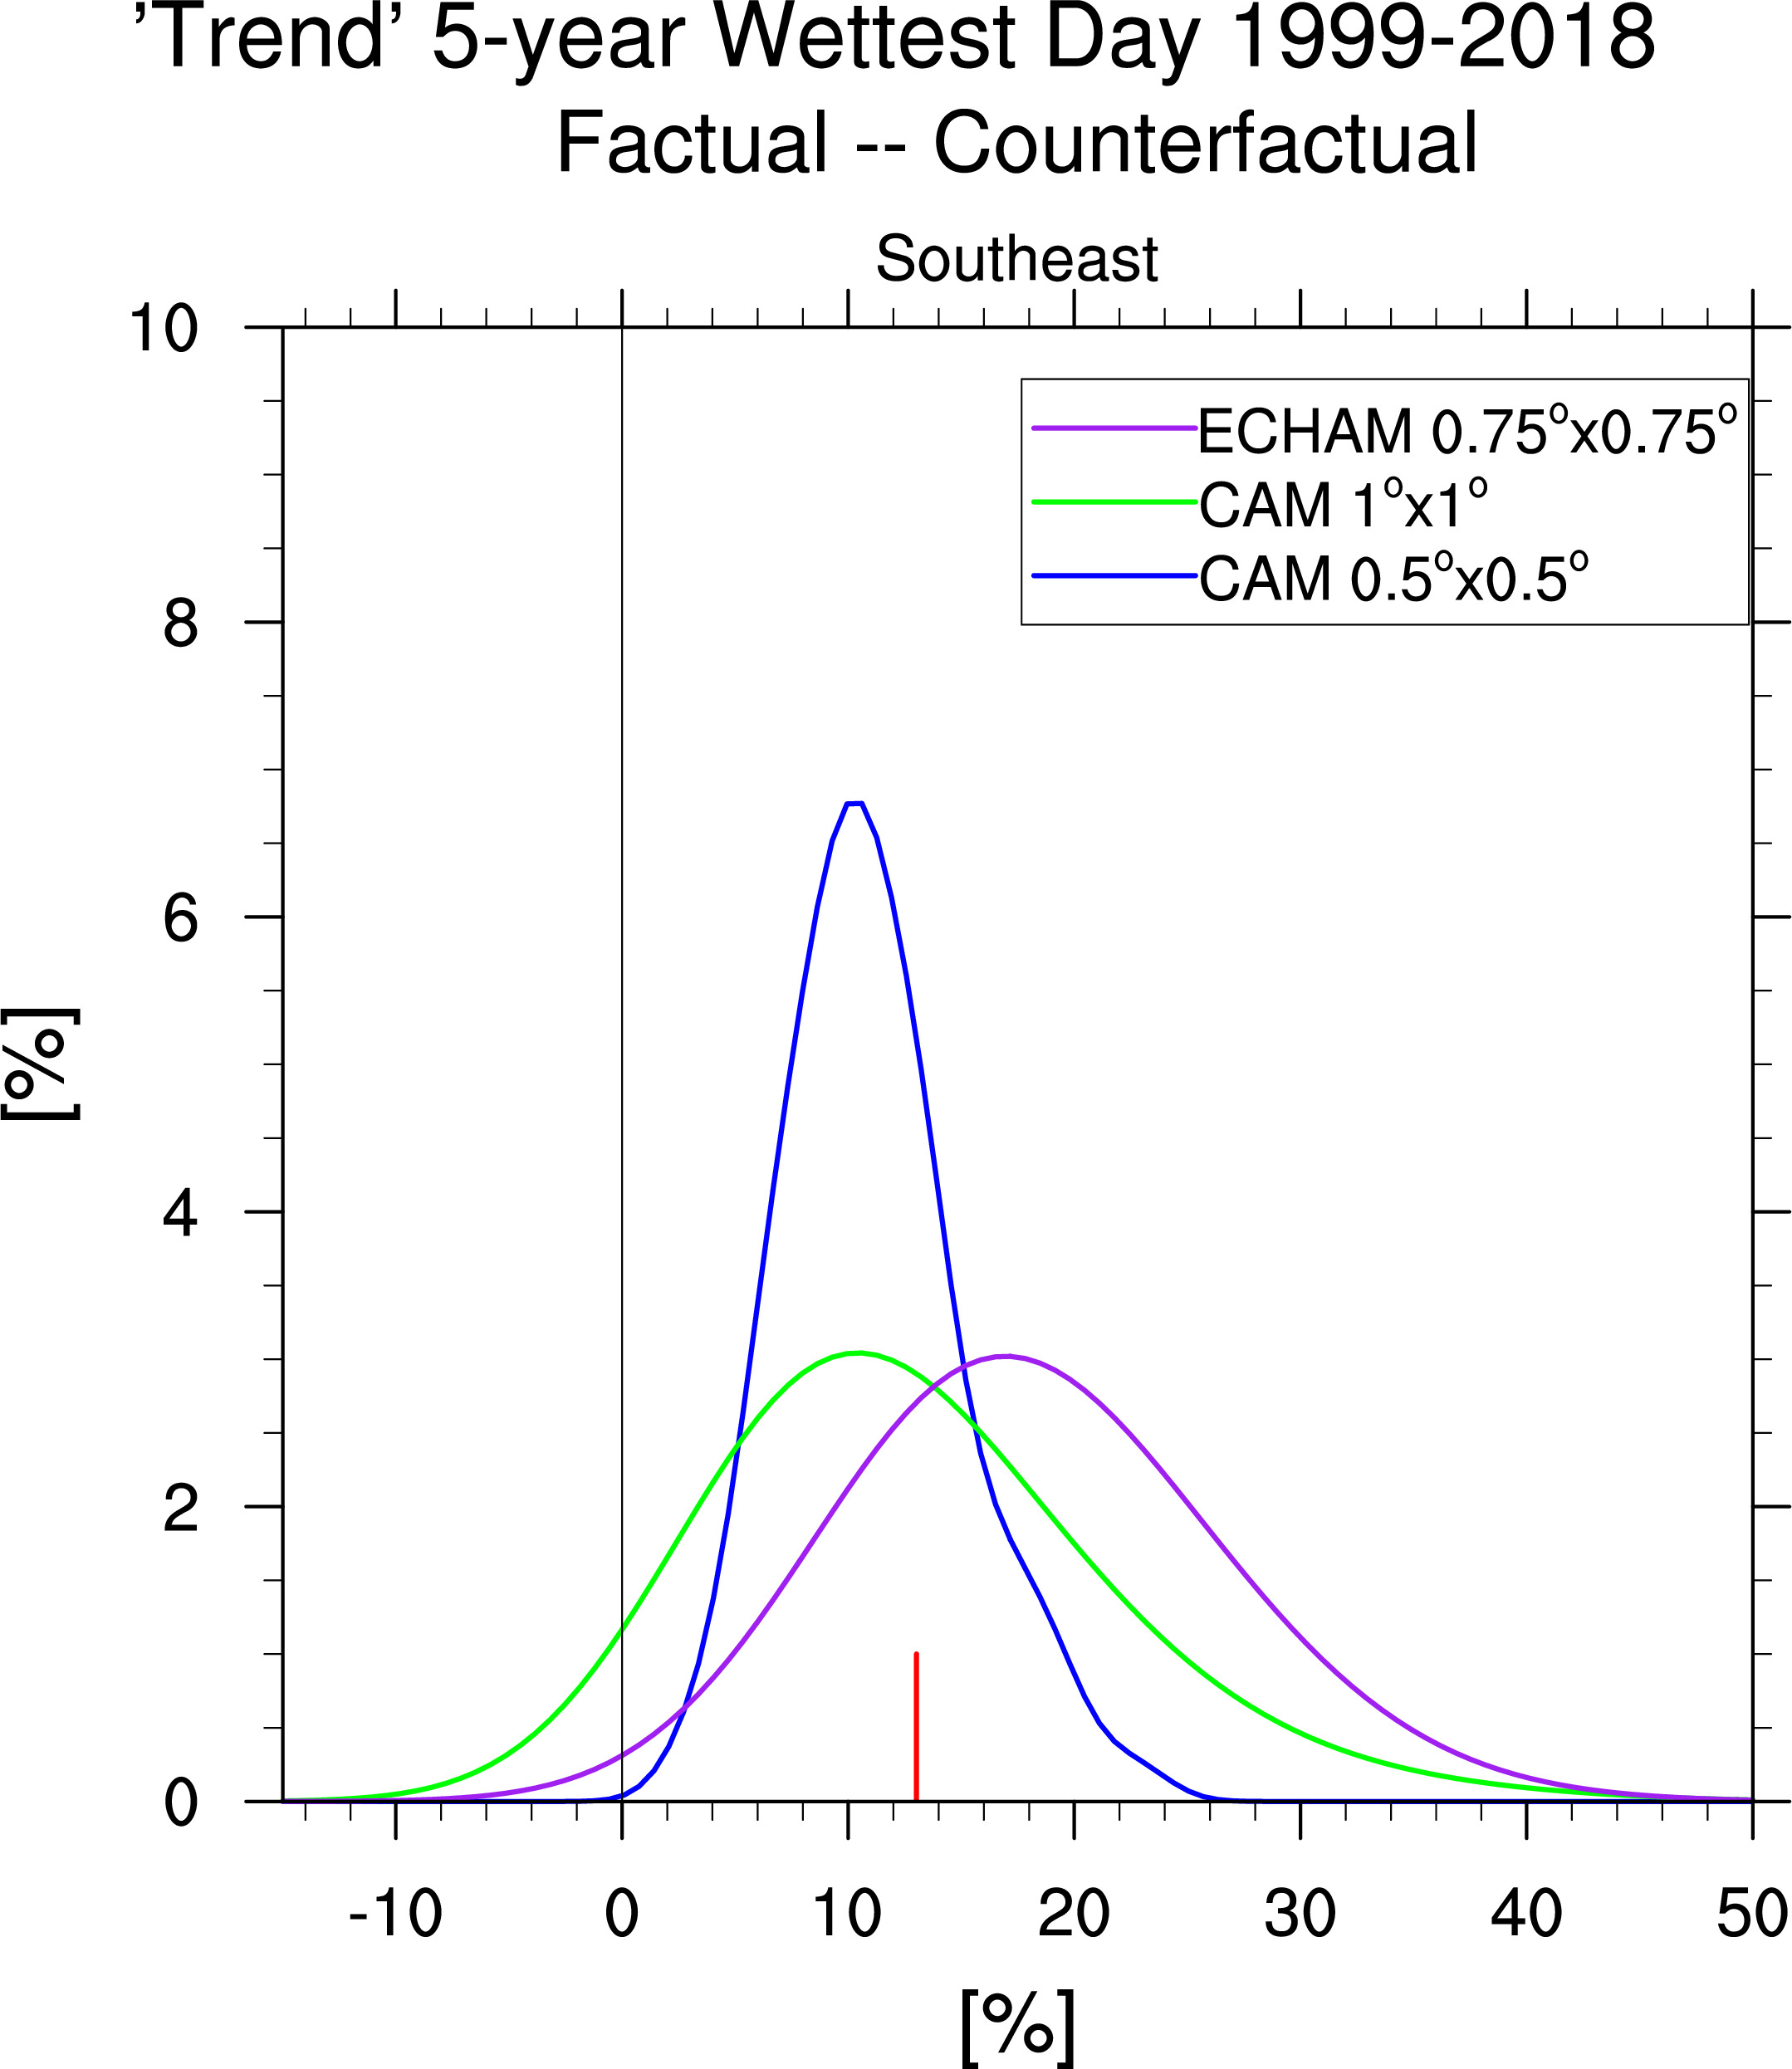
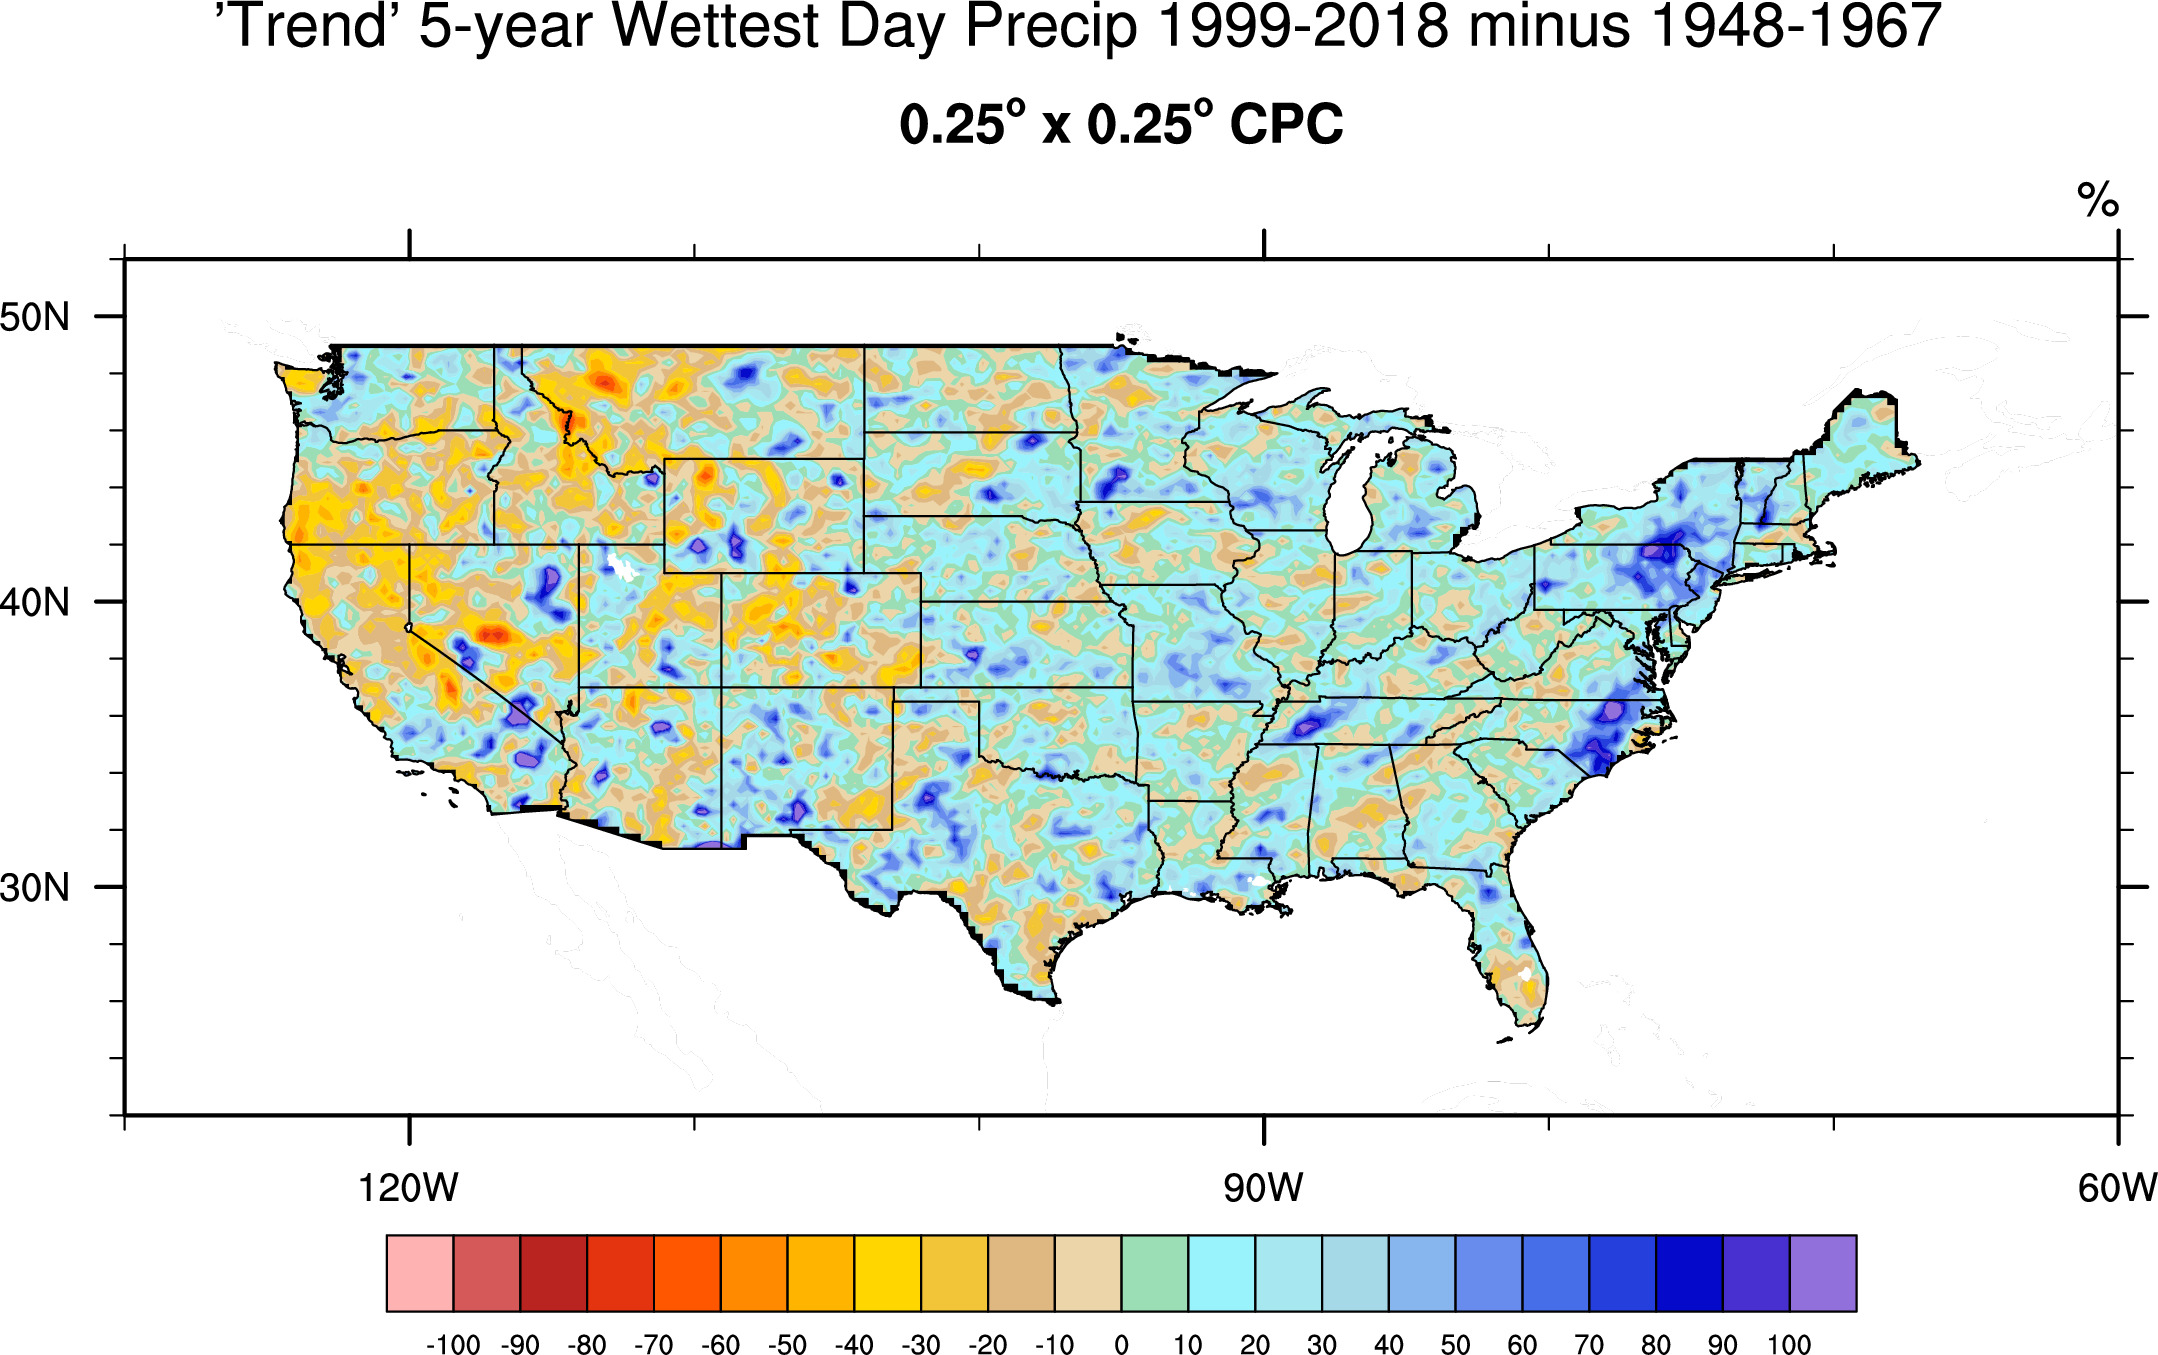
Trend Analysis Wettest Day of Year Factual versus Counterfactual 1999-2018 9 Climate Superdivisions
Comparison of Factual and Counterfactual 0.5ox0.5o & 1ox1o 1999-2018 yields 4 1-in-5-year cases
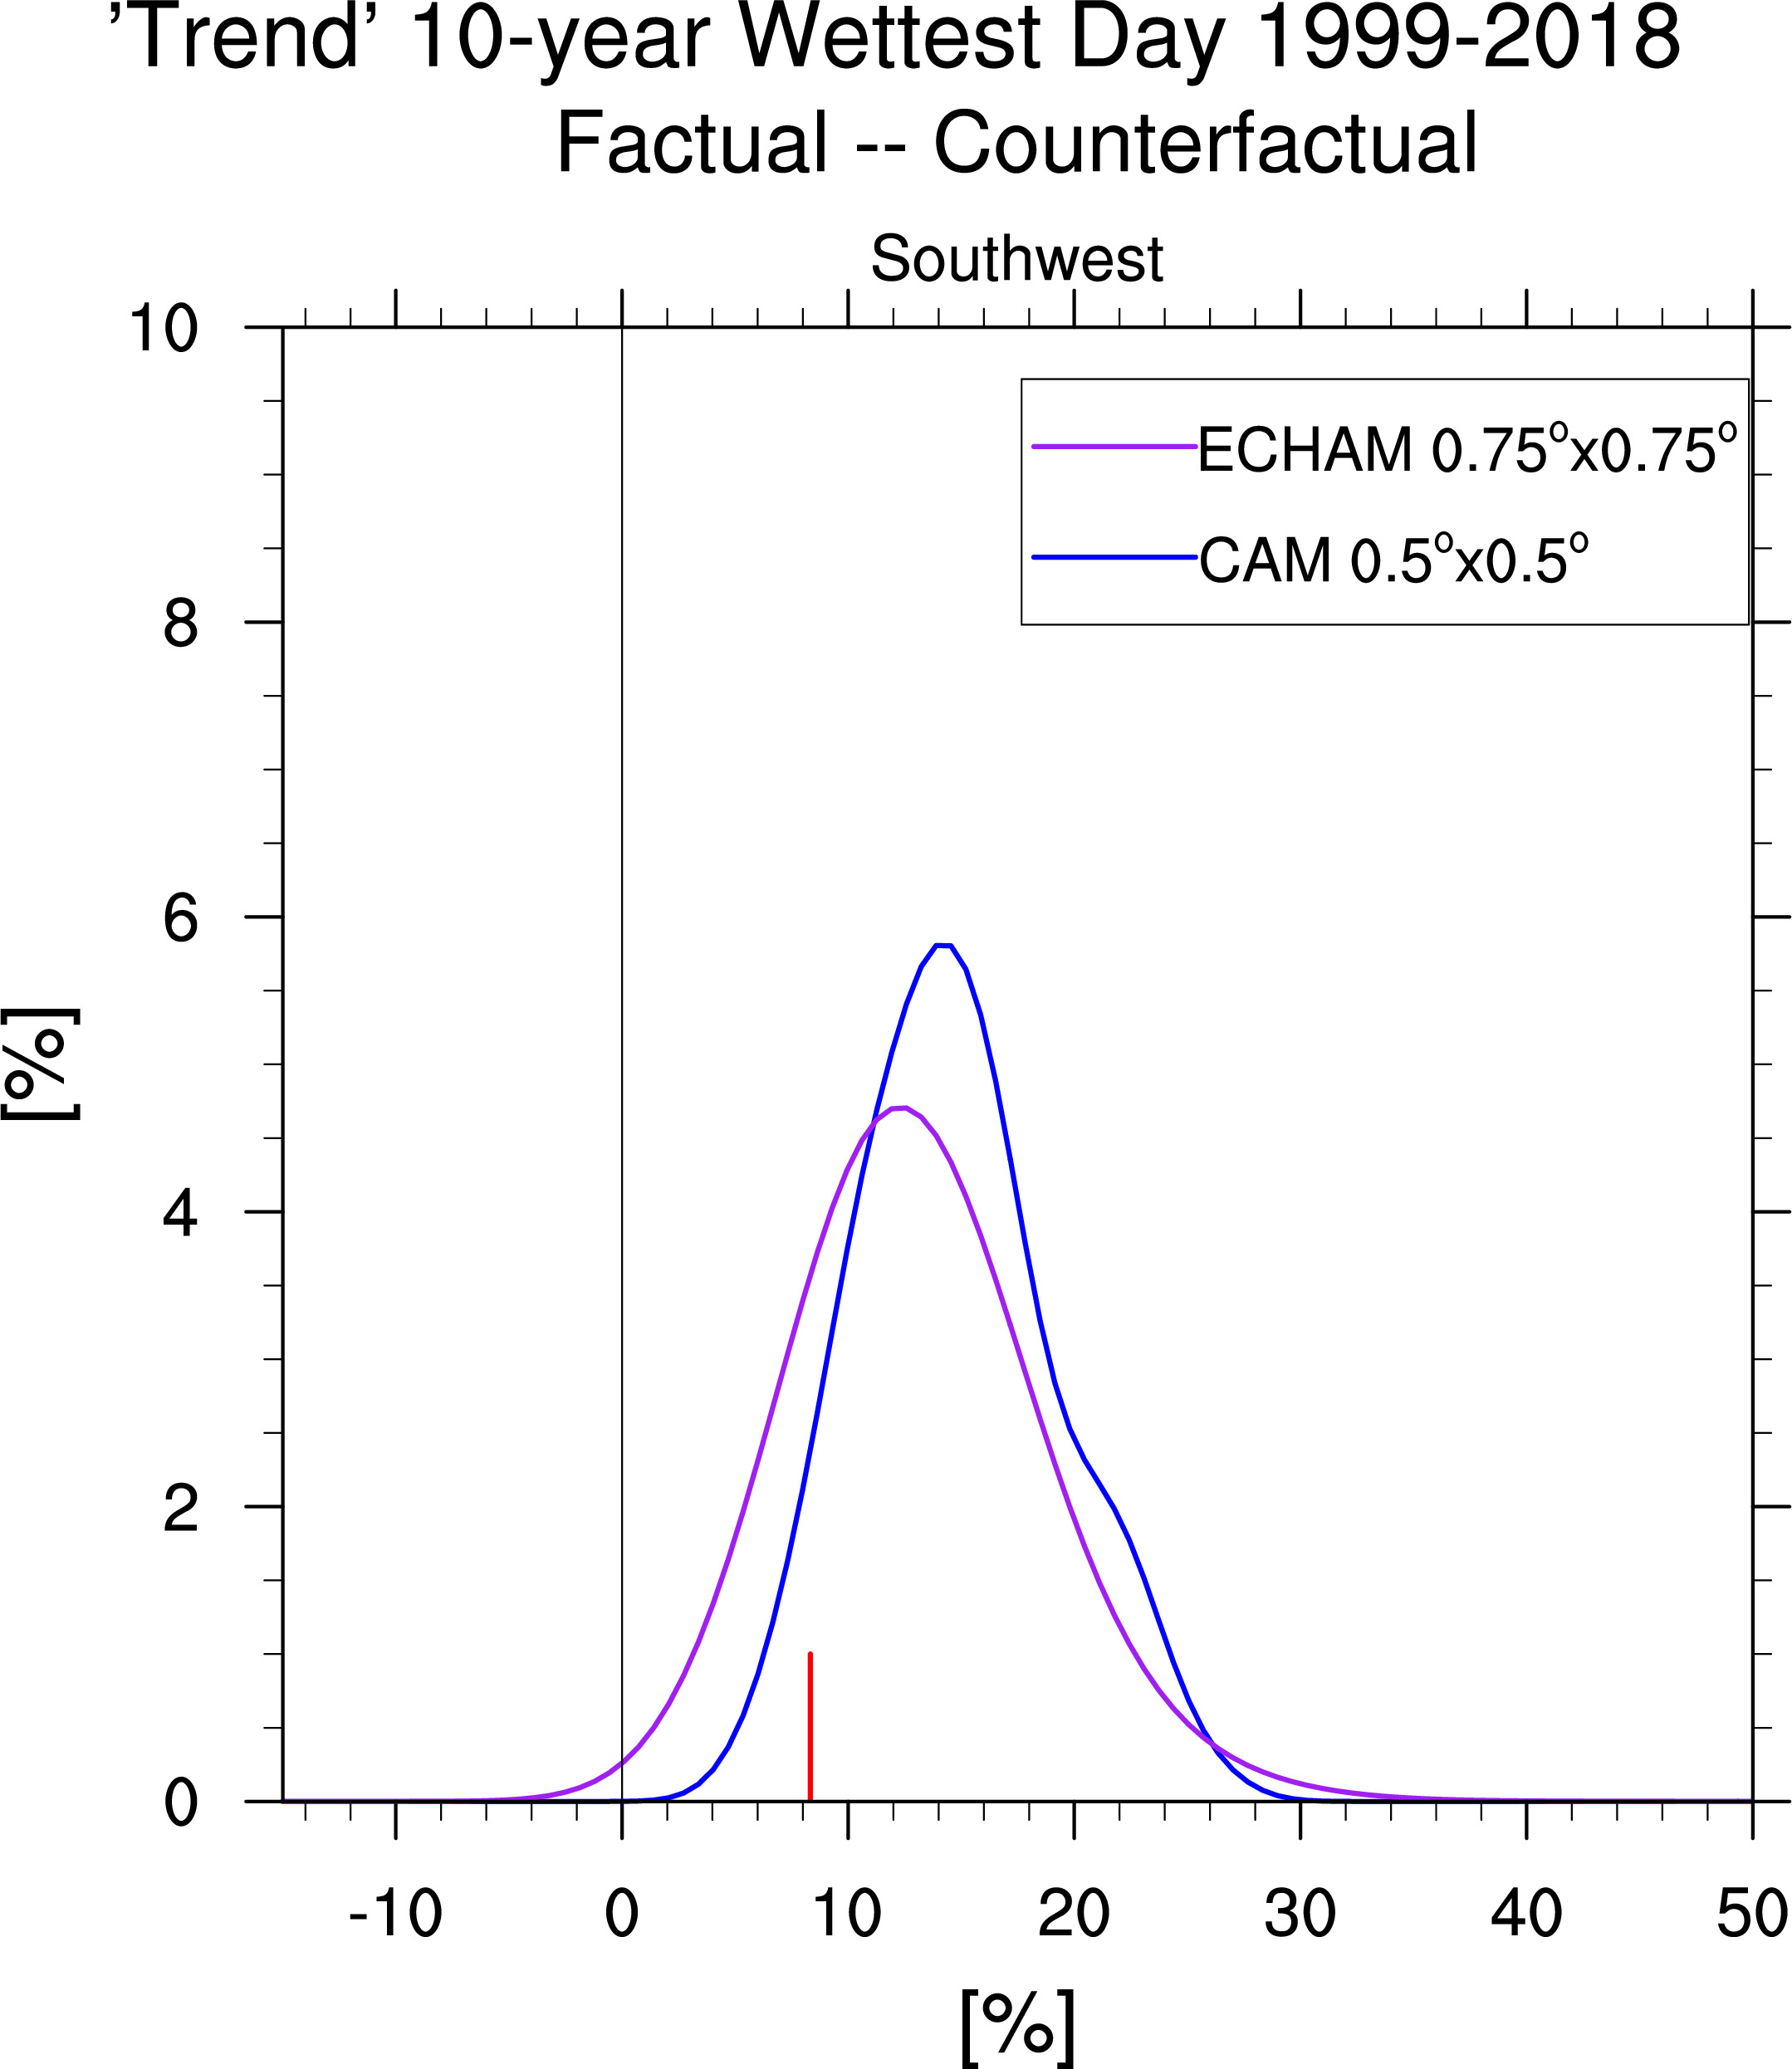
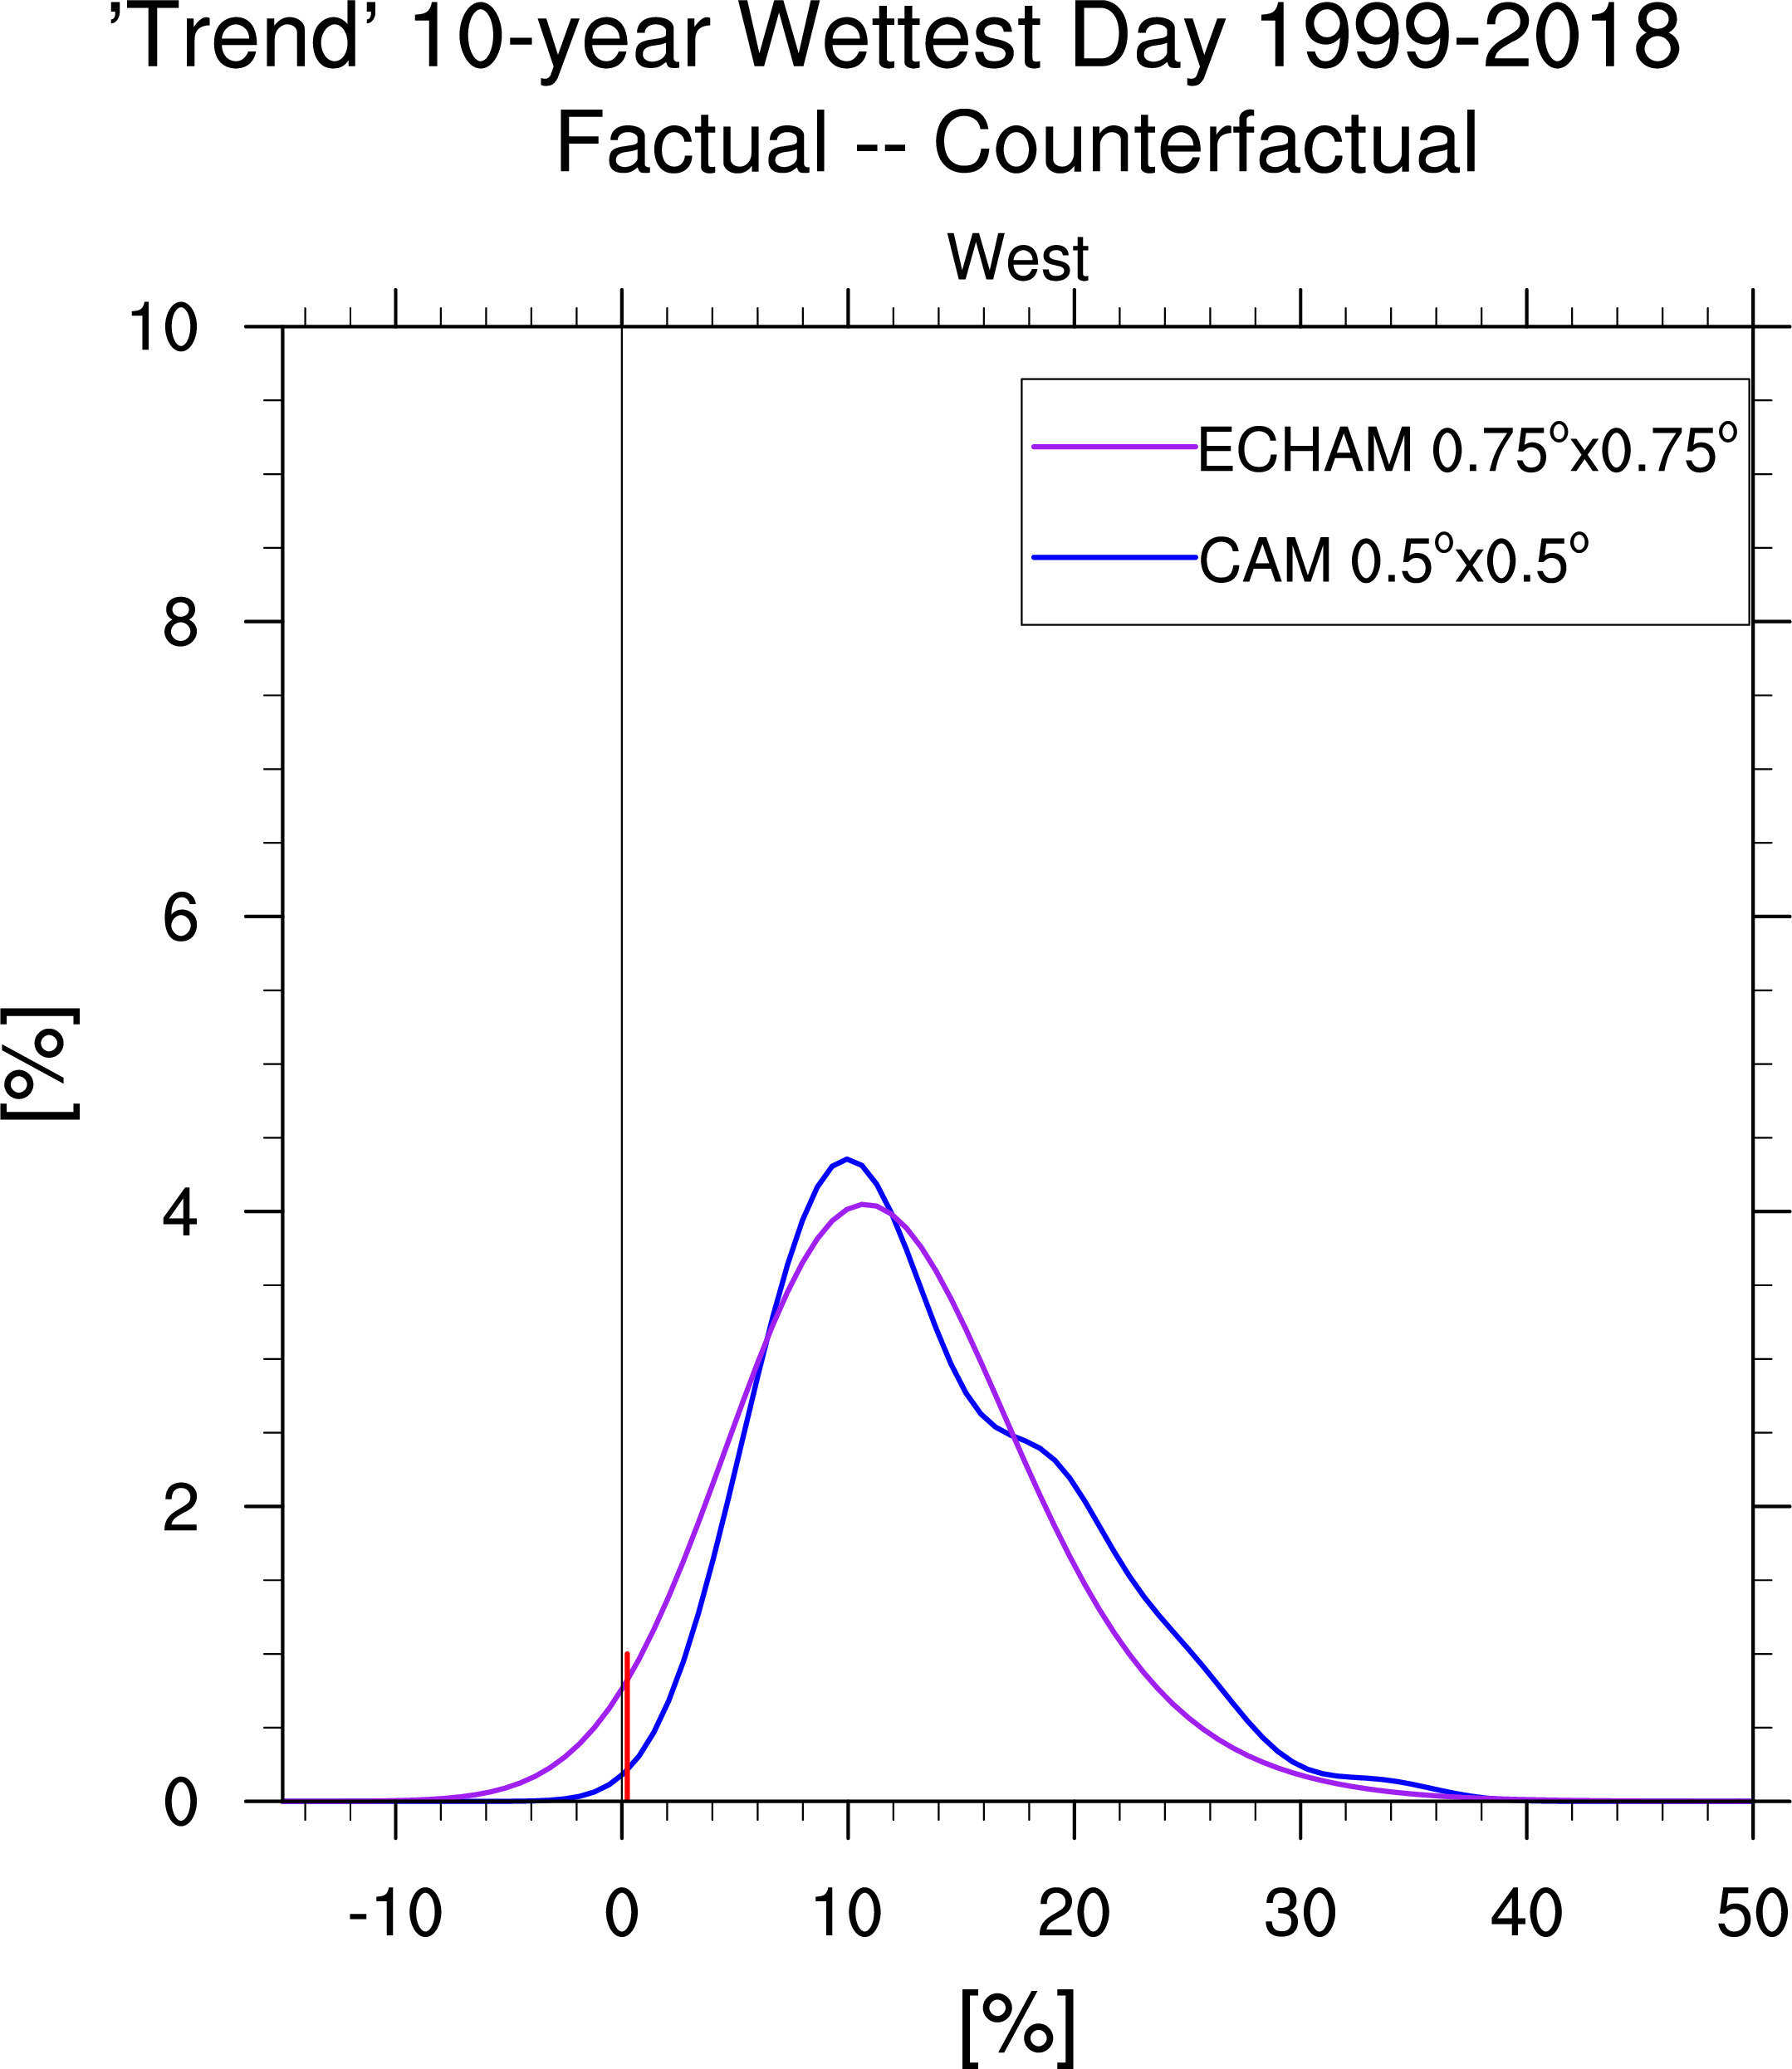
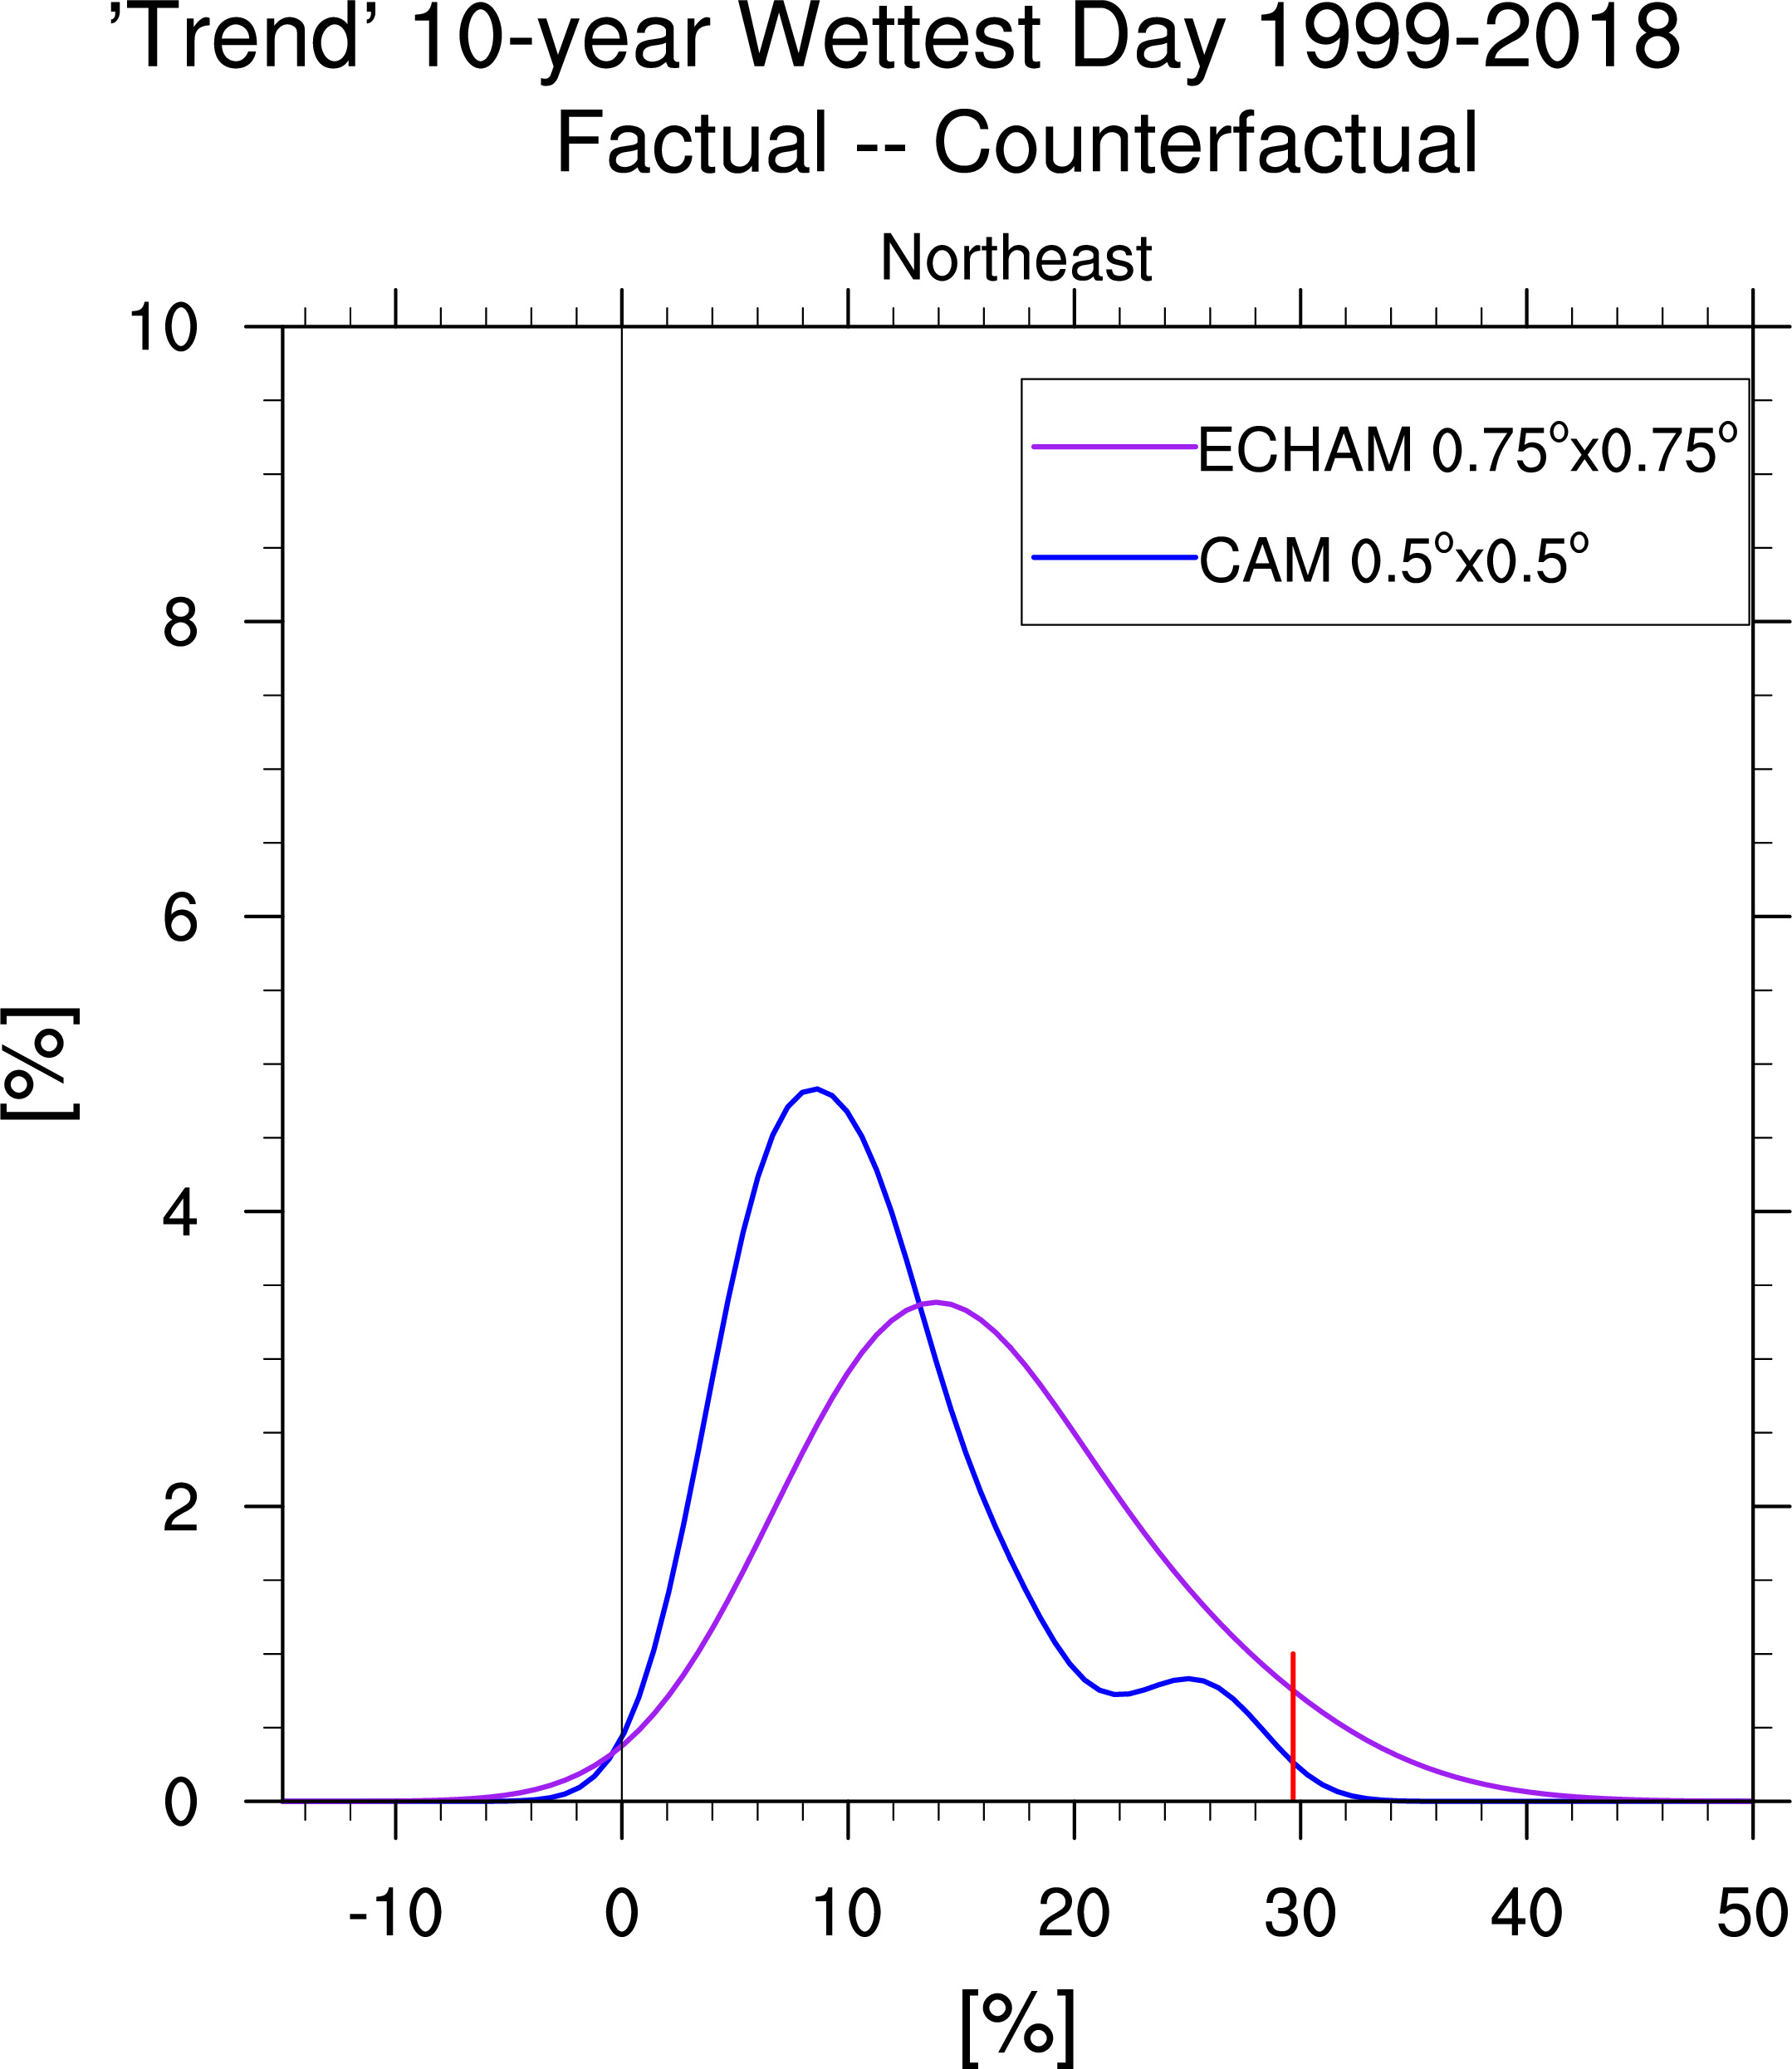
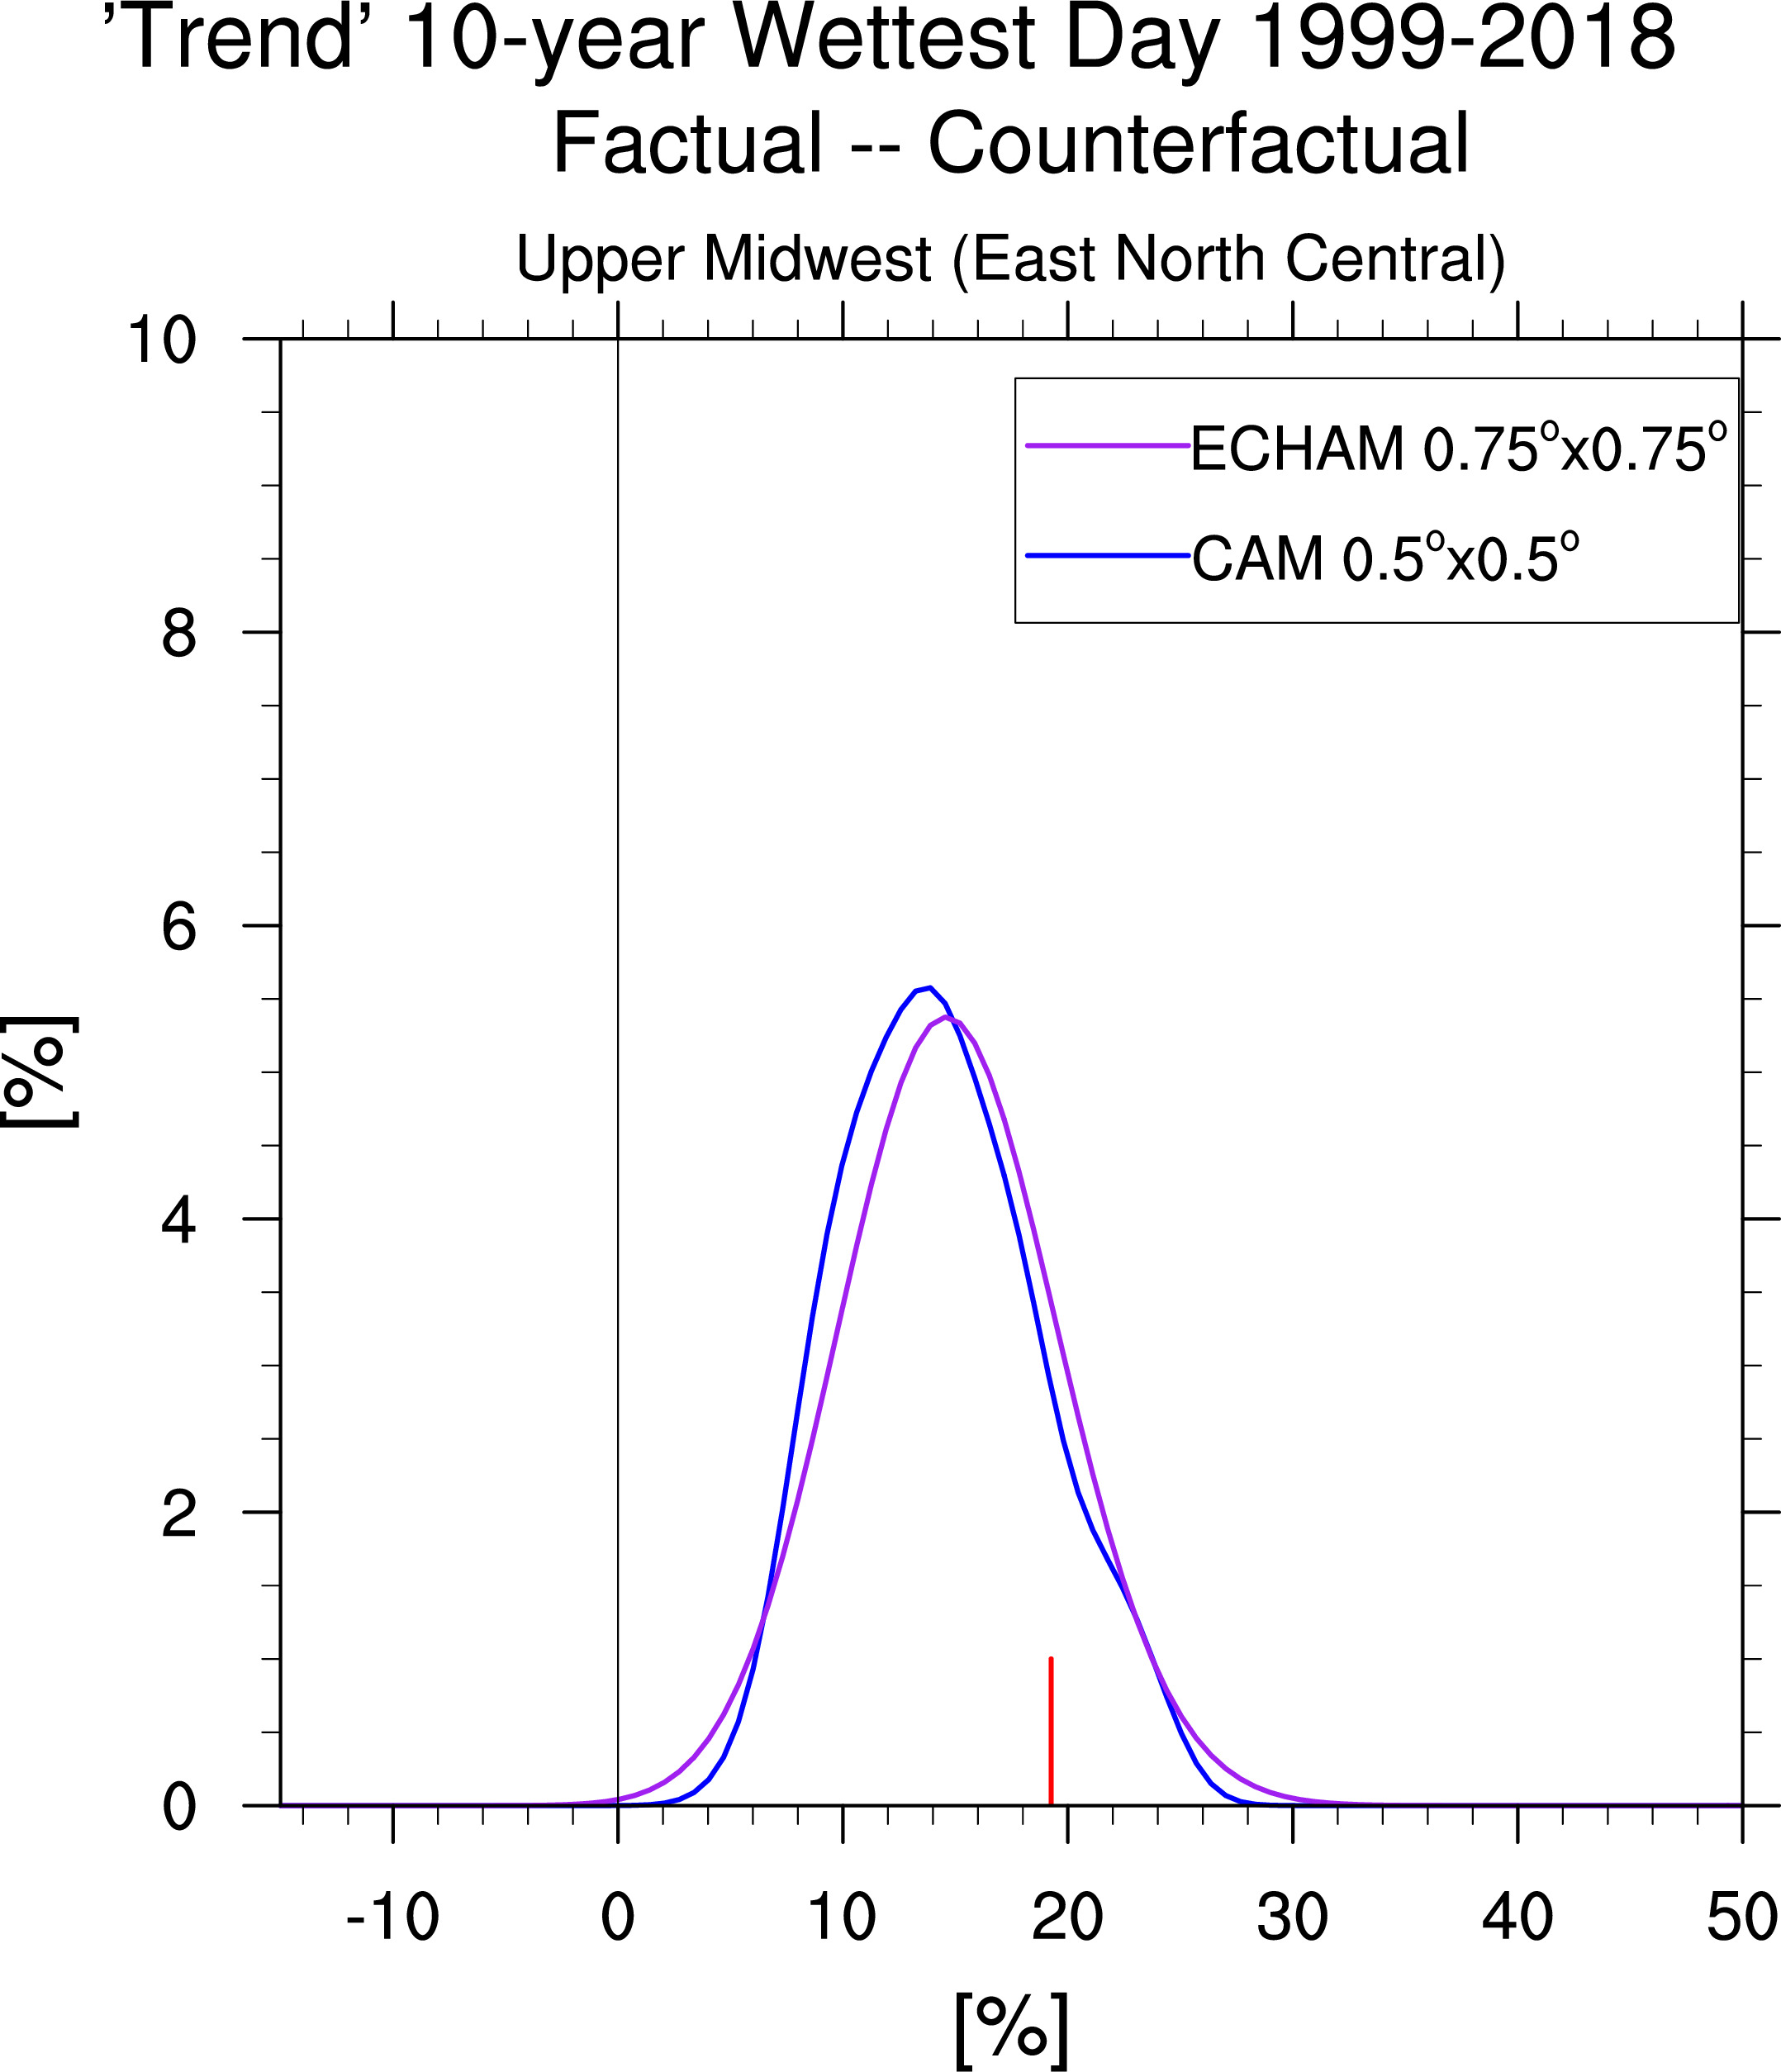
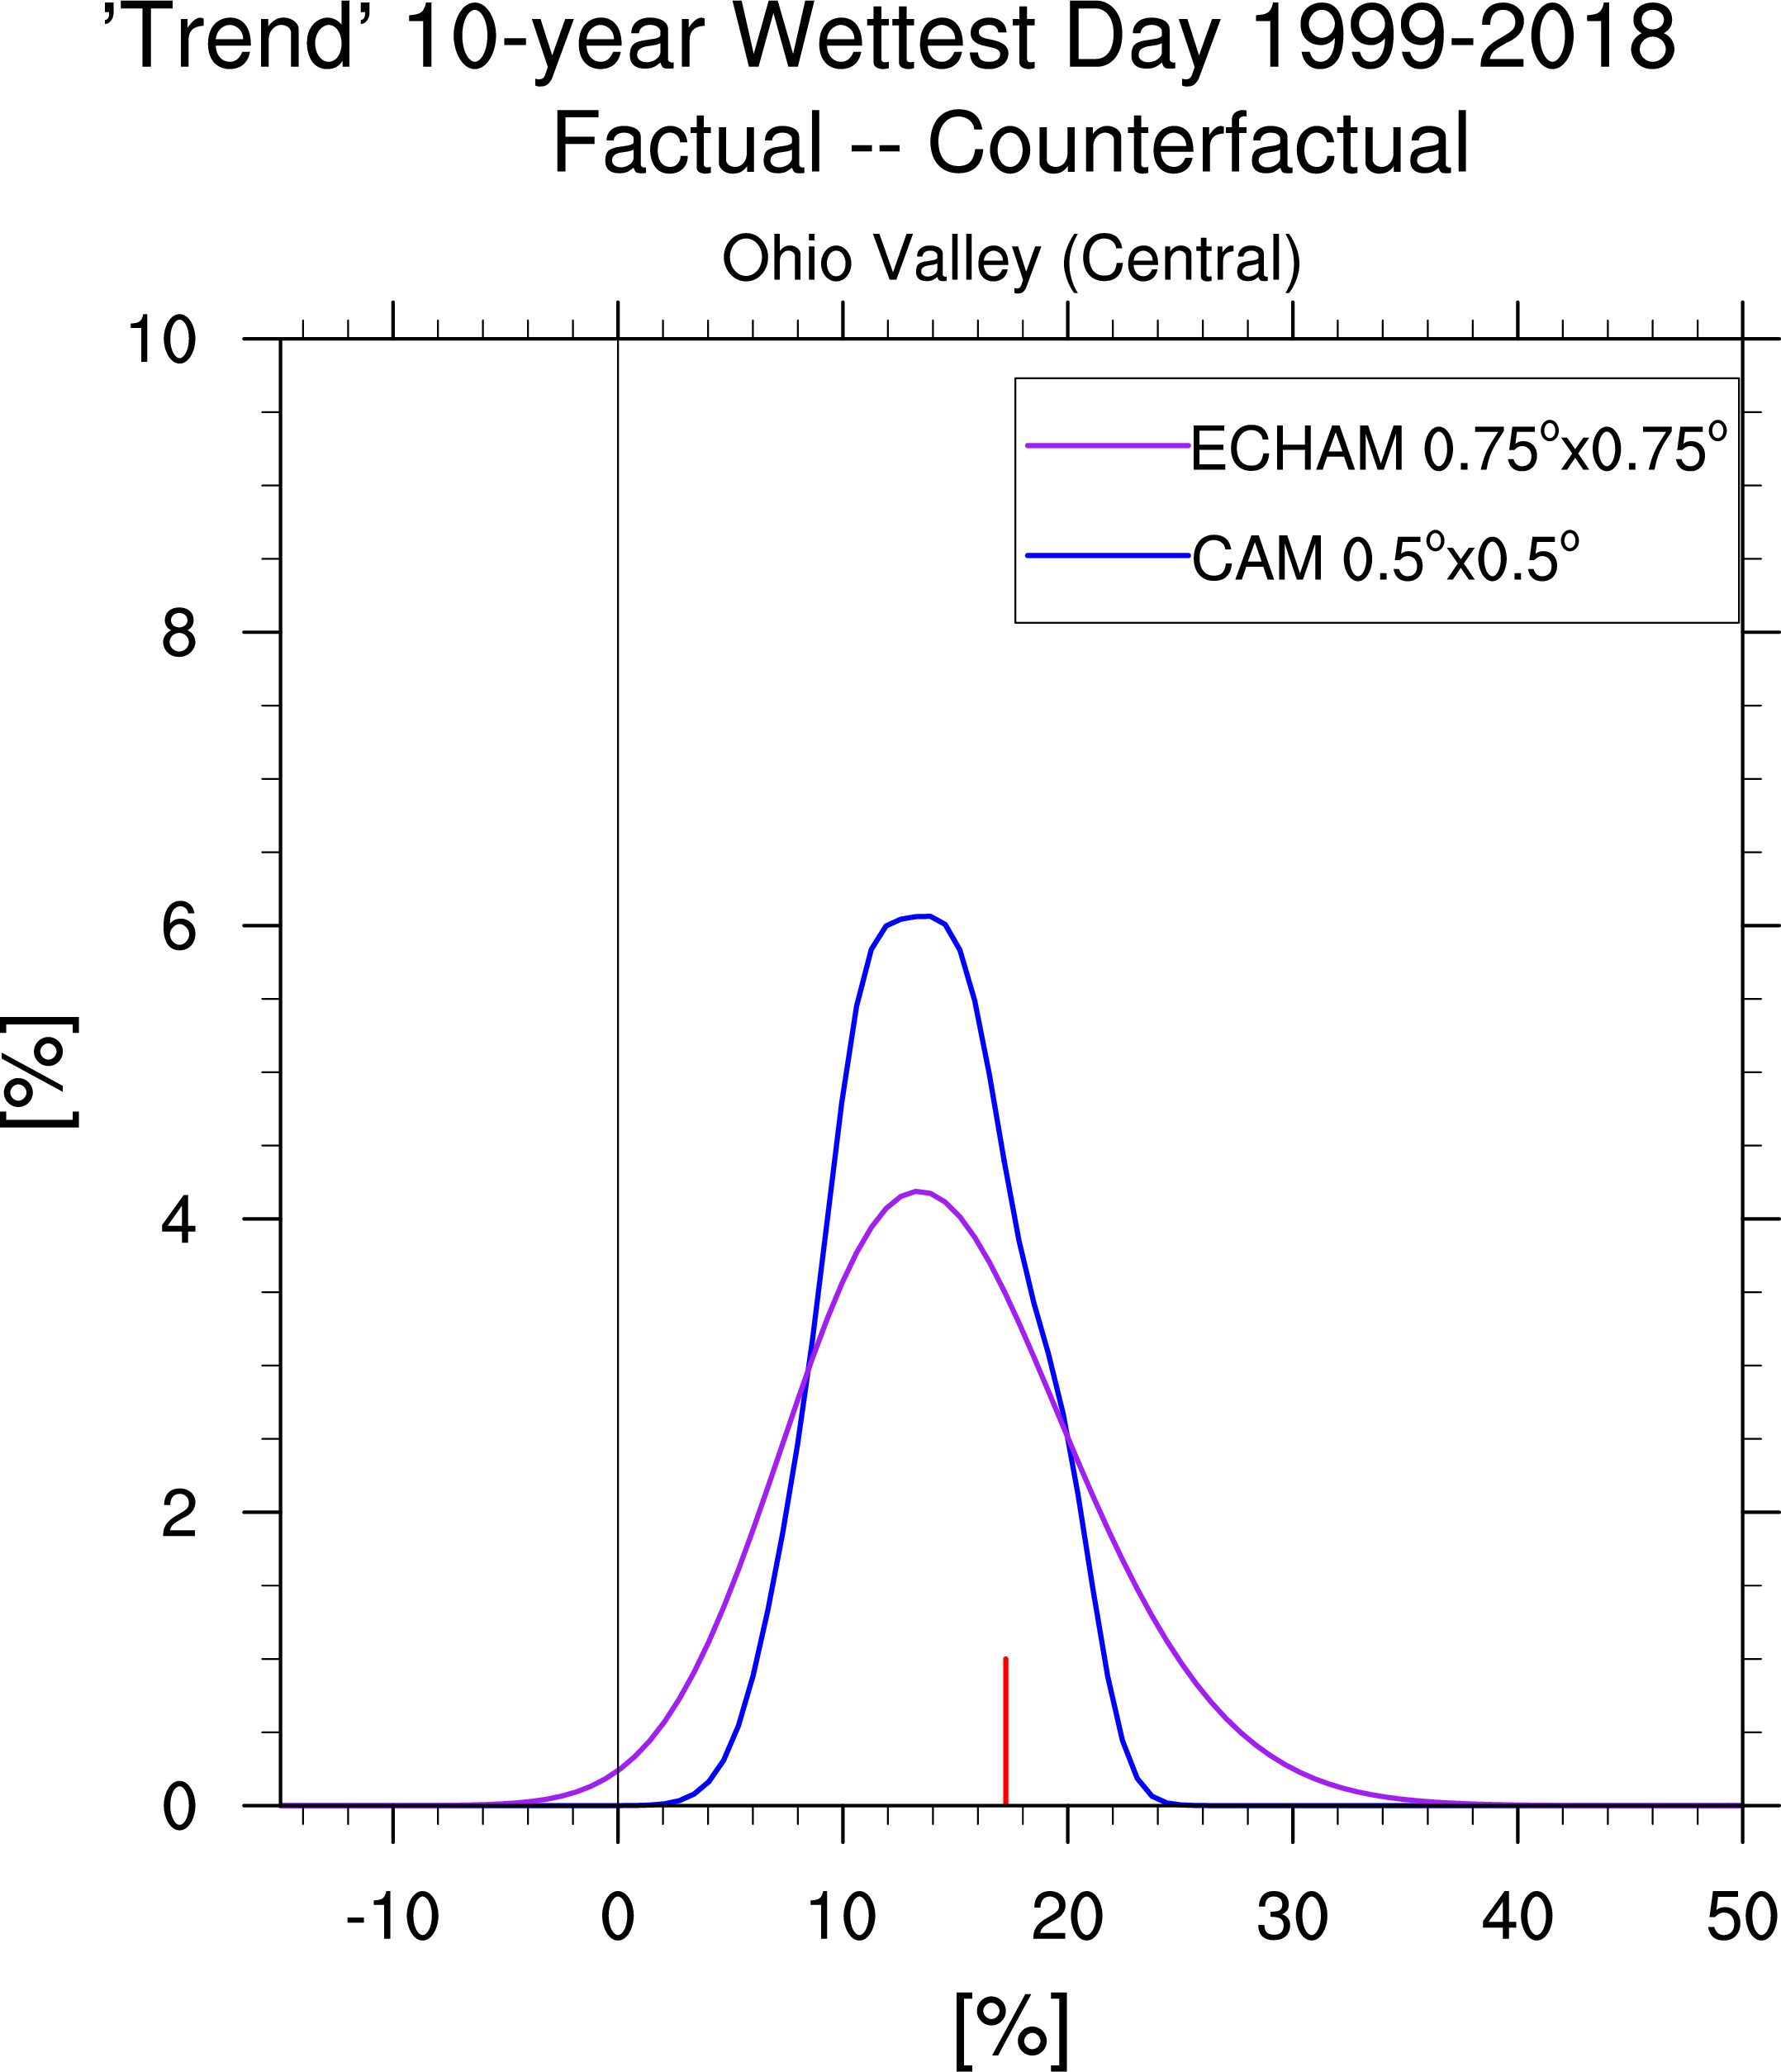
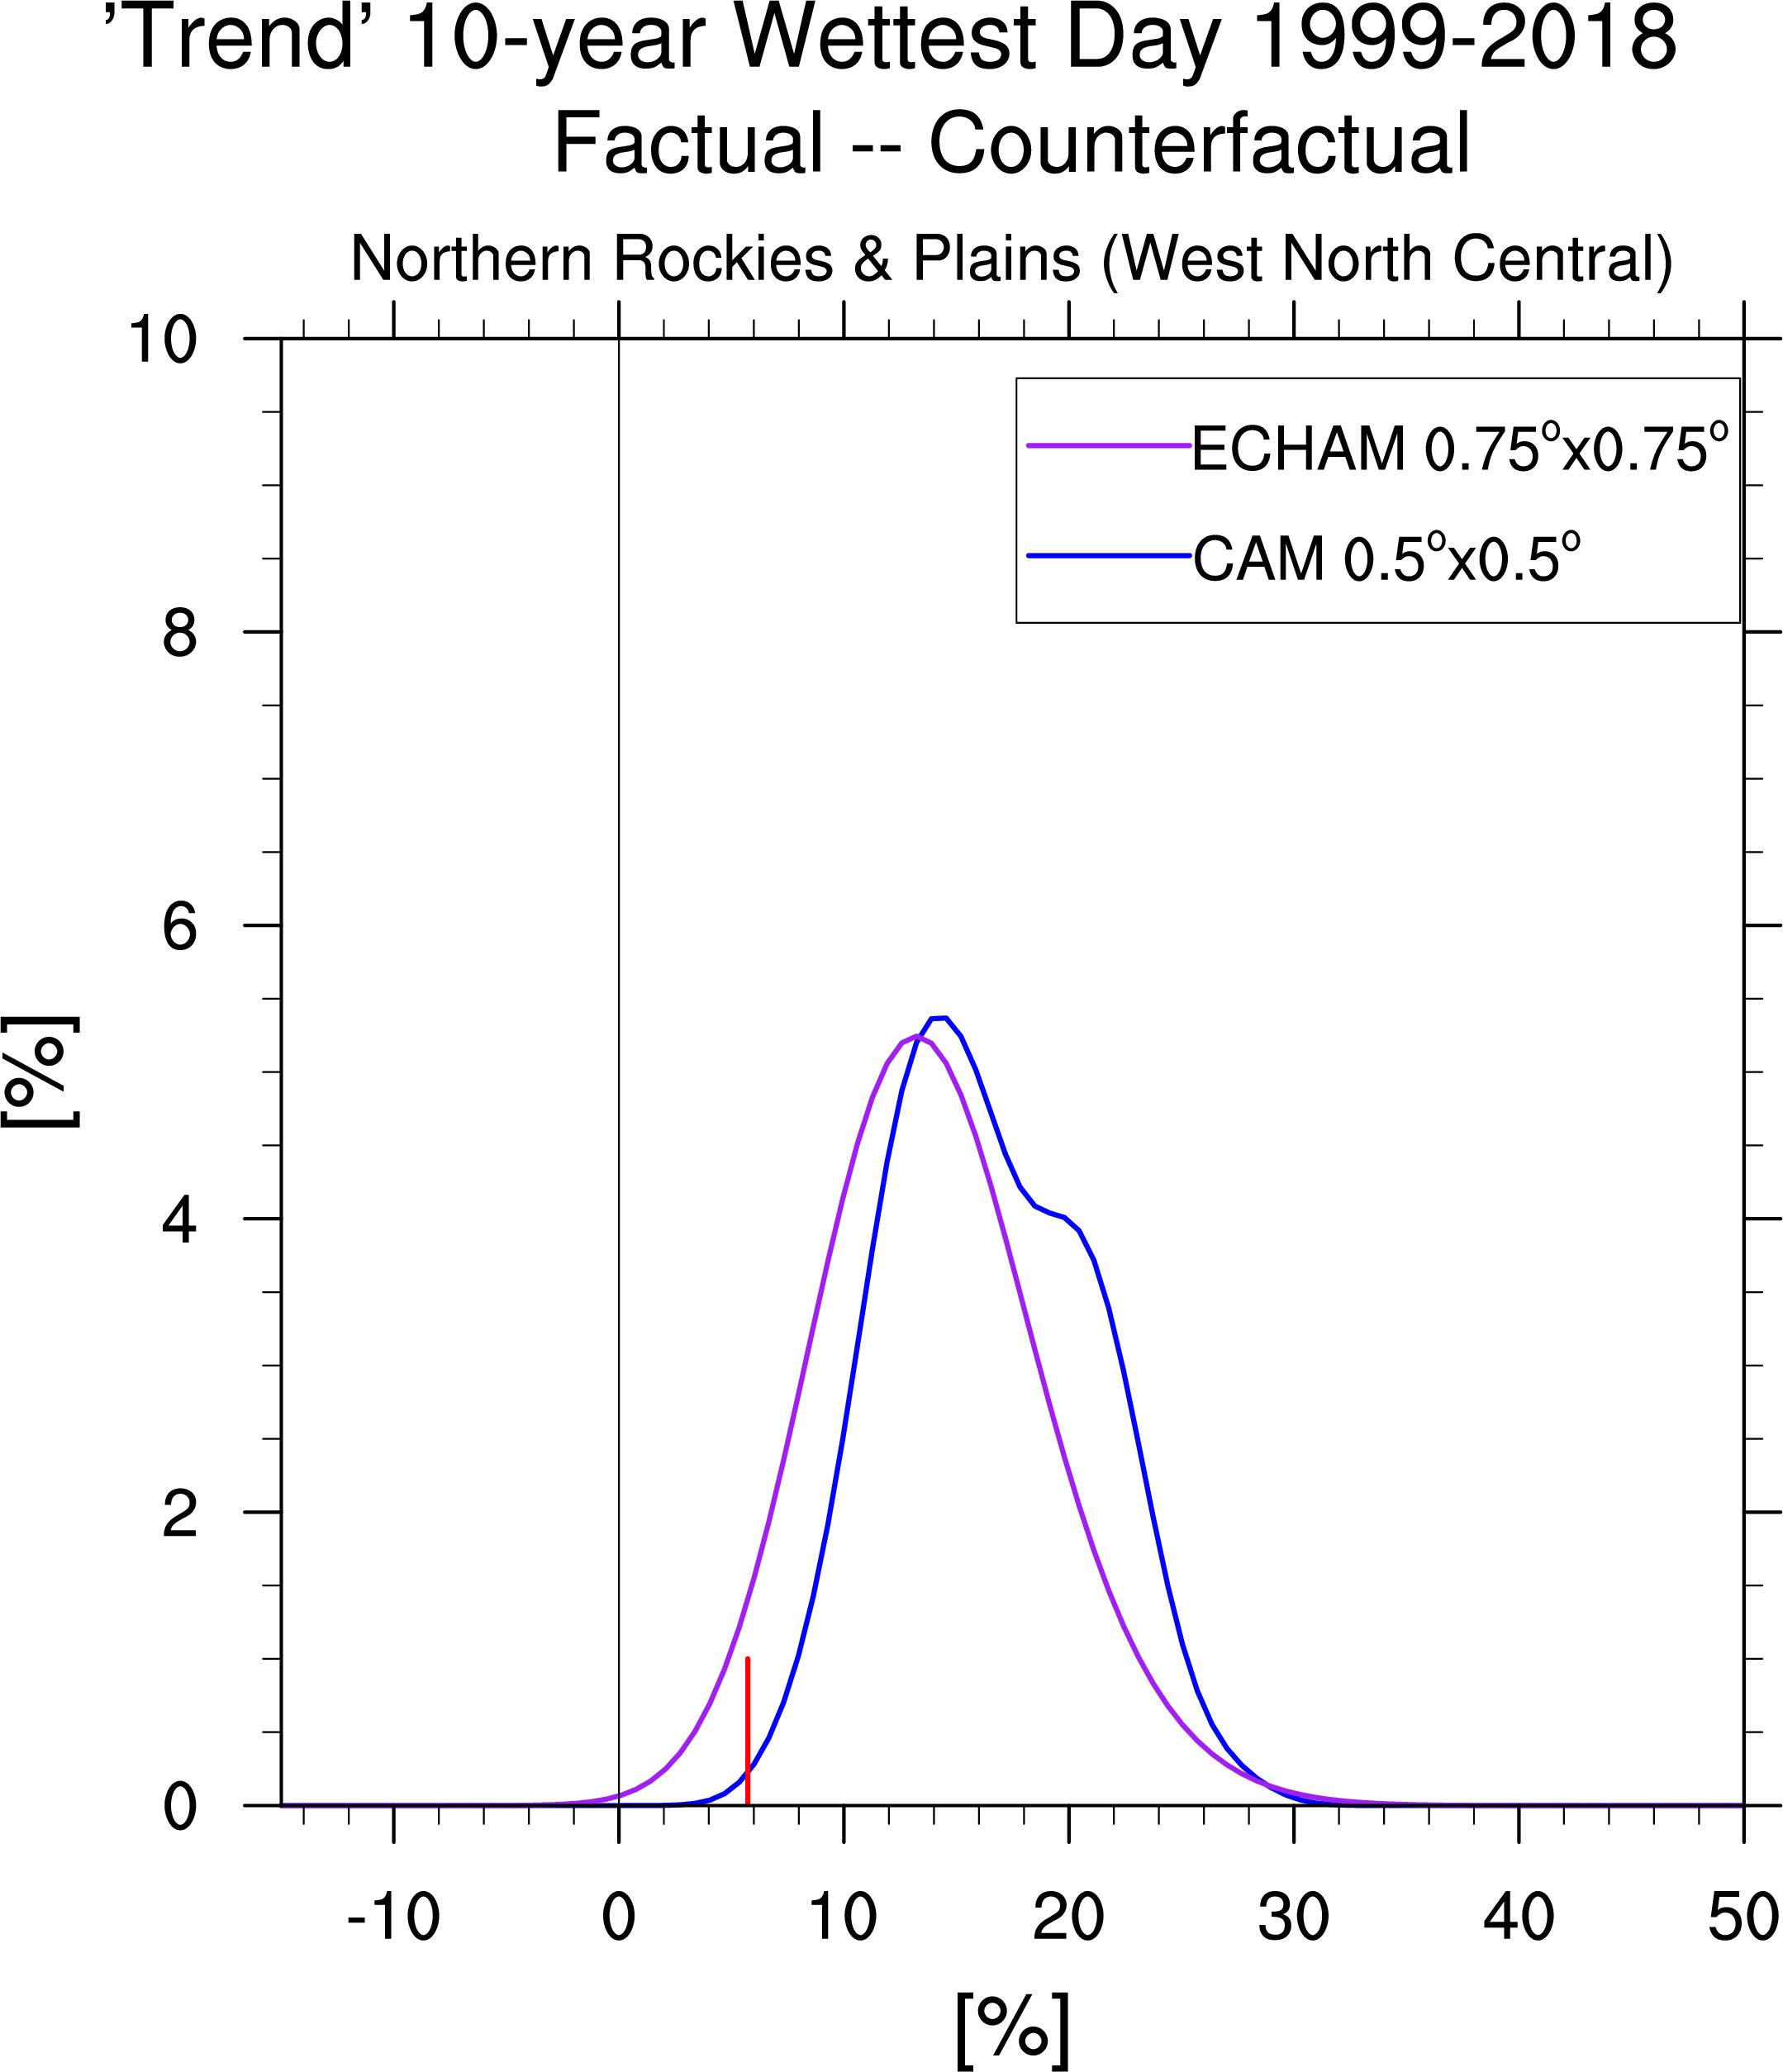
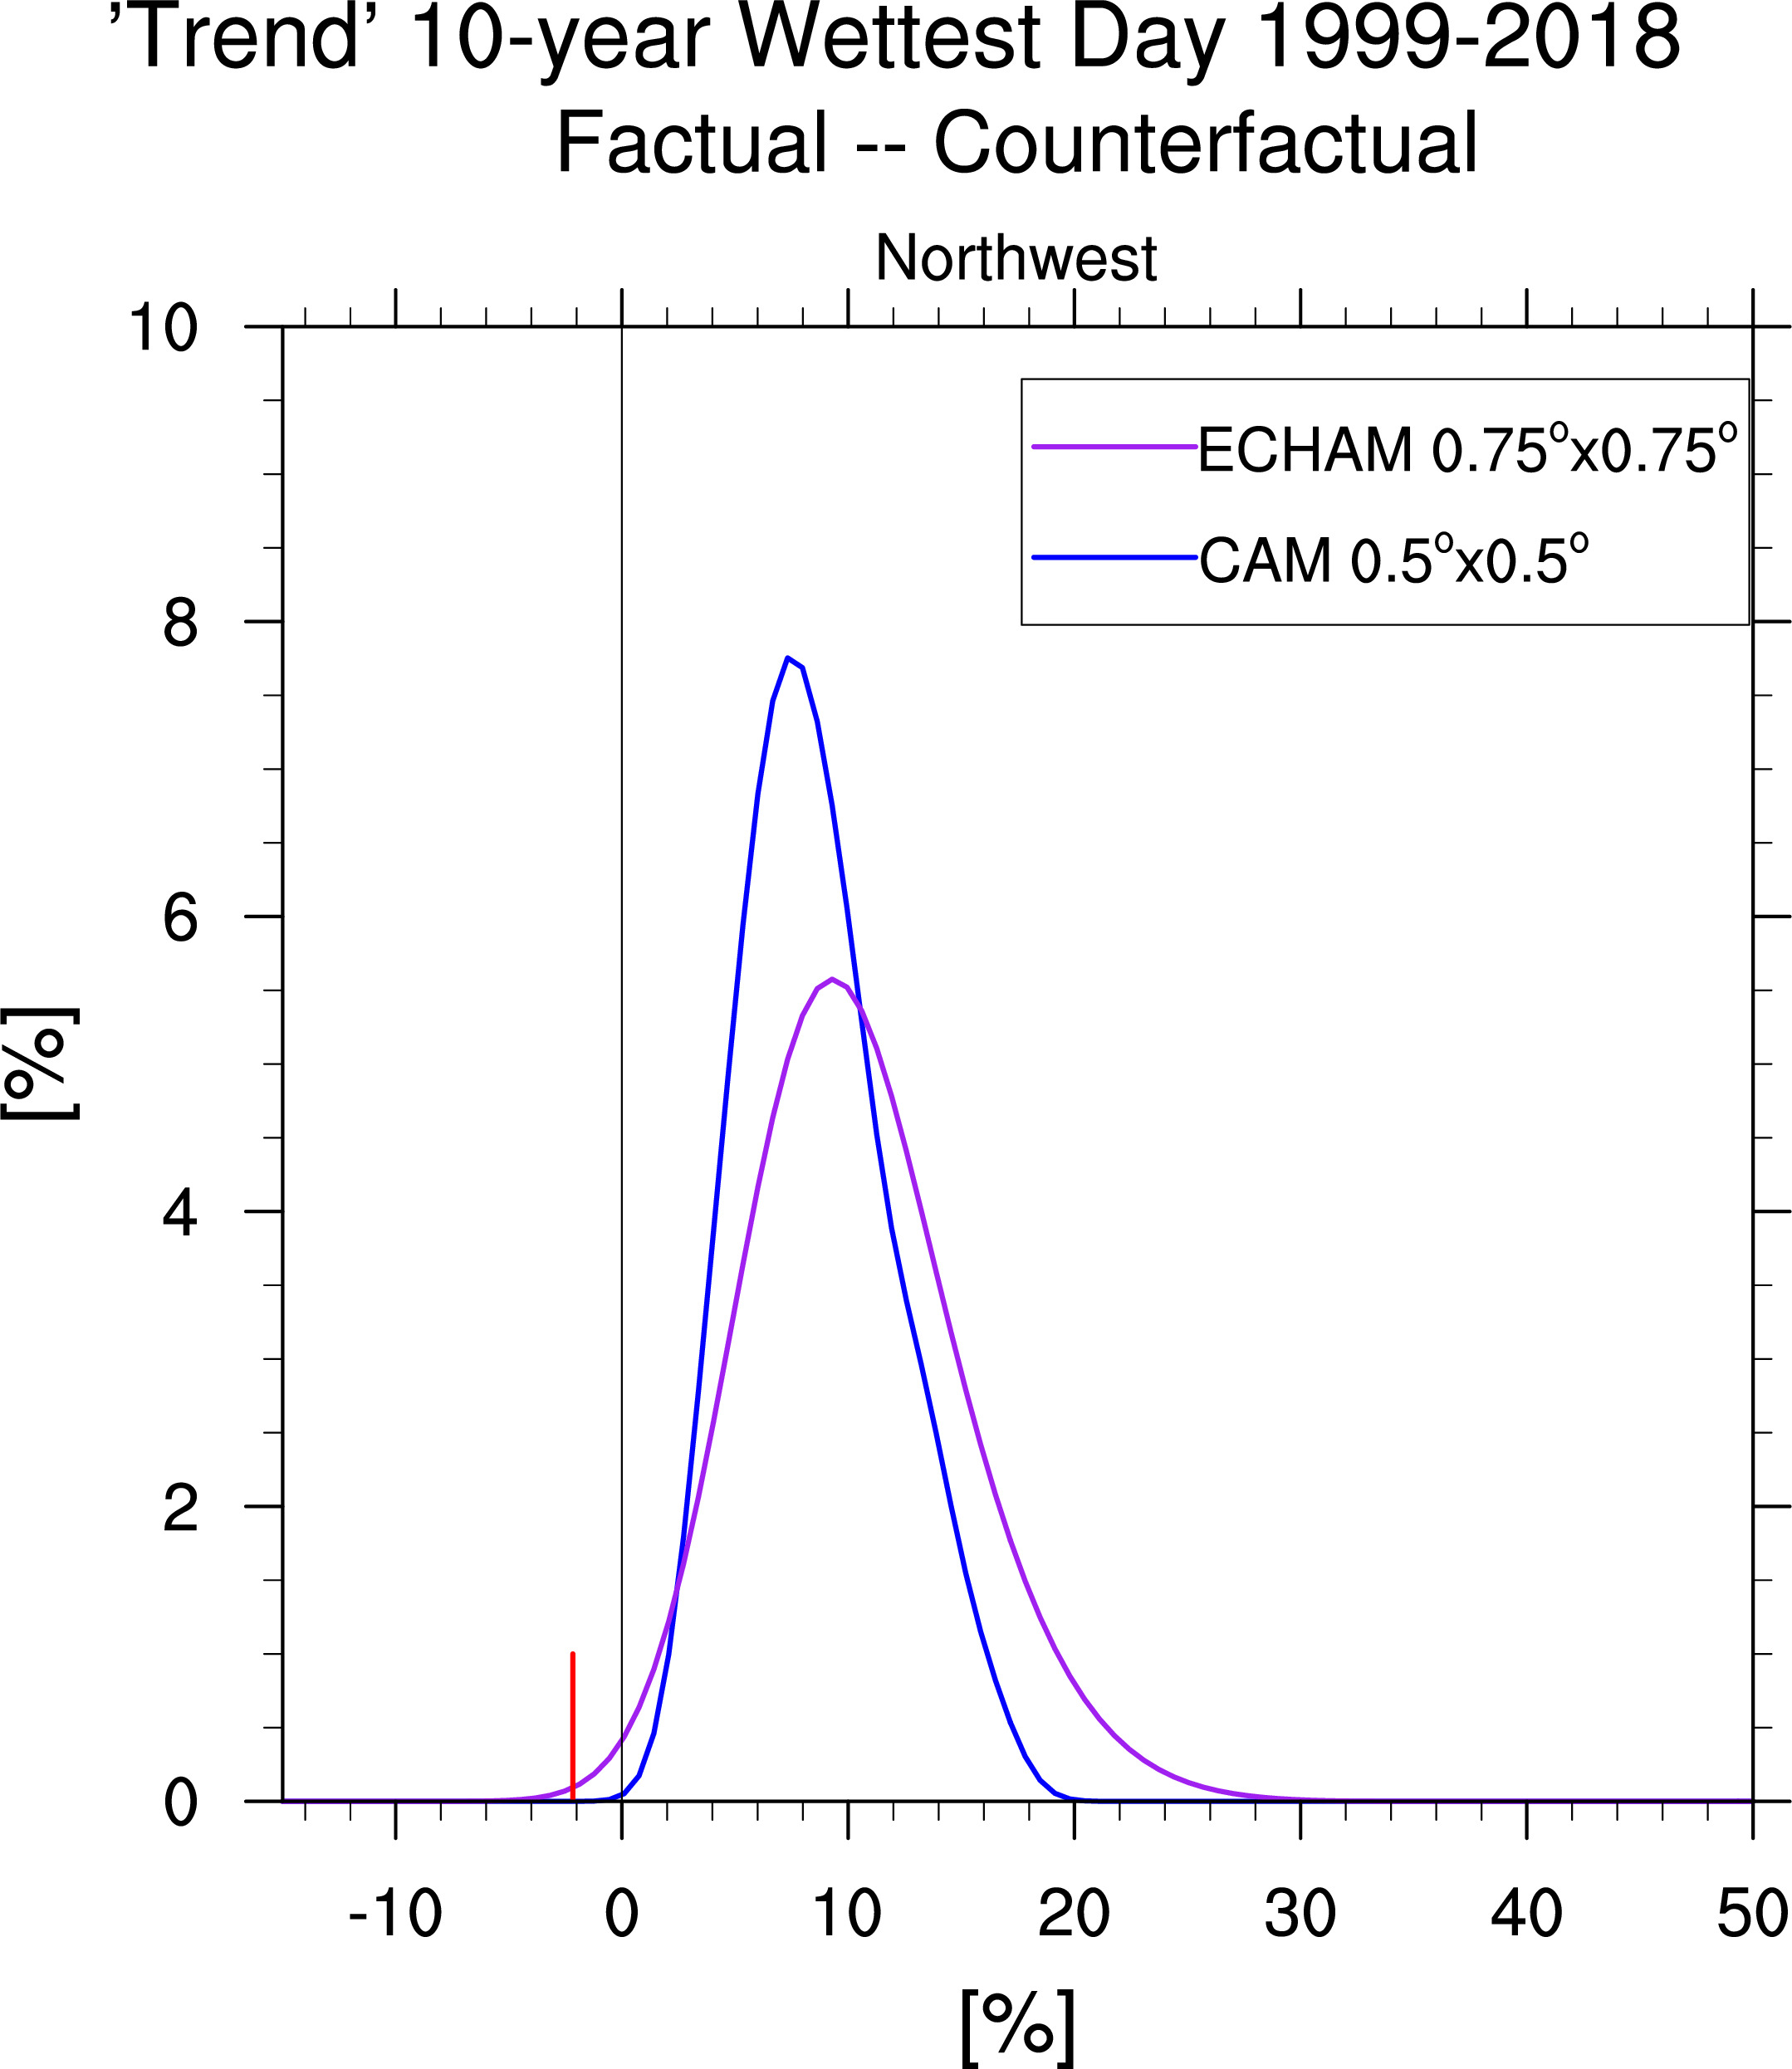
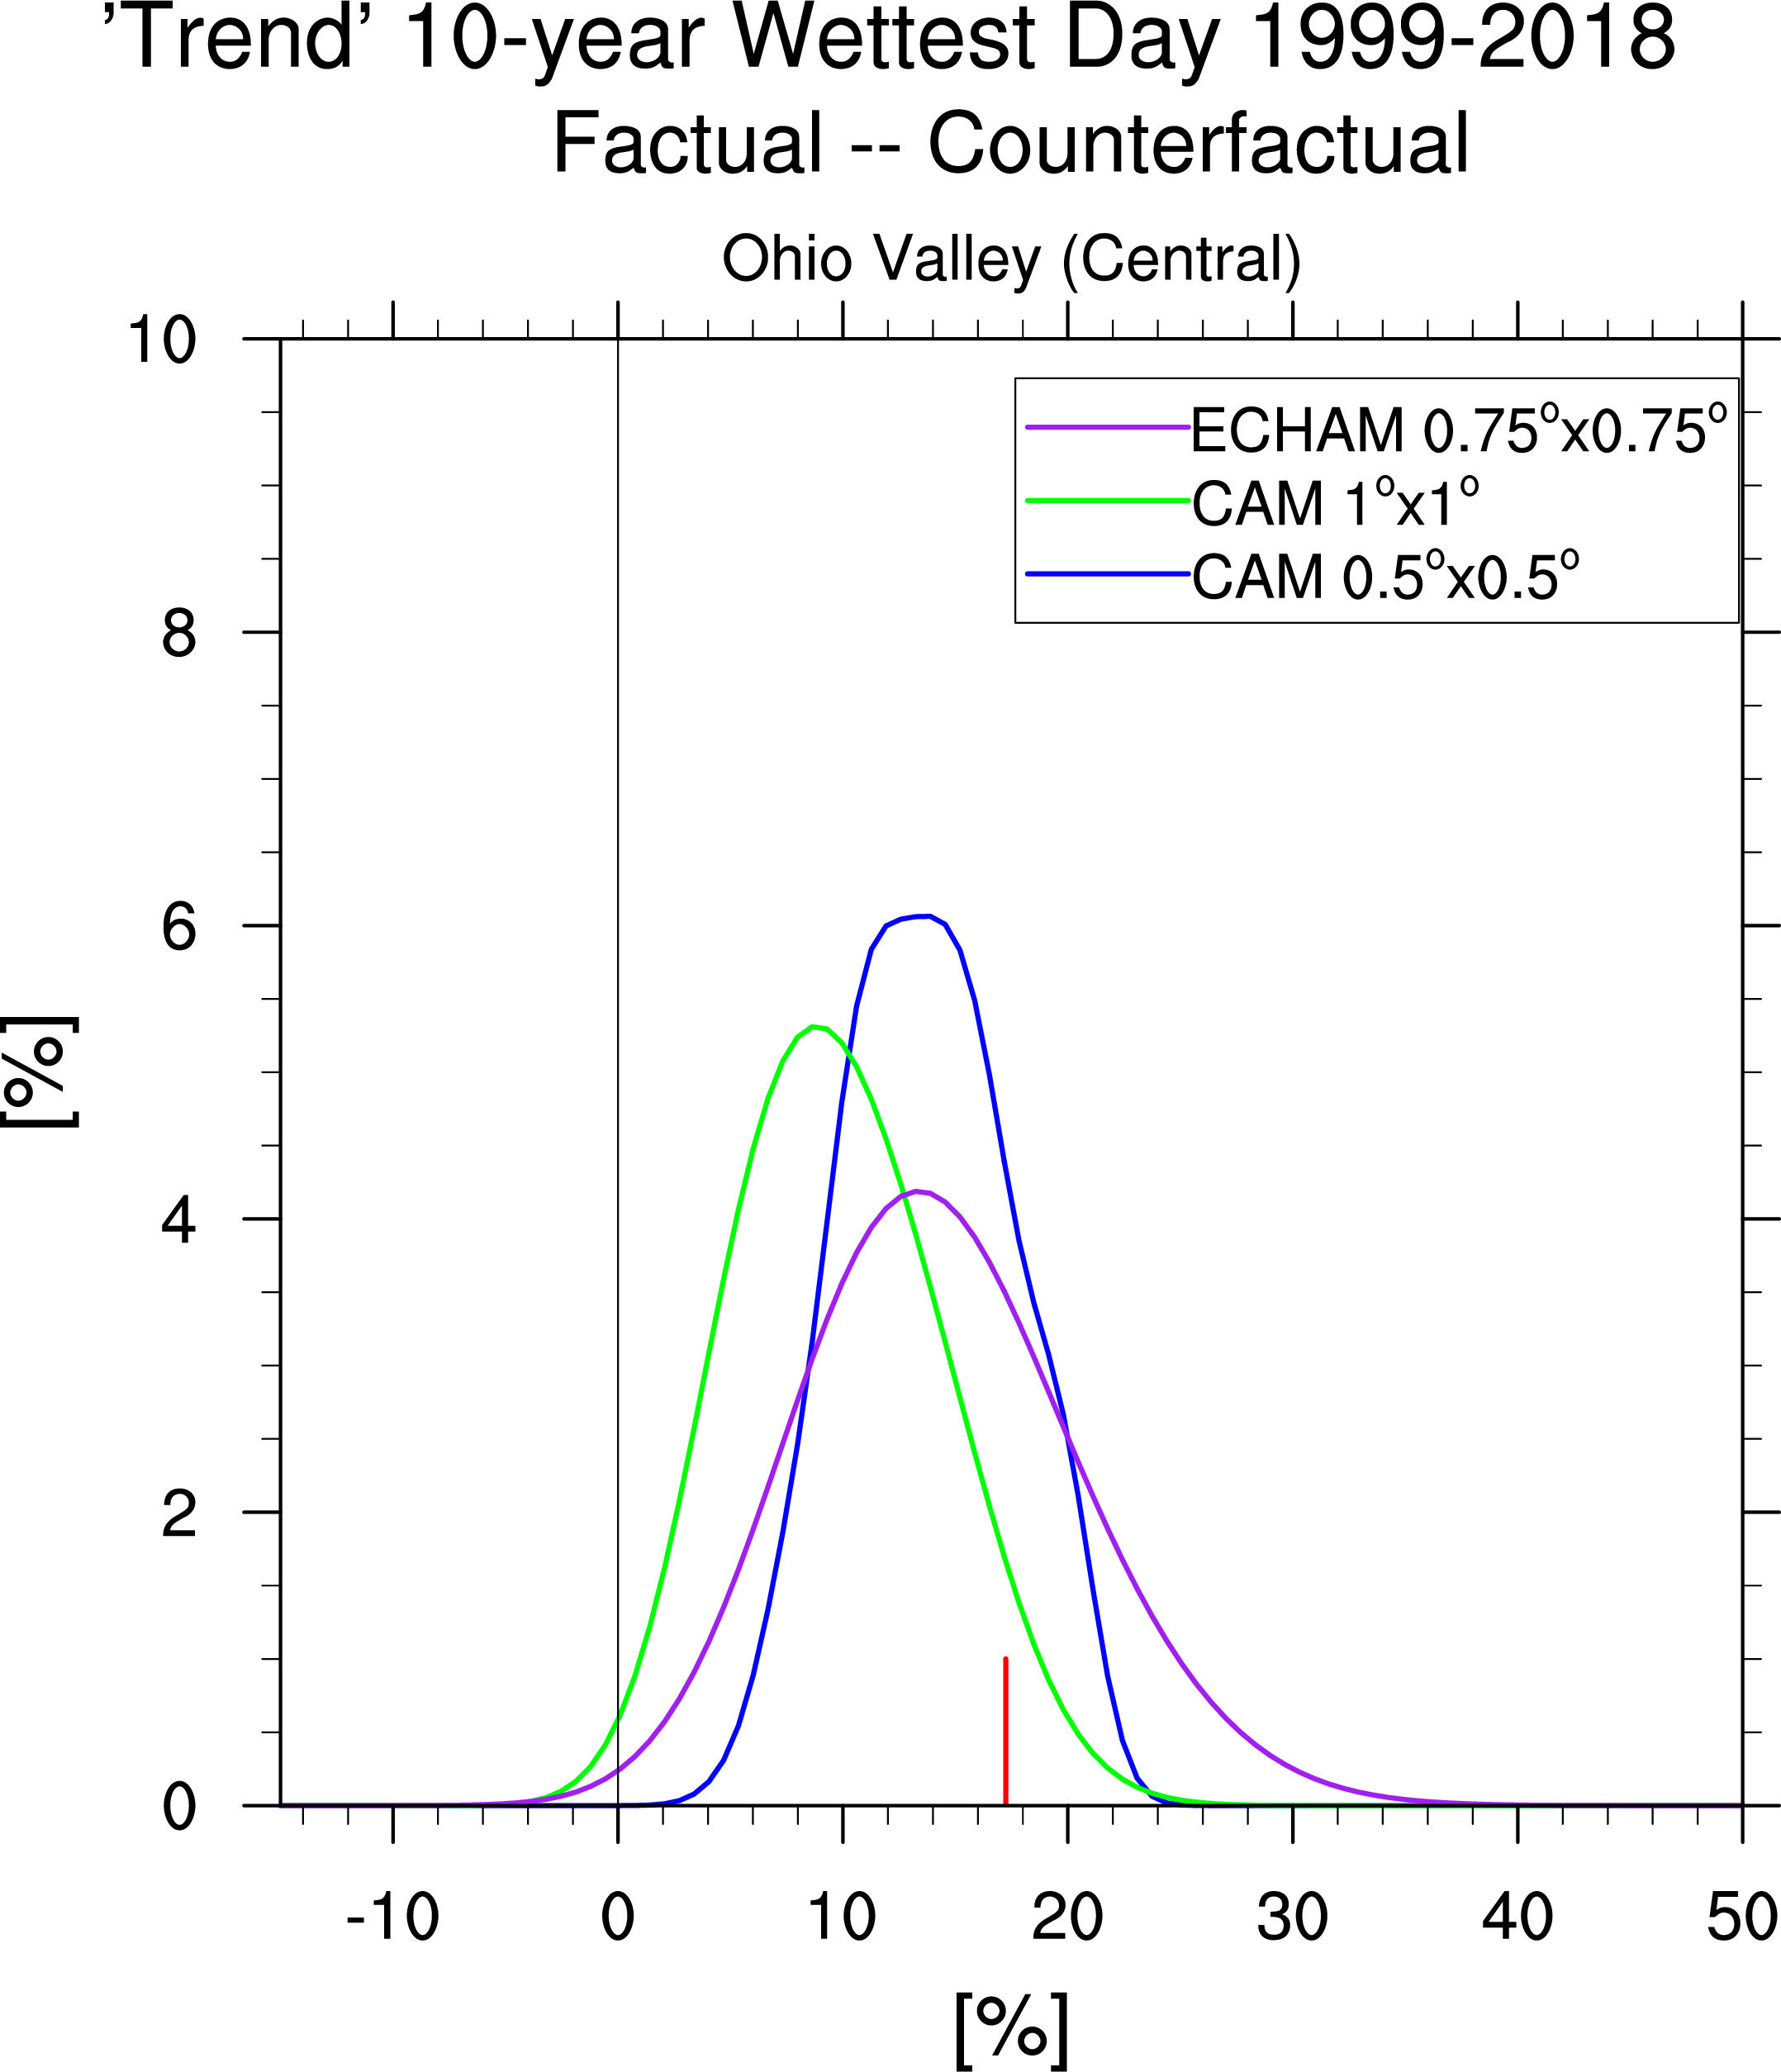
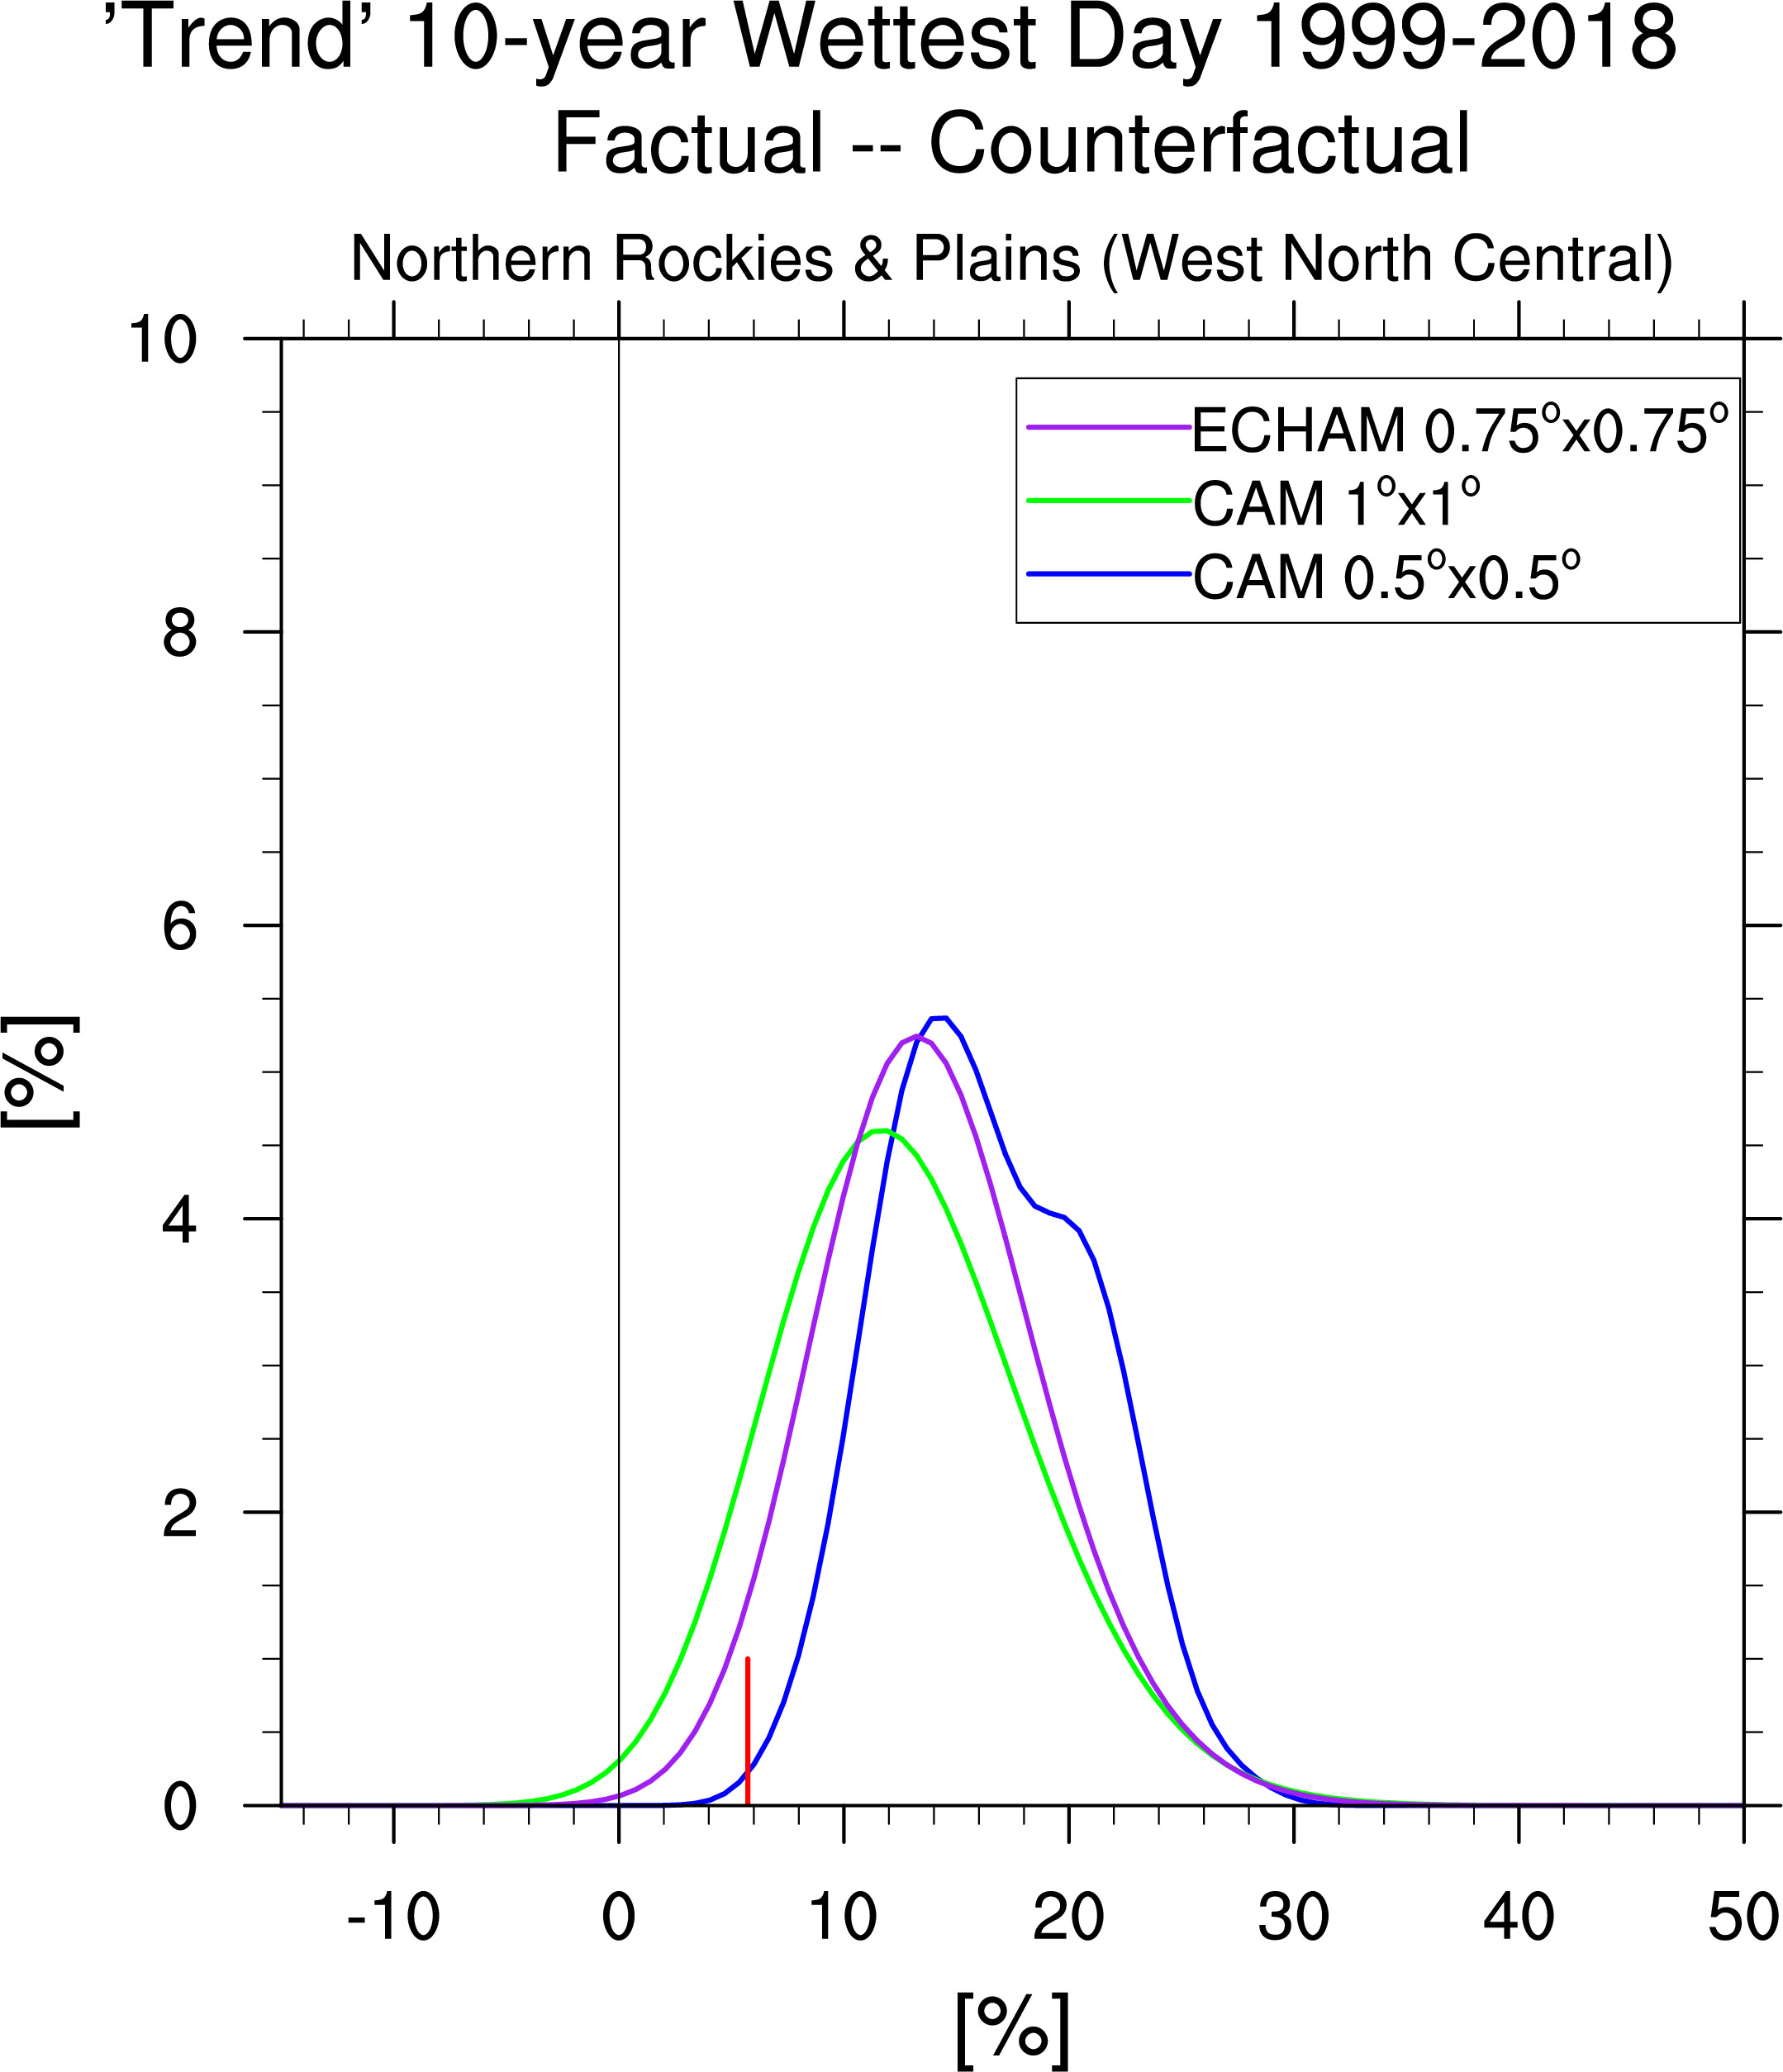
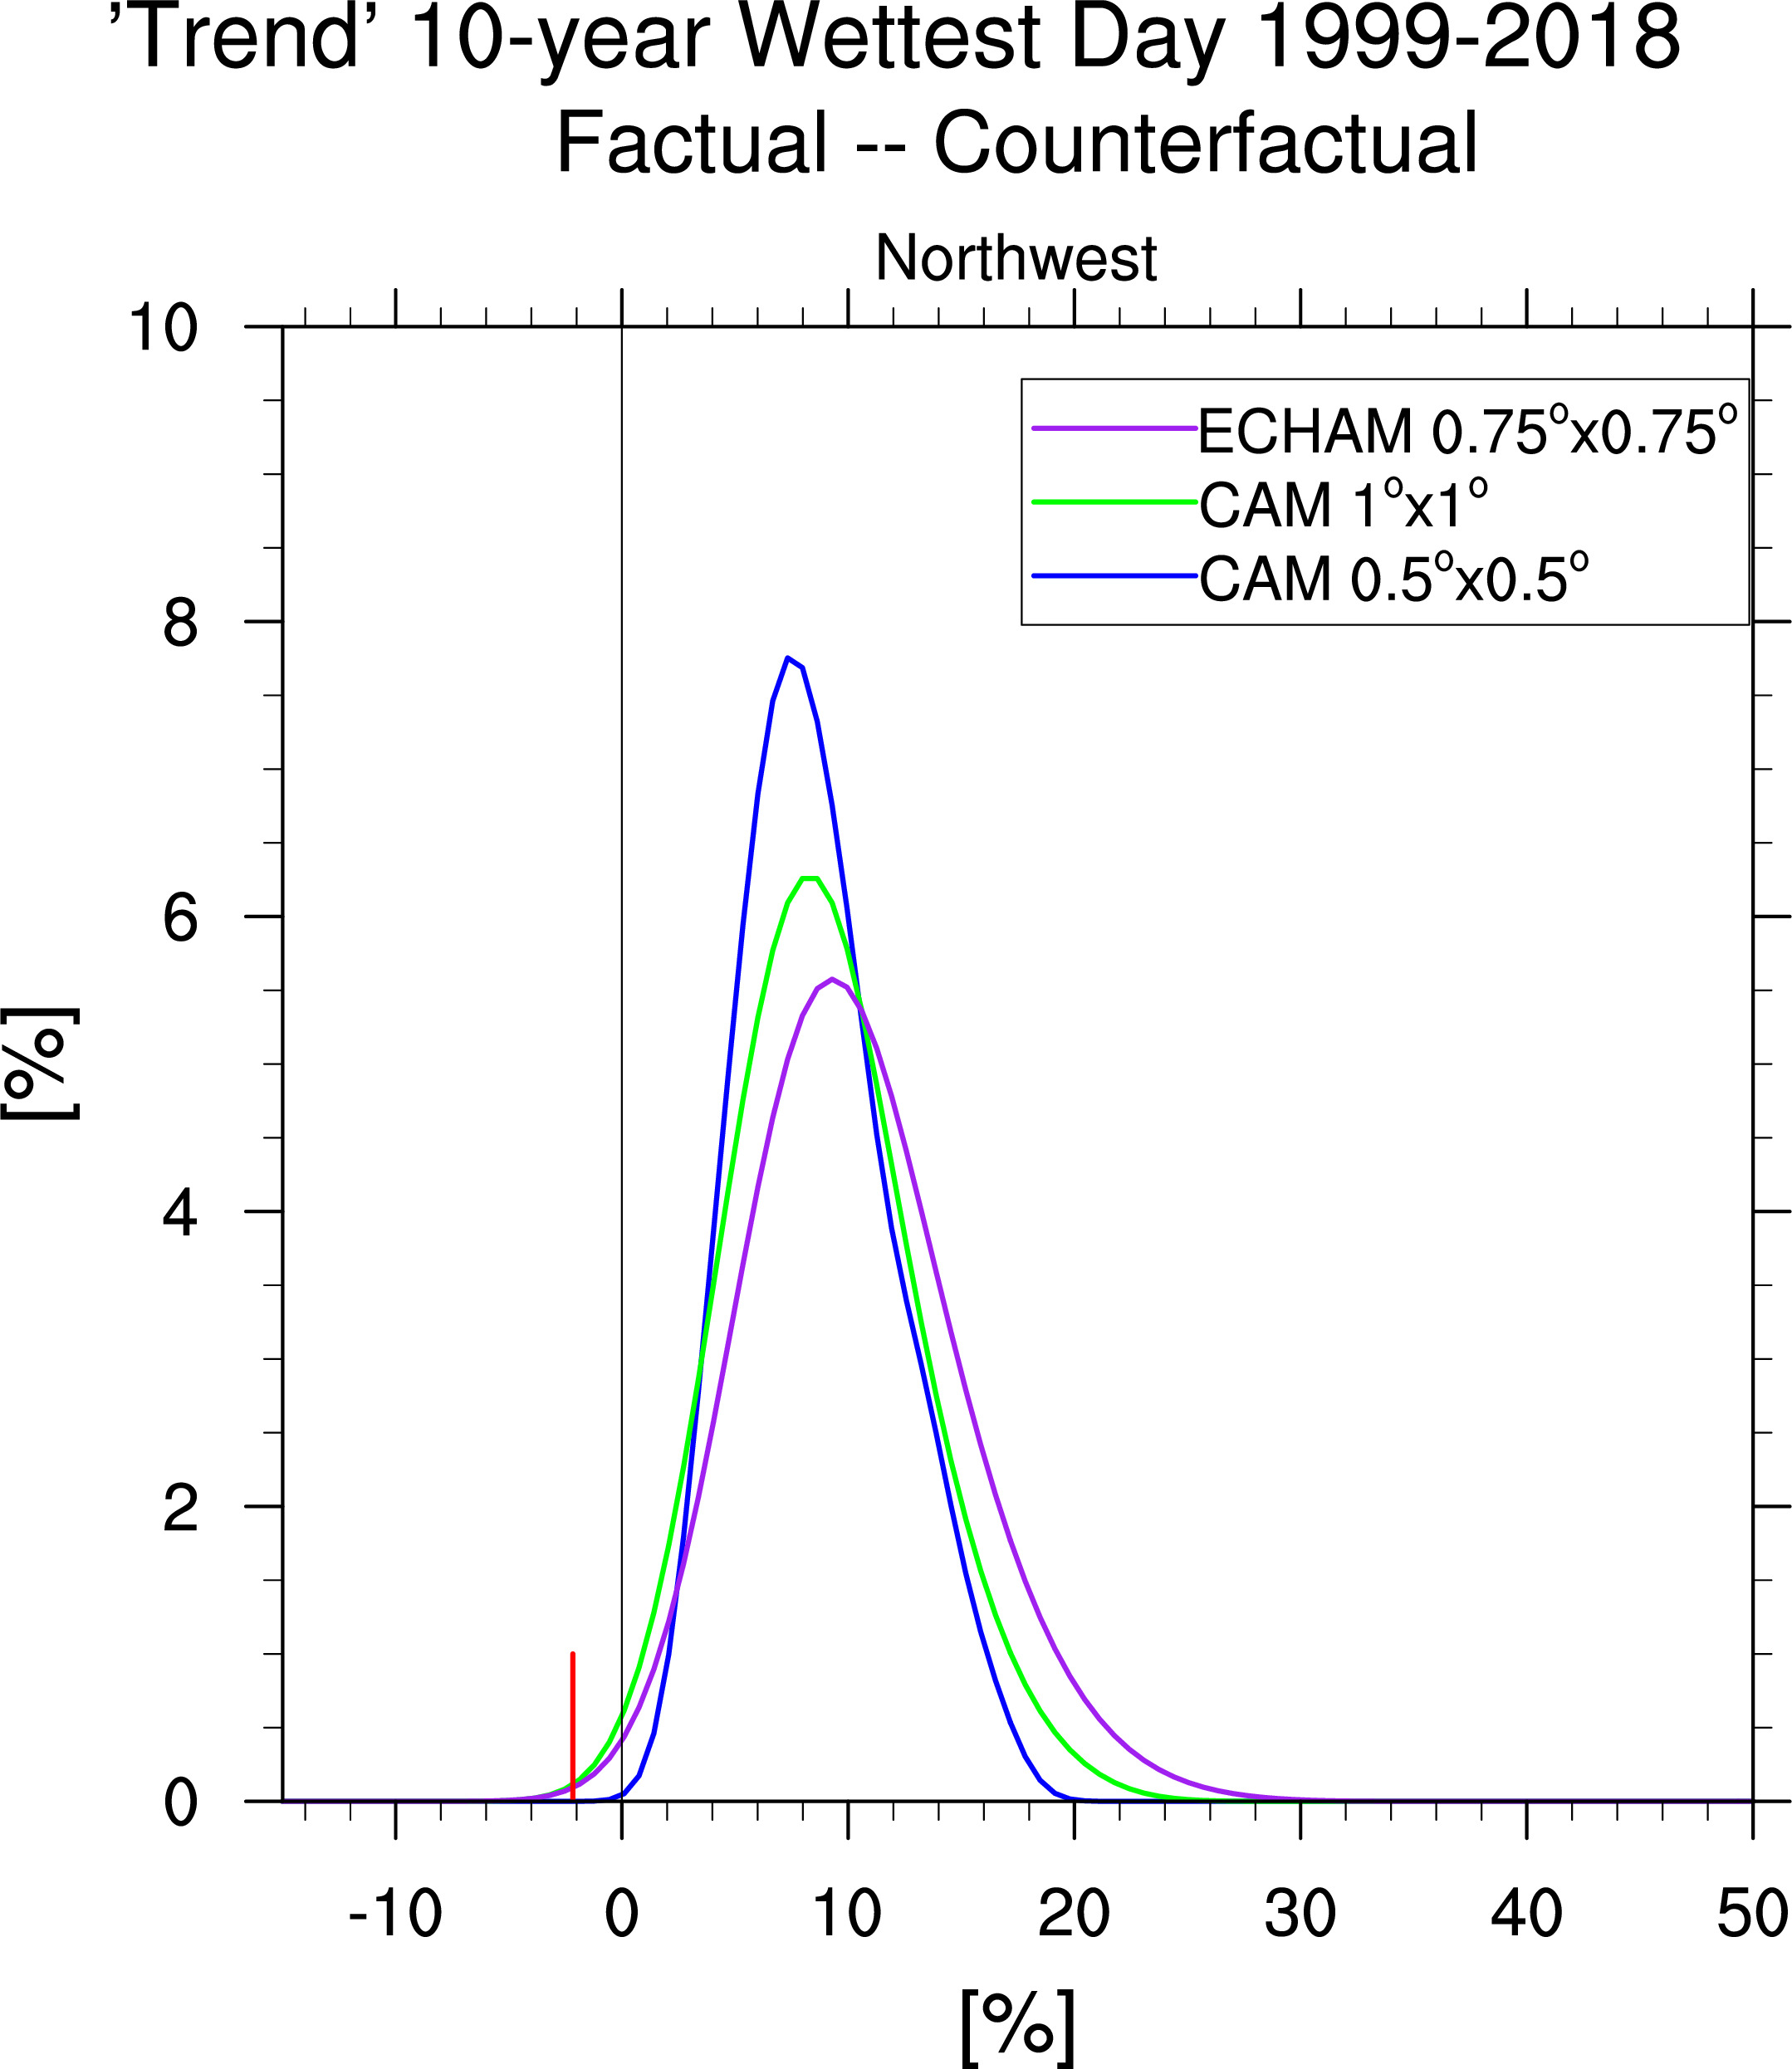
Below red line is CPC 'trend' for region.
Two Models
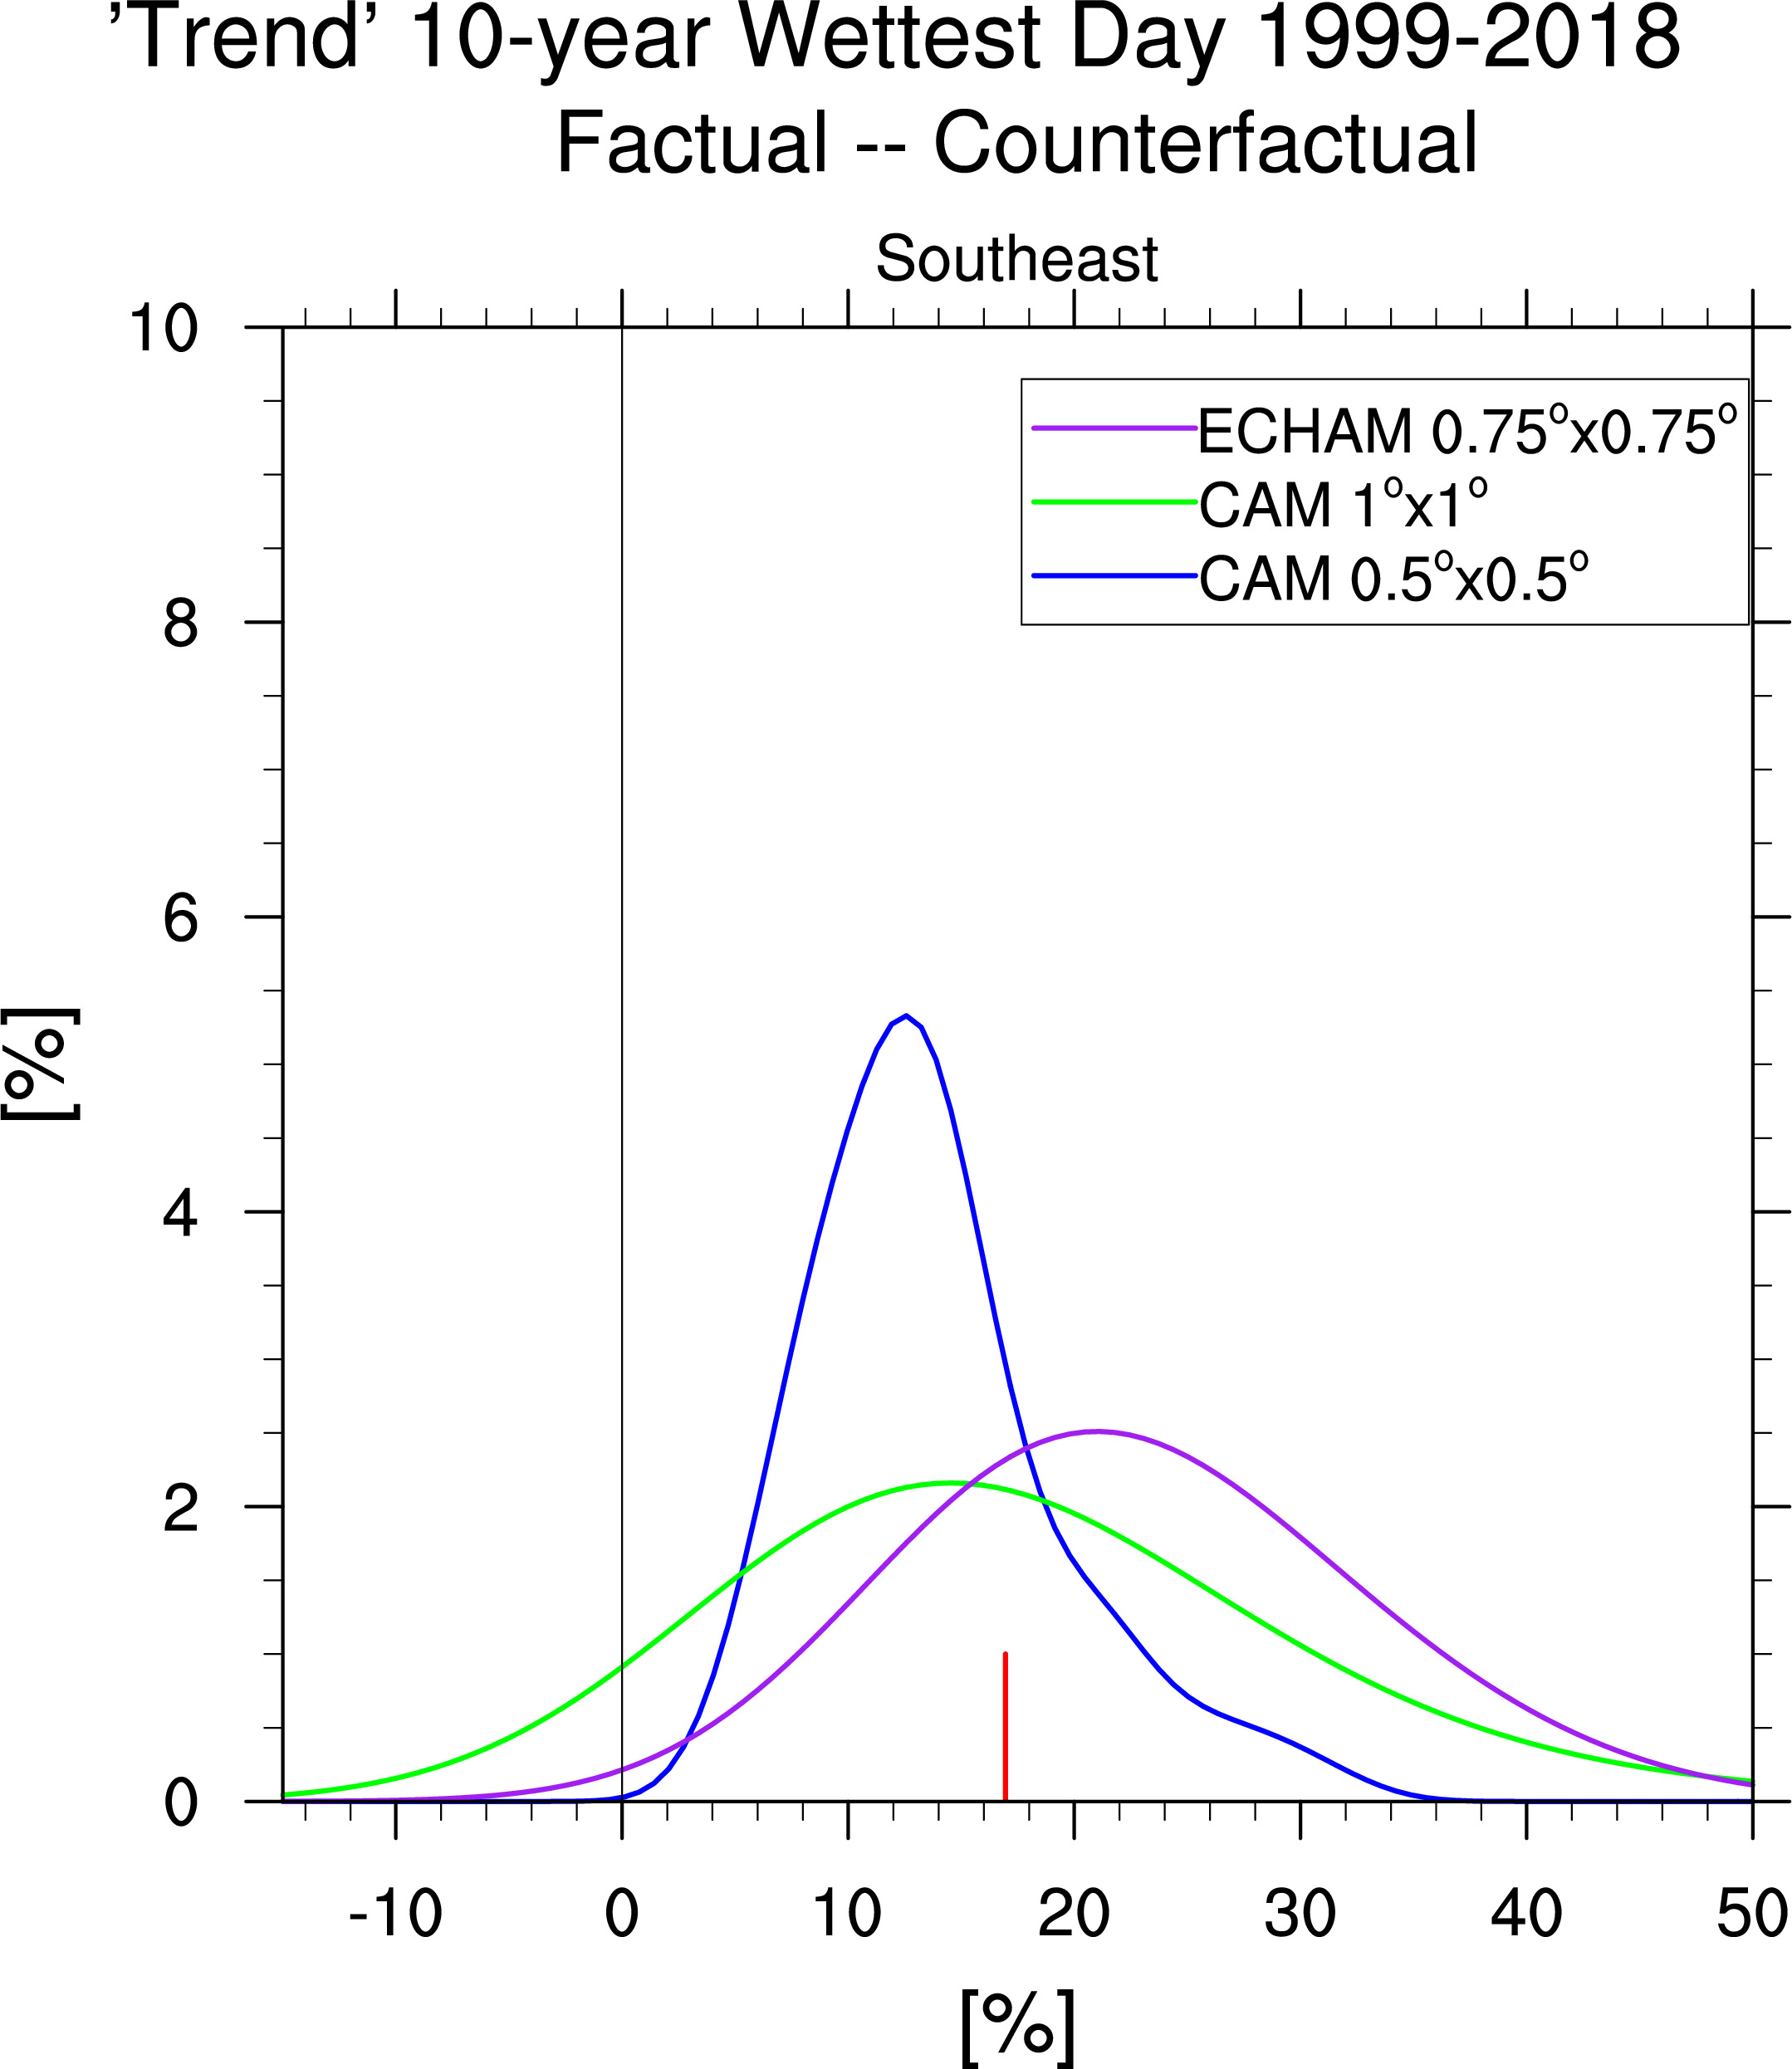
Below red line is CPC 'trend' for region.
Three Models
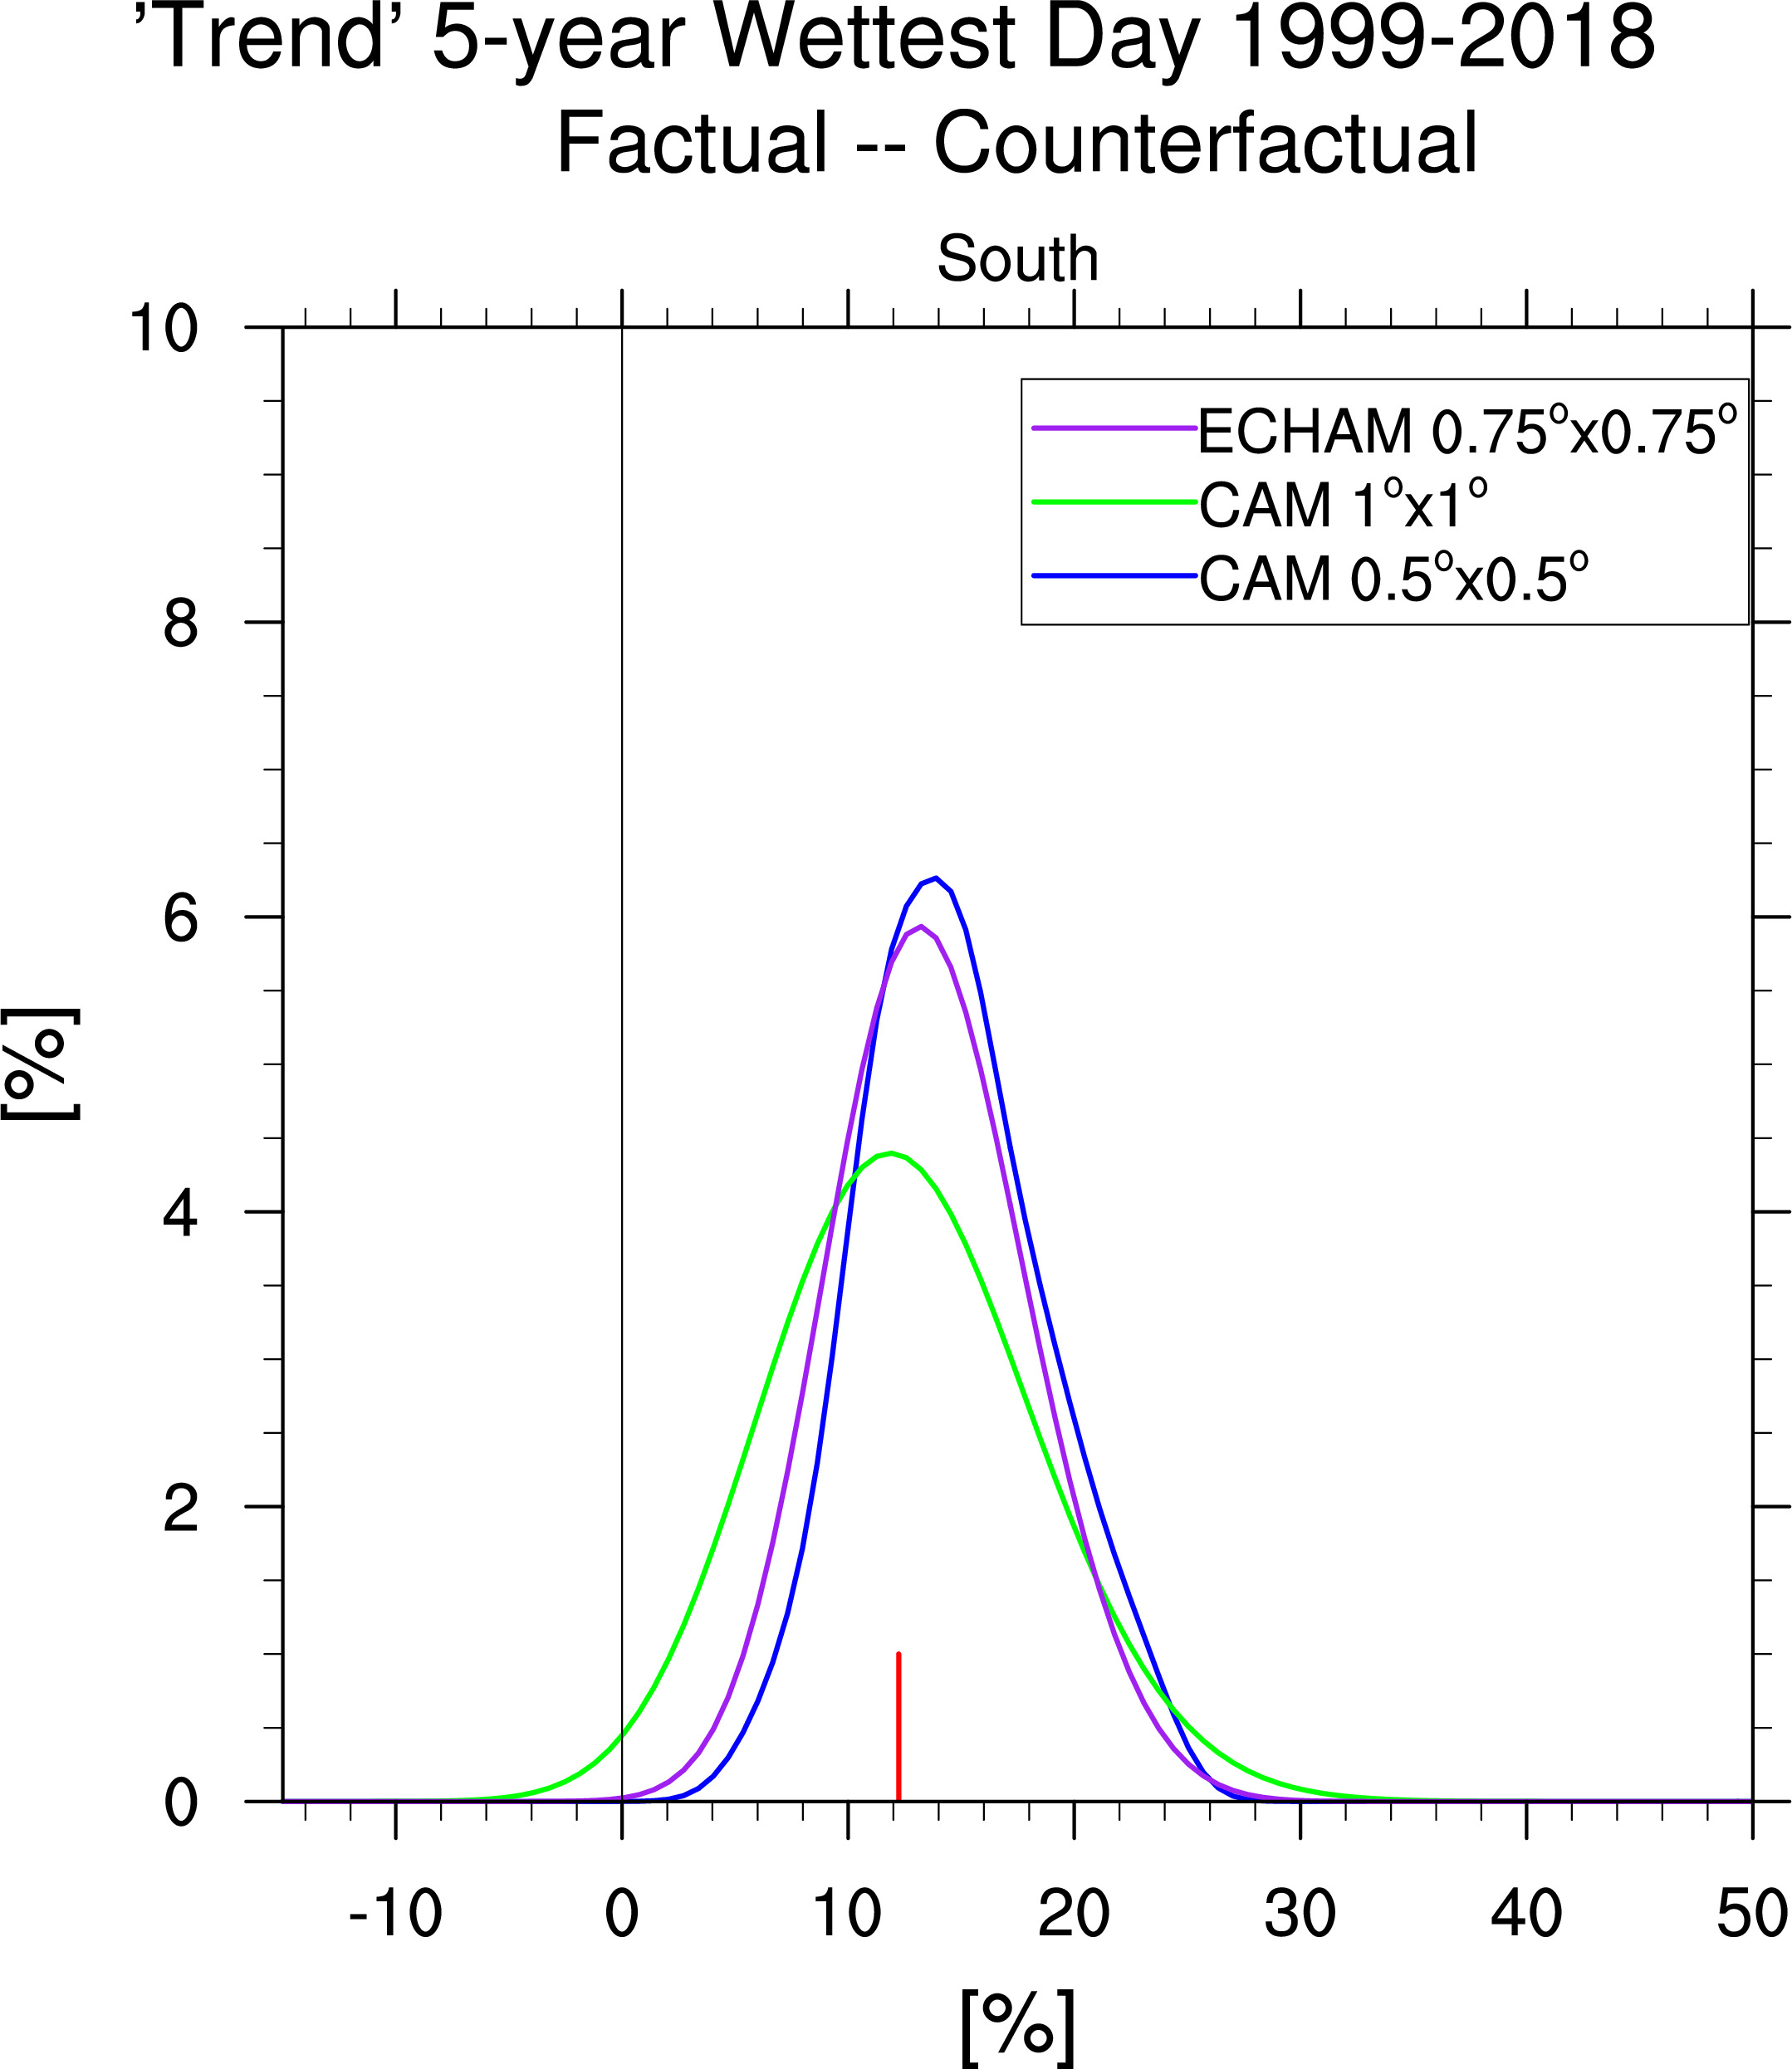
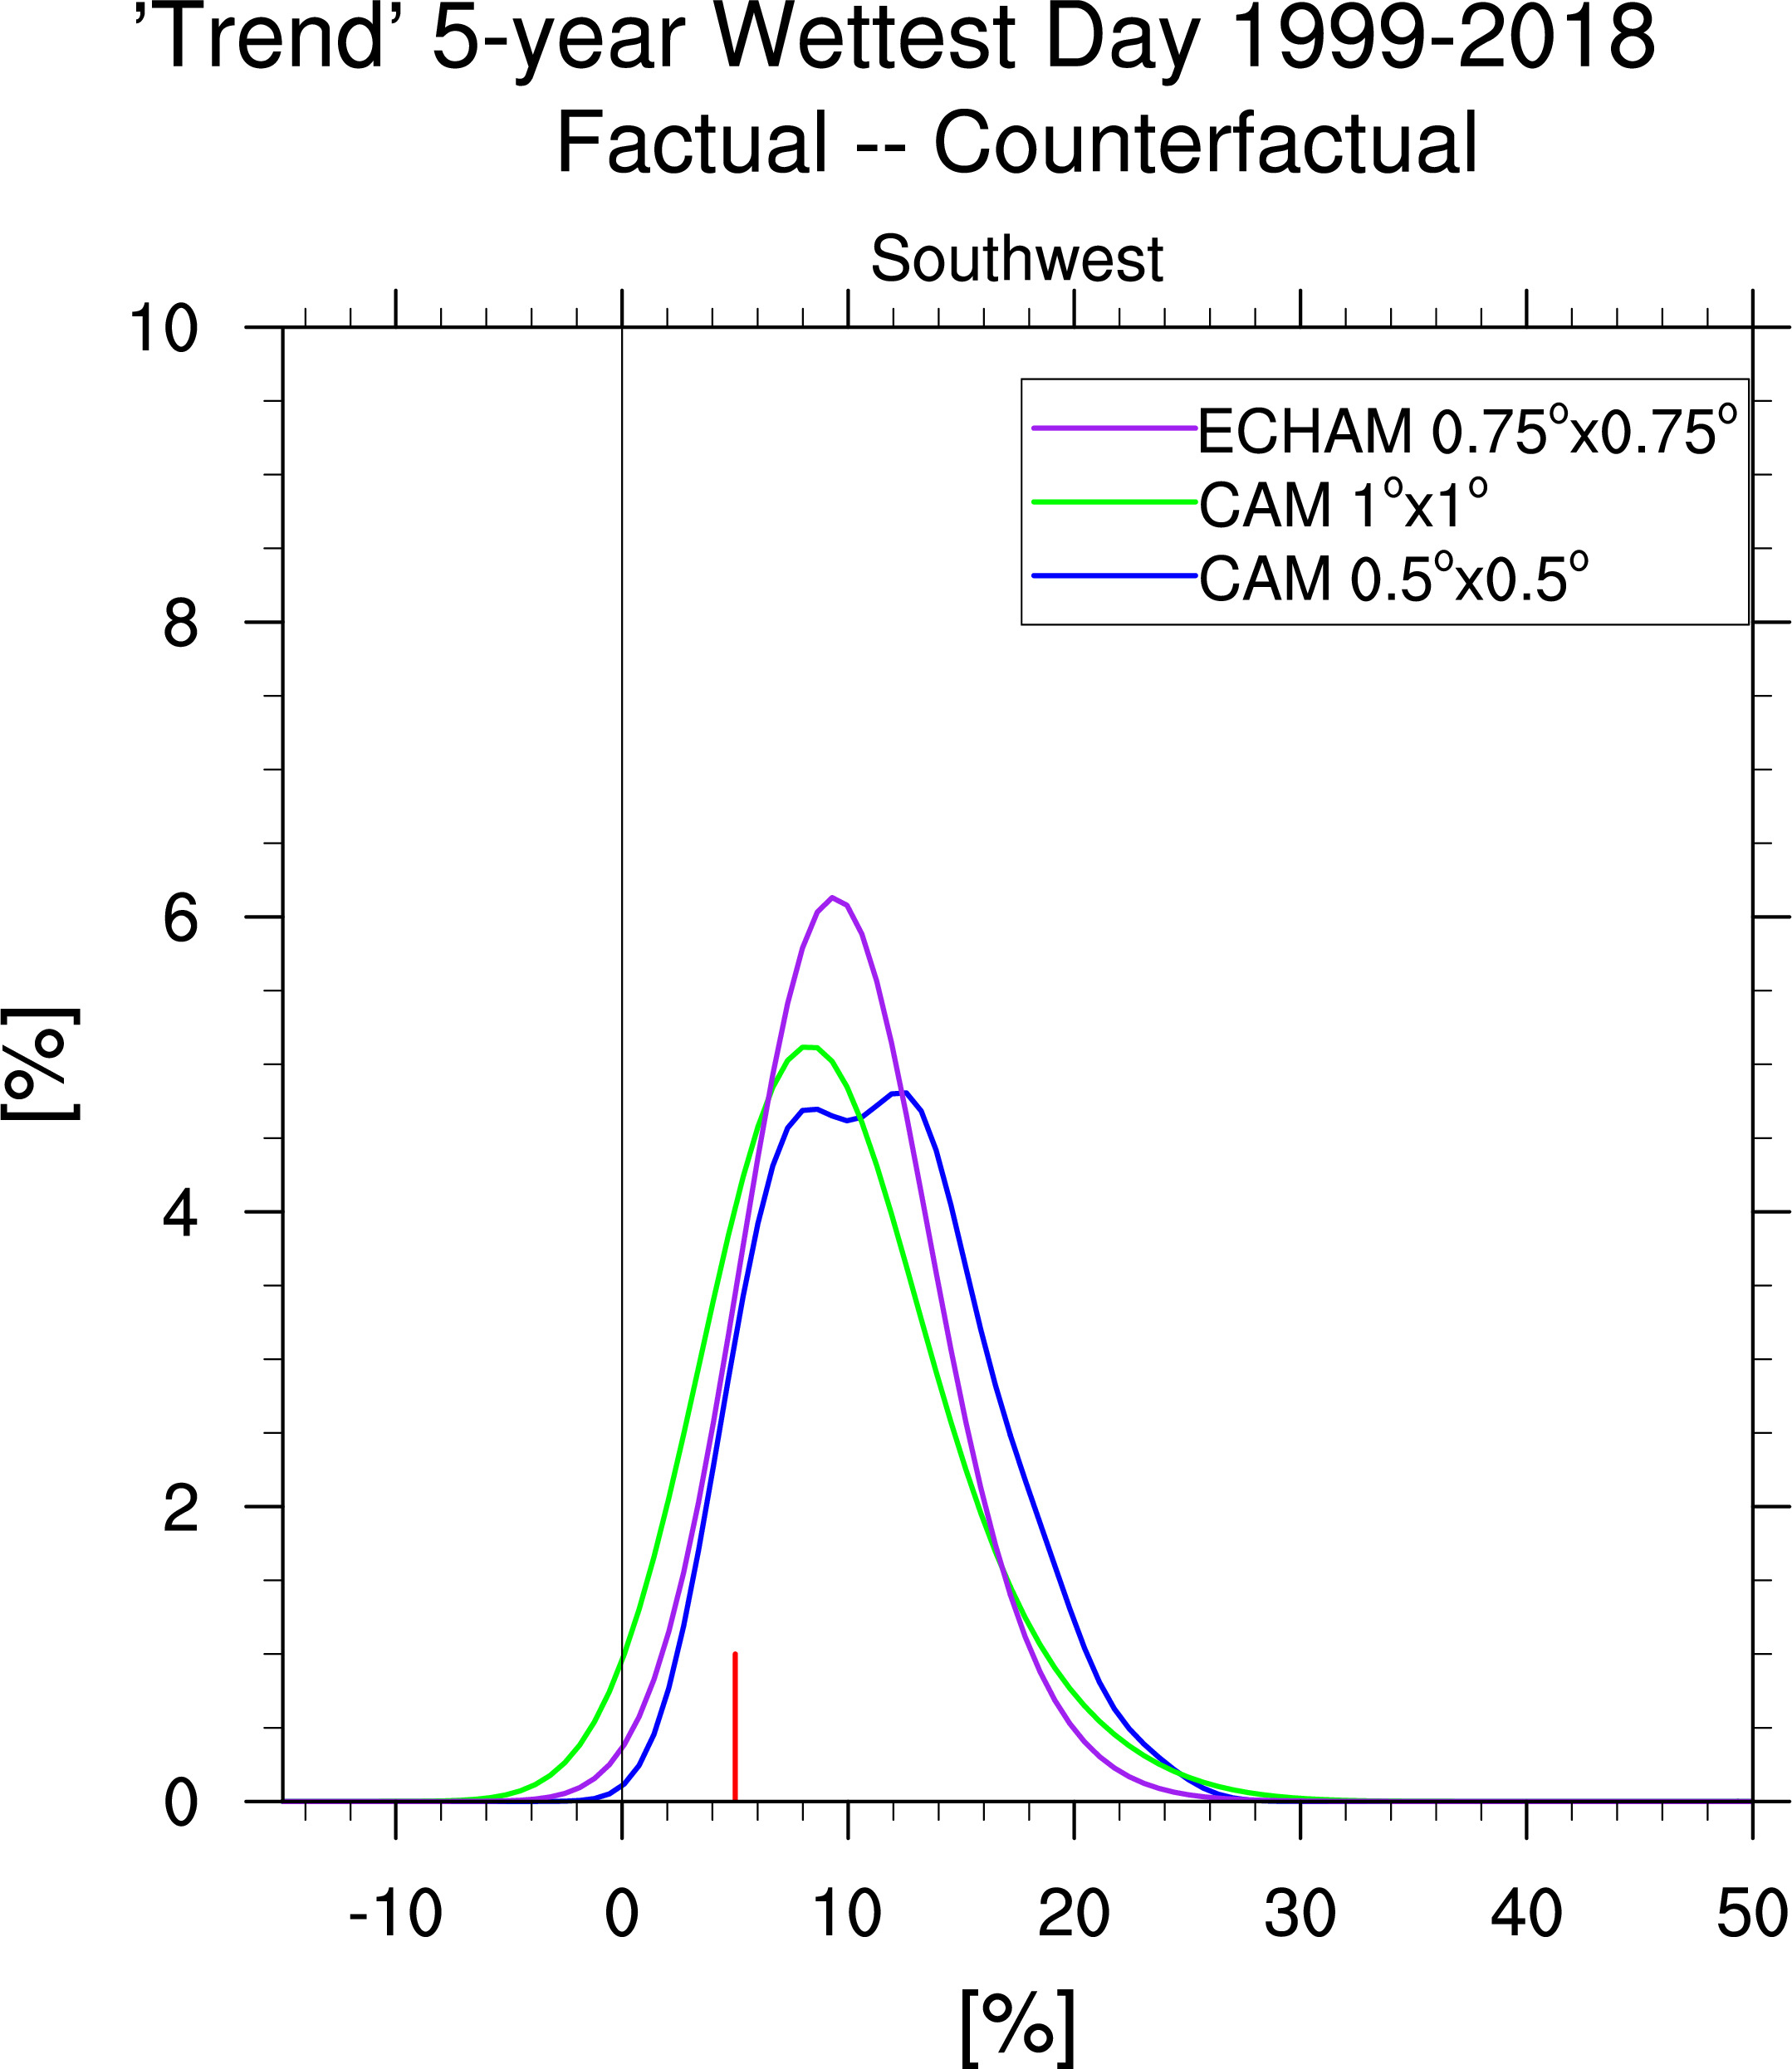
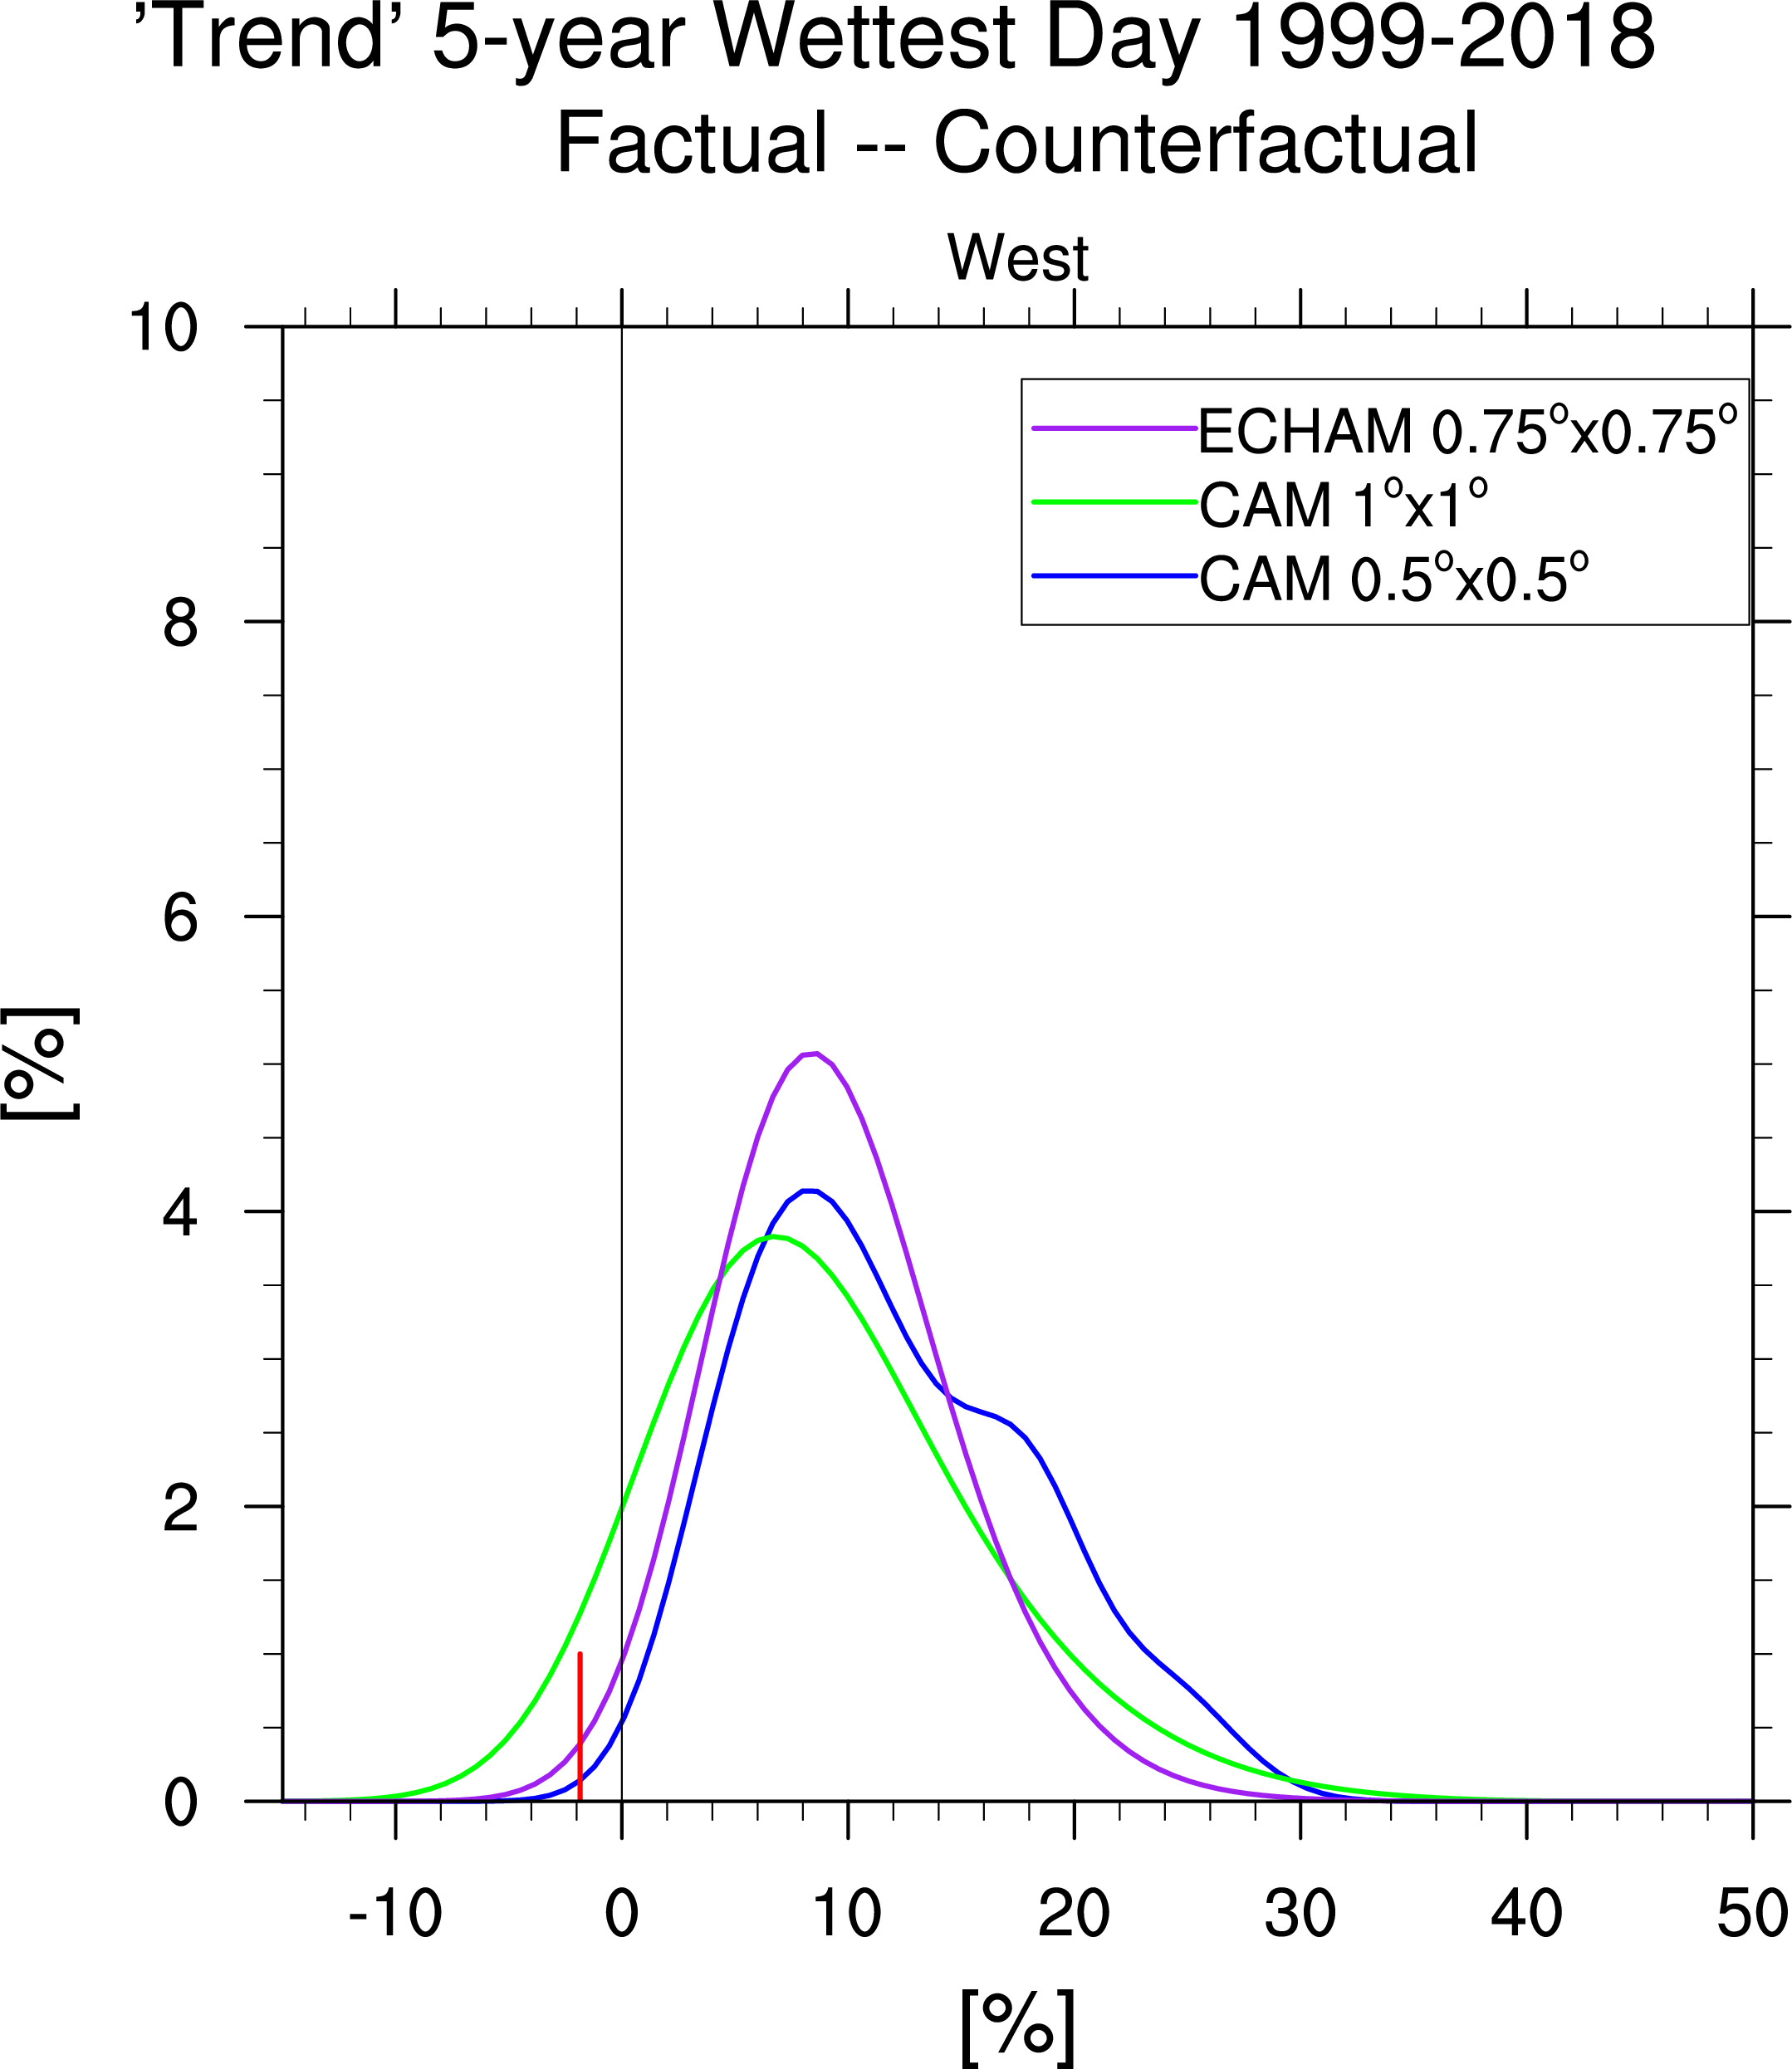
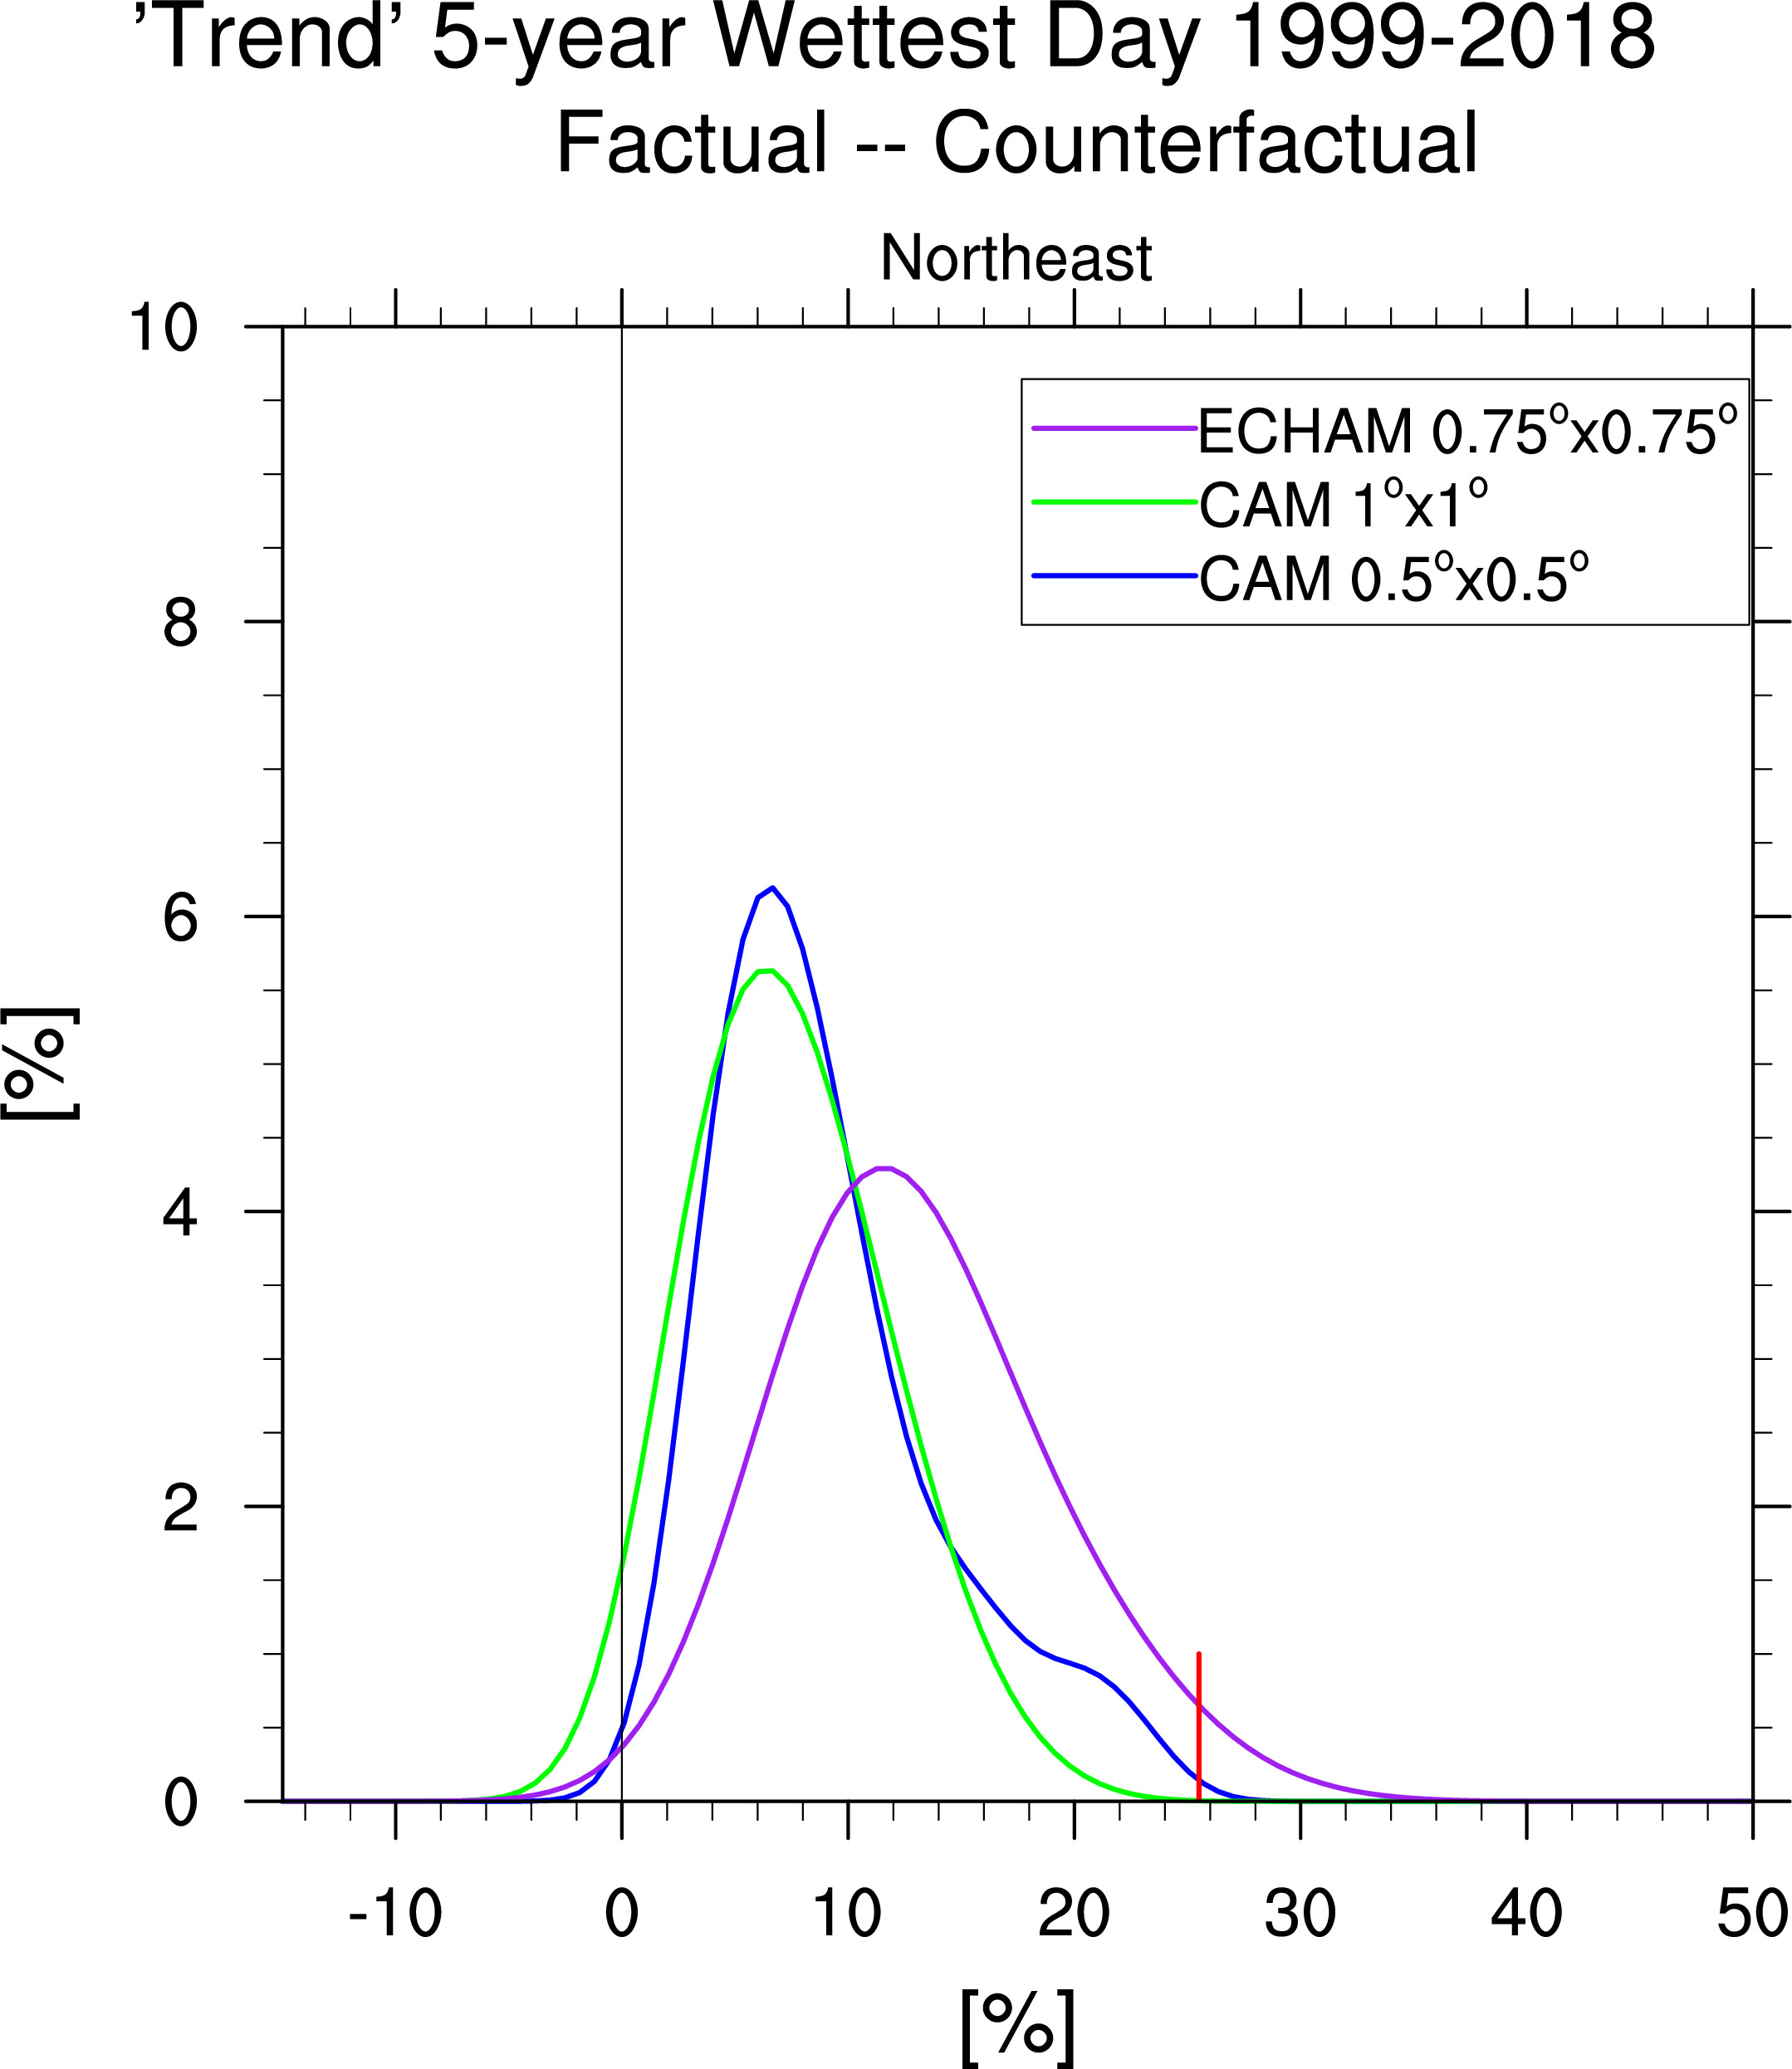
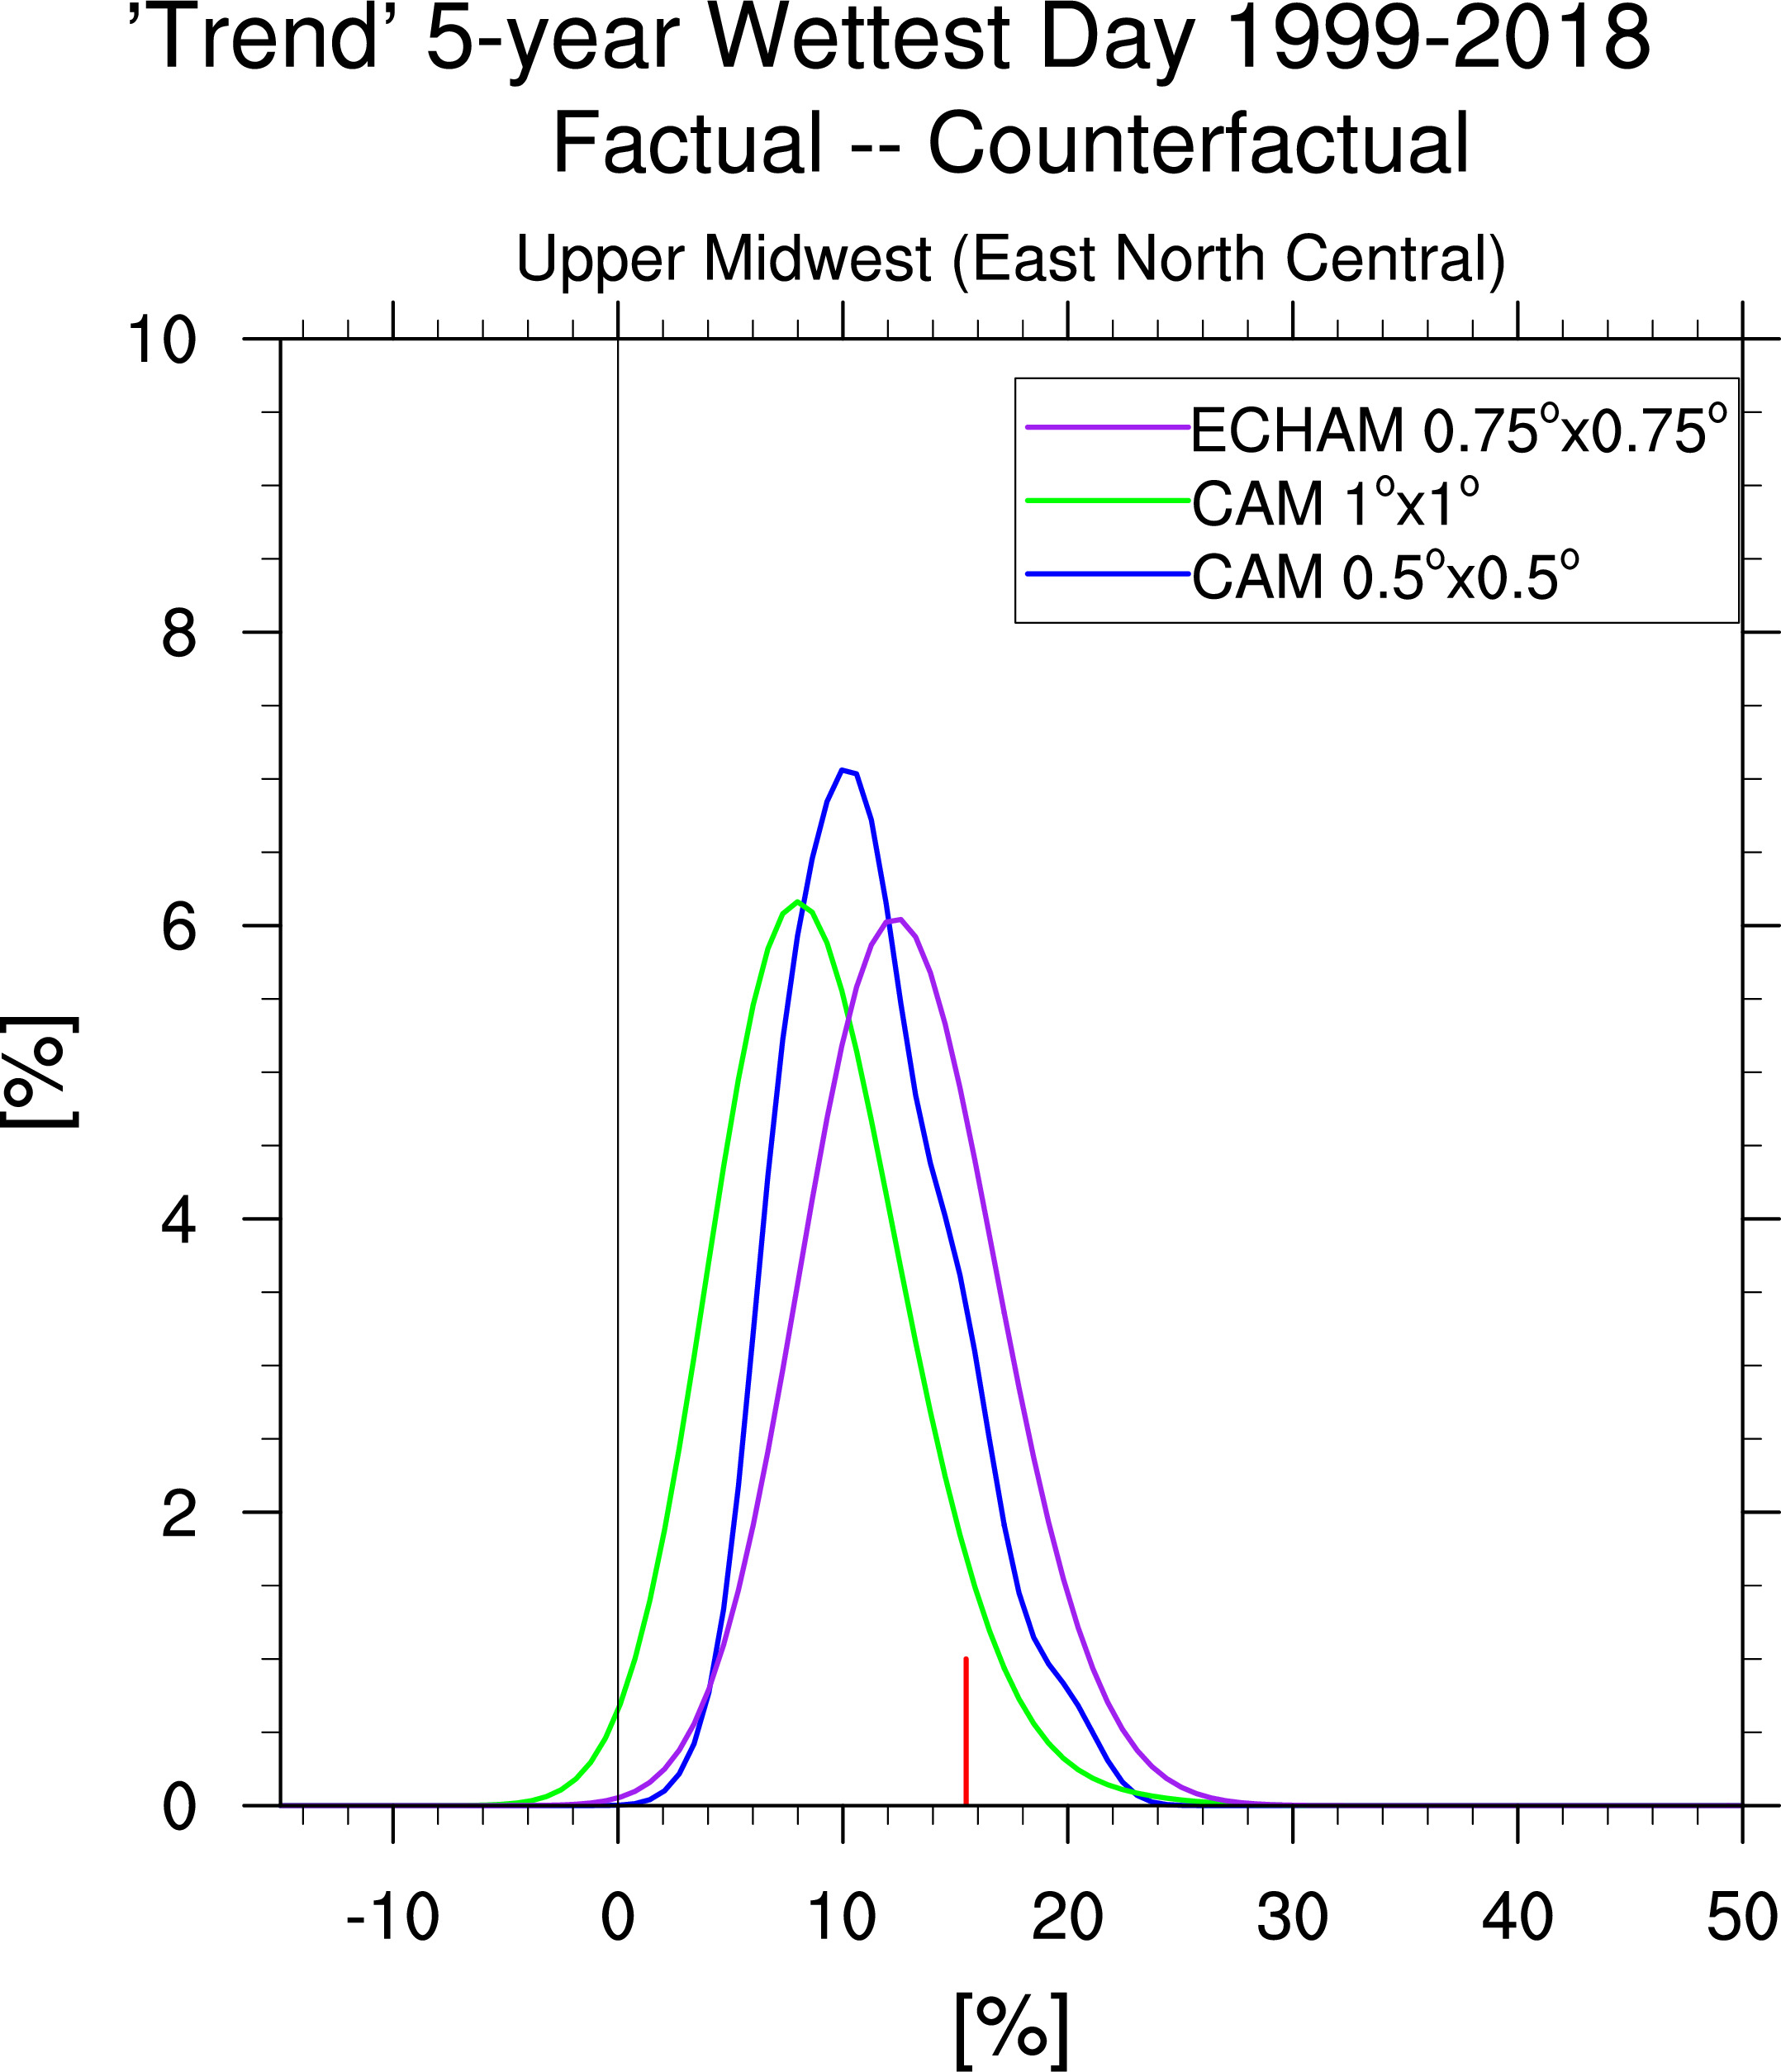
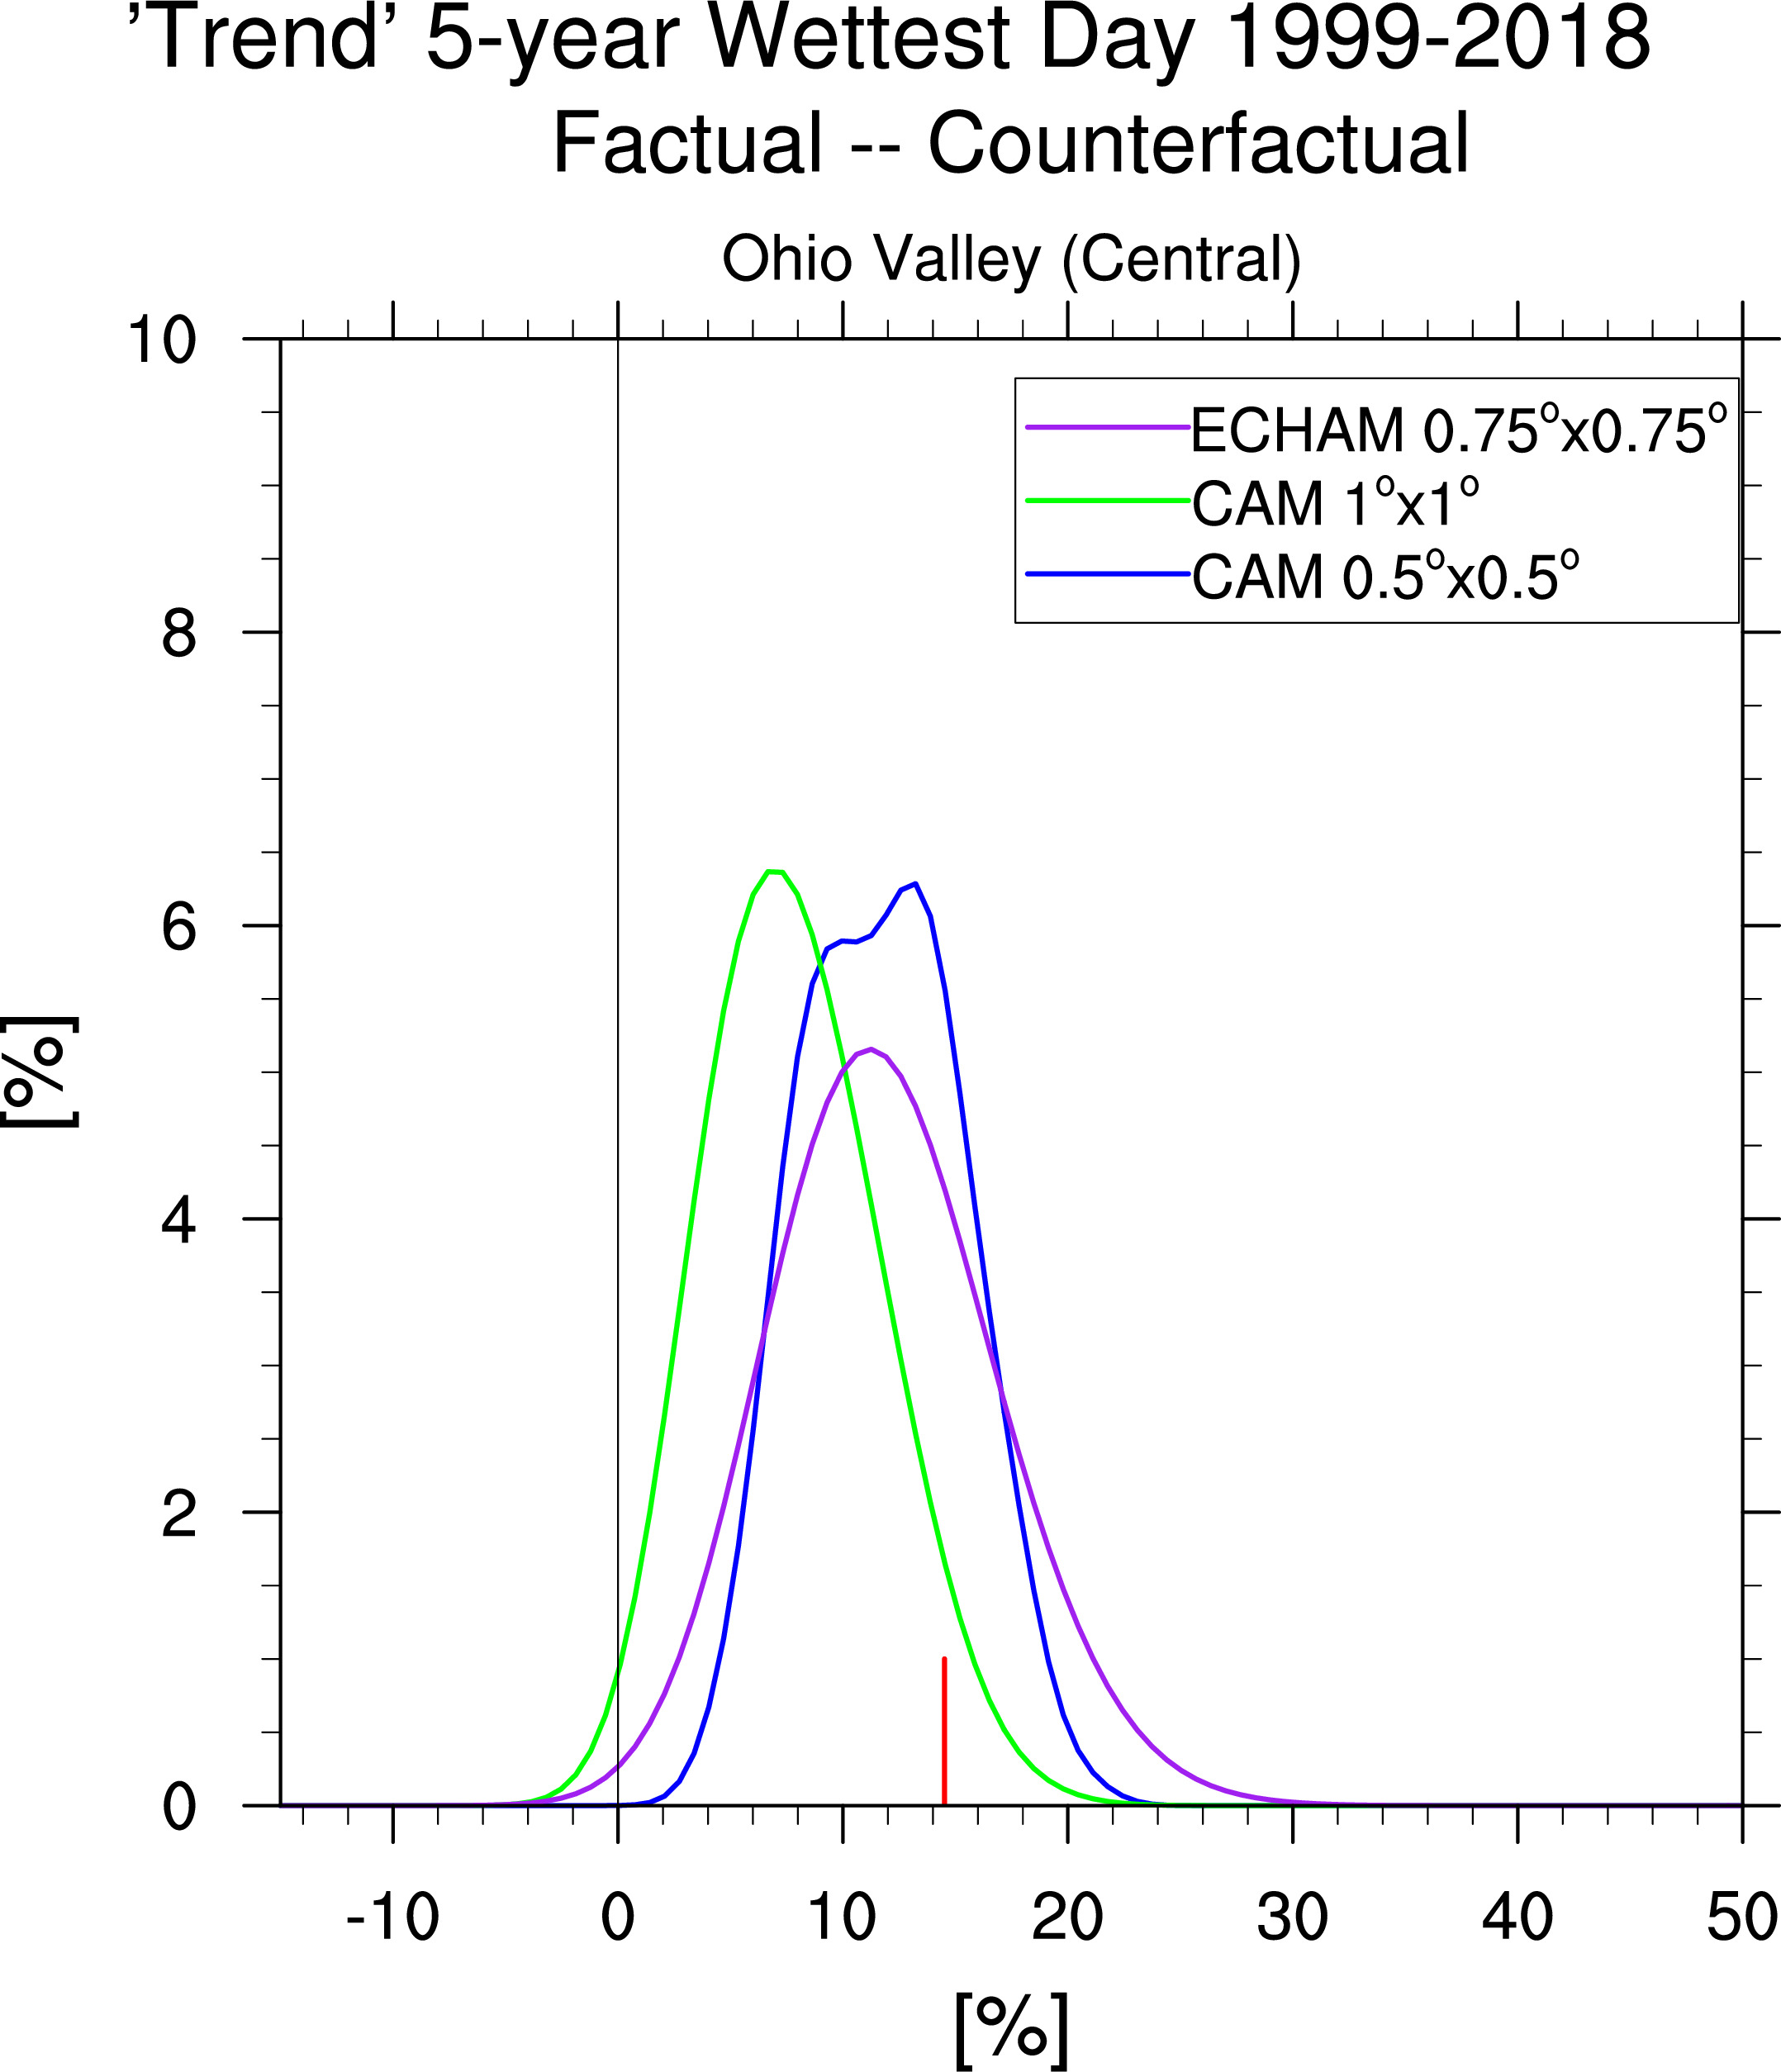
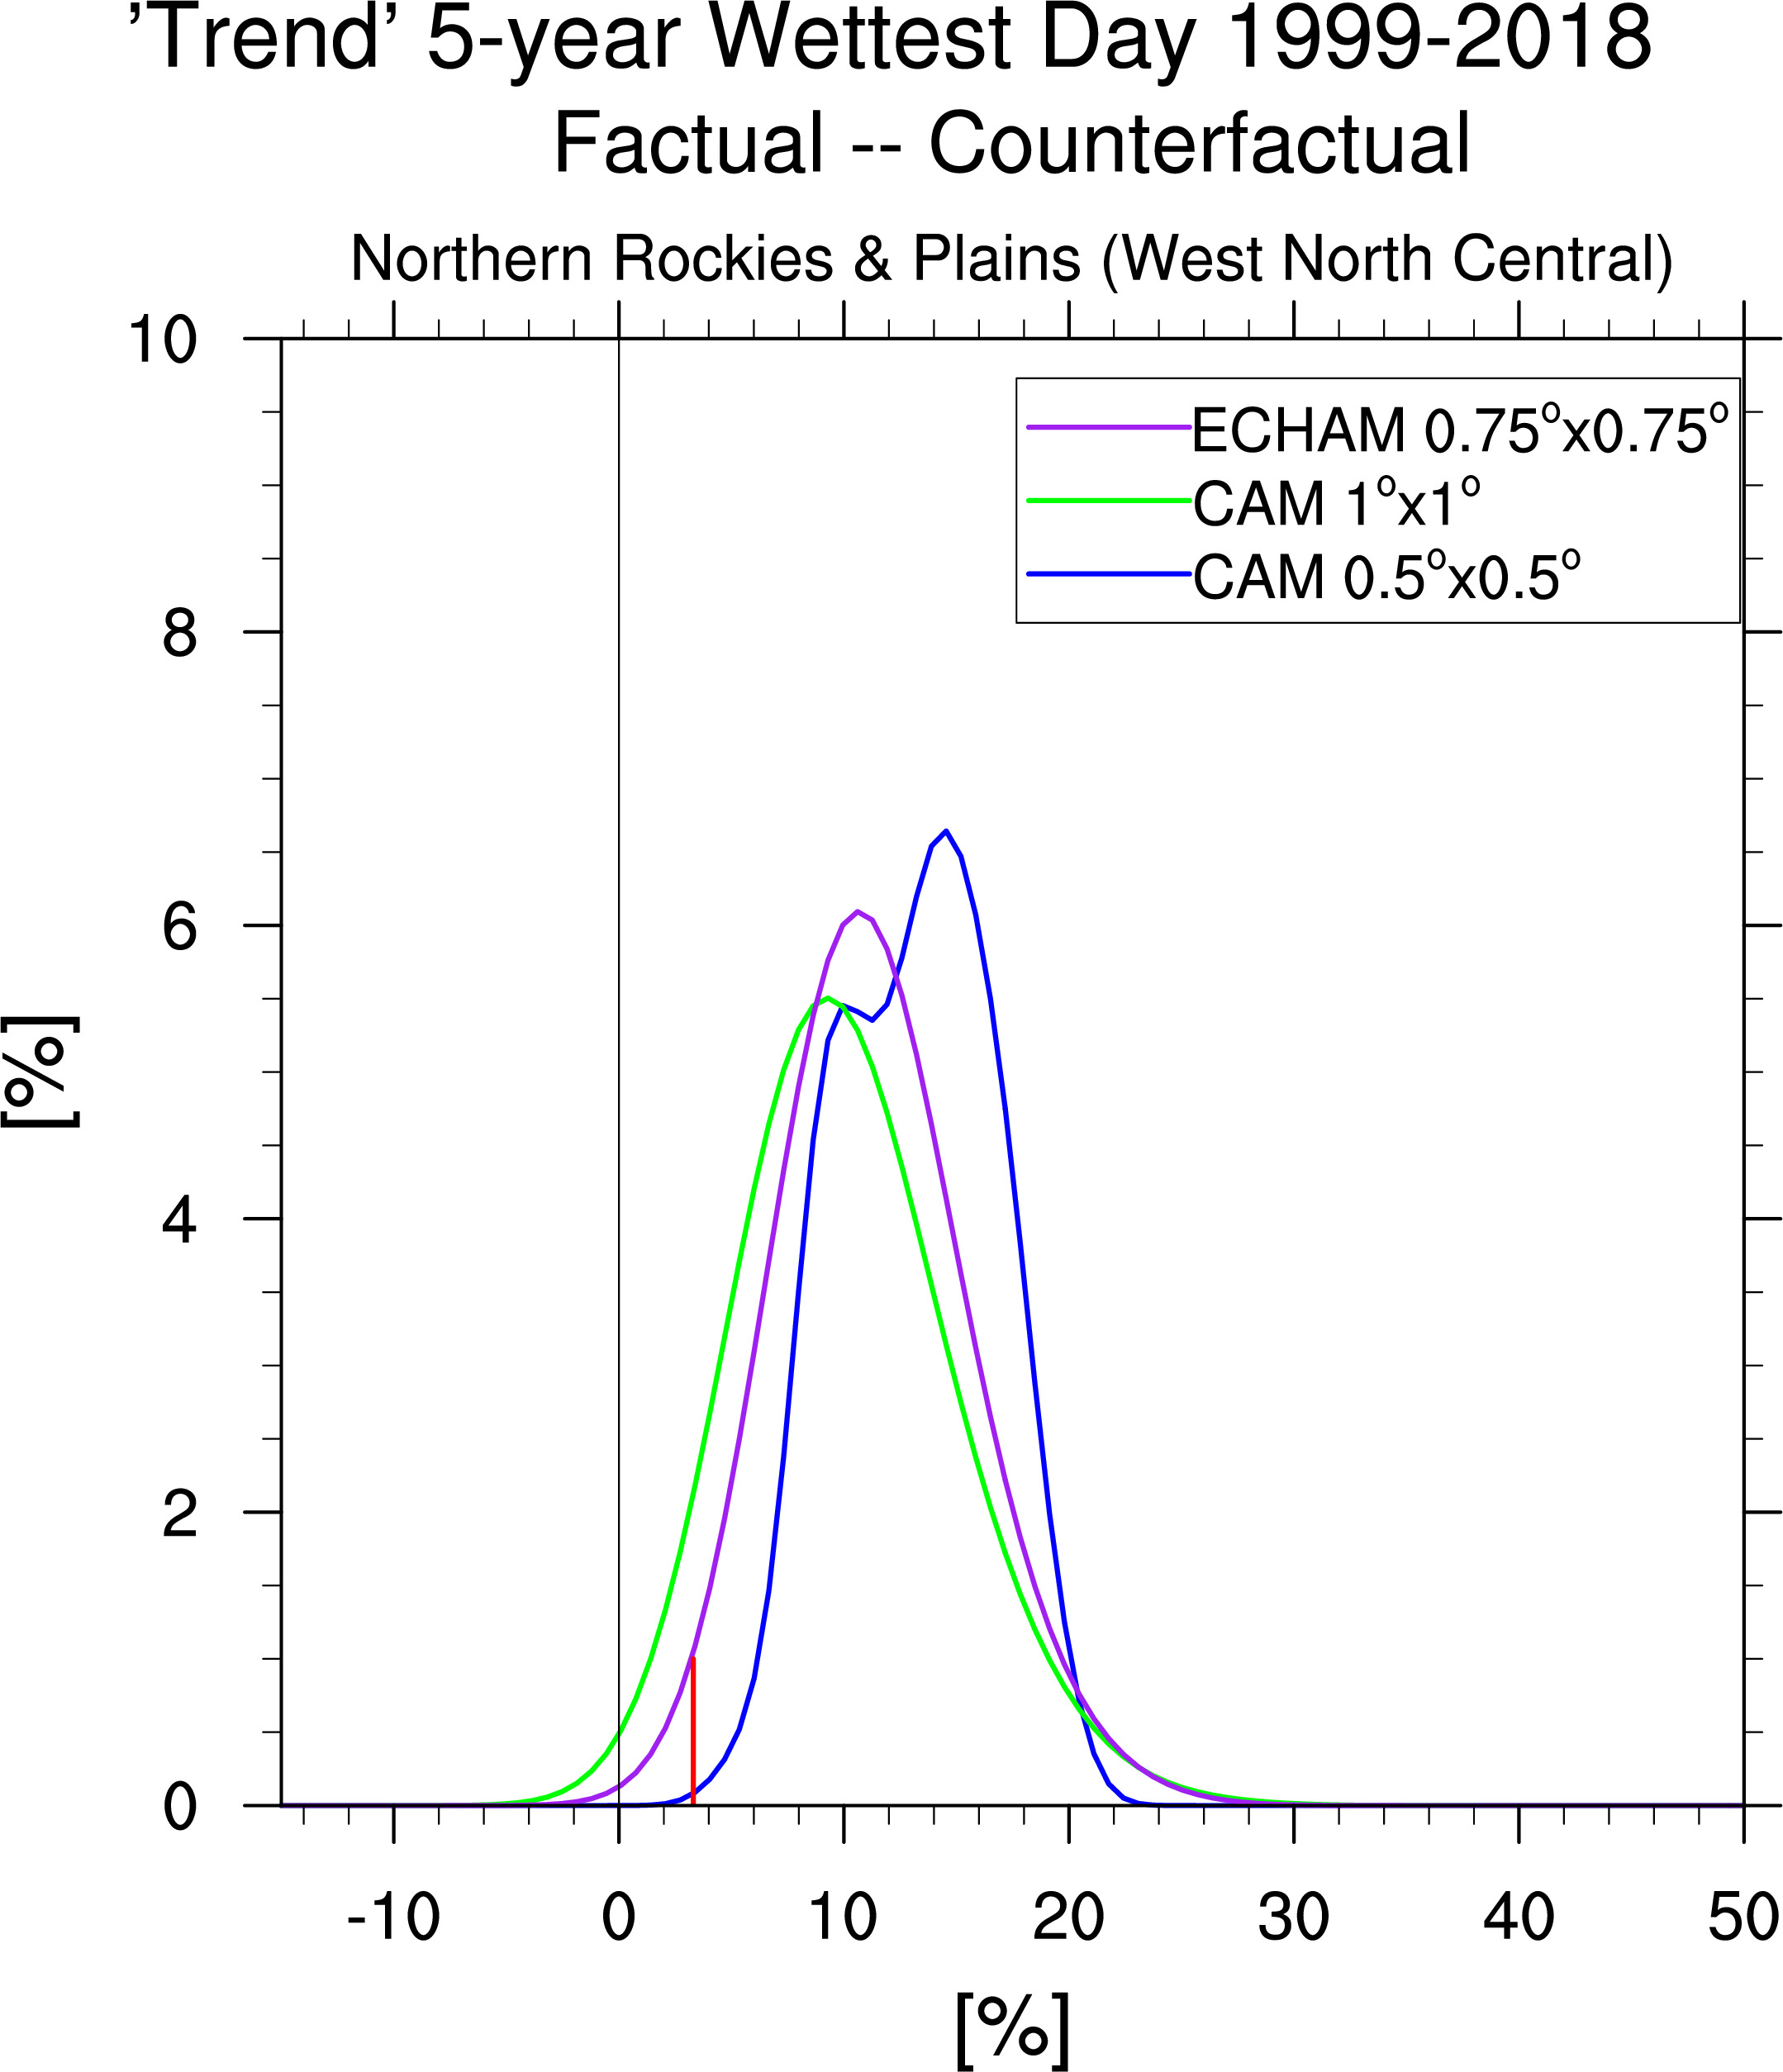
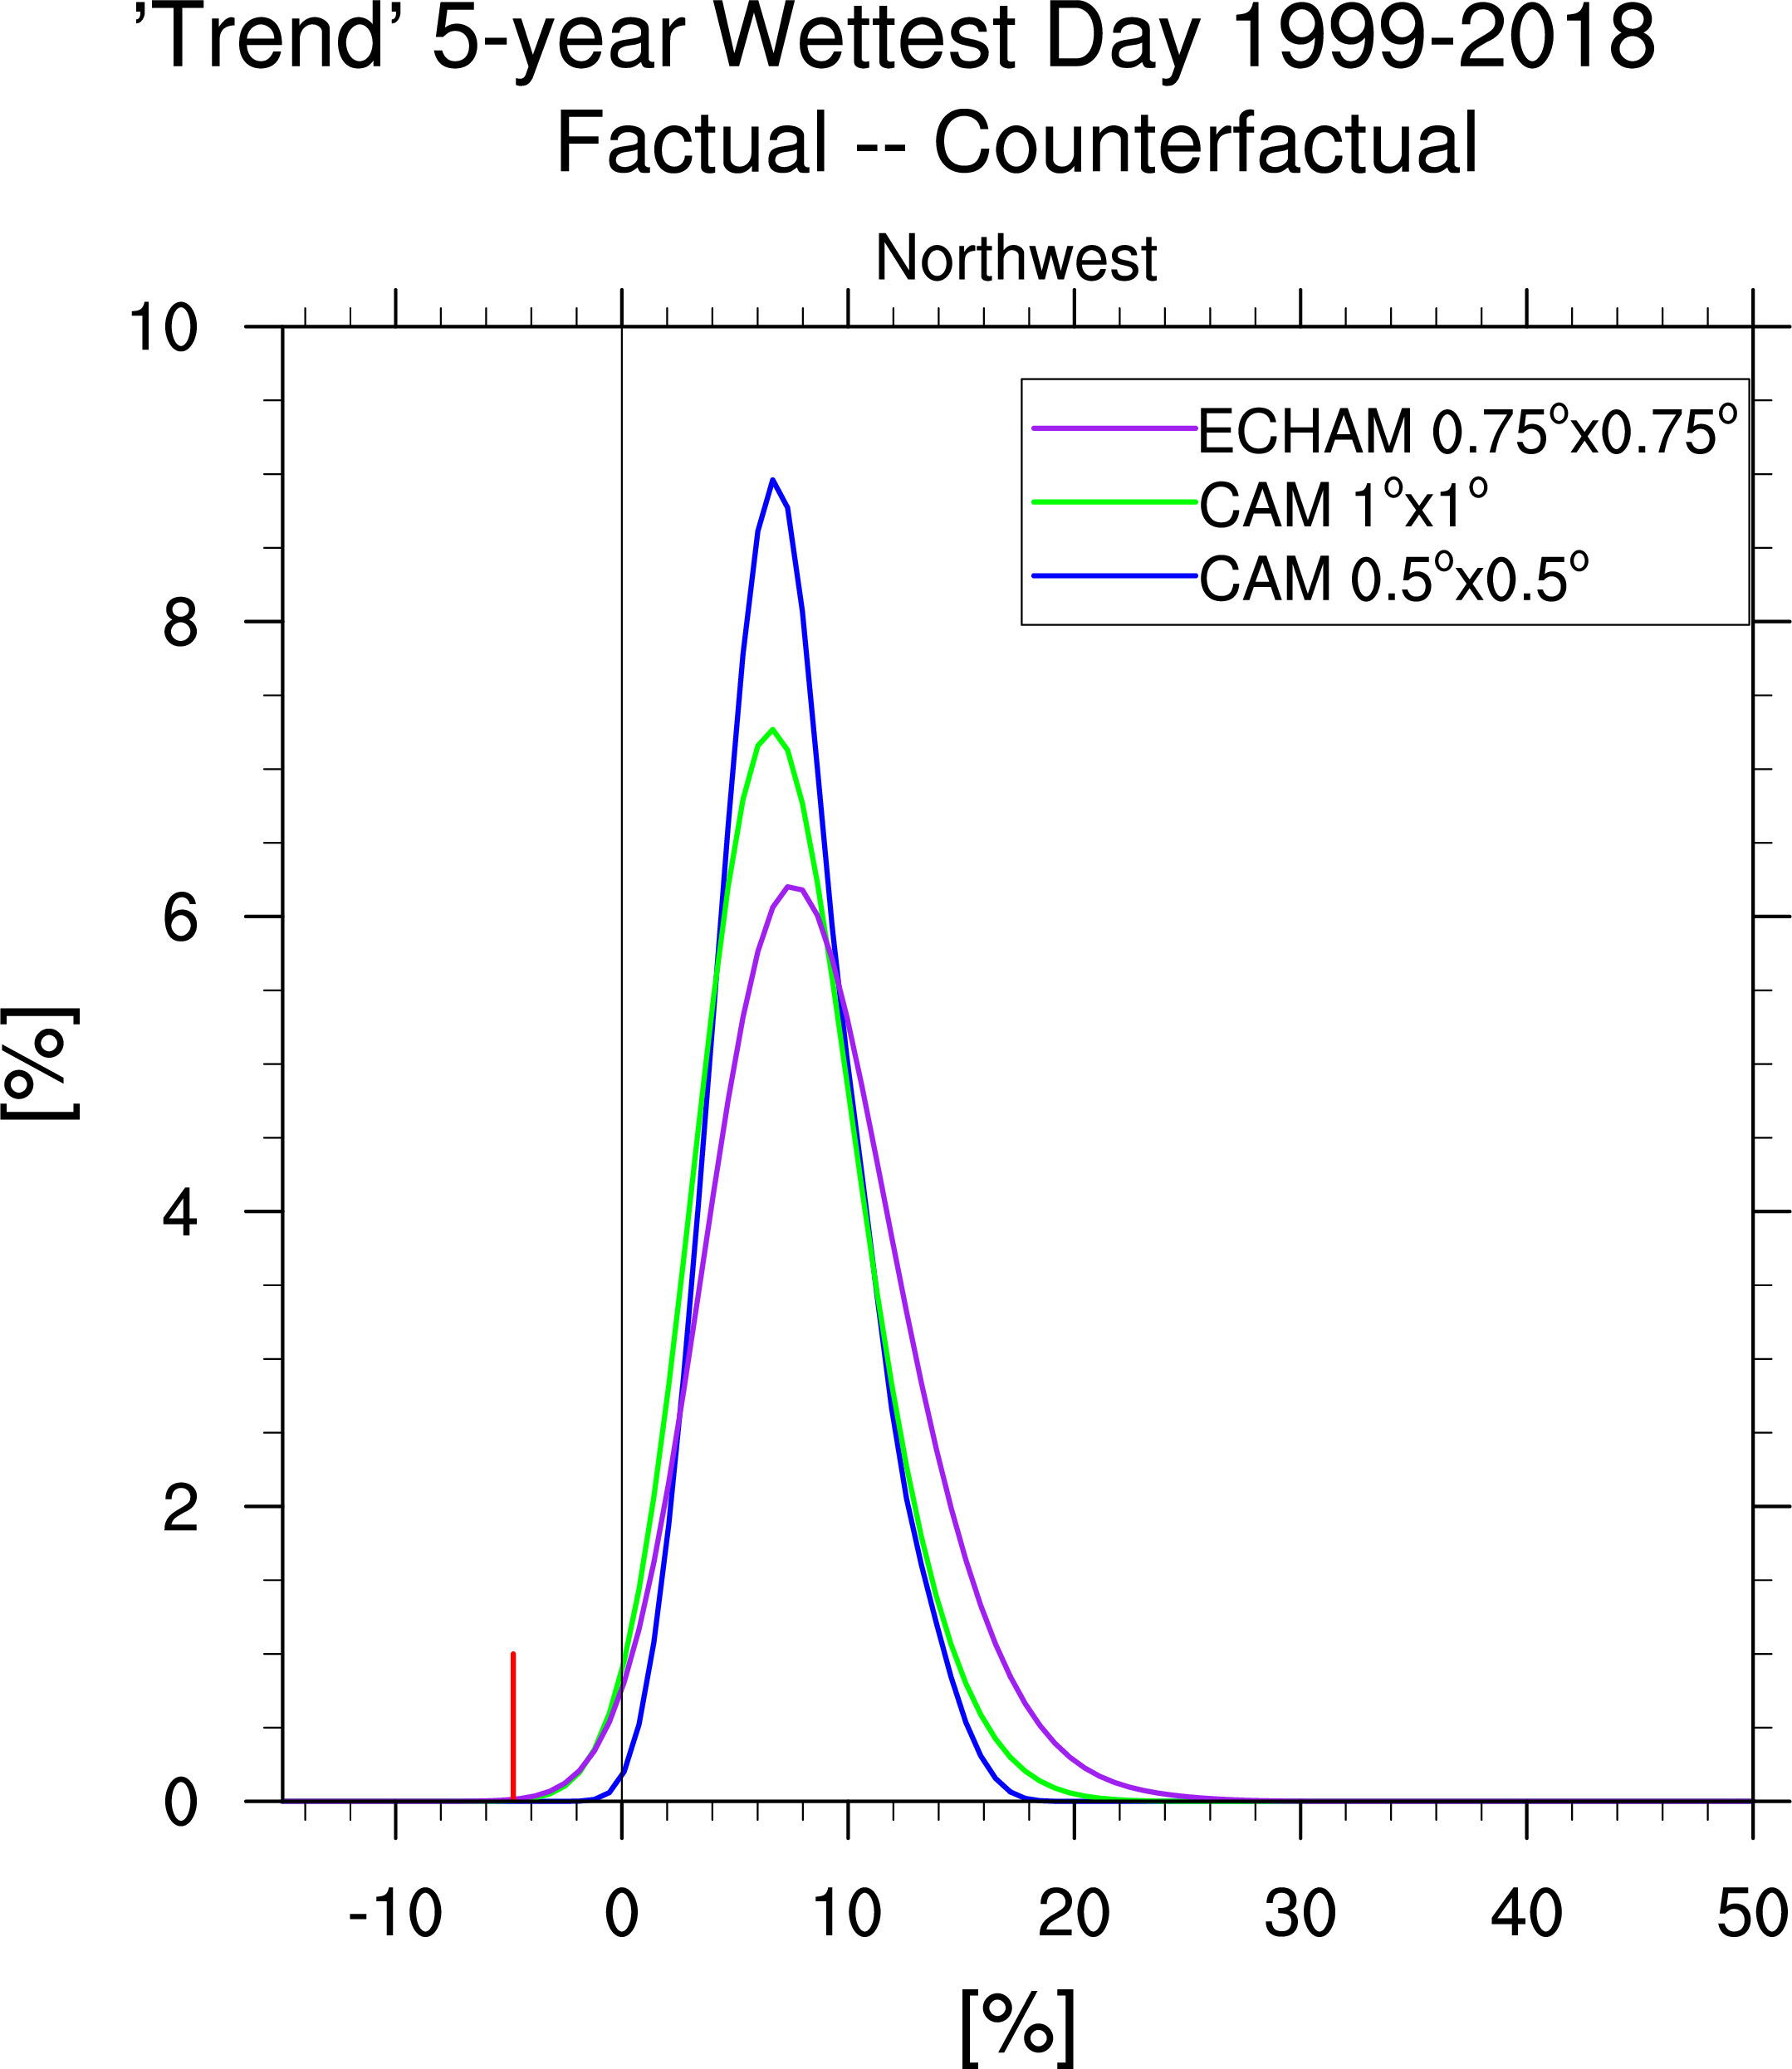
Climate Superdivision Map (right) shows precipitation corresponding to maximum frequency in pdfs above
below left ECHAM sample map, below right average
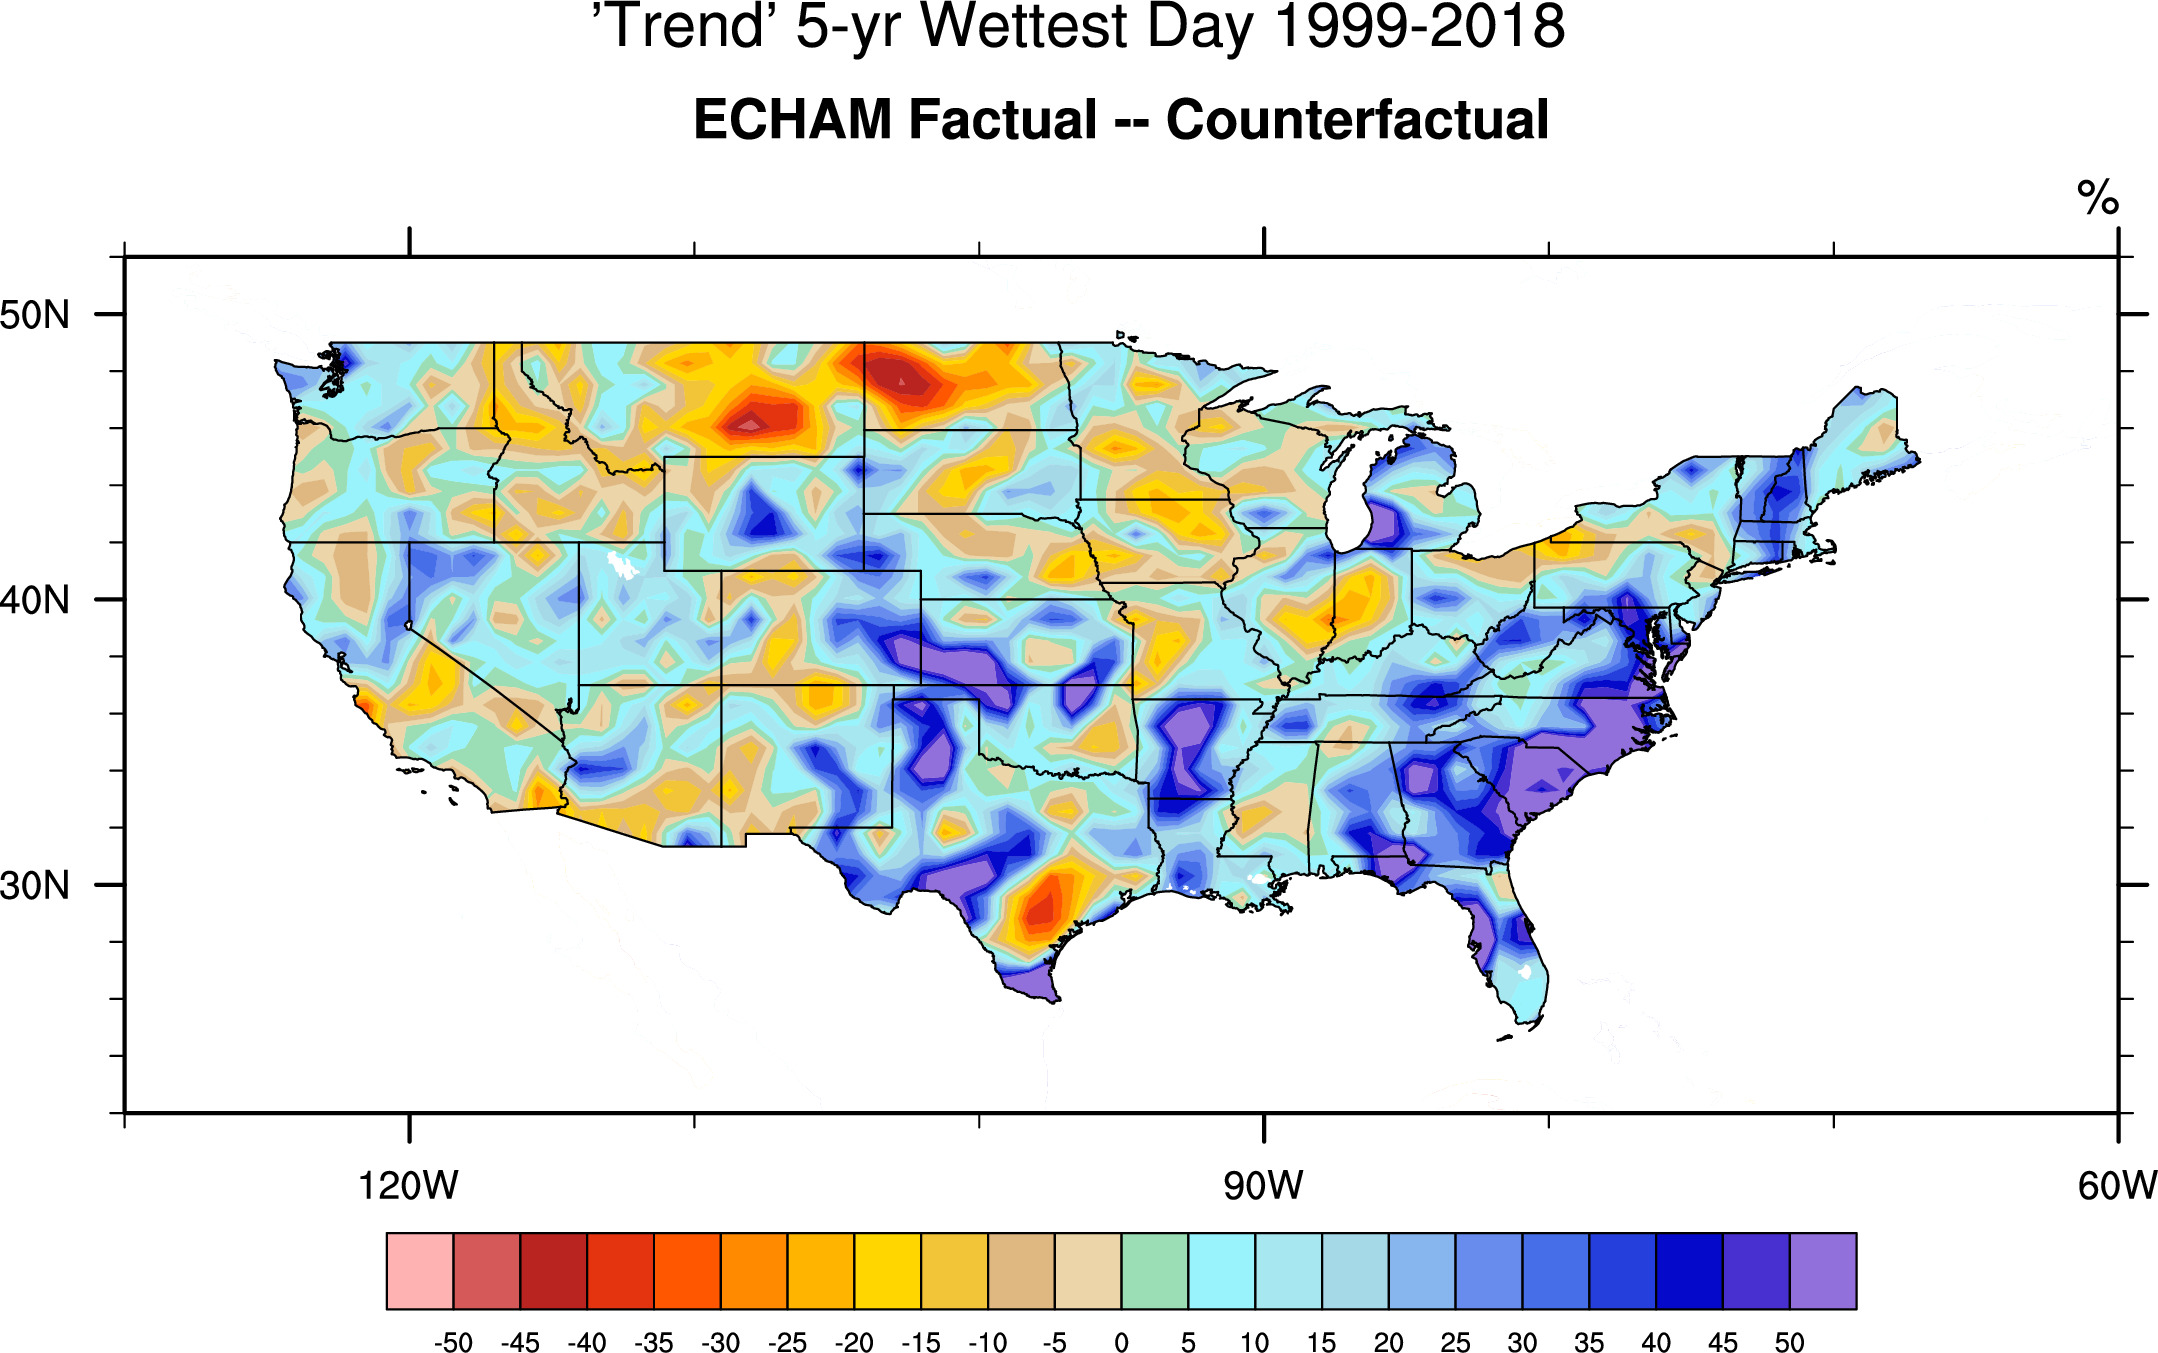

movie of all maps here
below left CAM5 0.5o sample map
w right average


movie of all maps here
below left CAM5 1.0o sample map, below right average


movie of all maps here
------
CPC Data
Climate Superdivision Map (right) shows precipitation corresponding to superdivision area average of precip on left

----------------------------------------------------------------------------------------------------------------------------------------------------------------------
1-IN-10-YEAR CASES
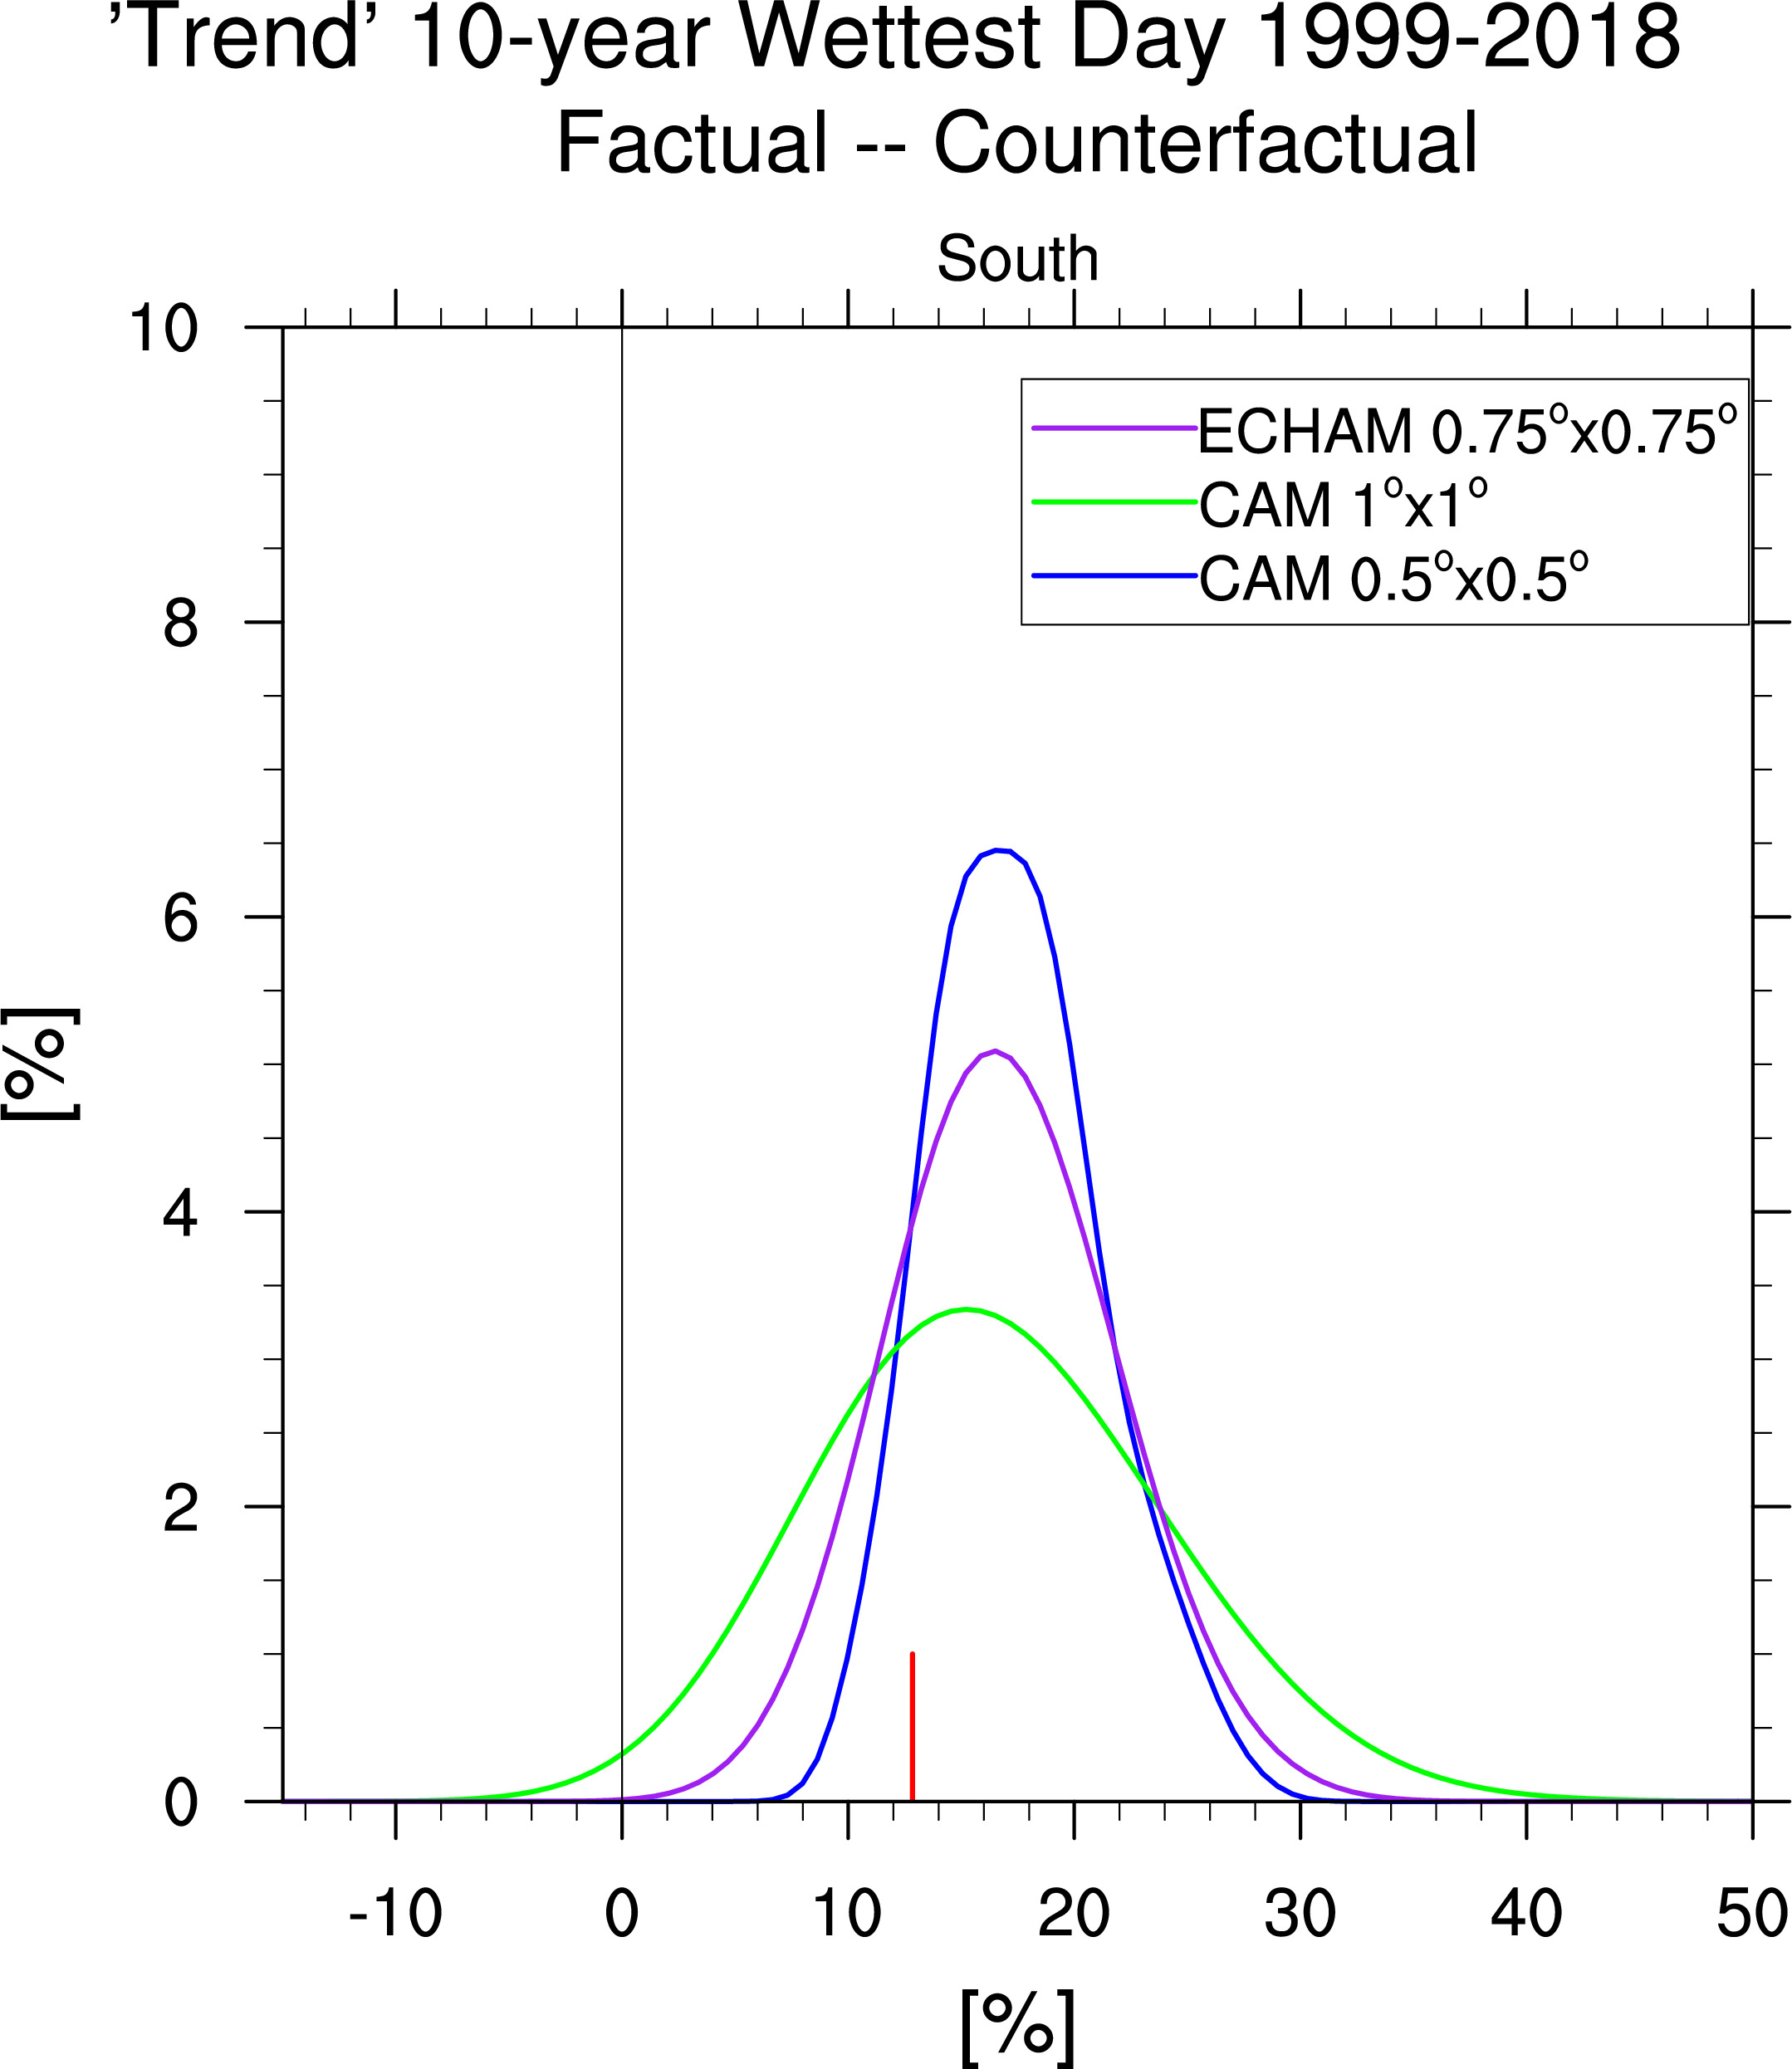
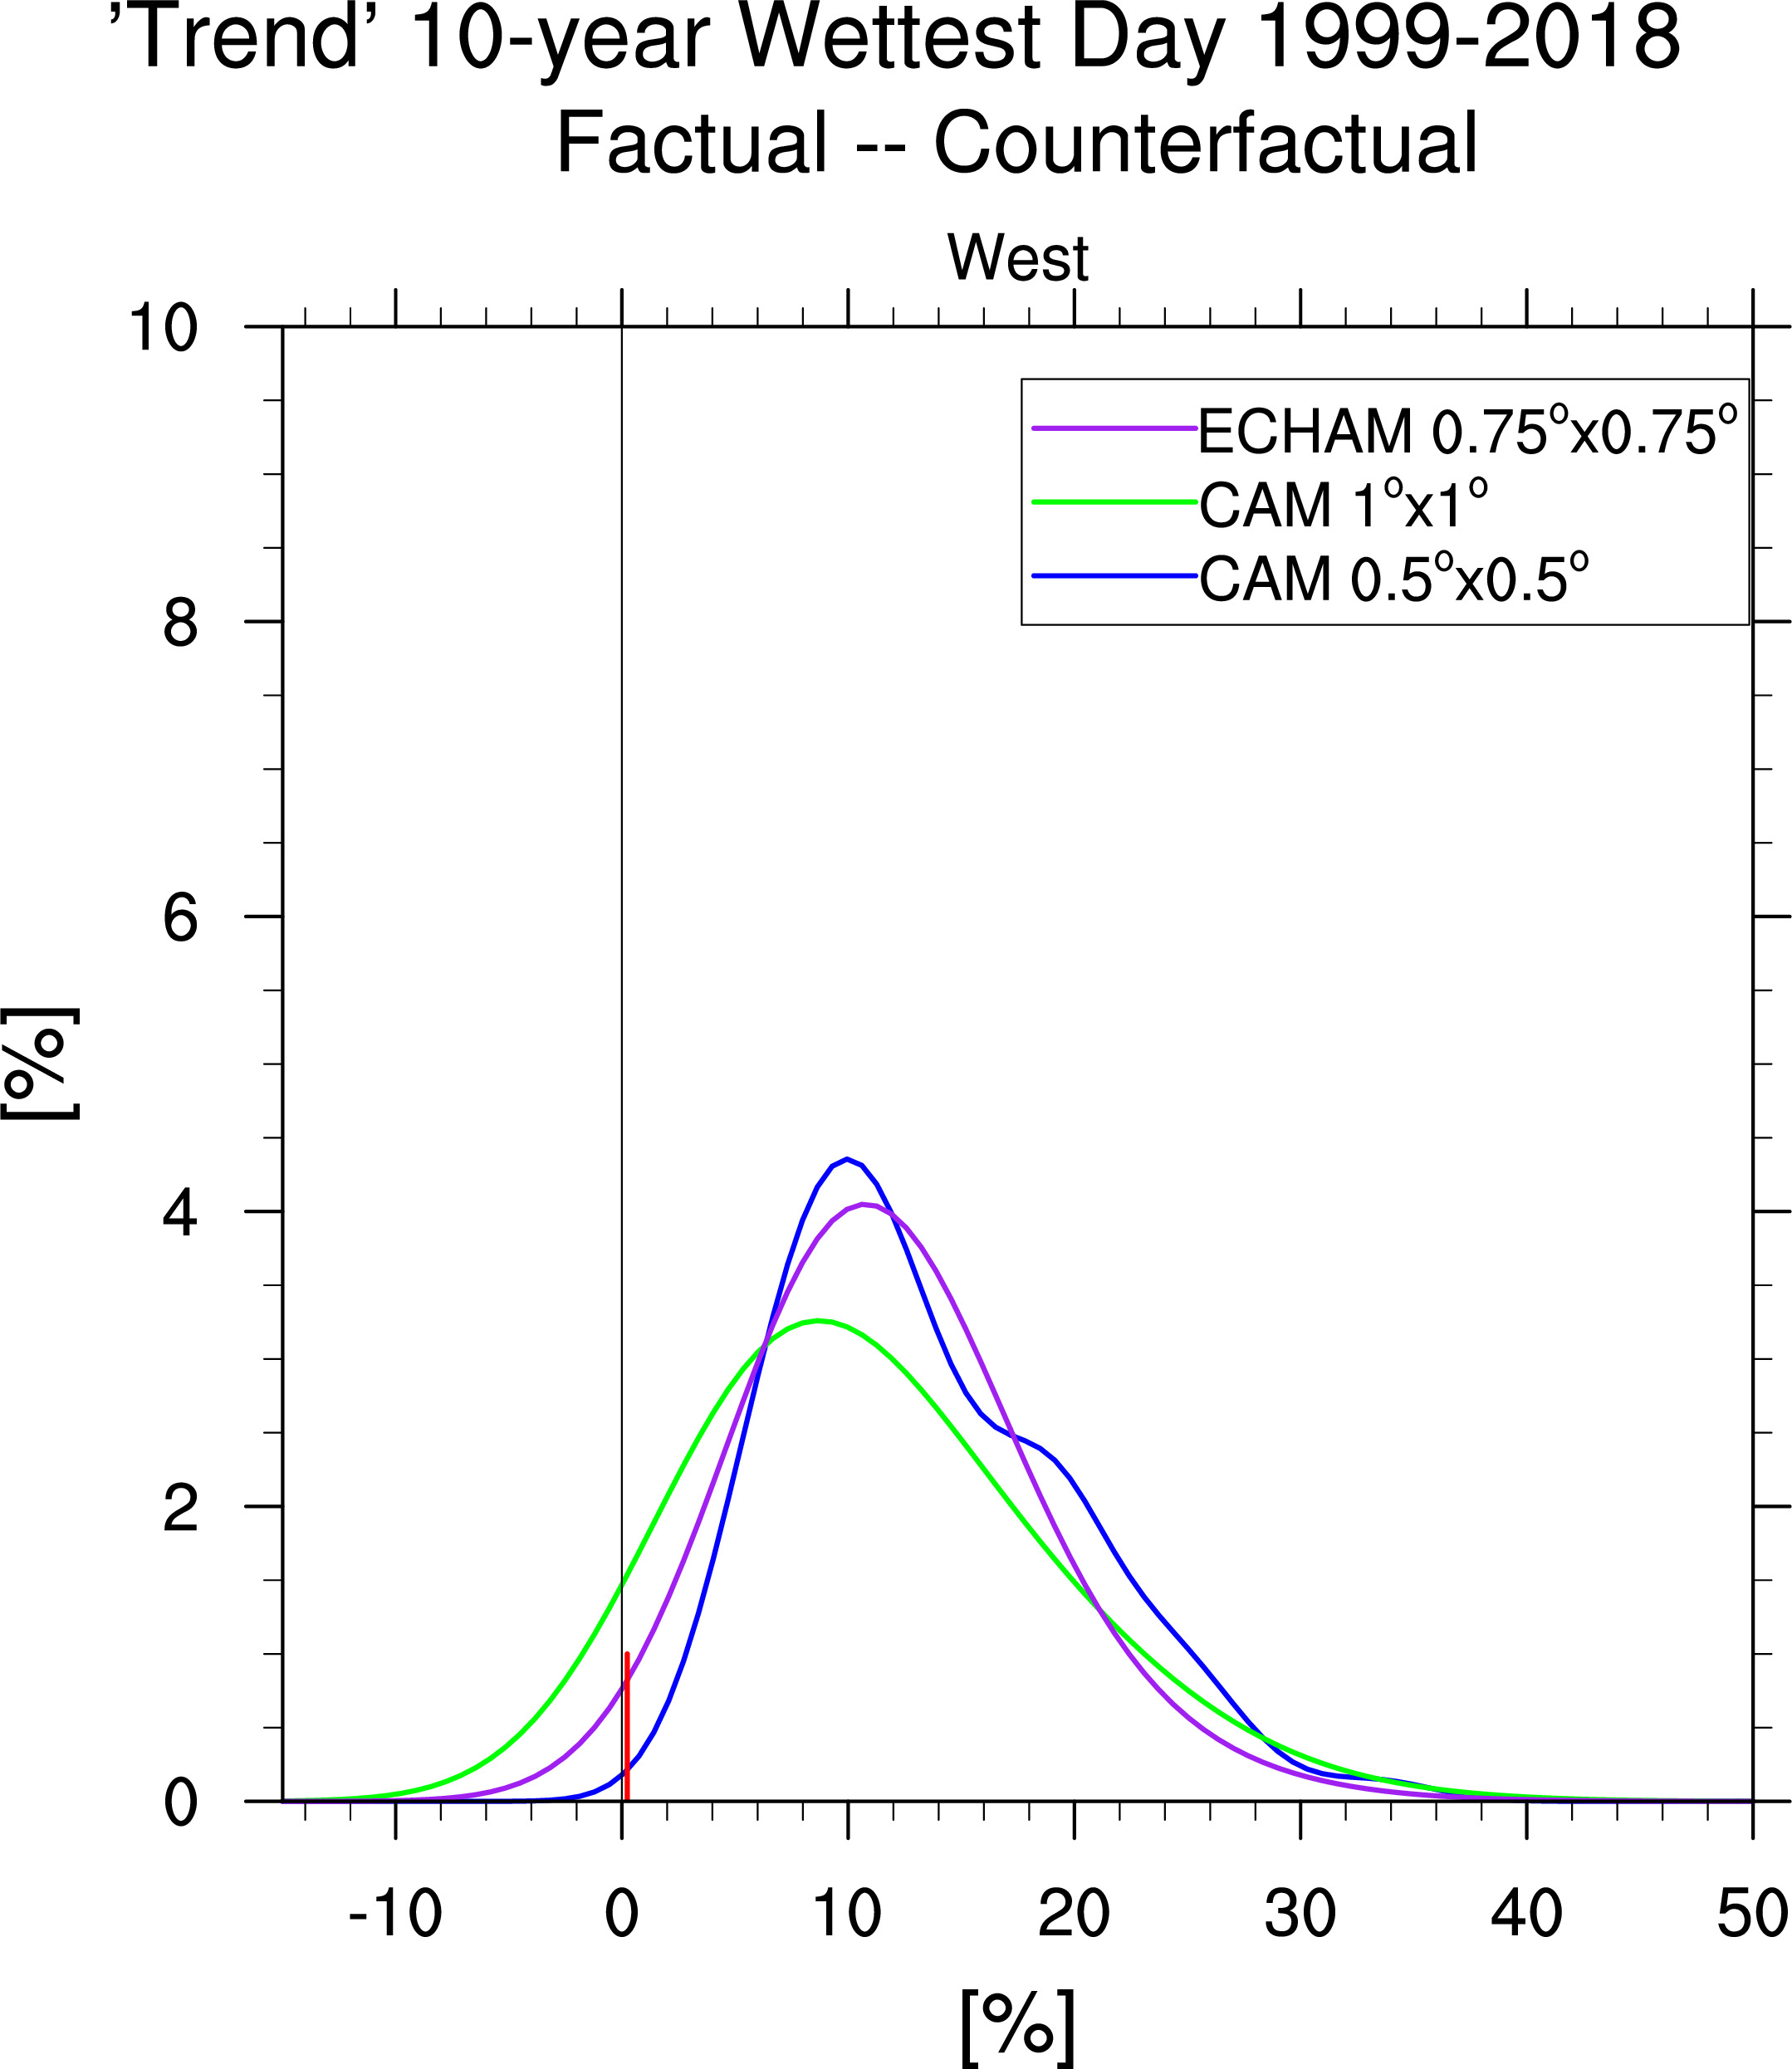
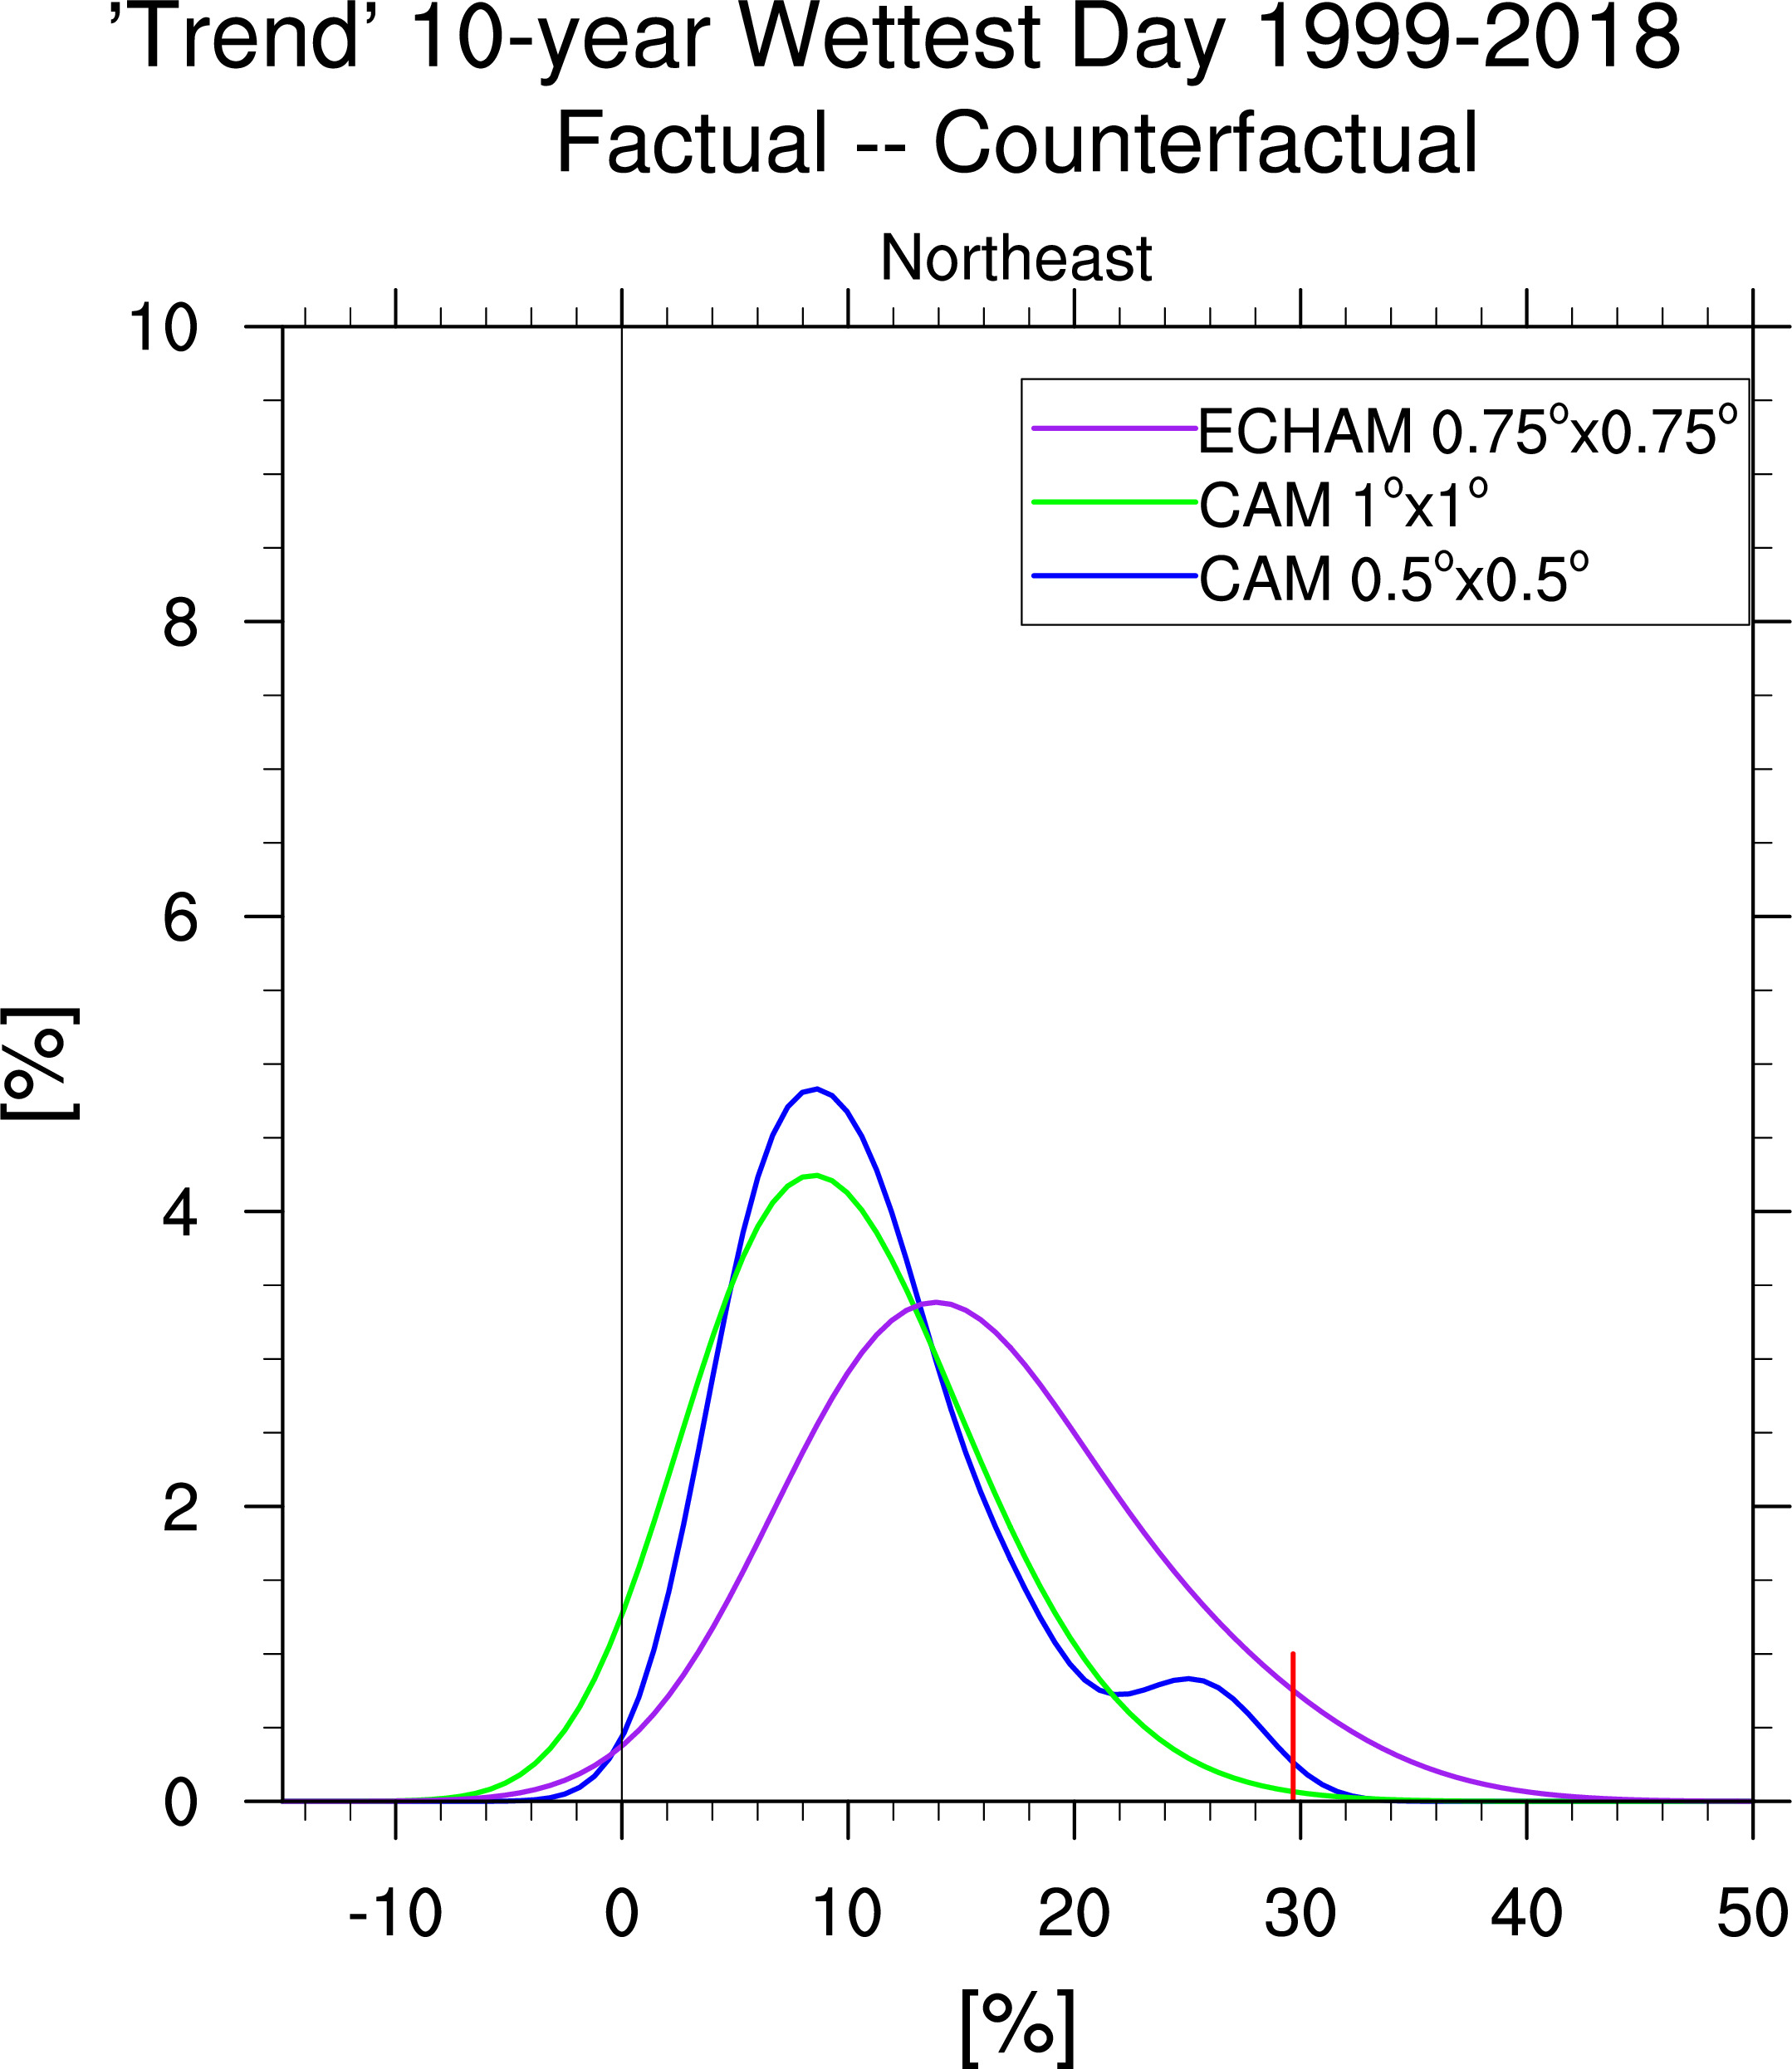
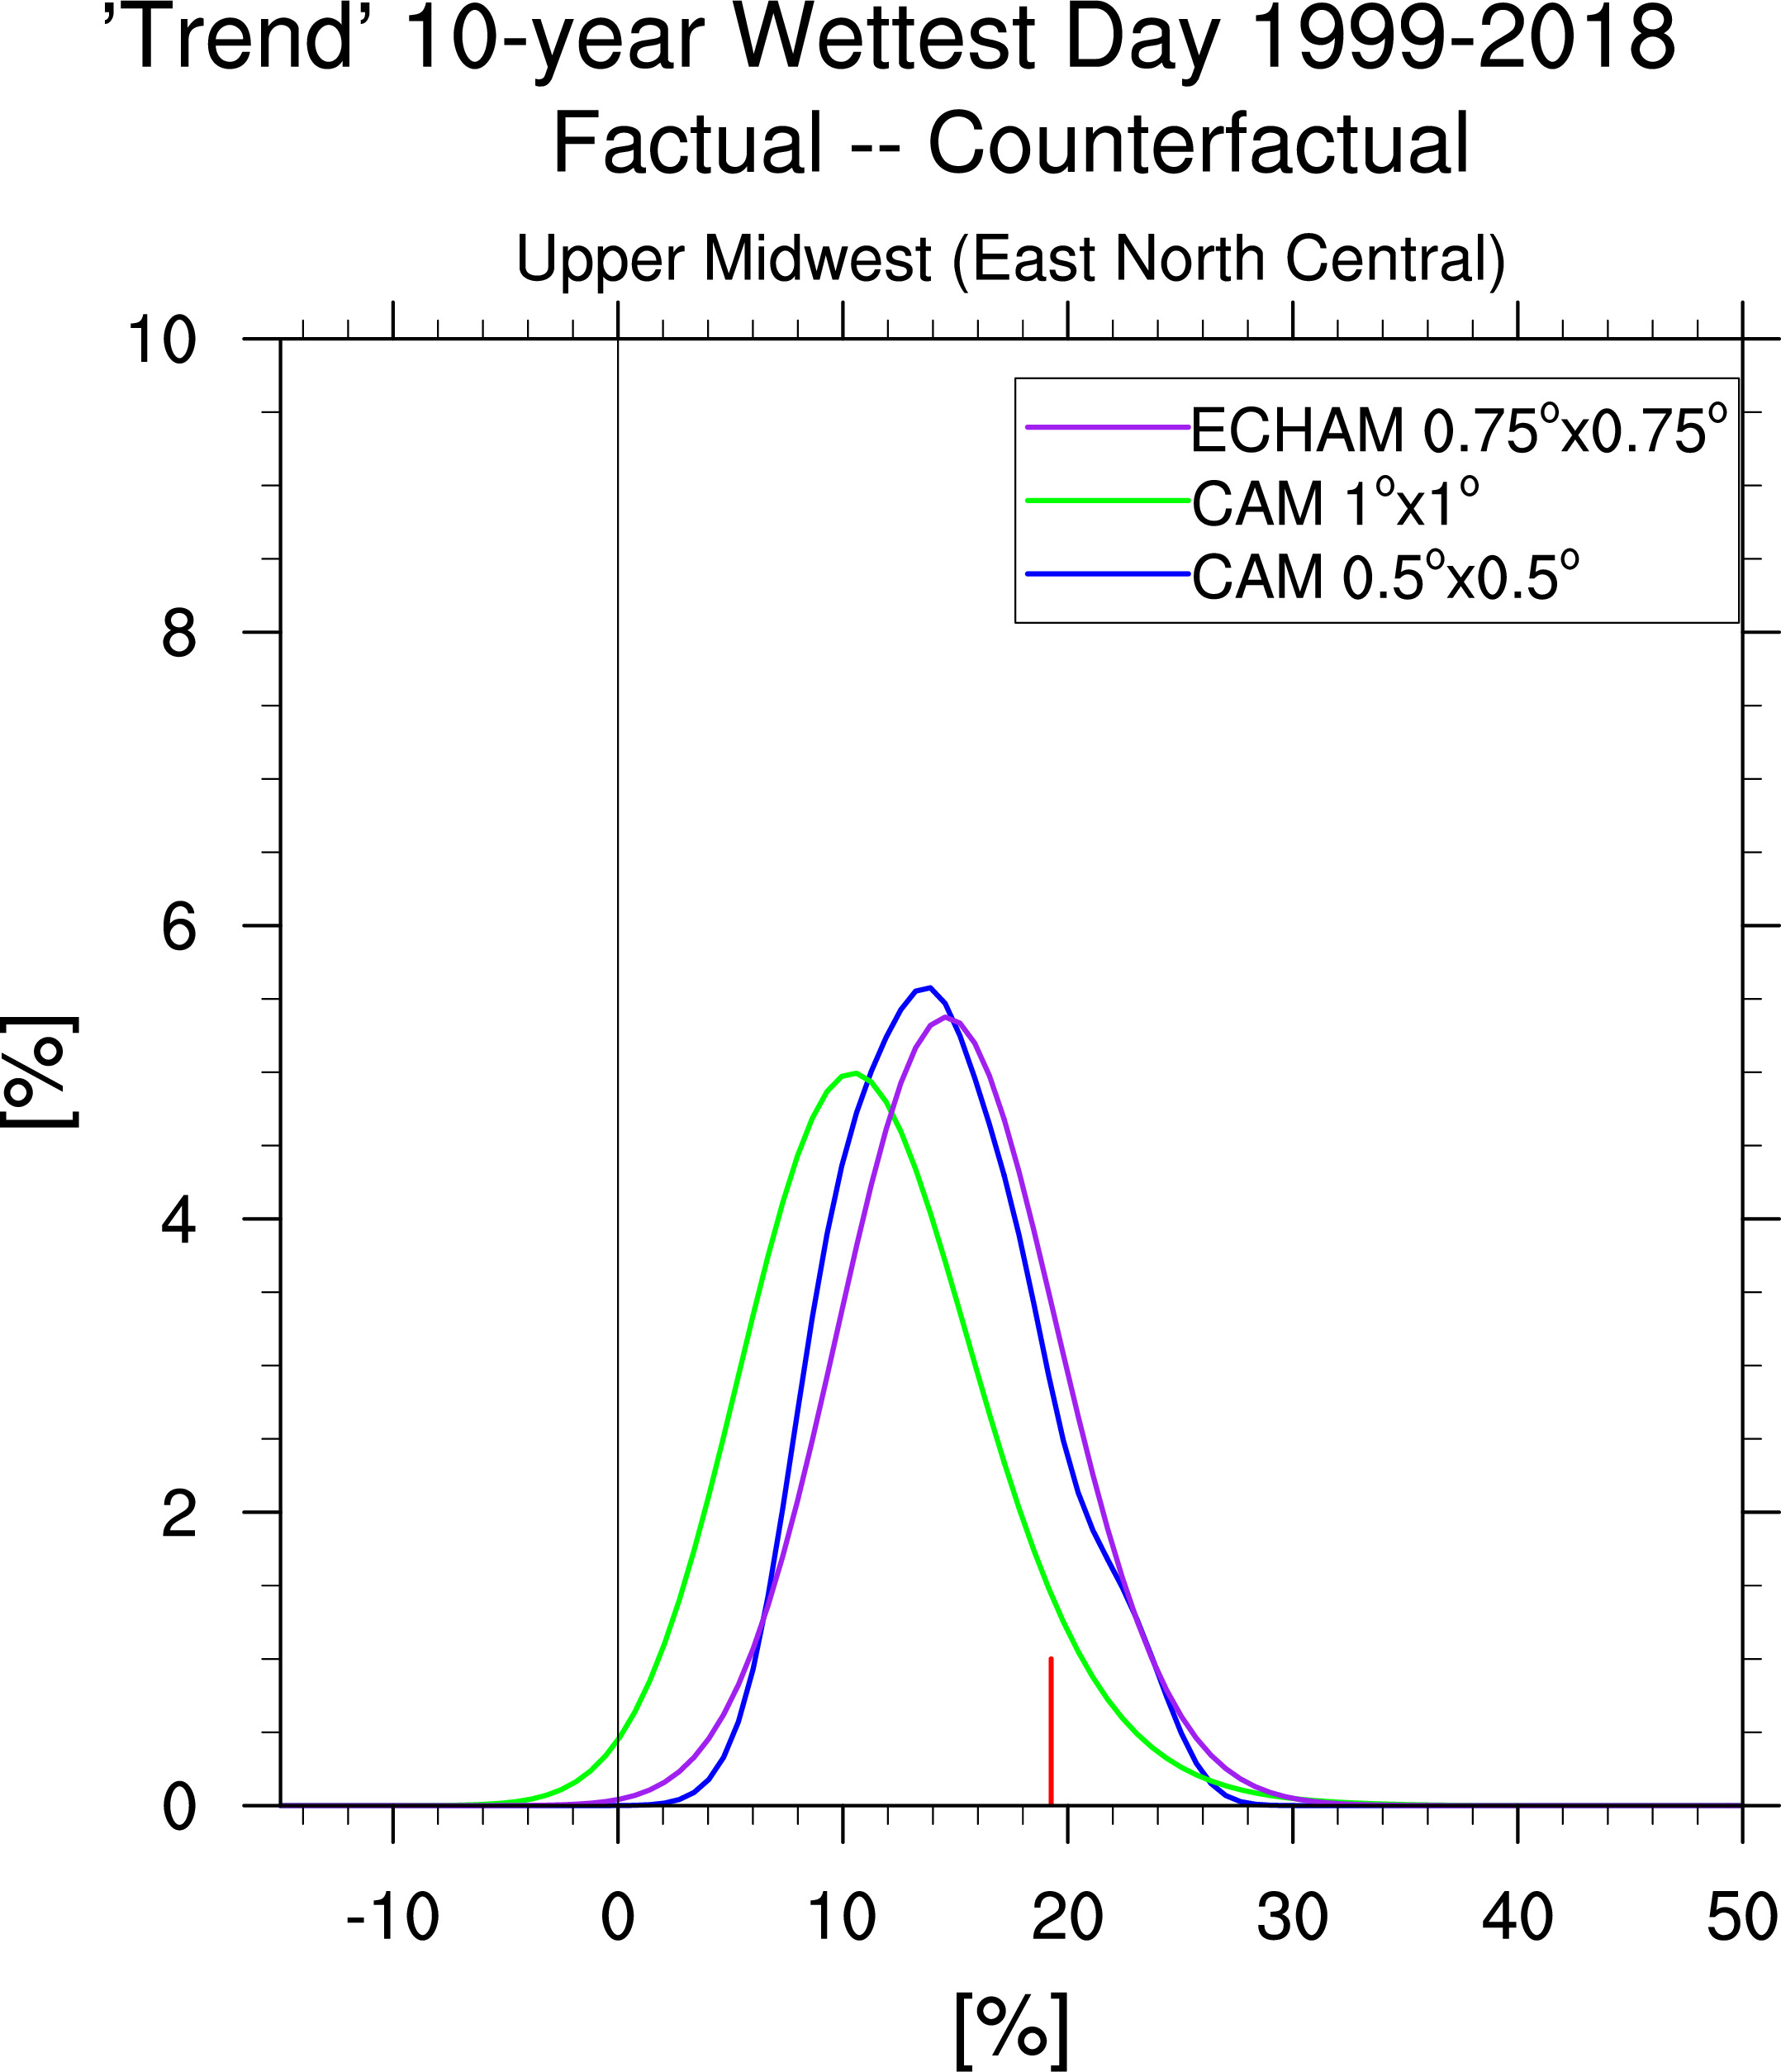
Trend Analysis Wettest Day of Year Factual versus Counterfactual 1999-2018 9 Climate Superdivisions
1999-2018 yields 2 1-in-10-year cases
Two Models
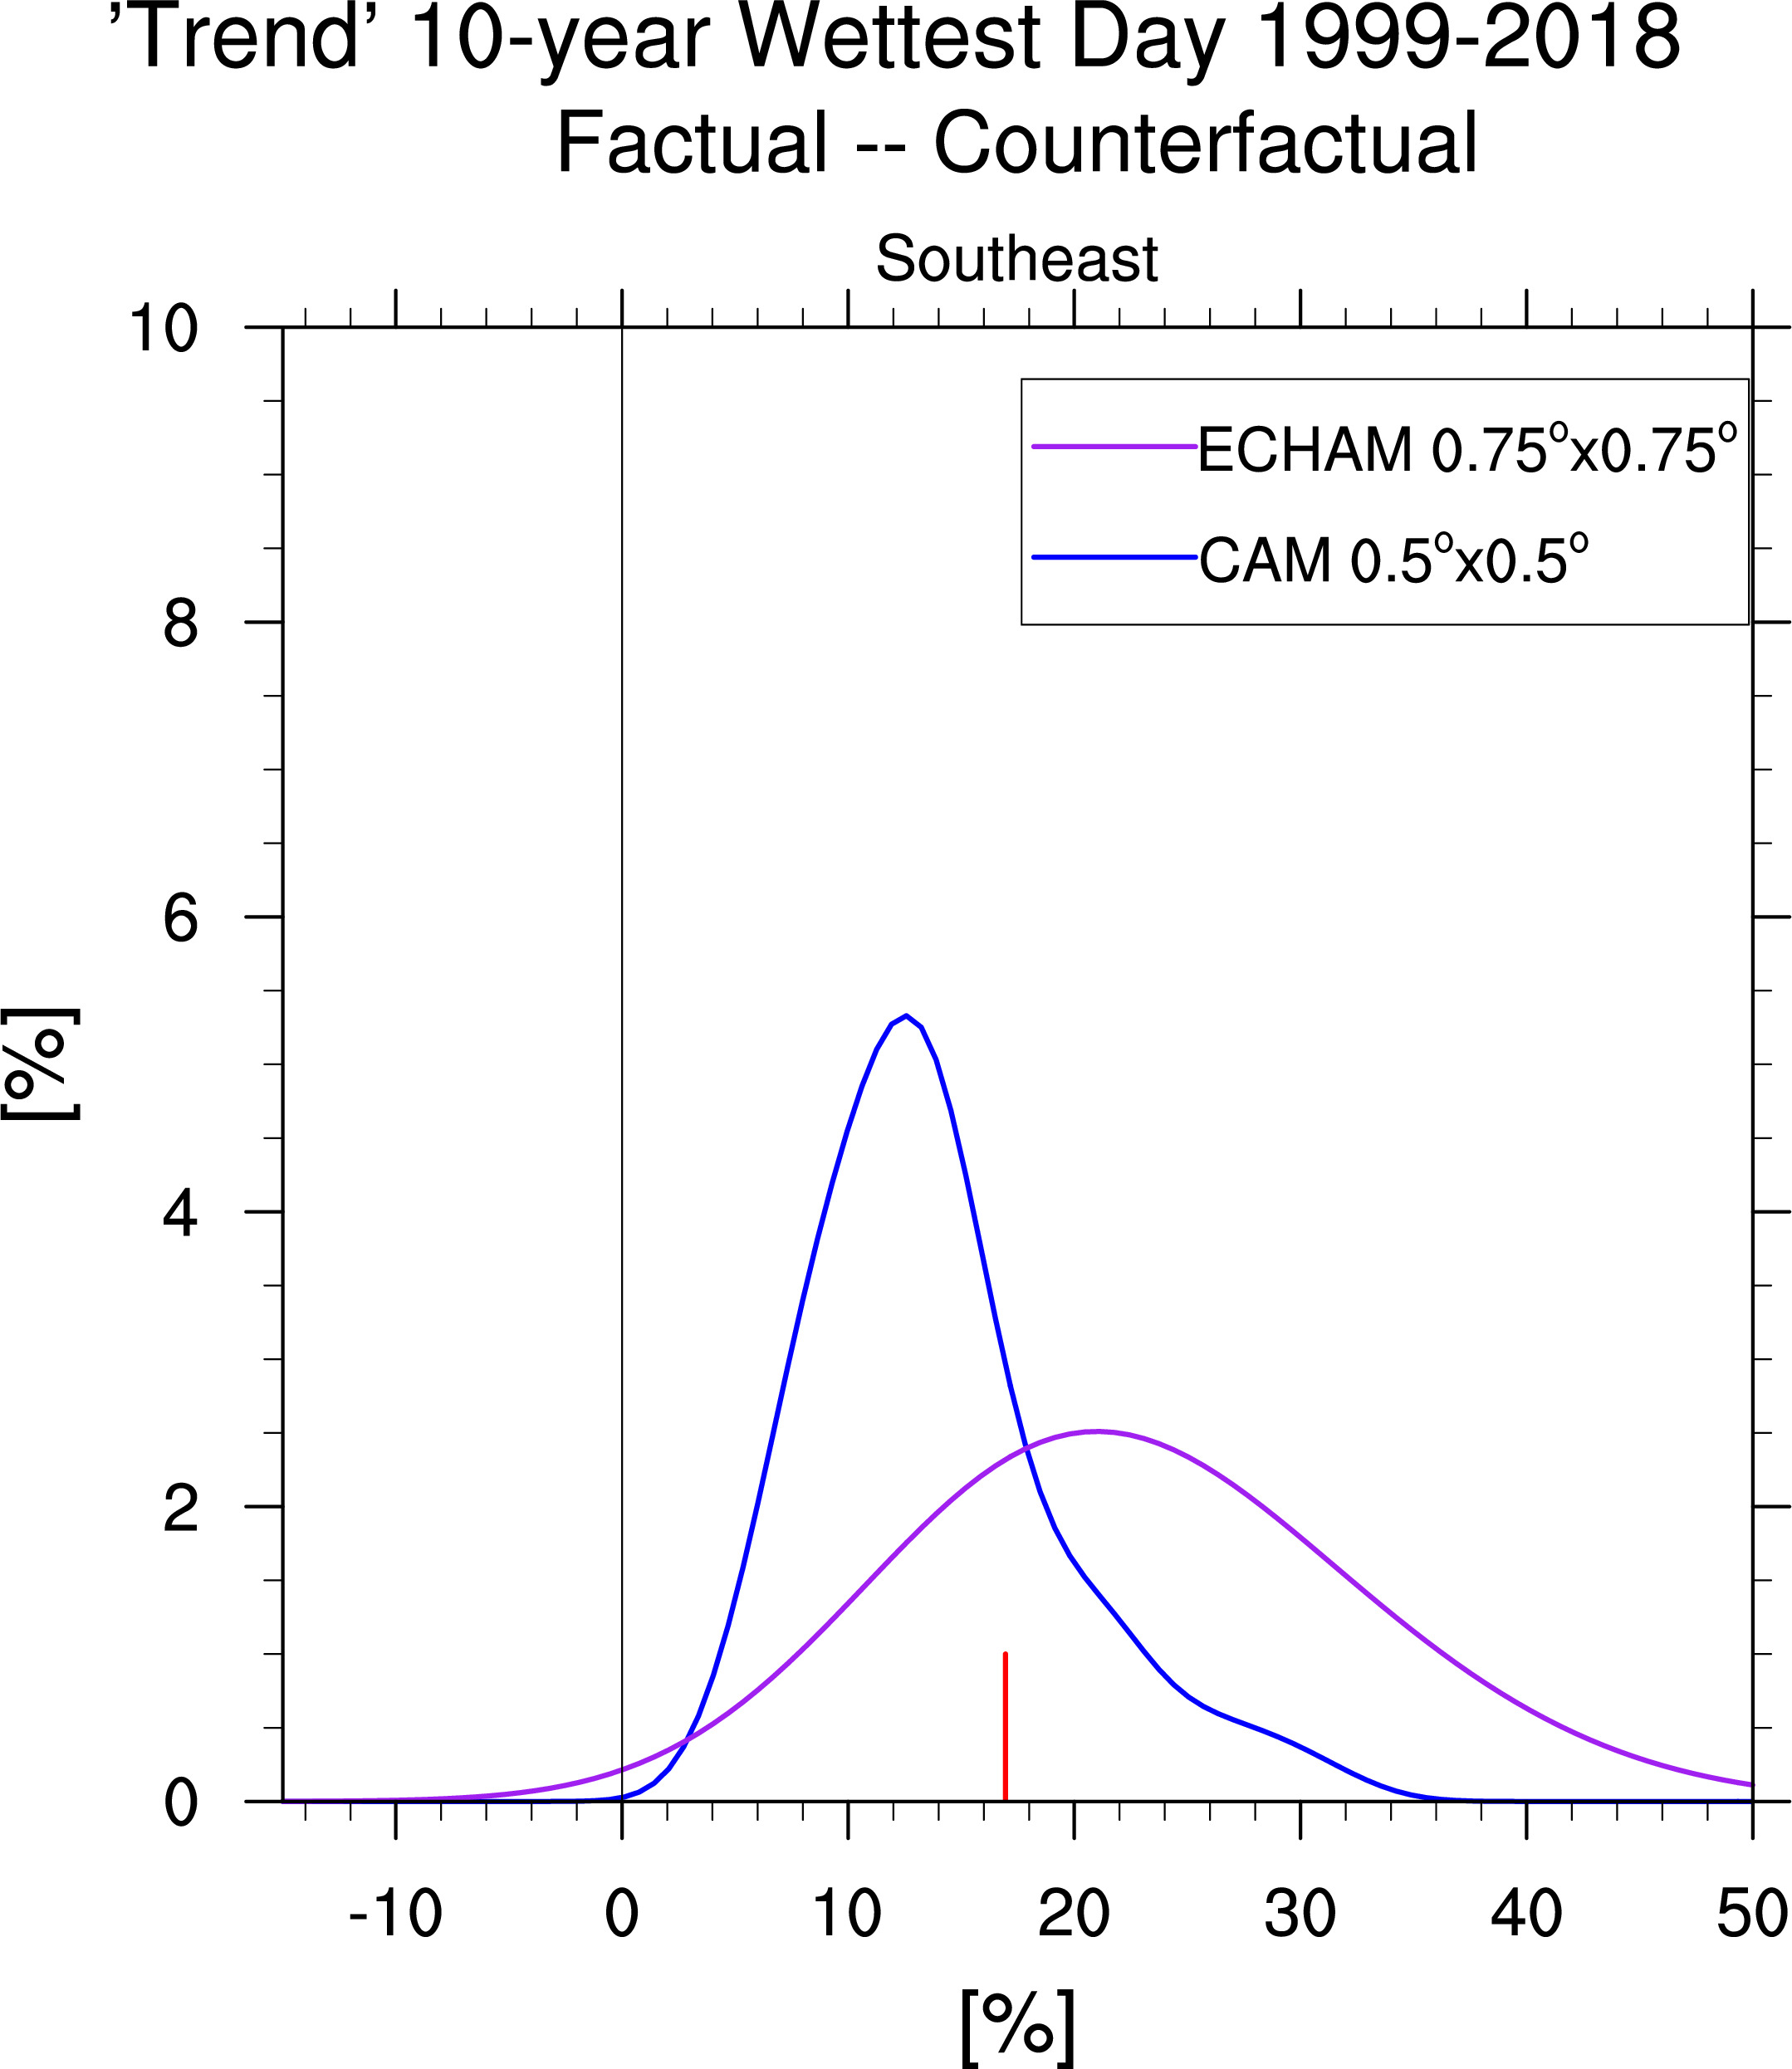
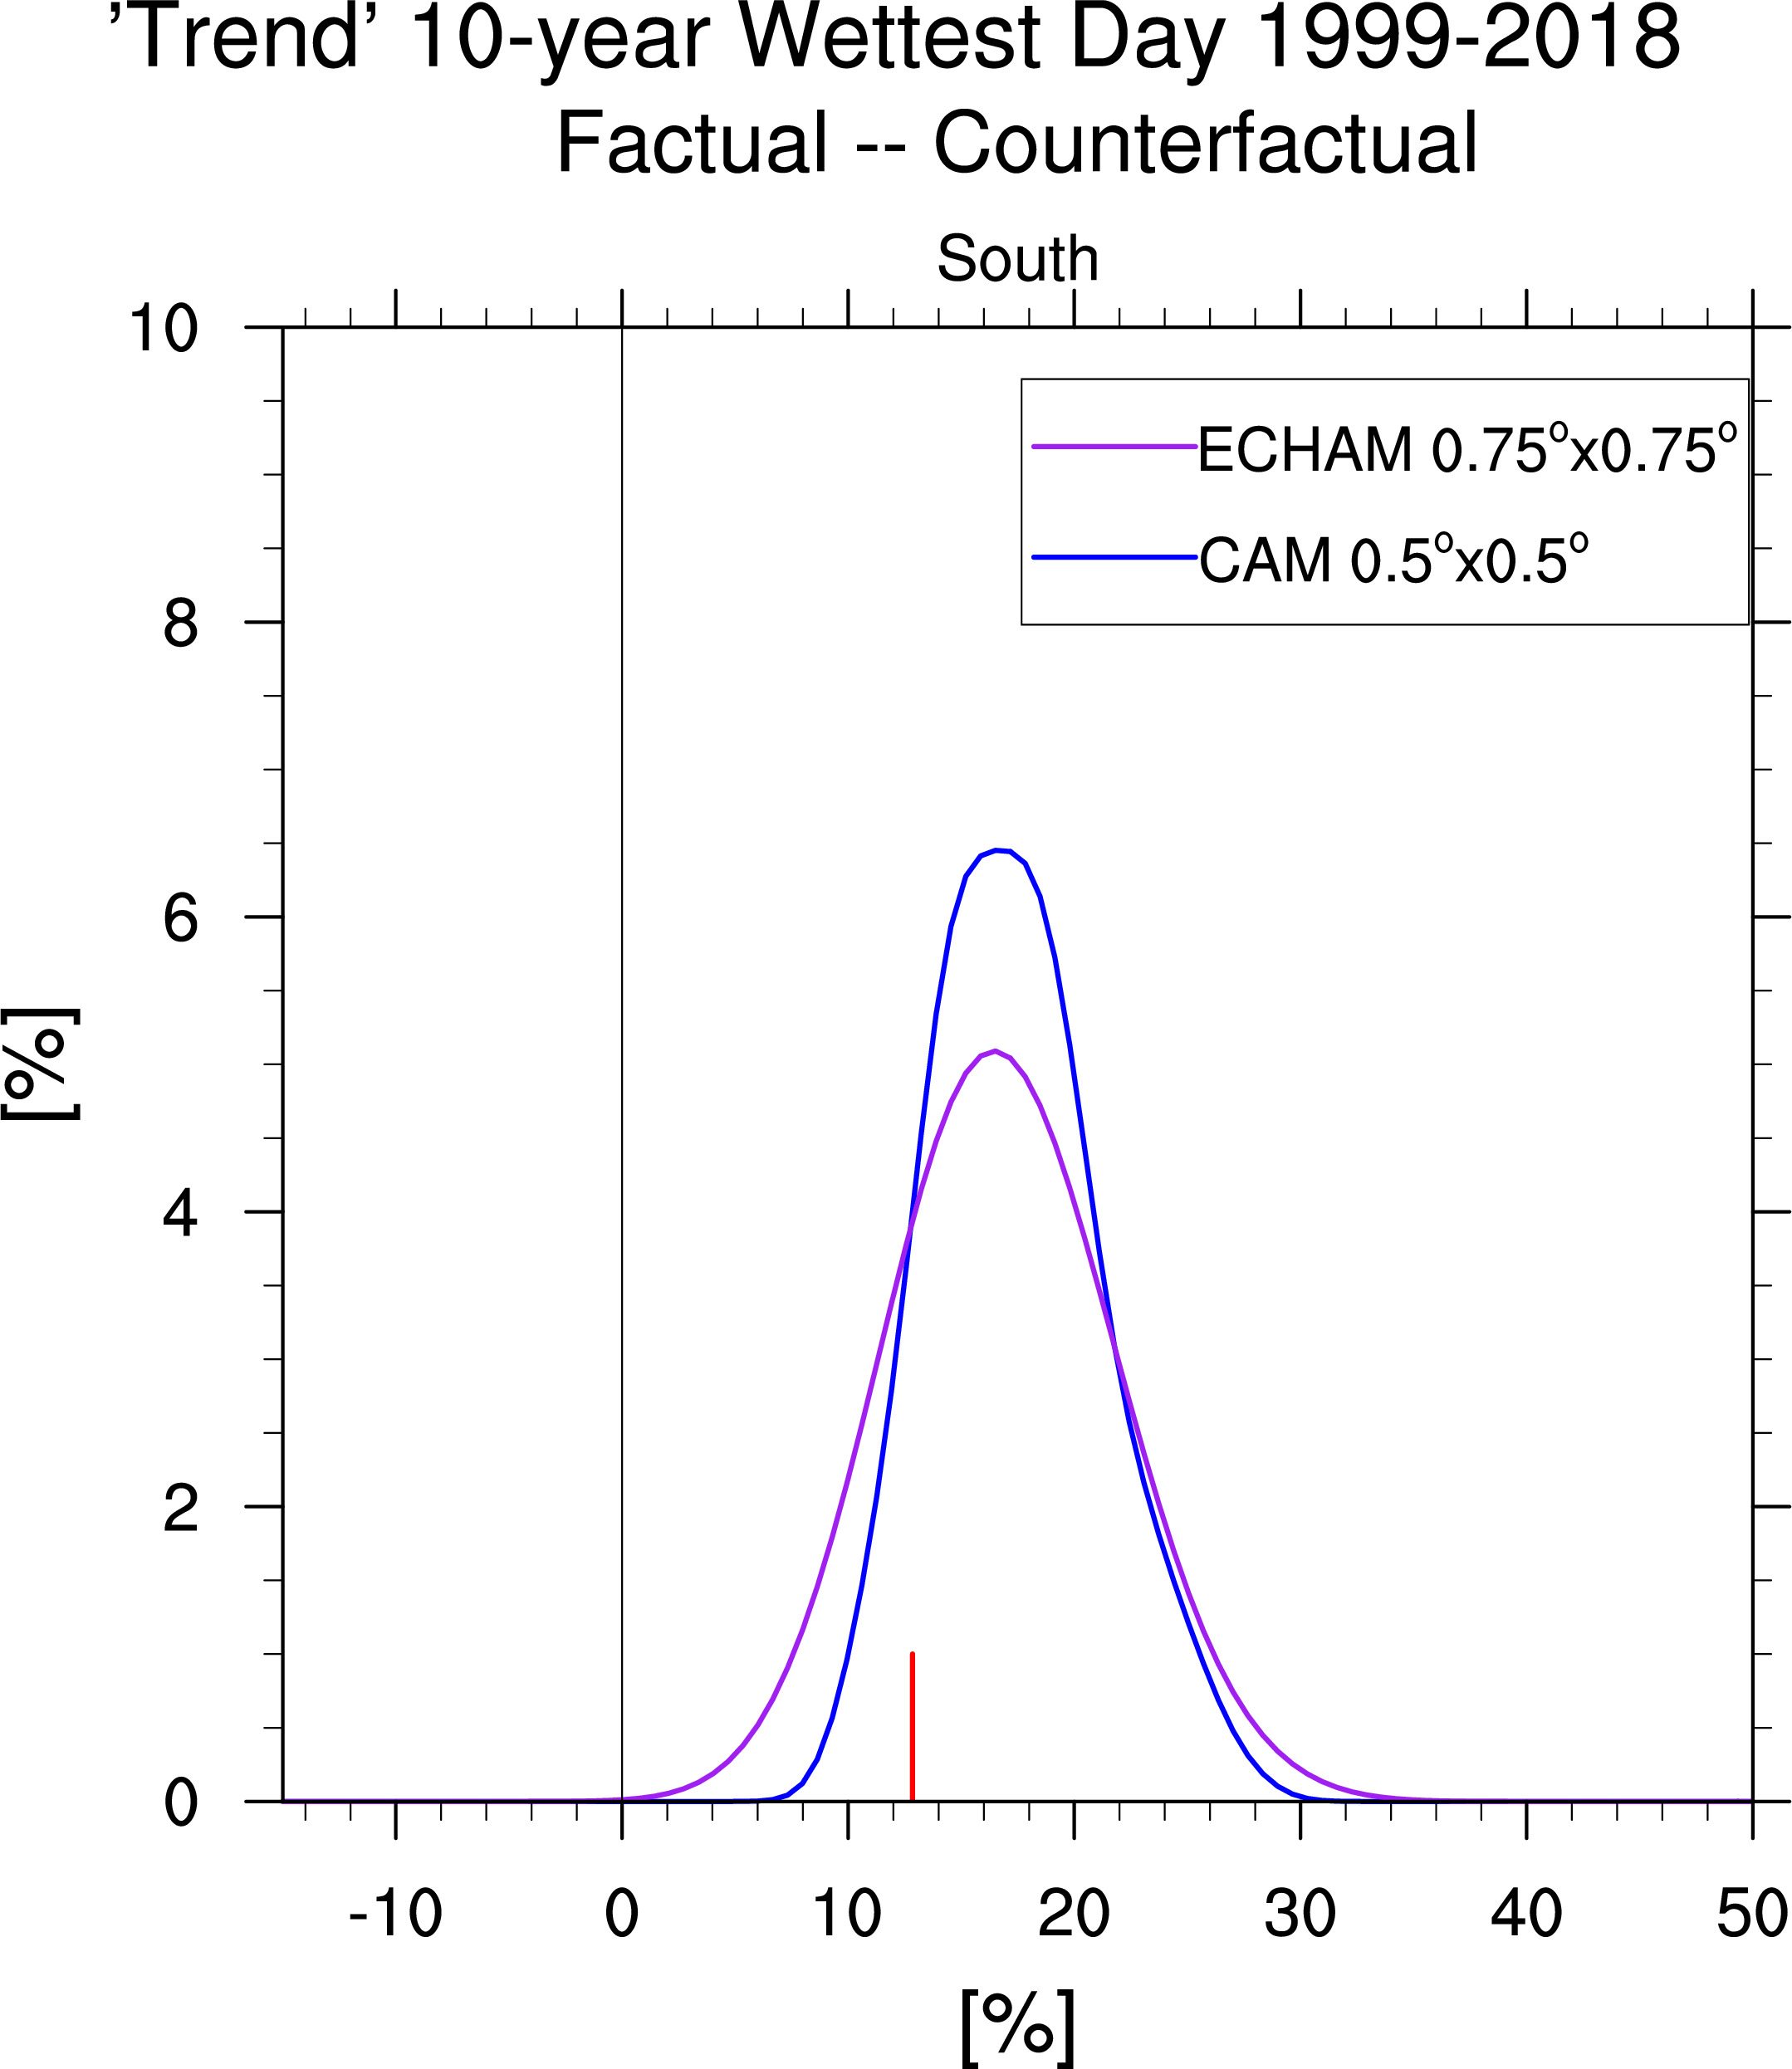
Three Models


--------------------------------------------------------------------------------------------------------------
NCEI Climate Superdivisions: