Atmospheric angular momentum (AAM) provides a convenient framework to study the role of mountains, surface wind stresses and various transport mechanisms in variability ranging from intraseasonal to interdecadal and beyond. Quantitative studies are feasible with current global assimilated datasets which show a good budget balance for global integrals, intraseasonal variations and during northern winter/spring. The budgets get much worse when gravity wave drag is included, if zonal integrals are considered or during summer/fall seasons. AAM is useful as an index of the large scale zonal flow since it is highly correlated with independent length-of-day measurements and with phenomena such as the QBO, ENSO, the MJO and possibly global warming. CDC scientists have examined several aspects of AAM variability, including: the link to MJO tropical convection, a linear model of global AAM and its torques, the global AAM budget imbalances due to gravity wave drag, the forcing for the semiannual seasonal component of AAM and the AAM response to global warming in an ensemble of coupled ocean-atmosphere model runs. CDC also monitors in real time the complete vertically integrated budget as part of its web-based maproom activities and distributes AAM and torque data to other researchers.
A composite study of the MJO AAM signal was performed using 30-70 day filtered data and global AAM tendency as a linear regression "predictor". Large-scale eddies forced by tropical convection were found to play a dominant role in forcing the AAM response during northern winter (November-March). As these eddies move eastward within the asymmetric basic state, they produce a poleward movement of momentum transports. When this upper tropospheric momentum source reaches the subtropics, it induces a vertically deep mass circulation and a subtropical friction torque anomaly, which causes AAM to change. For the mountain torque, a combination of equatorial Kelvin waves, forced by convection over Indonesia and then impinging on the Andes and mass exchanges along the east slopes of the Himalayas and Rockies were found. The former is more directly linked with the MJO while the latter is a residual of large amplitude, ubiquitous torques induced by mid-latitude synoptic wavetrains. In fact, a case study of an individual MJO, where the mountain torque was 3x larger than the frictional torque, prompted a linear model investigation of the torques and their role in forcing intraseasonal AAM anomalies.
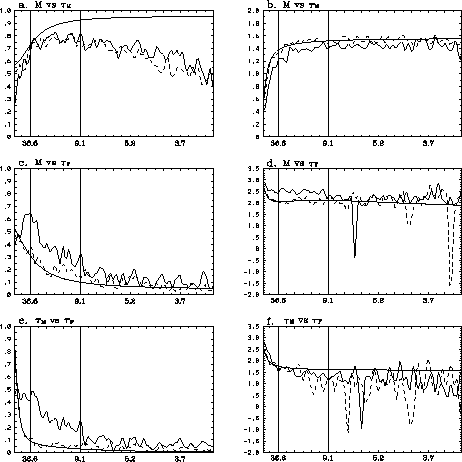
A simple Markov model of the three-component system comprised of total AAM, friction and mountain torque was developed. Statistical analysis of the observed data suggested AAM anomalies are damped on a 30 day time scale by the friction torque and forced stochastically by a "white" mountain torque and a "red" friction torque. The resulting Markov model has variances and lagged covariances that compare favorably to the observations, although systematic differences representing approximately 20-30% of the variance also emerge (see Fig. 4.9). The most prominent differences are the greater coherence between the mountain and friction torque for 10-90 day periods in the observations (see Fig. 4.9e) and the excessive AAM variance at ~2*pi*30 days (the AAM decay time scale) in the modeled spectrum (not shown).

About 30% of the torques' variance in the 10-90 day band is coherent in the observed data versus <10% in the Markov model. In both the observations and the model, the friction torque leads the mountain torque. Physically the relation reflects primary forcing of AAM by the mountain torque and primary damping by the friction torque. It occurs weakly in the Markov model because the 30 day damping on AAM is "assigned to" the friction torque. For the MJO the same relation accounts for ~45% of the variance. The increase appears related to the timing of the torques' response to tropical convective forcing and adds to a background coherence, as given by the Markov model. When linear inverse modeling is performed that accounts for feedback among the variables, the modeled AAM spectrum is improved somewhat and the skillful prediction of AAM is extended by 2 days.
The differences that remain after accounting for the linear feedbacks may be tied to limitations imposed by analyzing the global integrals. This naturally leads to three degrees-of-freedom for the simple Markov model which may be insufficient to describe the system accurately over a broad frequency range. In particular, the 30-day decay time scale for AAM blends interannual and intraseasonal variations that include both oscillatory and damped modes. Further improvement in the linear model requires analysis of a more complete set of variables that include deviations from the global mean.
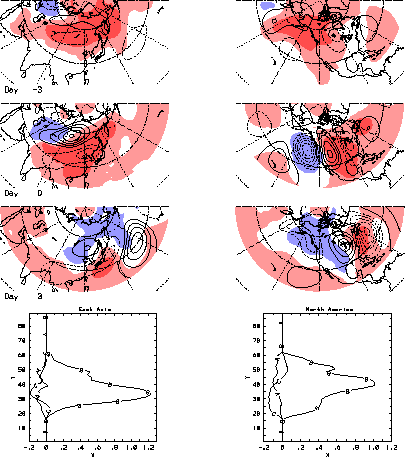
The synoptic features associated with global mountain and frictional torques were also studied. The primary synoptic structure producing the mountain torque during northern winter is seen in Fig. 4.10. Growth of quasi-geostrophic disturbances upstream of the mountains is followed by downstream dispersion of energy across the mountains. At the surface, mass anomalies propagate southward, likely reflecting topographic Rossby wave activity forced by low level flow impinging on the mountain slopes. Zonal mean momentum anomalies produced by the torque are transported out of the latitude band of the mountain. This is accomplished partially by the quasi-geostrophic wave activity. The momentum is dissipated in adjacent latitude bands by the friction torque which responds to the upper level momentum source produced by the transports. The mass anomalies are consistent with quasi-geostrophic balance of the surface flow. The decay time scale of the global mountain torque is ~1.5 days, i.e., it is nearly white for daily data.
Synoptic developments are more complicated with the global friction torque which has a slower, 6 day decay time scale. Such low frequency forcing implies larger AAM anomalies and possibly enhanced predictability. Regression, using the global friction torque as a "predictor", reveals zonal mean momentum transports across 35N during northern winter can initiate intraseasonal growth and decay of AAM anomalies. Fig. 4.11 shows the composite evolution of 250 mb streamfunction and SLP anomalies when regressed on the friction torque. The streamfunction pattern at day -10 (Fig. 4.11a) has a ring of anticyclonic centers along 30-40N, consistent with northward momentum transports across 35N. The sequence which follows (Figs. 4.11b-d) shows wavetrains amplifying over east Asian and then North American orography, low pressure moving equatorward east of these mountains and pre-existing zonal mean easterly wind anomalies south of 35N intensifying (Fig. 4.11c, mountain torque < 0) and then weakening (Fig. 4.11d, friction torque > 0).
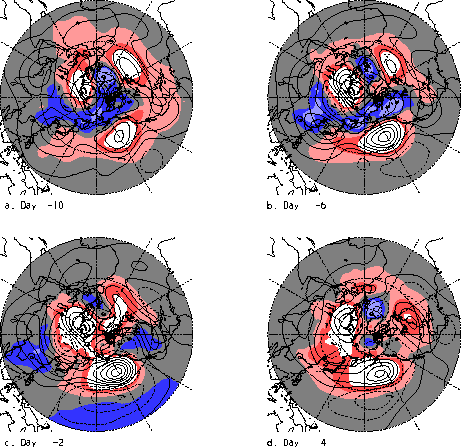
The negative zonal mean mountain torque at days -2 to -6 is balanced by momentum transports that produce a momentum source in the orographic regions and a momentum sink in adjacent regions (or latitude bands). The atmosphere responds with easterly surface wind anomalies as it adjusts to the momentum sinks and these are supported geostrophically by lower pressure in the tropics and higher pressure in the extratropics (e.g., Fig. 4.11c). The mass and wind fields are especially strong over the Pacific sector where the 250 mb pattern projects onto the PNA. The positive friction torque counteracts the negative AAM tendency produced by the mountain torque leading eventually to a weak positive AAM anomaly. The 6-day decay time scale for the friction torque translates to a typical life cycle of an event lasting ~30-40 days. The close proximity to the MJO oscillatory time scale of 30-60 days suggests a good chance for interaction and feedback, both through the tropical convection and through the momentum and heat transports.
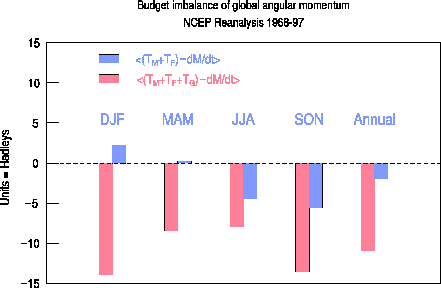
The long-term balance of global angular momentum was examined in the NCEP reanalysis data set. In a perfect balance, the tendency of global atmospheric angular momentum should equal the total surface torque that comprises the three components of the mountain (TM), friction (TF), and gravity wave (TG) torques. The gravity wave torque arises from the parameterization of subgrid-scale orographic gravity wave drag in the NCEP reanalysis model. Because TF and TG are not constrained by observation, a budget imbalance in the reanalysis data may exist. The extent of this imbalance reflects the realism of the assimilated data set. An extensive budget analysis of the NCEP data revealed a significant imbalance of angular momentum, on the order of -10 hadleys (negative value indicates that the torque is less than the tendency of angular momentum) for the annual mean. This imbalance is caused mainly by the gravity wave torque, as a removal of TG reduced the annual-mean budget imbalance to -2 Hadleys. Moreover, the greatest imbalance occurs in winter, when the magnitude of TG reaches its maximum. Figure 4.12 shows the seasonal and annual mean budget imbalance with (red) and without (blue) TG. The budget imbalance in the reanalysis data strongly suggests deficiencies in the TG parameterization scheme that may cause a loss of global angular momentum in real forecasts made with the NCEP GCM. This point was immediately confirmed by examining an extensive set of 8-day forecasts made with the NCEP reanalysis model. The rate of loss of global angular momentum in these medium-range forecasts is on the same order of magnitude as the budget imbalance deduced from the reanalysis data. These results constitute a critical examination of the realism of the NCEP reanalysis data. They also point to the potential negative impact of the gravity wave drag on numerical weather/climate prediction. Finally, the TG in the ECMWF reanalysis data is very similar to its counterpart in the NCEP reanalysis in its magnitude and temporal variability. It is very likely that the same problem of budget imbalance of angular momentum, caused by TG, also exists in the ECMWF reanalysis data and the ECMWF GCM.
This study was inspired by the budget analysis of global angular momentum described above. After finding the potential problem with the orographic gravity wave drag (GWD) in degrading the balance of global angular momentum, the impact of GWD on weather/climate prediction was examined by performing a series of extensive GCM simulations with varied strength of GWD. The GCM used was a recent version of the NCEP global forecast model. The numerical experiments comprised 9 sets of medium-range (2 week) forecasts, each using a different value of the surface GWD parameter ranging from 0 (no GWD) to 2 x GWD (twice the standard value used in the original NCEP model). Each set of forecasts, in turn, consisted of 20 runs from a series of initial conditions 5 days apart from the 1997-98 winter. The results showed a clear degradation of the forecasted global angular momentum as the strength of GWD increases, consistent with our previous budget analysis. At the same time, GWD did provide some improvement in the forecast of the local zonal mean angular momentum in the midlatitude of the Northern Hemisphere, a characteristic that has been emphasized by proponents of GWD parameterization.
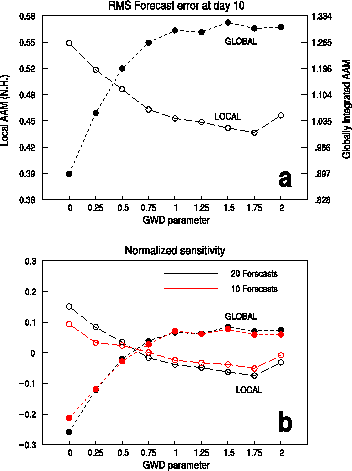
Thus, increasing the GWD in the model introduces opposite effects in the errors of the global and local angular momentum. This is most clearly illustrated in Fig. 4.13a, the forecast error of global angular momentum (filled circles) and the area-weighted RMS forecast error of local angular momentum (open circles) for the Northern Hemisphere as functions of the GWD parameter. Each circle represents the error at day 10 averaged over 20 forecasts. Figure 4.13b is similar to Fig. 4.13a, but with the error normalized by the grand average across the nine parameter values of GWD. The robustness of the result is demonstrated by the smallness of the difference between the 20- (black) and 10- (red) forecast averages. The detailed structure of the local forecast error of zonal mean zonal wind as a function of the GWD parameter was investigated. It is found that in the absence of GWD the forecasted zonal wind is too strong in the midlatitude but too weak in the subtropics of the Northern Hemisphere. The two local errors partially cancel each other such that the error in the global angular momentum appears to be small. The effect of GWD is to partially reduce the local error in the N.H. midlatitudes without affecting other areas. Thus, the stronger the GWD, the greater the negative bias in the forecasted global angular momentum. These results indicate that the GWD parameterization scheme is not consistent with the balance of global angular momentum. Research into alternative parameterization schemes for the mechanical dissipation in the GCM that is capable of correcting both local and global errors of angular momentum in the same direction is warranted.
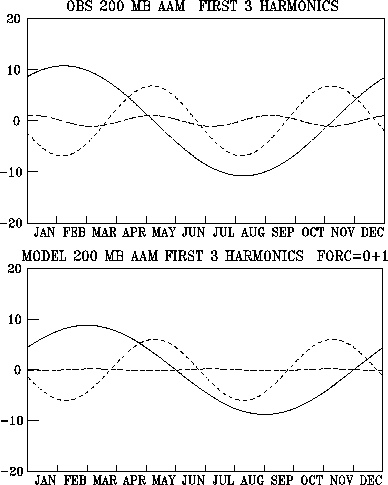
The mechanism for the semiannual oscillation of atmospheric angular momentum was examined. Upper-tropospheric winds, whose angular momentum is an excellent proxy of the vertically-integrated angular momentum, were used. The observed seasonal cycle of the zonal wind or angular momentum is dominated by its first two (annual and semiannual) harmonic components (Fig. 4.14, top panel). The seasonal variation of the rotational component (the part that contributes to global angular momentum) of the upper-level winds was diagnosed in a nonlinear upper-tropospheric vorticity-equation model with specified divergence (Rossby wave source) and transient eddy forcing. The divergence forcing is the more important of the two, especially in the Tropics and subtropics, where it is associated with tropical heating and cooling. Given the harmonics of the forcing, the model predicted the harmonics of the response, that is, the vorticity, from which the harmonics of angular momentum can be calculated. This procedure itself is an innovative way of diagnosing a temporally periodic phenomenon. It can, in principle, be generalized to the three-dimensional atmosphere or a coupled atmosphere-ocean system. The surprising but clear conclusion from our diagnosis is that the semiannual harmonic of atmospheric angular momentum arises more as a nonlinear response to the first (annual) harmonic of divergence forcing than as a linear response to the second harmonic of divergence forcing. To illustrate, the bottom panel of Fig. 4.14 shows the response of global relative angular momentum (first three harmonics) to a specified divergence forcing that contained only the annual mean plus the first harmonic. In this case, in the complete absence of a second-harmonic forcing, the second harmonic response resembles that observed in both amplitude and phase. Another case with specified second harmonic (but not first harmonic) forcing failed to produce a realistic response in the angular momentum. Thus, the semiannual harmonic of solar radiative forcing arising from the sun crossing the equator twice a year may not be as important as previously thought in generating the semiannual cycle of atmospheric angular momentum. The result is a clear demonstration that external forcing at one frequency can produce primary atmospheric response at a different frequency. Since it has been shown previously that significant errors exist in the semiannual harmonic of angular momentum or zonal wind in GCM simulations, the findings point to the possibility that these errors may be related to the first harmonic of the radiative/diabatic forcing as well as the detailed treatment of the interaction between this forcing and the annual harmonic of the tropical circulation.
