Reports from Jasmine
5/11/99 : 5/19/99
Sample Data
05/11/99
Jasmine Field Report 1
May 11, 1999
Chris Fairall, Peter Hacker, Yolande Serra, Peter Webster
Following a week of loading and installing equipment in Singapore, the NOAA
R/V Ronald H. Brown departed at 4 pm on April 30 to embark on the main phase of
the Joint Air Sea Monsoon Experiment (JASMINE). JASMINE is a 40-day study of
air-sea interaction and its relationship to monsoon variability in the Indian
Ocean and Bay of Bengal involving scientists from four NOAA research
laboratories, eight universities, and four countries. A "pre-JASMINE"
preliminary survey of the experimental area was conducted by the ship in
mid-April. The principal investigators are Chris Fairall from the NOAA
Environmental Technology Laboratory, Peter Hacker from the University of Hawaii,
Yolande Serra from the University of Washington, and Peter Webster from the
University of Colorado.
Why are we are in the Indian Ocean making measurements of the ocean and
the atmosphere? This is the part of the world that is influenced by the South
Asian monsoon. Between late May and September strong moisture laden winds
blow into the continental regions bringing copious rainfall. This rainfall is
important as the countries that surround the Indian Ocean rim are essentially
agrarian and good rains mean good crops and good crops means food. Furthermore,
more than 60 % of the world's population lives under the influence of the
monsoon. However, the monsoons sometimes fail and during any rainy season there
are short term droughts called "monsoon breaks". Some of us believe that these
variations in rainfall (either from month-to-month or year-to-year) can be
forecast with sufficient lead time that the farmers can alter their crop plans
if they expect a drought or anticipate a flood. Furthermore, we believe that the
key to being able to forecast the variations of the monsoon lies in the manner
that the ocean and the atmosphere interact. Hence the Joint Air-Sea Monsoon
Interaction Experiment project where we are looking for the first time at the
influence of the Indian Ocean on the monsoon.
The Ronald H. Brown is NOAA's newest research vessel and she has been
heavily instrumented for oceanic and atmospheric observations. Standard systems
on the Brown include a state-of-the-art scanning Doppler weather radar, a
satellite data receiver, a Doppler acoustic ocean current profiler, oceanic and
atmospheric CO2 concentration measurements, a radiosonde launch system, and a
Sea Beam sonar (for mapping ocean bottom terrain). The scientific party has
added three Doppler radars for wind and cloud information, microwave radiometers
to determine total column atmospheric water vapor and liquid concentrations, an
air-sea flux measurement system, radiometers to measure incoming solar and
infrared heat flux, and a high-accuracy dual-sensor
conductivity-temperature-depth (CTD) ocean profiling system. Two types of
drifting buoy oceanic measurement units will be deployed at selected locations.
After leaving Singapore we headed towards the equator to enter the Indian
Ocean between Java and Sumatra where we passed by the crater of Krakatoa (a
volcano that exploded in the late 1800s). This early part of the trip was marked
by nice weather and a variety of interesting sights from "stilt cities" on the
water to a flight of huge bats. From there, we headed west and then north west
until we reached the equator. Off the coast of Sumatra we encountered rather
disturbed weather with showers and towering cumulonimbus clouds. These were
associated with the southern hemisphere intertropical convergence zone which
stretches across the Indian Ocean along about 5S at this time of the year. In
the next few weeks the convection and heavy rains will be more to the north of
the equator as the south west monsoon sets in. Near the equator, the winds were
very light and the seas almost flat except for a swell which gave the impression
of the whole ocean heaving up and down like a large jello. We have been
tracking along 89E and have gone as far as 13N. During the time, the rain fall
has decreased and there has been little cumulus cloud, just an overcast of high
level cirrus clouds some 10 km (33,000ft) above the surface. The winds have
freshened to about 10 m/s (20-25 mph) and the seas are quite choppy with white
caps.
As we headed up 89E, we have been taking atmospheric and oceanic
measurements. We measure the temperature of the ocean from the surface to 500 m
as well as its salt content and the currents. We also measure the temperature
and the moisture content of the atmosphere from the ocean surface to above the
tropopause, some 18-20 km above us. But most importantly, we measure the heat
and momentum exchanges between the ocean and the atmosphere so that we can
understand how the ocean and the atmosphere interact.
We are now "on station" for the next 5 days near 12N, 89E. This is just the
type of weather that we need: no convection or very strong winds and lots of
sunlight to heat the ocean. The reason why we like this type of weather is that
we want to see how the upper ocean responds to continual heating from the sun.
Later, when we return to the same spot in two weeks, and after rainfall and
strong storms have stirred up the ocean, we will be able to compare we will be
able to deduce the impact that the storms have had on the ocean.
A group from The University of Hawaii is conducting the oceanographic
observations on the JASMINE cruise. During the pre-JASMINE cruise, 7-22 April
1999, 44 CTD stations were completed along a survey line from 5S to 16.5N along
88E. In addition, continuous acoustic Doppler current profiler (ADCP) and
near-surface thermosalinograph data (water temperature and salinity) were
obtained while underway. Seven surface drifters supplied by the University of
California at San Diego (UCSD) were deployed to measure near-surface currents
and temperatures. The pre-JASMINE data were obtained during an active period of
the pre-southwest monsoon season, with strong south-westerly winds driving
eastward currents and forming deep near-surface mixed layers in the
near-equatorial band. During the ongoing JASMINE cruise, 5-10 May, 39 CTD
stations and continuous ADCP and thermosalinograph measurements have been
completed along the south-to-north survey line within the Bay of Bengal sector.
In addition, six surface drifters and one SOLO float (UCSD) have been deployed.
The remarkable difference between the two surveys is the reversal of the
equatorial currents, with the currents now flowing strongly to the west in the
equatorial band. The two sections conducted as part of JASMINE are the first
ever meridional sections of the combined upper ocean temperature, salinity and
velocity fields during the pre- and monsoon onset periods in the Bay of Bengal
sector. In this data sparse region of the world's oceans, these data will
provide essential information on the upper ocean structure and variability and
its relationship to atmospheric forcing during the monsoon onset period.
The showcase instrument for the study of powerful rainstorms associated with
the monsoon is the ship's C-band Doppler radar. The C-band radar radiates at a
frequency of 5600 MHz or with a wavelength of about 5 cm. The radar beam is
about 1 degree wide. This region of the electromagnetic spectrum sees the
larger water droplets in the atmosphere, allowing us to detect rain and snow.
The radar is alternating between two basic scan types for Jasmine, a
surveillance scan and a volume scan. The 1 degree radar beam sweeps 360 degrees
around the ship at an angle of less than 1 degree from the horizon for the
surveillence scan. The range of this scan is about 0.5 - 250 km. The volume
scan is a series of 360 degree sweeps between about 0.5 degrees and 30 degrees
from the horizon with an extra sweep at 80 degrees for comparison with upward
looking shipboard instruments also measuring at cloud properties. The volume
scan set provides a three dimensional picture of the rainy areas, indicating
both the intensity of the rain and the along-beam velocity of the air mass
within these areas. This scan has a range of about 0.5 - 120 km.
For our first leg of Jasmine from 5 S to 13.5 N along 89 E, we have not
encountered any organized rain events. As discussed above, we are here just
before the expected onset of the monsoon season. The radar primarily picks up
isolated towering rain clouds attaining altitudes anywhere from 8 - 16 km or
greater. The 1 degree width of this radar beam is smaller than the previous 1.5
degree beam radar taken to sea on the Ronald Brown in 1997 on a trip to the
equatorial East Pacific. This narrower beam allows us to see smaller cloud
systems. It is hard to say whether such systems are more common over the Indian
Ocean than over the East Pacific Ocean, or whether our this newer radar is just
allowing us to detect these systems. Such questions will likely be answered
upon analysis of the data back home.
The air-sea flux system has been running smoothly since we left, packing in
about 400 mb of data every day. Unlike most past cruises, we have assembled a
large number of different sensors to measure each variable. This gives us
redundancy and cross checking. For example, we are recording 12 different
measurements for near-surface humidity, 9 for air temperature, 3 for CO2
concentration, 3 for water temperature, and 3 for relative wind speed. We also
have 4 different measurements of downward solar heat flux and 2 of downward
atmospheric IR heat flux. So far the biggest surprise in these measurements has
been the large increase of downward IR heat flux in the presence of low clouds
and storms. In the tropical western Pacific warm pool, this increase is 5-10
W/m^2 while here in the Indian Ocean it has been 40-60 W/m^2. Right now don't
know why this occurs, but we believe the explanation will be revealed in later
analysis of the radiosonde temperature and humidity profiles.
At this writing, we have just begun the first of two planned "star" surveys.
These are 5-day transects of the region in a 5-pointed star pattern about 50 in
diameter. Our intention is to obtain one star pattern before the monsoon onset
and then get a second with strong winds and heavy precipitation during the first
monsoon cycle. So far, the atmosphere has consented to follow our plans by
providing clear weather and weak convection for the first half of our study.
Stay tuned for our next update in a couple of weeks.
|
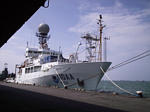
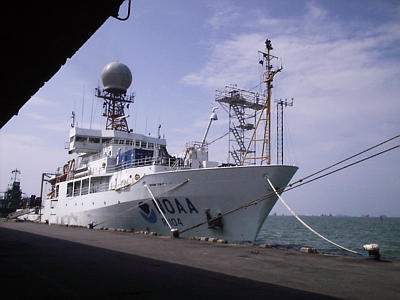
The Ronald H. Brown prepares for JASMINE in
Singapore. Towers visible on the bow include the ETL flux system
(center) and combined sensors (radiometers, rain gauges, CO2 sensor,
temperature and humidity) scaffold. The C-band precipitation radar
is protected by the spherical radome above the bridge.

The white seatainer in the foreground contains the millimeter cloud radar (MMCR)
and liquid water vapor and infrared radiometers.
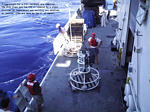
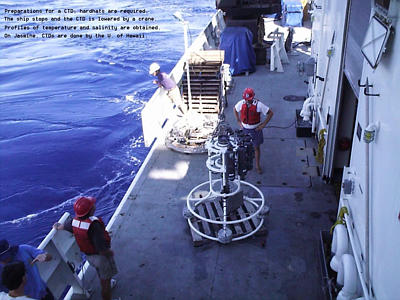
University of Hawaii scientists prepare a CTD for launch. This system will
obtain profiles of water temperature and salinity as a function of depth.
During JASMINE profiles will be done to 1000 m, 500 m, and 350 m, depending
on circumstances.
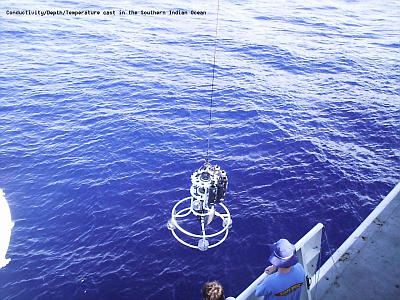
The CTD is lower into the water by winch.
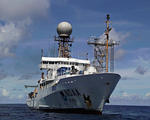
The NOAA ship R/V Ronald H. Brown in the equatorial Indian Ocean near 89 deg.
W longitude. The flux instruments are on the two bow towers.

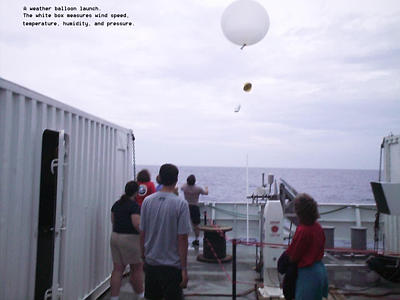
Scientists from University of Colorado and University of Washington celebrate
the launch of the first JASMINE radiosonde.
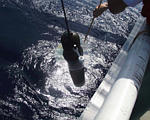
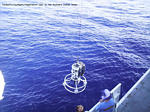
A SOLO float is launched. This device profiles the upper 200 m
of the ocean and comes to the surface to transmitt its data every 15-25 days.

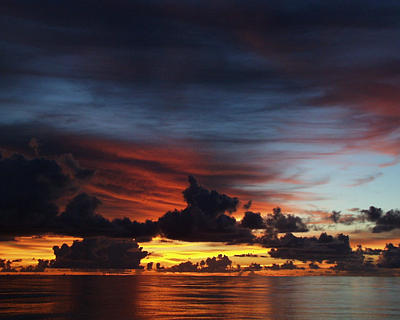
A nice sunset at about 5 deg. north.
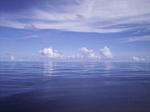
Fairweather clouds on a glassy sea near the equator.
|