Some Basics
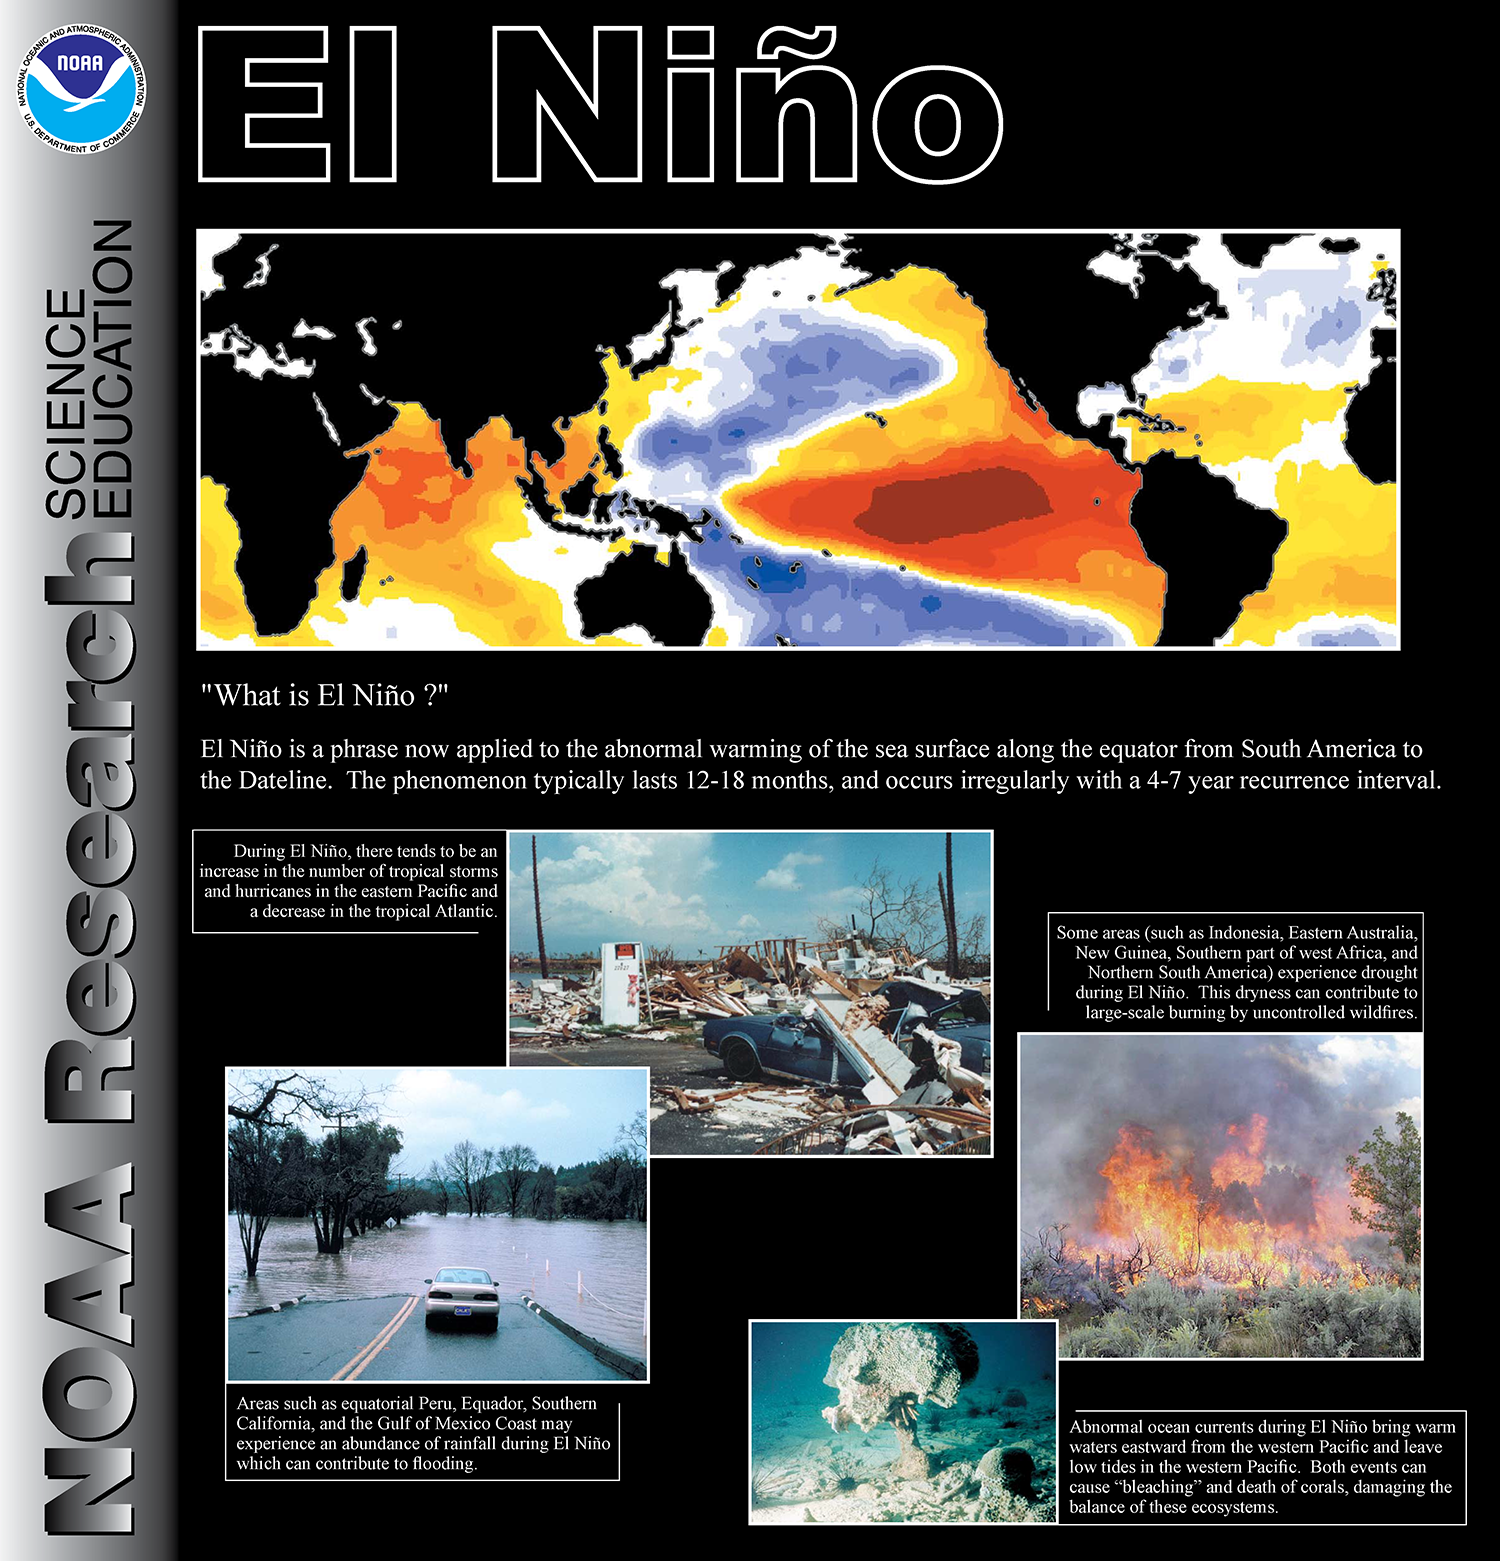
What are El Niño and La Niña?
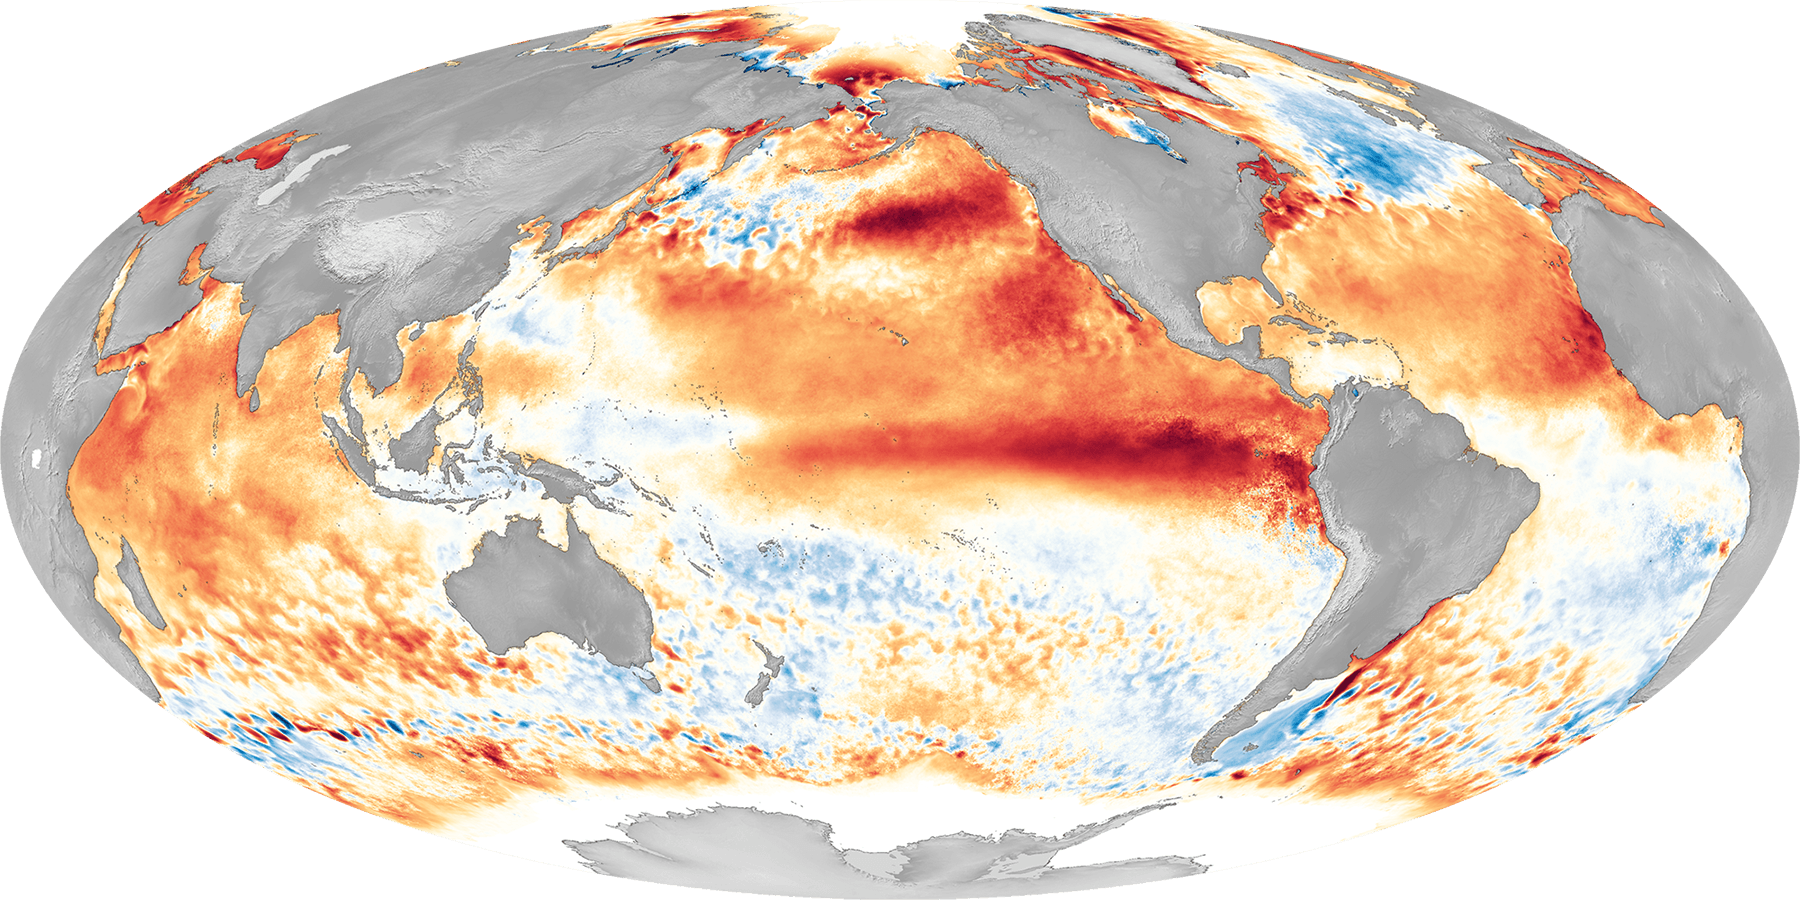
El Niño is characterized by unusually warm ocean temperatures along the the Equatorial Pacific, whereas La Niña is characterized by unusually cold ocean temperatures in this region. These variations from "normal" temperatures influence the tropical Pacific ocean—atmosphere system, which in turn impacts weather and climate around the globe. The term El Niño Southern Oscillation (ENSO) basically refers to both the El Niño and La Niña phenomena together. See this page for a more detailed explanation of what happens in the ocean and atmosphere during ENSO.
")
How often does ENSO occur?
While their frequency can be quite irregular, El Niño and La Niña events occur on average every 2—7 years. Typically, El Niño occurs more frequently than La Niña.
How long does ENSO last?
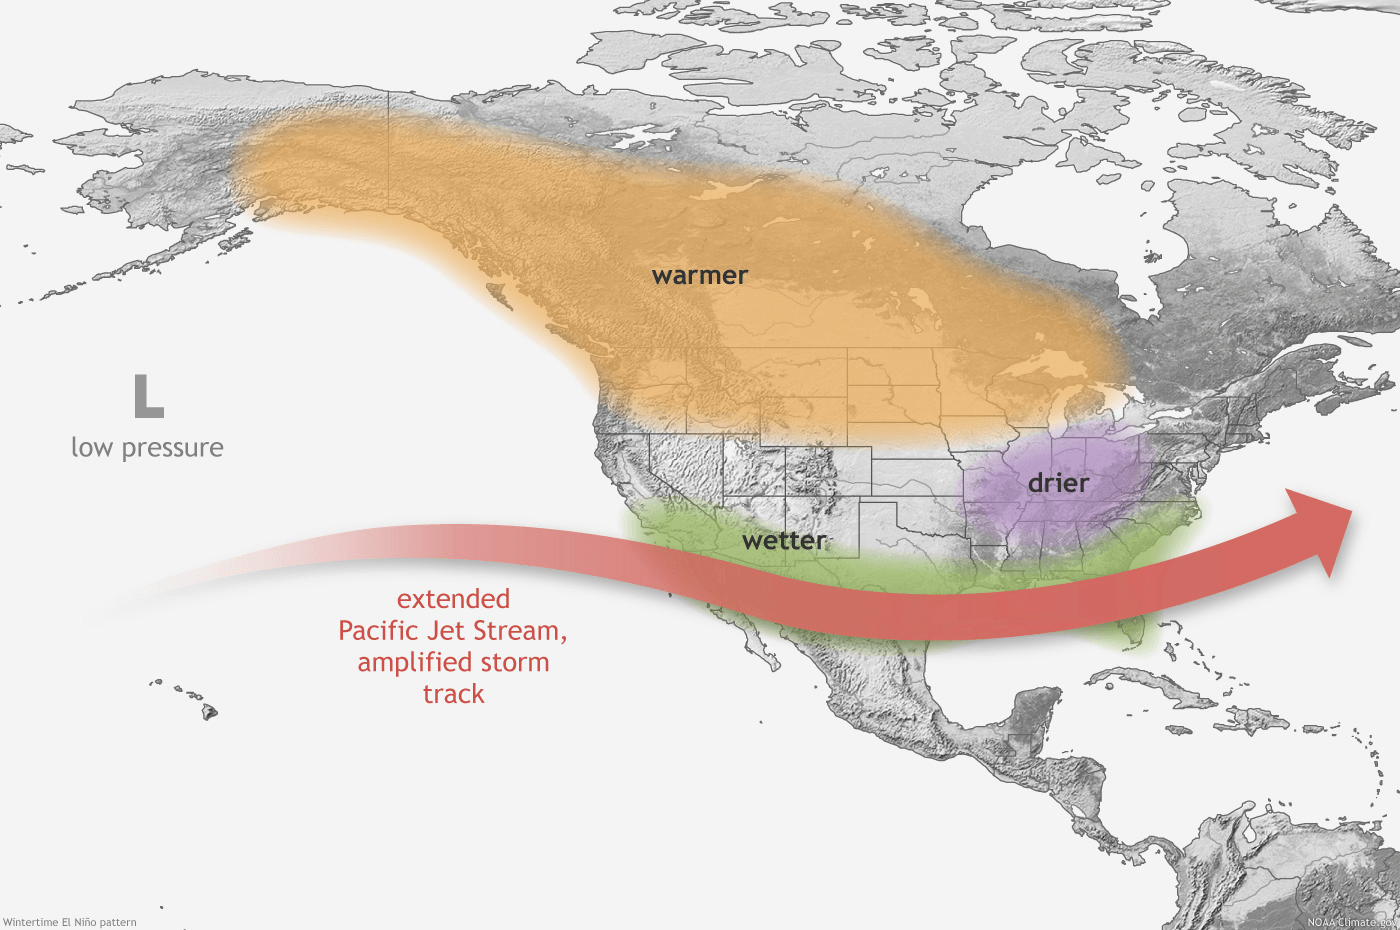
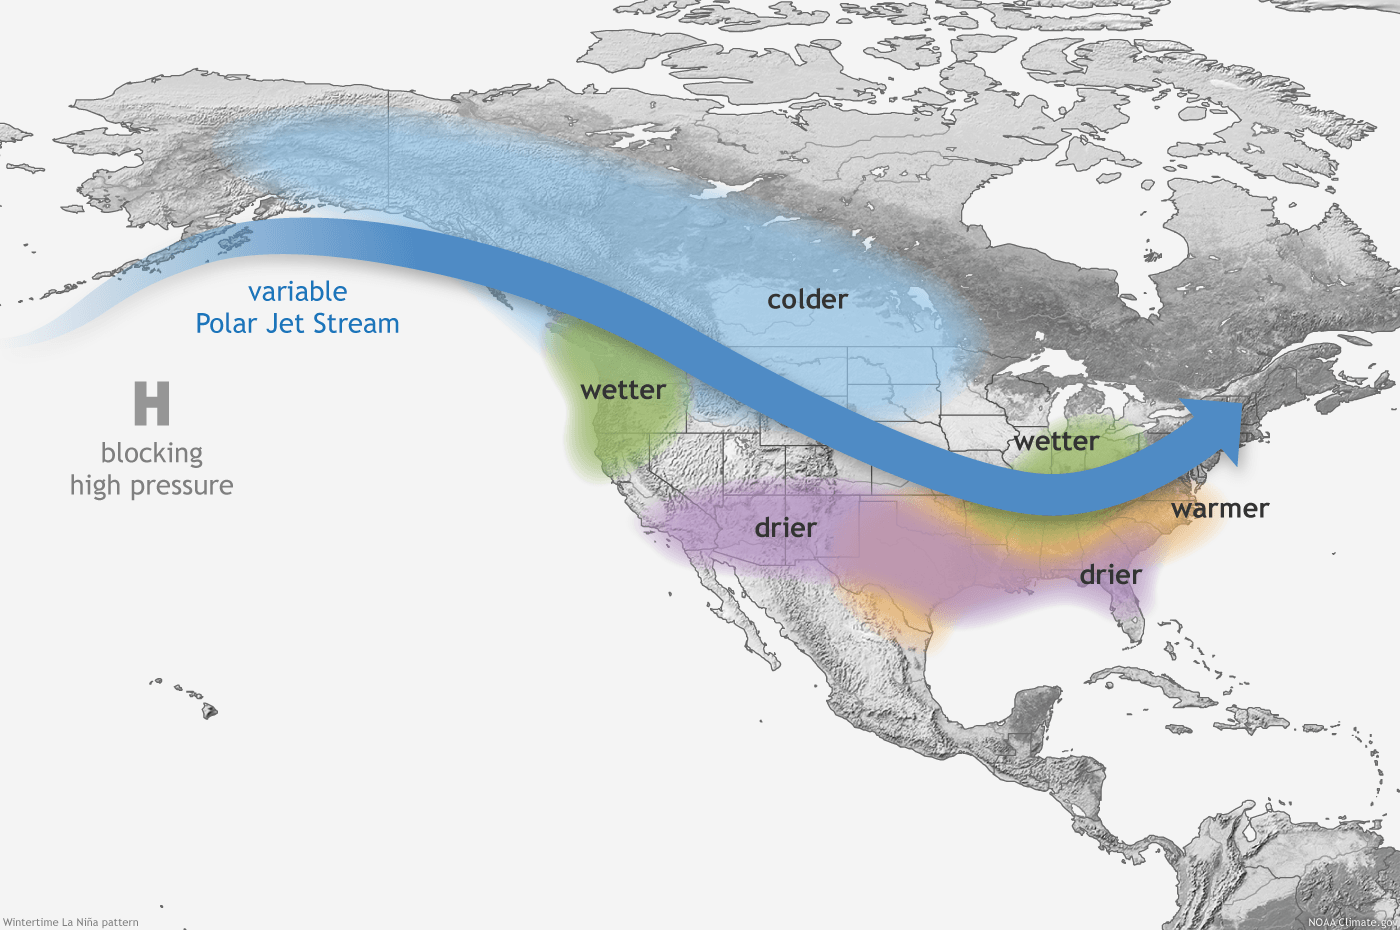
How will ENSO impact a particular region?
There has been a lot research investigating the effects of El Niño and La Niña on climate (temperature, rainfall, snowpack, climate extremes, etc.) around the world. However, these impacts can be different from year-to-year due to the varying nature of ENSO, and variations in the atmosphere–ocean system. The images below show typical El Niño and La Niña wintertime patterns for the U.S. Detailed information about worldwide impacts can be found on NOAA's El Niño Theme Page.
What is the Southern Oscillation Index (SOI)?
The cyclic warming and cooling of the eastern and central Pacific can be seen in the sea level pressure in the region. For example, when the pressure measured at Darwin, Australia is compared with that measured at Tahiti, the differences between the two can be used to generate an "index" number. A positive number indicates La Niña, and a negative number indicates El Niño. Historical and recent values can be found at NOAA's Climate Prediction Center .