The plots linked below show wind at various levels colored by speed, snow
level/freezing layer (black dots/dashed line), integrated water vapor (cyan
line), upslope wind speed (purple or brown bars), upslope integrated water vapor
flux (blue line), and hourly precipitation (green or red bars) with time moving
from right to left. Using tabs at the top left of the plot, users can choose to
display observations only or observations and forecasts produced by the National
Weather Service's hourly-updated weather forecast models.
[ How to Read These Plots ]

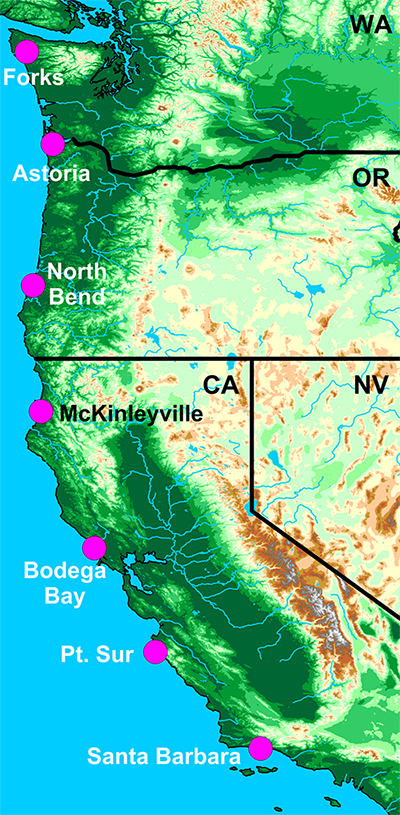
Location of observatories
The plots linked below show wind at various levels colored by speed, snow
level/freezing layer (black dots/dashed line), integrated water vapor (cyan
line), upslope wind speed (purple or brown bars), upslope integrated water vapor
flux (blue line), and hourly precipitation (green or red bars) with time moving
from right to left. Using tabs at the top left of the plot, users can choose to
display observations only or observations and forecasts produced by the National
Weather Service's hourly-updated weather forecast models.
[ How to Read These Plots ]

