Arctic Monthly Temperature Plots

Vaisala HMT330 humidity and temperature sensor
Vaisala HMT330 humidity and temperature sensor installed on the Eureka flux tower.
Climate change and arctic warming have gained public attention recently. Among various meteorological measurements, temperature is the most tangible measurment that many of us can related to in our everyday life. A picture on the left shows the Vaisala HMT330 humidity and temperature sensor installed on the Eureka flux tower.

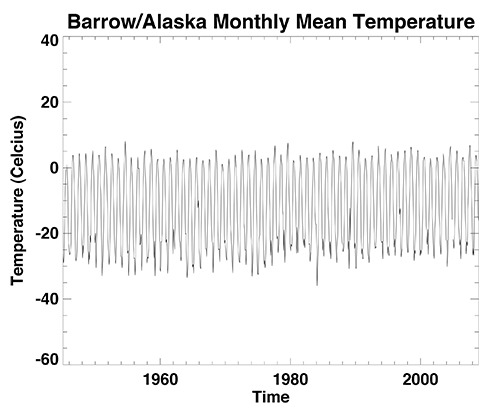
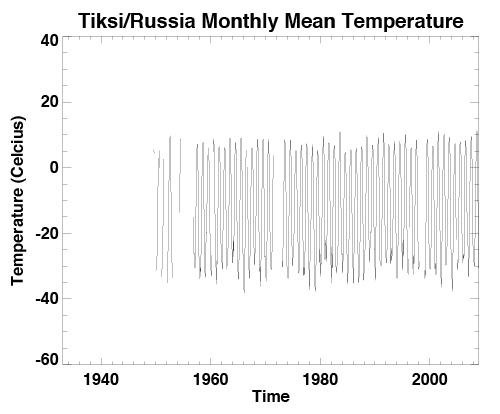
Some of the arctic stations have long-term temperature records. Here we plotted monthly mean temperature records from the three arctic stations: Barrow(Alaska), Eureka(Canada), and Tiksi(Russia). The data goes as far back as 1945, 1947, and 1933 respectively. The data comes from the Integrated Surface Hourly Global dataset (National Climate Data Center). Using this dataset, we calculated daily average temperature data first. Then in turn, we calculated monthly mean temperature data. If there were more than five days of missing data, we counted that month missing.

In order to decipher the temperature trend for each station, further sophisticated analysis is necessary (i.e., Calculations might involve finding seasonal, annual, or even decadal mean).

The ISH (Integrated Surface Hourly) data is available upon request at the UCAR CISL Research Data Archive .

Example of Barrow, AK monthly mean temperature data plot
Example of Eureka, Canada monthly mean temperature data plot
Example of Tiksi, Russia monthly mean temperature data plot