ATOMIC
Forecast Briefing
Satellite Imagery
Tropical Regional GeoColor
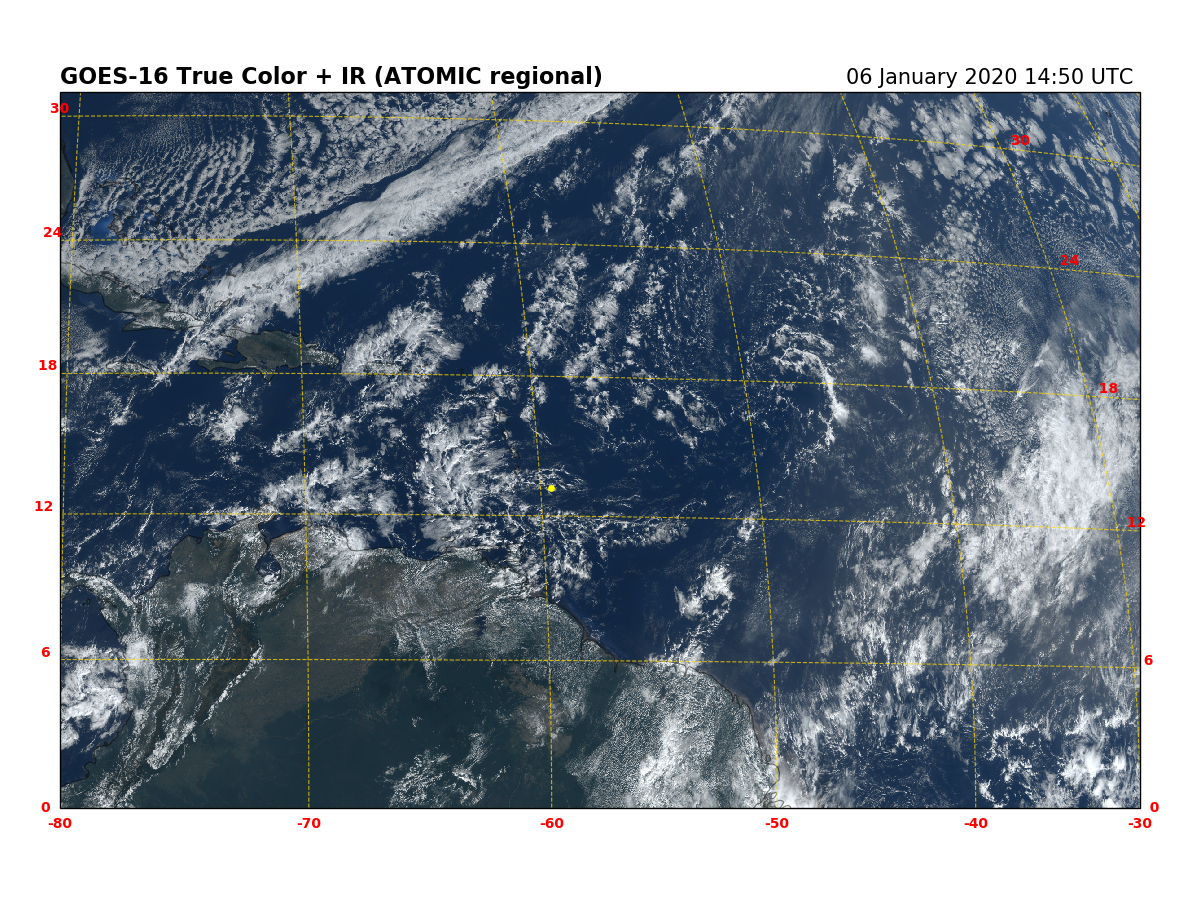
ATOMIC Mesoscale GeoColor

More NOAA Satellite Images: Other Sectors
CIMSS Satellite Wind Products
Sea Surface Temperatures
JPL MUR SST Analysis

JPL MUR SST Anomaly

Sea Level State
AVISO Sea Level Anomalies

In-Situ Observations
Observed Soundings
Ship/Flight Tracks
Flight Tracks from NOAA P3
Soundings with GFS Model Comparisons
The GFS analysis field is from the closest run time to the sounding time; the 24 & 48 hour forecast data are interpolated from the nearest times to the sounding time (see plot for exact times used). GFS vertical spacing is every 50 hPa.
Forecast Resources
Model Guidance Websites
GFS Flux Products
Additional Resources
Daily Forecast Briefing Summaries & Archive
| Date | Summary | Briefing Recording |
|---|---|---|
| Mon, 02/10/2020 | 20200210_ATOMIC_Briefing_Summary.pdf | 20200210_ATOMIC_Briefing_Video.mp4 |
| Thu, 02/06/2020 | 20200206_ATOMIC_Briefing_Summary.pdf | 20200206_ATOMIC_Briefing_Video.mp4 |
| Mon, 02/03/2020 | 20200203_ATOMIC_Briefing_Summary.pdf | 20200203_ATOMIC_Briefing_Video.mp4 |
| Thu, 01/30/2020 | 20200130_ATOMIC_Briefing_Summary.pdf | 20200130_ATOMIC_Briefing_Video.mp4 |
| Mon, 01/27/2020 | 20200127_ATOMIC_Briefing_Summary.pdf | 20200127_ATOMIC_Briefing_Video.mp4 |
| Thu, 01/23/2020 | 20200123_ATOMIC_Briefing_Summary.pdf | 20200123_ATOMIC_Briefing_Video.mp4 |
| Tue, 01/21/2020 | 20200121_ATOMIC_Briefing_Summary.pdf | 20200121_ATOMIC_Briefing_Video.mp4 |
| Mon, 01/06/2020 | 20200106_ATOMIC_Briefing_Summary.pdf | 20200106_ATOMIC_Briefing_Video.mp4 |