EP Fluxes
Data Notice: NCEP/NCAR Reanalysis 1 updates to end on or about March 18. Learn more
Last day available Mar 17, 2026
| Plot either the EP Flux averaged from daily data over N days until the date you select. Data is taken from the NCEP/NCAR Reanalysis which begins Jan 1 1948. or the ERA5 data starting Jan 1 1940 (2 months behind). |
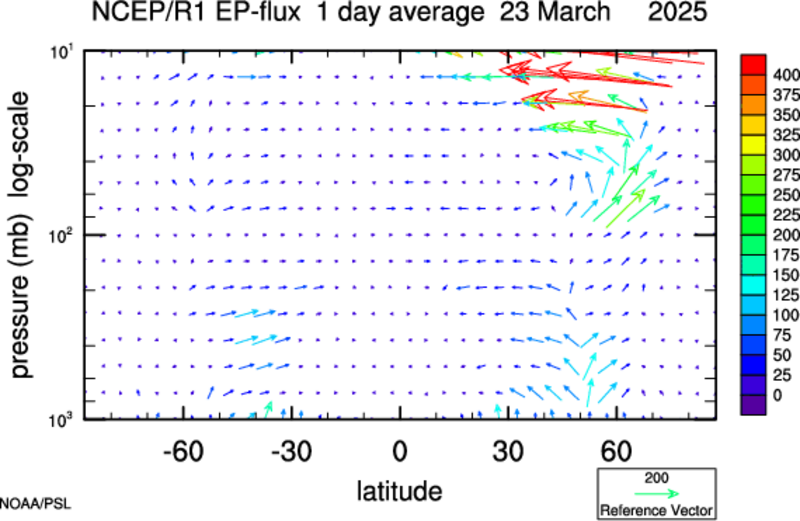
Quasi-geostrophic Eliassen Palm flux on the sphere are computed from daily-averaged values of wind and temperature taken from the NCAR/NCEP Reanalysis hosted at ESRL/PSL. The EP-Flux vectors have been scaled for display purposes. Contours show the value of EP Flux divergence. Areas of EP-Flux convergence, and hence of westerly deceleration shown by solid lines. Note that vectors above 100mb will be multiplied by a scale factor which you can change.
*Calculate divergence
Setting this to "On" will calculate and plot
contours of the EP-Flux divergence on the same plot as the EP Flux
vectors. "Off" will only plot the EP Flux vectors.
"Show Acceleration". Plots the acceleration of the zonal wind instead
of the divergence of EP Flux. The difference between the two is a
factor of a*cos(latitude).
**Scale by Square Root
Scales the EP Flux vectors for display by a
factor proportional to the square-root of pressure. This is done in
order to enhance visibility of vectors in the stratosphere.
- EP Fluxes were generated courtesy of code written by Joe Barsugli.
- Code to calculate and plot the EP Flux data was written in NCL: NCAR's command language which is made freely available.. You may download our EP Flux code
- Documentation describing EP Flux available in PDF and DOC.
This is a Research and Development Application