")
About
This page is intended for members of the FEWS NET science community. The goal here is to document NOAA's ongoing progress toward the following:
1. Development of the multi-generational global Reference Evapotranspiration (ET0) dataset, including: <link>
- a) development of ET0 from MERRA2 (native, coarse-resolution data), <link>
- b) verification of native-resolution ET0 data, <link>
- c) downscaling to 0.125° (fine-resolution data), and <link>
- d) potential improvements to downscaling procedure. <link>
2. Distribution of the multi-generational global Reference Evapotranspiration (ET0) dataset, at multiple resolutions: <link>
- fine scale (0.125°),
- coarse-scale (0.5° x 0.625°).
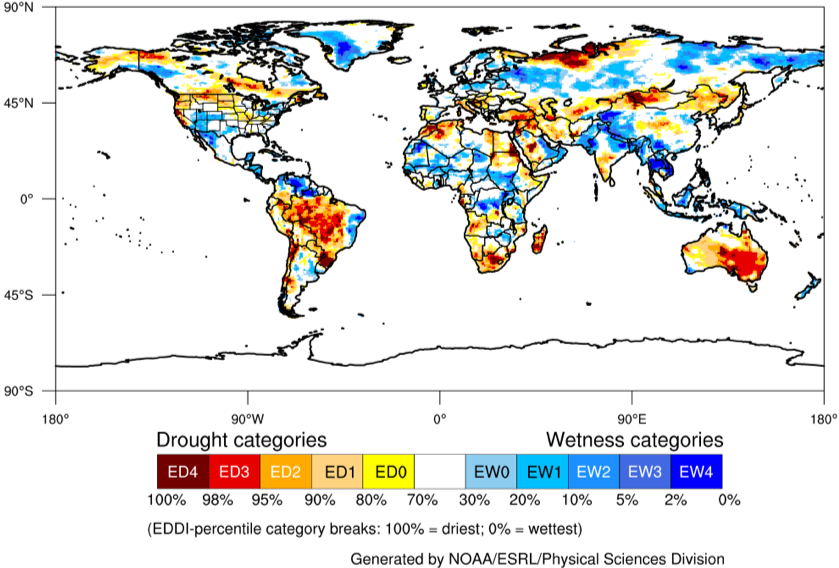
3. Distribution of the experimental global Evaporative Demand Drought Index (EDDI), in two formats: <link>
- raw data in flat ascii files,
- context-enhanced maps,
and at various timescales:
- dekadal (10-day) at the end of each dekad, and
- 1- to 12-monthly at the end of each month.
1. Developing the multi-generational global reference evapotranspiration (ET0) dataset:
1.a. Development of coarse-resolution ET0 from MERRA2:
The data set currently employed by FEWS NET for their ET0 estimations – based on GDAS drivers – was verified by Senay et.al. (2008), using weather station data from the California Irrigation Management Information System (CIMIS). In order to facilitate inter-study comparisons with FEWS NET’s current ET0 estimates, by Senay et al. (2008) using GDAS in the ASCE hourly version of the Penman-Monteith equation, we use the daily version of ASCE’s formula, taking the form:
.png)
We assume G = 0 in Eqn 1. The constant values 900 [K.mm.s3/Mg/day] and 0.34 [s/m] reflect the ASCE values assuming the short reference crop (0.12-m grass), and 0.23 is the albedo [dimensionless].
.png)
.png)
.png)
.png)
Eqns 1 - 5 are driven by the following five variables, all provided by MERRA2:
- T, 2-m air temperature [°C; from MERRA2 variable T2M],
- q, 2-m specific humidity [kg/kg; from QV2M],
- Rs, surface downward short wave radiation [W/m2; from SWGDN],
- U2, 2-m wind speed at 2 m height [m/s; from 10-m orthogonal wind vectors U2M and V2M], and
- P, surface atmospheric pressure [kPa; from PS].
The equation for es deviates from ASCE convention, where it takes the form:
.png)
where Tmax and Tmin are the daily maximum and minimum temperatures, respectively. Since the MERRA2 data set only provides daily mean temperature T, we use the form in Eqn 4. On the other hand, our verification dataset (GSOD) provides daily Tmax and Tmin, so instead of using the ASCE (2005) convention, for consistency we estimated the daily average T by calculating the average of the two values:
.png)
and subsequently used Eqn 4.
The MERRA2 reanalysis provides all five required variables at a 0.5° lat x 0.625° long resolution.
1.b. Verification of native resolution ET0 data:
So far, we have conducted a preliminary verification of the ET0 reanalysis against station-based ET0 "observations" across Africa. These are not true observations of ET0; rather they are synthesized using the equations above (section 1a) driven by observations of T, U2, and q from Global Summary of the Data (GSOD) stations and Rs from the Global Land Data Assimilation System v 2.1 at a 1° lat/long resolution but linearly interpolated to the GSOD station locations. Spatially distributed and downscaled ET0 estimates derived from MERRA2 are compared with these (mostly) station-based ET0 estimates (hereafter referred to as GSOD) to test the performance of MERRA2 both regionally and seasonally. MERRA2 ET0 values are extracted by linear interpolation to the daily GSOD station coordinates. The comparison uses moving-mean plots of spatially averaged daily ET0 versus time, and scatter plots, the latter allowing for determination of r2-values and linear fitting parameters.
Although GSOD provides daily mean station pressure, we follow the ASCE (2005) method of estimating the atmospheric pressure P using station elevation z according to:
.png)
Furthermore, as q is not included in the GSOD dataset we derive it from the dew-point temperature Tdew, a quantity provided by the dataset, and surface atmospheric pressure P, using:
.png)
where ea is from:
.png)
Using GLDASv2.1 limits our verification of MERRA2 ET0 to the period 1980-2000.
Eqn 1 requires wind speeds at 2 m above the surface, U2. Measurements performed at a different heights can be converted to approximate a 2-m wind speed using the following equation from ASCE (2005):
.png)
GSOD, however, does not specify any anemometer height, introducing an uncertainty in the value for our U2 input to GSOD-derived ET0. In order to constrain this uncertainty, we contacted the meteorological institutes of many African countries to try to ascertain anemometer heights used at their weather stations. Contact information is, however, very limited for many countries, and many times we did not get a response. The four countries that did respond--South Africa, Algeria, Kenya and Tanzania--all informed us that they use a 10-m anemometer height pursuant to WMO specifications. It seems therefore a fair assumption that most other countries also use the same convention. For stations not located in one of the four countries with known anemometer height, we calculate ET0 twice: once with the assumption that wind speeds are measured at 2 m (i.e., we use the GSOD value as is), and another time with the assumption of 10-m anemometer heights. From Eqn 11, we know that U2 ≈ 0.75 U10![]() .
.
Figure 1 shows the spatial and temporal characteristics of the number of GSOD weather stations in Africa. It can be seen that, although the number of reporting stations can vary strongly from one day to another, the number of stations has significantly increased since the beginning of the year 2000. Globally (not shown in the figure), the total amount of station is over 9000. For reasons unknown to the authors, the GSOD data set contains some days where the number of stations suddenly drops dramatically, with a lowest station count of 25 on September 9, 2013. The spatial map shows that South Africa and Algeria have the highest density of stations, whereas most of the Sahel region, Central Africa and the Horn of Africa are poorly represented. Throughout this work, Africa is divided into five regions, as shown in Figure 1, in order to compare the performance of MERRA2 on a regional basis.
.png)
.png)
1.c. Downscaling to fine-resolution (0.125°) ET0 data:
Daily ET0 surfaces are spatially downscaled to 0.125° x 0.125°, using climatological monthly potential evaporation (PET) estimates from the International Water Management Institute (IWMI). Fine-scale IWMI pixels are averaged spatially to the extent of the encompassing MERRA2-derived ET0 pixel (a block of 4 x 5 0.125-degree IWMI pixels to each 0.5 x 0.625-degree MERRA2 pixel) to derive a coarse-scale IWMI estimate at the same spatial resolution of the MERRA2-derived ET0. The ratio of the fine-scale :: coarse-scale IWMI PET is applied at the fine-scale 0.125-deg resolution to the MERRA2-derived ET0 to provide a fine-scale (0.125-degree) MERRA2-derived ET0.
This simple downscaling procedure is dissatisfying: it introduces no fine-scale temporal variability and so does nothing to enhance the performance of EDDI even going to finer scales.
1.d. Potential improvements to downscaling procedure:
As an improvement to the IWMI-based downscaling outlined above, an upcoming alternative is to downscale each driver in anomaly space, and then reconstruct the fine-scale ET0 from the fine-scale drivers.
First, we define anomalies for each response or driver variable, i.e., X = {ET0, T, q, U2, Rd}, as:
.png)
where Xf is the value of variable X at the fine scale, and Xc is the value of X at the coarse scale. Clearly, each parent pixel at Xc will have multiple child pixels with a range of Xf values.
The anomaly in ET0 is also defined as the sum of the four drivers' contributions, themselves the product of the sensitivity of ET0 to the driver (∂ET0/∂X) and the anomaly in the driver, or:
.png)
What we seek is fine-scale ET0 (ET0f), so we need to solve:
.png)
or, in more detail:
.png)
where every term on the right-hand side of Eqn 15 is known, as follows:
- ET0c is derived from Penman-Monteith driven by {Tc, qc, U2c, Rdc} from MERRA2.
- Tf, qf, U2f, Rdf are derived by downscaling, as follows:
- Tf is derived by applying a lapse rate (γ) to Tc according to the anomaly in elevation (z) from the coarse- and fine-scale grids:
.png)
-
- qf, U2f, Rdf are derived by budget downscaling of qc, U2c, Rdc
- Sensitivity expressions (∂ET0/∂X
 ) are derived from partial differentiation of the Penman-Montieth equation with respect to each variable X, and are provided in Hobbins (2016). They can be evaluated for each day of the year from climatological means of either the fine-scale Xf or coarse-scale Xc.
Needs:
- elevation grid (from MERRA2) for zc
- elevation grid (from a fine-scale source) for zf
- budget downscaling software / access to LIS
- GSOD assimilation (pre or post-downscaling?)
Advantages:
- conservative
- temporal variability gained at fine scale
- physically based
- no latency introduced (beyond that of MERRA2)
Disadvantages:
- processing time?
- disk space?
2. Access to the multi-generational global ET0 dataset:
The archive of NOAA-Physical Science Division's global reference evapotranspiration (ET0) reanalysis is freely available to all from here: https://downloads.psl.noaa.gov/Projects/RefET/global/. This directory structure contains ET0 data and imagery for multiple generations of the reanalysis, from January 1, 1980 to the near-present across the globe. Data are daily depths of reference evapotranspiration (ET0; mm) for the indicated date.
Generation-0 ET0 reanalysis: this generation has been created as outline above in steps 1(a) through 1(c), and is located here: https://downloads.psl.noaa.gov/Projects/RefET/global/Gen-0/. This directory structure contains the following two subdirectories:
- /coarse_resolution/ for the coarse-resolution daily ET0 data. Contains two subdirectories /data_v1/ and /data_v2/, each divided into annual subdirectories /1980/ … /2018/, each containing a year (complete prior to 2018) of daily, coarse-resolution ET0 data for short and long reference crops, estimated using the ASCE Standardized Reference Evapotranspiration Equation forced by MERRA2 drivers. Briefly the reanalysis specs are as follows:
- File format: NetCDF,
- Filenames indicate date: e.g., ETos_19801215.nc contains ETos data for December 15, 1980,
- Units: mm,
- Temporal resolution: daily,
- Spatial resolution: 0.5° lat X 0.625° long,
- ETrs: long-crop ET0, i.e., for 0.5-m alfalfa,
- ETos: short-crop ET0, i.e., for 0.12-m grass.
- The difference between the data in /data_v1/ and /data_v2/ is an improved daily wind speed estimation in v2.
- /fine_resolution/ for the fine-resolution daily ET0 data--downscaled from the coarse-resolution data and masked to land areas. The reanalysis specs are similar to those listed above for the coarse-resolution data, except:
- Filenames indicate fine resolution and date: e.g., ETos_fine_19801215.nc contains fine-scale ETos data for December 15, 1980,
- Spatial resolution: 0.125° lat X 0.125° long.
Generation-1 ET0 reanalysis: this generation will have the GSOD/GLDASv2.1 station data (currently used as verification in step 1(b) above) assimilated into it, and have an improved downscaling procedure. It is yet to come.
3. Access to the experimental global Evaporative Demand Drought Index (EDDI):
The archive of the global Evaporative Demand Drought Index (EDDI; Hobbins et al. 2016, McEvoy et al. 2016) service is freely available to all from here: https://downloads.psl.noaa.gov/Projects/EDDI/global_archive/. This directory structure contains EDDI imagery (/images/) and data (/data/) from January 1, 1980 to the near-present across the globe, based on the fine-scale (0.125°), Generation-0, tall-crop reference evapotranspiration (ETrs) reanalysis listed above. Data are EDDI values (and images are mapped EDDI values) for the timescale prior to the indicated date.
- All files--data and images--are arranged in annual subdirectories /1980/ ... /2018/.
- Available timescales are as follows:
- dekadal (~10-day) EDDI at the end of each dekad (1st dekad = 10th day of month, 2nd = 20th, 3rd = last day),
- 1- to 12-monthly EDDI at the end of each month.
- Filenames indicate timescale and date: e.g., EDDI_ETrs_02dk_19801220.asc is the dekadal EDDI data file for the 10-day period ending December 20, 1980.
- Data files are currently stored in ascii format, starting in the northwest corner, reading west to east (left to right across each row), and then southwards (downwards). The coordinated system is geographic. With the addition of the following six header lines preceding the data, these files would be directly importable into ArcGIS:
ncols 2880
nrows 1440
xllcorner -90 – this line is not correct
yllcorner -90
cellsize 0.125
nodata_value -9.
- Soon, all data files will be converted to NetCDF format.
References:
- American Society of Civil Engineers (ASCE; 2005), The ASCE standardized reference evapotranspiration equation. Technical Committee report to the Environmental and Water Resources Institute of the American Society of Civil Engineers from the Task Committee on Standardization of Reference Evapotranspiration. Reston, Va.: ASCE Water Resources Institute, 173 pp. <link>
- Hobbins, M.T. (2016), The variability of ASCE Standardized Reference Evapotranspiration: a rigorous, CONUS-wide decomposition and attribution. Transactions of the ASABE, 59(2): 561-576, doi:10.13031/trans.59.10975. <link>
- Hobbins, M.T., A.W. Wood, D.J. McEvoy, J.L. Huntington, C.G. Morton, M.C. Anderson, and C.R. Hain (2016), The Evaporative Demand Drought Index: Part I - Linking drought evolution to variations in evaporative demand. Journal of Hydrometeorology, 17: 1745–1761, doi:10.1175/JHM-D-15-0121.1. <link>
- McEvoy, D.J., J.L. Huntington, M.T. Hobbins, A.W. Wood, C.G. Morton, M.C. Anderson, and C.R. Hain (2016), The Evaporative Demand Drought Index: Part II - CONUS-wide assessment against common drought indicators. Journal of Hydrometeorology, 17: 1763–1779, doi:10.1175/JHM-D-15-0122.1. <link>
- Senay, G.B., J.P. Verdin, R. Lietzow, and A.M. Melesse (2008), Global daily reference evapotranspiration modeling and evaluation. Journal of the American Water Resources Association, 44(4): 969–979, doi:10.1111⁄j.1752-1688.2008.00195.x. <link>
Status
Check here for the latest developments regarding the status of the global ETo reanalysis and derived EDDI service.
The two latest advances to report are that the improved version (v2) of the Generation-0 global ET0 reanalysis mentioned below (October 26) has been automated and has a "leading edge" of data driven by MERRA-2 data that has yet to be released on the NASA GES DISC (early access to which has been granted by NASA), and that significantly cuts down the latency of data.
This version has corrected wind speed inputs (mentioned in earlier posts) and has also corrected the issues outlines in the October 26 post (i.e., it now starts on January 1, 1980 and contains February 29s). Further, this dataset now:
- updates automatically whenever further drivers are released on the NASA GES DISC (latest data are for October 31, 2018, at time of writing),
- has attached at the leading edge (i.e., partially filling the latency gap between today and when the latest MERRA-2 drivers were released) data derived from pre-release MERRA-2 drivers. These data are denoted by the suffix "_pre", as in "ETos_20181119_pre.nc" for leading-edge data for November 19, 2018. The addition of these data at the leading edge cuts the latency gap down to about 12 days.
- has been downscaled to 0.125º lat and long,
- the coarse-resolution data (at the MERRA-2 native resolution of 0.5º lat X 0.625º long) are available here: /data_v2/ .
- the fine-resolution data are available here: /data_v2/.
The "leading-edge" data will automatically be over-written as and when new MERRA-2 drivers are officially released on the NASA GES DISC; they ("leading-edge" data) will not be archived.
The previous version of the ET0 reanalysis now resides in /data_v1/, and will no longer be updated.
These latest advances are liable to teething issues. Please bear with me and report any problems.
An improved version (v2) of the Generation-0 global ET0 reanalysis has been generated and hosted here: /data_v2/. This version has the corrected wind speed inputs. Issues with this new reanalysis relate to:
- started on January 1, 1981 (v1 started on January 1, 1980),
- it contains no February 29s,
- it is only available up to August 31, 2018.
These issues will be resolved after November 4, 2018.
The previous version of the ET0 reanalysis now resides in /data_v1/, and will no longer be updated.
The new version (v2) has not yet been downscaled. This should start after November 4, 2018.
The global ET0 reanalysis has completed running for the period for which the corrected wind speed data are available, i.e., January 1, 1981 to August 6, 2018. They are not yet posted to the ftp site.
I am re-running the global ETo reanalysis to account for the error in the wind fields described in the previous blog entry.
Amy McNally and Daniel Sarmiento of NASA GSFC are providing corrected daily wind vectors, and I've been regenerating the reanalysis using these corrections. The new, wind-corrected data are not yet available, but I plan on replacing all the ETo reanalysis stored here (https://downloads.psl.noaa.gov/Projects/RefET/global/) with the new data over the next few days.
I will post here when these new data are in place. The old wind-incorrect reanalysis will still be available for those who desire it, but they won't be hosted on the ftp site.
There is an error in the wind fields as downloaded from MERRA-2. Briefly, NASA stores the wind data for MERRA-2 as orthogonal U and V vectors of 10-m wind velocity (U10M and V10M). In aggregating up to daily data prior to download from the NASA GES DISC, each of these vector components is summed across a day, with the potential of wind reversals within a day "canceling each other out," thereby underestimating daily U10M and V10M. Converting these underestimated daily net U10M and V10M to daily wind speeds [speed = sqrt(U10M^2 + V10M^2)] leads to daily wind speeds being underestimated, ultimately leading to an underestimate of ETo.
ETo reanalysis updated to August 12, 2018.
ETo reanalysis updated to July 31, 2018.
This blog will track the latest and ongoing developments on both the global reference ET (ETo) reanalysis and the global Evaporative Demand Drought Index (EDDI) service developed from it.
Entire ETo reanalysis re-run to correct for net longwave radiation, to January 31, 2017.