Multivariate ENSO Index (MEI)
The views expressed are those of the author and do not necessarily represent those of NOAA.
| Click to enlarge |
 |
Outline for MEI webpage (updated on December 7th, 2018)
This webpage consists of seven main parts, three of which are updated every month:
1. A short description of the Multivariate ENSO Index (MEI);
2. Historic La Niña events since 1950;
3. Historic El Niño events since 1950;
4. MONTHLY UPDATED MEI loading maps for the latest season;
5. MONTHLY UPDATED MEI anomaly maps for the latest season;
6. MONTHLY UPDATED Discussion of recent conditions;
7. Publications and MEI data access.
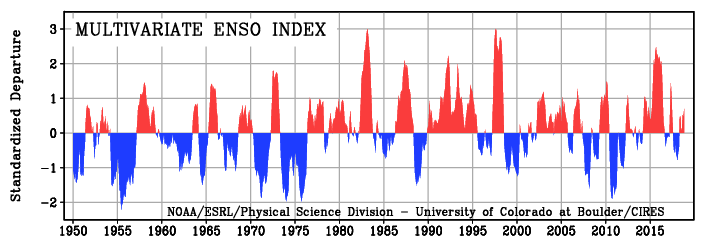
El Niño/Southern Oscillation (ENSO) is the most important coupled ocean-atmosphere phenomenon to cause global climate variability on interannual time scales. Here we attempt to monitor ENSO by basing the Multivariate ENSO Index (MEI) on the six main observed variables over the tropical Pacific. These six variables are: sea-level pressure (P), zonal (U) and meridional (V) components of the surface wind, sea surface temperature (S), surface air temperature (A), and total cloudiness fraction of the sky (C). These observations have been collected and published in ICOADS for many years. The MEI is computed separately for each of twelve sliding bi-monthly seasons (Dec/Jan, Jan/Feb,..., Nov/Dec). After spatially filtering the individual fields into clusters (Wolter, 1987), the MEI is calculated as the first unrotated Principal Component (PC) of all six observed fields combined. This is accomplished by normalizing the total variance of each field first, and then performing the extraction of the first PC on the co-variance matrix of the combined fields (Wolter and Timlin, 1993). In order to keep the MEI comparable, all seasonal values are standardized with respect to each season and to the 1950-93 reference period.
IMPORTANT CHANGE: The MEI used to be updated every month during the first week of the following month based on near-real time marine ship and buoy observations (courtesy of Diane Stokes at NCEP). However, this product has been discontinued as of March 2011 (ICOADS-compatible 2-degree monthly statistics). Instead, the MEI is now being updated using ICOADS throughout its record. The main change from the previous MEI is the replacement of 'standard' trimming limits with 'enhanced' trimming limits for the period from 1994 through the current update. This leads to slightly higher MEI values for recent El Niño events (especially 1997-98 where the increase reaches up to 0.235 standard deviations), and slightly lower values for La Niña events (up to -.173 during 1995-96). The differences between old and new MEI are biggest in the 1990s when the fraction of time-delayed ship data that did not enter the real-time data bank was higher than in more recent years. Nevertheless, the linear correlation between old and new MEI for 1994 through 2010 is +0.998, confirming the robustness and stability of the MEI vis-a-vis input data changes. Caution should be exercised when interpreting the MEI on a month-to-month basis, since the MEI has been developed mainly for research purposes. Negative values of the MEI represent the cold ENSO phase, a.k.a.La Niña, while positive MEI values represent the warm ENSO phase (El Niño).
NEWSFLASH: Processing of ICOADS was delayed by more than three weeks in December 2016. We are working with NCEI to reduce the risk of similar delays in the future. Subsequent updates for monthly data have typically become available before the 10th of the month, so I have been able to update by about the 10th in most cases.
IMPORTANT ADDITION: For those interested in MEI values before 1950, a 'sister' website has now been created that presents a simplified MEI.ext index that extends the MEI record back to 1871, based on Hadley Centre sea-level pressure and sea surface temperatures, but combined in a similar fashion as the current MEI. Our MEI.ext paper that looks at the full 135 year ENSO record between 1871 and 2005 is available online at the International Journal of Climatology (Wolter and Timlin, 2011).
Historic La Niña events since 1950
| Click to enlarge |
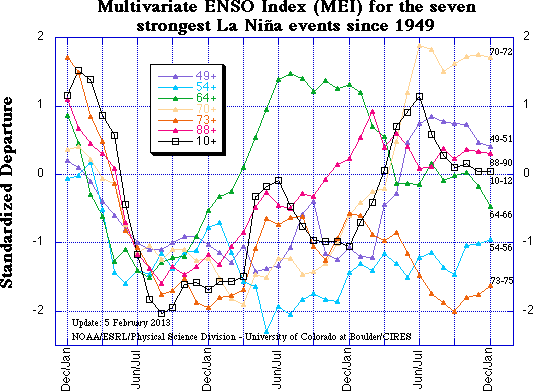 |
How does the 2010-12 La Niña event compare against the six previous biggest La Niña events since 1949? This figure includes only strong events (with at least three bimonthly rankings in the top seven), after replacing the slightly weaker 2007-09 event with 2010-12 (rankings are listed here). La Niña events have lasted up to and over three years since 1949, in fact, they do tend to last longer on average than El Niño events. The longest two events included here lasted through most of 1954-56 and 1973-75. The longest event NOT included here occurred in 1999-2001 which reached the 'strong' threshold (top seven rankings) just once. Click on the "Discussion" button below to find a comparison of recent conditions with analogous situations.
Historic El Niño events since 1950
| Click to enlarge |
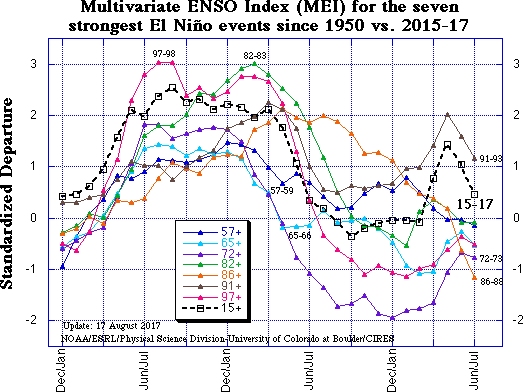 |
How does the 2015-16 El Niño event compare against the seven previous biggest El Niño events since 1950? This figure includes only strong events (with at least three bimonthly rankings in the top seven), and 2015-16 has replaced the 2009-10 event that reached the top seven ranking only twice. Visual inspection reveals that the 2015-16 event was slightly weaker than 1982-83 and 1997-98, resembling the latter more than the former in its evolution. Click on the "Discussion" button below to find a comparison of recent conditions with analogous situations.
MEI loading maps for the latest season
| Click to enlarge |
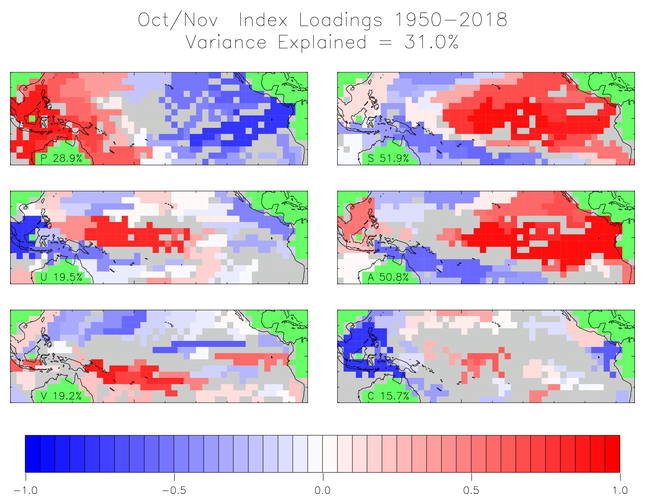 |
The six loading fields display the correlations between the local anomalies of each field and the MEI time series. Land areas as well as the Atlantic are excluded and flagged in green, while typically noisy regions with no coherent structures and/or lack of data are shown in grey. Each field is denoted by a single capitalized letter and the explained variance for the same field in the Australian corner.
The sea level pressure (P) loadings show the familiar signature of the Southern Oscillation: high pressure anomalies in the west and low pressure anomalies in the east correspond to positive MEI values, or El Niño-like conditions. Consistent with P, U has positive loadings near the dateline, corresponding to westerly anomalies along the Equator from Indonesia and the Phillippines to 140W. In contrast, significant negative loadings cover the western Maritime Continent, denoting easterly anomalies during Niño at this time of year. The meridional wind field (V) features scattered negative loadings north of the Equator across the Pacific basin, flagging the southward shift of the ITCZ so common during El Niño-like conditions, juxtaposed with strong positive loadings northeast of Australia (southerly anomalies during El Niño).
Both sea (S) and air (A) surface temperature fields exhibit the typical ENSO signature of a wedge of positive loadings stretching from the Central and South American coast to the dateline, or warm anomalies during an El Niño event. They are flanked by a horse-shoe pattern of negative loadings (cold anomalies during El Niño) to its northwest and, in particular, to its southwest. At the same time, total cloudiness (C) tends to be increased near the dateline over the central equatorial Pacific and on the northeastern flank of the South Pacific Convergence Zone (SPCZ), sandwiched in between in decreased cloudiness over Indonesia and the eastern-most equatorial Pacific.
The MEI now stands for 31% of the explained variance of all six fields in the tropical Pacific from 30N to 30S, close to its annual peak season. Twenty-one years ago, right after the MEI was introduced to the internet, the explained variance for October-November 1950-1997 amounted to almost 33%. This drop-off by almost 2% reflects the diminished coherence and importance of ENSO events over the last two decades (and/or more subtle changes in the expression of ENSO during this time of year), but is less dramatic than at other times of year. The loading patterns shown here resemble the seasonal composite anomaly fields of Year 0 in Rasmusson and Carpenter (1982).
MEI anomaly maps for the latest season
| Click to enlarge |
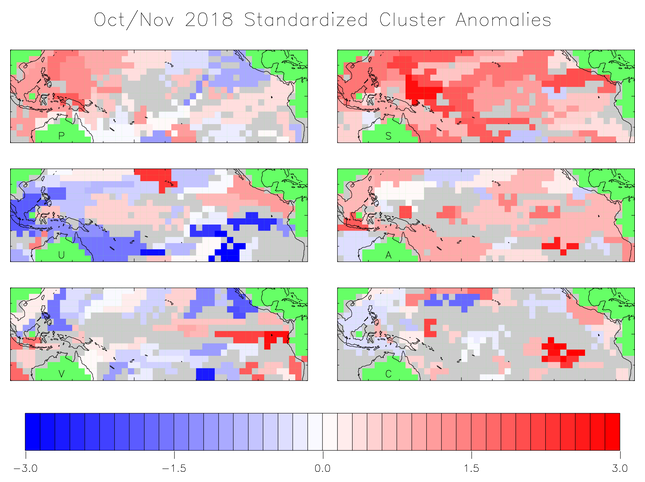 |
With the MEI showing El Niño-like conditions, four key anomalies in the MEI component fields flag El Niño, while La Niña anomalies are still found in two locations/variables, so this is not a completely settled affair. Key anomalies refer to values in excess of one standard deviation, or one sigma in support of either ENSO phase (compare to loadings figure).
Significant positive anomalies (coinciding with high positive loadings) denote anomalously high sea level pressure (P) over the Maritime Continent, and warm sea surface (S) and air temperature anomalies (A) along the Equator from the dateline to the South American coast. Significant negative anomalies (coinciding with high negative loadings) flag easterly wind anomalies (U) over the Maritime Continent.
On the other hand, there are warm temperature anomalies (S, A) northeast of Australia that still indicate lingering La Niña conditions in a region with strong warming trends over the last few decades, making it much harder to get the 'canonical' cold El Niño temperature signal in this region.
Go to the discussion below for more information on the current situation.
If you prefer to look at anomaly maps without the clustering filter (which is most limiting for the cloudiness field), check out the climate products in our map room.
Discussion and comparison of recent conditions with historic short-lived El Niño conditions and their aftermath
| Click to enlarge |
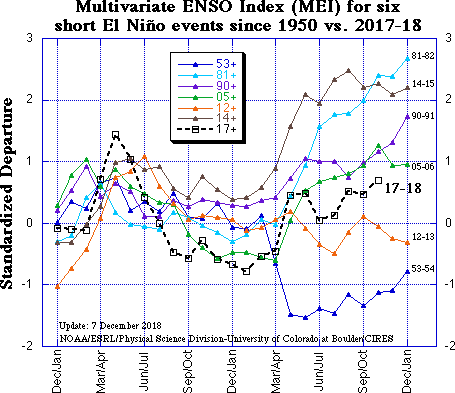 |
In the context of last year's aborted El Niño event, as well as this year's repeated attempts at crossing into El Niño territory, this section features a comparison figure with six other short-lived events during the MEI period of record. Only one of them occurred before 1980, while 2017 joined both 2014 and 2012 in a recent clustering of such events that lasted at most five bimonthly seasons, with all of them ending before September-October.
Compared to last month, the updated (October-November) MEI moved up by more than 0.2 standard deviations to reach +0.70, finally surpassing the lowest El Niño ranking. Looking at the nearest 12 rankings (+6/-6) in this season, and removing cases with one- or three-months drops rather than rises leading up to October-November, we are left with six 'analogue' years: 1963, '68, '69, '79, '03, and '04, four of which were also mentioned last month. All but two of them (1969, 2003) either remained or attained El Niño status through the following boreal winter months, with '69-70 and '03-04 hovering in high neutral conditions. This is the time of year when persistence is hard to beat - the fact that the MEI attained this status this late in the season is quite unusual, perhaps most similar to 2004.
The odds for continued El Niño conditions at least for some of the following six months has risen to about 67% (four out of six), better than last month's 50/50 odds.
Negative SST anomalies south of the Equator and towards the South American coast have decreased much further since last month, while positive SST anomalies in excess of +1C are now found all along the Equator from west of the dateline to Galapagos, as seen in the latest weekly SST map.
For an alternate interpretation of the current situation, I recommend reading the NOAA ENSO Advisory which represents the official and most recent Climate Prediction Center opinion on this subject. In its latest update (8 November 2018), ENSO-neutral conditions are diagnosed, and predicted to transition to El Niño later this year with 80% odds. The latest MEI assessment is in better agreement with this outlook than last month.
There are a number of ENSO indices that are kept up-to-date on the web. Several of these are tracked at the NCEP website that is usually updated around the same time as the MEI. Note that I am referring to the OISST.v2 data, not ERSSTv5. After a short-lived run of Niño region 3.4 SST anomalies near +0.5C in May and June 2017, this index dropped below -0.5C by November 2017 and remained in formal La Niña territory through March 2018, peaking at -0.9C in February. Since then it has taken its time to warm up, hovering near +0.3C from July through September, but jumped up to +0.9C in October and +1.0C in November. For comparison, Niño region 3 SST nurtured +0.5C anomalies from February through May 2017, dropped below -0.5C from September 2017 through March 2018 (peaking at -1.1C in January). It then warmed up all the way to +0.4C in July, but dropped below that in the following two months, only to mimic Niño 3.4 in October and November, reaching +1.0C last month as well.
For extended Tahiti-Darwin SOI data back to 1876, and timely monthly updates, check the Australian Bureau of Meteorology website. In 2017, this index oscillated around 0 through May, only to drop to -10 (-1 sigma) in June, corresponding to El Niño conditions for just one month, rose back up to +8 in July, continued between +3 and +9 through October, hit +12 in November, the highest value since September 2016, flagging the strongest La Niña conditions for that event, only to yoyo back to -1 in December, and back up to +9 in January, -6 in February, all the way up to +11 in March, its final La Niña peak for the last event. Since then it declined steadily and reached -6 by June 2018, a hick-up to +2 in July, back down to -7 in August, and finally to -10 in September. True to form, it jumped back up to +3 in October 2018, and remained right at 0 in November. In sum, the SOI is back to wild fluctuations that do not really match any other ENSO index on a monthly basis.
Now for the big news: I will be retiring from my position at the end of December 2018. The future of the MEI is not settled yet, stay tuned, it will be announced on this website. If it continues in some fashion, it will probably be updated less frequently, and based on reanalysis data rather than ICOADS. Daily updates of the ENSO status can be found at the TAO/TRITON website, showing moderate warm SST anomalies (+1C or higher from 160E to 90W along the Equator, and recently building westerly wind anomalies from the dateline to 150W along and north of the Equator. This confirms the increased likelihood of El Niño conditions in the near future.
MEI data access and publications
You can find the numerical values of the MEI timeseries under this link, and historic ranks under this related link.
If you have trouble getting the data, please contact me under (Klaus.Wolter@noaa.gov)
You are welcome to use any of the figures or data from the MEI websites, but proper acknowledgment would be appreciated. Please refer to the (Wolter and Timlin, 1993, 1998) papers below (available online as pdf files), and/or this webpage.
In order to access and compare the MEI.ext against the MEI, go here.
Publications
- Rasmusson, E.G., and T.H. Carpenter, 1982: Variations in tropical sea surface temperature and surface wind fields associated with the Southern Oscillation/El Niño. Mon. Wea. Rev., 110, 354-384. Available from the AMS.
- Wolter, K., 1987: The Southern Oscillation in surface circulation and climate over the tropical Atlantic, Eastern Pacific, and Indian Oceans as captured by cluster analysis. J. Climate Appl. Meteor., 26, 540-558. Available from the AMS.
- Wolter, K., and M.S. Timlin, 1993: Monitoring ENSO in COADS with a seasonally adjusted principal component index. Proc. of the 17th Climate Diagnostics Workshop, Norman, OK, NOAA/NMC/CAC, NSSL, Oklahoma Clim. Survey, CIMMS and the School of Meteor., Univ. of Oklahoma, 52-57. Download PDF.
- Wolter, K., and M. S. Timlin, 1998: Measuring the strength of ENSO events - how does 1997/98 rank? Weather, 53, 315-324. Download PDF.
- Wolter, K., and M. S. Timlin, 2011: El Niño/Southern Oscillation behaviour since 1871 as diagnosed in an extended multivariate ENSO index (MEI.ext). Intl. J. Climatology, 31, 14pp., 1074-1087. Available from Wiley Online Library.
Questions about the MEI and its interpretation should be addressed to:
(Klaus.Wolter@noaa.gov),
(303) 497-6340.