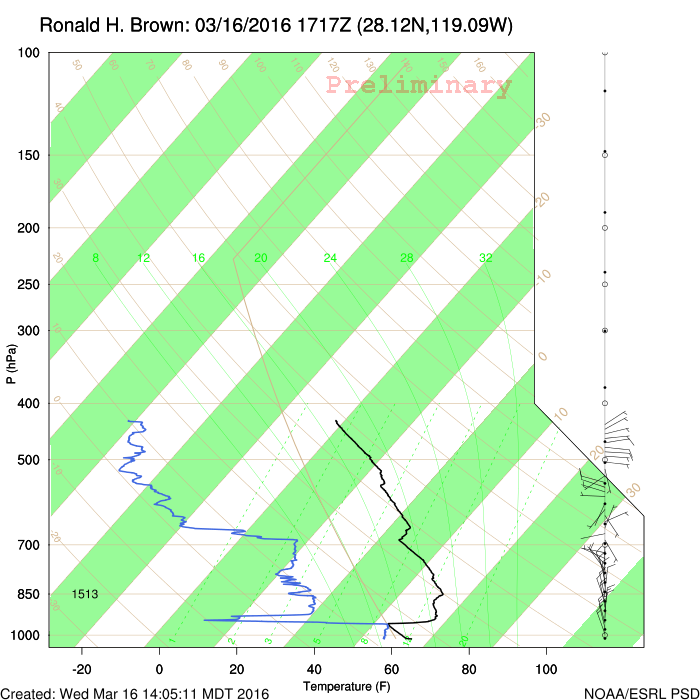
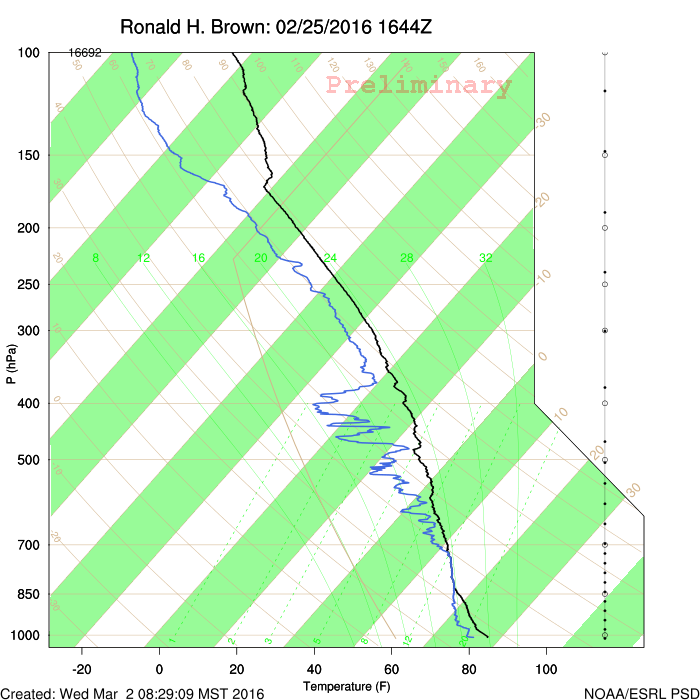
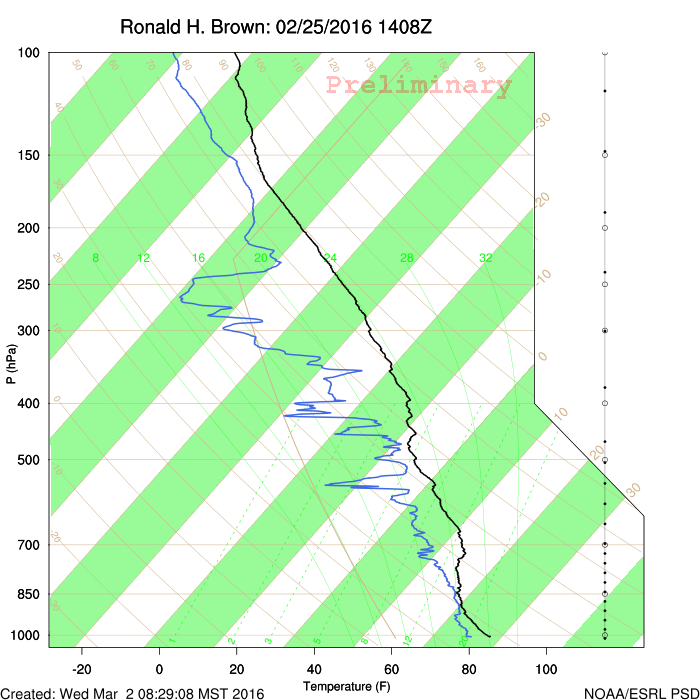
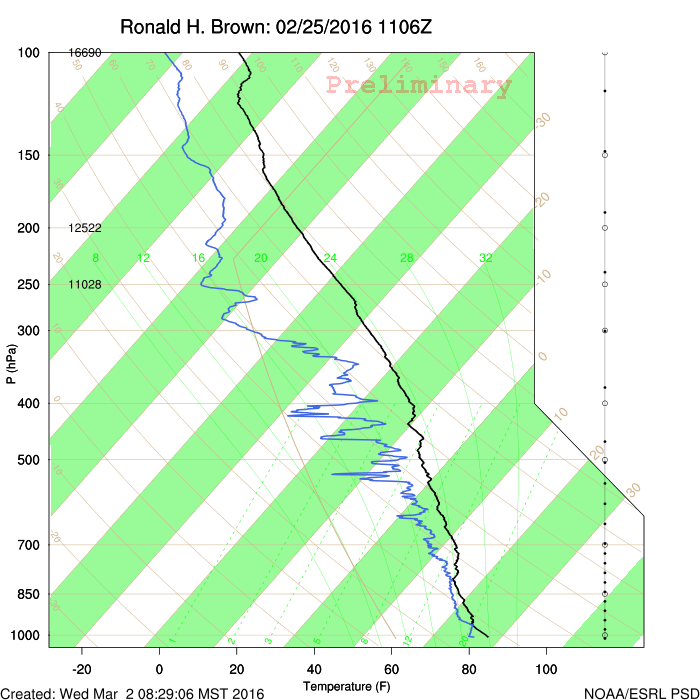
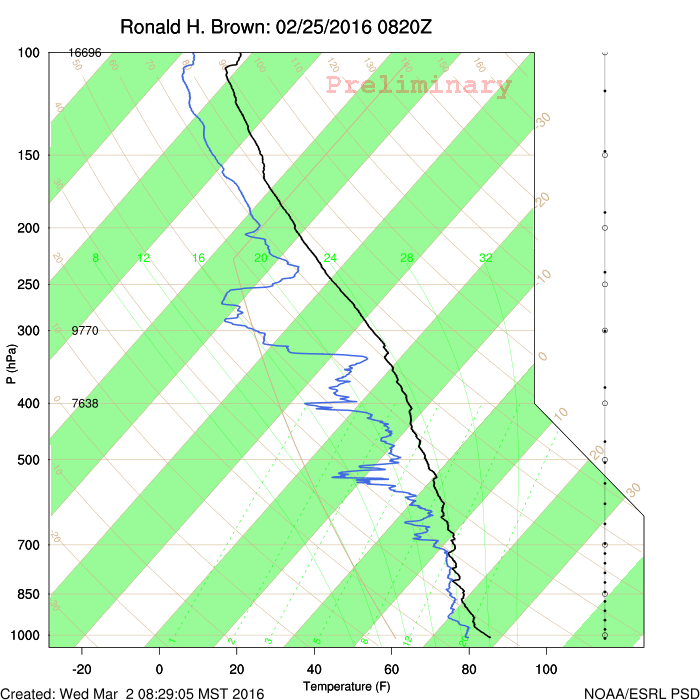
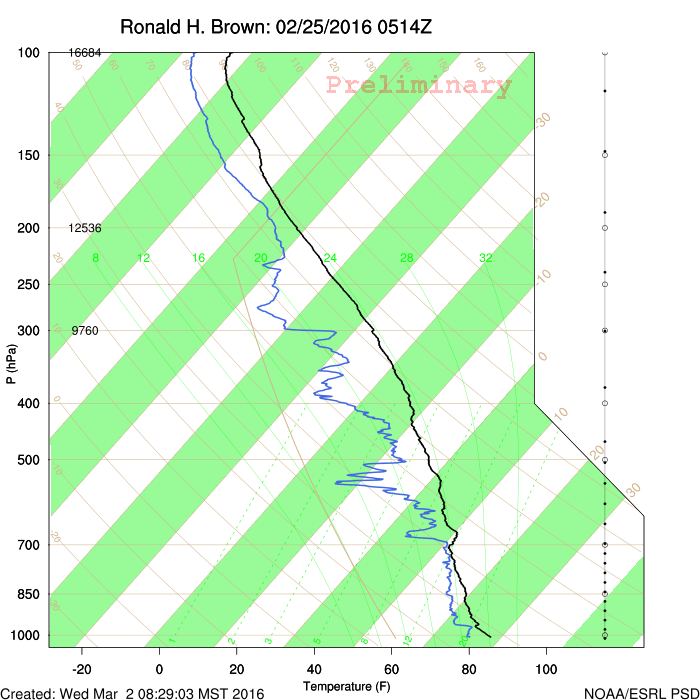
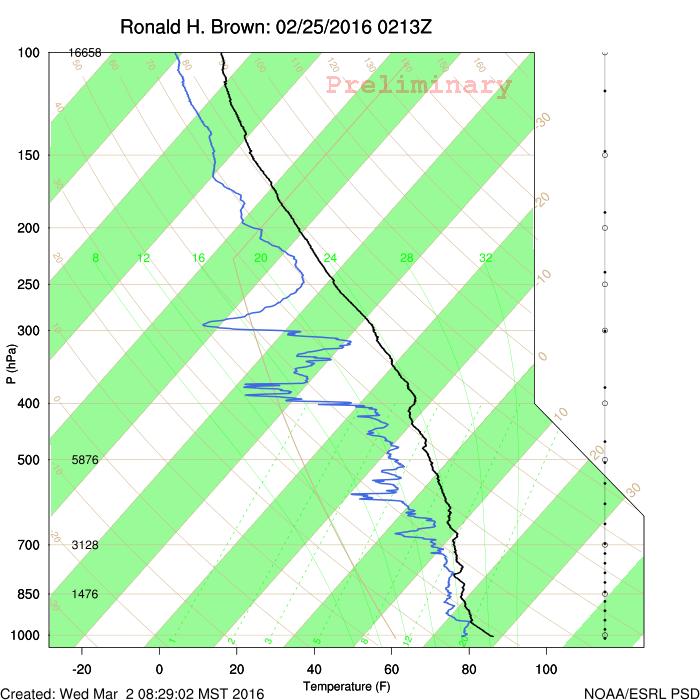
List of skew T plots for NOAA Research Ship Ronald H. Brown
Plots show the ascending and descending data collected by the weather balloons. Data have not been quality controlled, and are to be considered preliminary. File names contain the string 2016MMDDHHNN (MM=Month, DD=Day, HH=Hour, NN=Minute). This is the launch time (UTC). Sondes with "wtec" in the title are from a different sonde output (non-research) and do not record the down portion. You can look at the position of the ship (new!).
Information on radiosondes is available from the NWS. Find out how to read a skewT plot.