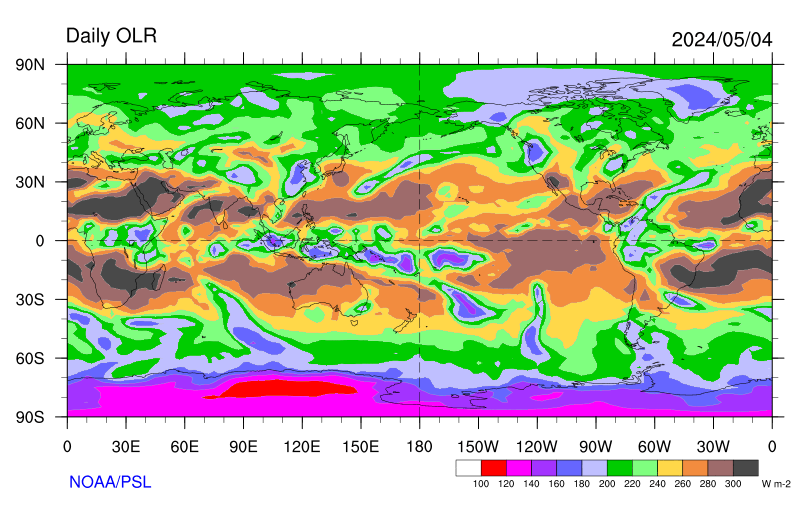
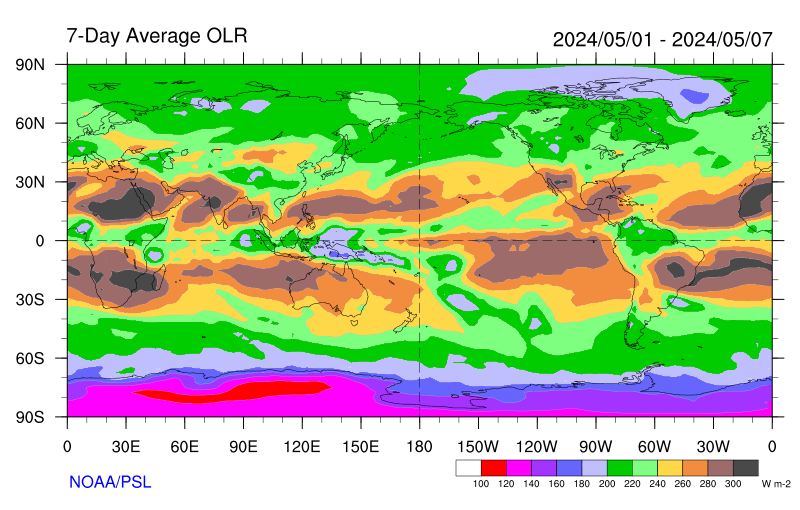
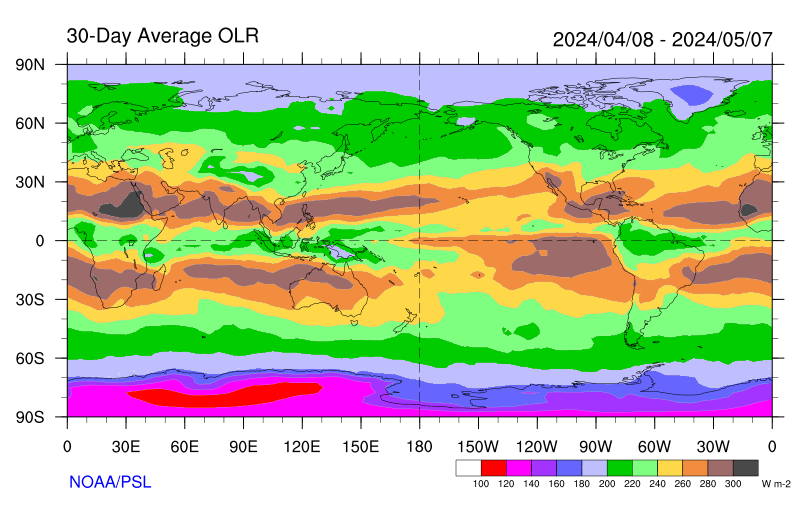
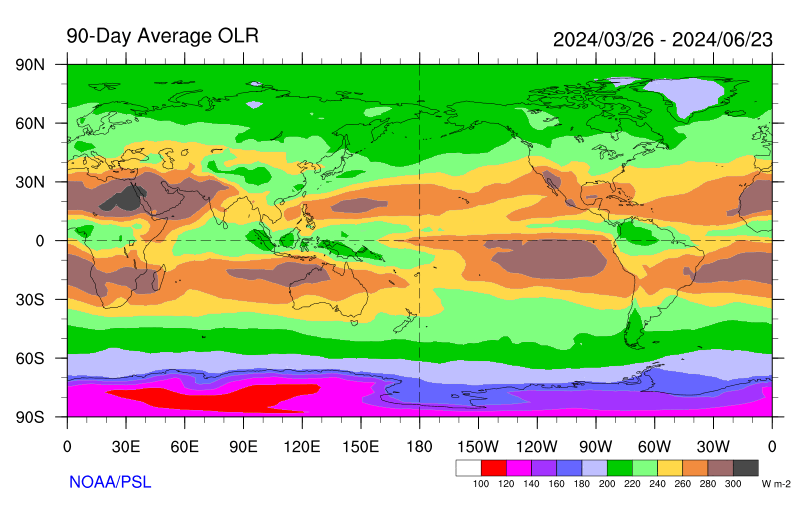
PSL Map Room - Outgoing Longwave Radiation (OLR)
These graphical products are not guaranteed to be updated on a regular basis. They are intended to serve as examples of our ongoing work. You are free to use and distribute these images, but we request that you acknowledge PSL when you do use them. Please read the disclaimer page for additional information, including how to cite this work.
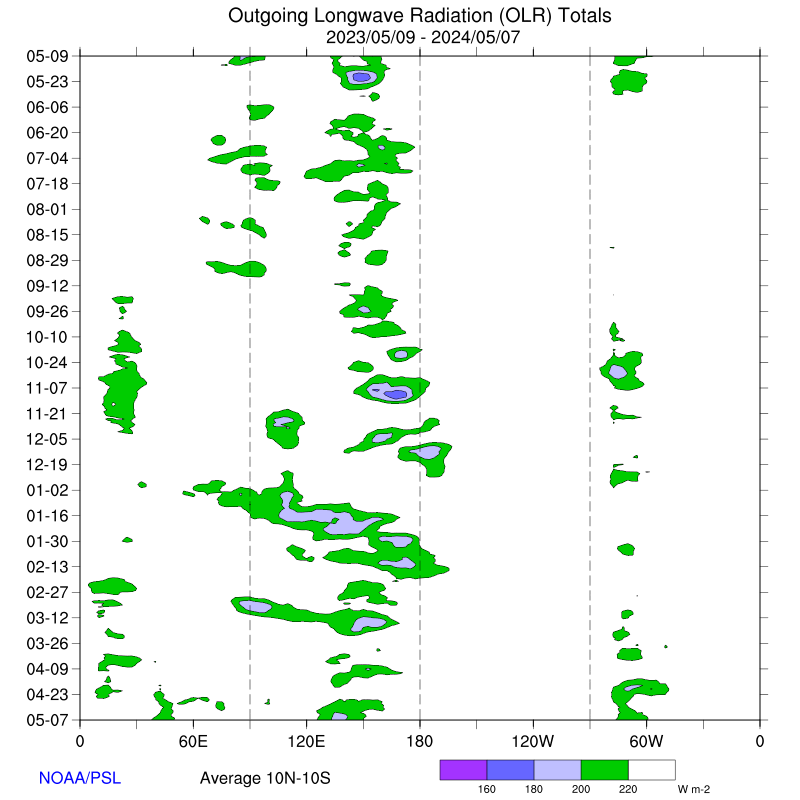
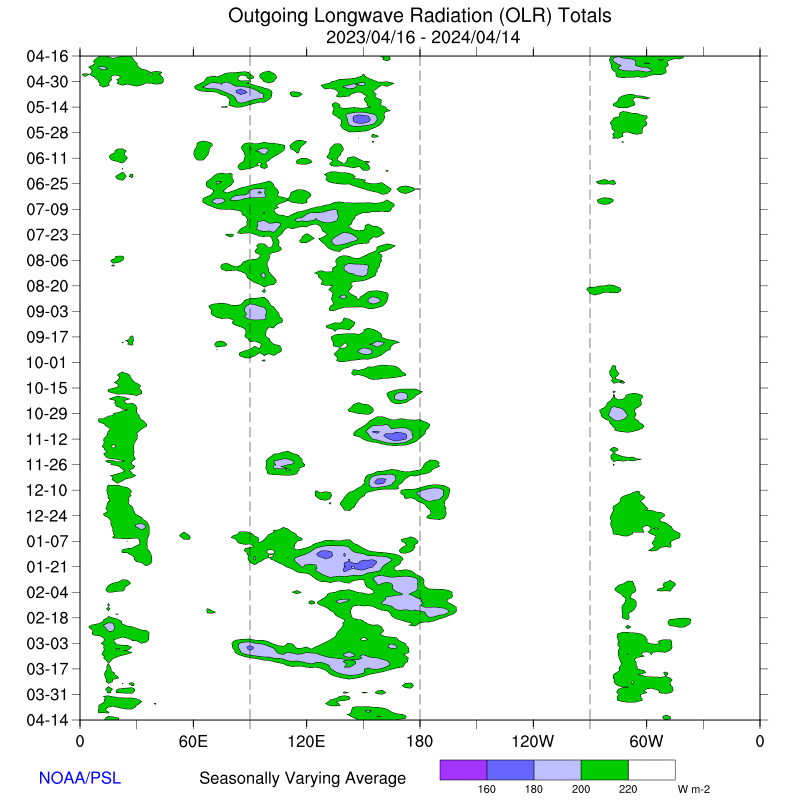
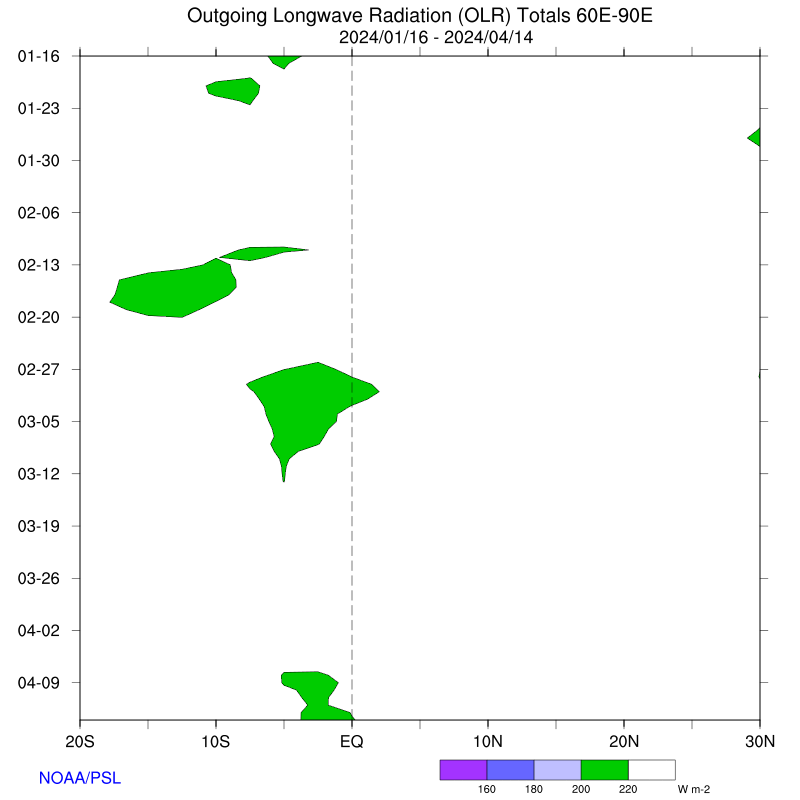
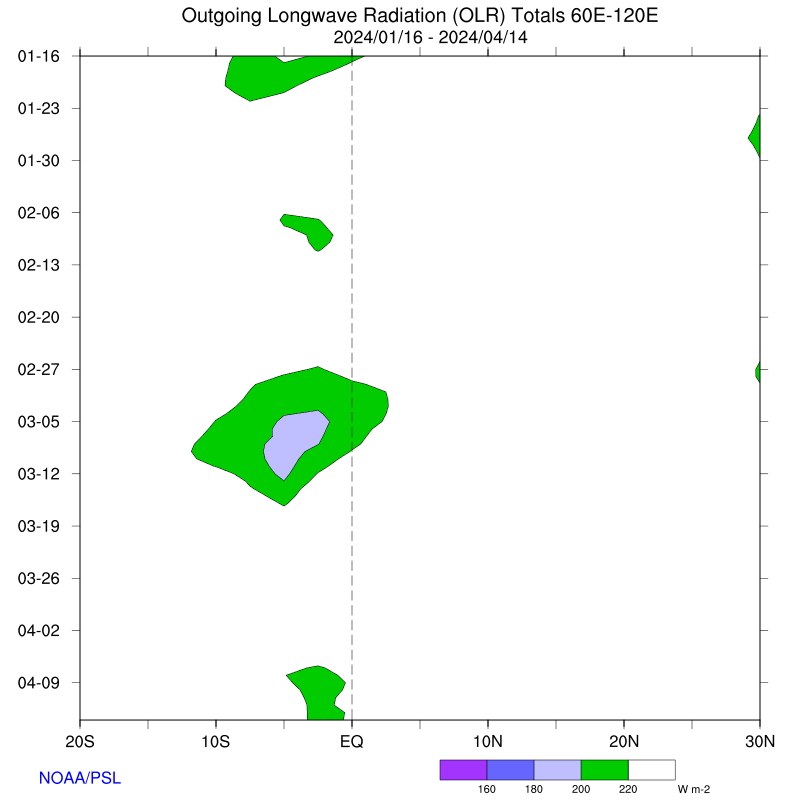
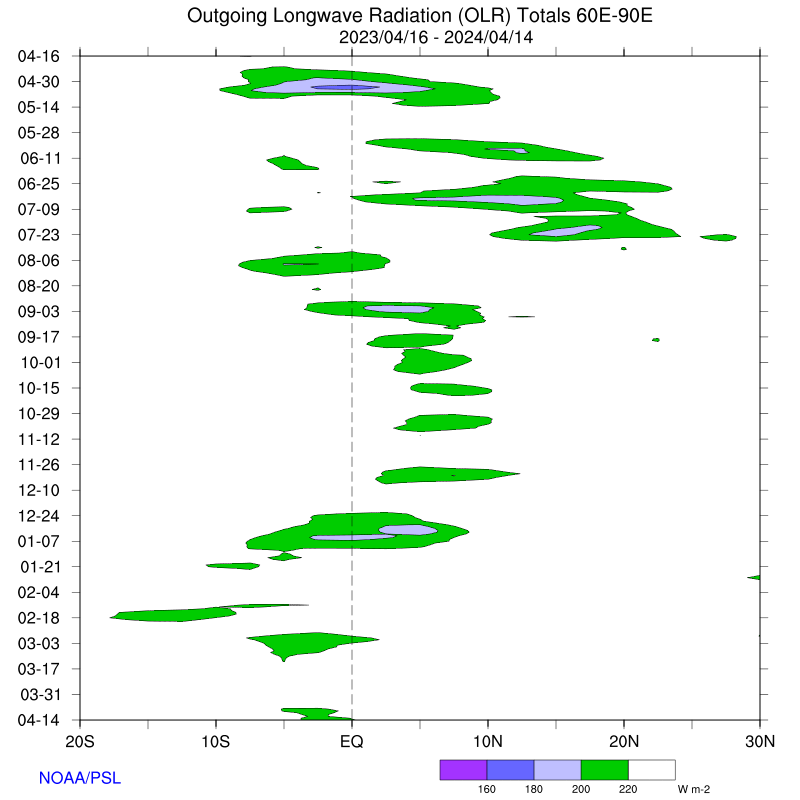
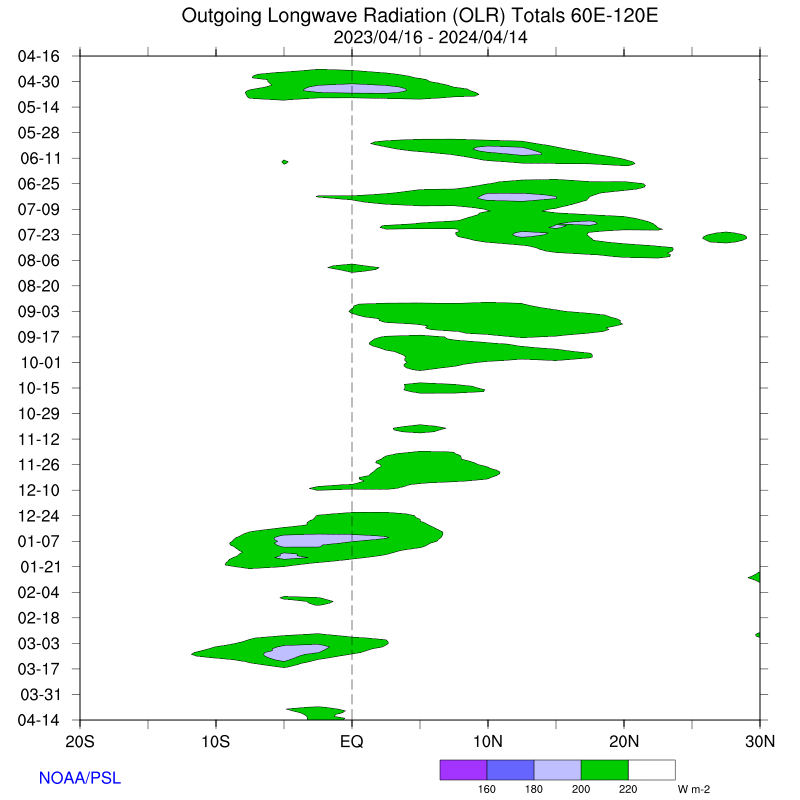
Totals
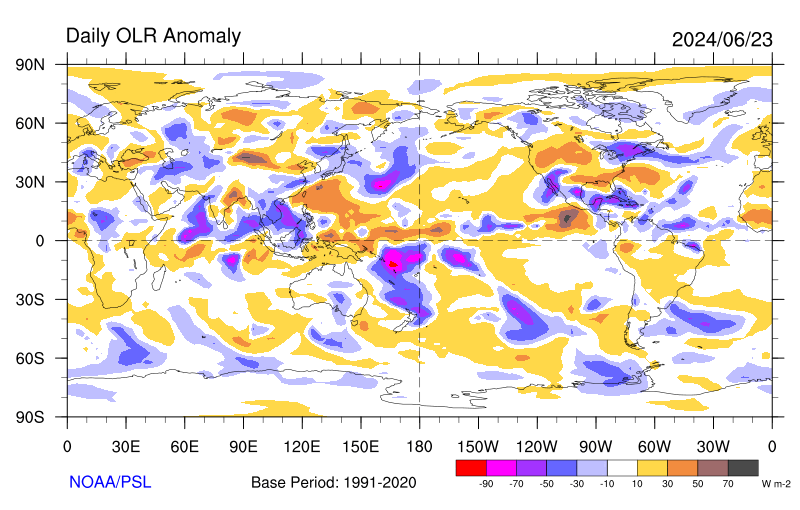
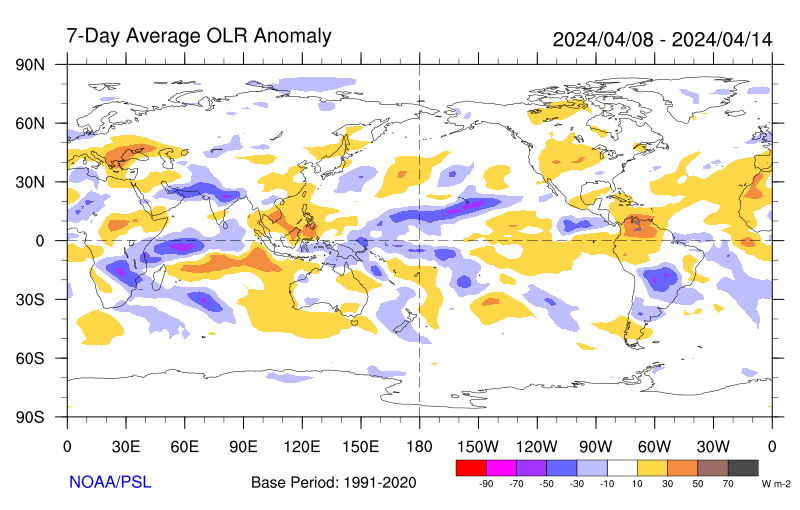
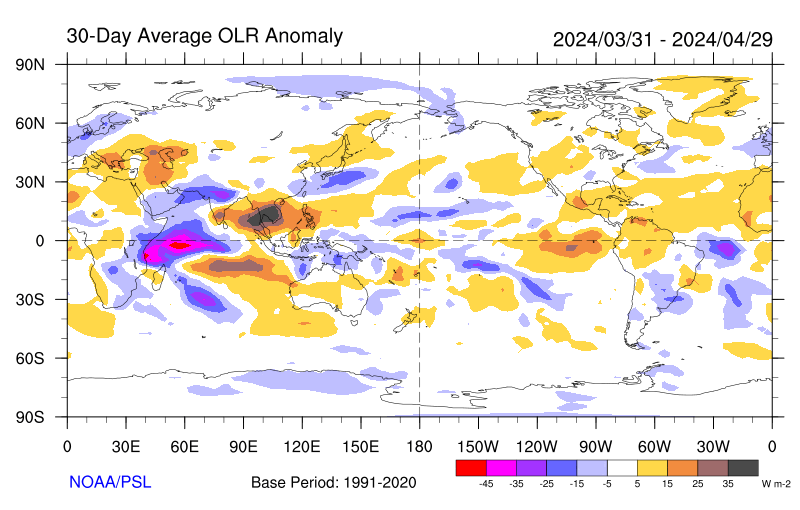
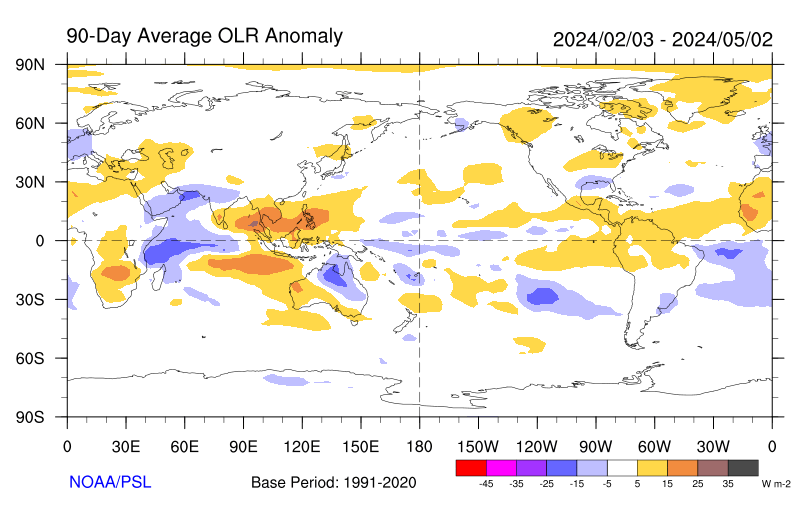
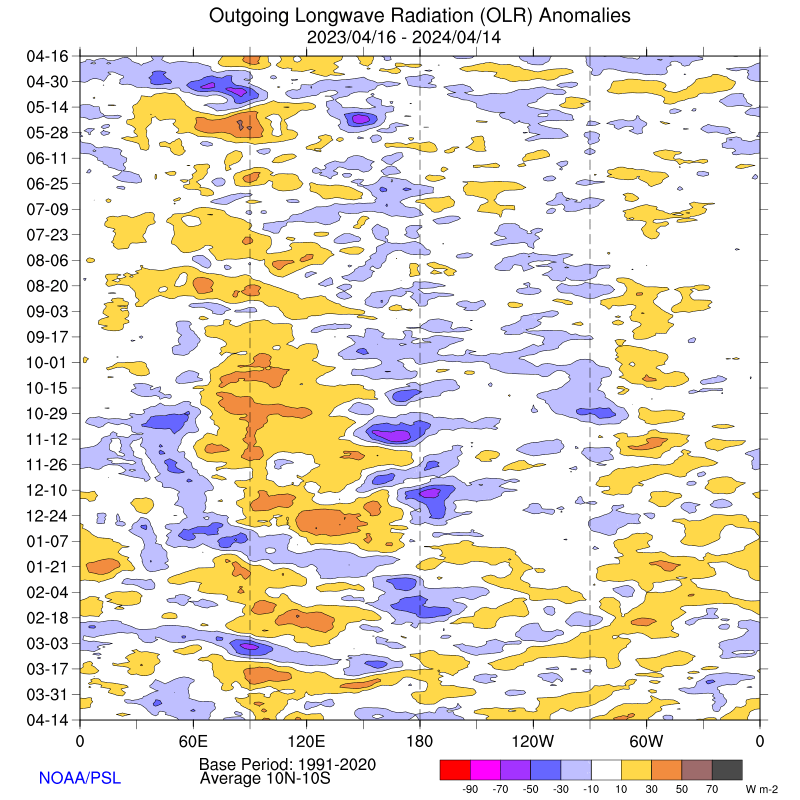
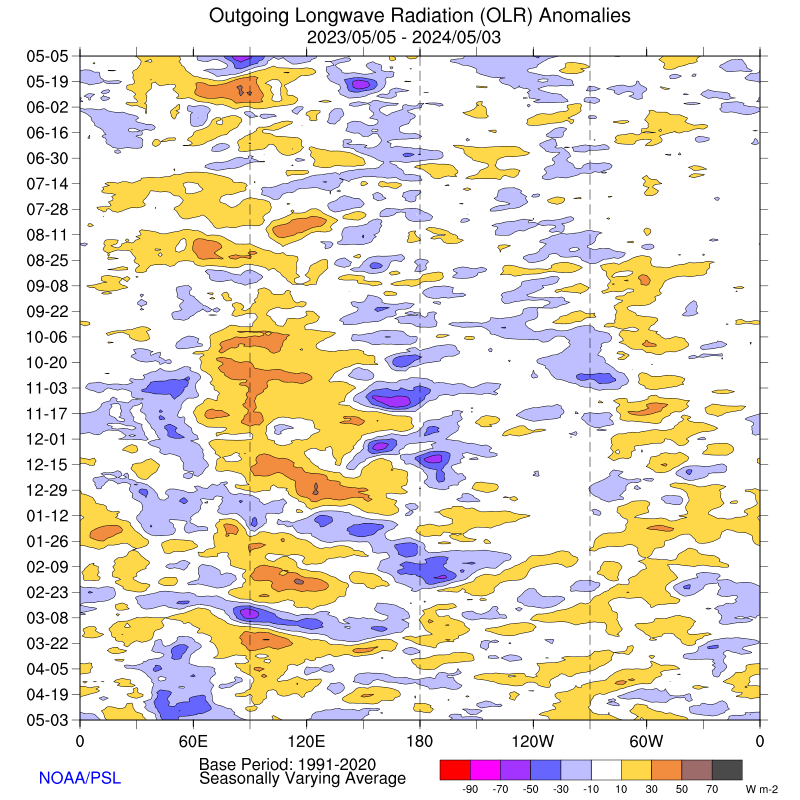
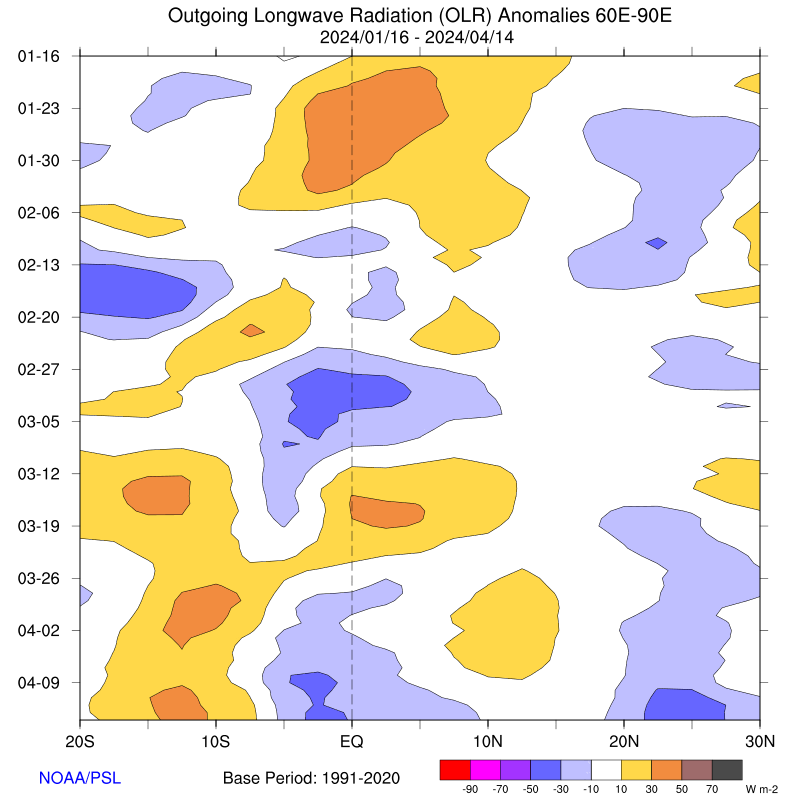
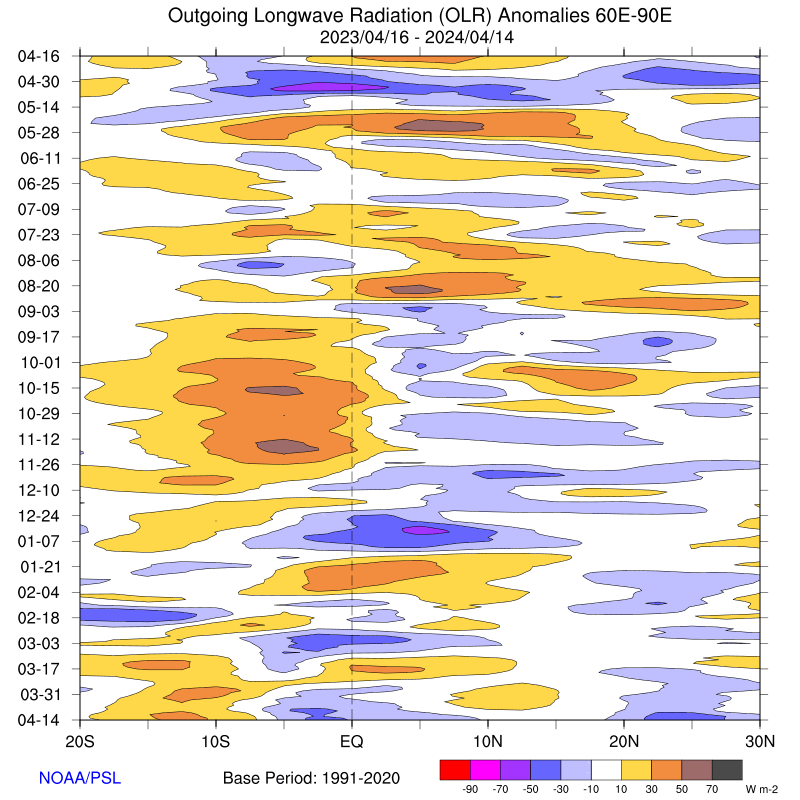
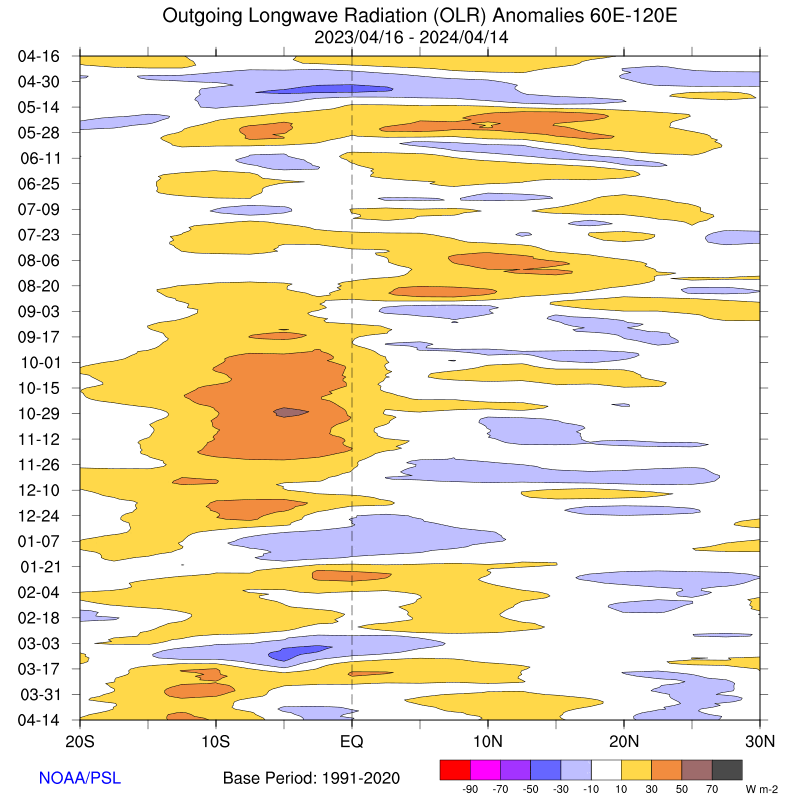
Anomalies
Time-Longitude
Seasonally Varying Average**
**OLR data are averaged based on the season of the year. For the months Dec-Mar the data are averaged over 15S-5N, for the months Jun-Sep the data are averaged over 5S-15N, and for the rest of the year(Apr-May and Oct-Nov) the data are averaged over 10S-10N.
