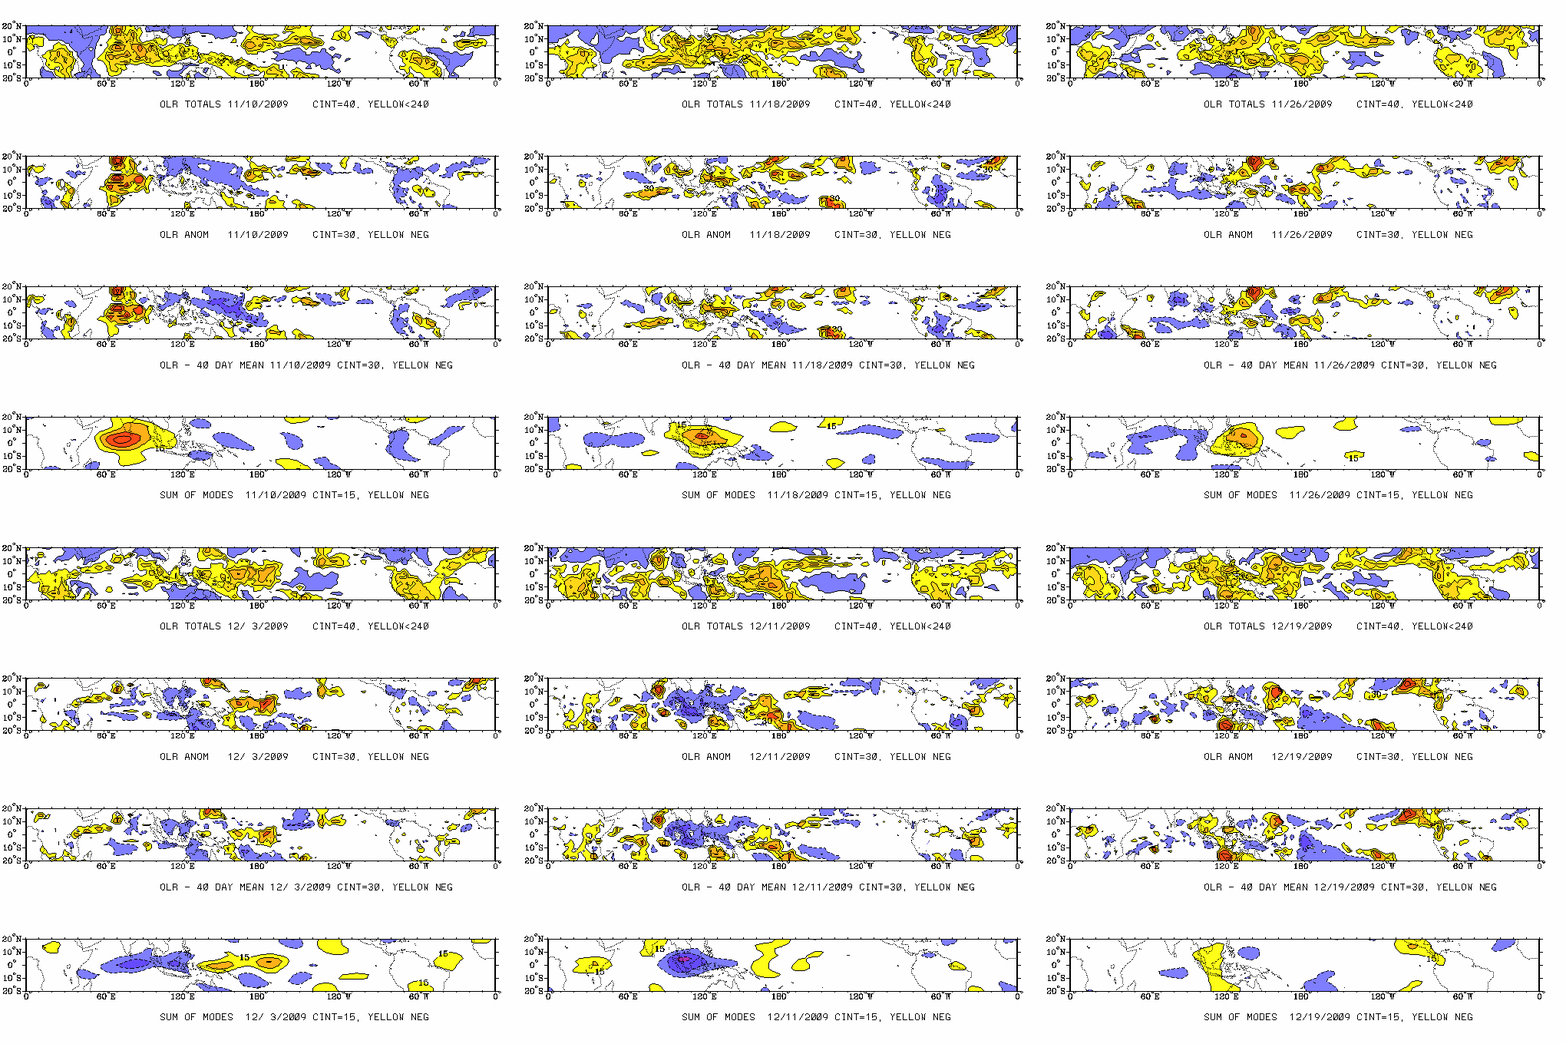
Map sequence for the most recent 40 days. First panel shows the OLR total field. Second panel shows the OLR anomalies with respect to the climatological mean and seasonal cycle (base period 1979 to 1995). Third panel shows the OLR anomalies created by removing the 40-day mean (of this sequence). Fourth panel shows the sum of the anomalies attributed to the MJO, Kelvin wave, n = 1 equatorial Rossby wave, and mixed Rossby-gravity wave as presented in the next plot, accessible by clicking here.