PSL Map Room - Sea Surface Temperature (SST)
These graphical products are not guaranteed to be updated on a regular basis. They are intended to serve as examples of our ongoing work. You are free to use and distribute these images, but we request that you acknowledge PSL when you do use them. Please read the disclaimer page for additional information, including how to cite this work.
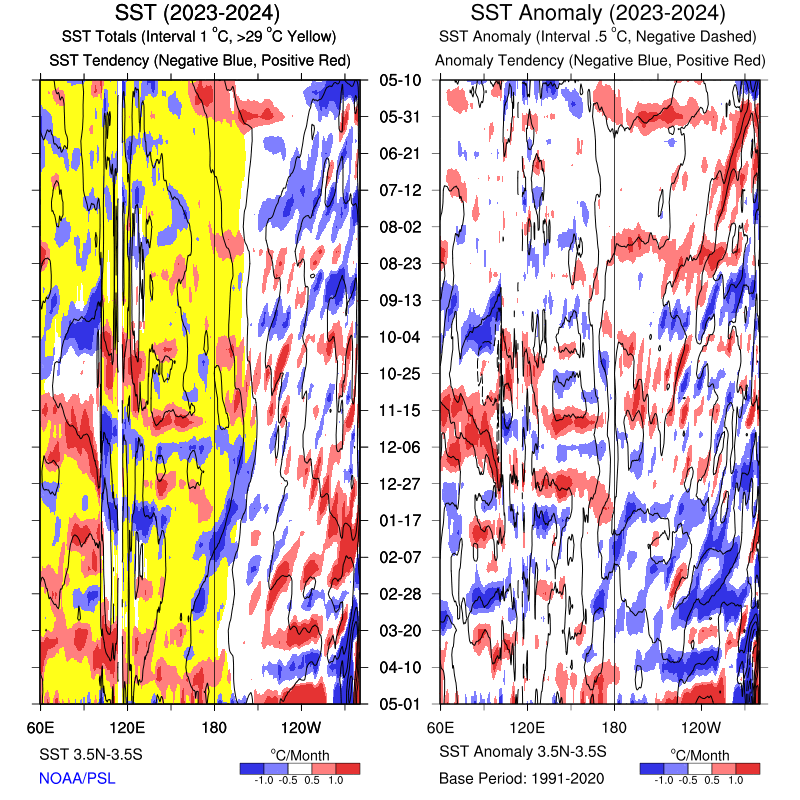
Totals (Updated: Jul 31 10:07 MDT)
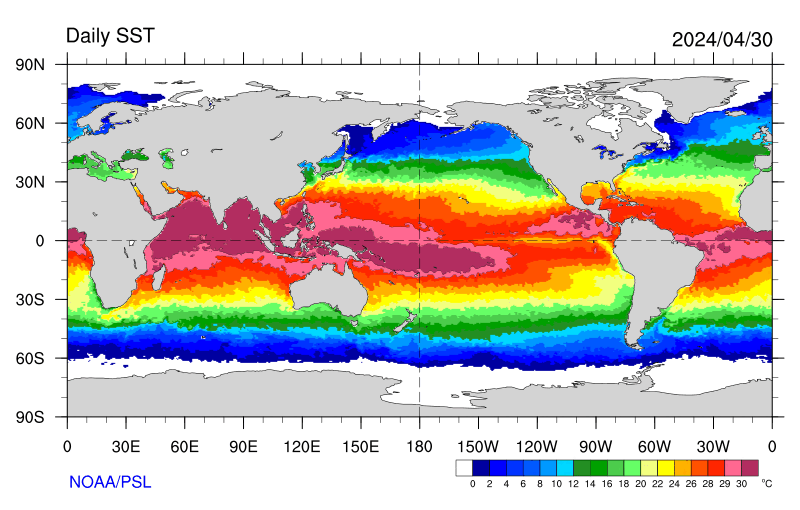
Latest Daily Product
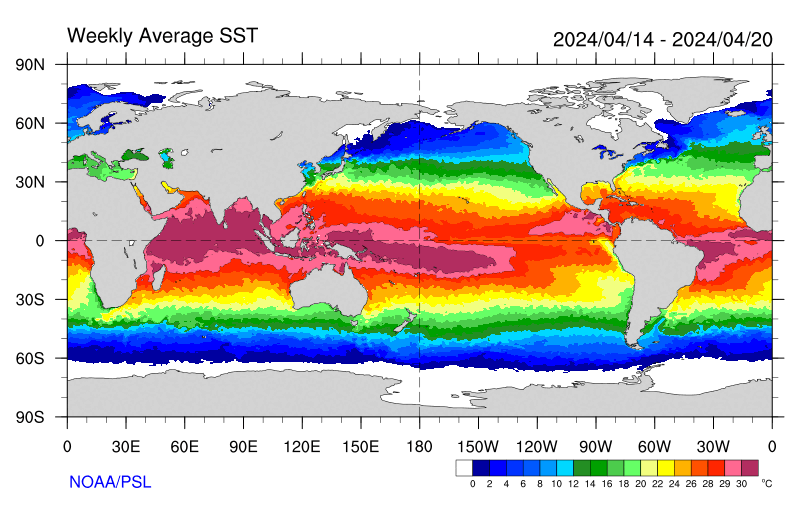
Latest Weekly Product
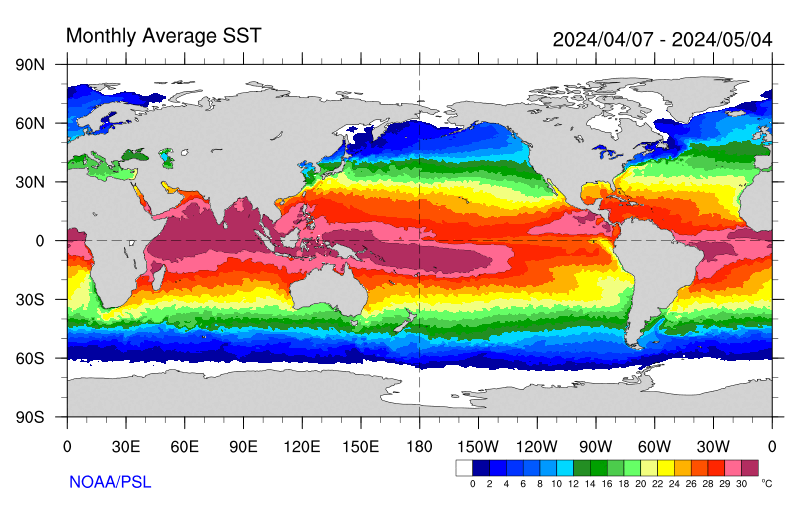
Latest Monthly Product
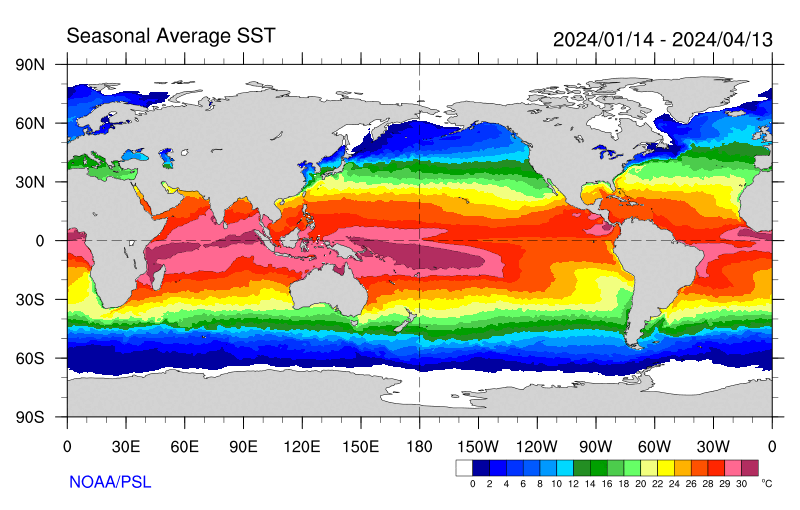
Latest Seasonal Product
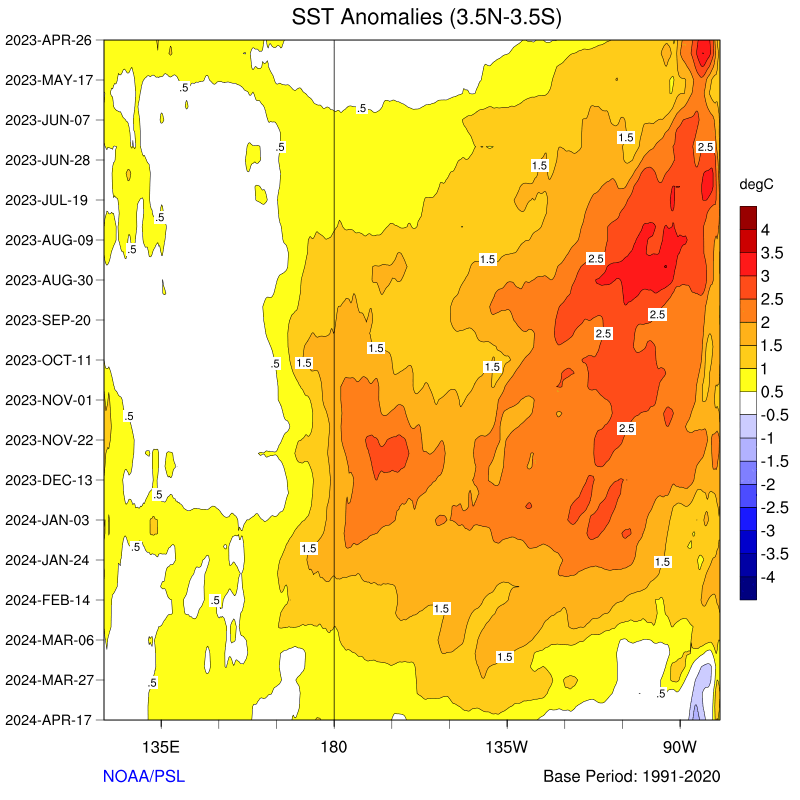
Anomalies (Updated: Jul 31 10:07 MDT)
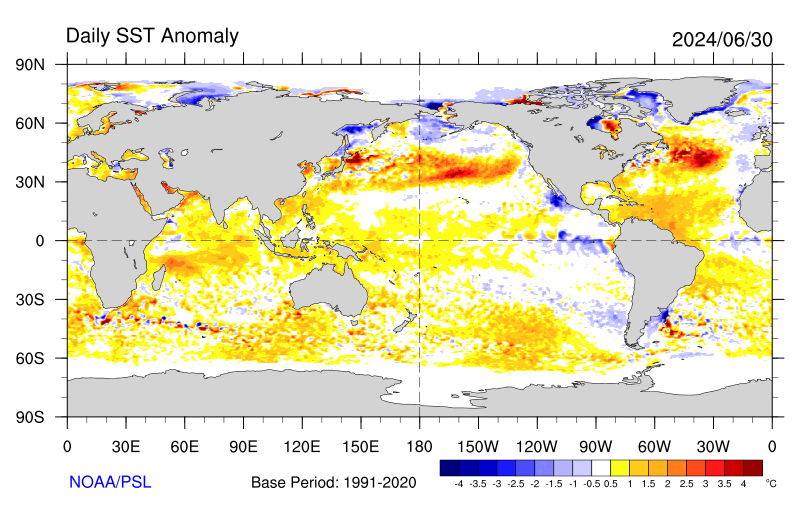
Latest Daily Product
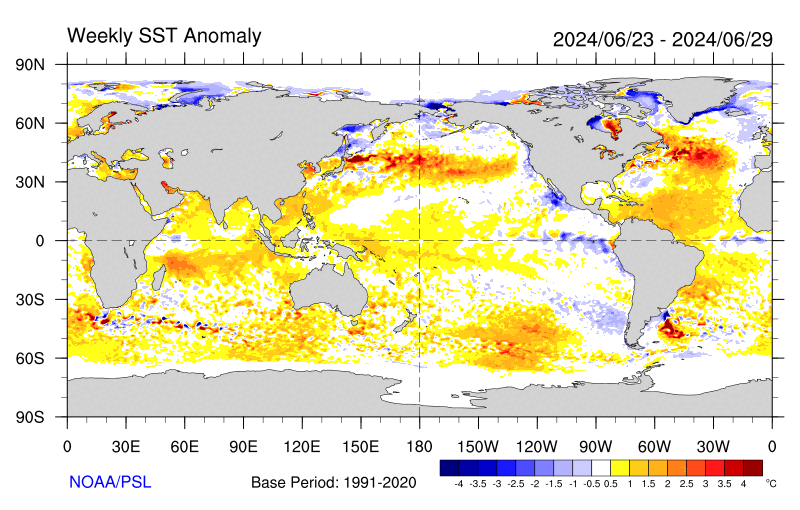
Latest Weekly Product
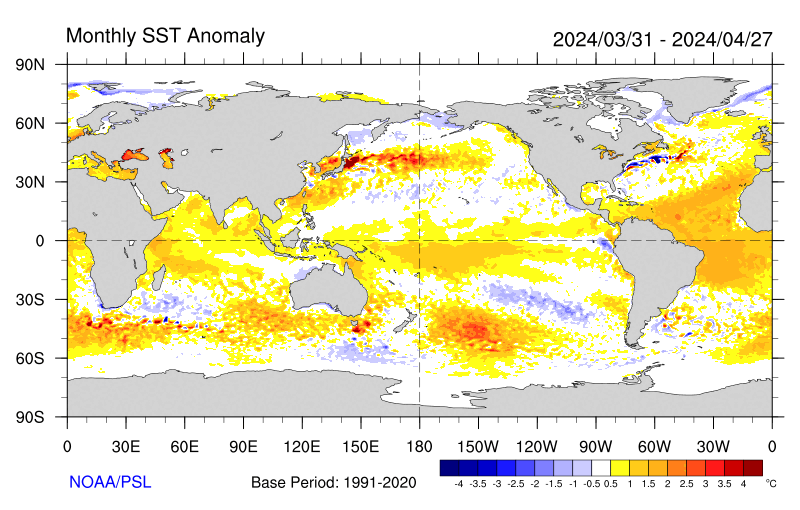
Latest Monthly Product
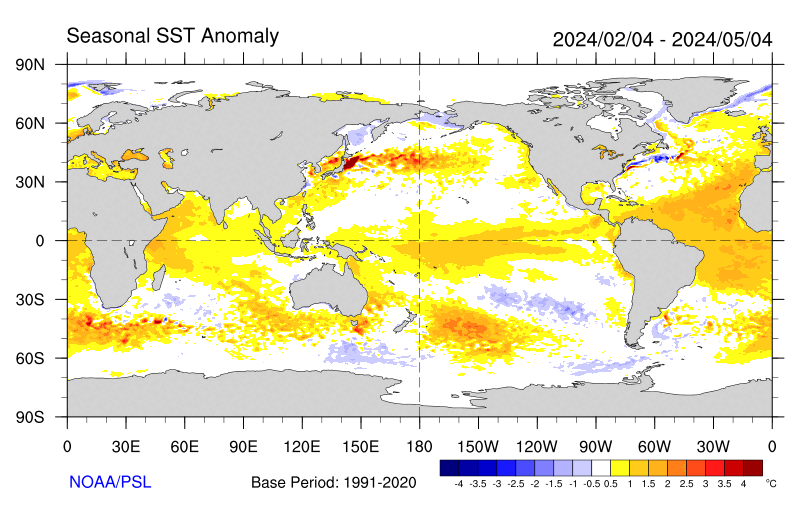
Latest Seasonal Product
Time-Lon/Lat
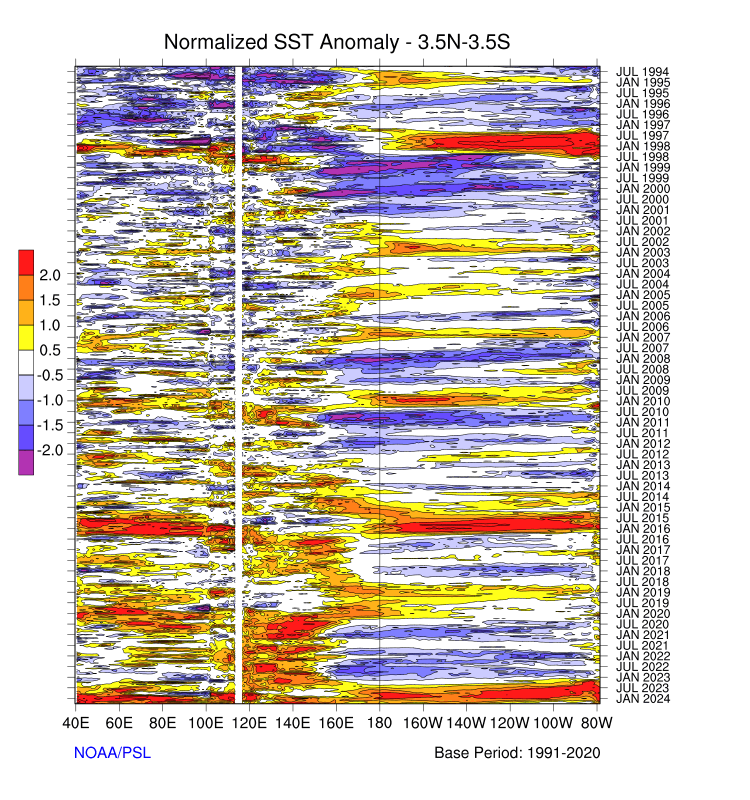
Yearly Anomalies
 (Updated:
Jul 26 13:07 MDT)
(Updated:
Jul 26 13:07 MDT)
(Updated:
Jul 26 13:07 MDT)
Yearly Trends
 (Updated:
Jul 26 13:07 MDT)
(Updated:
Jul 26 13:07 MDT)
(Updated:
Jul 26 13:07 MDT)
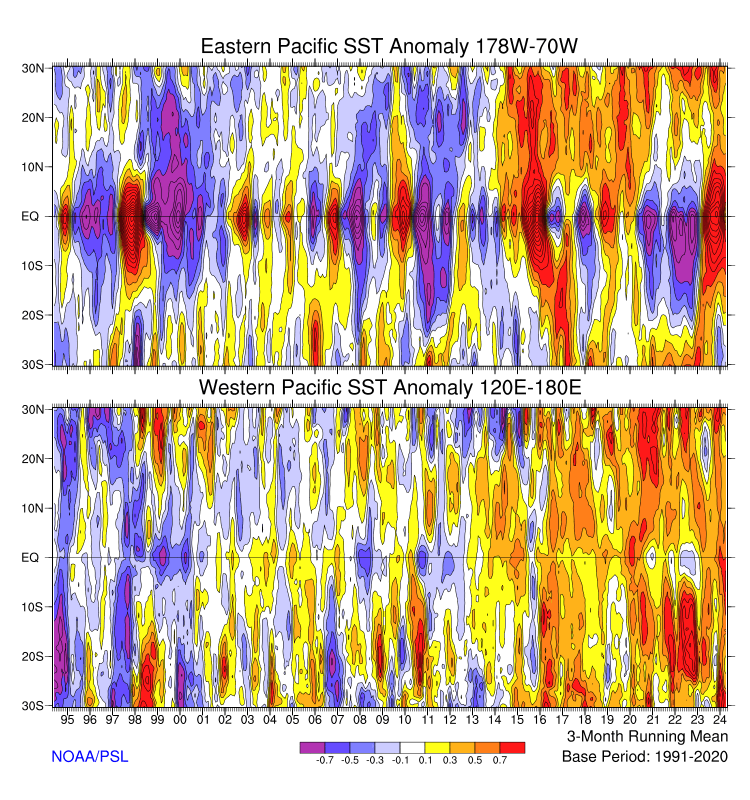
Long Term Anomaly (3.5N-3.5S)
 (Updated:
Jul 15 12:07 MDT)
(Updated:
Jul 15 12:07 MDT)
(Updated:
Jul 15 12:07 MDT)
Longitudinally Averaged Anomaly
 (Updated:
Jul 15 12:07 MDT)
(Updated:
Jul 15 12:07 MDT)
(Updated:
Jul 15 12:07 MDT)