The world in a hundred snapshots: New calculation method could help improve climate model accuracy
Climate change is primarily caused by changes in concentrations of “greenhouse gases” within the atmosphere which modify the exchange of energy between the Earth and space. This change in energy flow – the size of the push to which the climate system responds – relies on fundamental physics that has been understood for more than a century, and can be calculated precisely with very large amounts of computing time. But because the size of the push depends on local conditions such as temperature and humidity, performing calculations that account for the rich variety around the globe has not been practical.
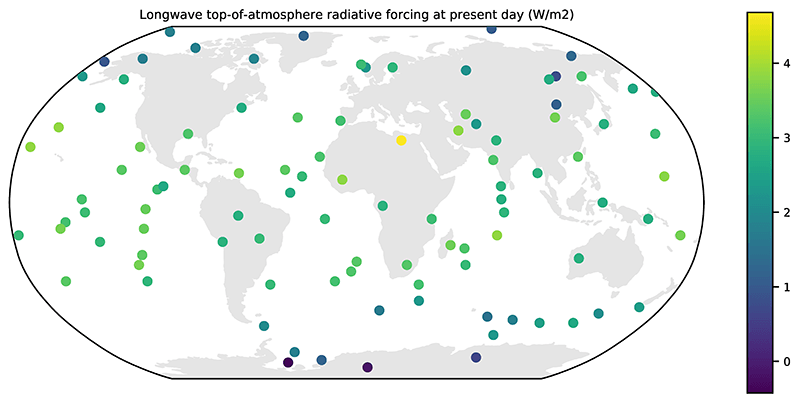
In a new study, researchers from CIRES and the Physical Sciences Laboratory, NOAA’s Geophysical Fluid Dynamics Laboratory, and their collaborators around the world drew on similarities across many parts of the Earth system to identify just 100 snapshots of conditions that represent the average energy exchange across the global and yearly climate cycle. This simplification made the computing problem manageable enough that six independent but very accurate calculation methods were able to more quickly and easily make the computations. Their findings, recently published in the Journal of Geophysical Research – Atmospheres, suggest that this approach can be used to very accurately determine the relationship between greenhouse gas concentrations and the resulting change in Earth's energy imbalance.
The basic calculation methods used in this study agreed very well with one another, in contrast to the much more approximate calculations used by climate models. Although these basic calculations don’t account for some important factors, including the presence of clouds, the study estimates the size of these factors well enough without reverting to uncertain climate models.
Because the models used in this study agree so well, this work can be used to establish a benchmark for improving climate model accuracy, and also interpreting with greater confidence the changes the world has experienced.
Authors of the J. Geophys. Res. Atmos. article Benchmark calculations of radiative forcing by greenhouse gases are: Robert Pincus, Stefan A. Buehler, Manfred Brath, Cyril Crevoisier, Omar Jamil, K. Franklin Evans, James Manners, Raymond L. Menzel*, Eli J. Mlawer, David Paynter*, Rick L. Pernak, and Yoann Tellier
Posted: December 22, 2020