Lesley L. Smith – Extreme California Precip
All plots preliminary.
 |
Extreme Precipitation in California(CA DWR activity 6 subproject 2) Re. OLR-based MJO index "mjoindices" from https://github.com/cghoffmann/mjoindices: |
All nClimDiv daily precipitation data from A.Hoell; all ERA5 OLR daily data from M.Gehne.
Daily PNA (https://psl.noaa.gov/data/timeseries/daily/PNA/) from NOAA PSL
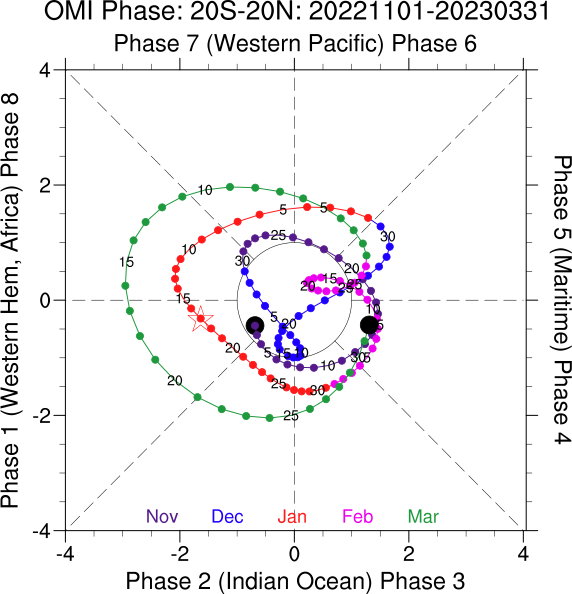
Sample ERA-5 MJO (OMI) Plot November 2022 thru March 2023
where red star indicates a maximum California precip event: Jan 16, 2023
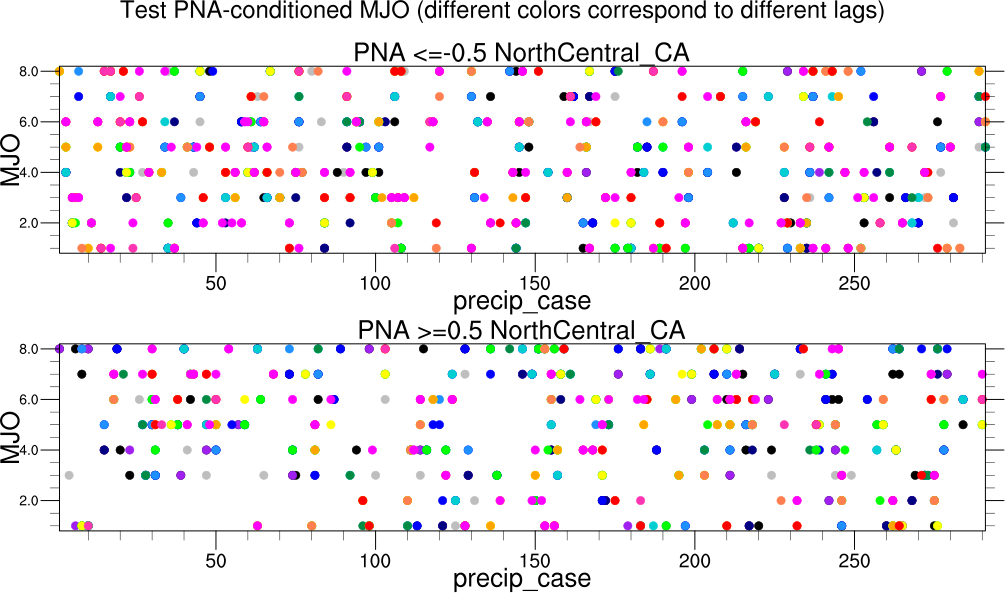
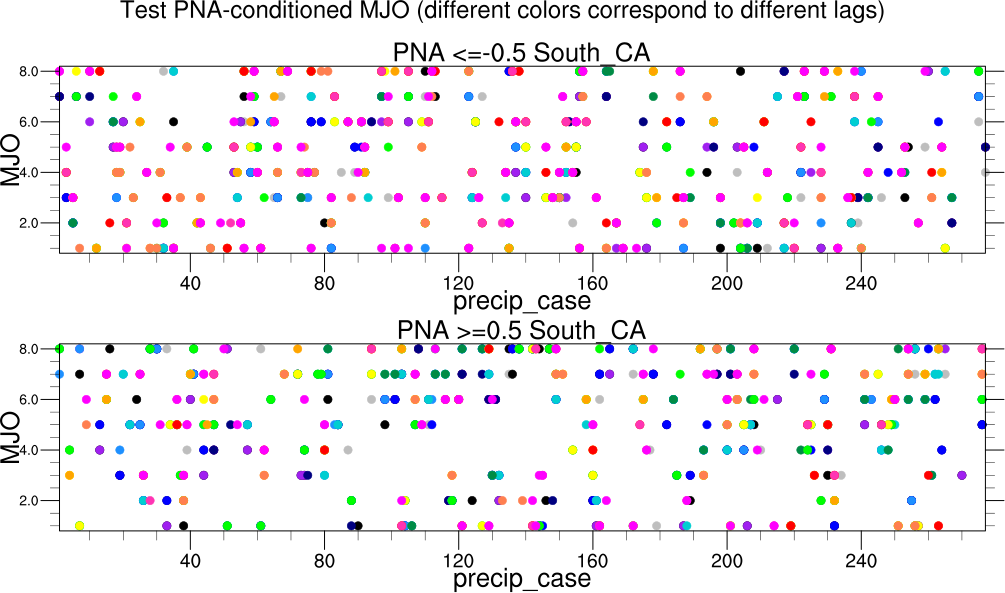
----------------------POSITIVE AND NEGATIVE PNA CASES------------------------------------
MJO phases conditioned by PNA (positive or negative) for lags: -15 days to -1 days
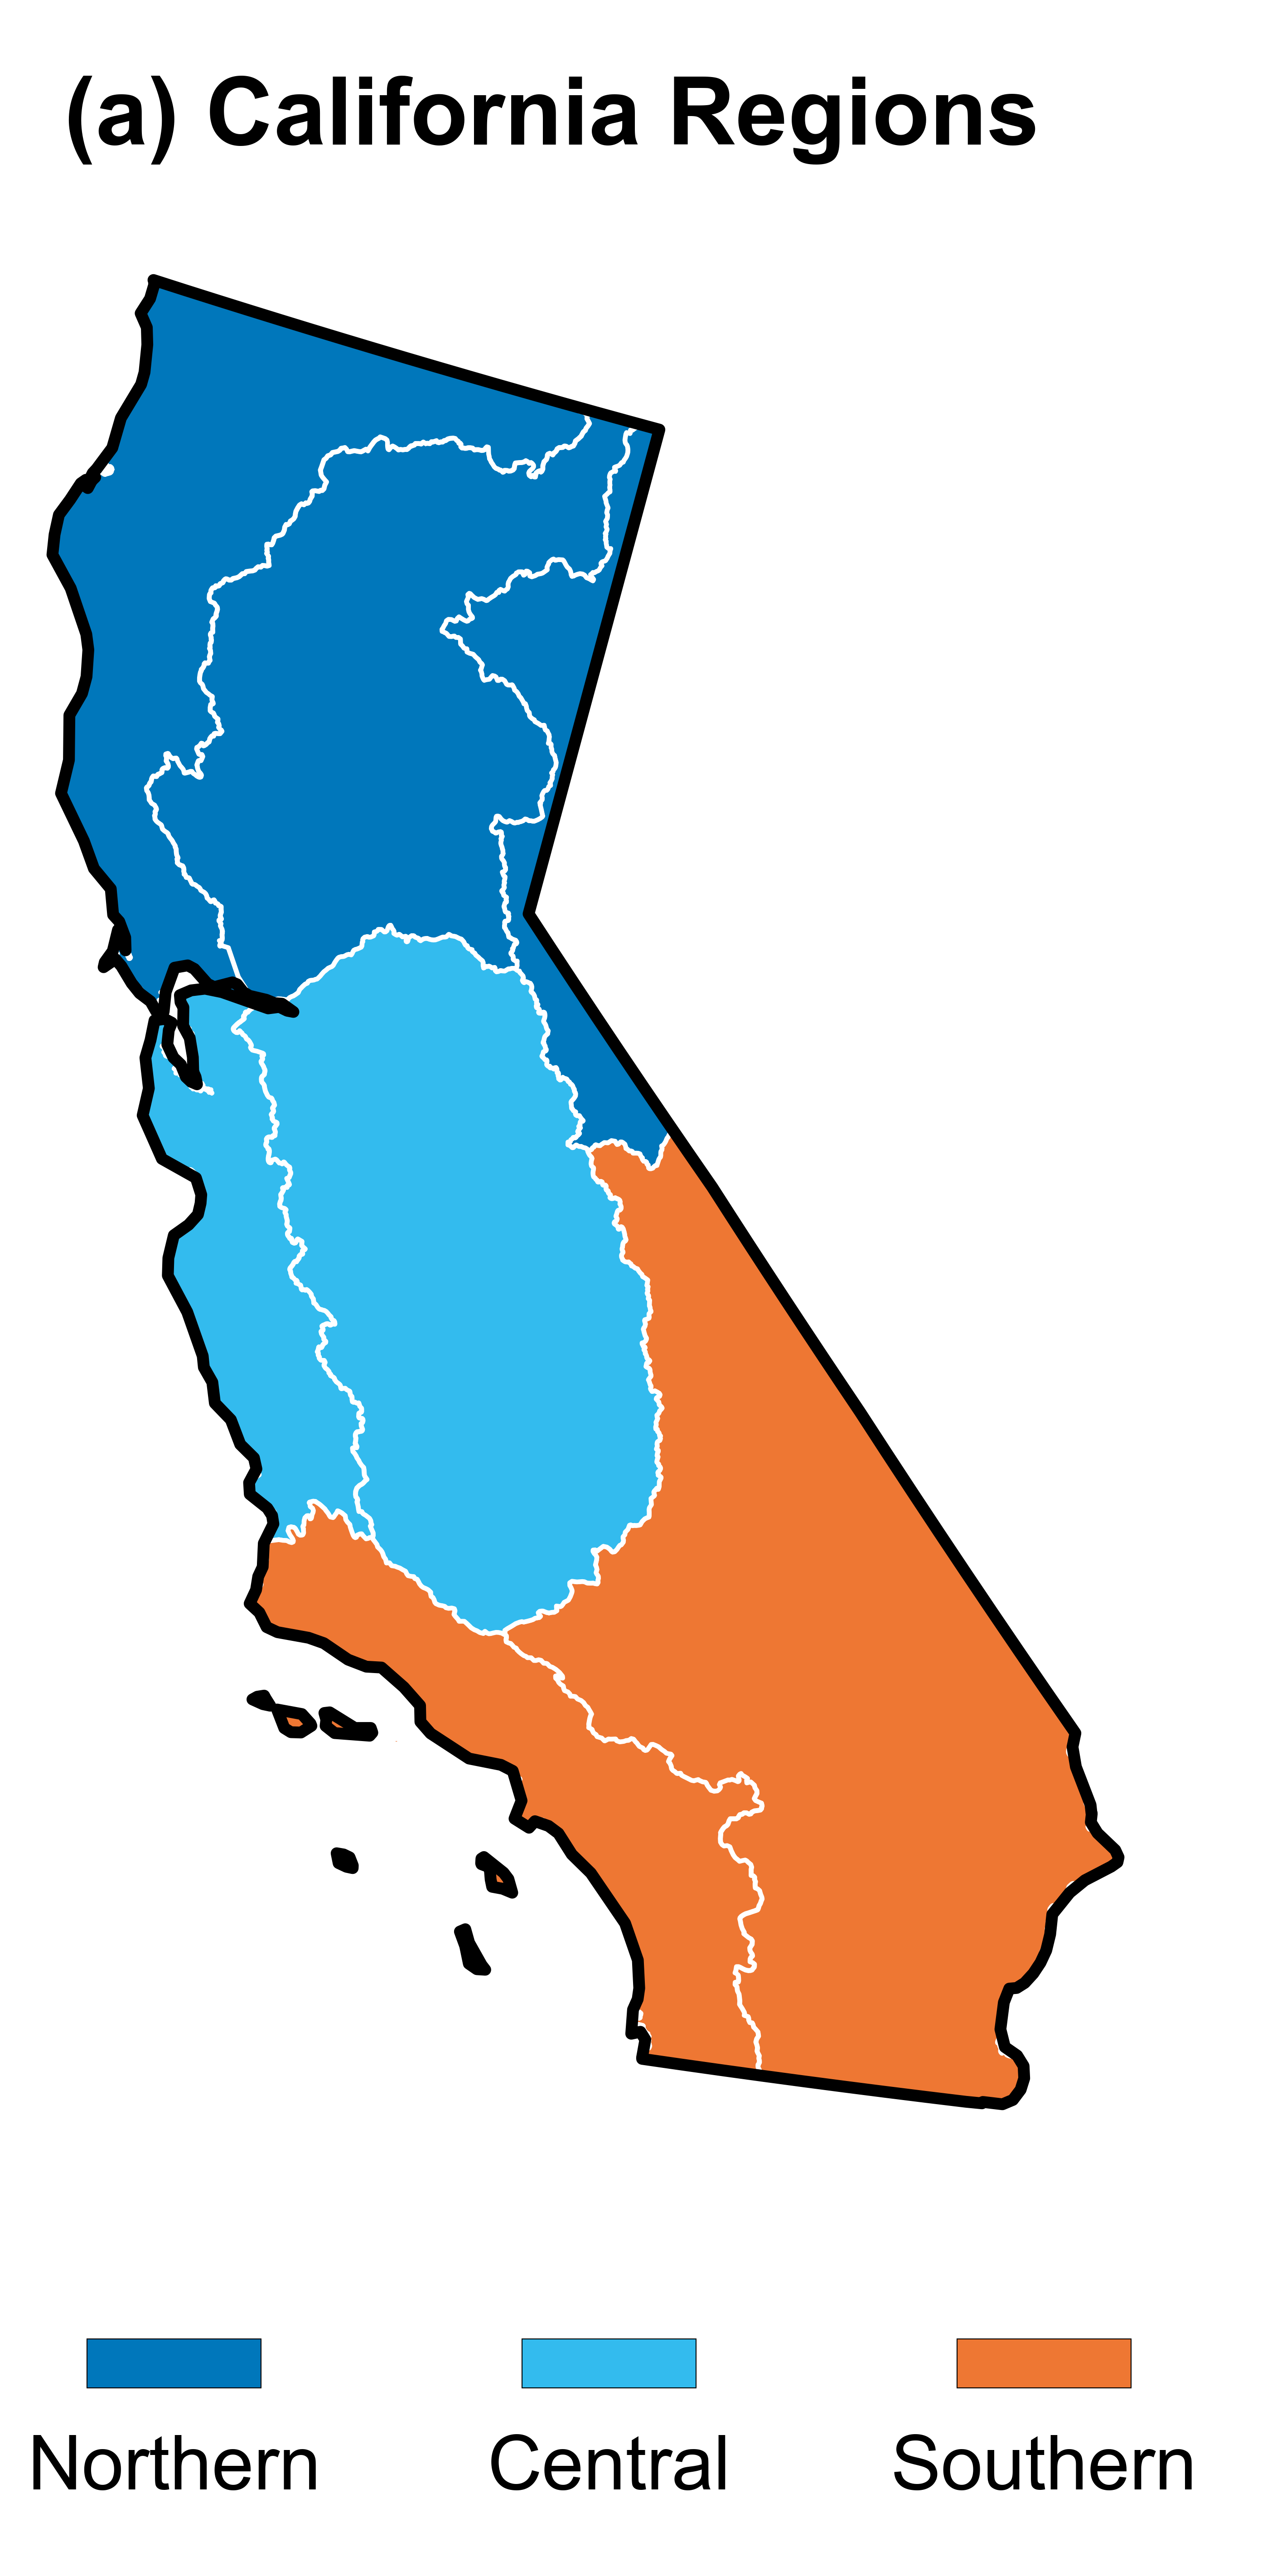
NorthCentral_CA and South_CA
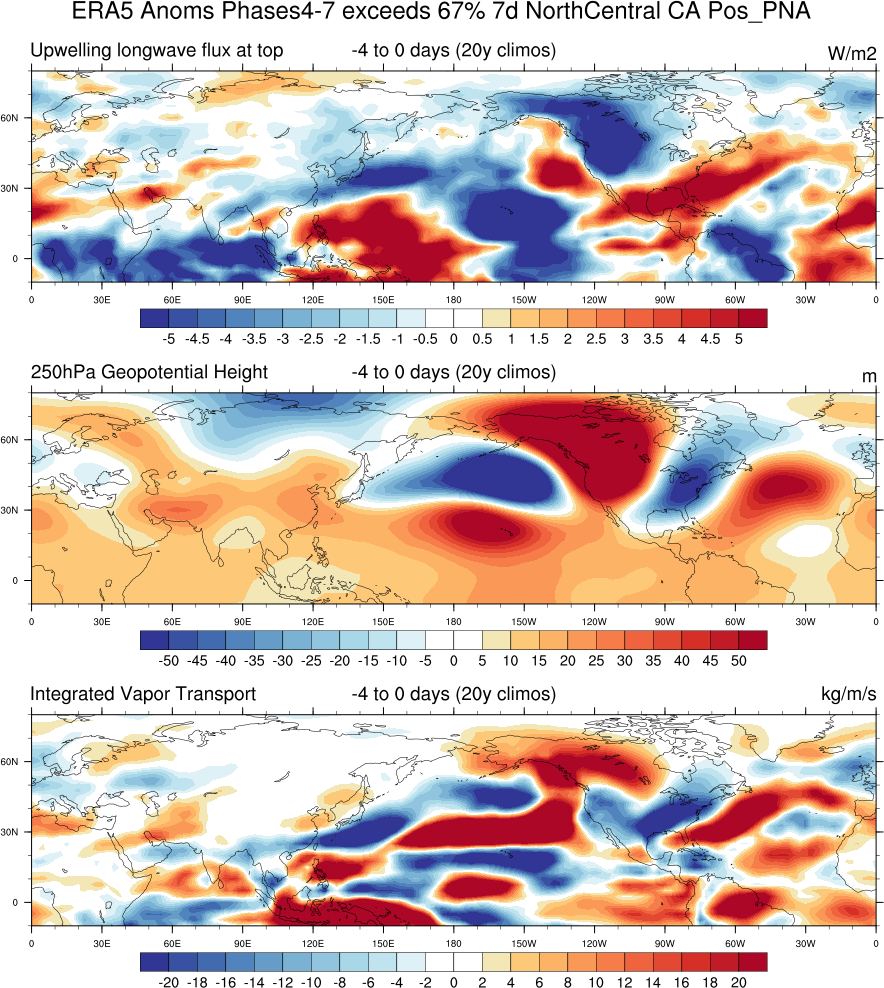
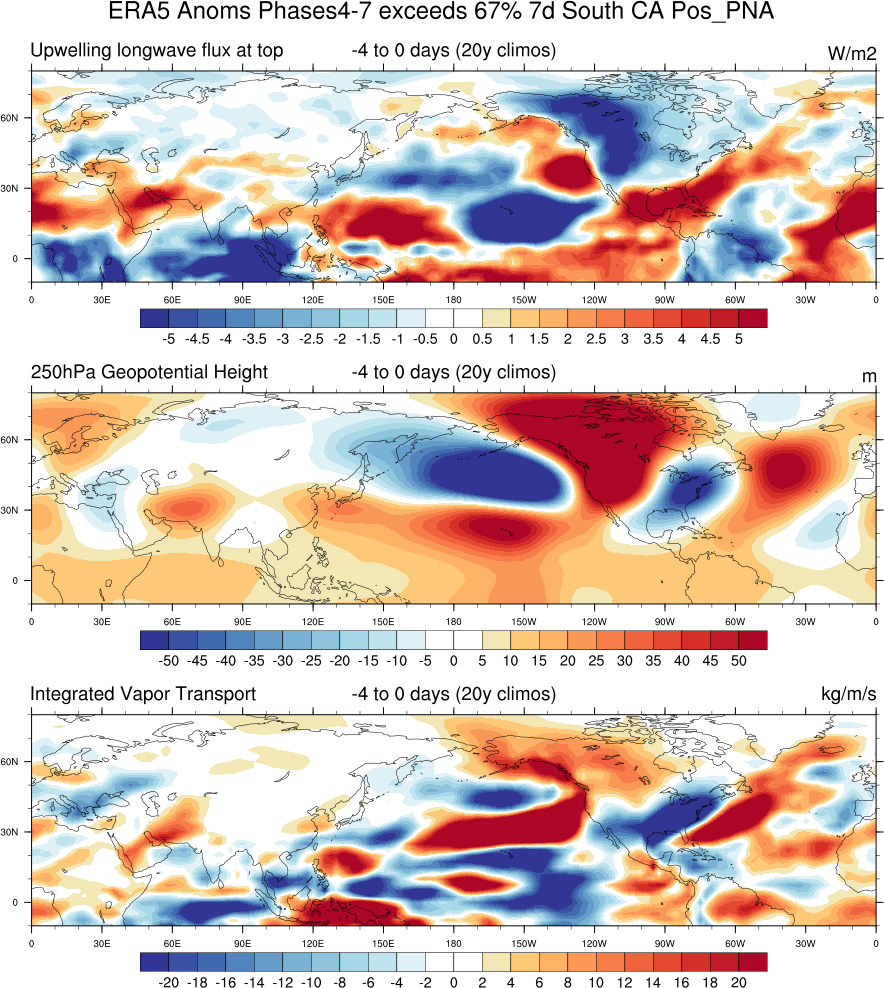
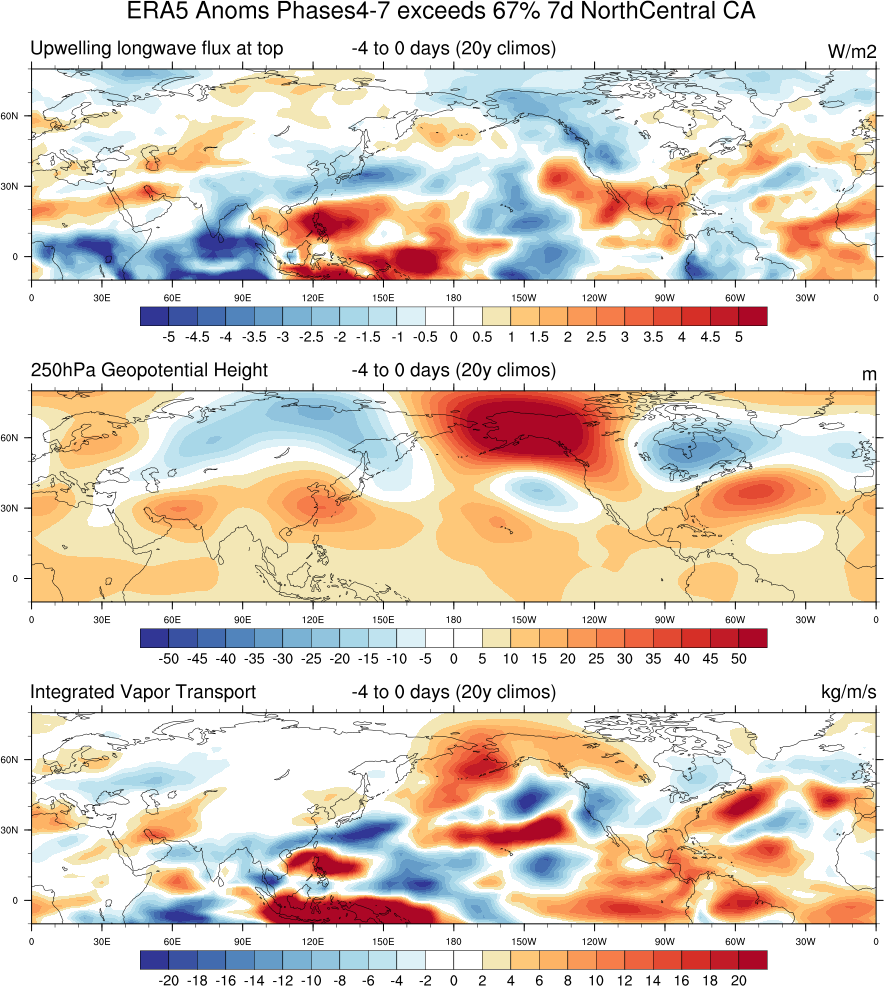
ERA5 Anomalies corresponding to nClimDiv Precip exceedances
MJO amplitude > 1 and Phases 4,5,6, or 7 at least 3 times between lags -15 days and -1 days
7-day accumulations California 67 percentile samples at lags -4 to 0 days, 20-yr climos
Positive_PNA
Additional plots, including negative PNA cases, here:
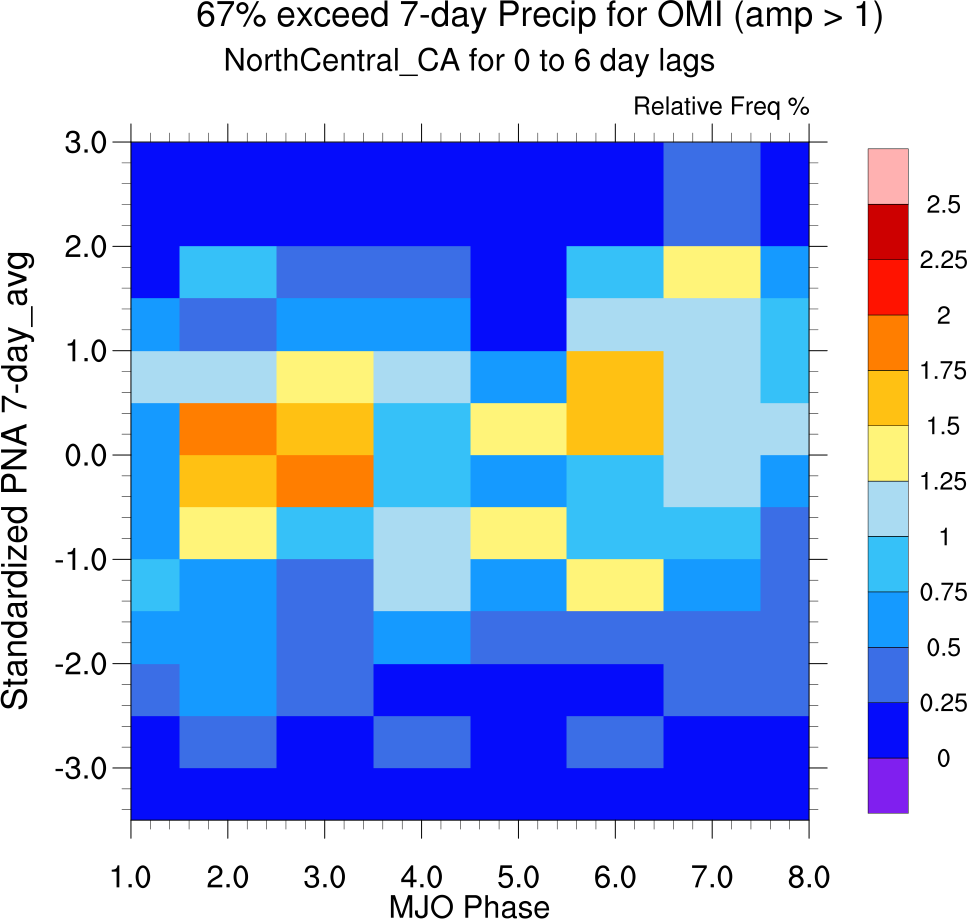
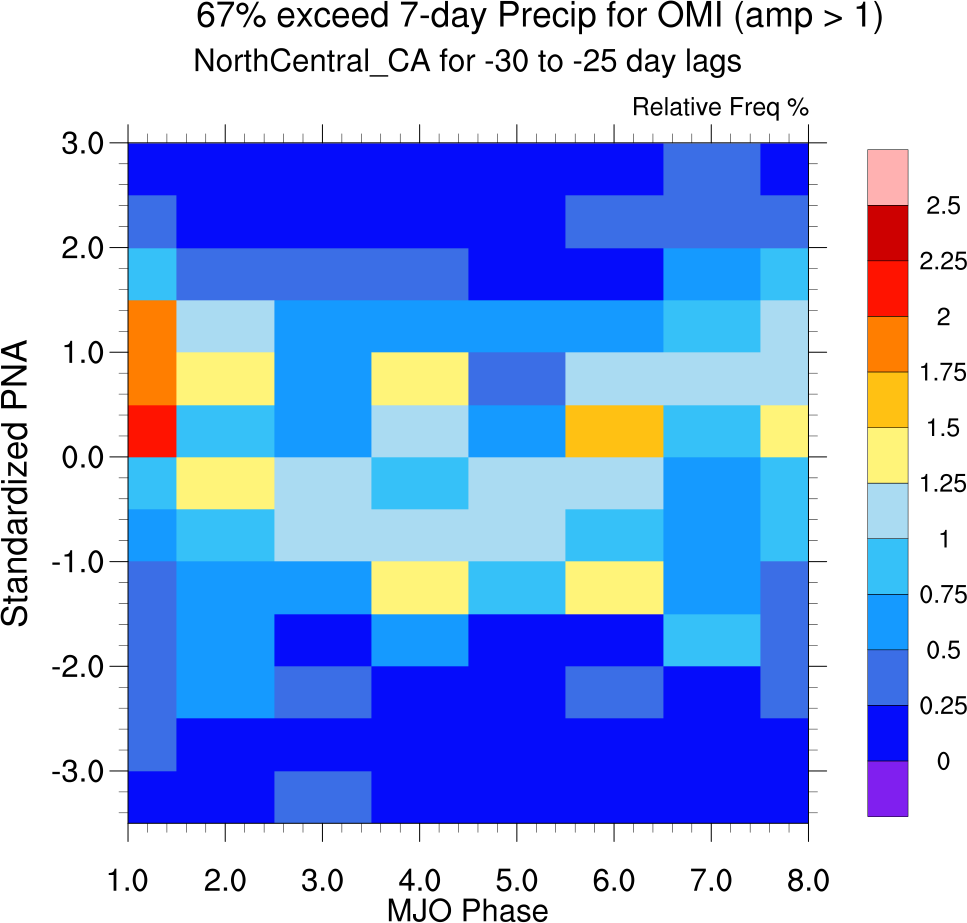
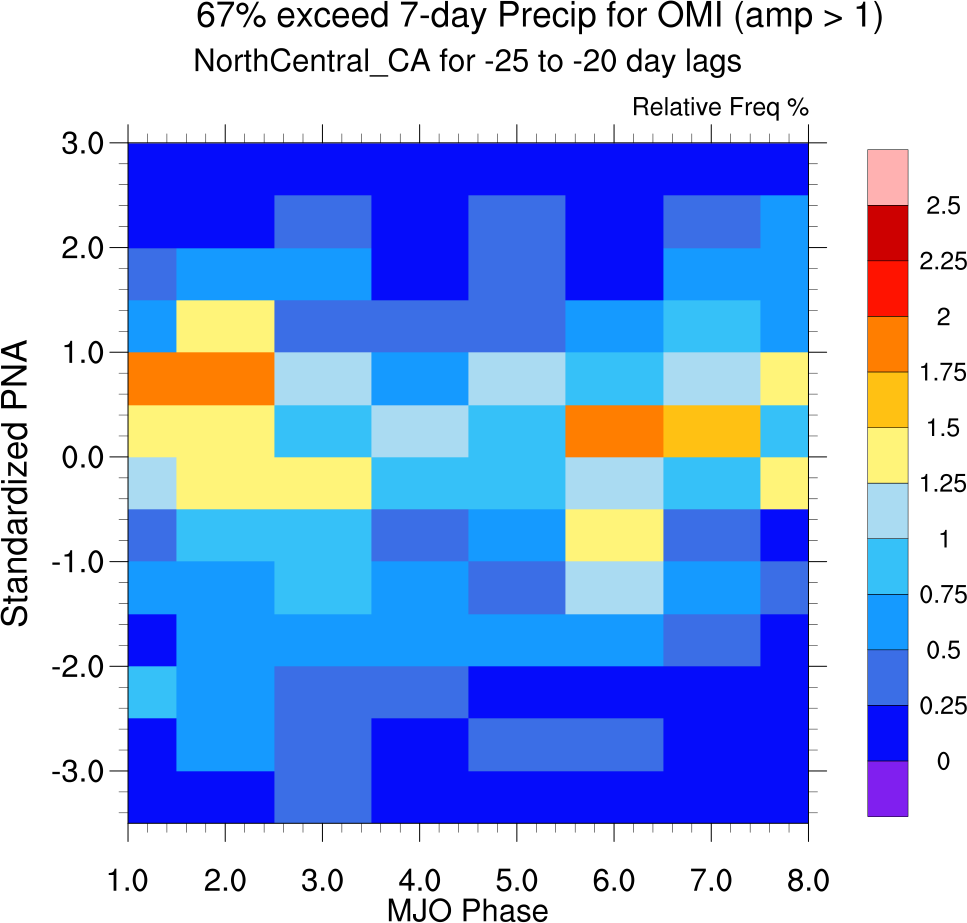
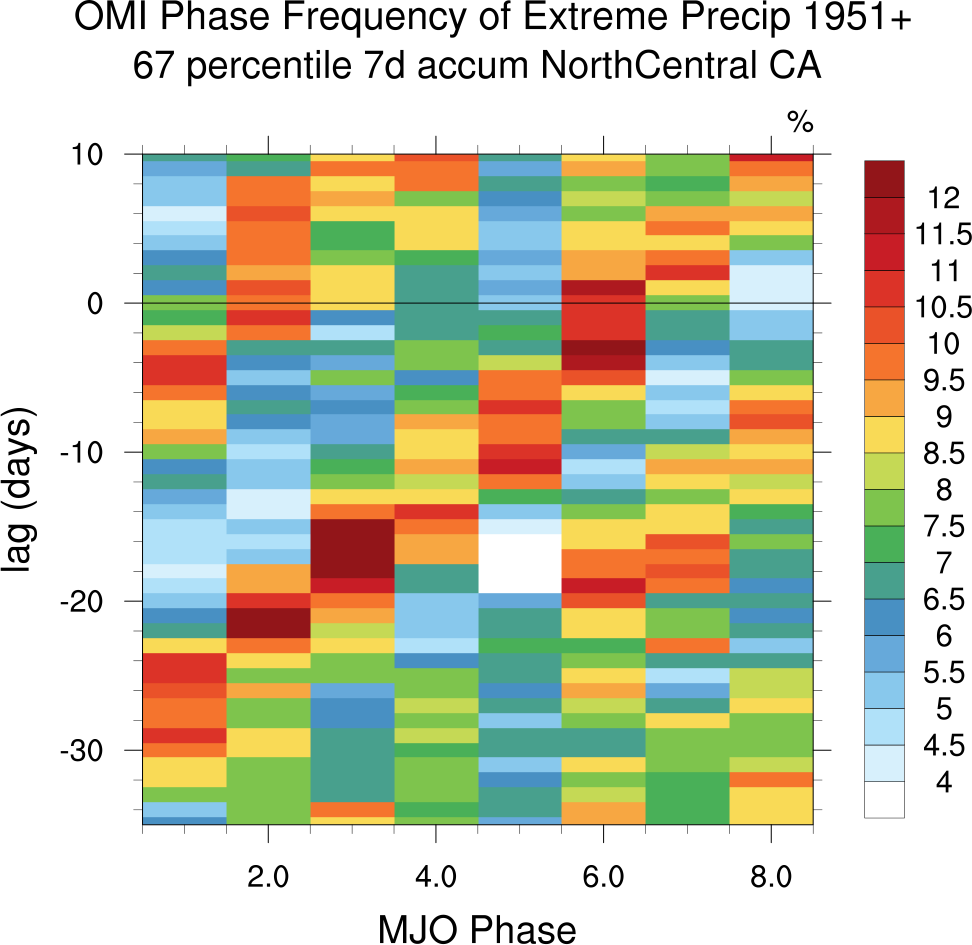
7-day North 67%
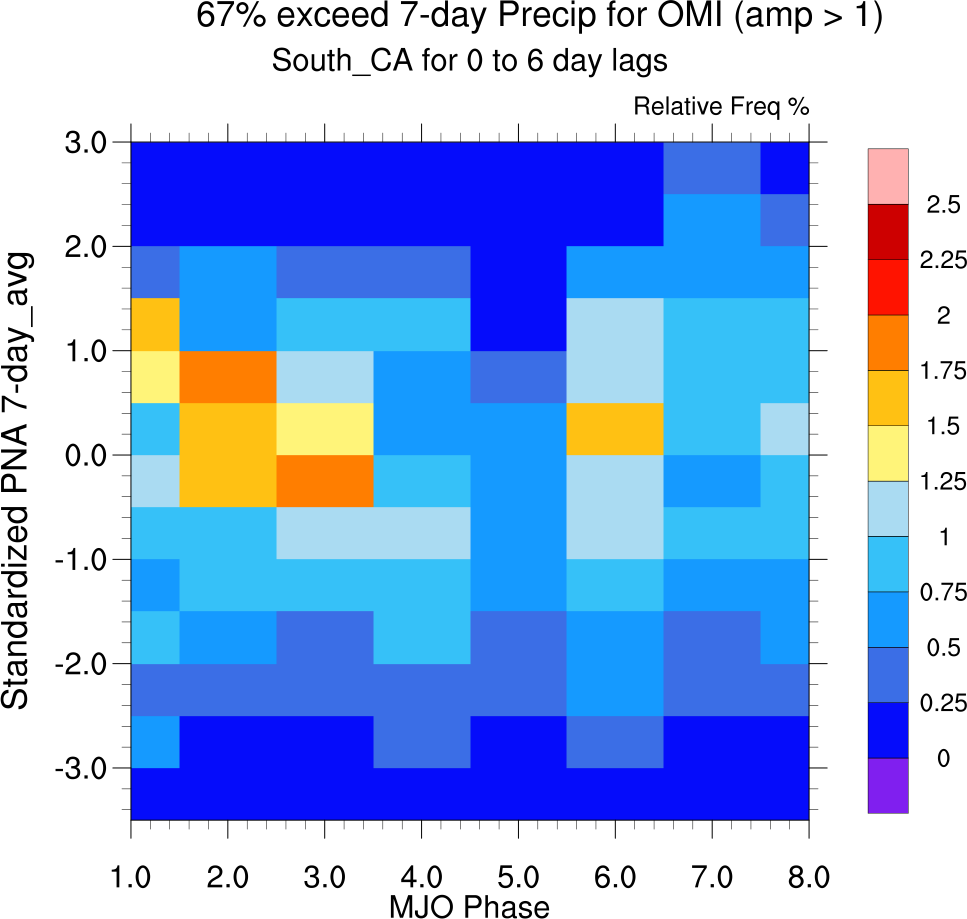
7-day South 67%
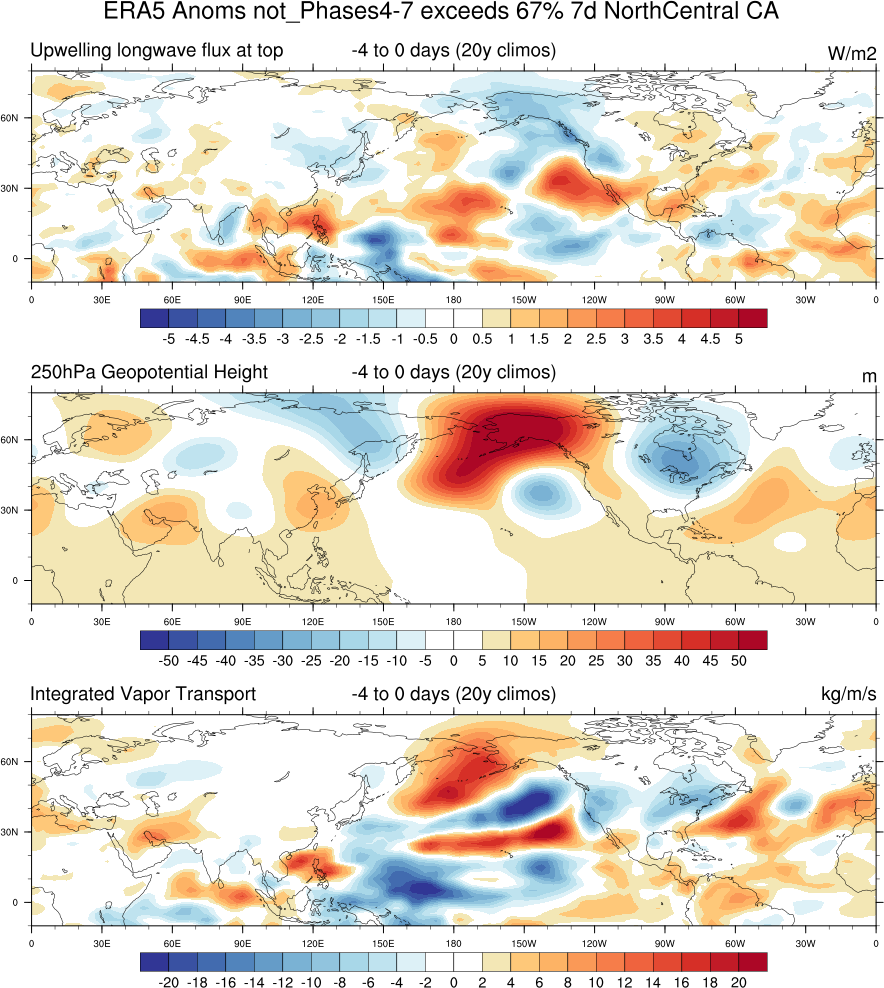
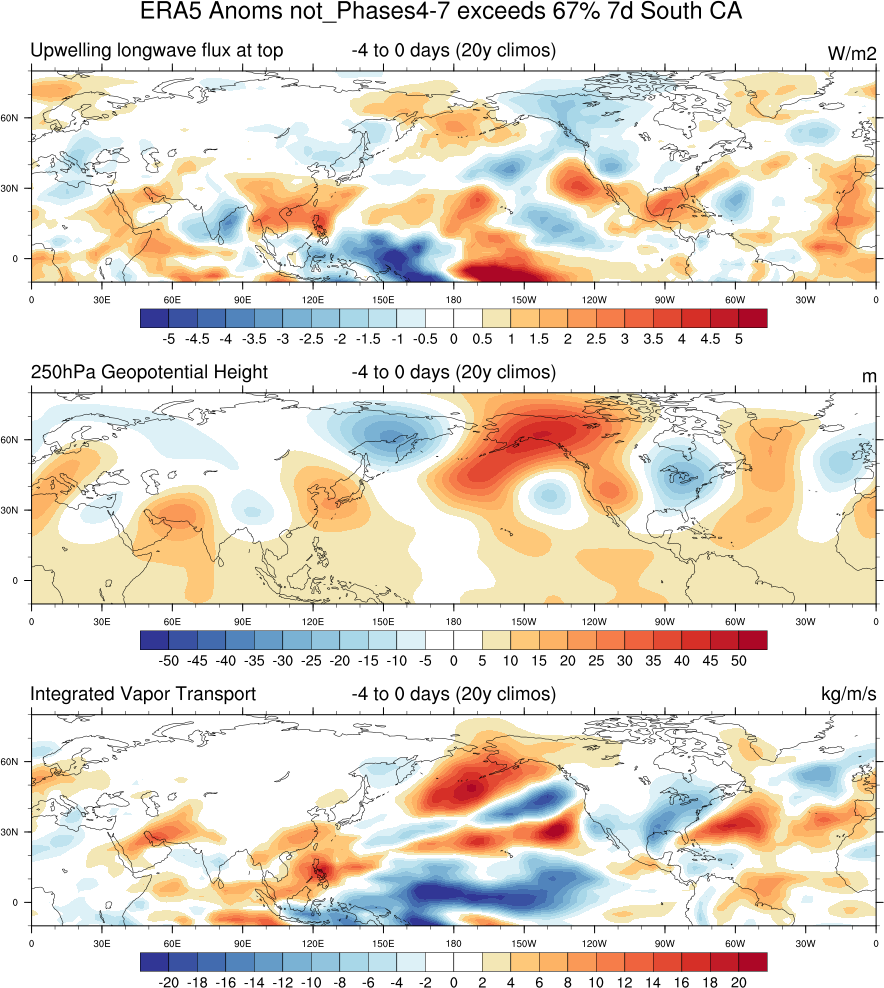
NOT MJO amplitude > 1 and Phases 4,5,6, or 7 between lags -15 days and -1 days
7-day accumulations California 67 percentile samples at lags -4 to 0 days, 20-yr climos
Positive_PNA
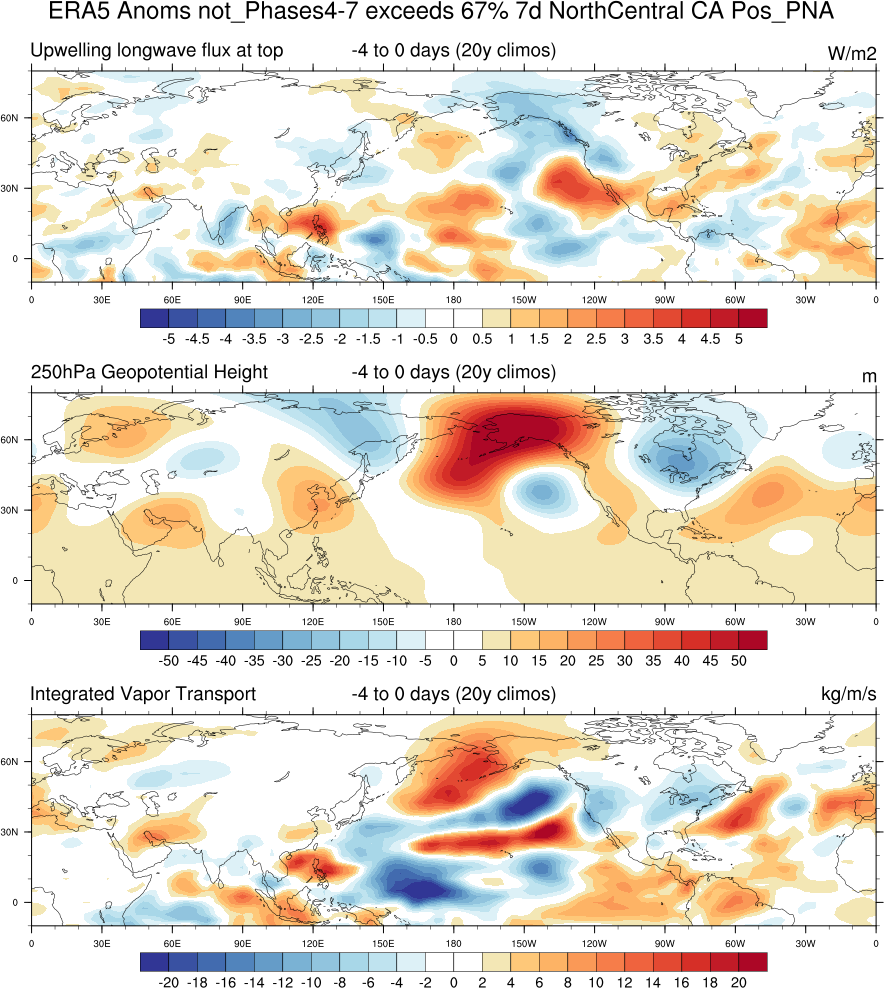
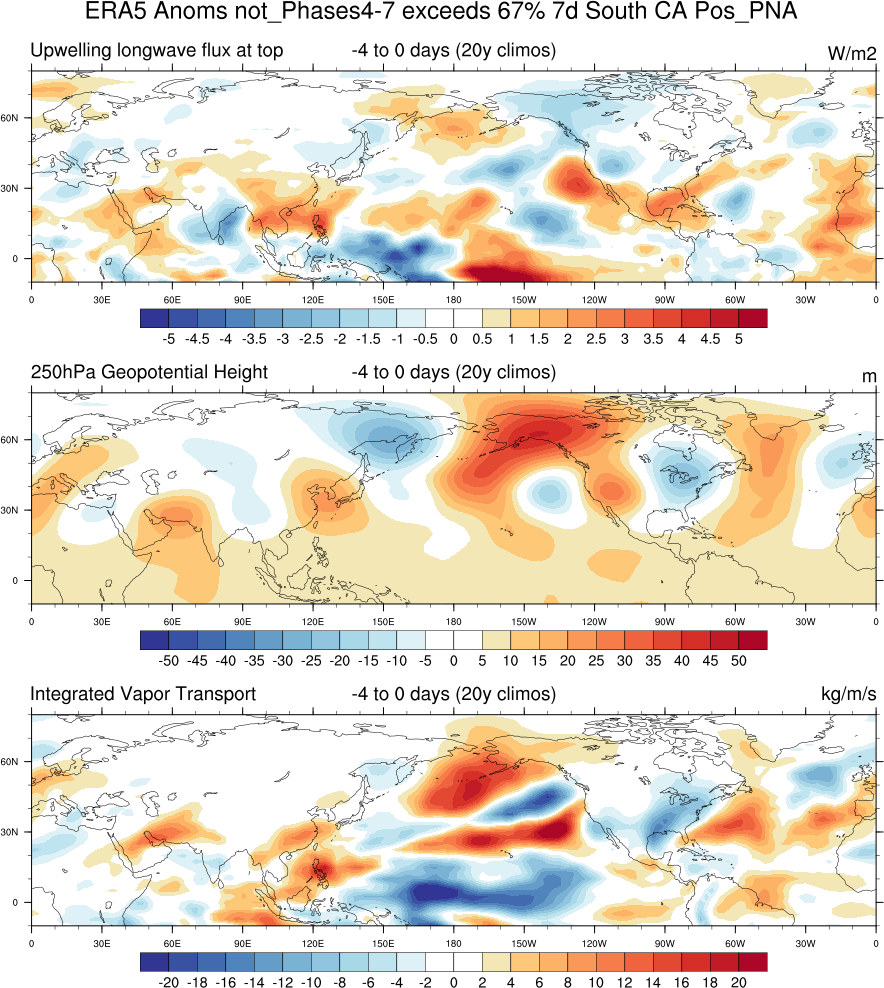
Additional plots, including negative PNA cases, here:
7-day North 67%
7-day South 67%
-----------------------end positive and negative PNA cases section-------------------
-----------------------------no PNA or ENSO cases------------------
MJO phases for lags -15 days to -1 day NorthCentral_CA and South_CA
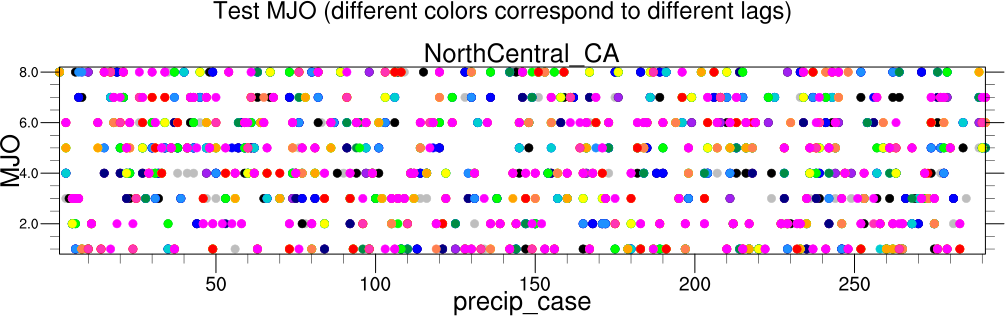
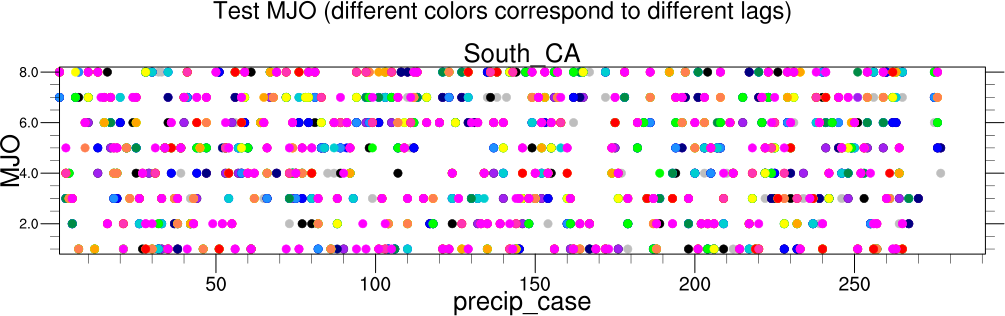
NOT MJO Phases 4,5,6, or 7 between lags -15 days and -1 days
7-day accumulations
Northern_Central California 67 percentile samples at lags -4 to 0 days
Using 20-year antecedent climatologies
Additional plots here:
7-day North 67%
7-day South 67%
-----------------end no PNA or ENSO case sections-----------------
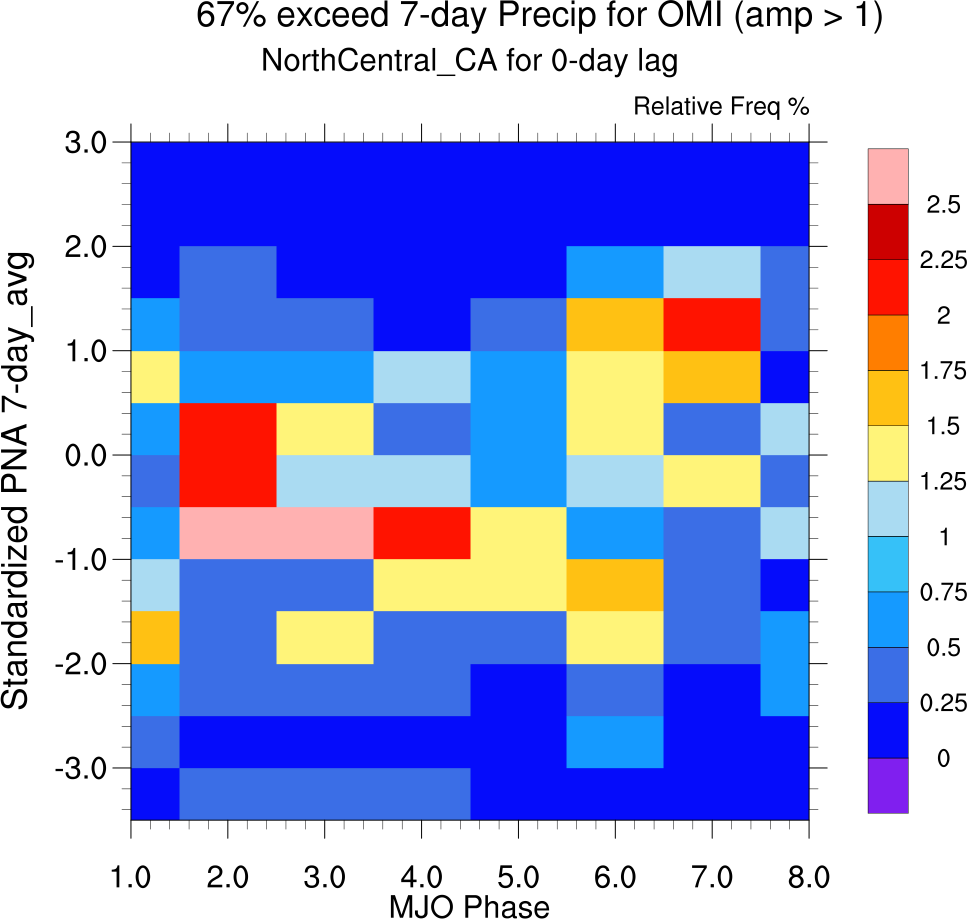
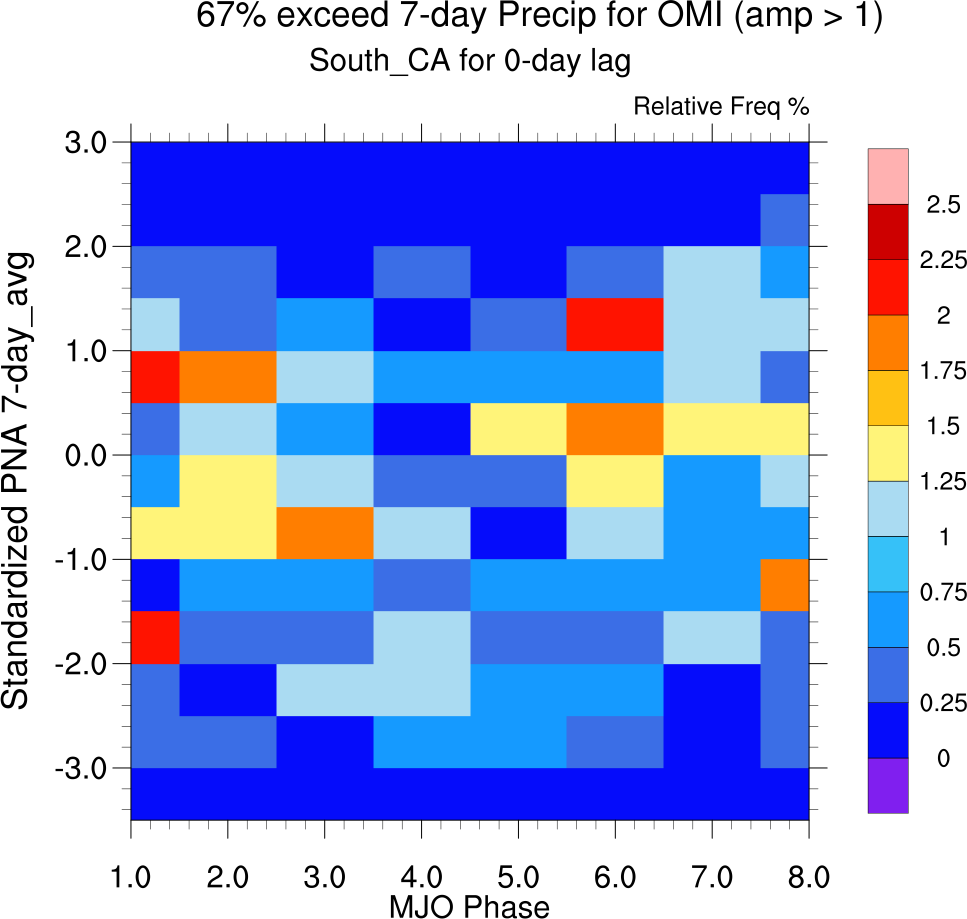
----------------------------16 binned PNA CASES-------------------------------------
Daily PNA standardized and binned into 16 0.5_increments
Relative frequency of precip events as a function of OMI MJO phase and single 7-day_mean PNA 'phase' for 0-day lag
North & Central CA and South CA
Relative frequency of precip events as a function of OMI MJO phase and running 7-day_mean PNA 'phase' for 6-day time-lag bins
North & Central CA and South CA
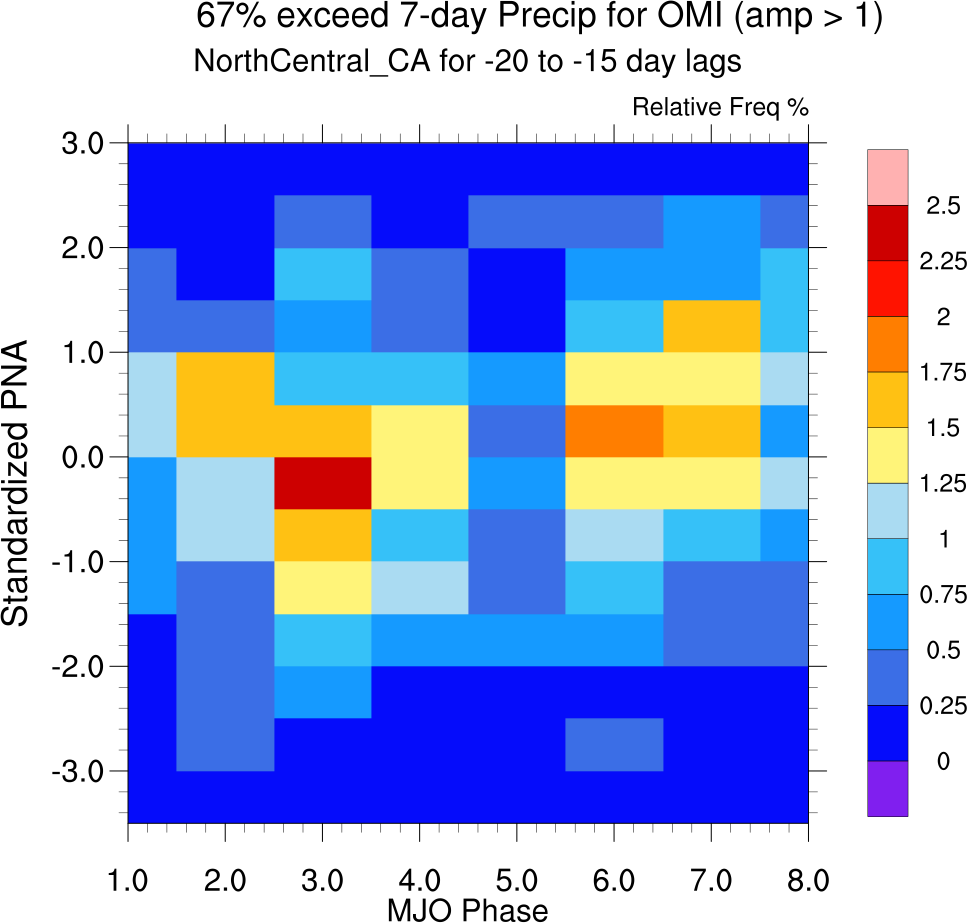
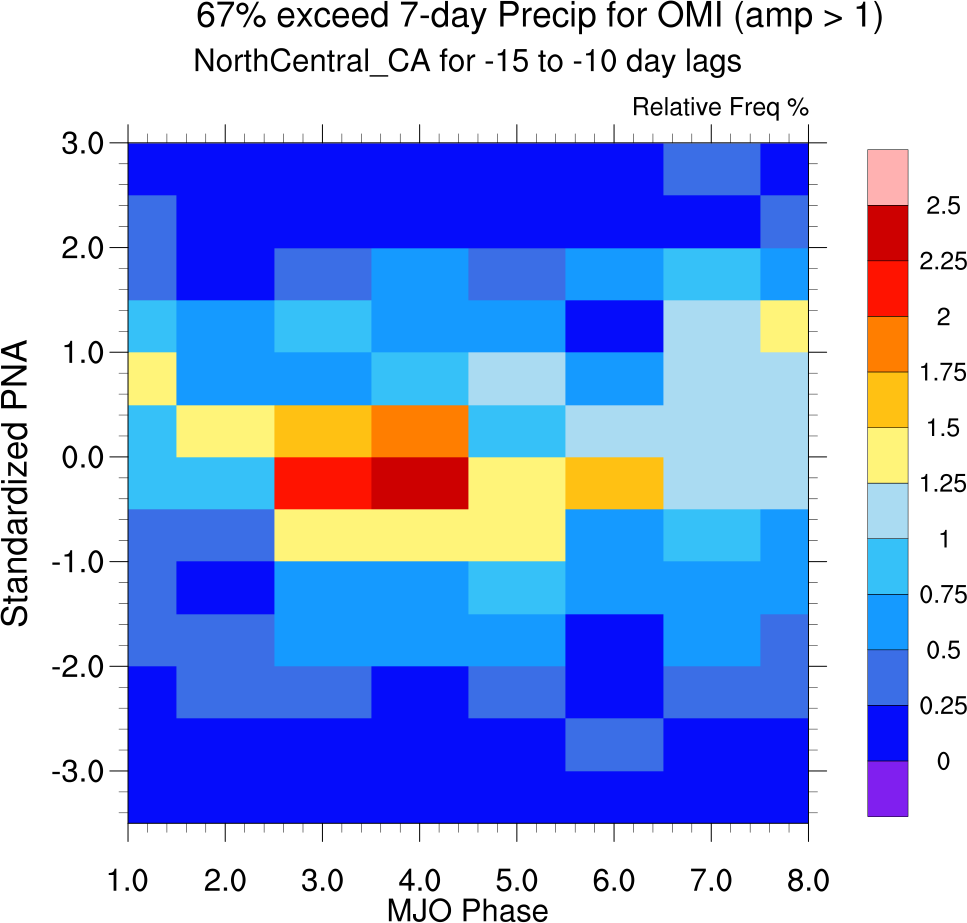
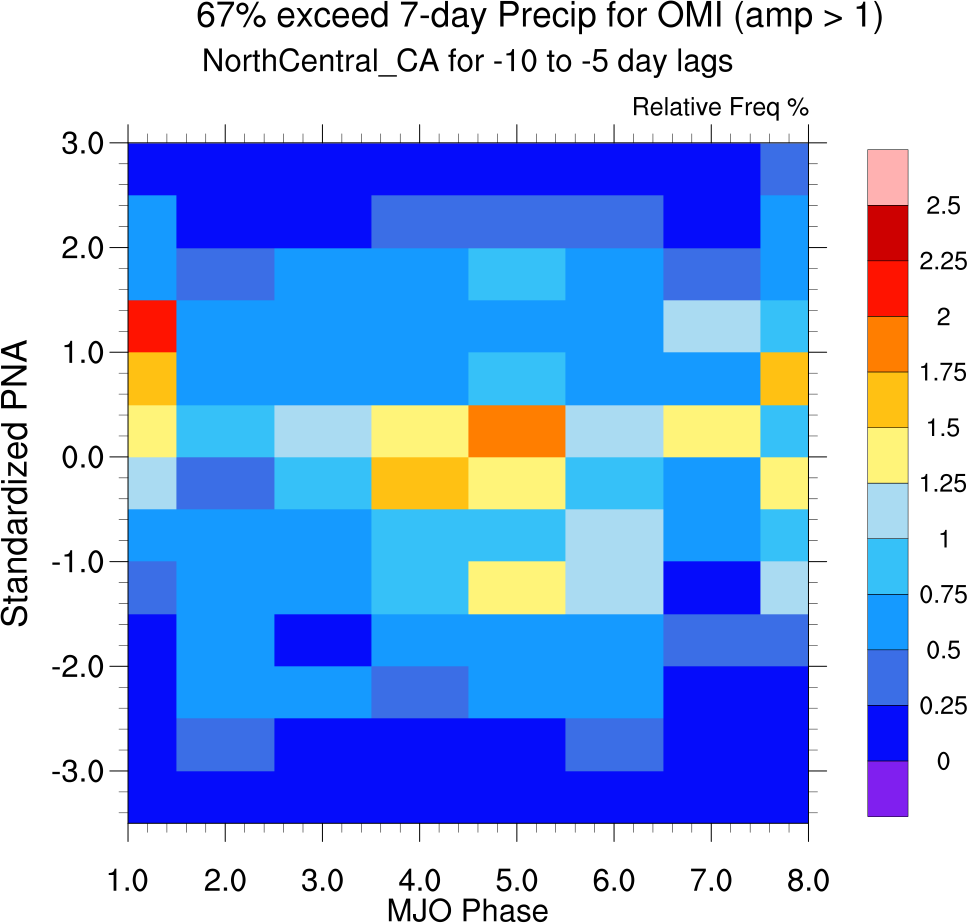
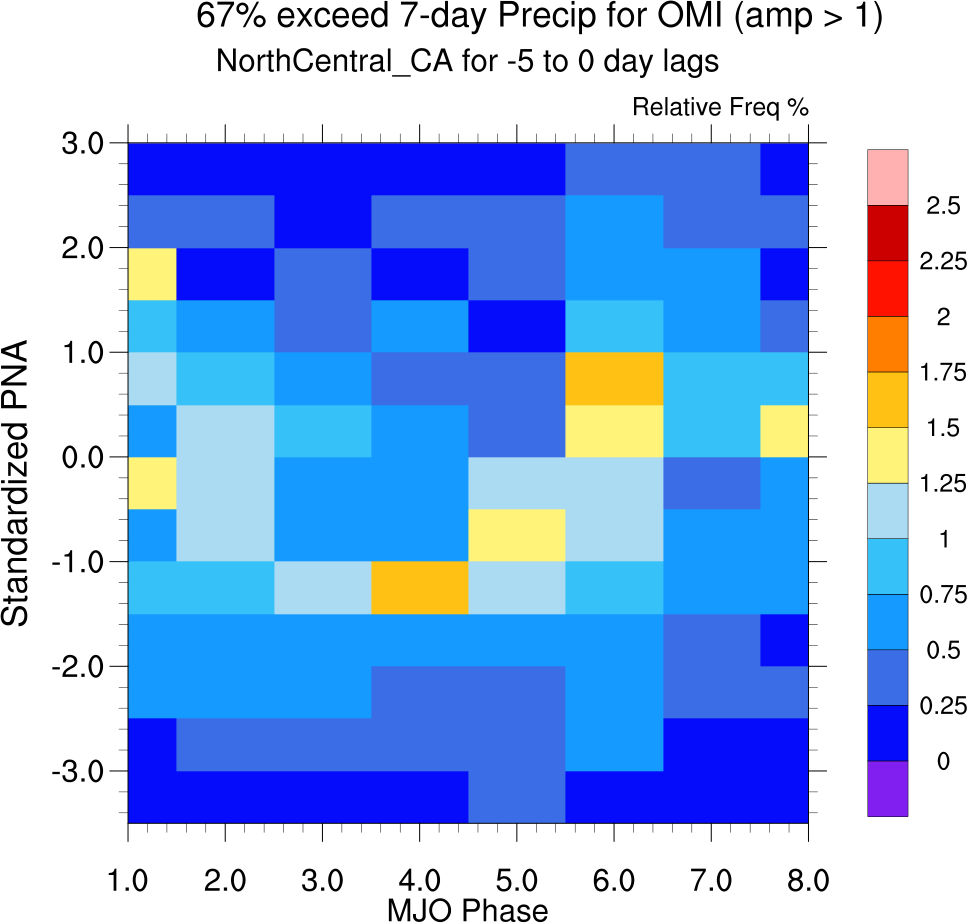
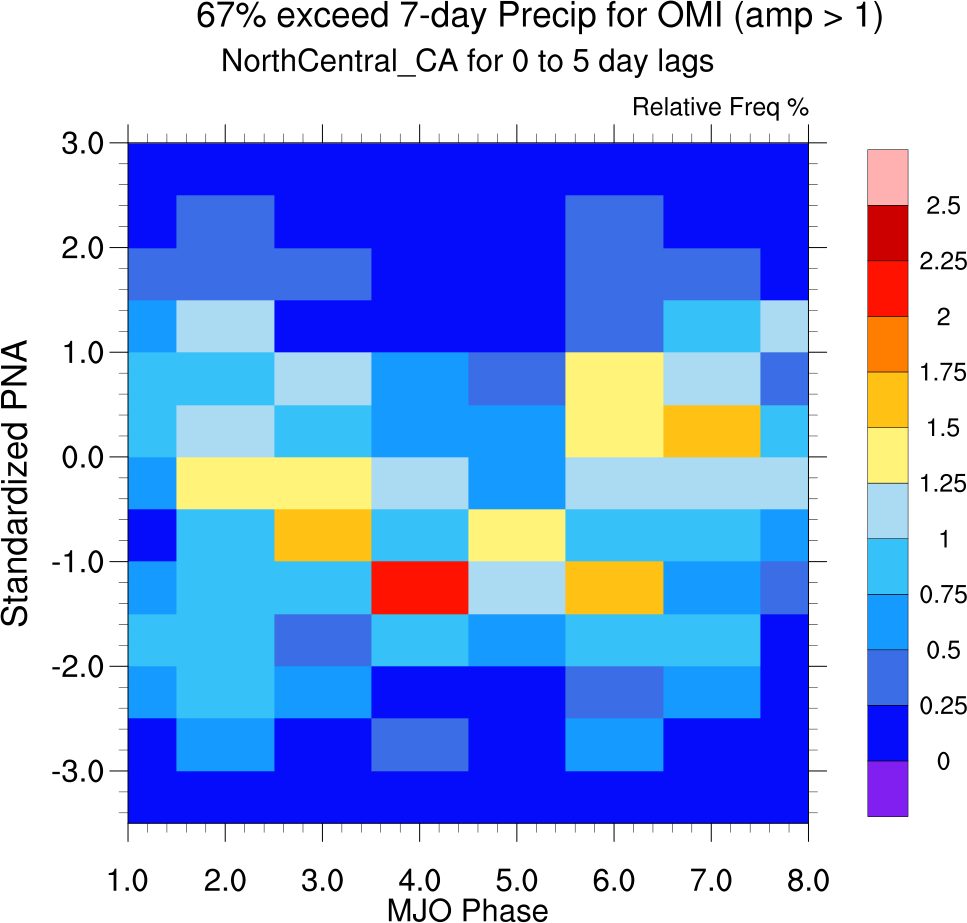
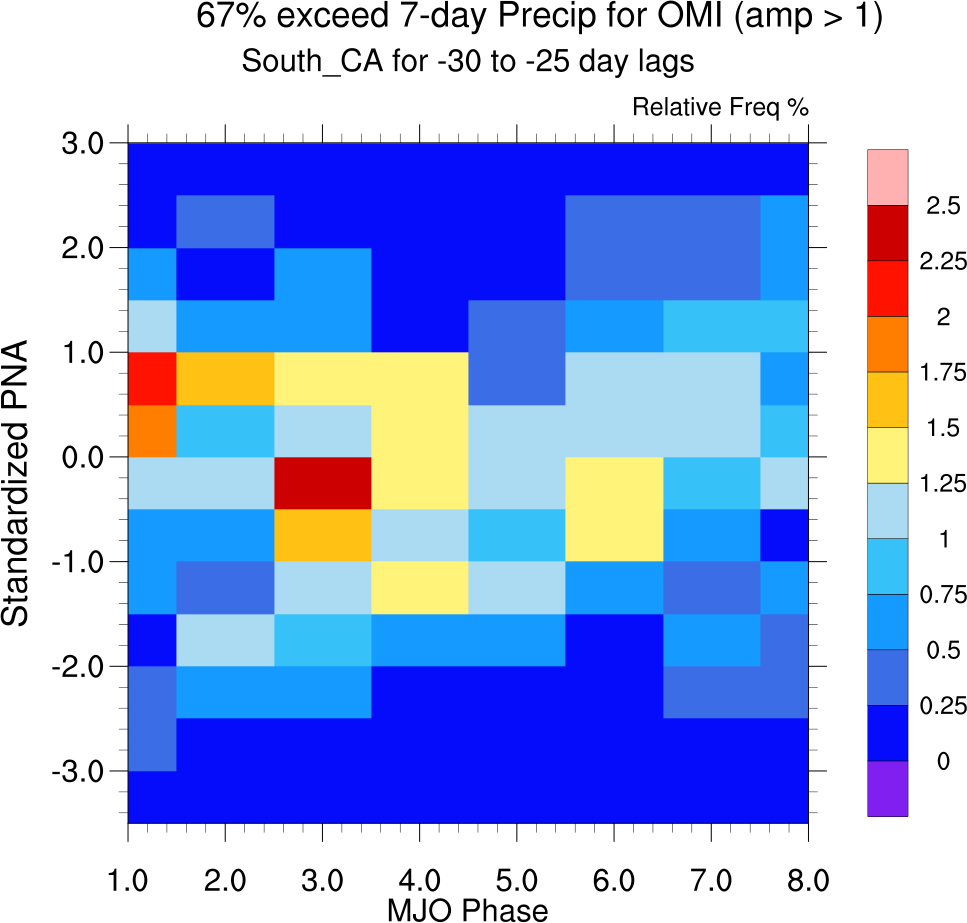
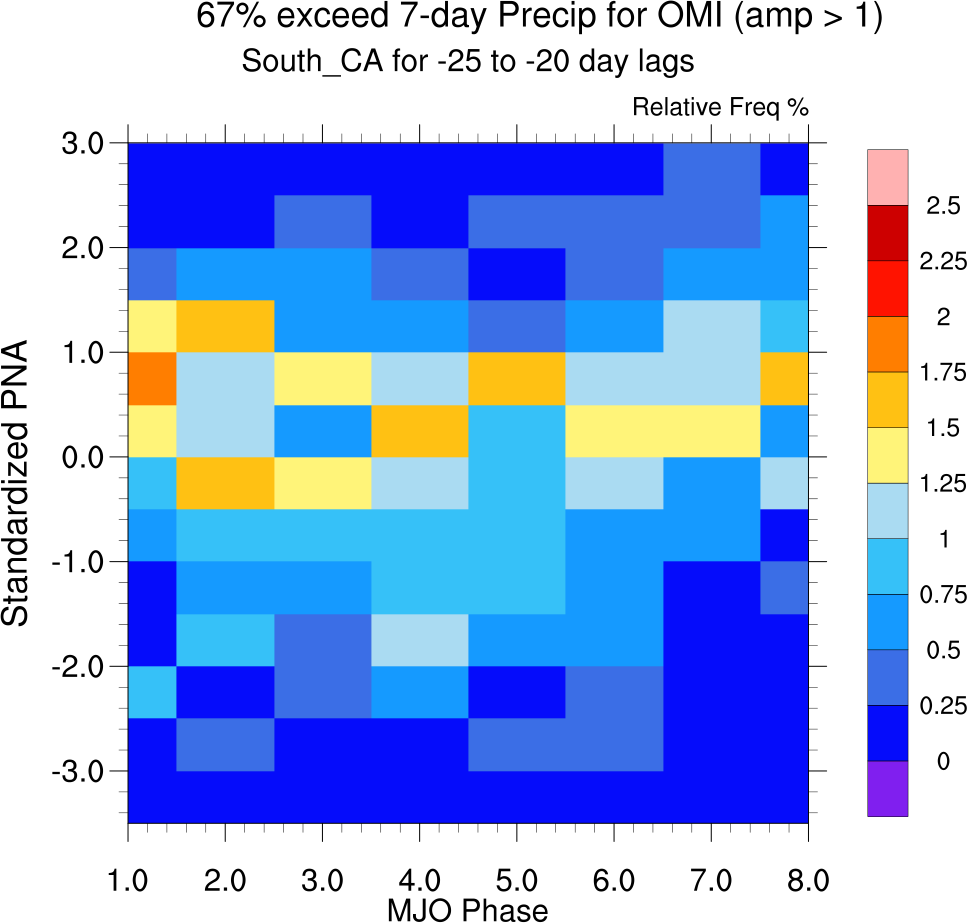
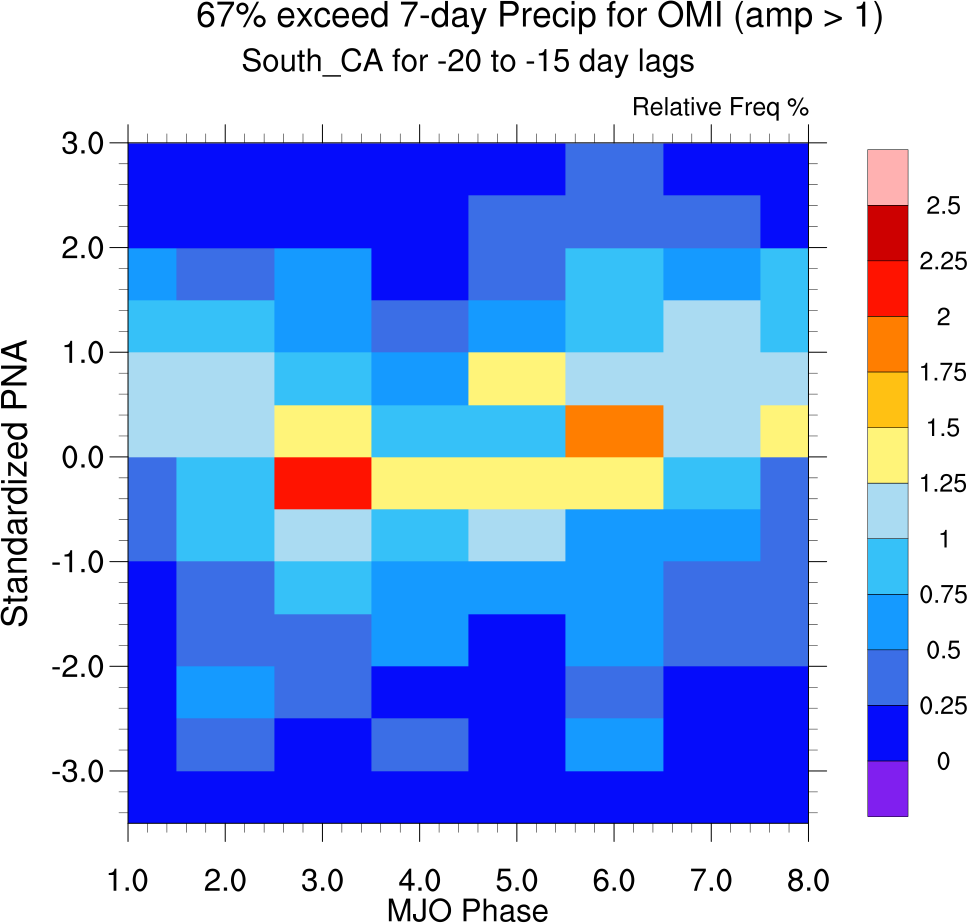
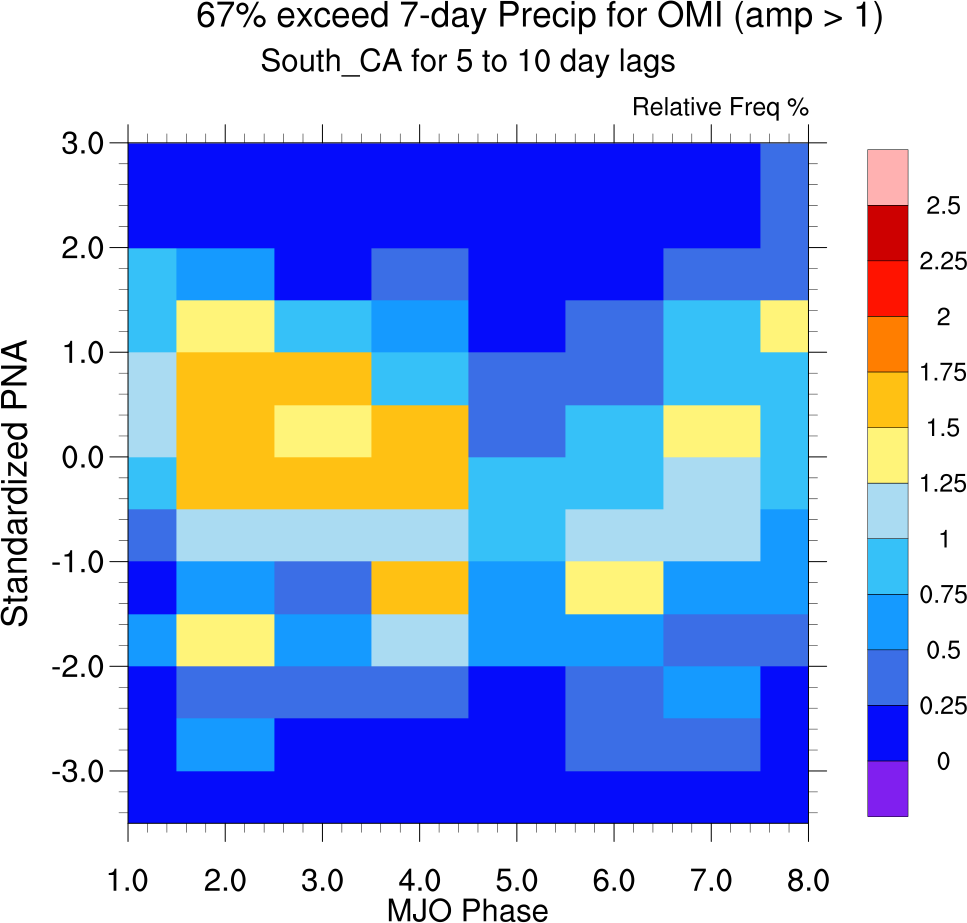
Relative frequency of precip events as a function of OMI MJO phase and daily PNA 'phase' for 5-day time-lag bins
North & Central CA

South CA
-------------------------------end 16 binned PNA cases section-----------
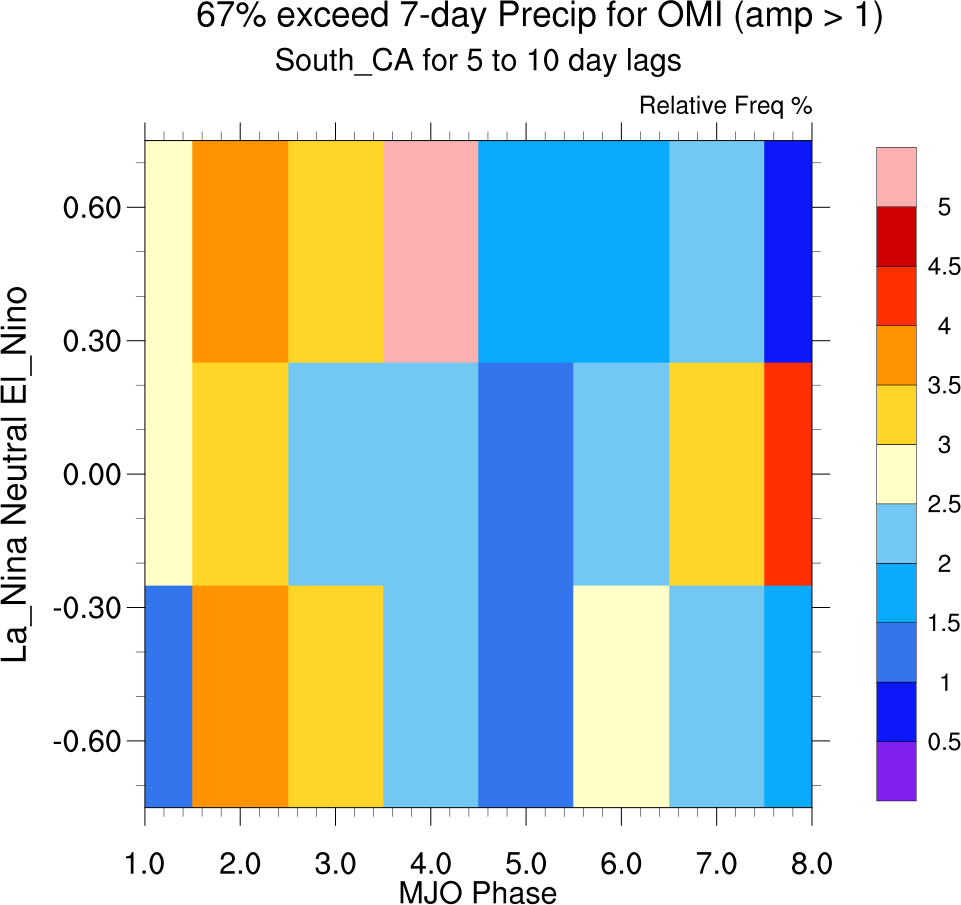
---------------------------------ENSO CASES----------------------------------------------------
Monthly ENSO Oceanic Nino Index (https://origin.cpc.ncep.noaa.gov/products/analysis_monitoring/ensostuff/ONI_v5.php) from NOAA CPC
Relative frequency of precip events as a function of OMI MJO phase and ENSO phase for 5-day time-lag bins
North & Central CA
South CA
-------------------------------end ENSO cases section----------------------------
ERA5 Anomalies corresponding to nClimDiv Precip exceedances
MJO amplitude < 1 for all times between lags -15 days and -1 days
7-day accumulations California 67 percentile samples at lags -4 to 0 days, using 20-yr climos
(No cases.)
MJO amplitude > 1 and Phases 4,5,6, or 7 at least 3 times between lags -15 days and -1 days
7-day accumulations California 67 percentile samples at lags -4 to 0 days, using 20-yr climos
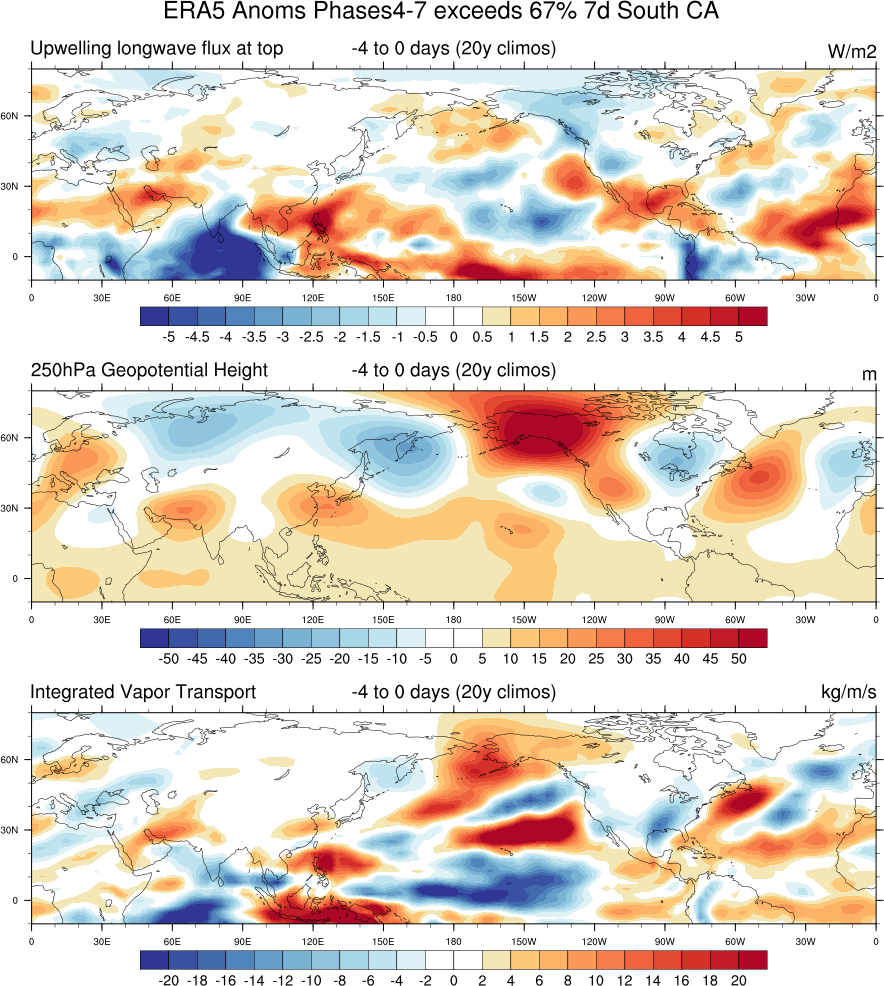
Additional plots here:
7-day North 67%
7-day South 67%
Re. OMI Phase Frequency Anomaly with boostrapping for extreme CA precip with MJO leads and precip lags:
7-day accumulations:
Northern_Central & Southern California 67th percentile (MJOs radius>1) Two MJO Phases at a time
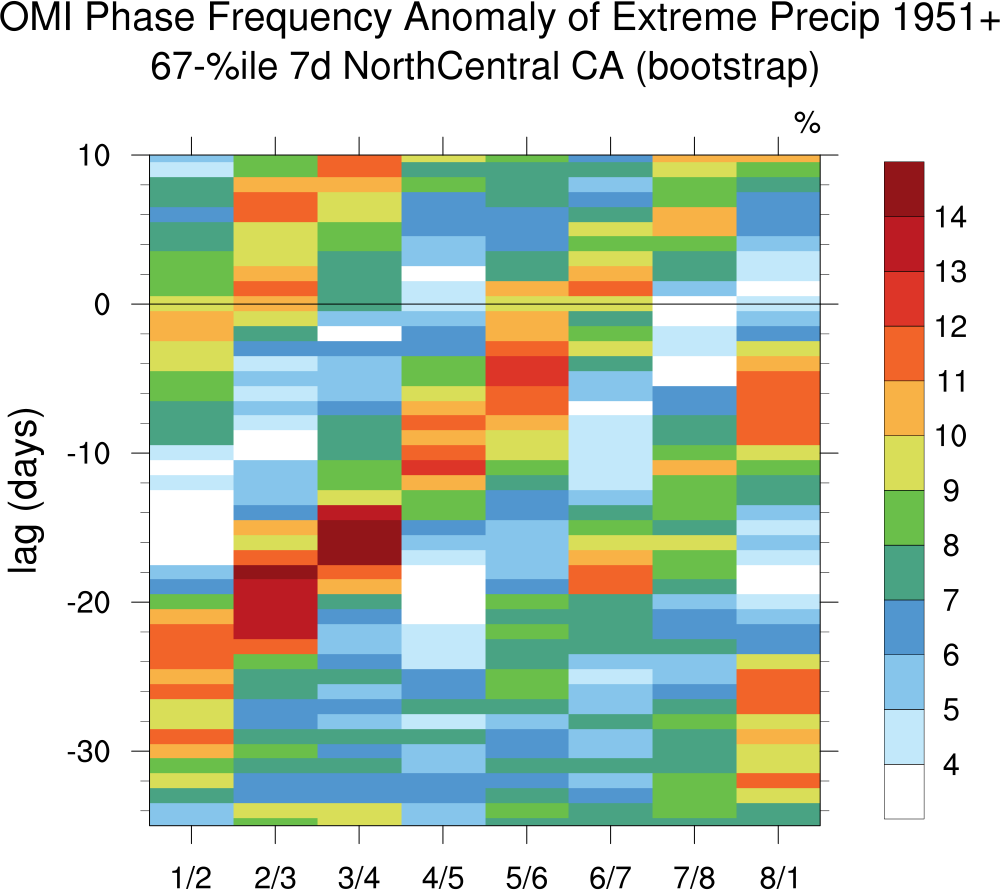
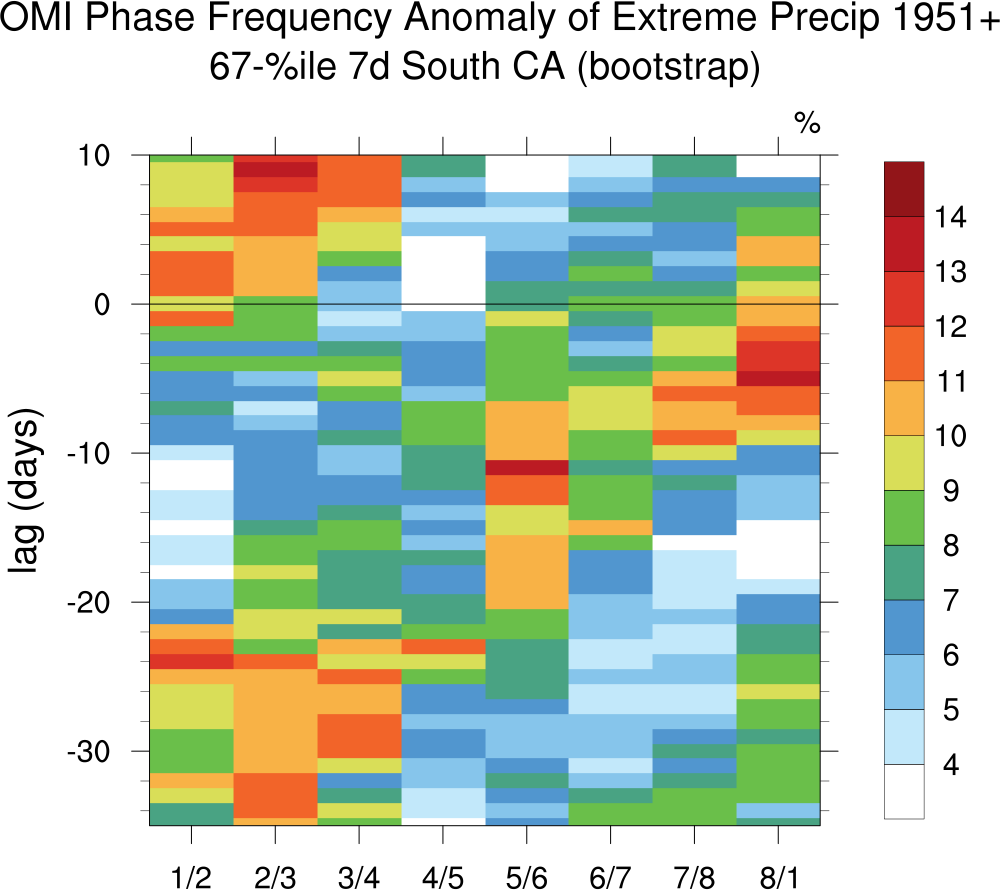
where anomalies obtained by subtracting the boostrap averages
All plots/analyses updated with lag-0 date corresponding to event onset rather than event end
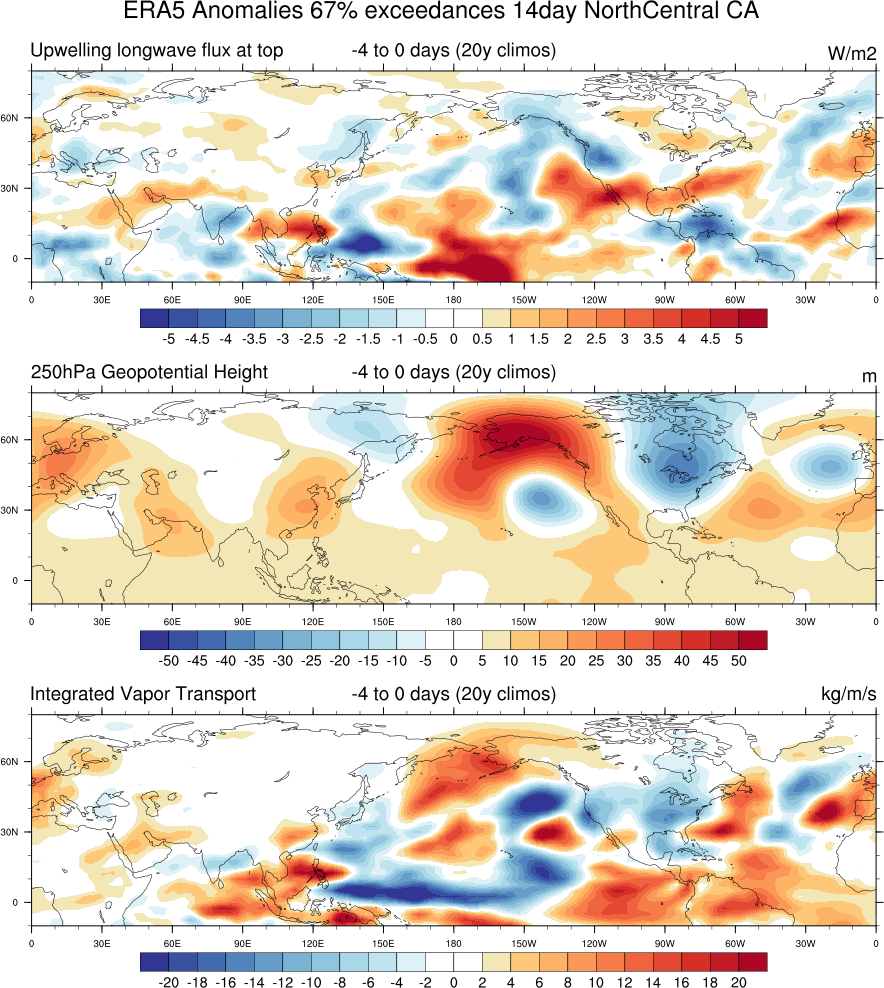
ERA5 Anomalies corresponding to nClimDiv Precip exceedances
7-day, 14-day accumulations
Northern_Central California 67 percentile samples at lags -4 to 0 days
Using 20-year antecedent climatologies
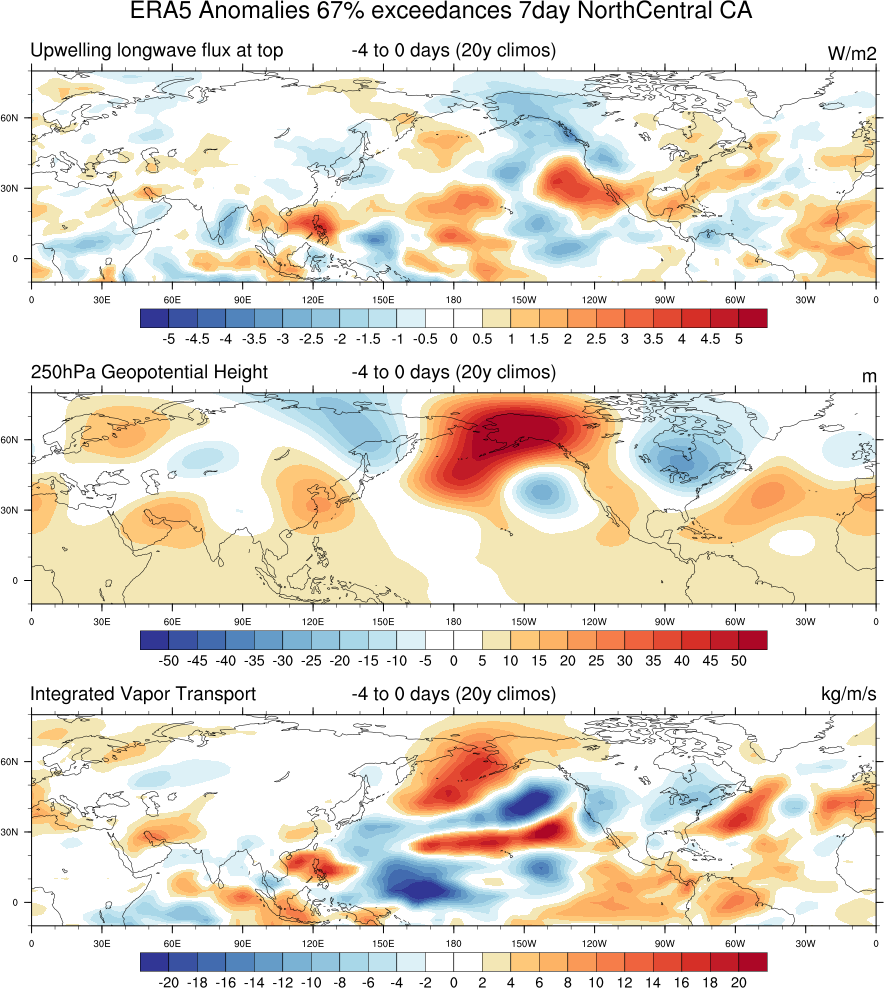
Additional plots here:
7-day North 67%
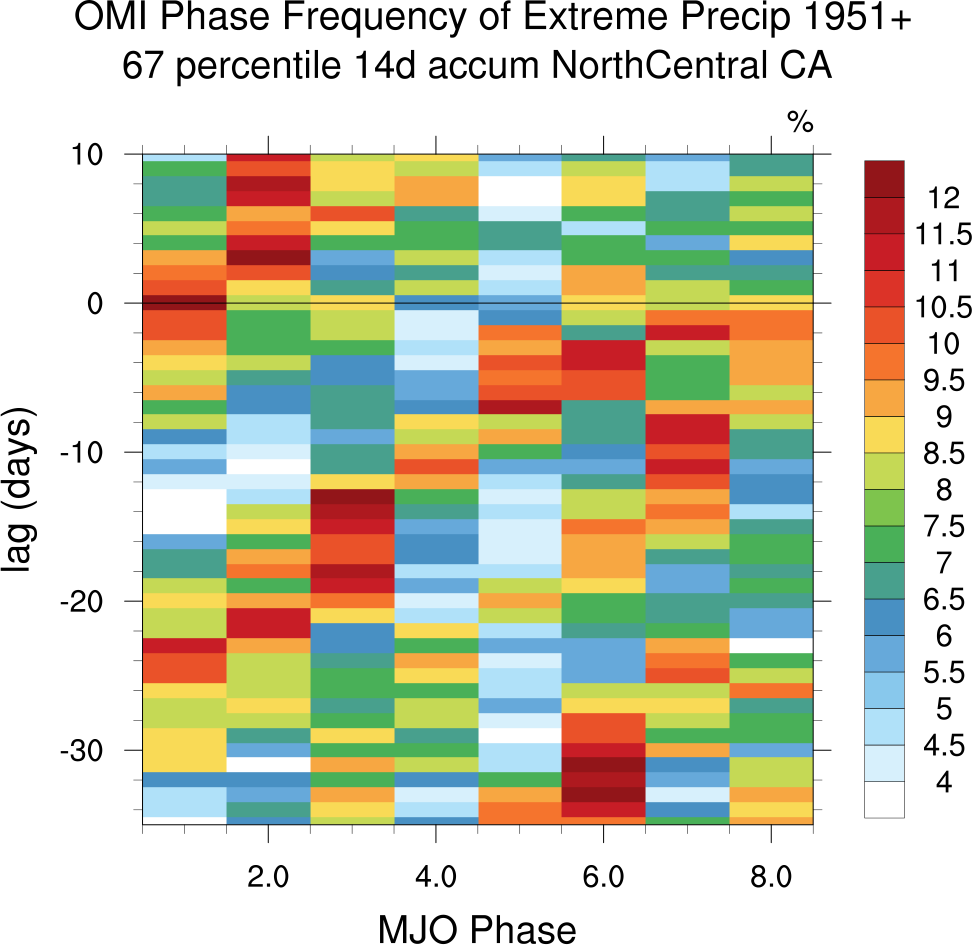
14-day North 67%
7-day South 67%
14-day South 67%
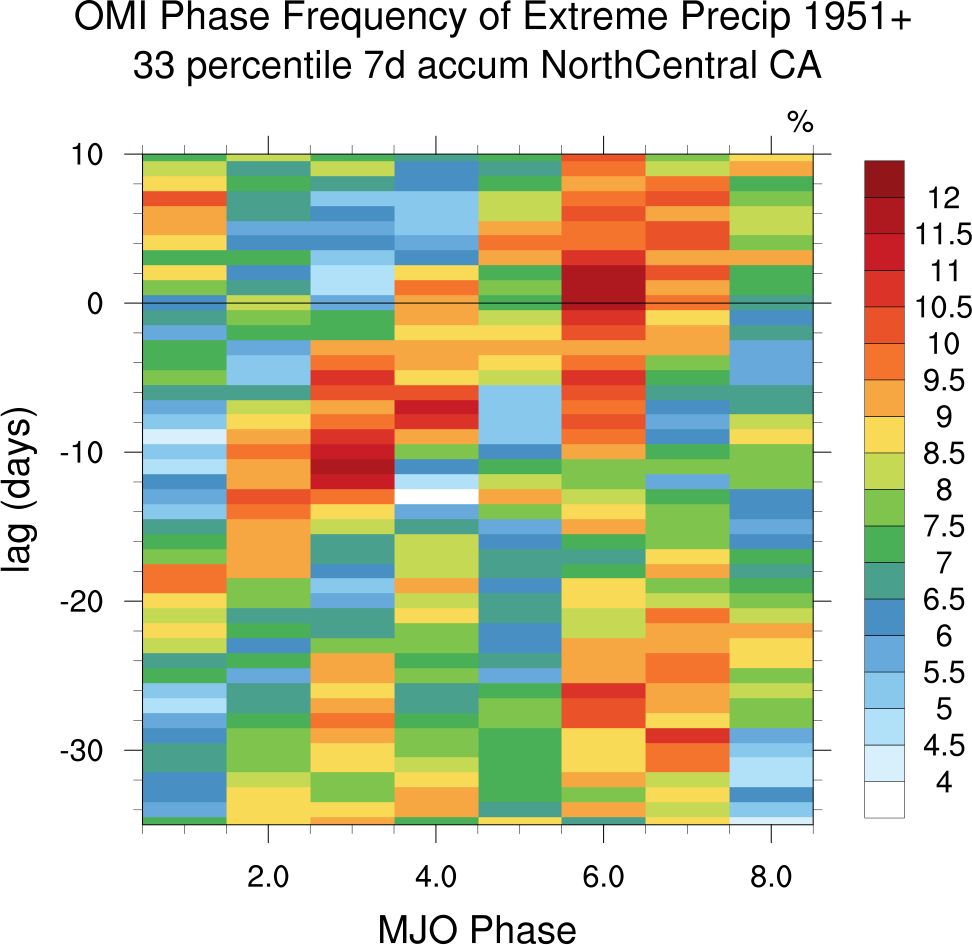
7-day North 33%
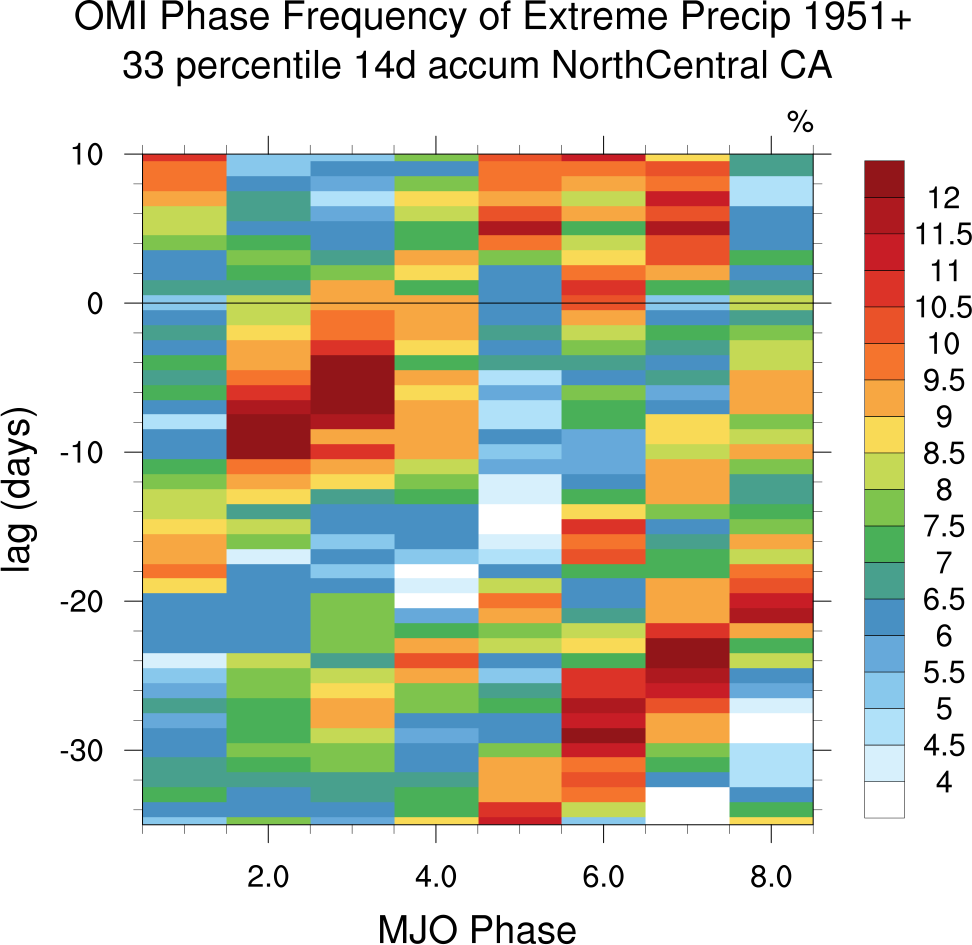
14-day North 33%
7-day South 33%
14-day South 33%
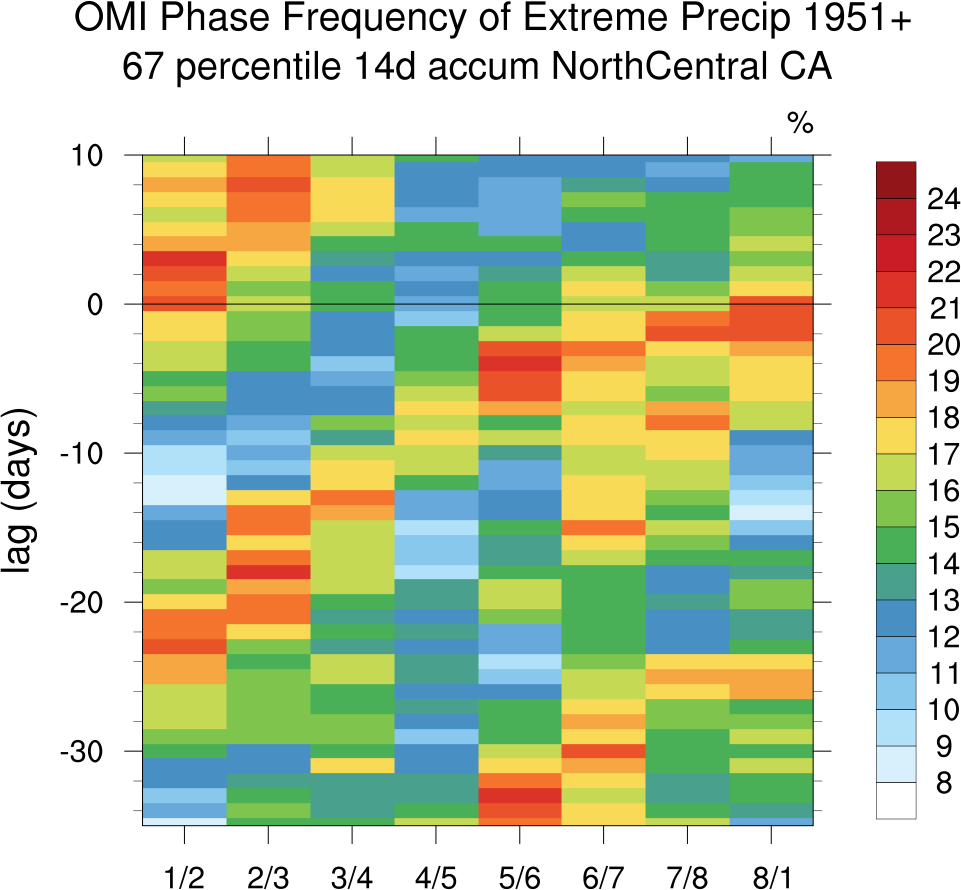
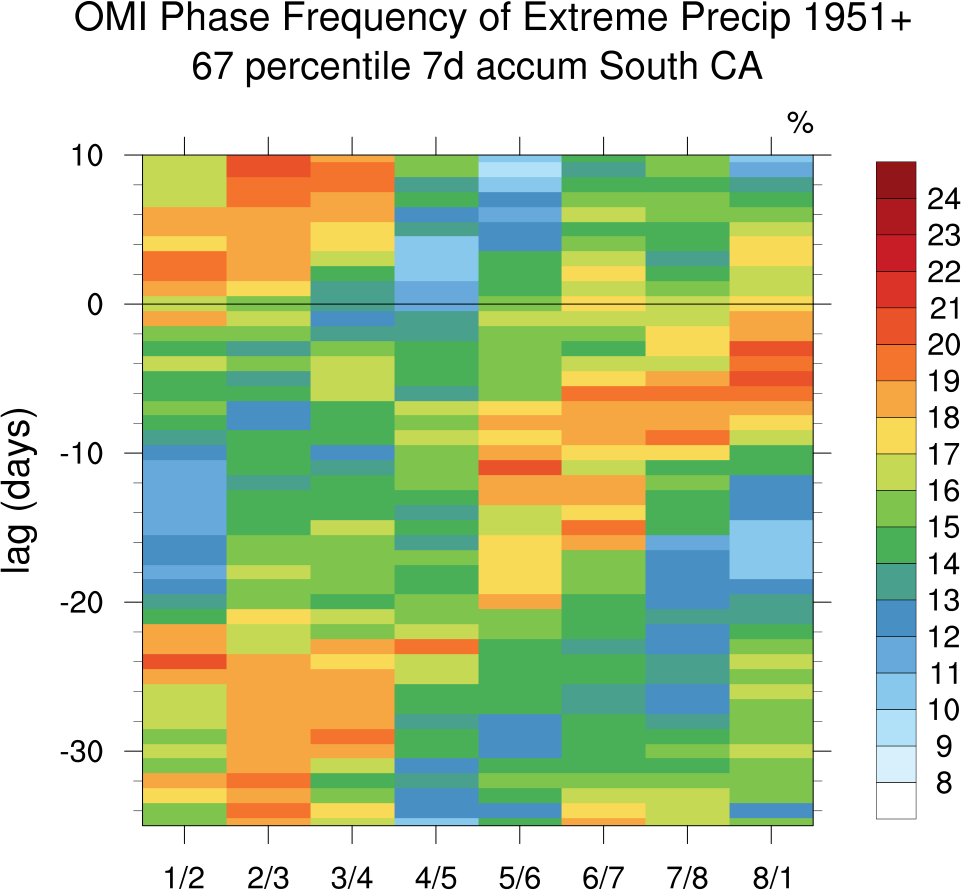
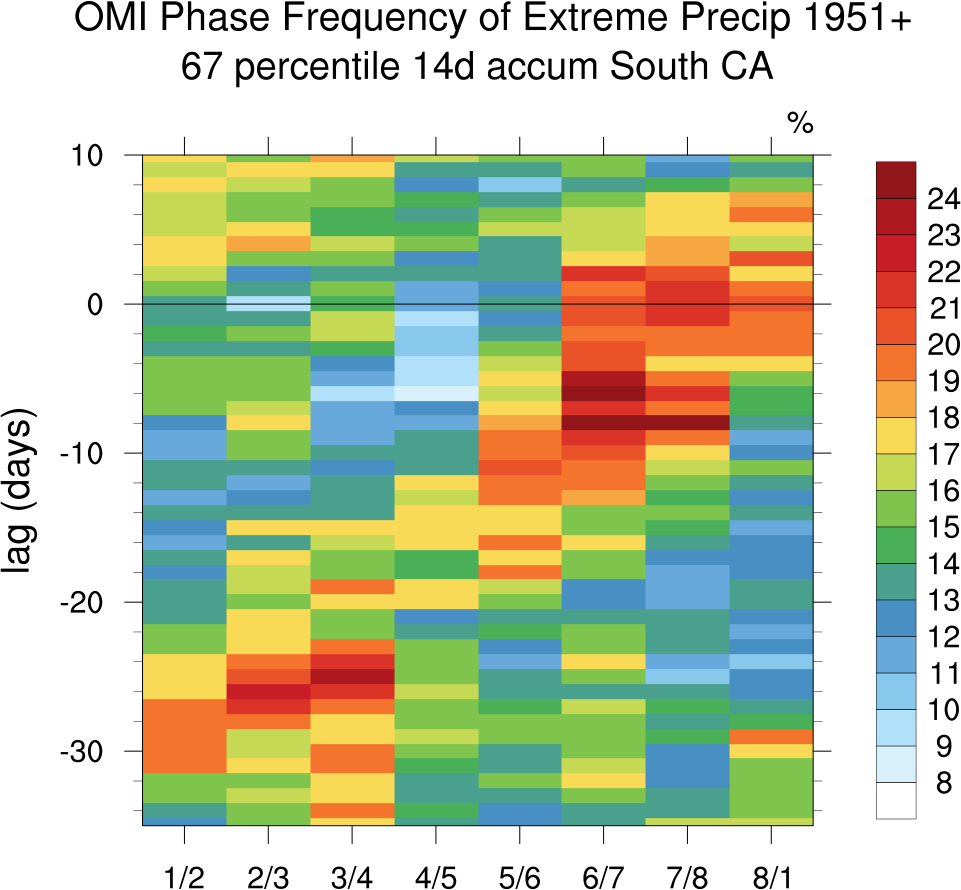
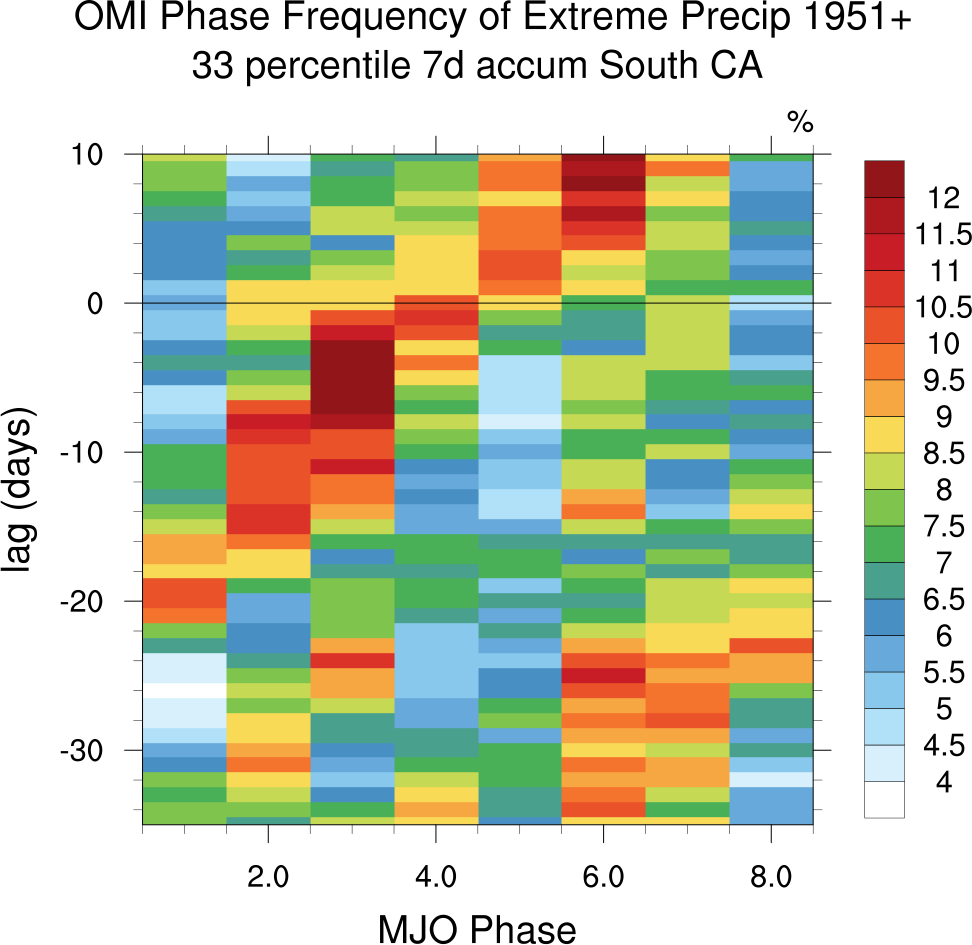
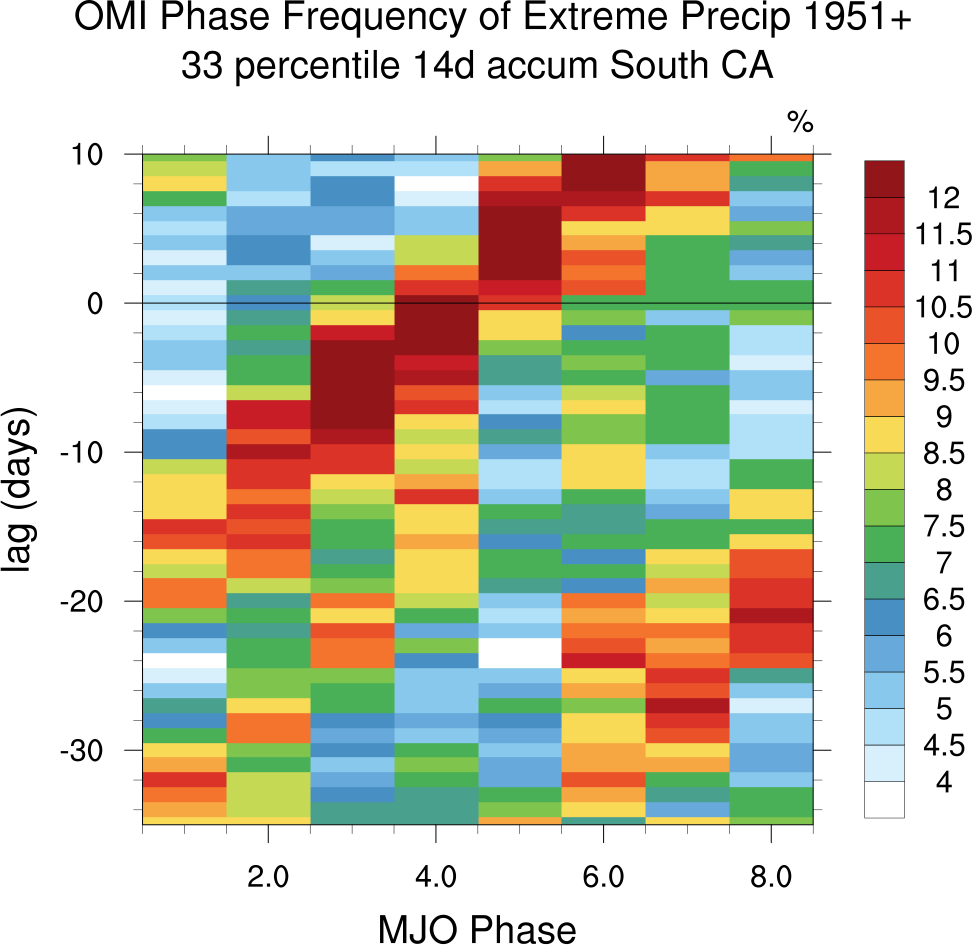
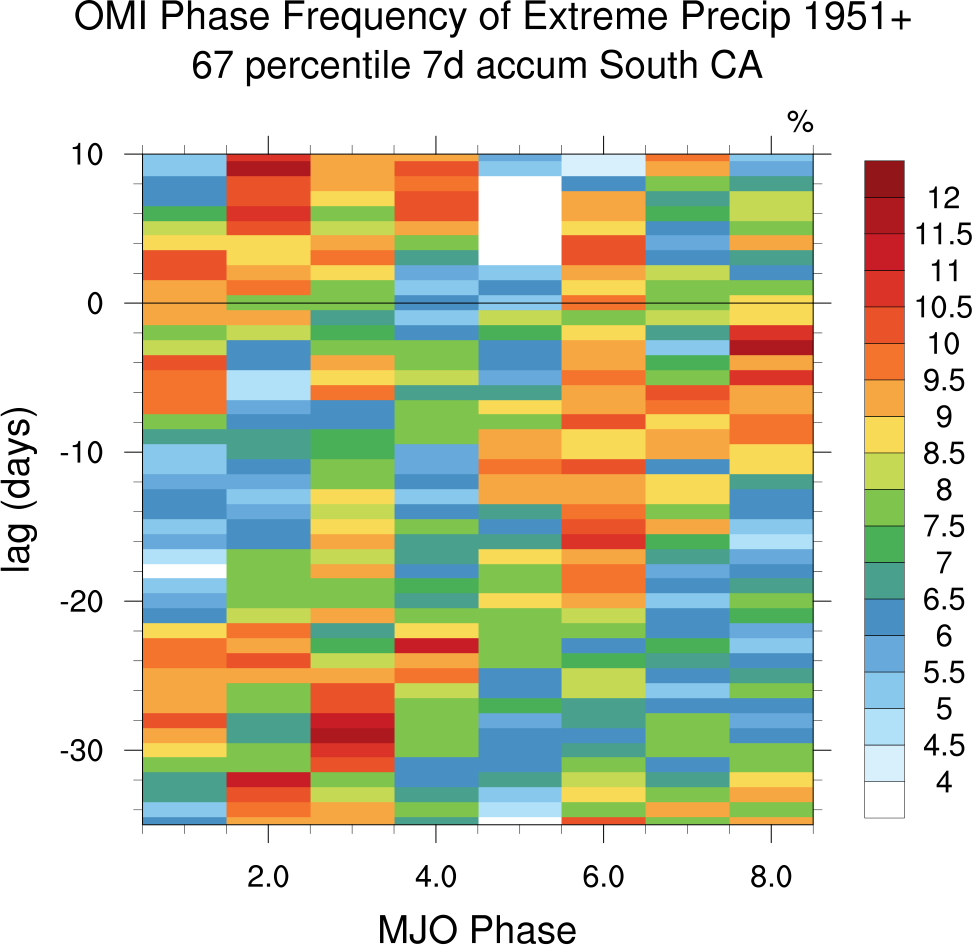
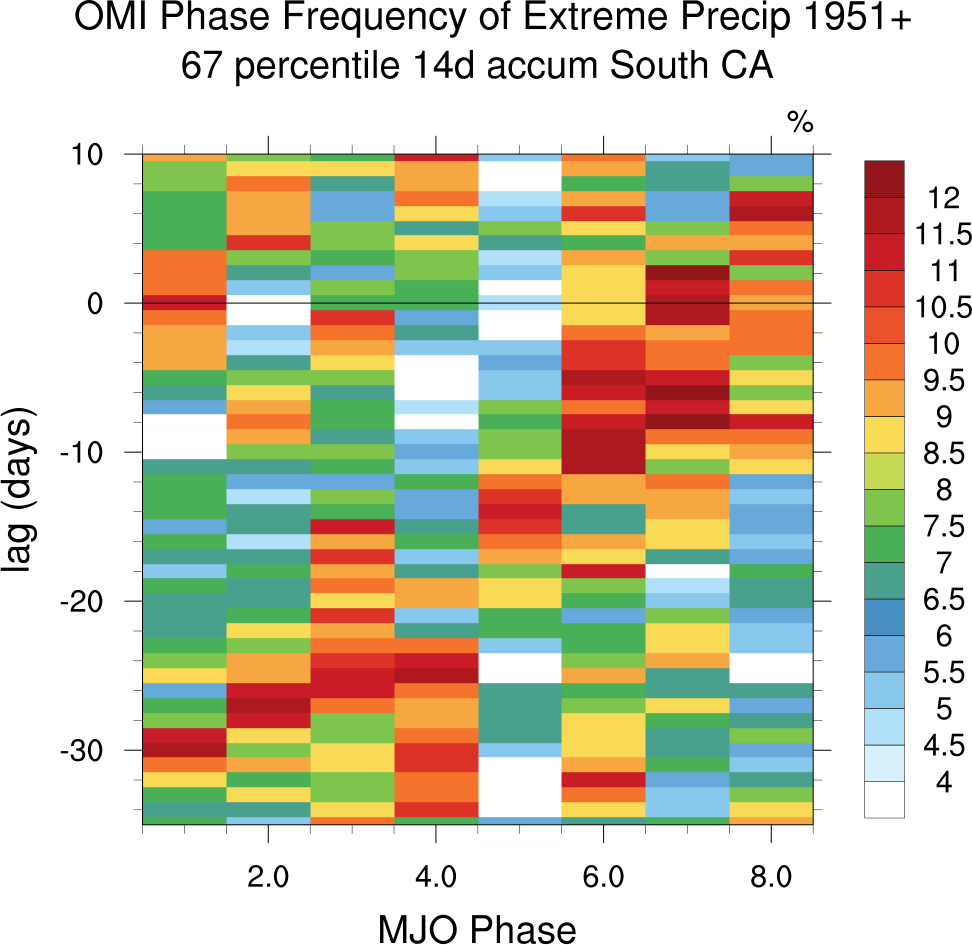
Re. OMI Phase frequency and extreme CA precip with MJO leads and precip lags:
7-day, 14-day accumulations:
Northern_Central California 33rd percentile (MJOs radius>1) Two MJO Phases at a time
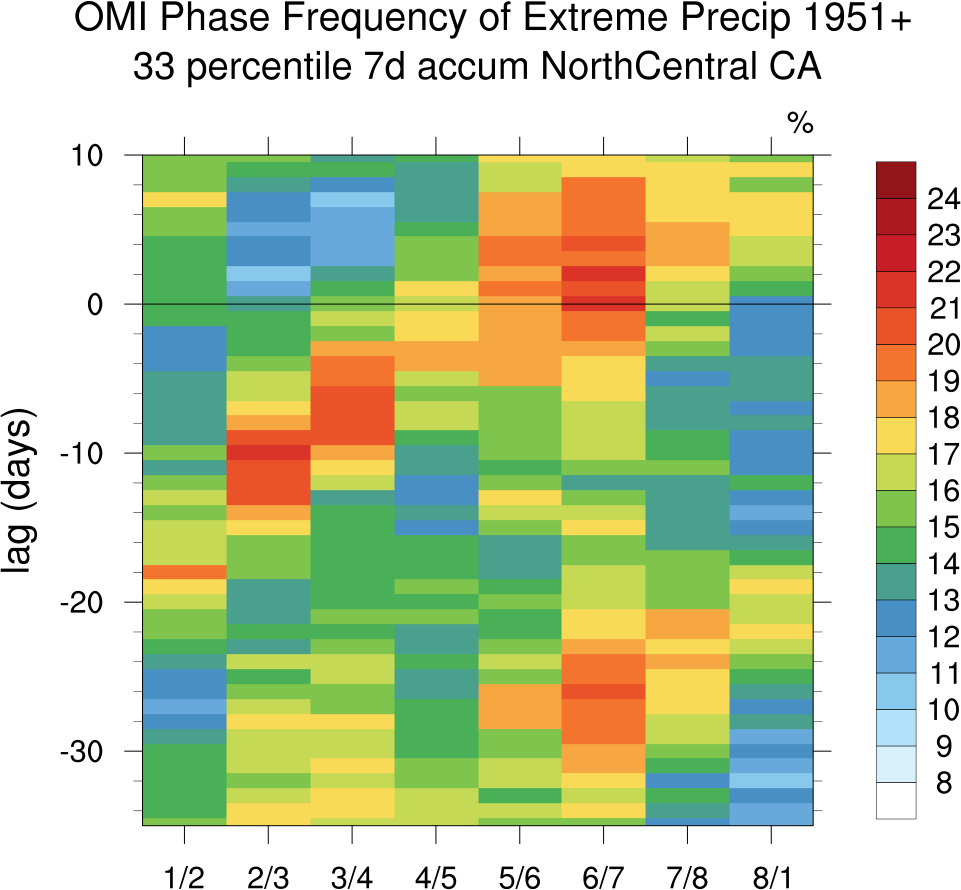
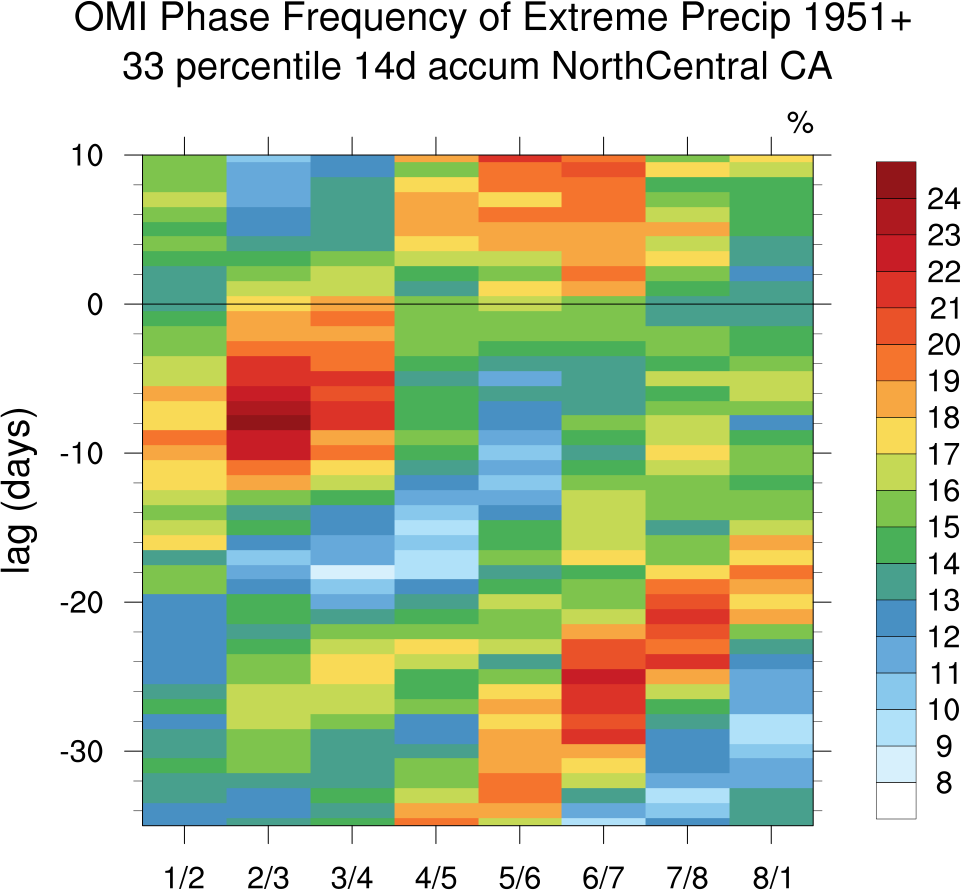
Northern_Central California 67th percentile (MJOs radius>1) Two MJO Phases at a time
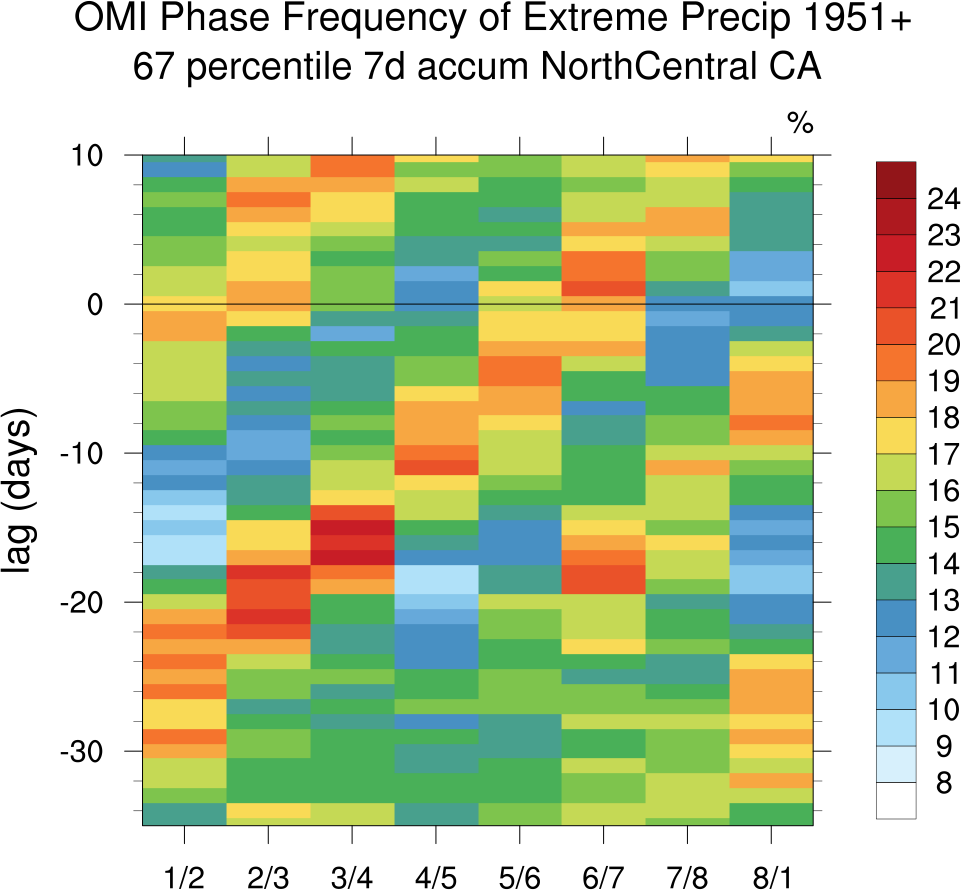
Southern California 33rd percentile (MJOs radius>1) Two MJO Phases at a time
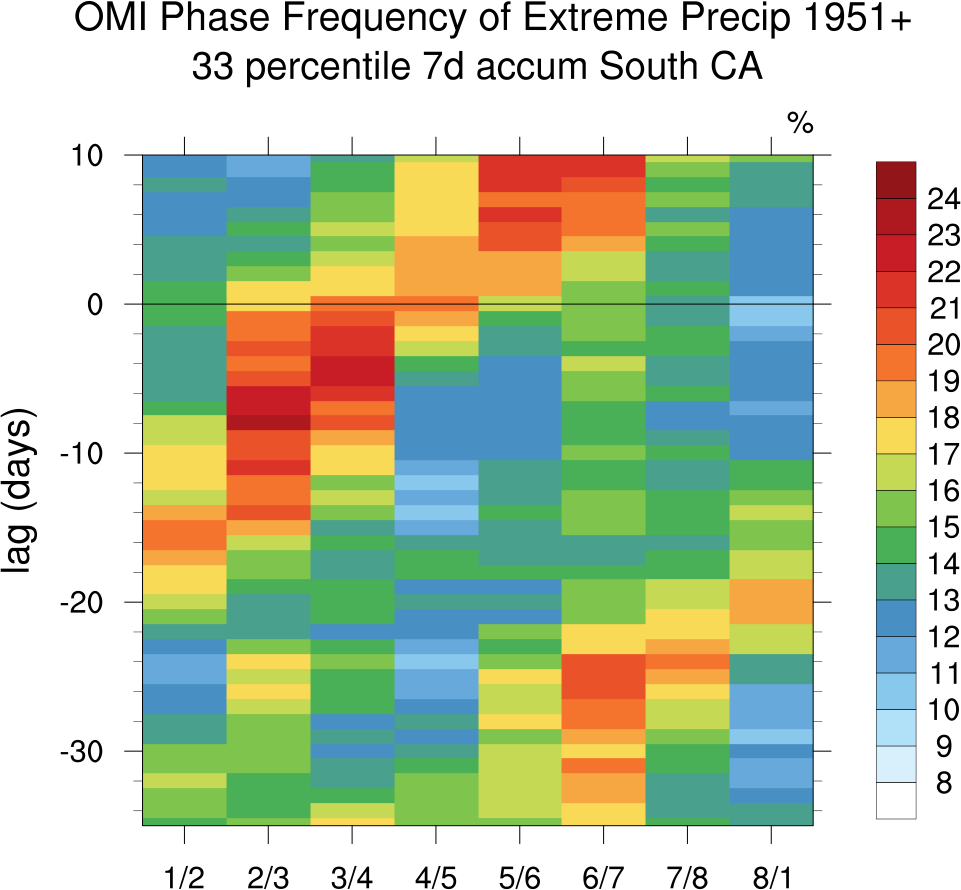

Southern California 67th percentile (MJOs radius>1) Two MJO Phases at a time
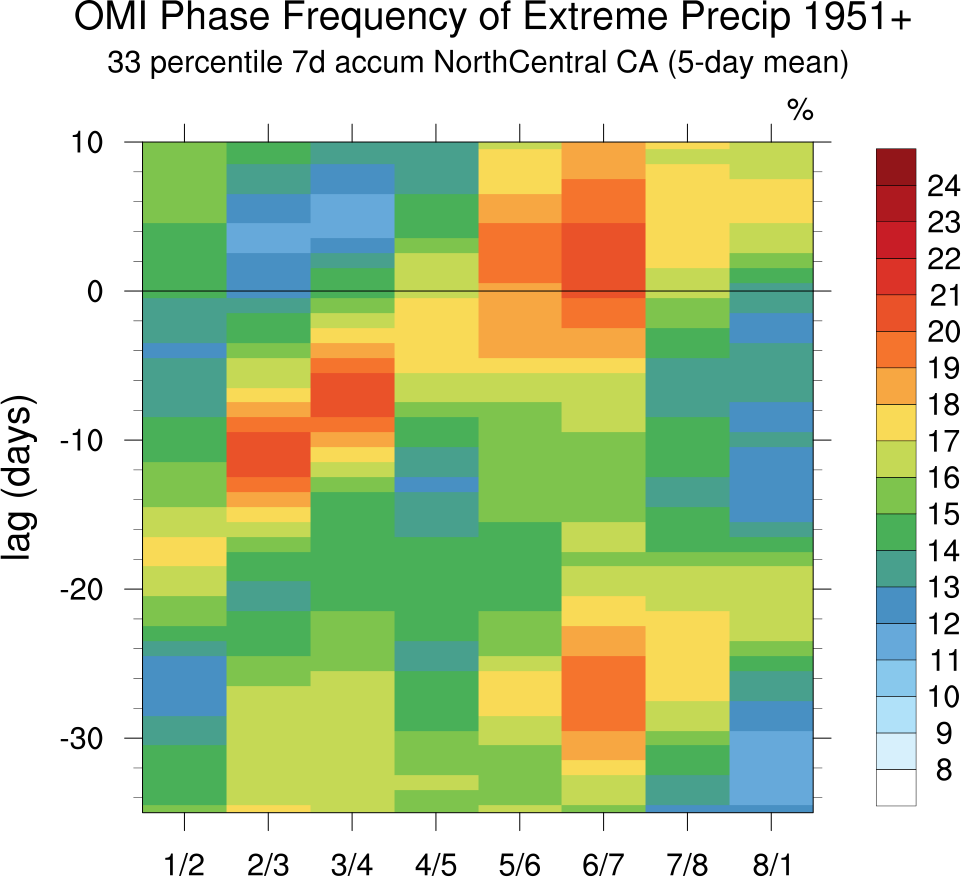
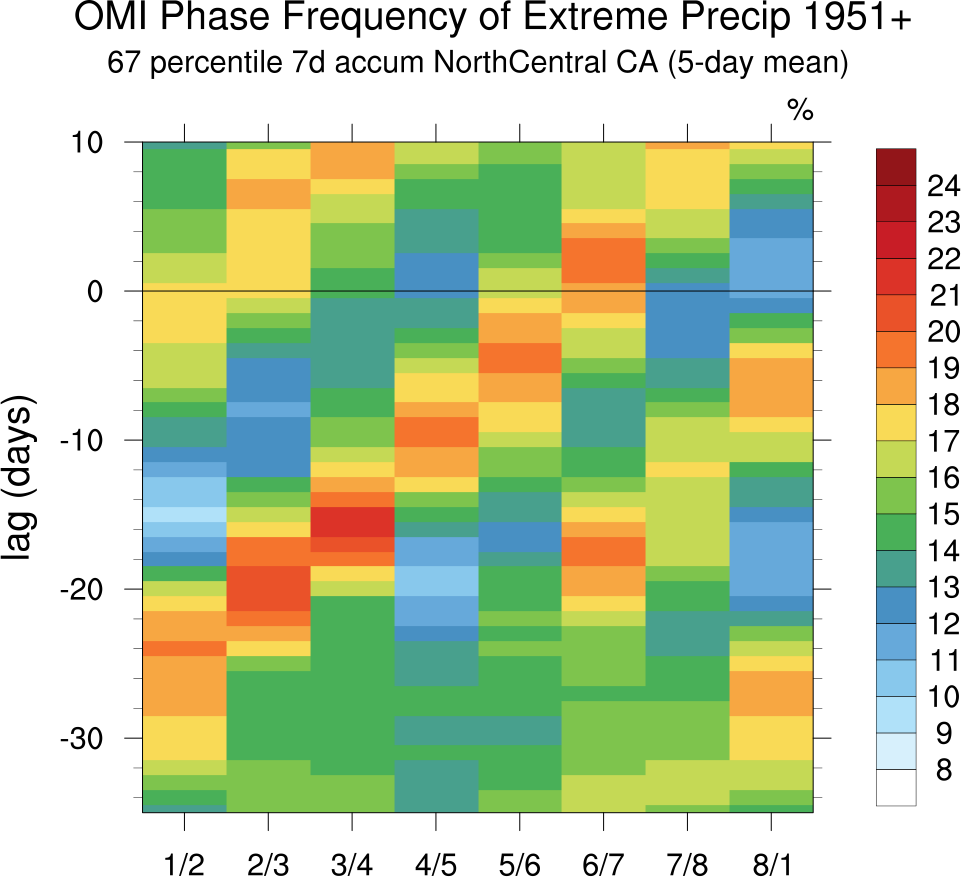
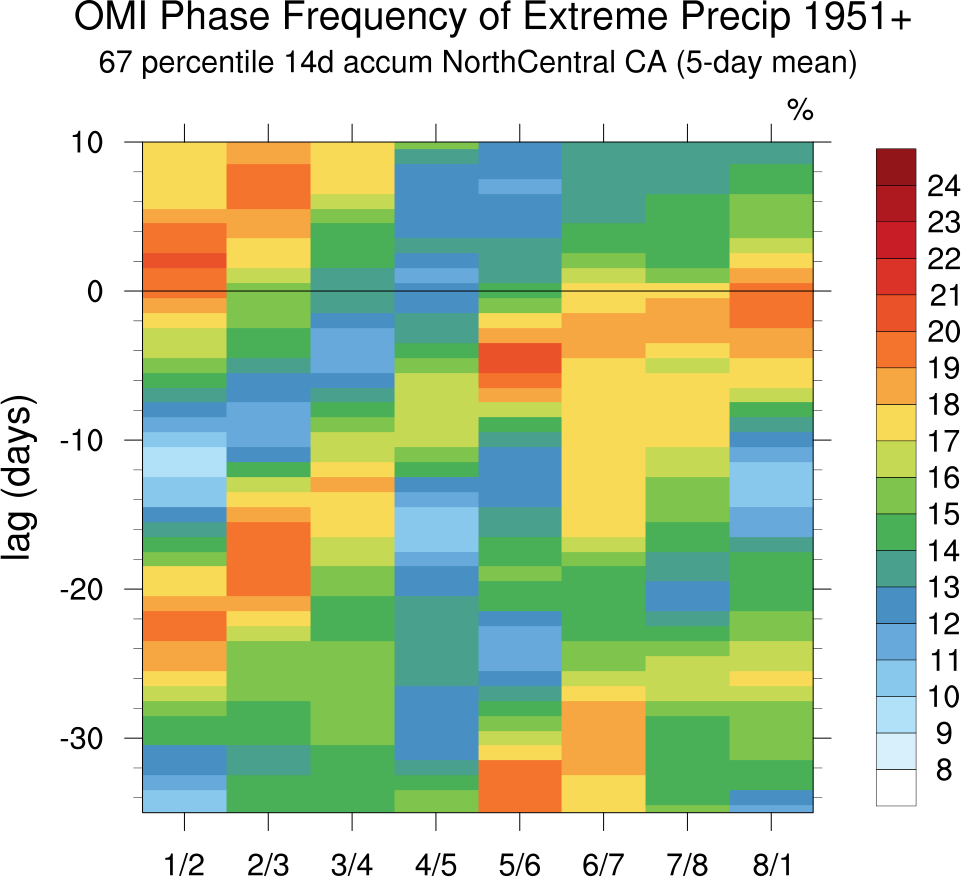
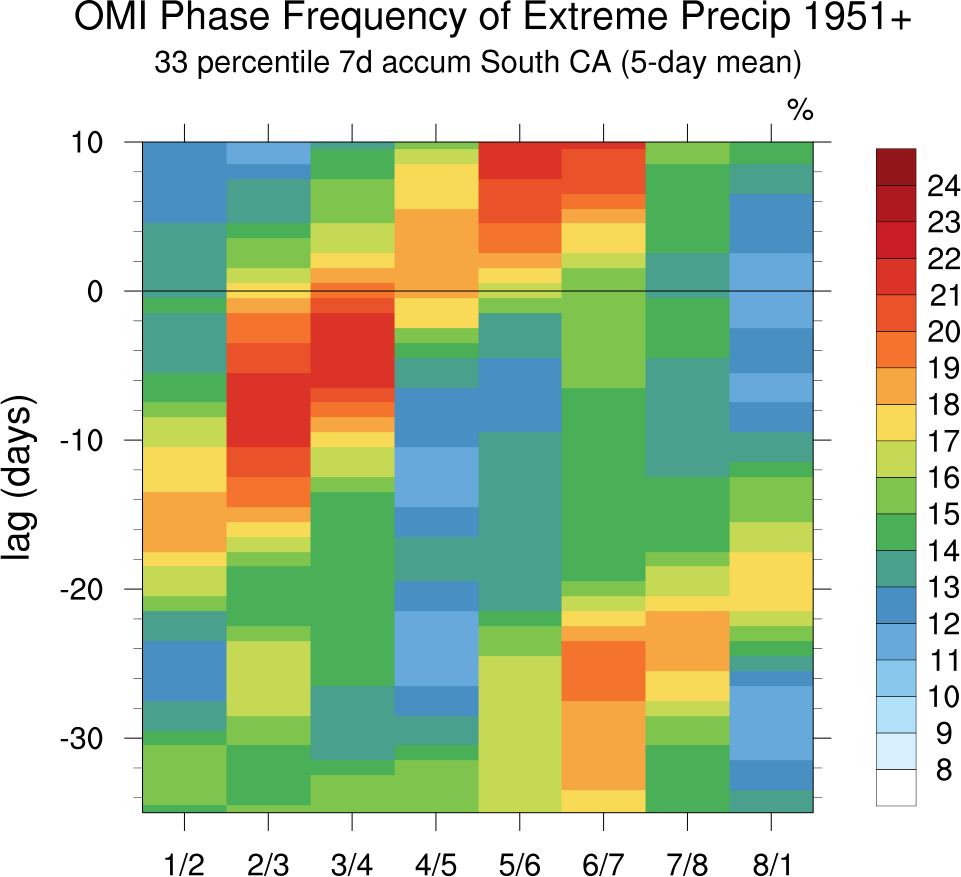
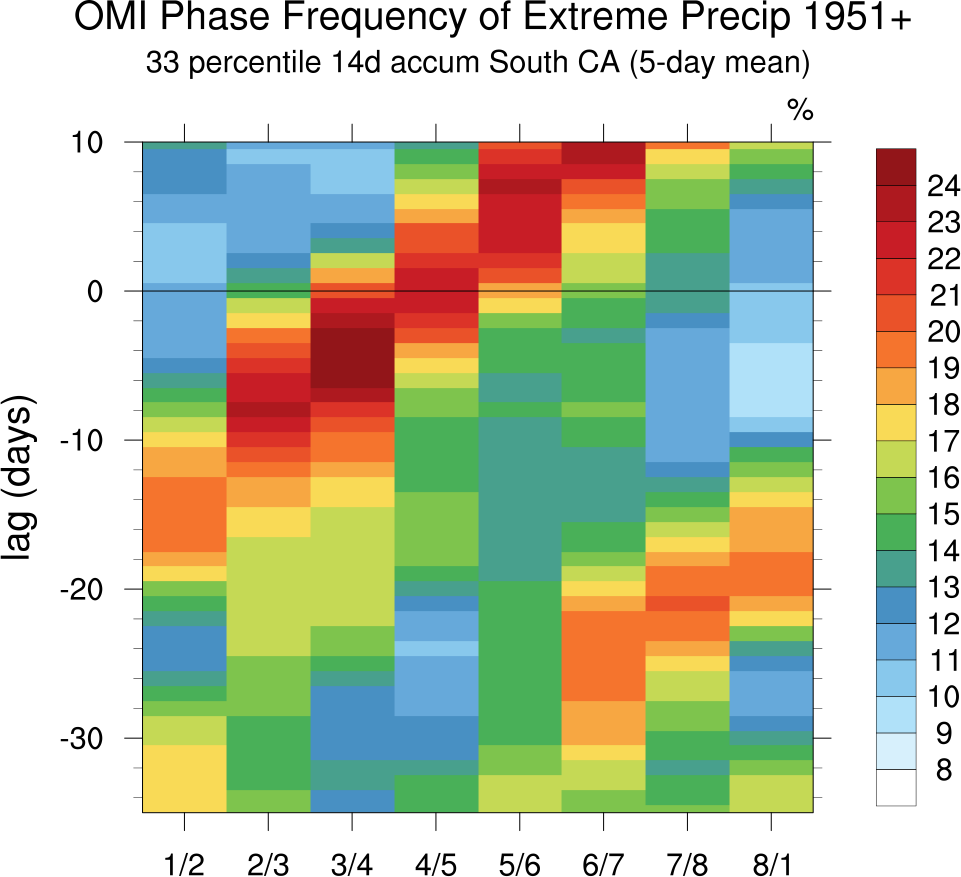
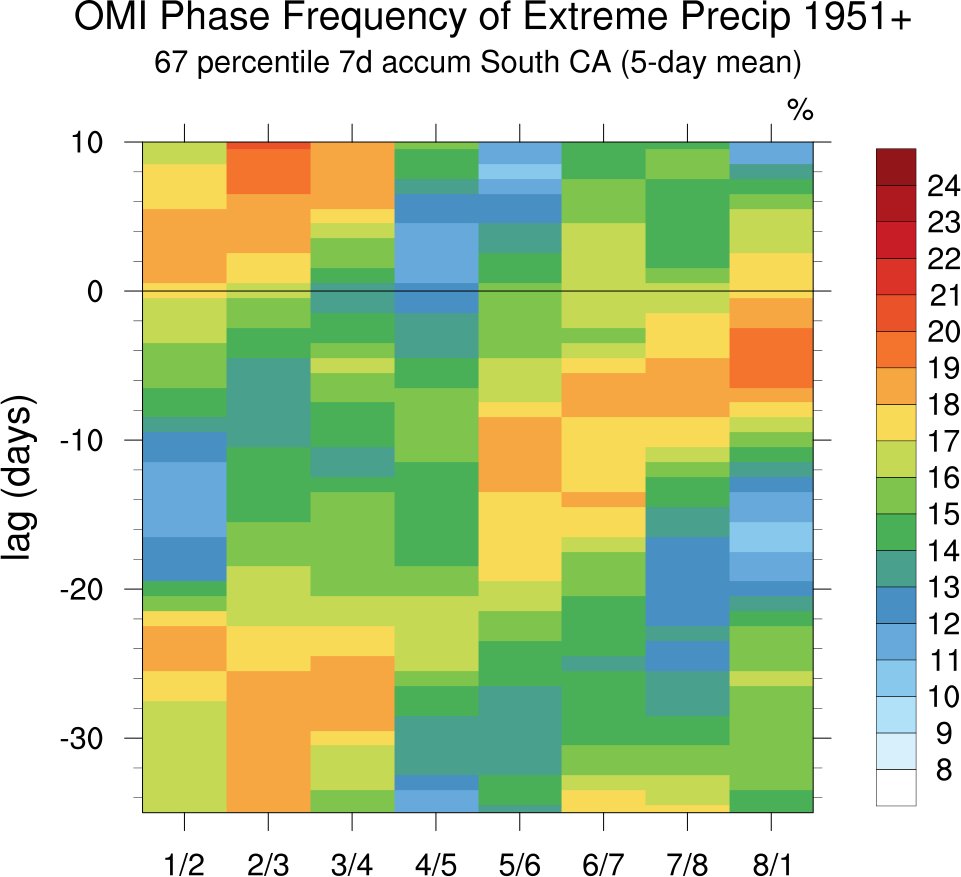
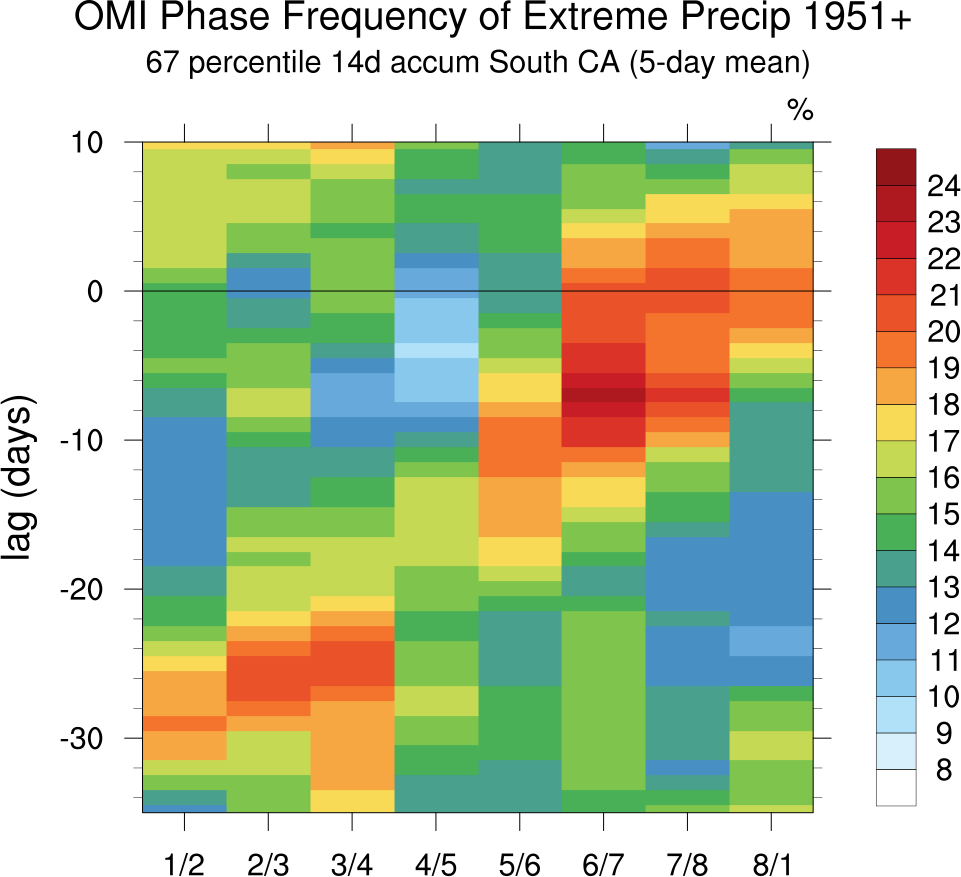
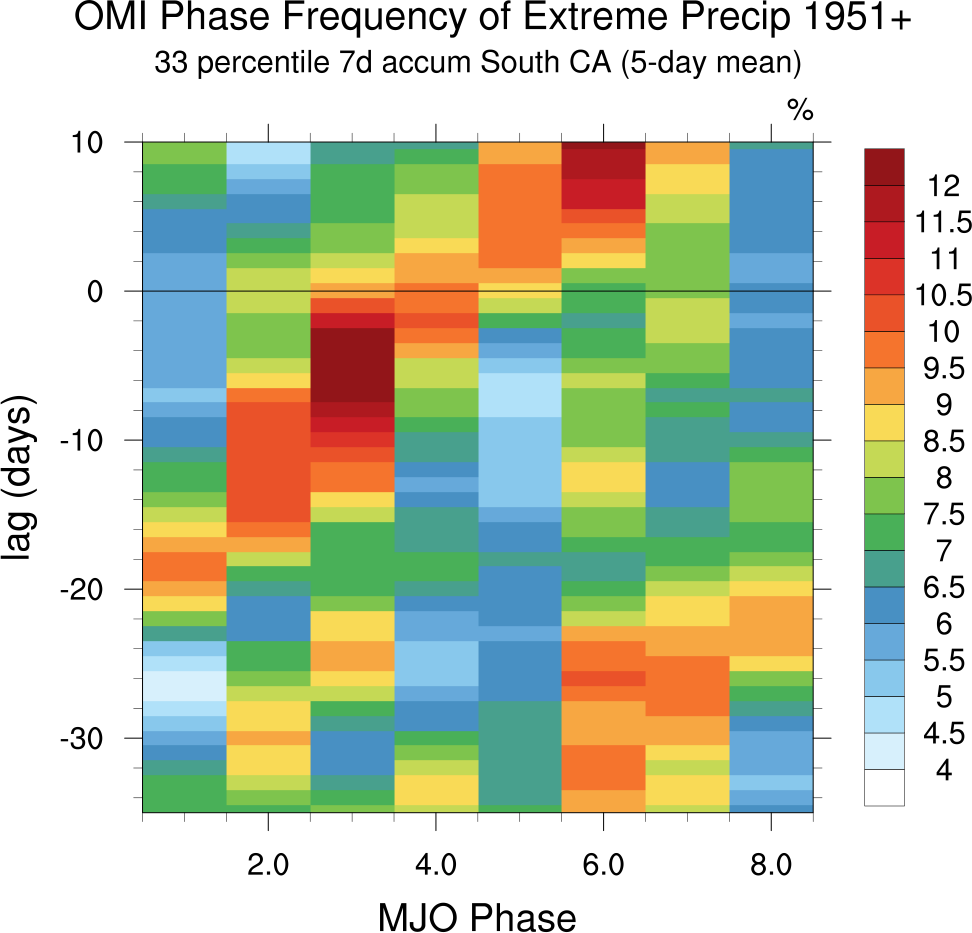
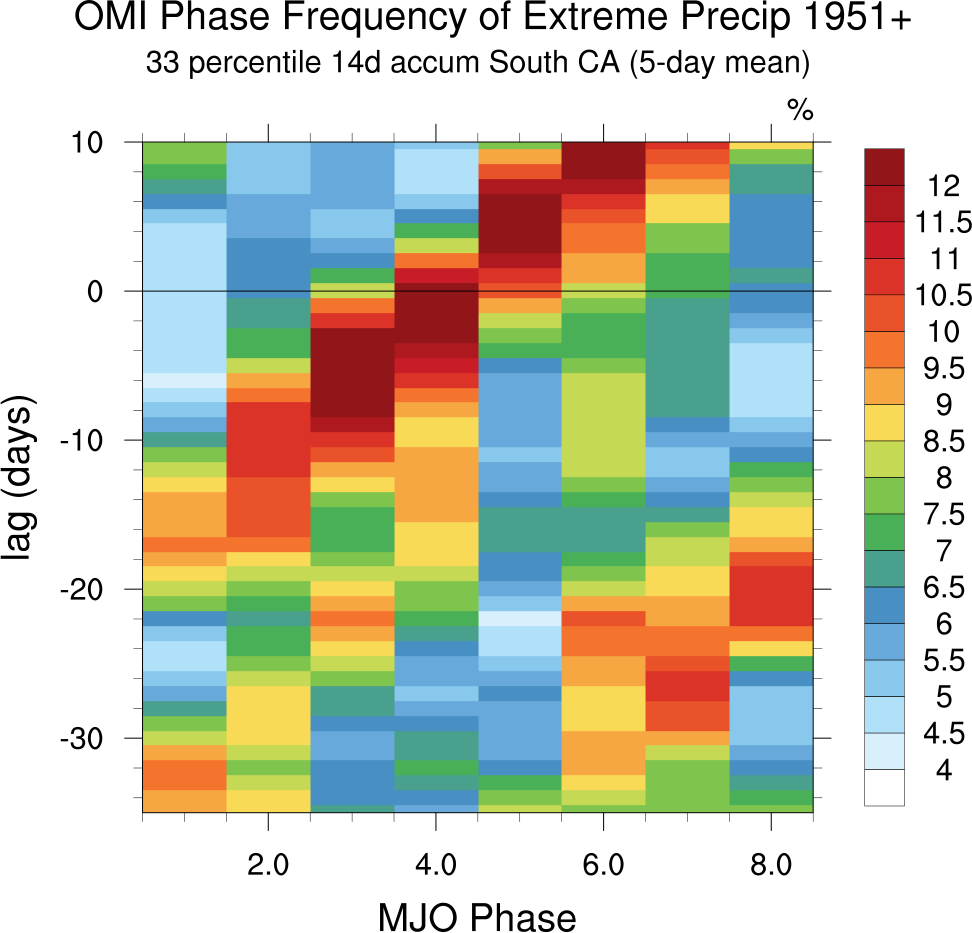
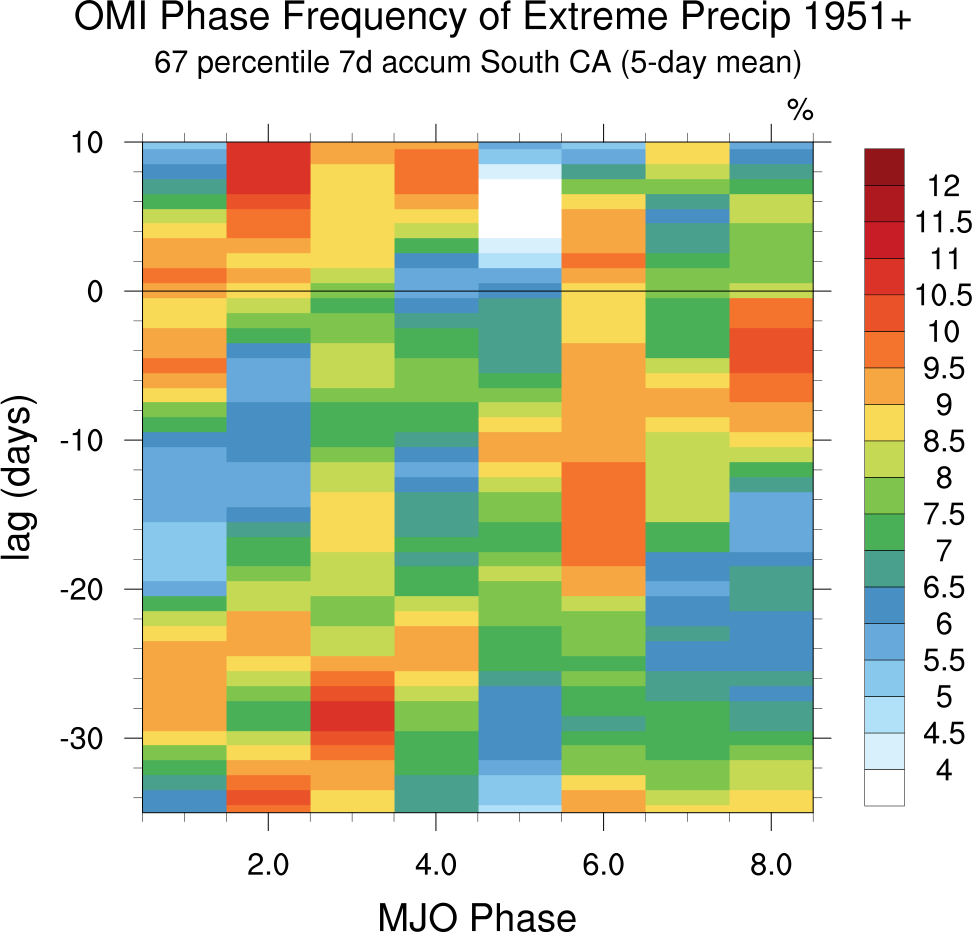
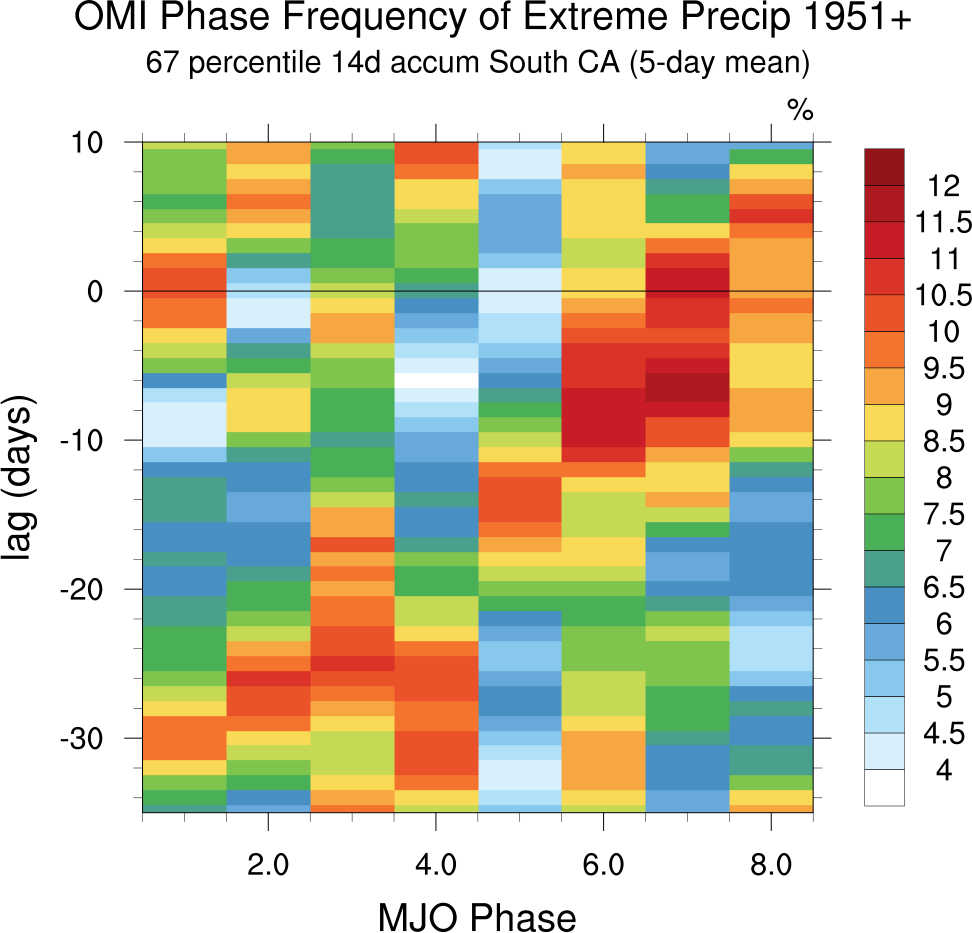
Re. OMI Phase frequency and extreme CA precip with MJO leads and precip lags:
7-day, 14-day accumulations and 5-day running mean
Northern_Central California 33rd percentile (MJOs radius>1) Two MJO Phases at a time
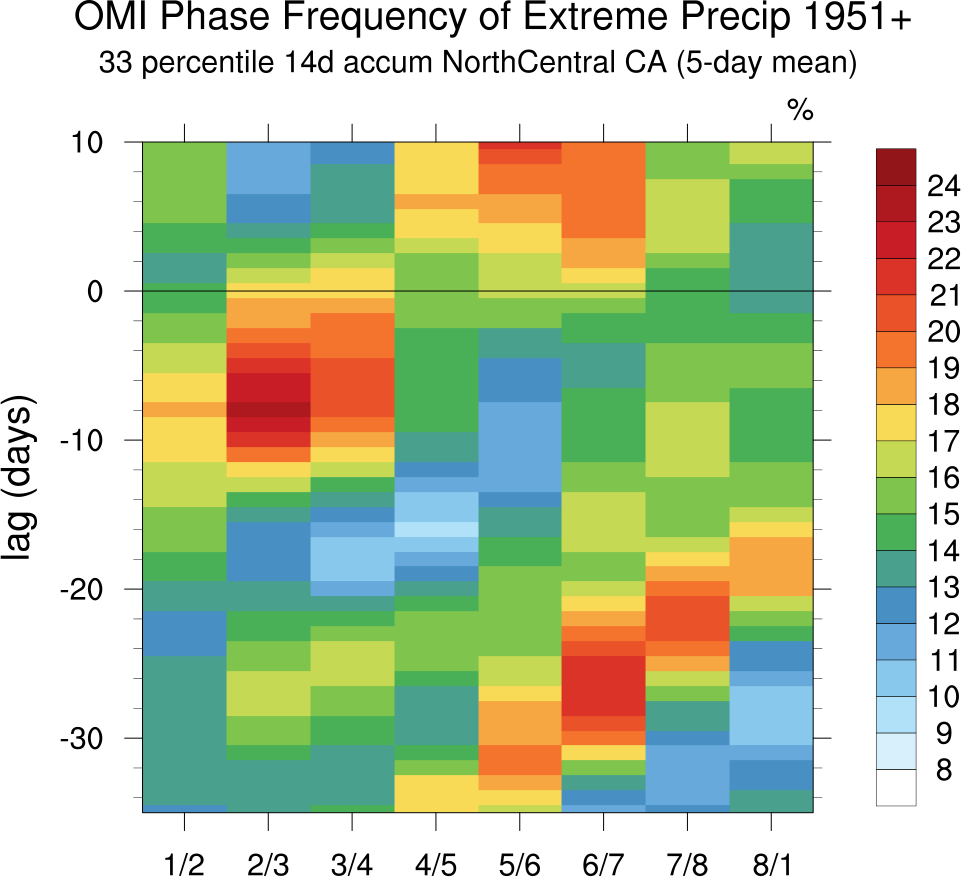
Northern_Central California 67th percentile (MJOs radius>1) Two MJO Phases at a time
Southern California 33rd percentile (MJOs radius>1) Two MJO Phases at a time
Southern California 67th percentile (MJOs radius>1) Two MJO Phases at a time
Re. OMI Phase frequency and extreme CA precip with MJO leads and precip lags:
7-day, 14-day accumulations:
Northern_Central California 33rd percentile (MJOs radius>1) One MJO Phase at a time
where the 7-day case included 414 nonoverlapping Nov-Mar precip-less-than-33-percentile points, 14-day case included 243 nonoverlapping Nov-Mar precip-less-than-33-percentile points;
with the Strong MJO condition reducing this to 27,39,38,22,22,37,27,40 7-day lag-0 Phase 1-8 points respectively
and 11,18,26,18,17,18,15,24 14-day lag-0 Phase 1-8 points respectively.
Northern_Central California 67th percentile (MJOs radius>1) One MJO Phase at a time
where the 7-day case included 292 nonoverlapping Nov-Mar precip exceedances, 14-day case included 166 nonoverlapping Nov-Mar precip exceedances,
with the Strong MJO condition reducing this to 12,19,31,29,12,31,19,24 7-day lag-0 Phase 1-8 points respectively
and 2,15,9,12,14,14,17,12 for 14-day lag-0 Phase 1-8 points respectively.
Southern California 33rd percentile (MJOs radius>1) One MJO Phase at a time
where the 7-day case included 418 nonoverlapping Nov-Mar precip-less-than-33-percentile points, 14-day case included 256 nonoverlapping Nov-Mar precip-less-than-33-percentile points,
with the Strong MJO condition reducing this to 28,31,38,22,21,33,34,35 7-day lag-0 Phase 1-8 points respectively
and 24,20,21,13,22,20,21,23 for 14-day lag-0 Phase 1-8 points respectively.
Southern California 67th percentile (MJOs radius>1) One MJO Phase at a time
where the 7-day case included 276 nonoverlapping Nov-Mar precip exceedances, 14-day case included 153 nonoverlapping Nov-Mar precip exceedances,
with the Strong MJO condition reducing this to 13,18,24,14,21,18,30,21 7-day lag-0 Phase 1-8 points respectively
and 8,7,18,9,10,12,10,15 for 14-day lag-0 Phase 1-8 points respectively.
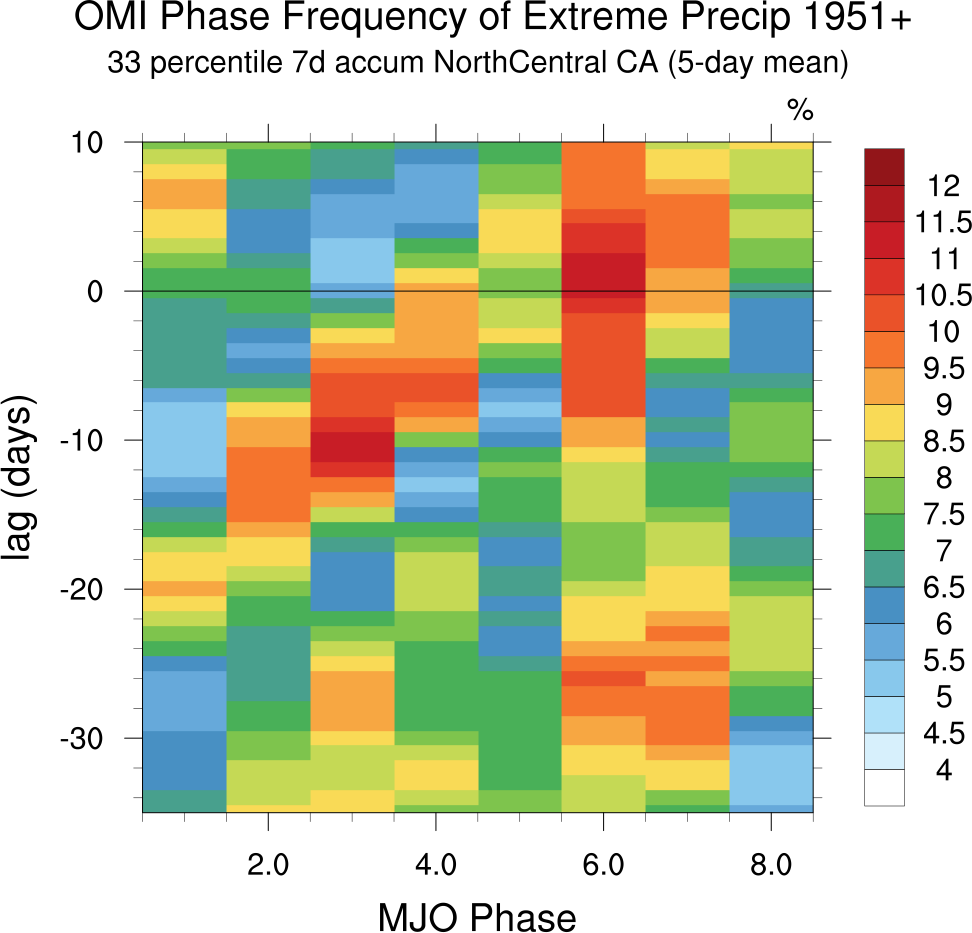
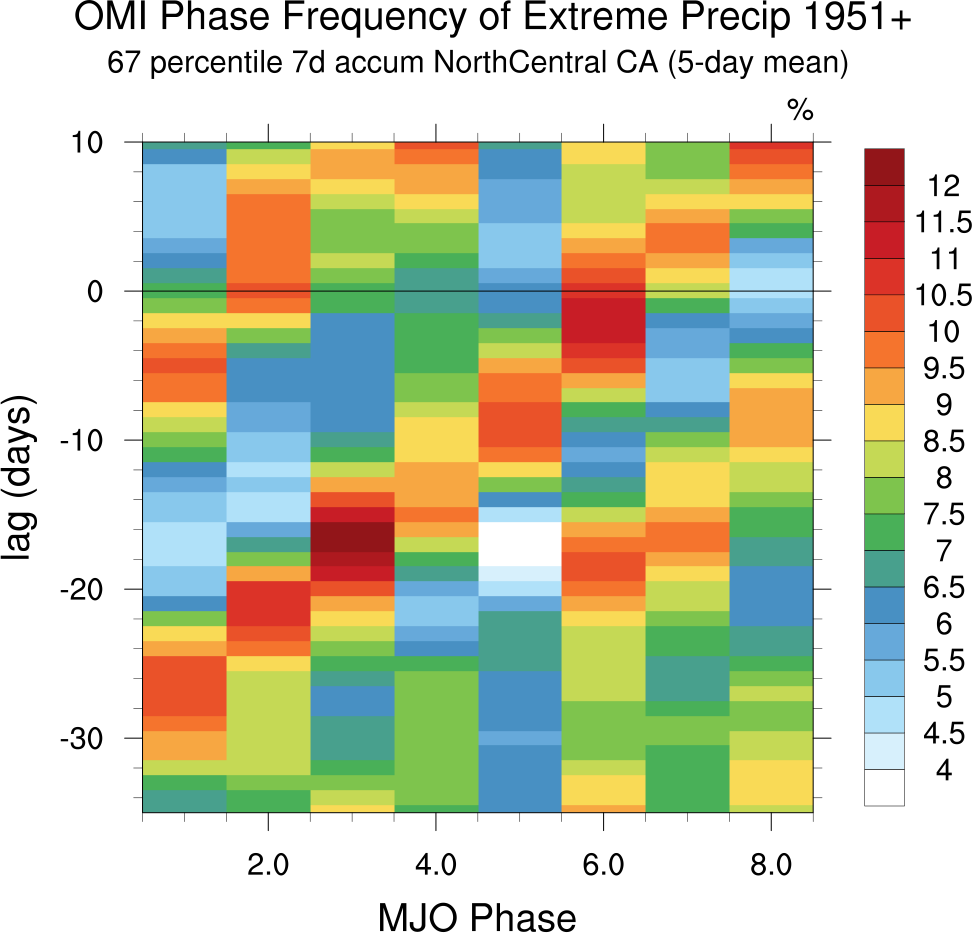
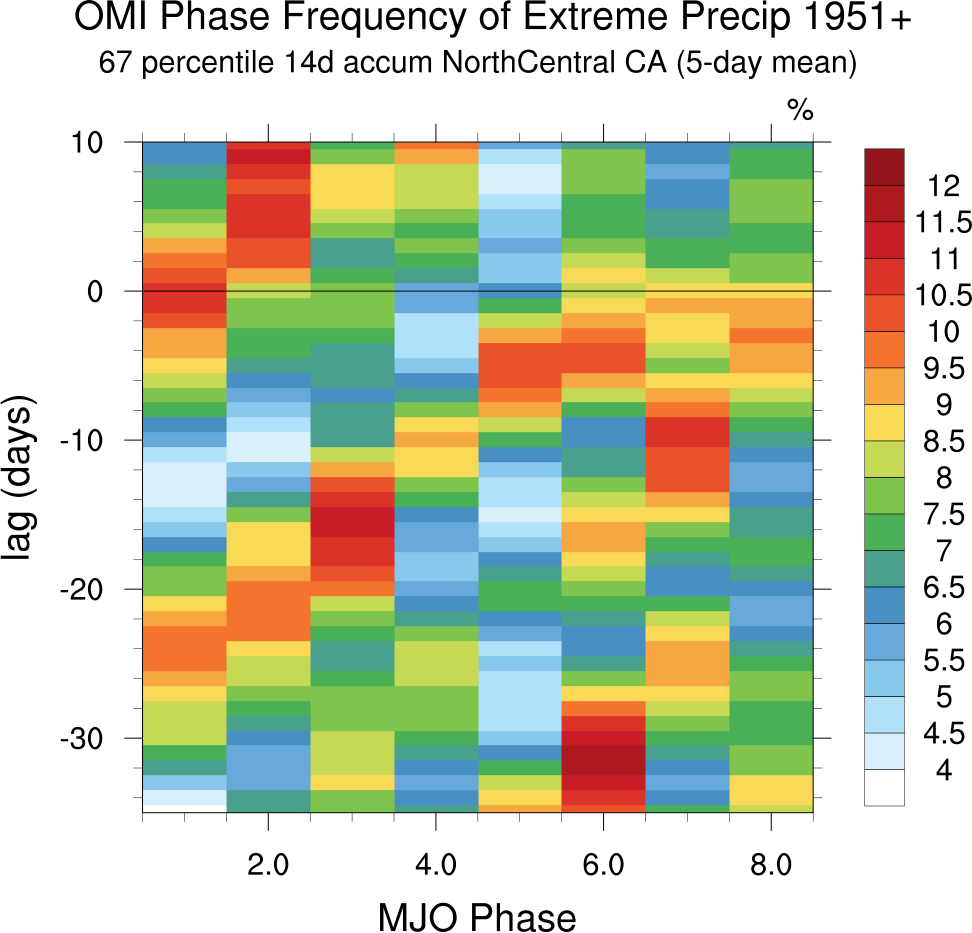
Re. OMI Phase frequency and extreme CA precip with MJO leads and precip lags:
7-day, 14-day accumulations and 5-day running mean
Northern_Central California 33rd percentile (MJOs radius>1) One MJO Phase at a time
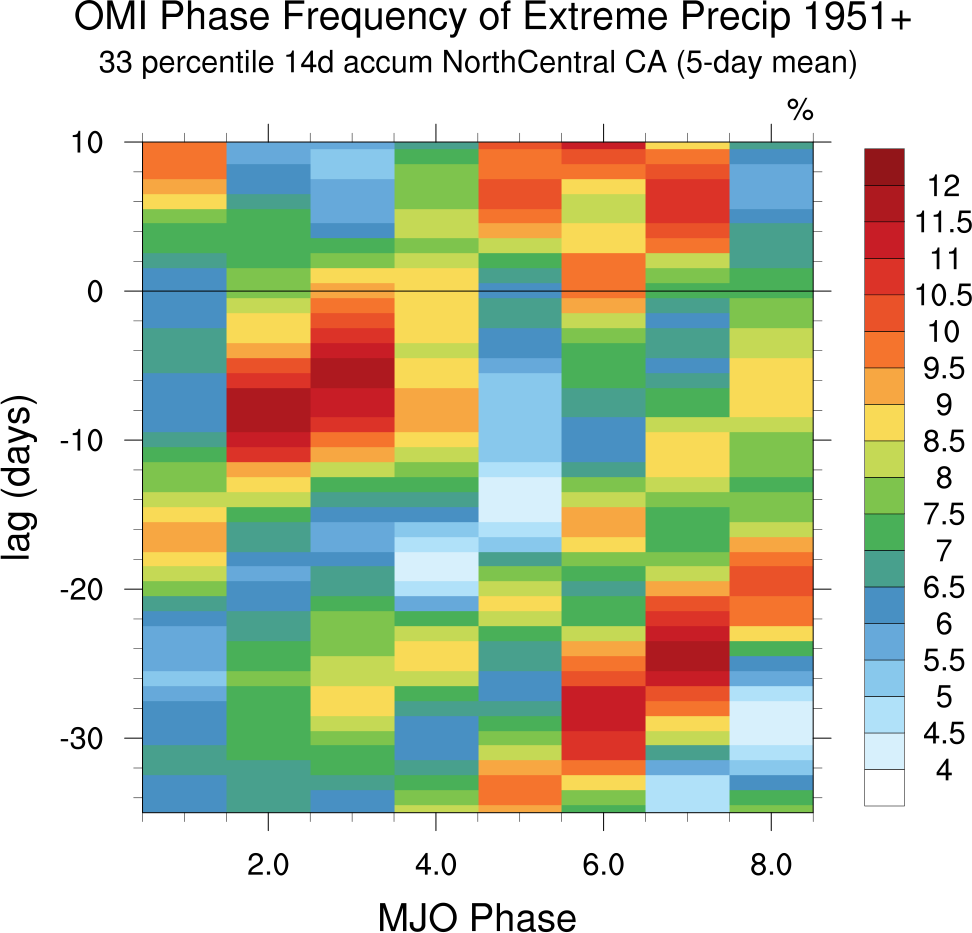
Northern_Central California 67th percentile (MJOs radius>1) One MJO Phase at a time
Southern California 33rd percentile (MJOs radius>1) One MJO Phase at a time
Southern California 67th percentile (MJOs radius>1) One MJO Phase at a time
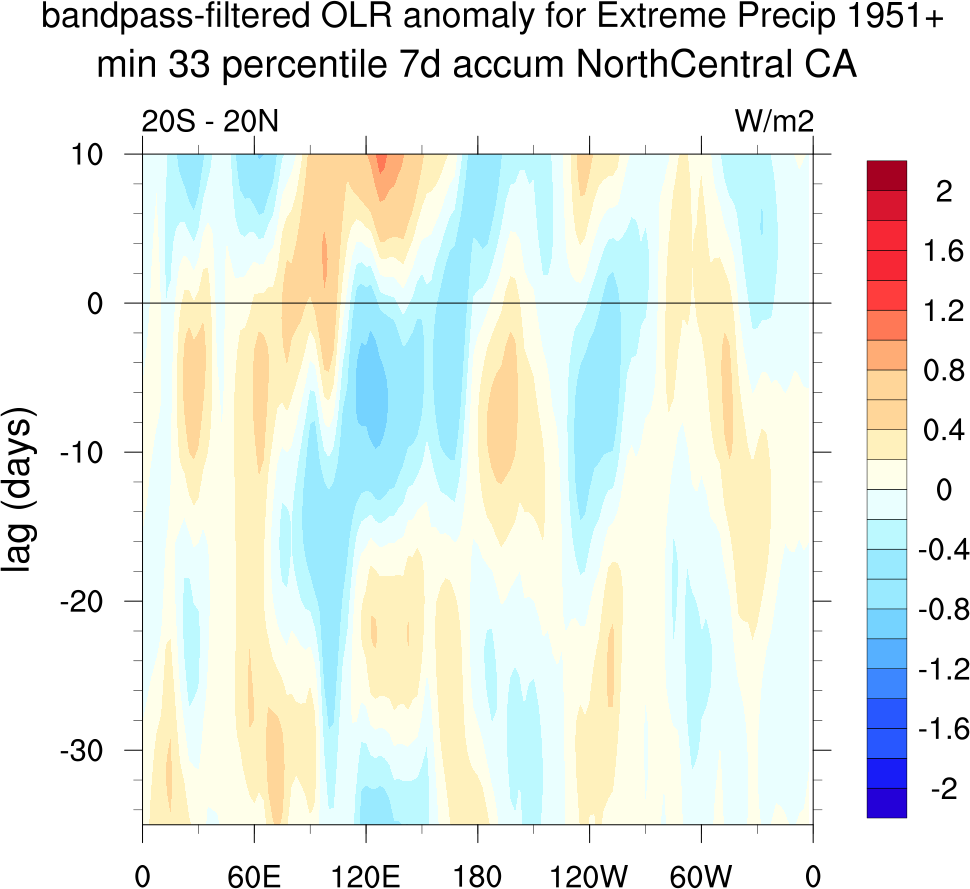
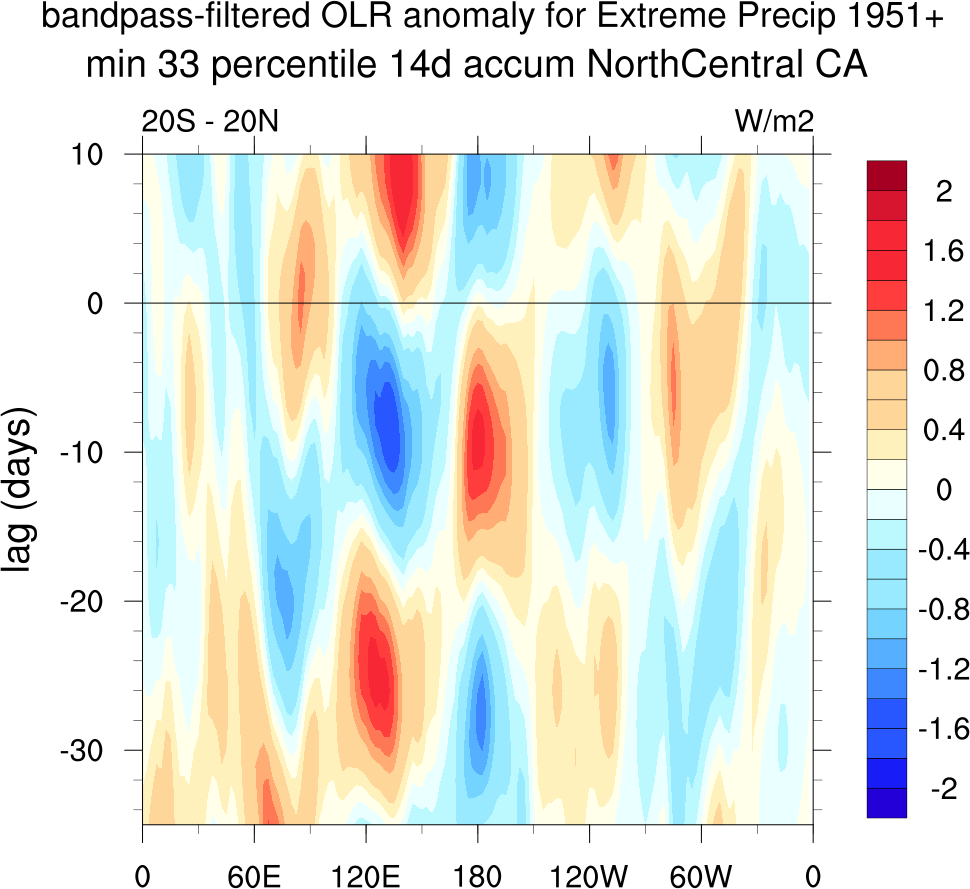
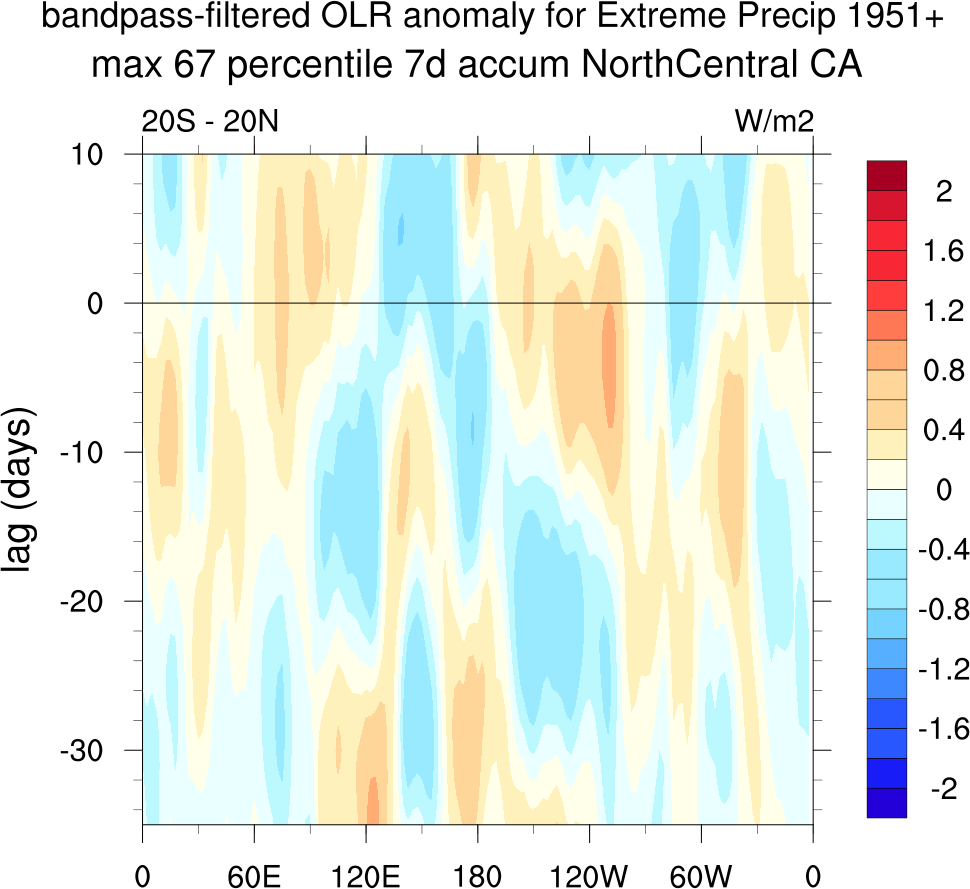
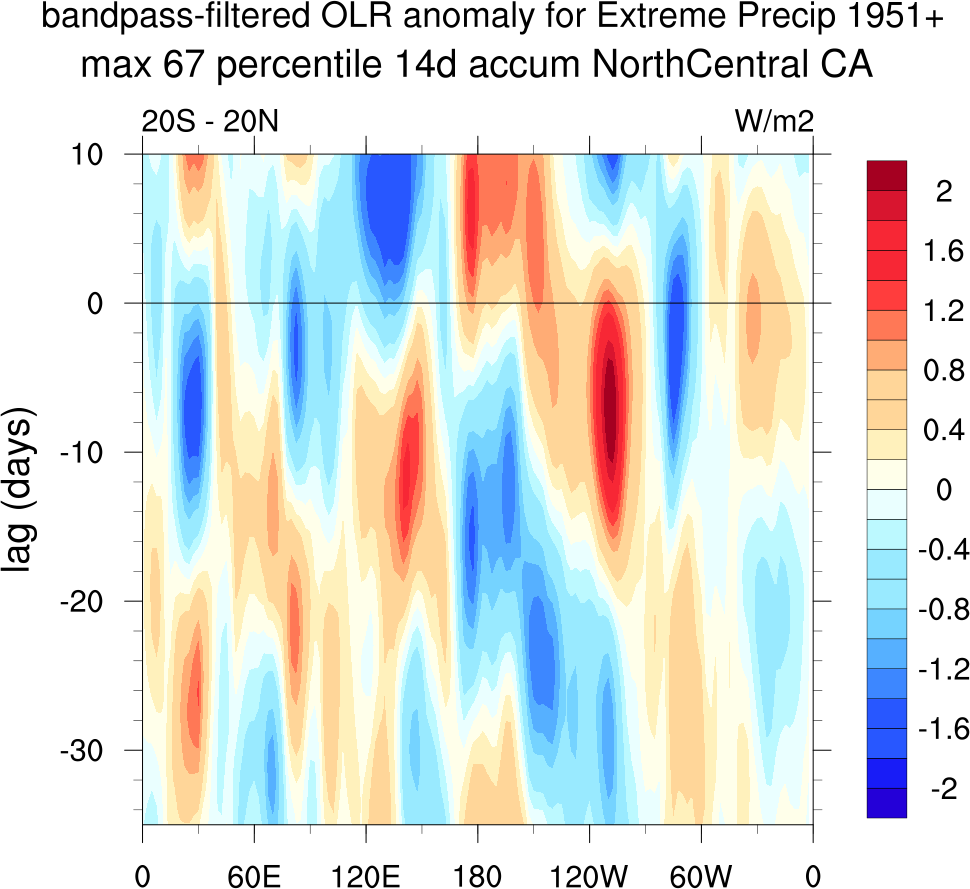
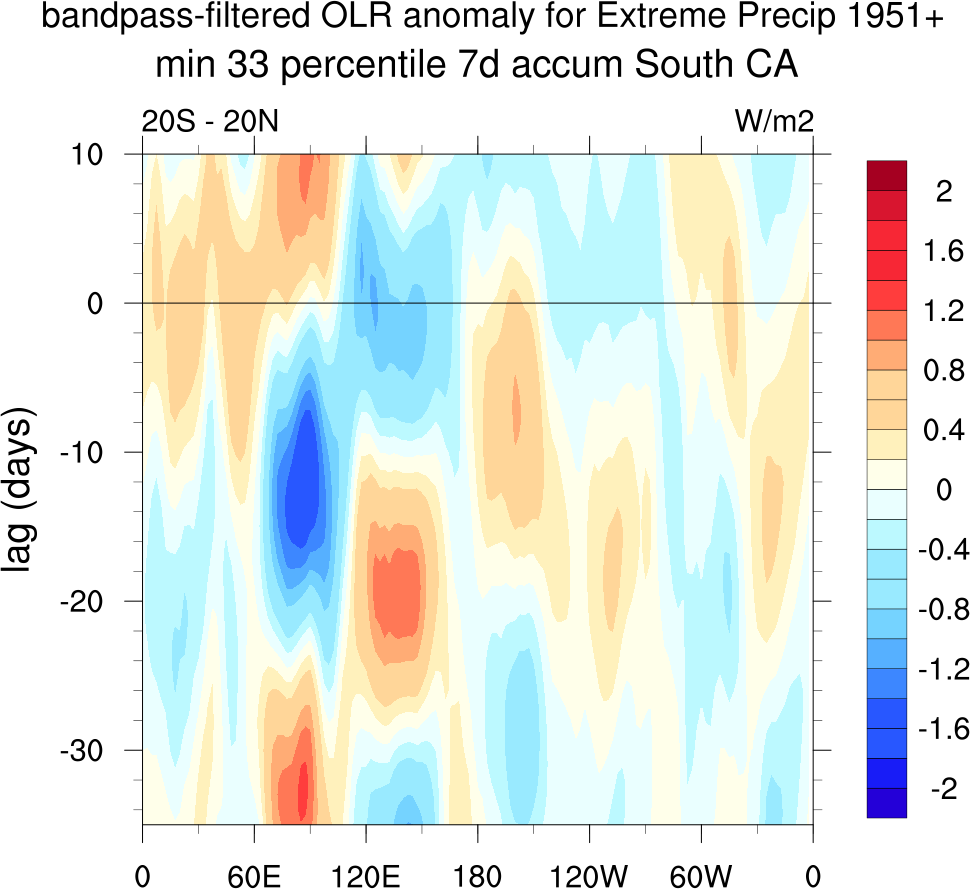
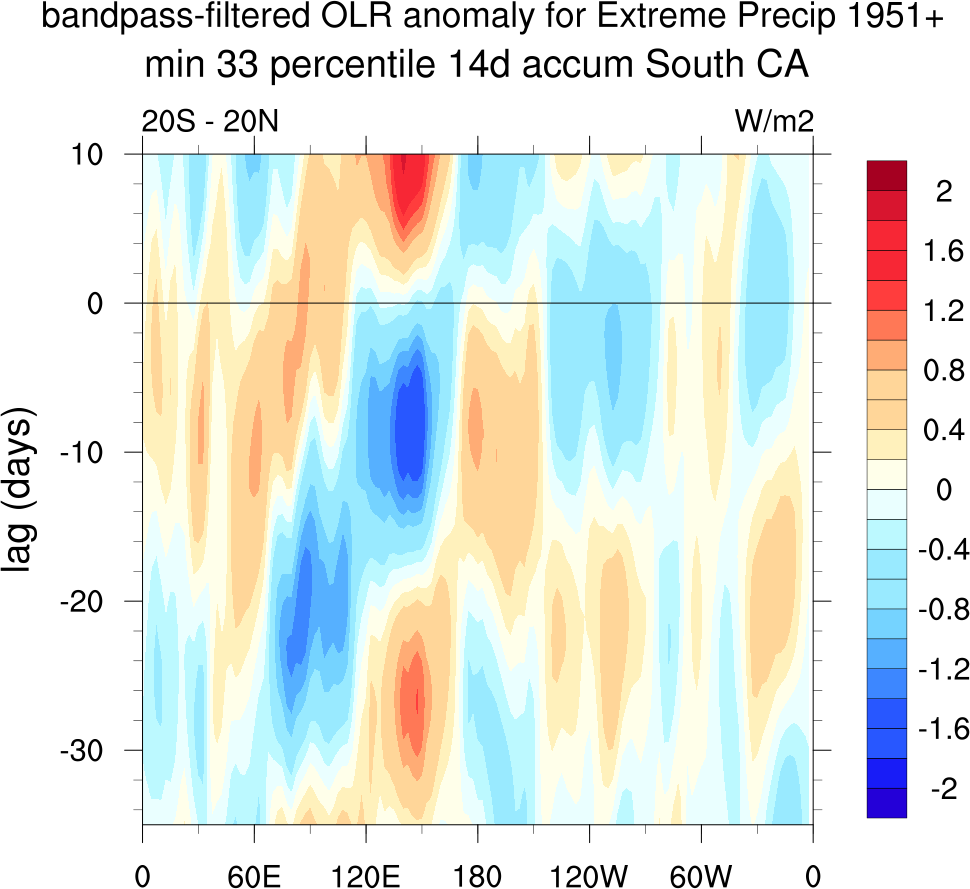
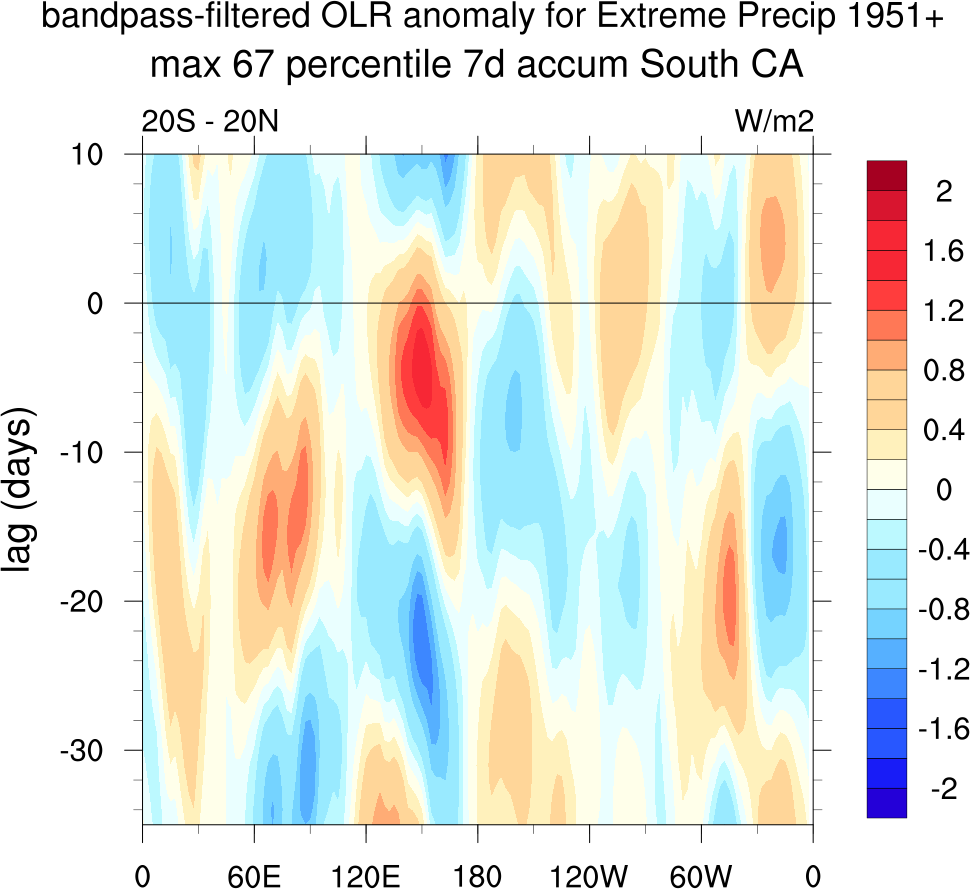
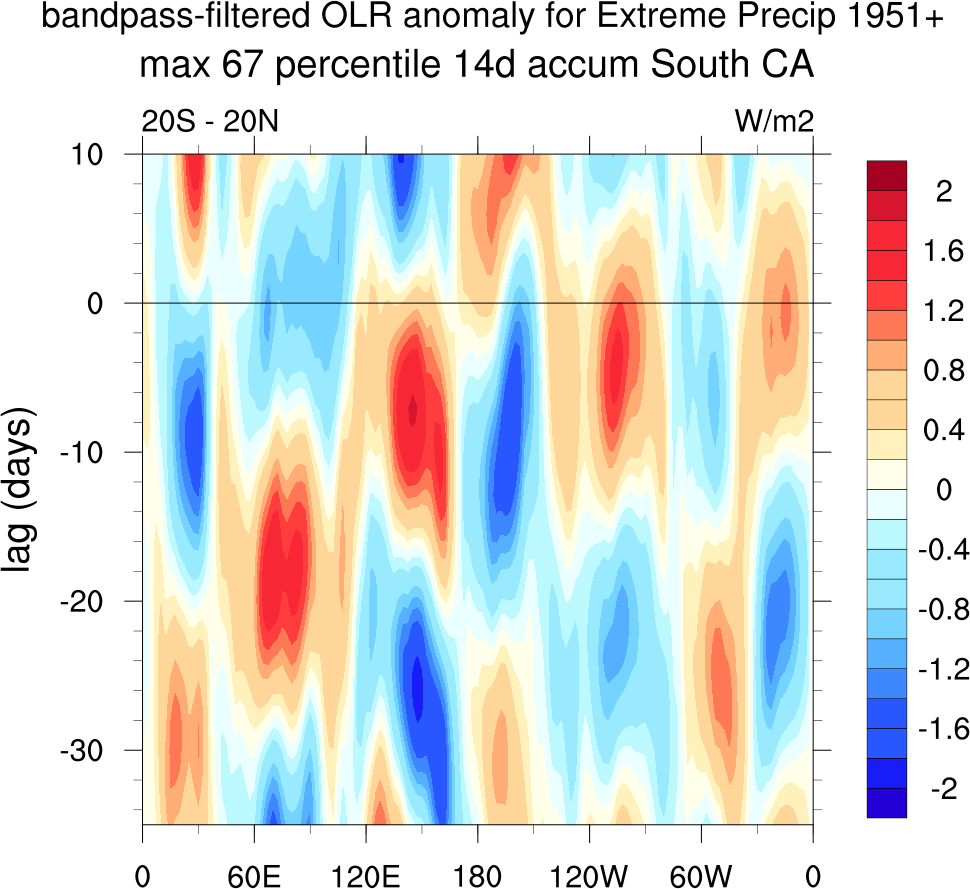
Re. bandpass-filtered OLR anomaly and extreme CA precip with OLR leads and precip lags:
7-day, 14-day accumulations:
Northern_Central California 33rd percentile
Northern_Central California 67th percentile
Southern California 33rd percentile
Southern California 67th percentile
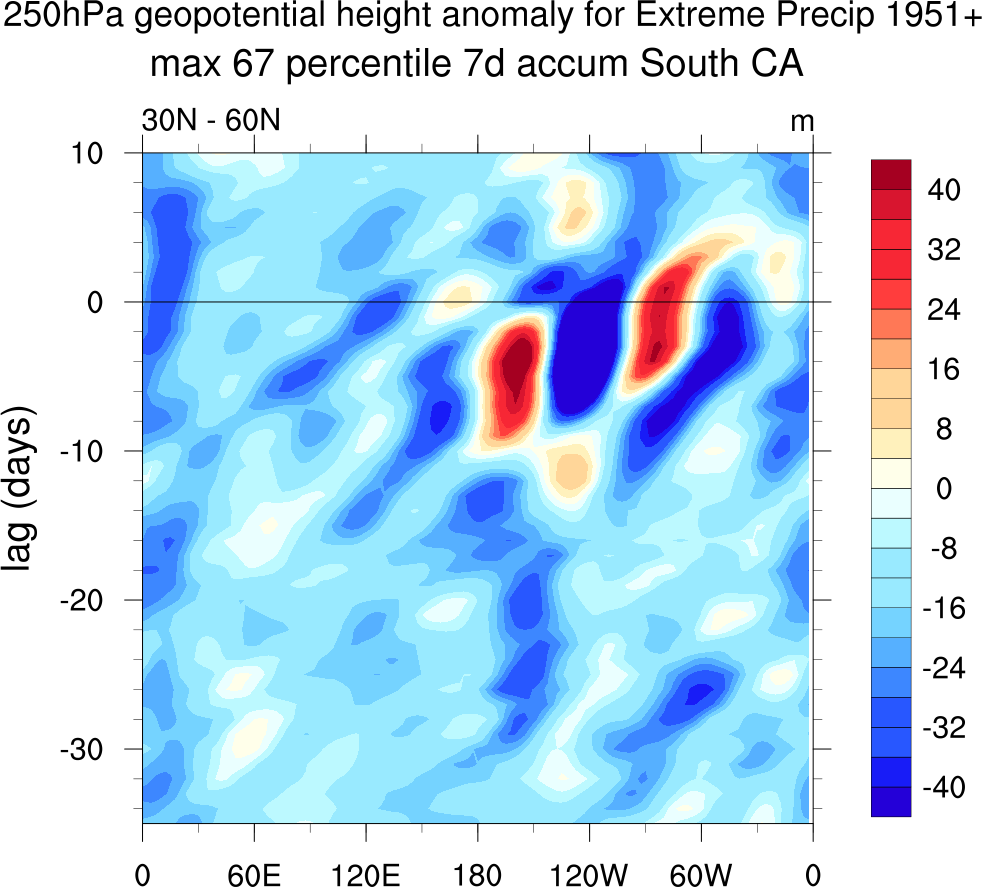
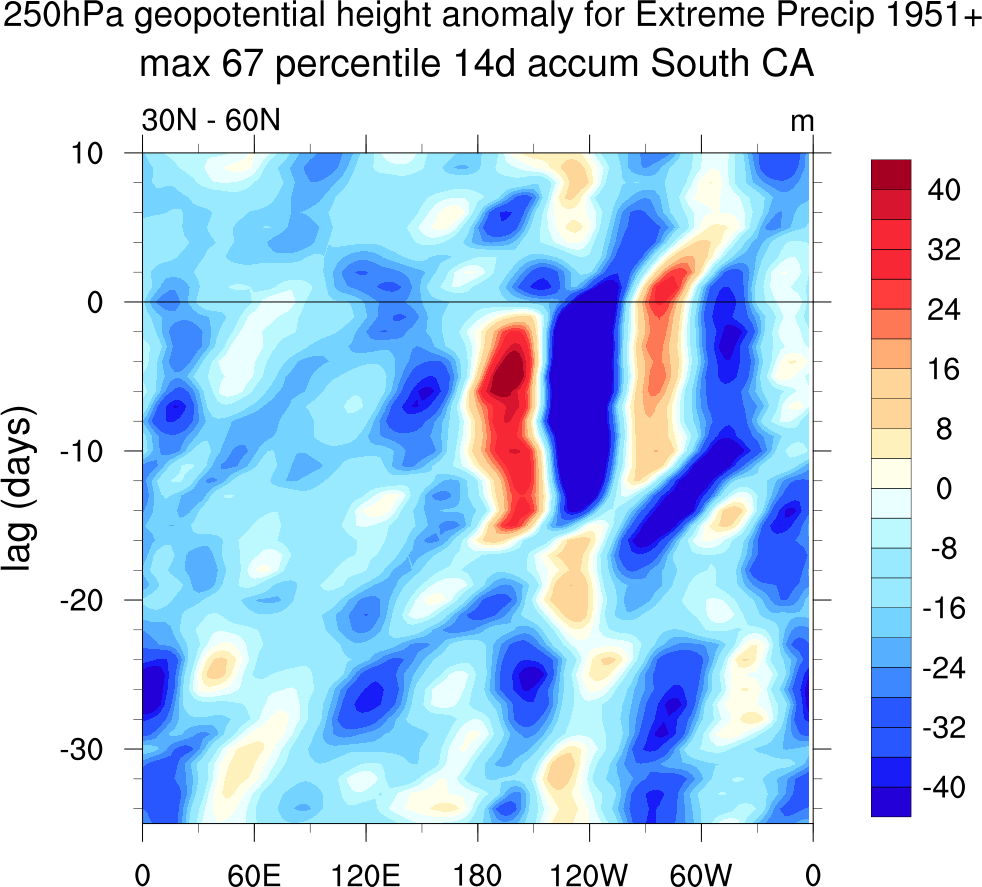
Re. 250hPa geopotential height anomaly and extreme CA precip with geopotential_height leads and precip lags:
7-day, 14-day accumulations:
Northern_Central California 33rd percentile
Northern_Central California 67th percentile
Southern California 33rd percentile
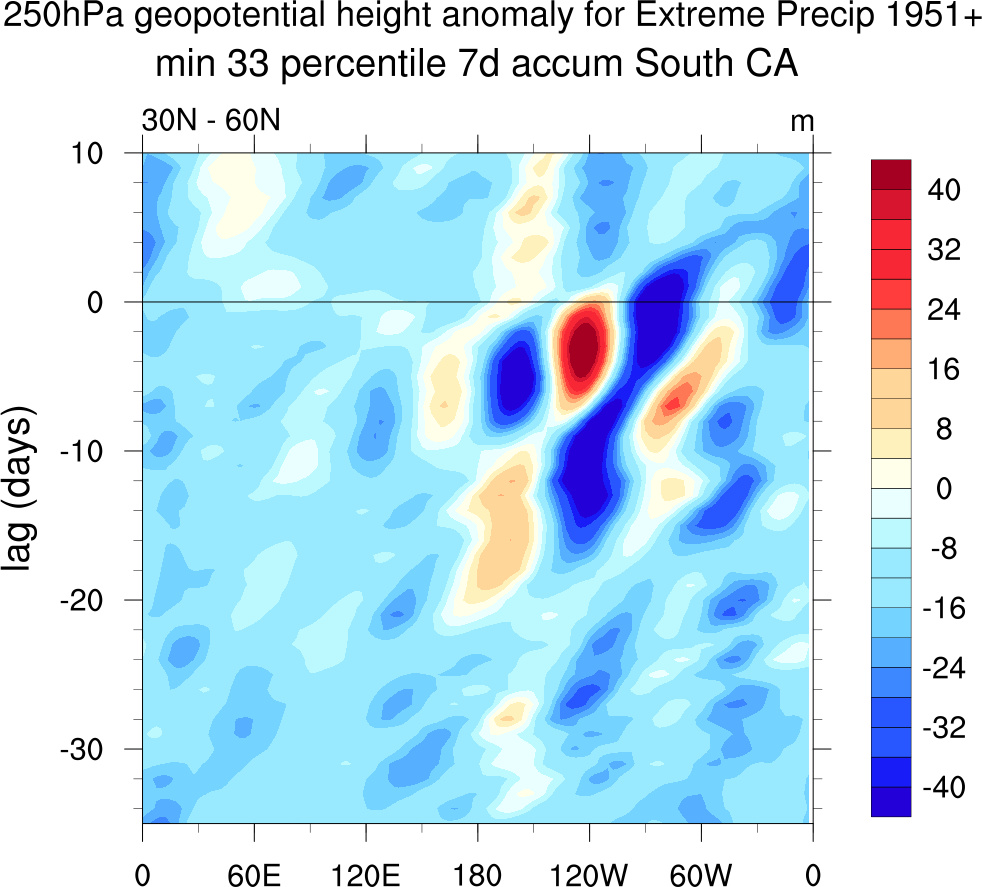
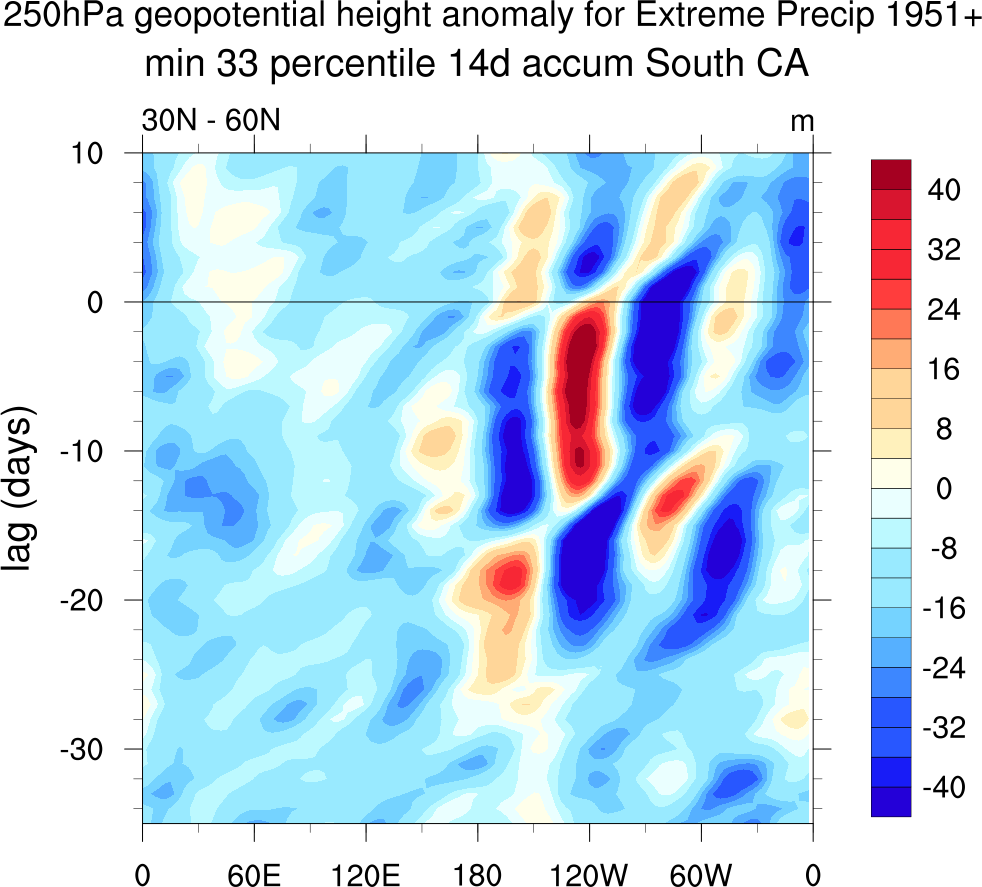
Southern California 67th percentile
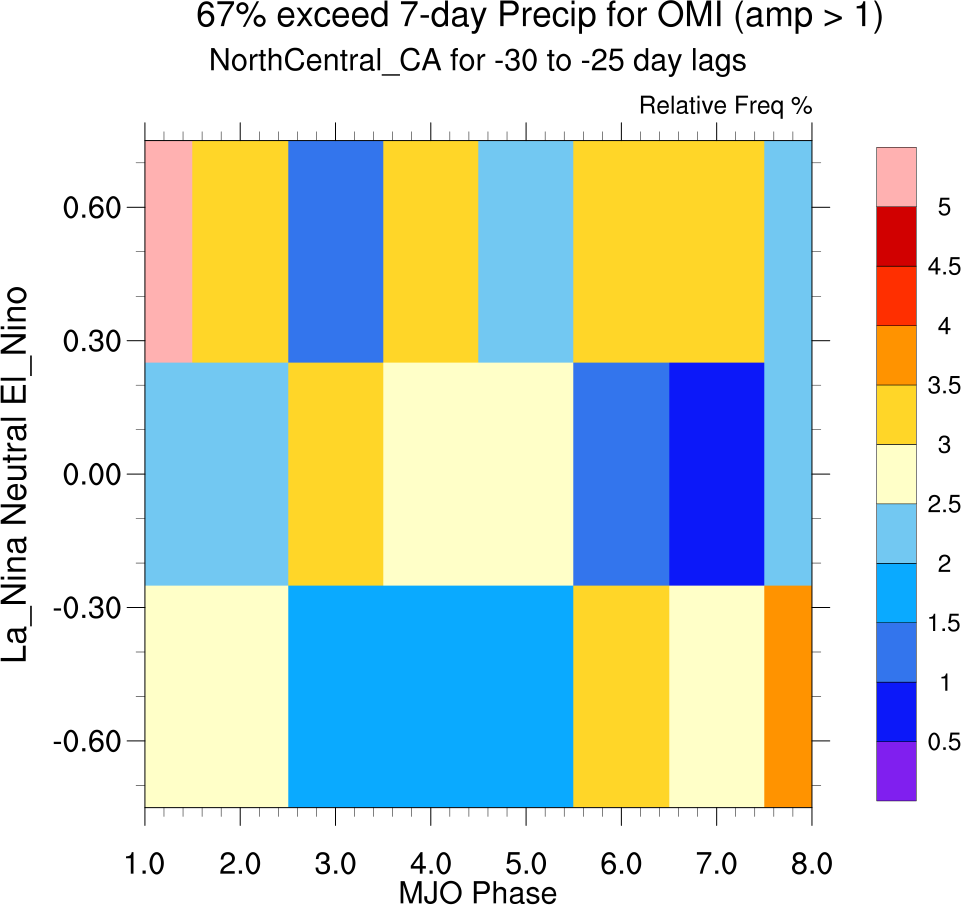
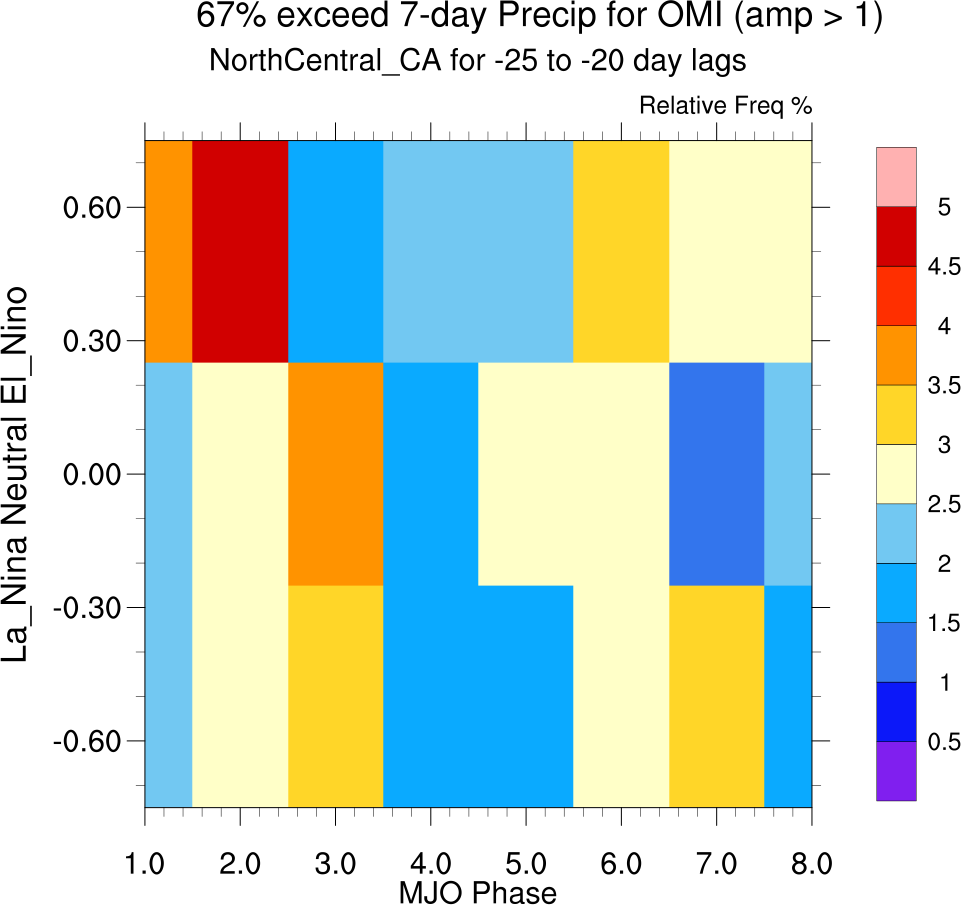
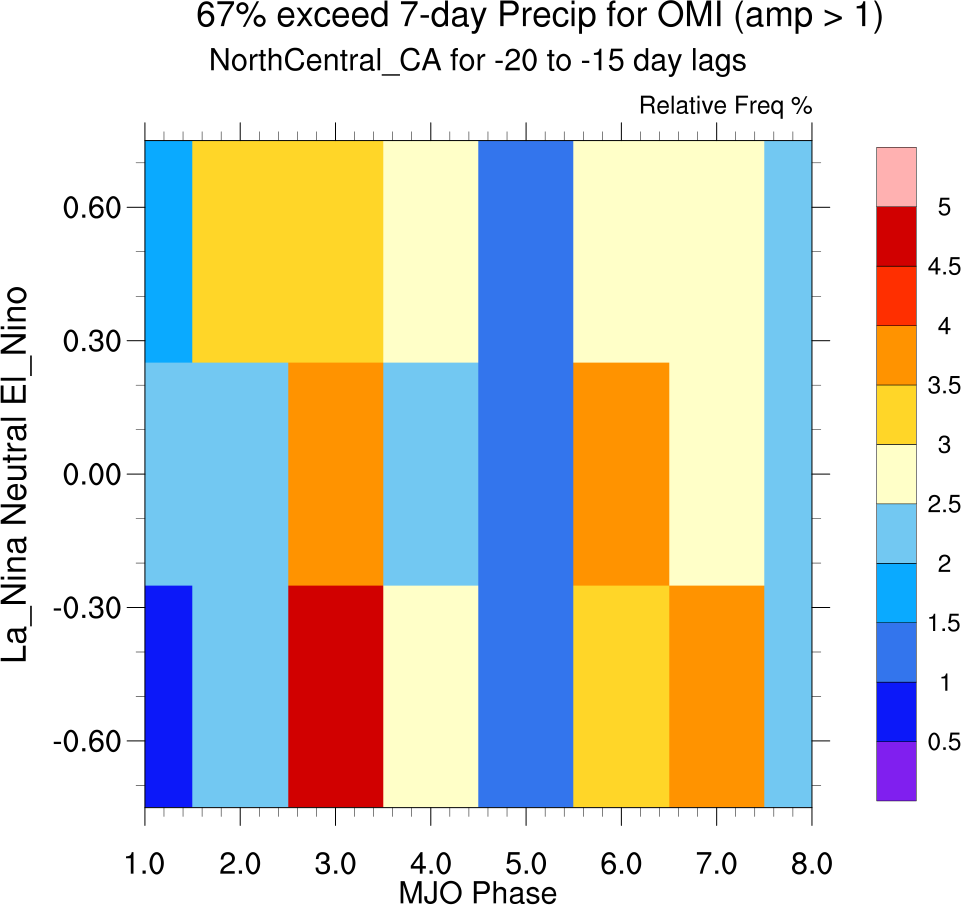
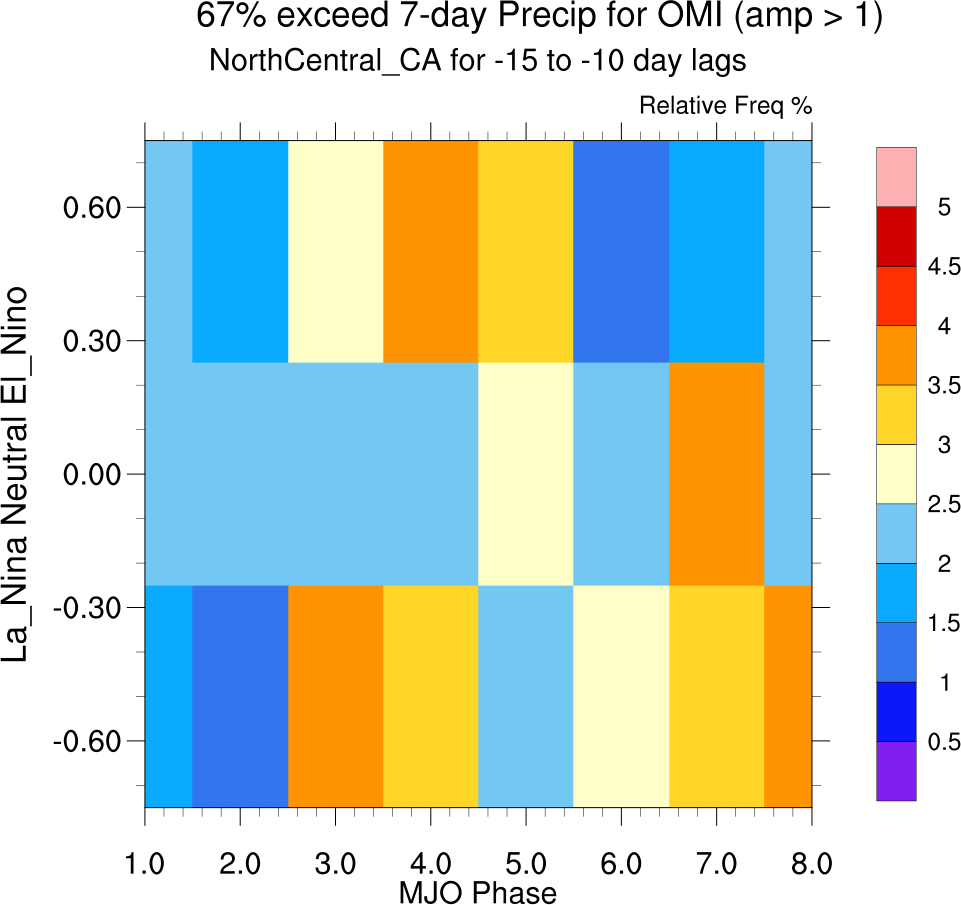
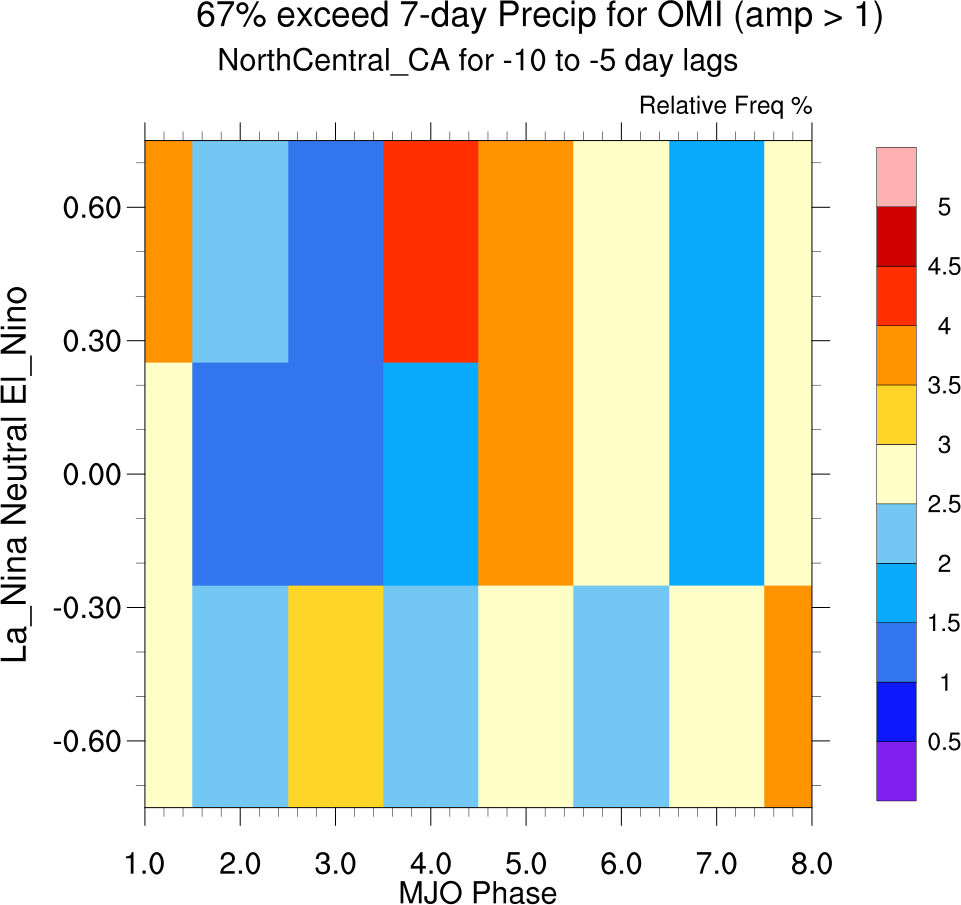
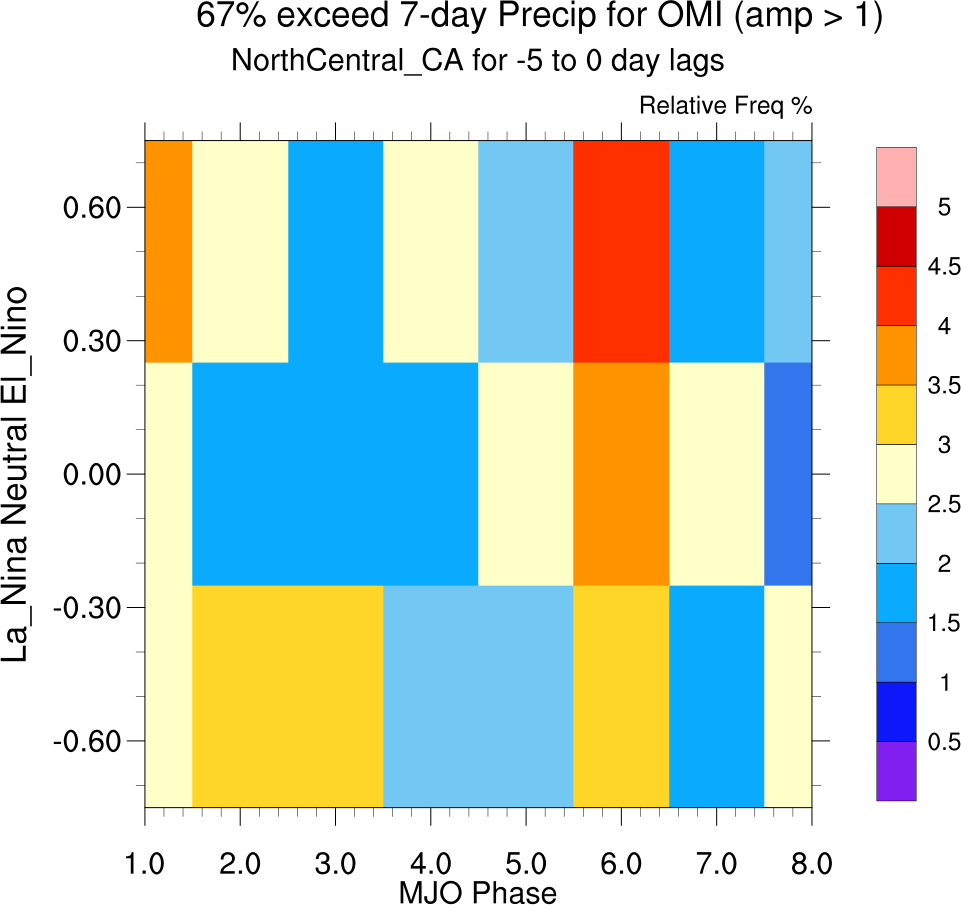
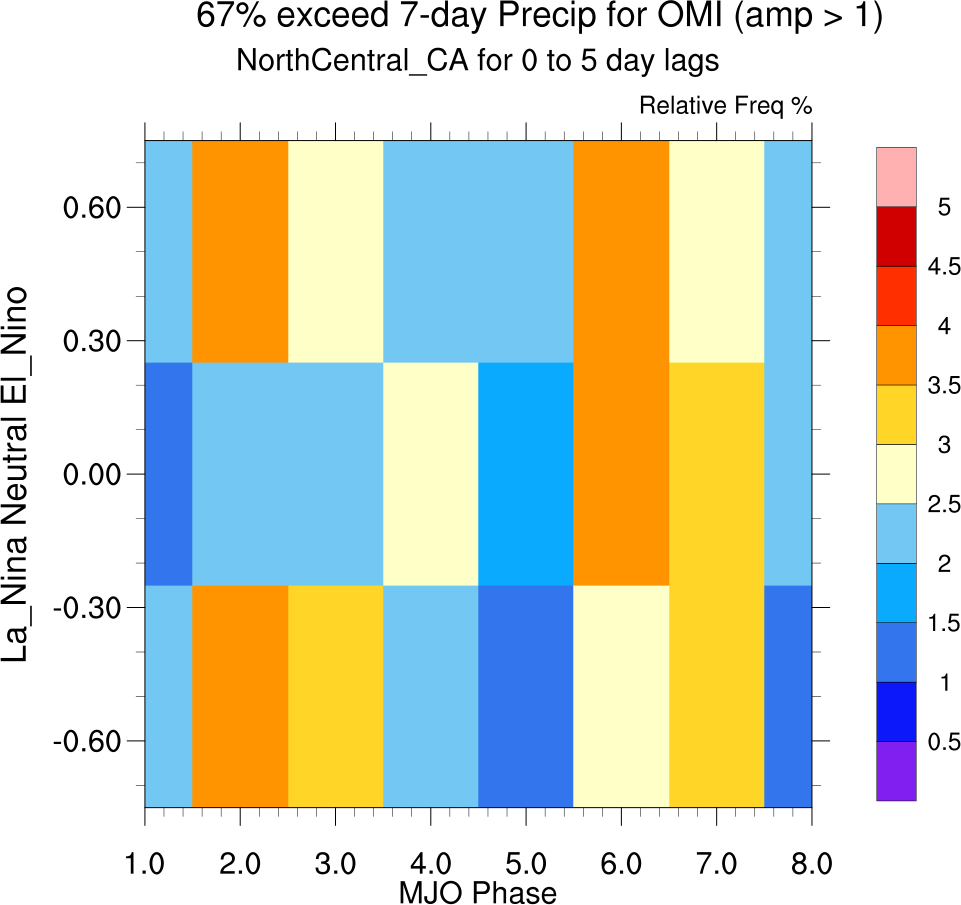
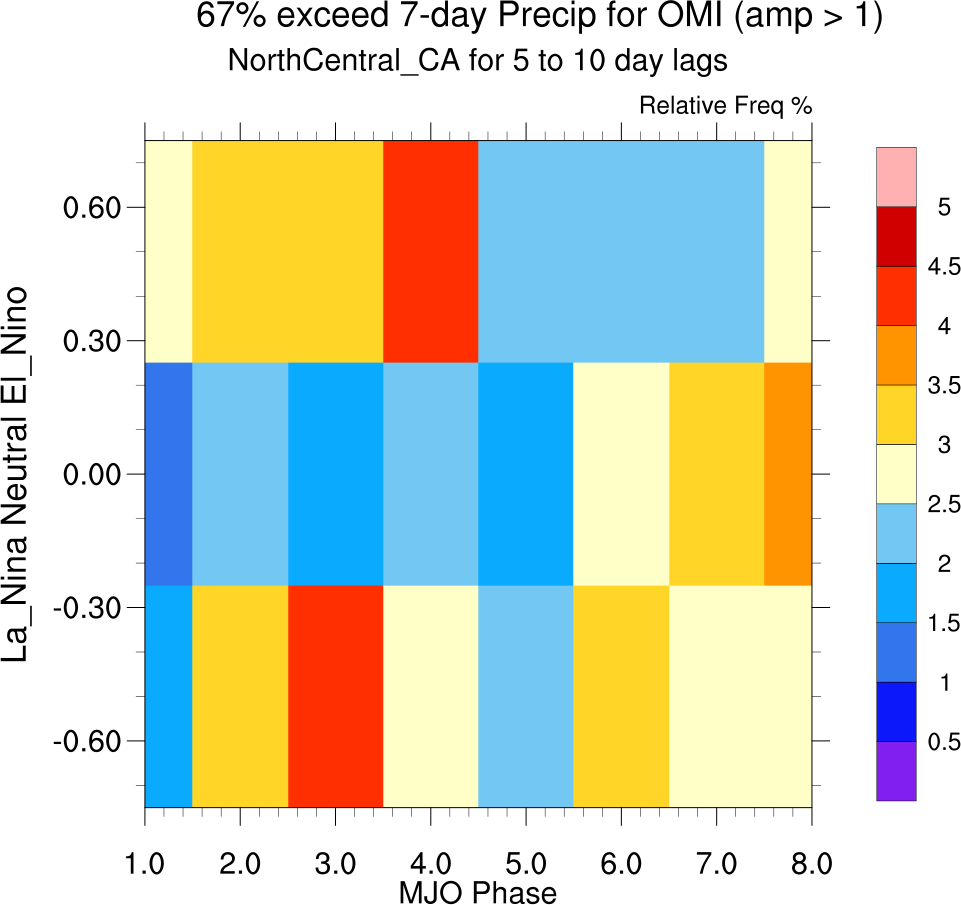
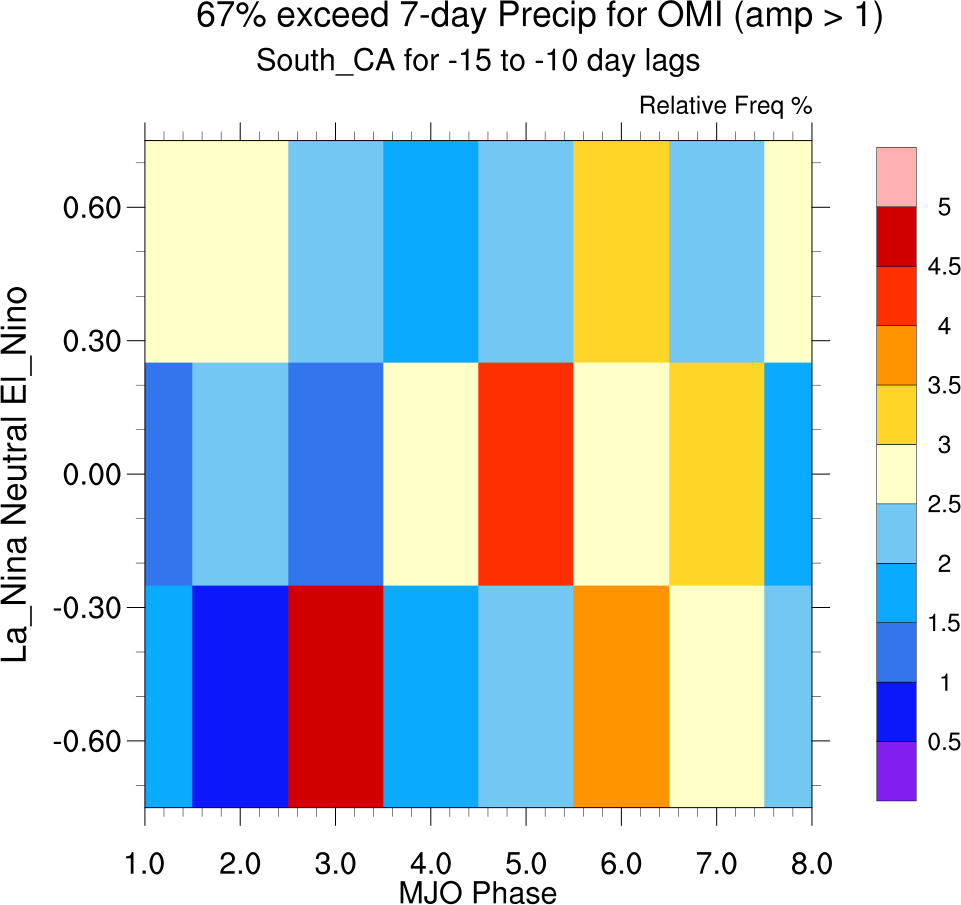
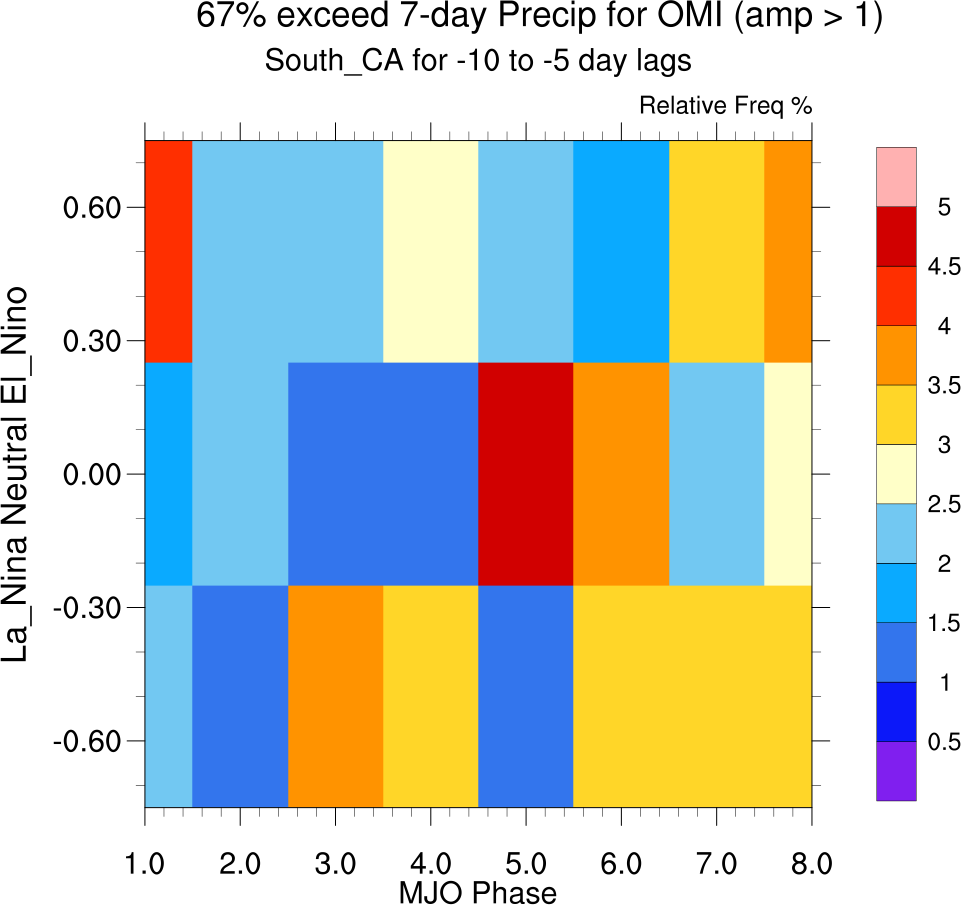
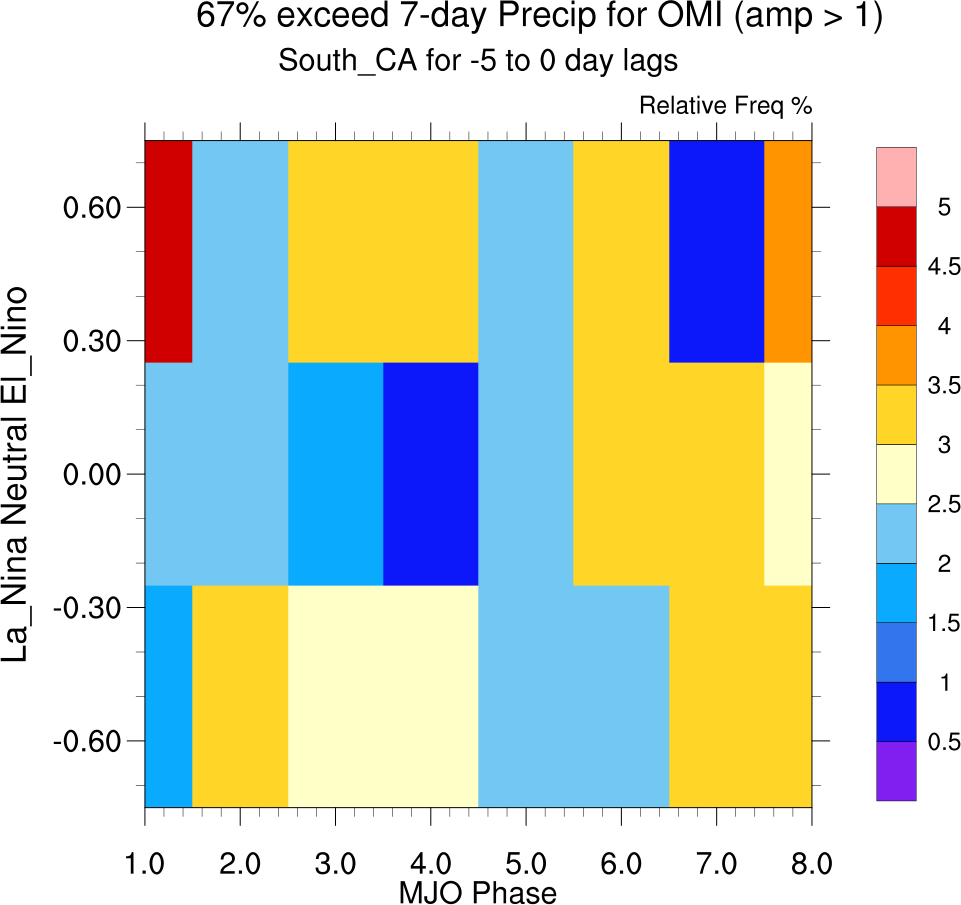
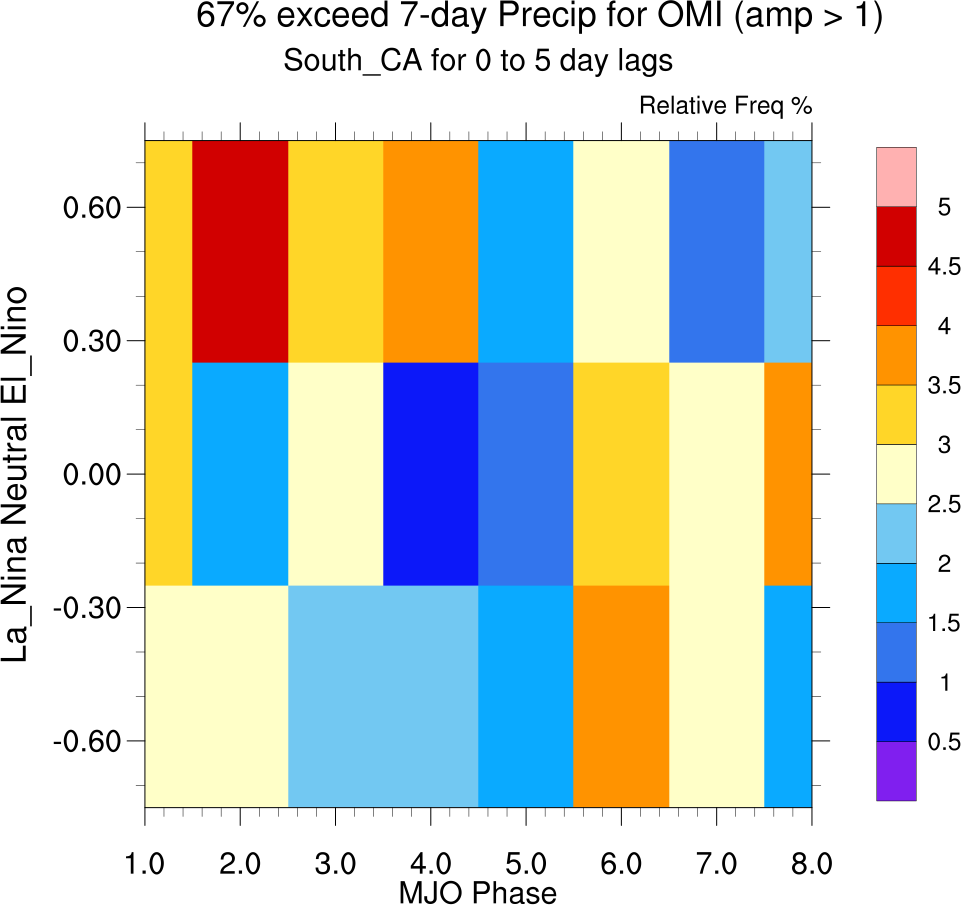
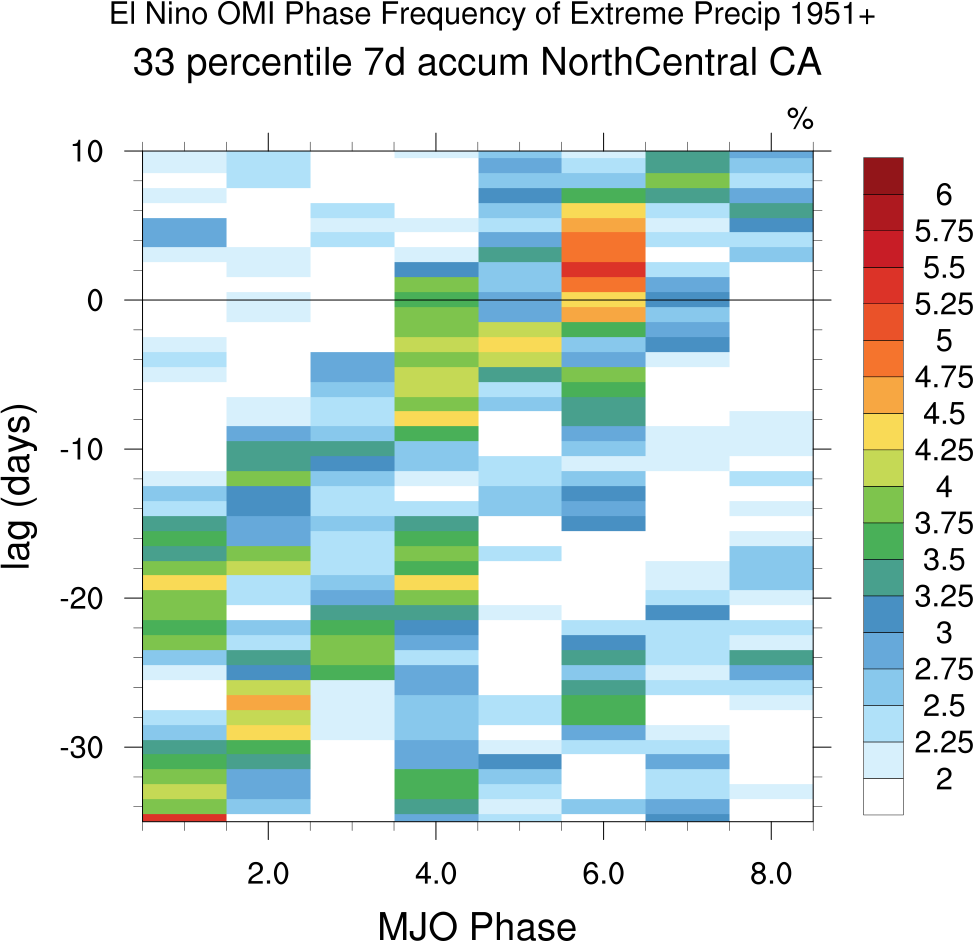
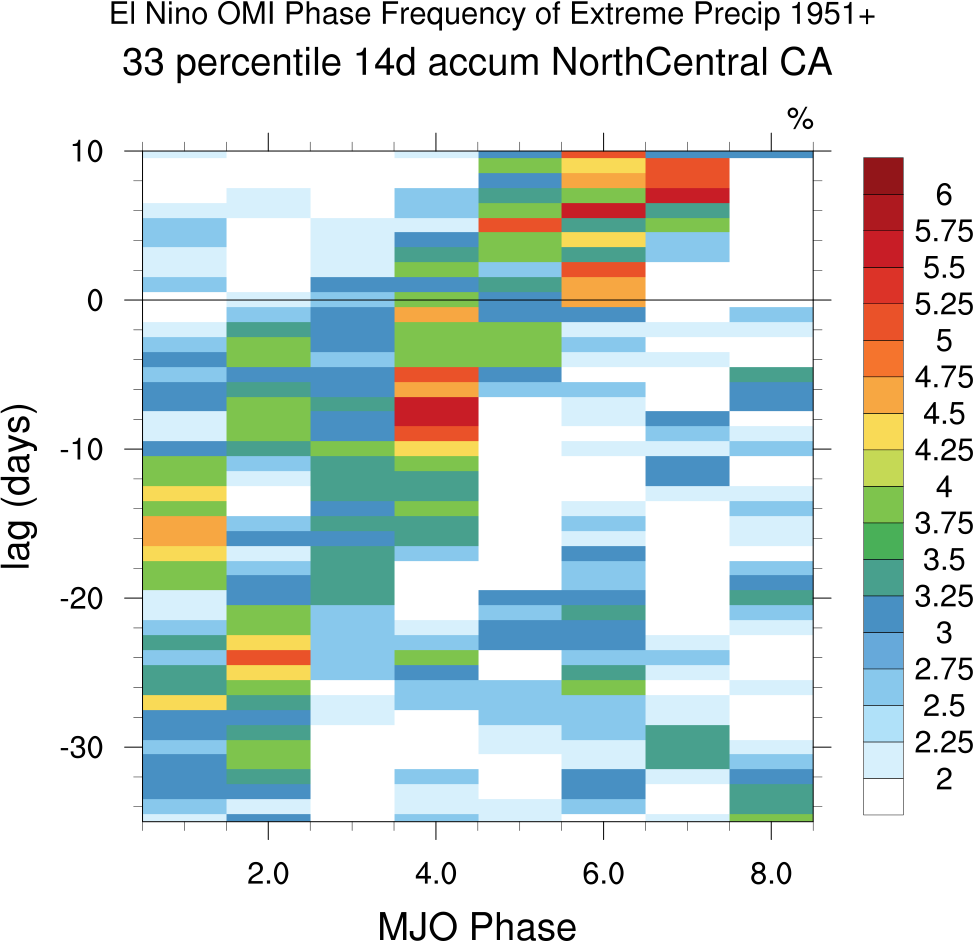
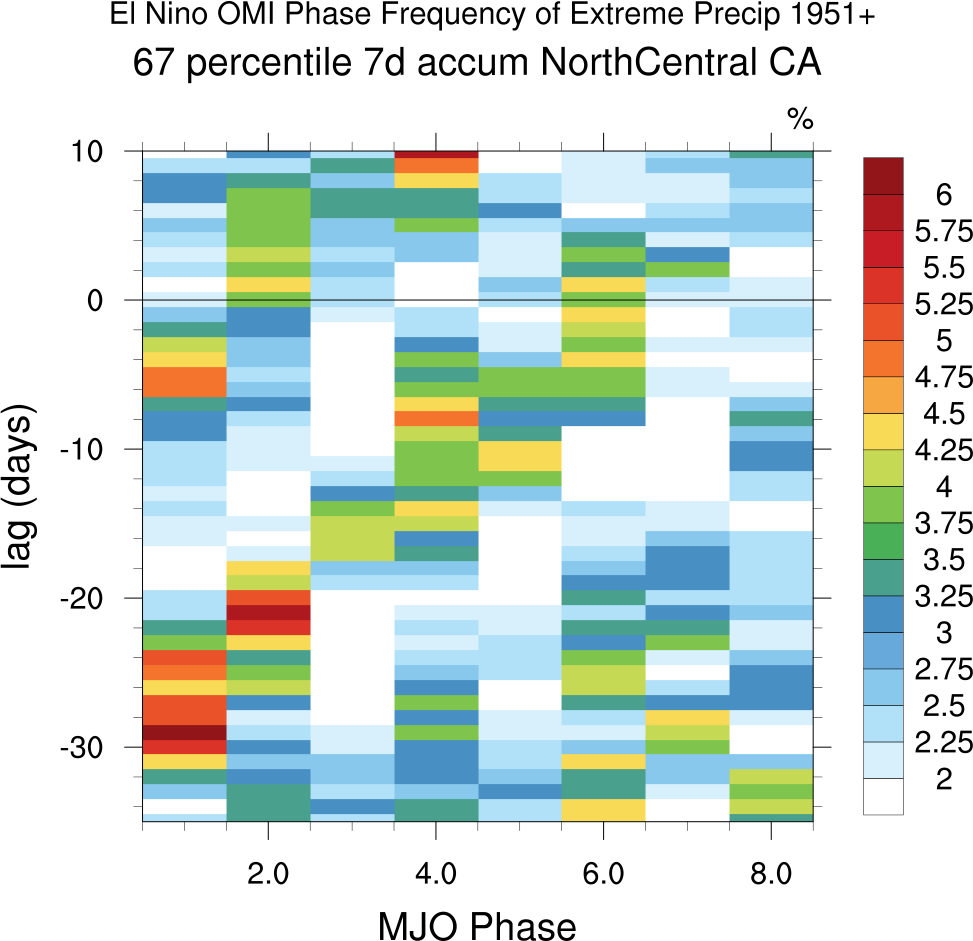
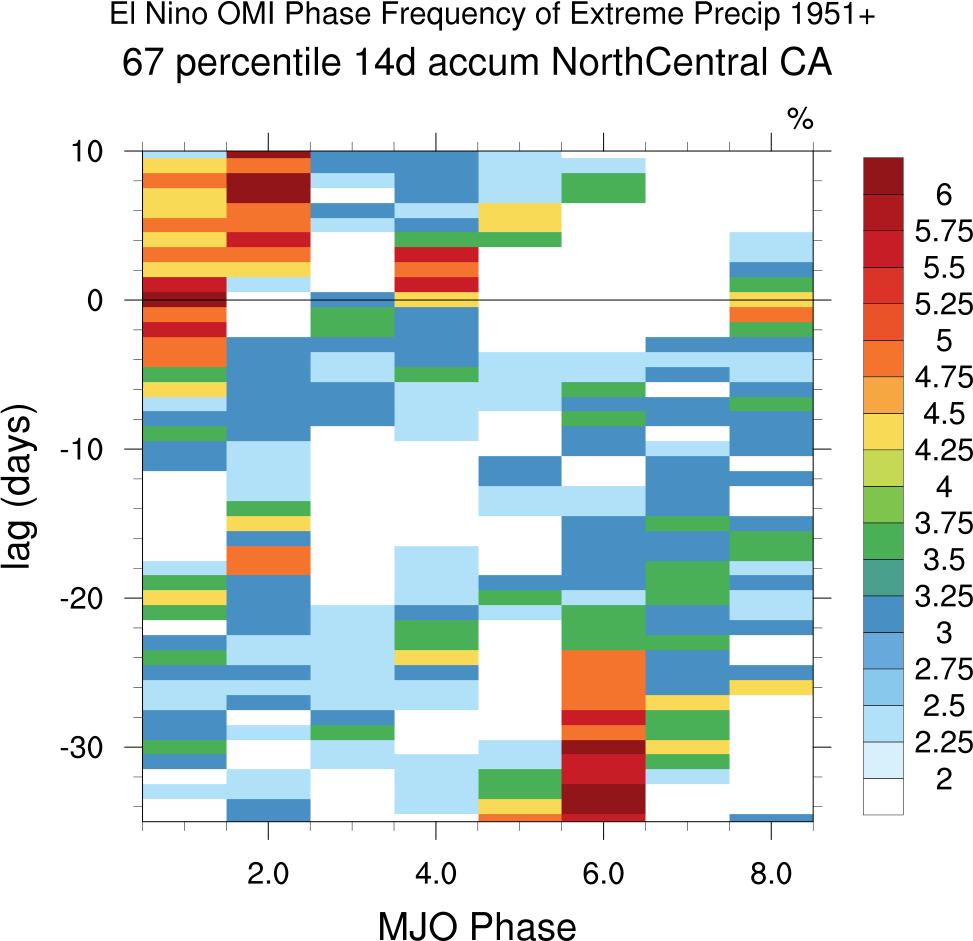
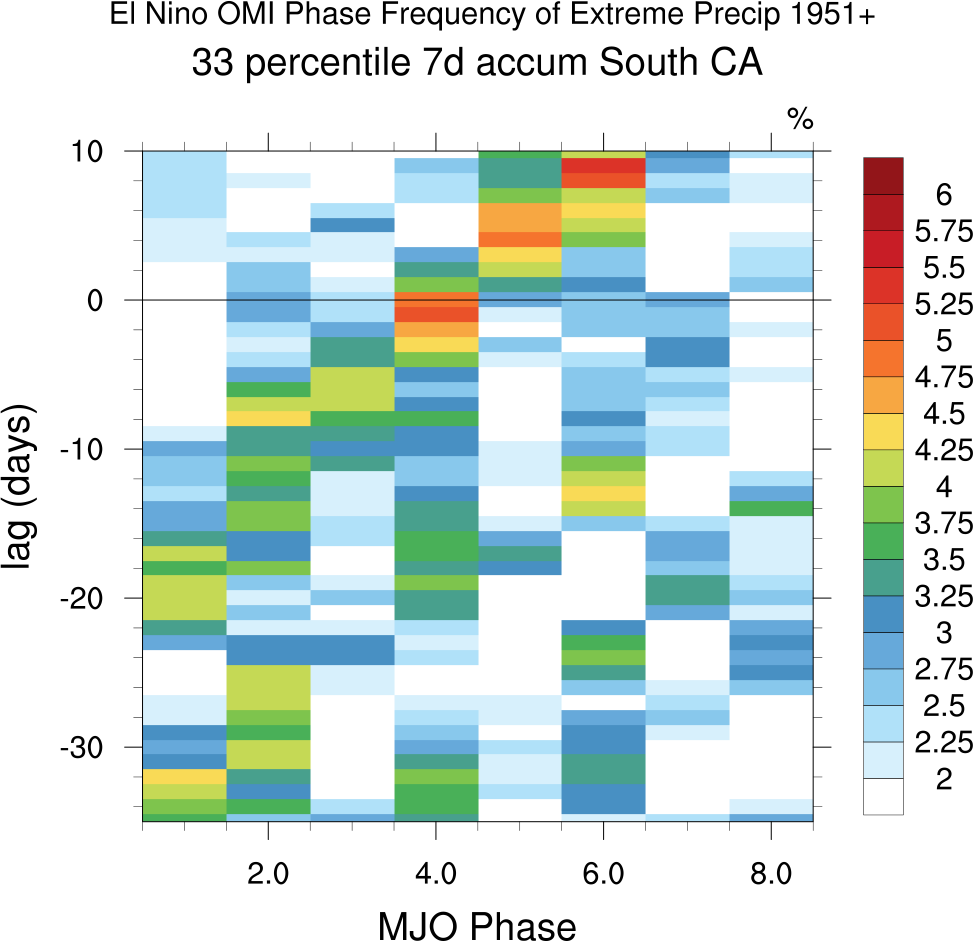
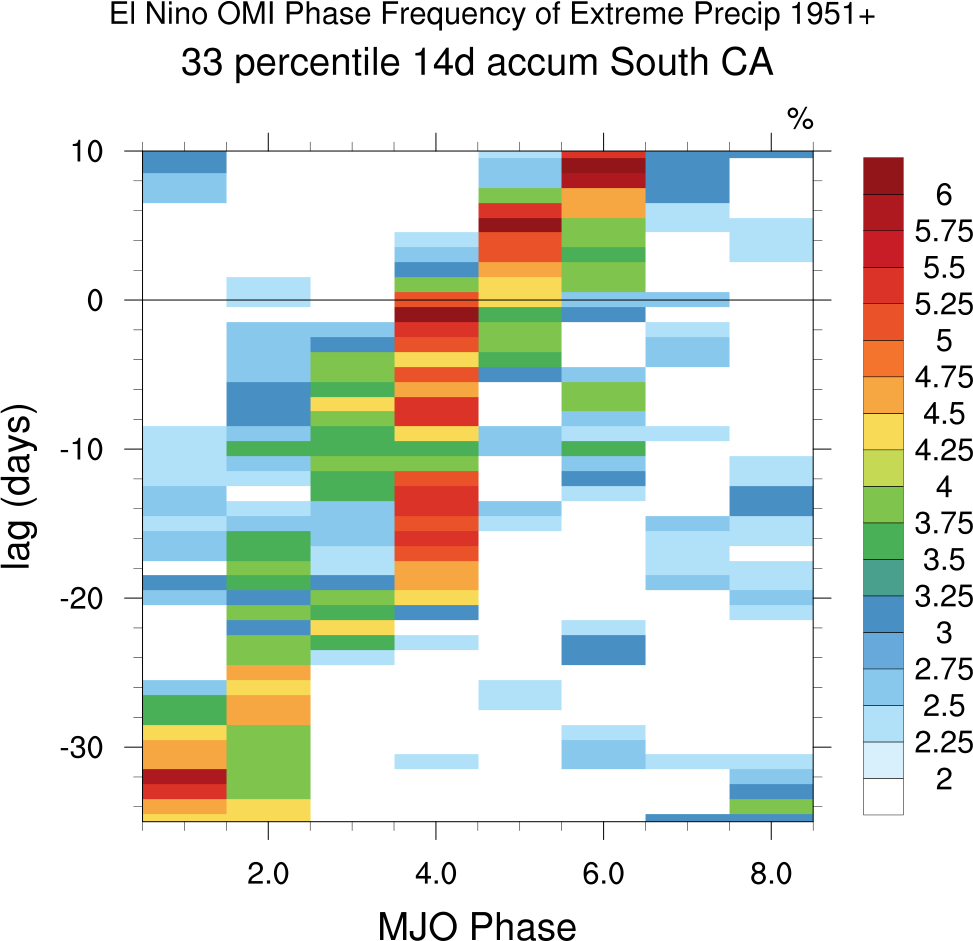
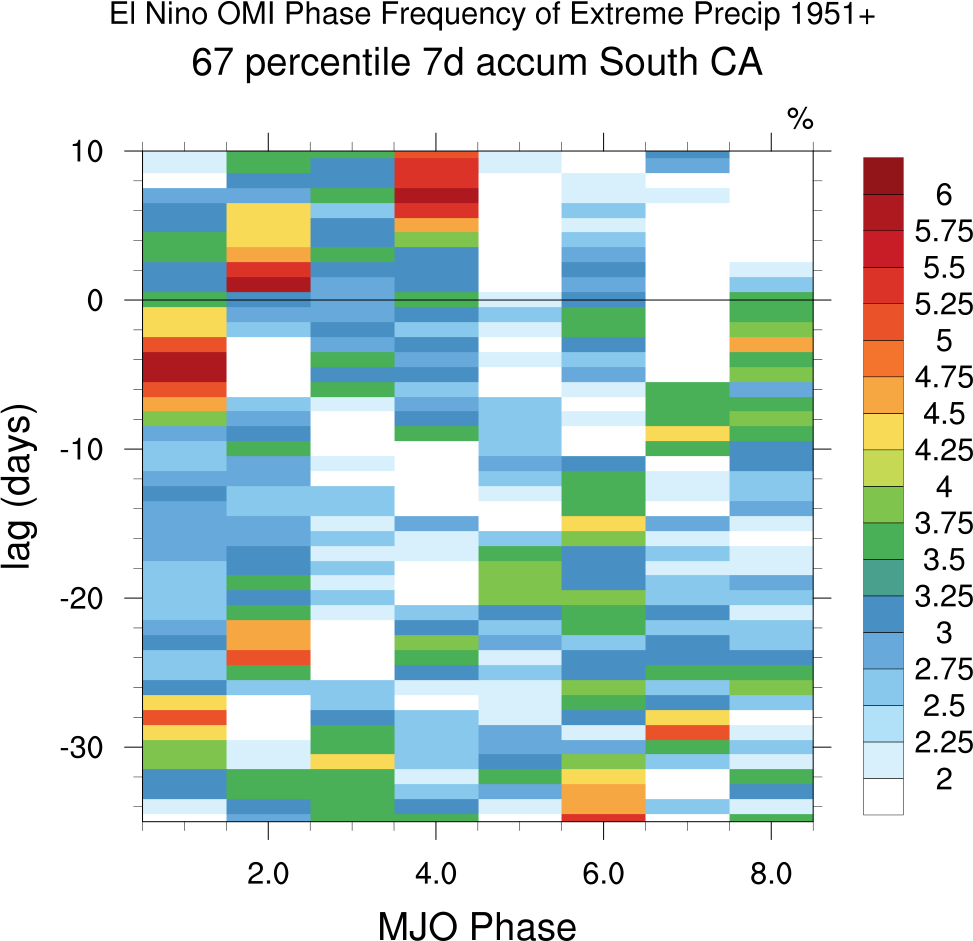
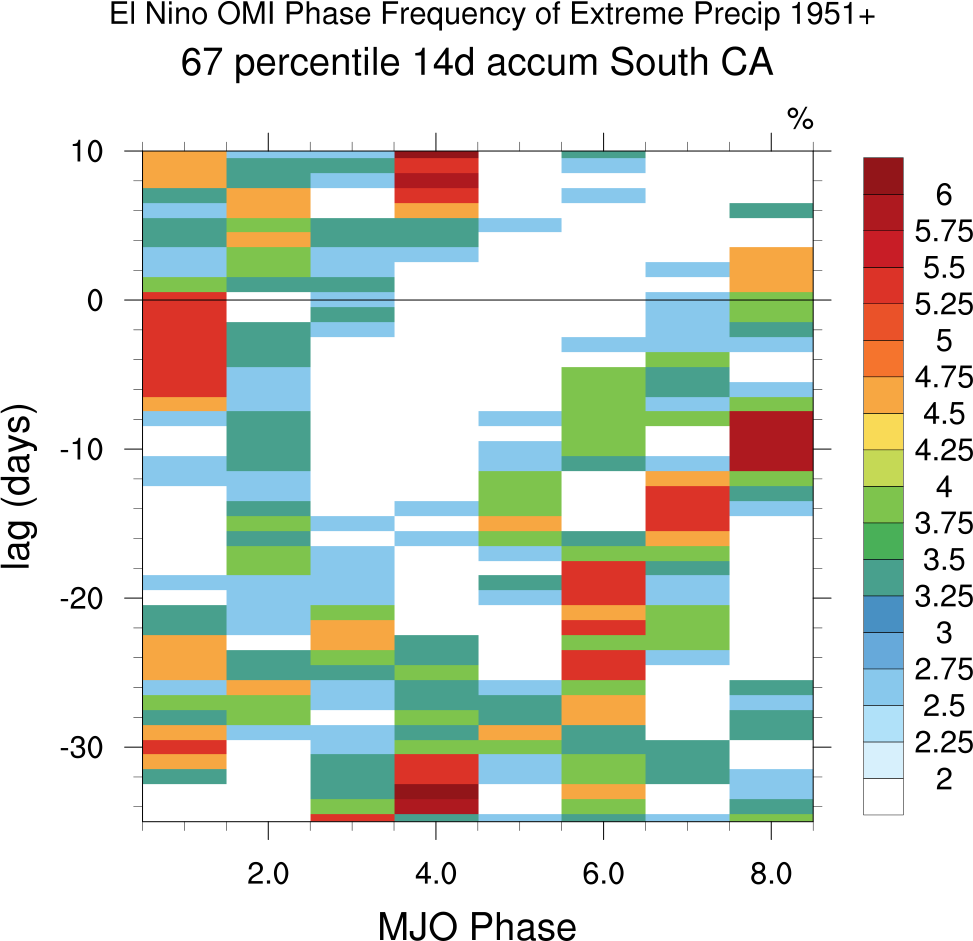
Re. OMI Phase frequency and extreme CA precip with MJO leads, El Nino and precip lags:
7-day, 14-day accumulations:
Northern_Central California 33rd percentile (MJOs radius>1)
Northern_Central California 67th percentile
Southern California 33rd percentile (MJOs radius>1)
Southern California 67th percentile
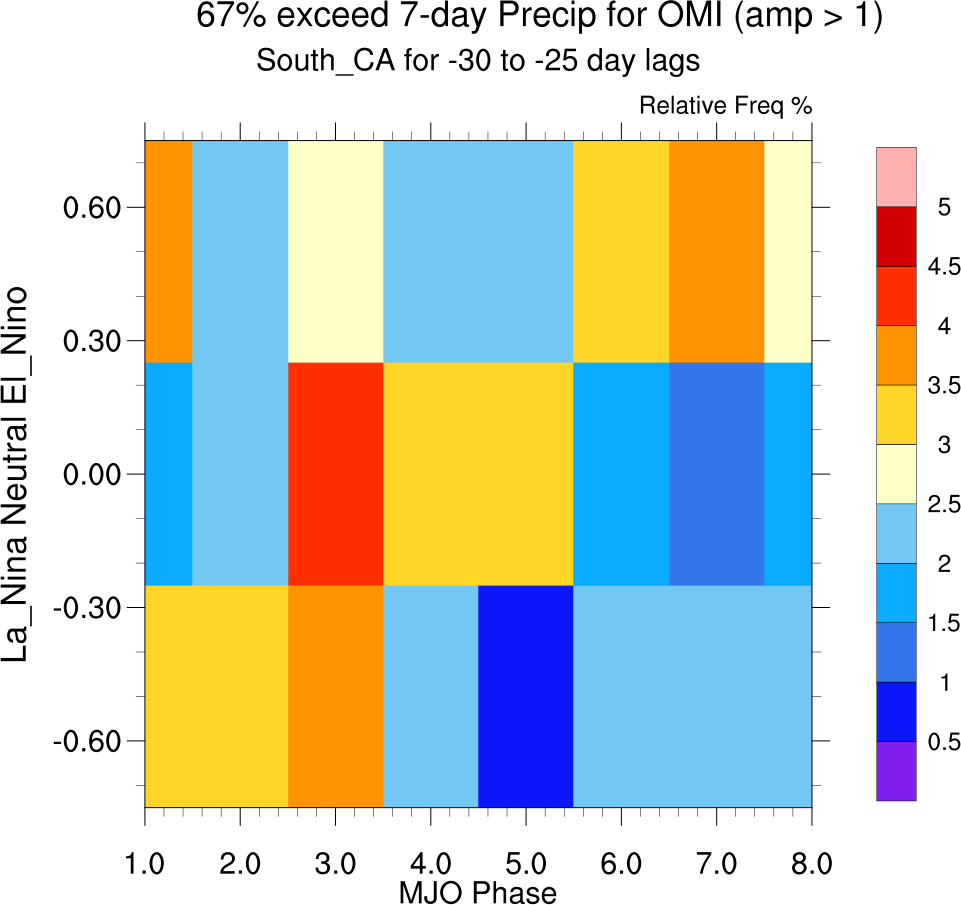
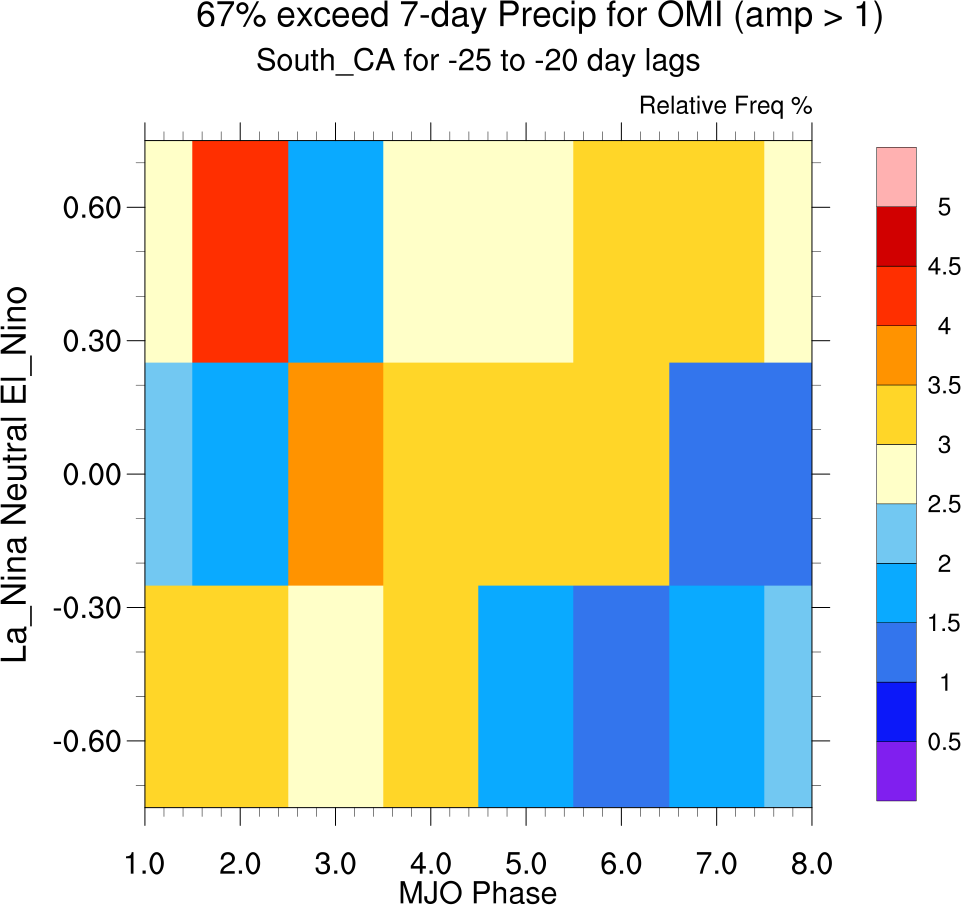
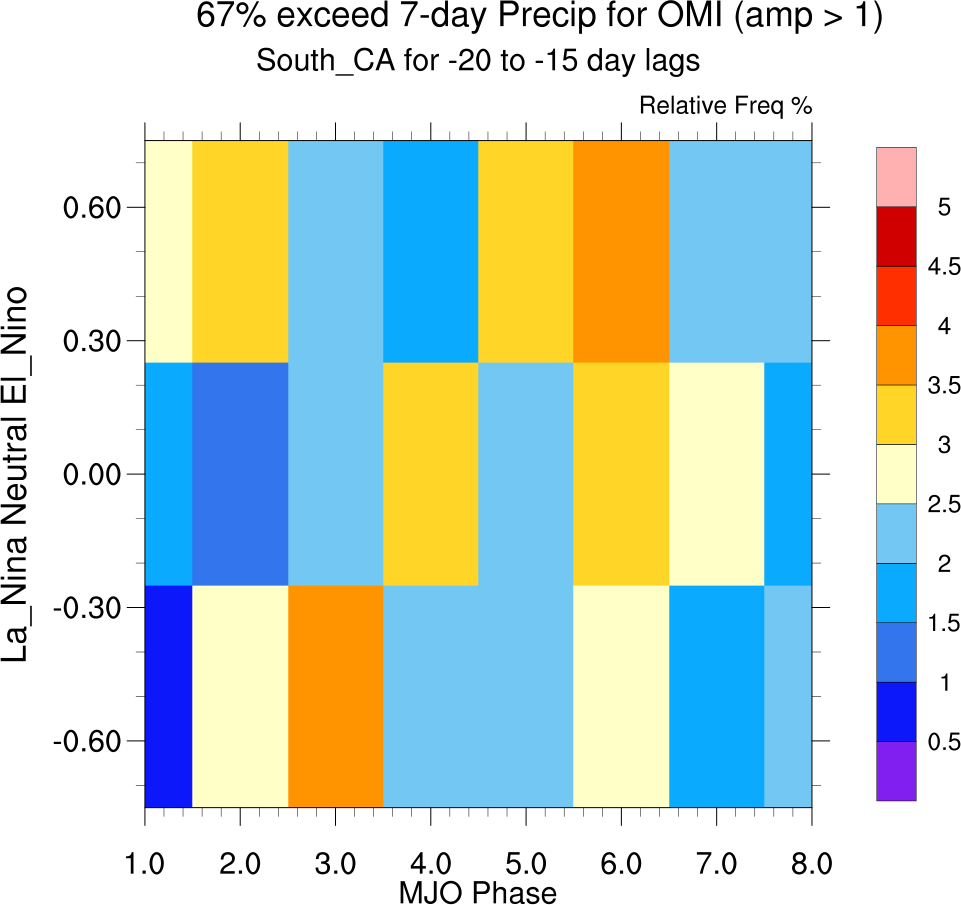
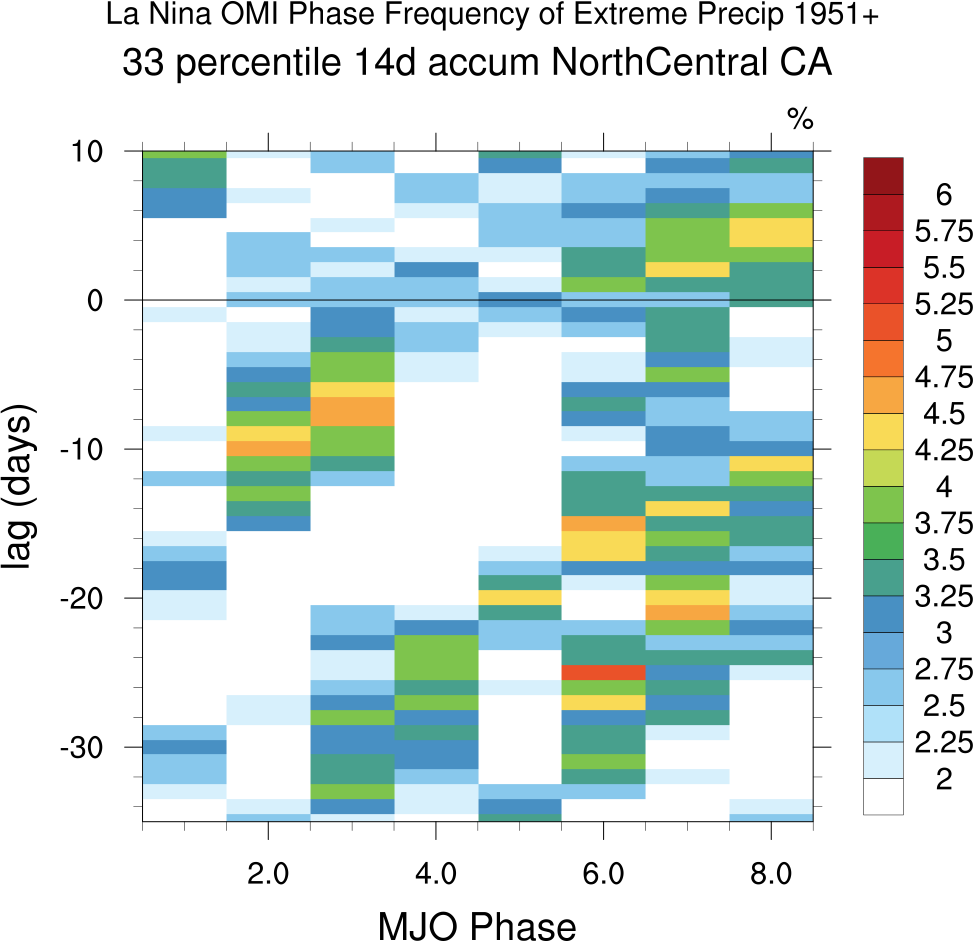
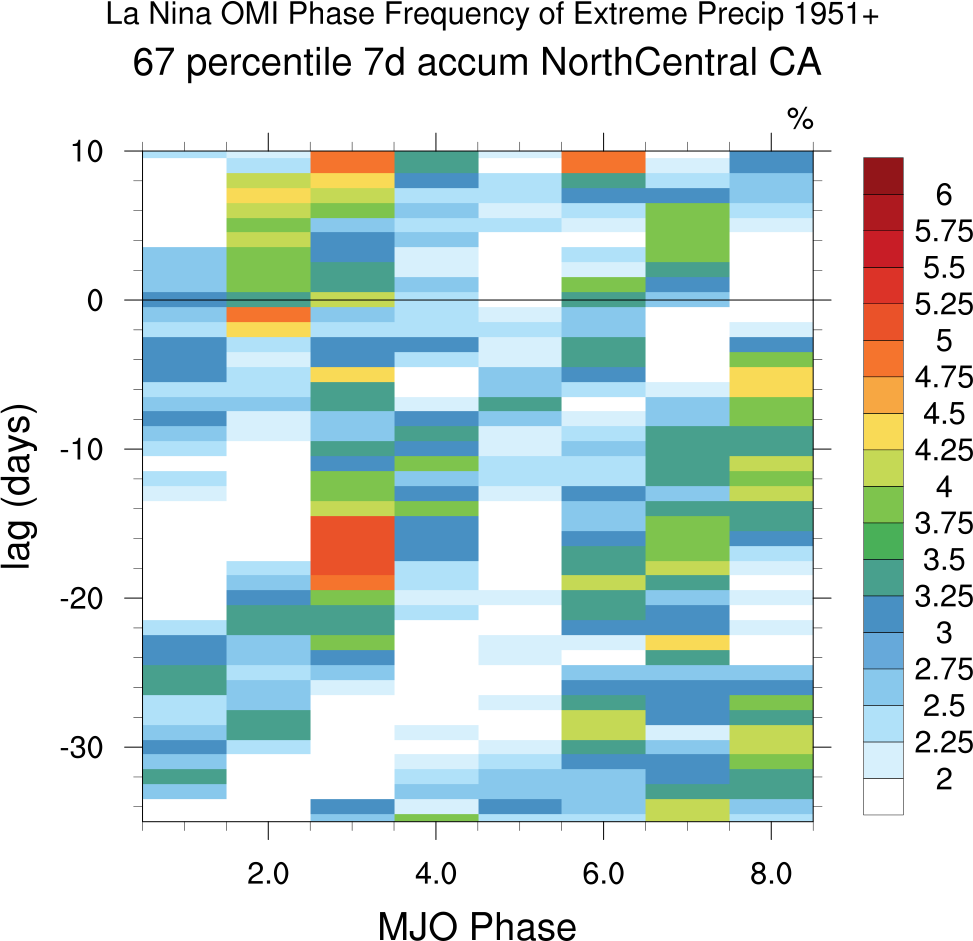
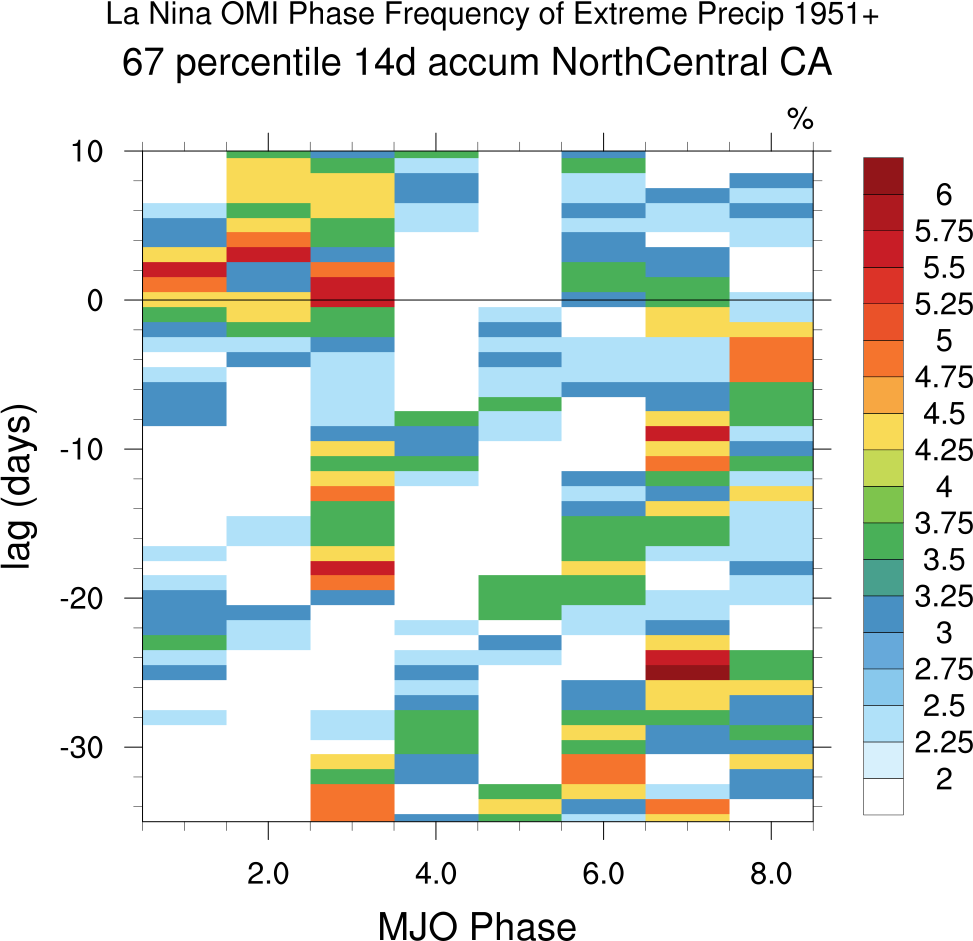
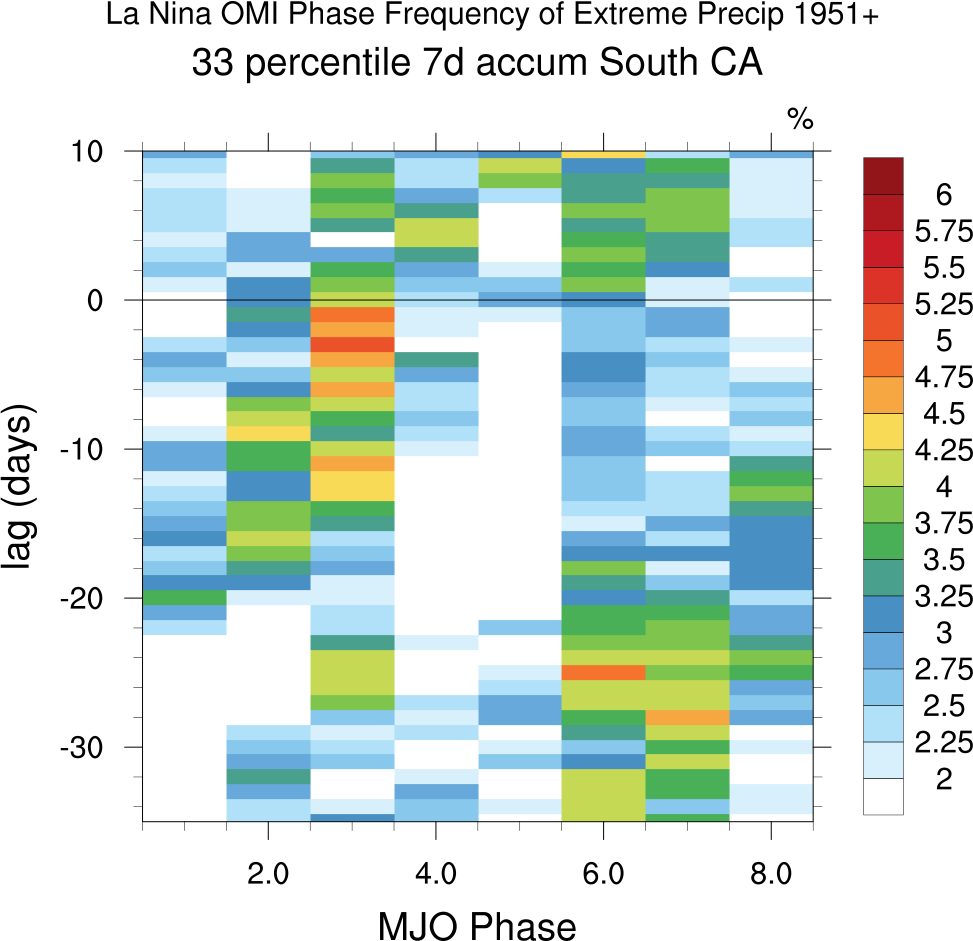
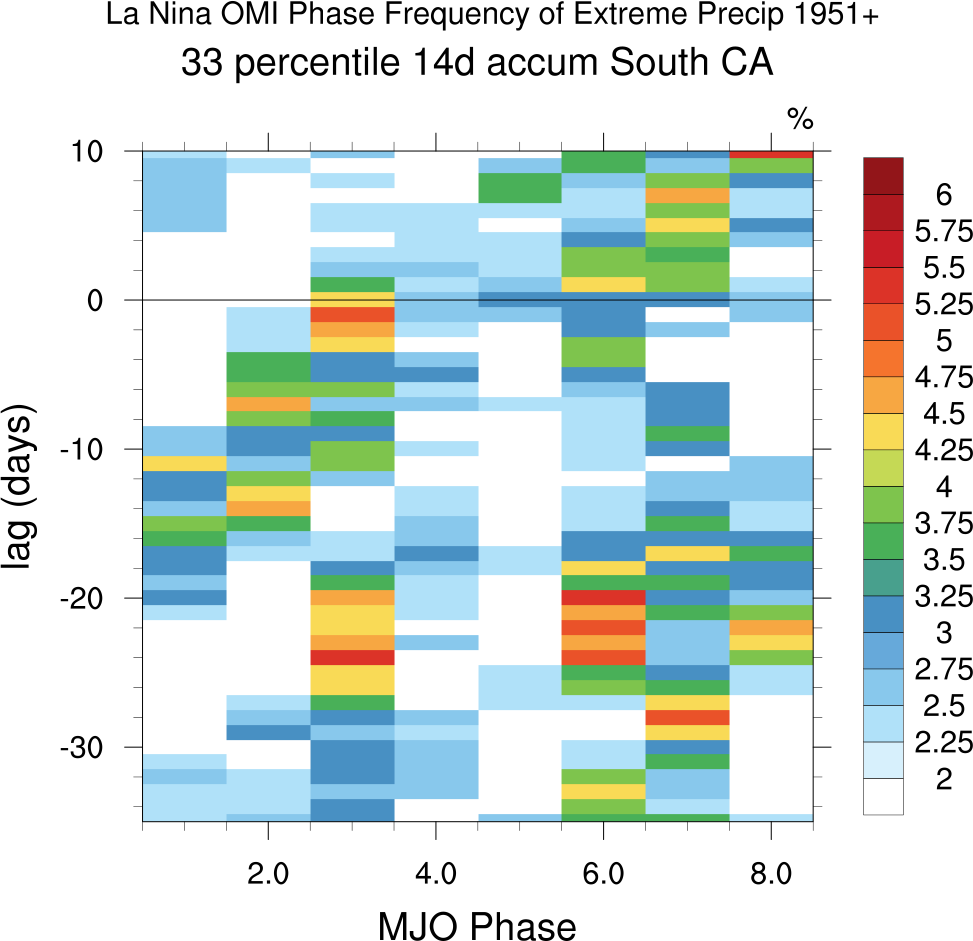
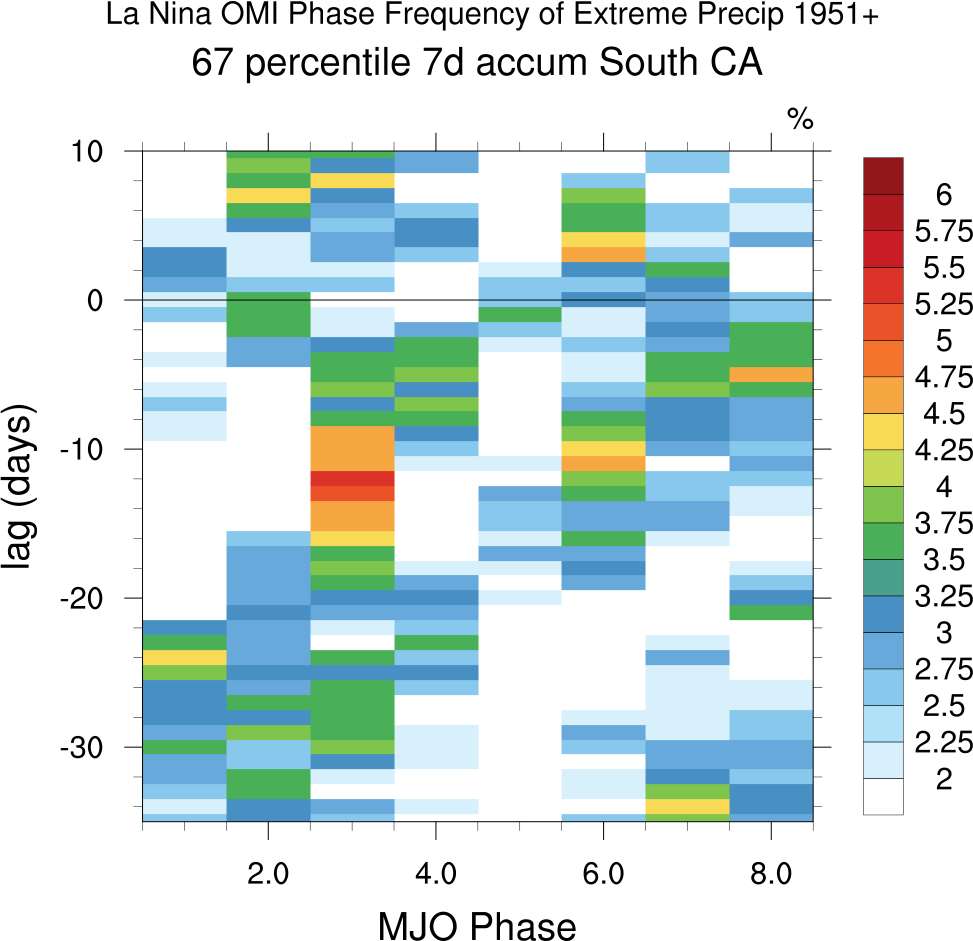
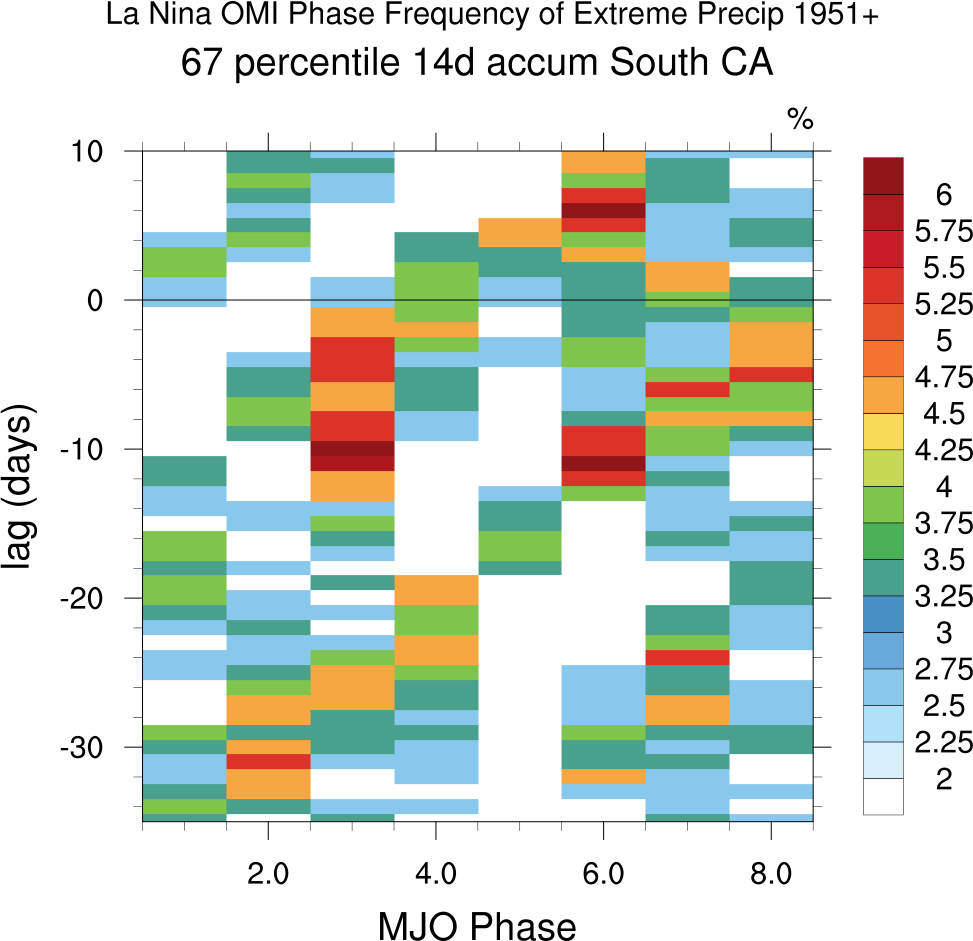
Re. OMI Phase frequency and extreme CA precip with MJO leads, La Nina and precip lags:
7-day, 14-day accumulations:
Northern_Central California 33rd percentile (MJOs radius>1)
Northern_Central California 67th percentile
Southern California 33rd percentile (MJOs radius>1)
Southern California 67th percentile
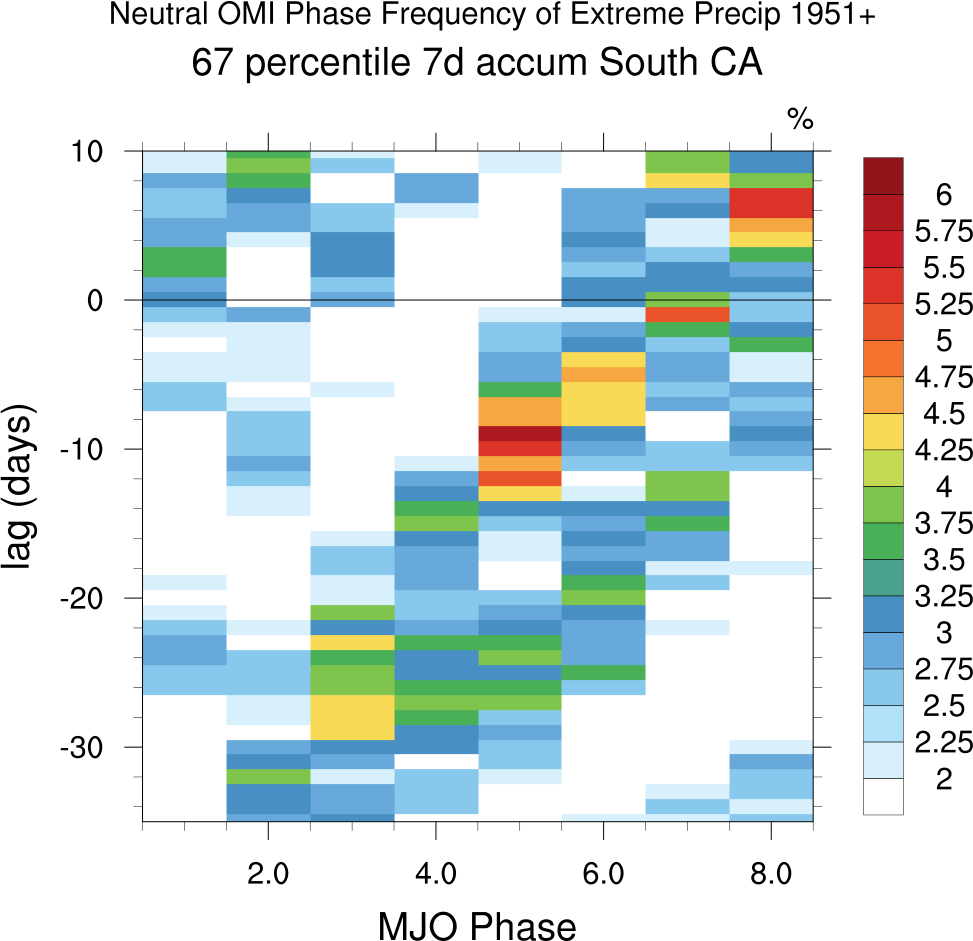
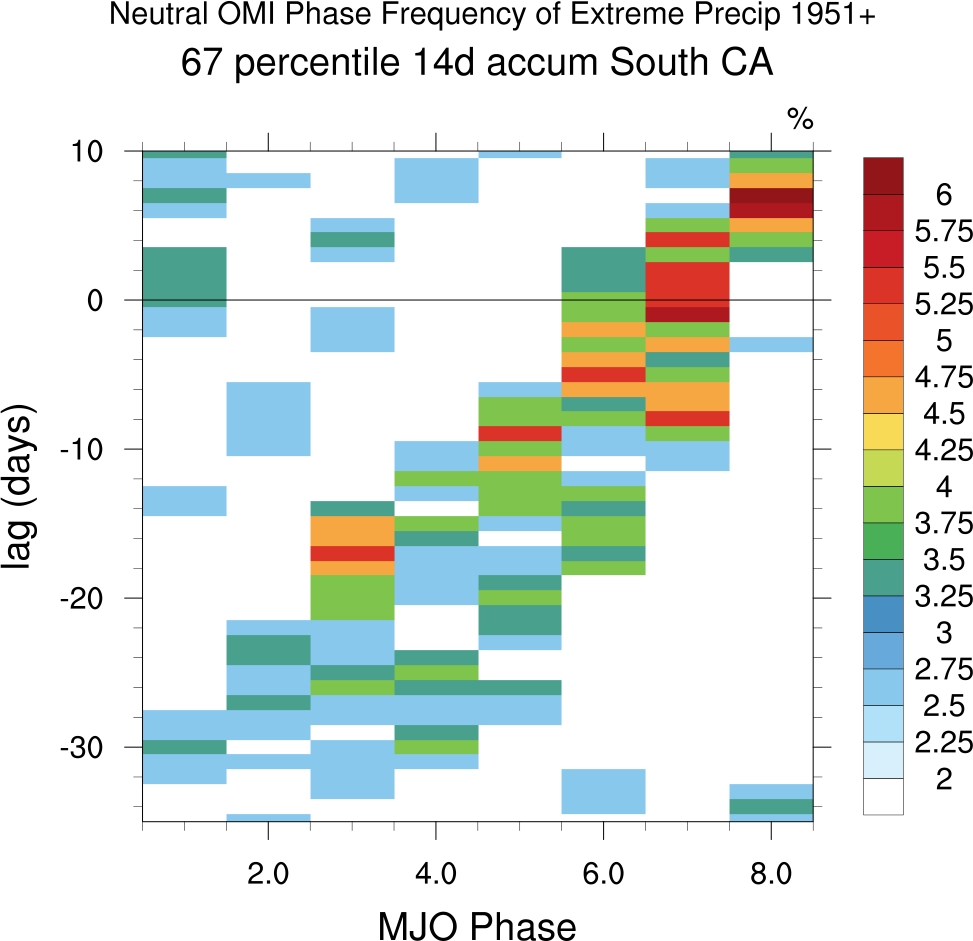
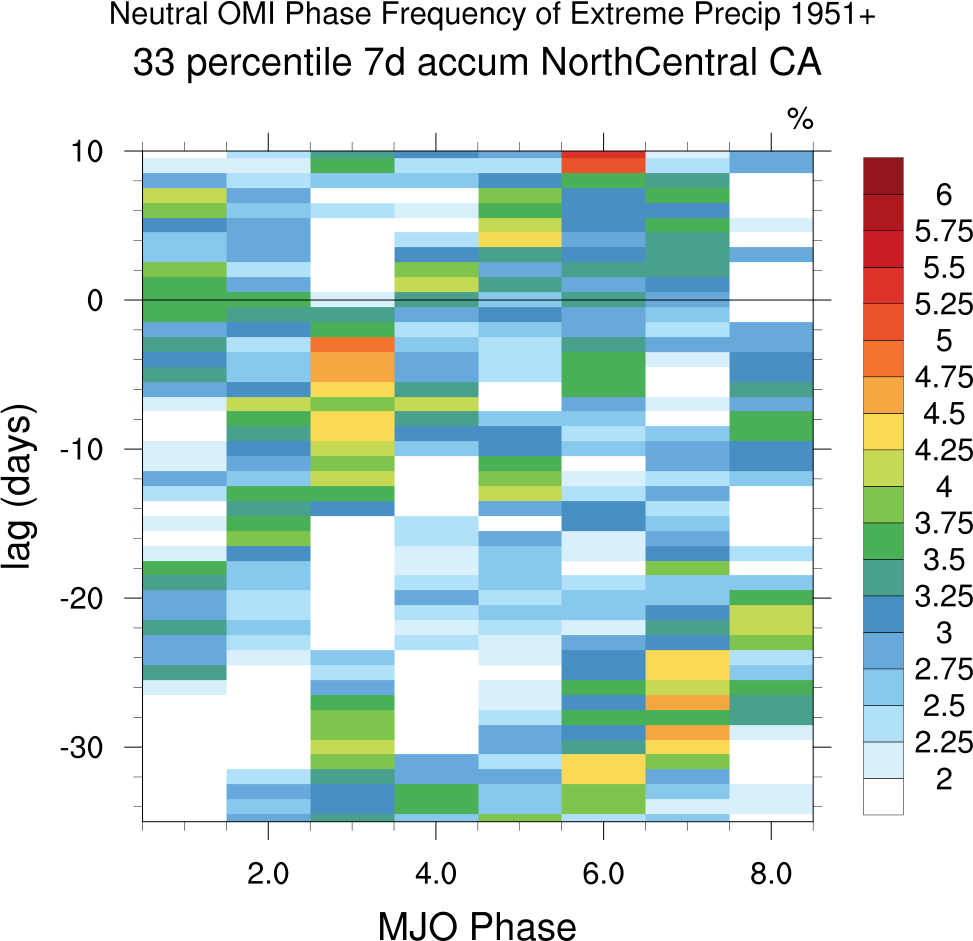
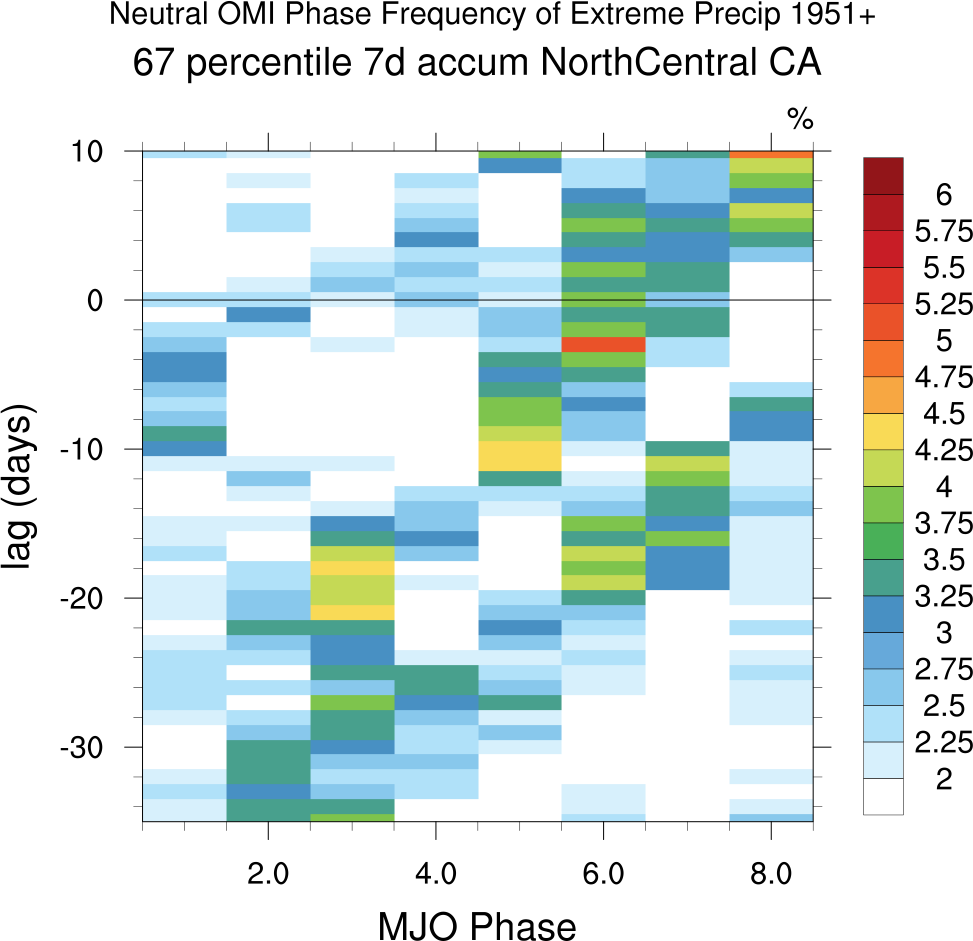
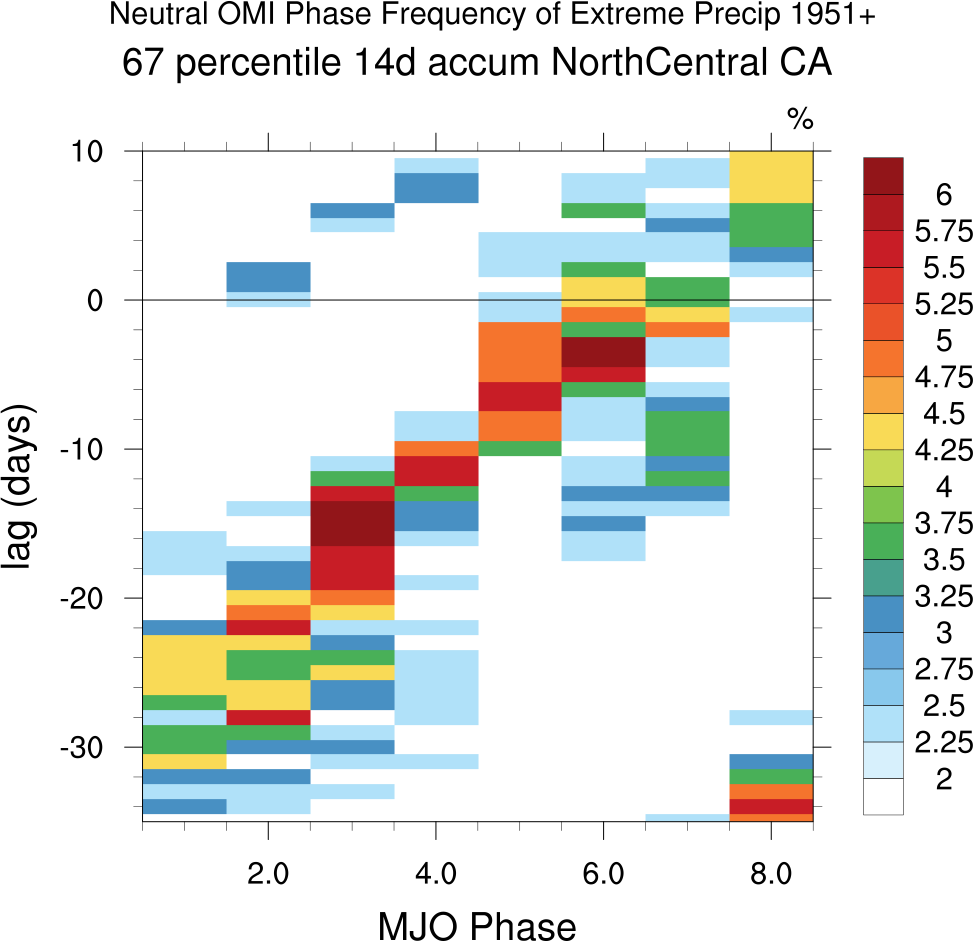
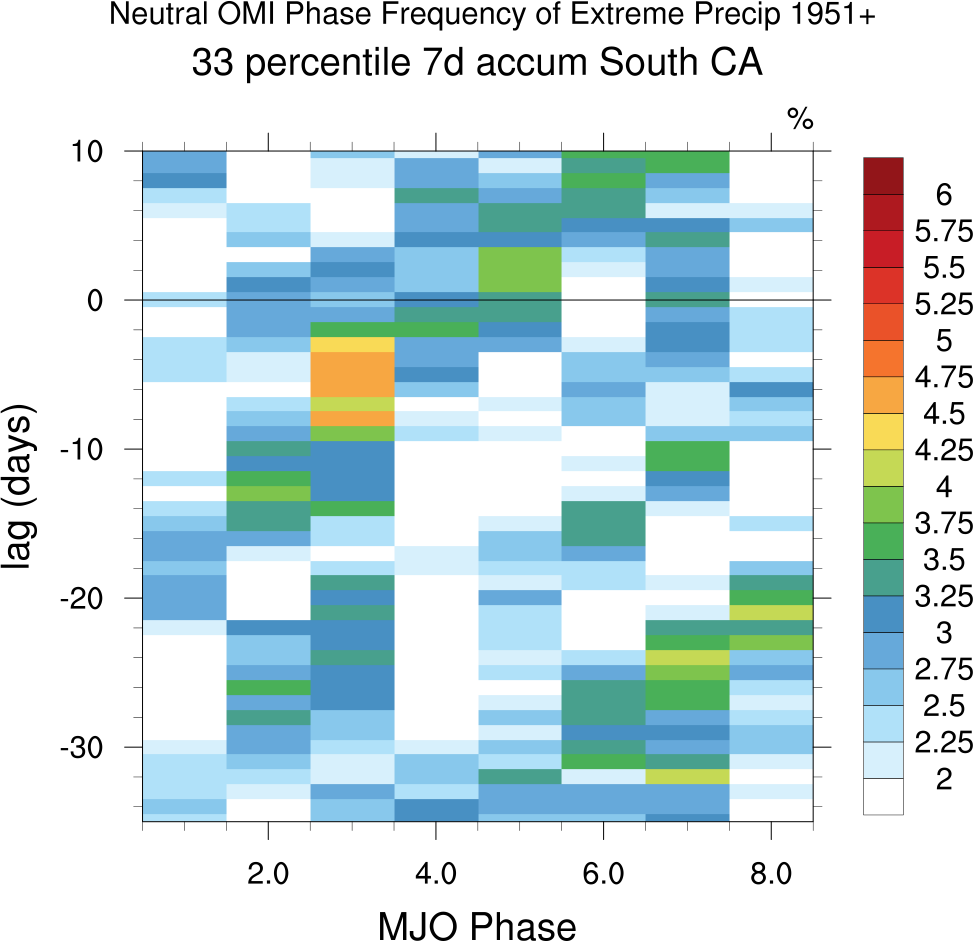
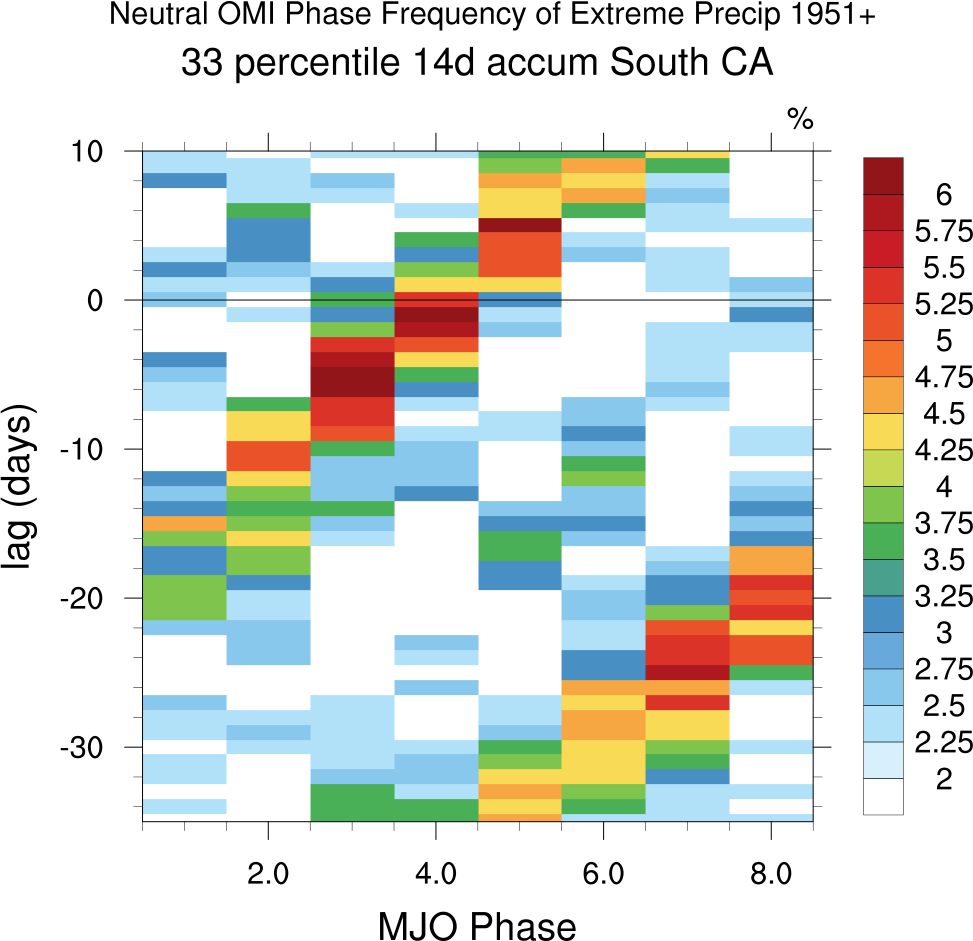
Re. OMI Phase frequency and extreme CA precip with MJO leads, ENSO Neutral and precip lags:
7-day, 14-day accumulations:
Northern_Central California 33rd percentile (MJOs radius>1)
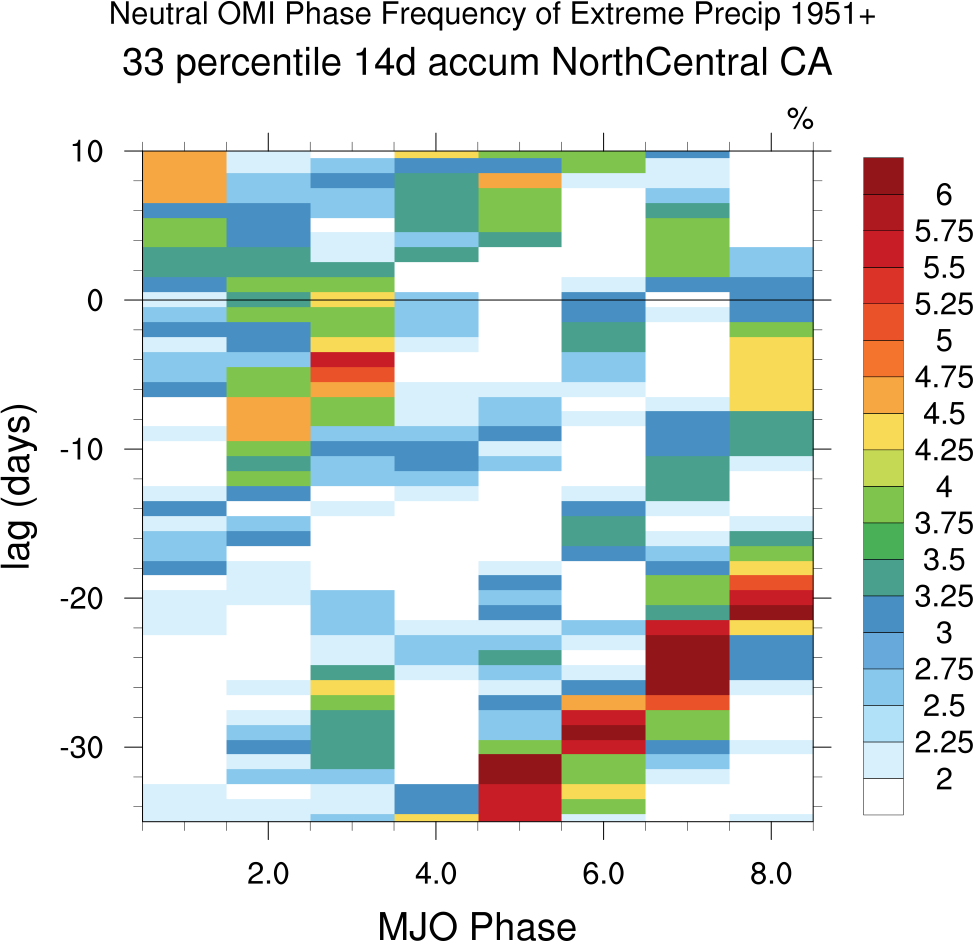
Northern_Central California 67th percentile
Southern California 33rd percentile (MJOs radius>1)
Southern California 67th percentile