Lesley L. Smith
All plots here preliminary. Right click to see bigger images.
Back to main Smith page
ENSO's effect on U.S. weather
CESM1 Large ensemble experiment
Are El Nino teleconnections changing?
New 30 year periods Anomalies computed wrt 1981-2010. El Ninos computed wrt respective 30-year period.
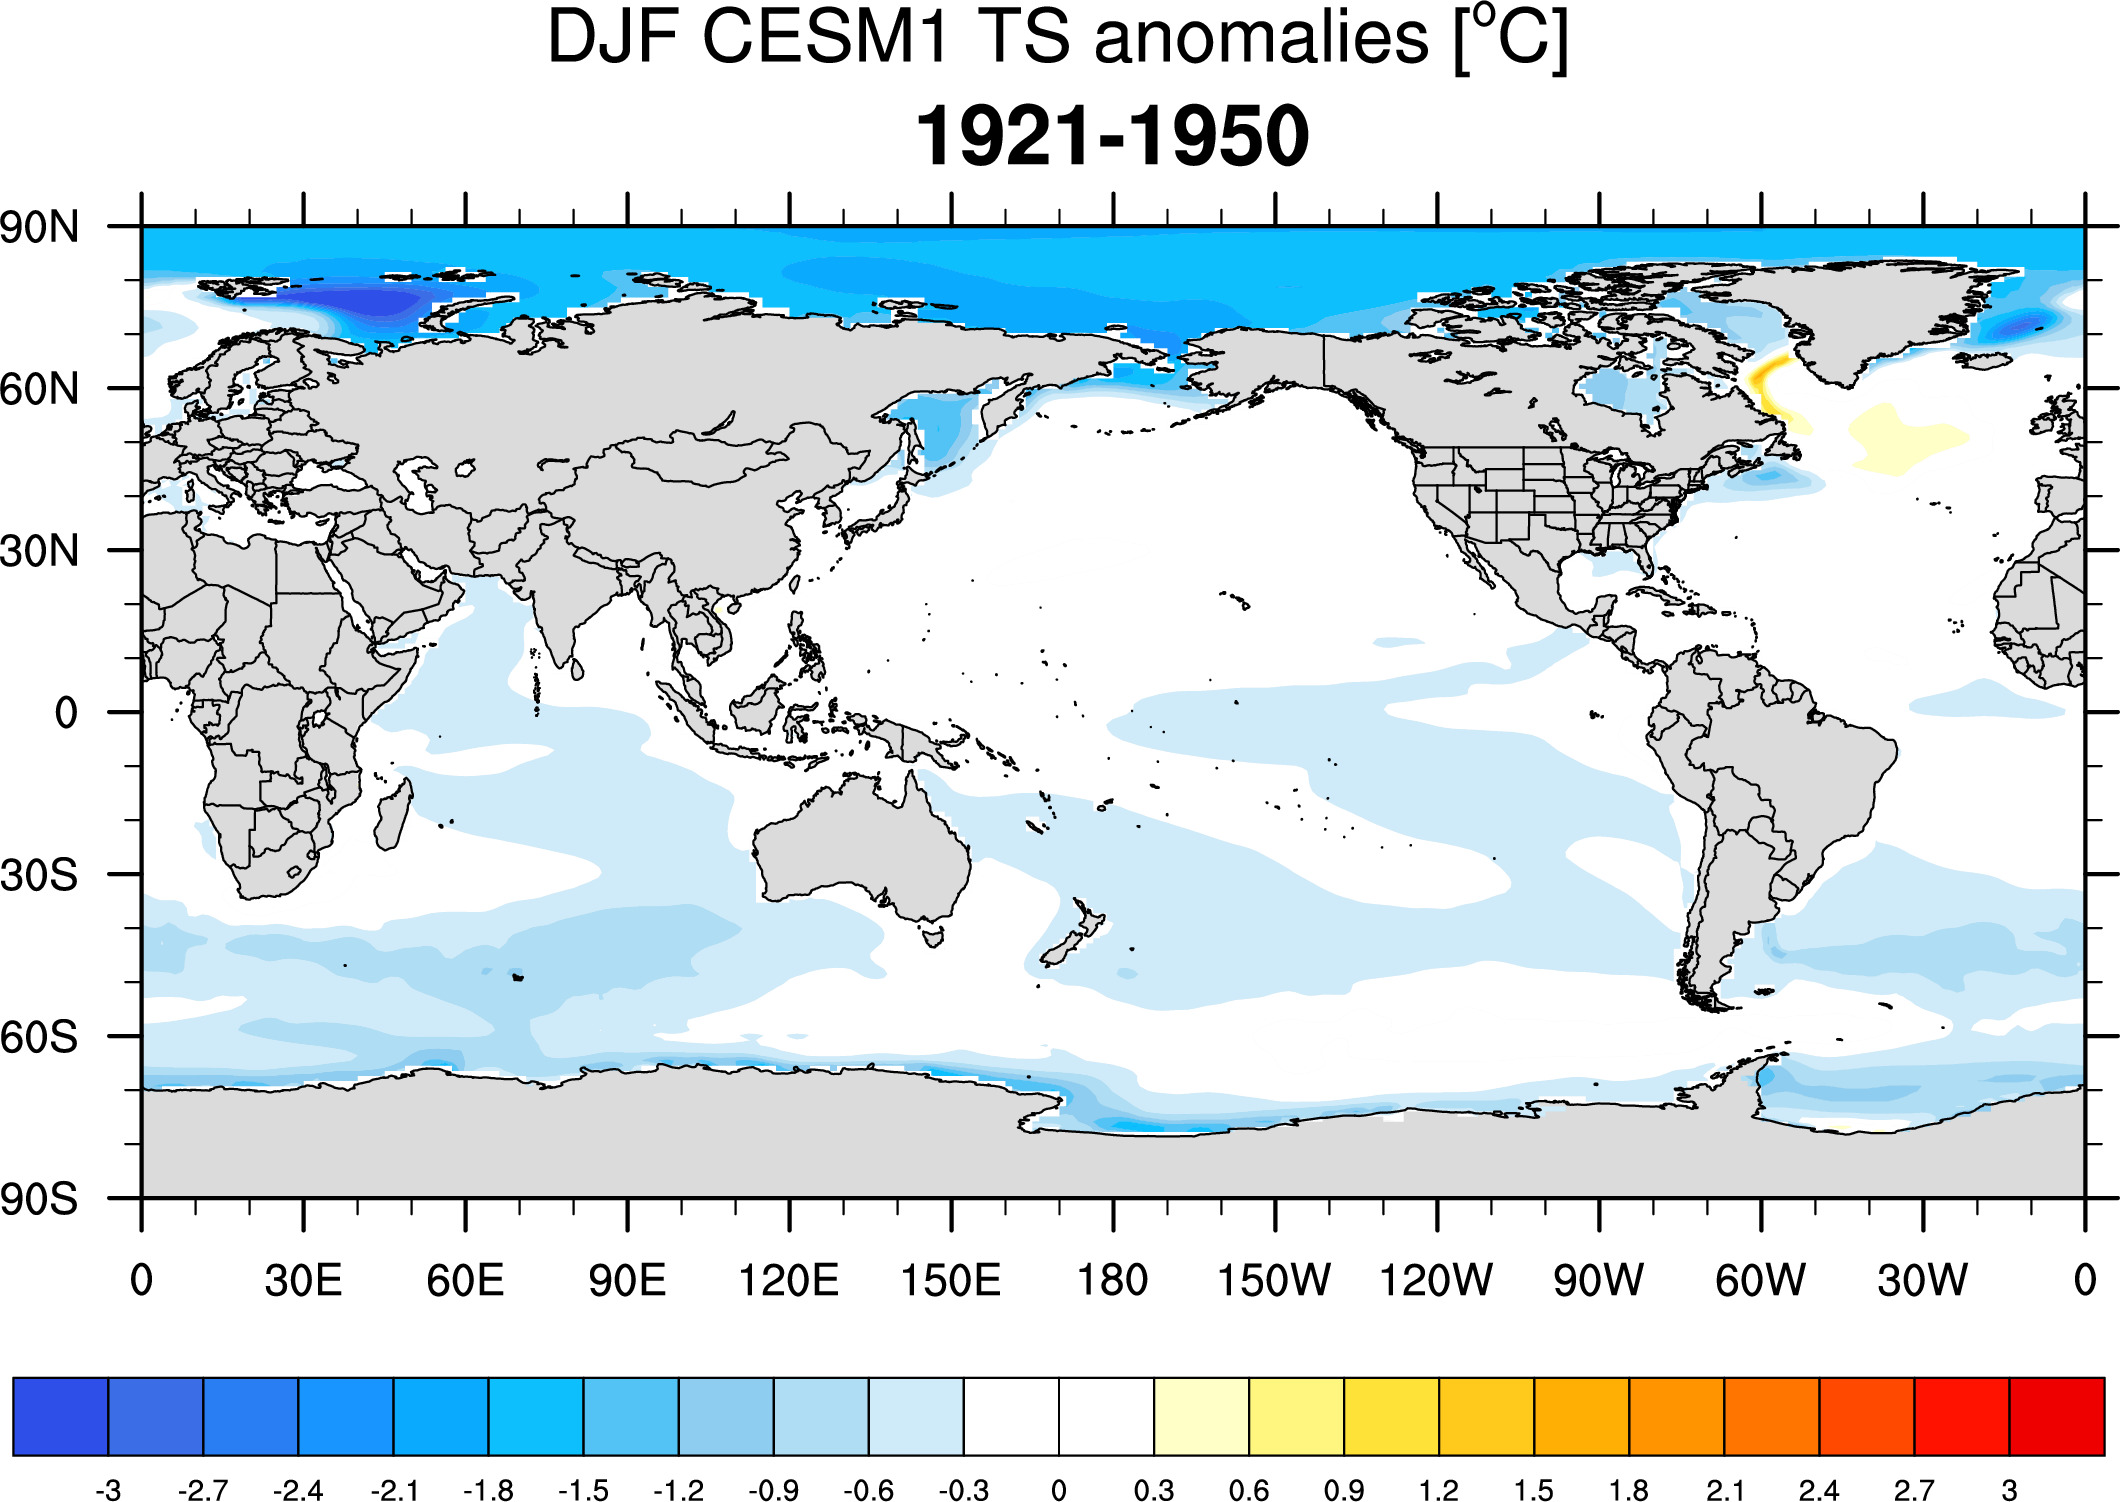
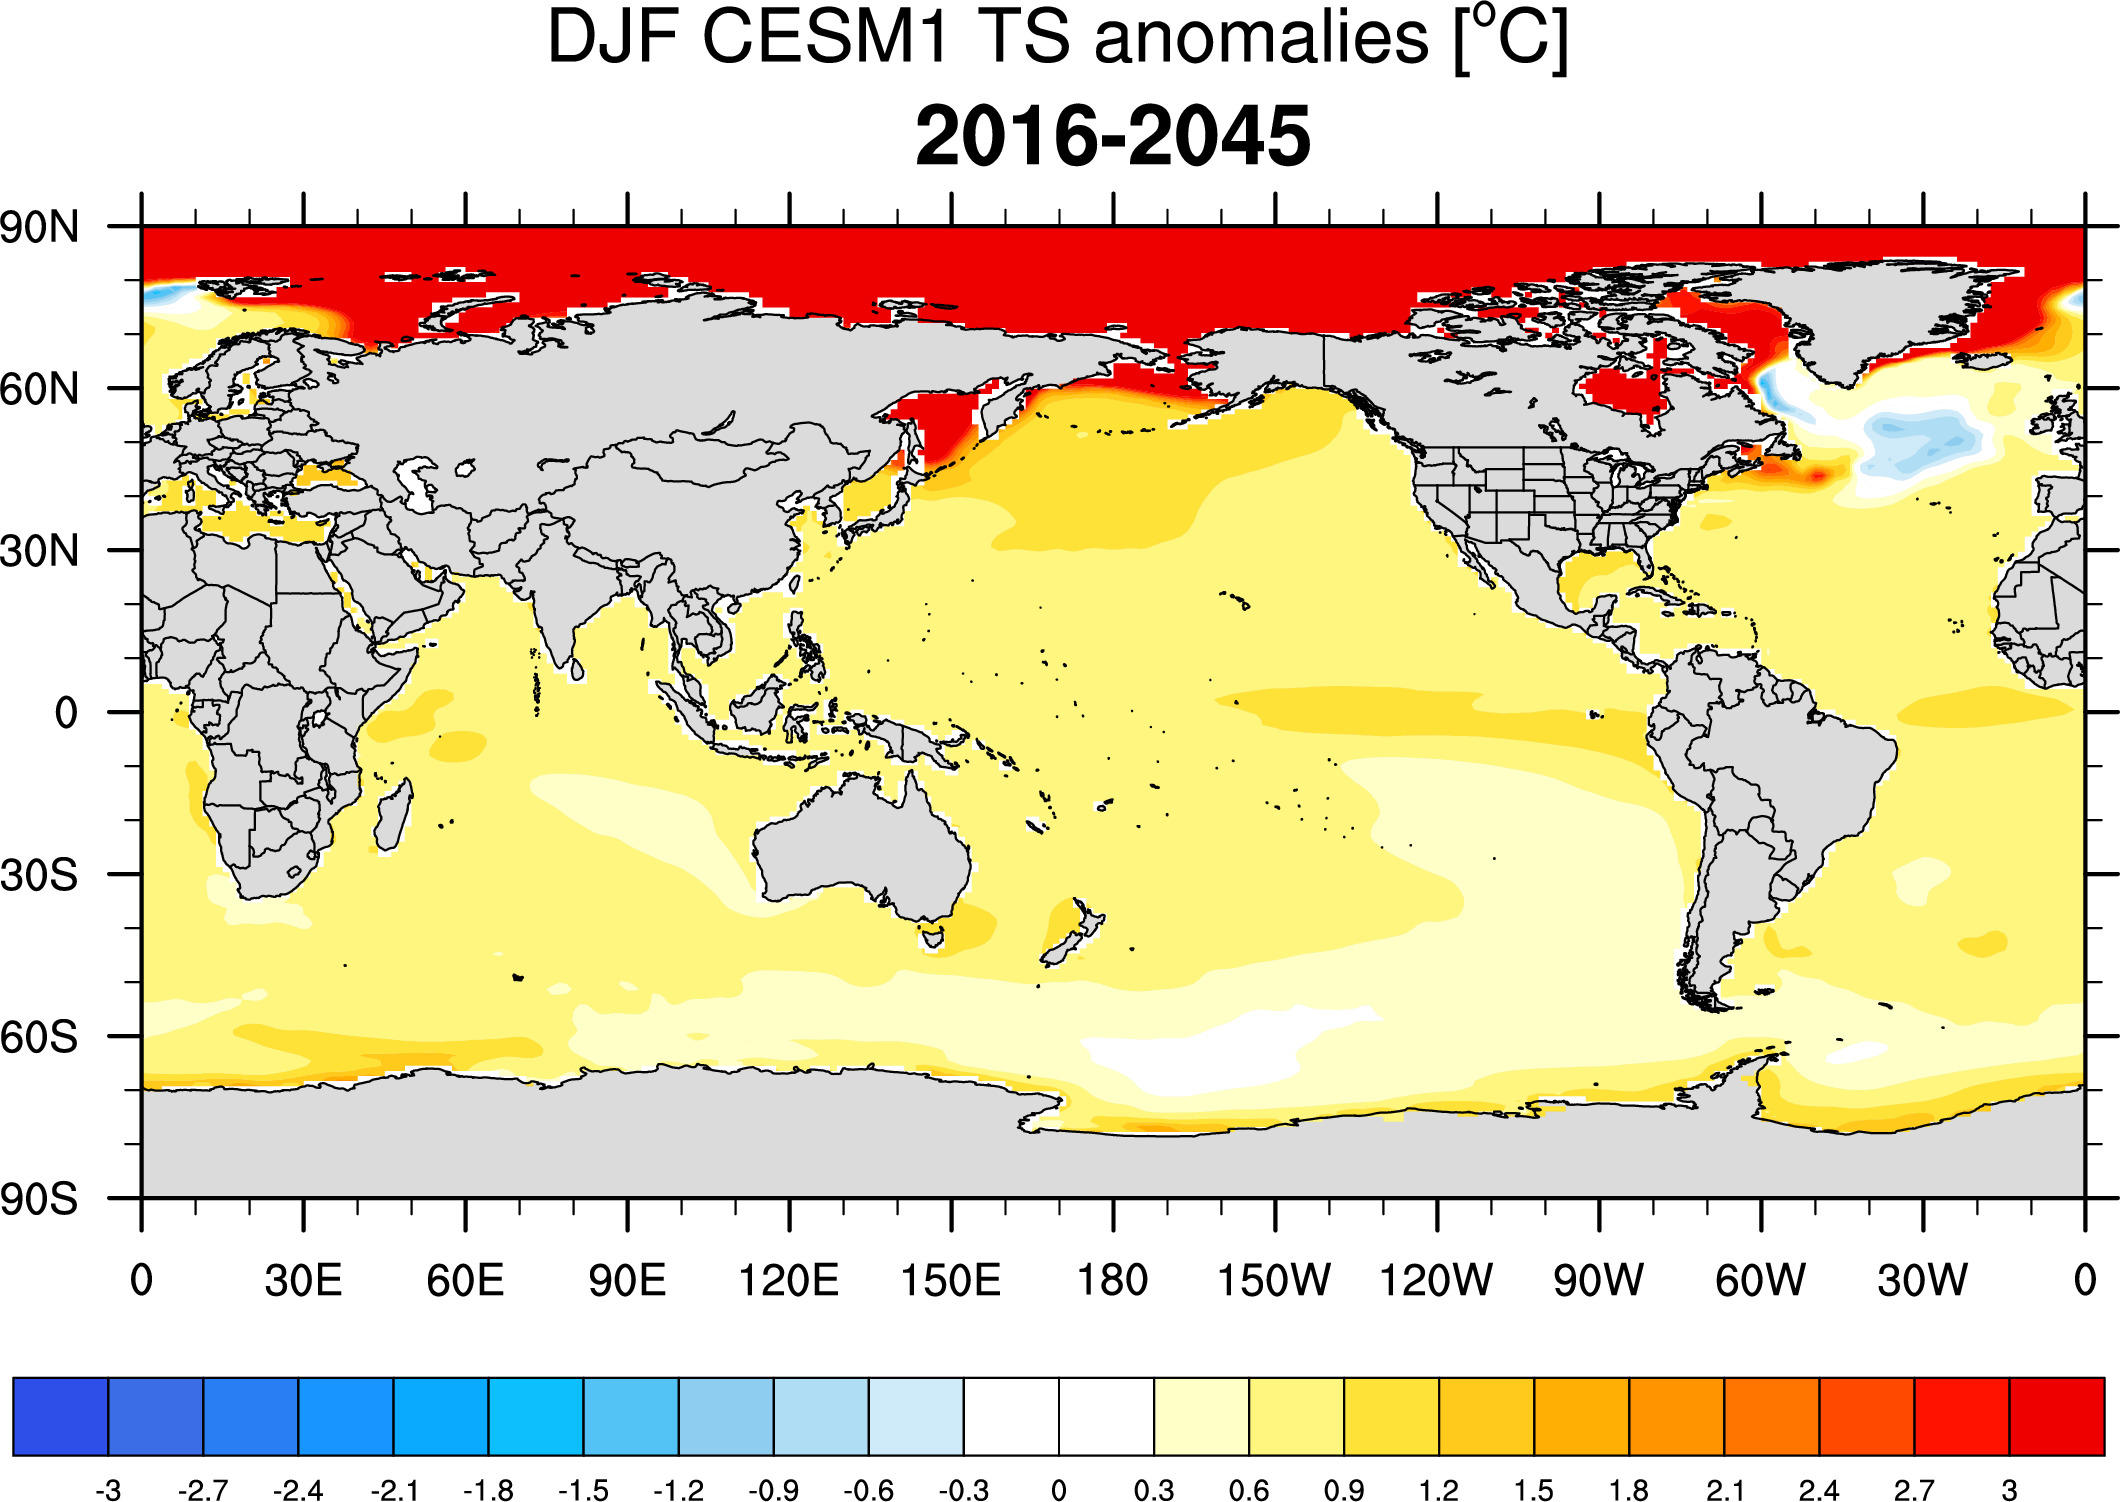
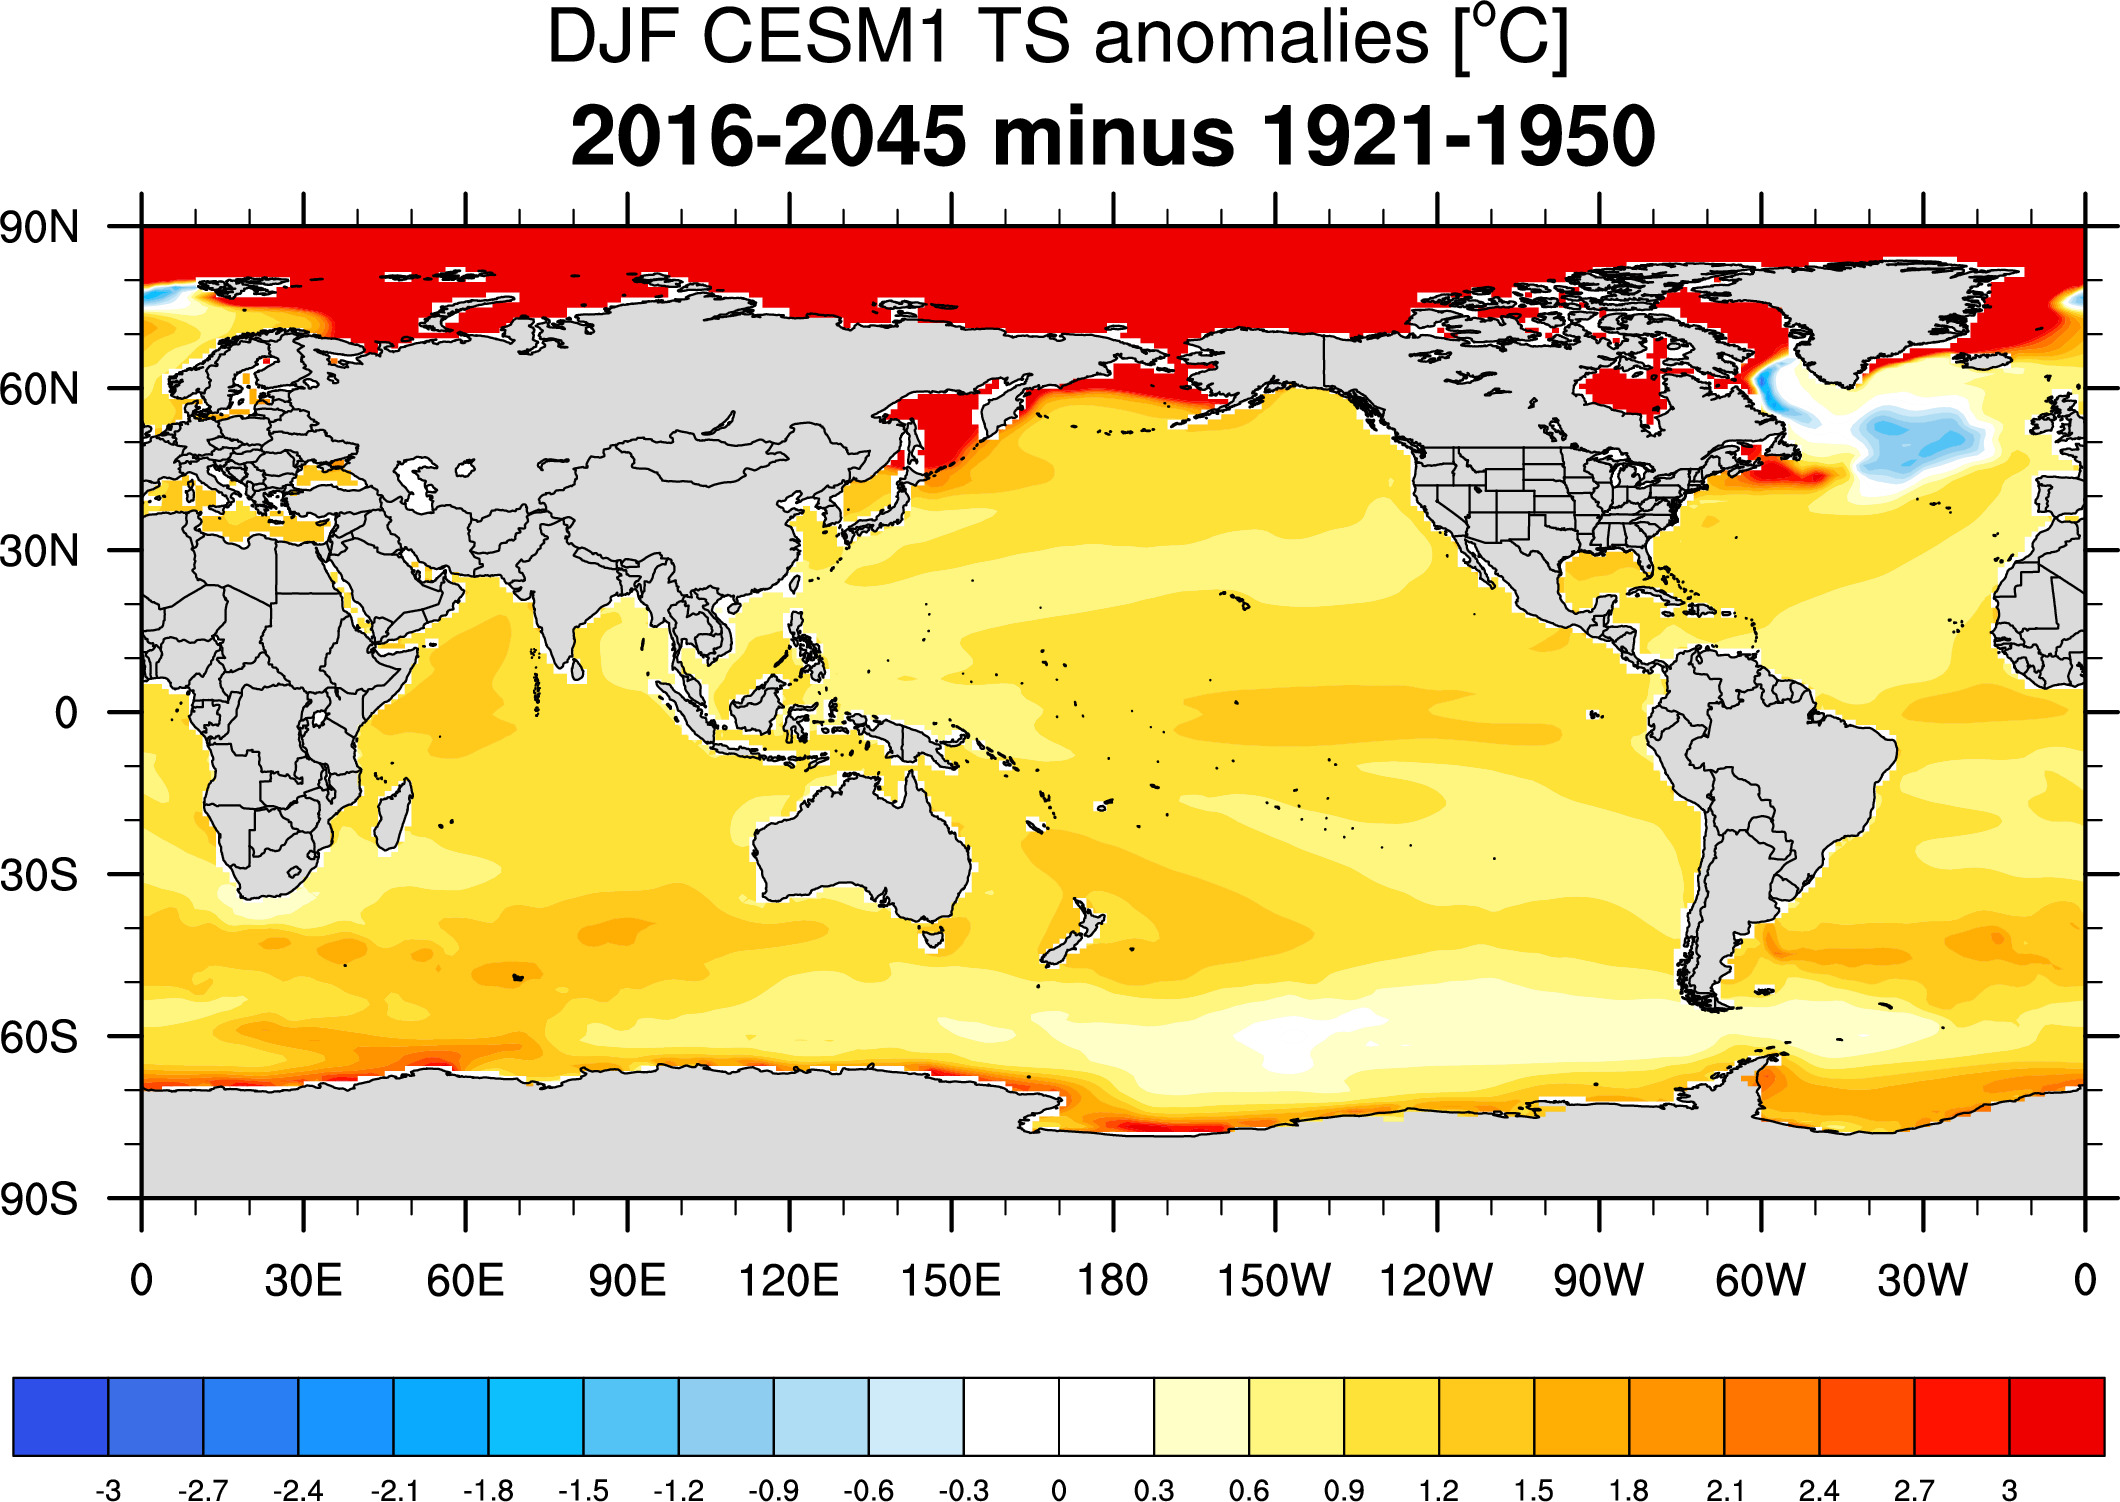
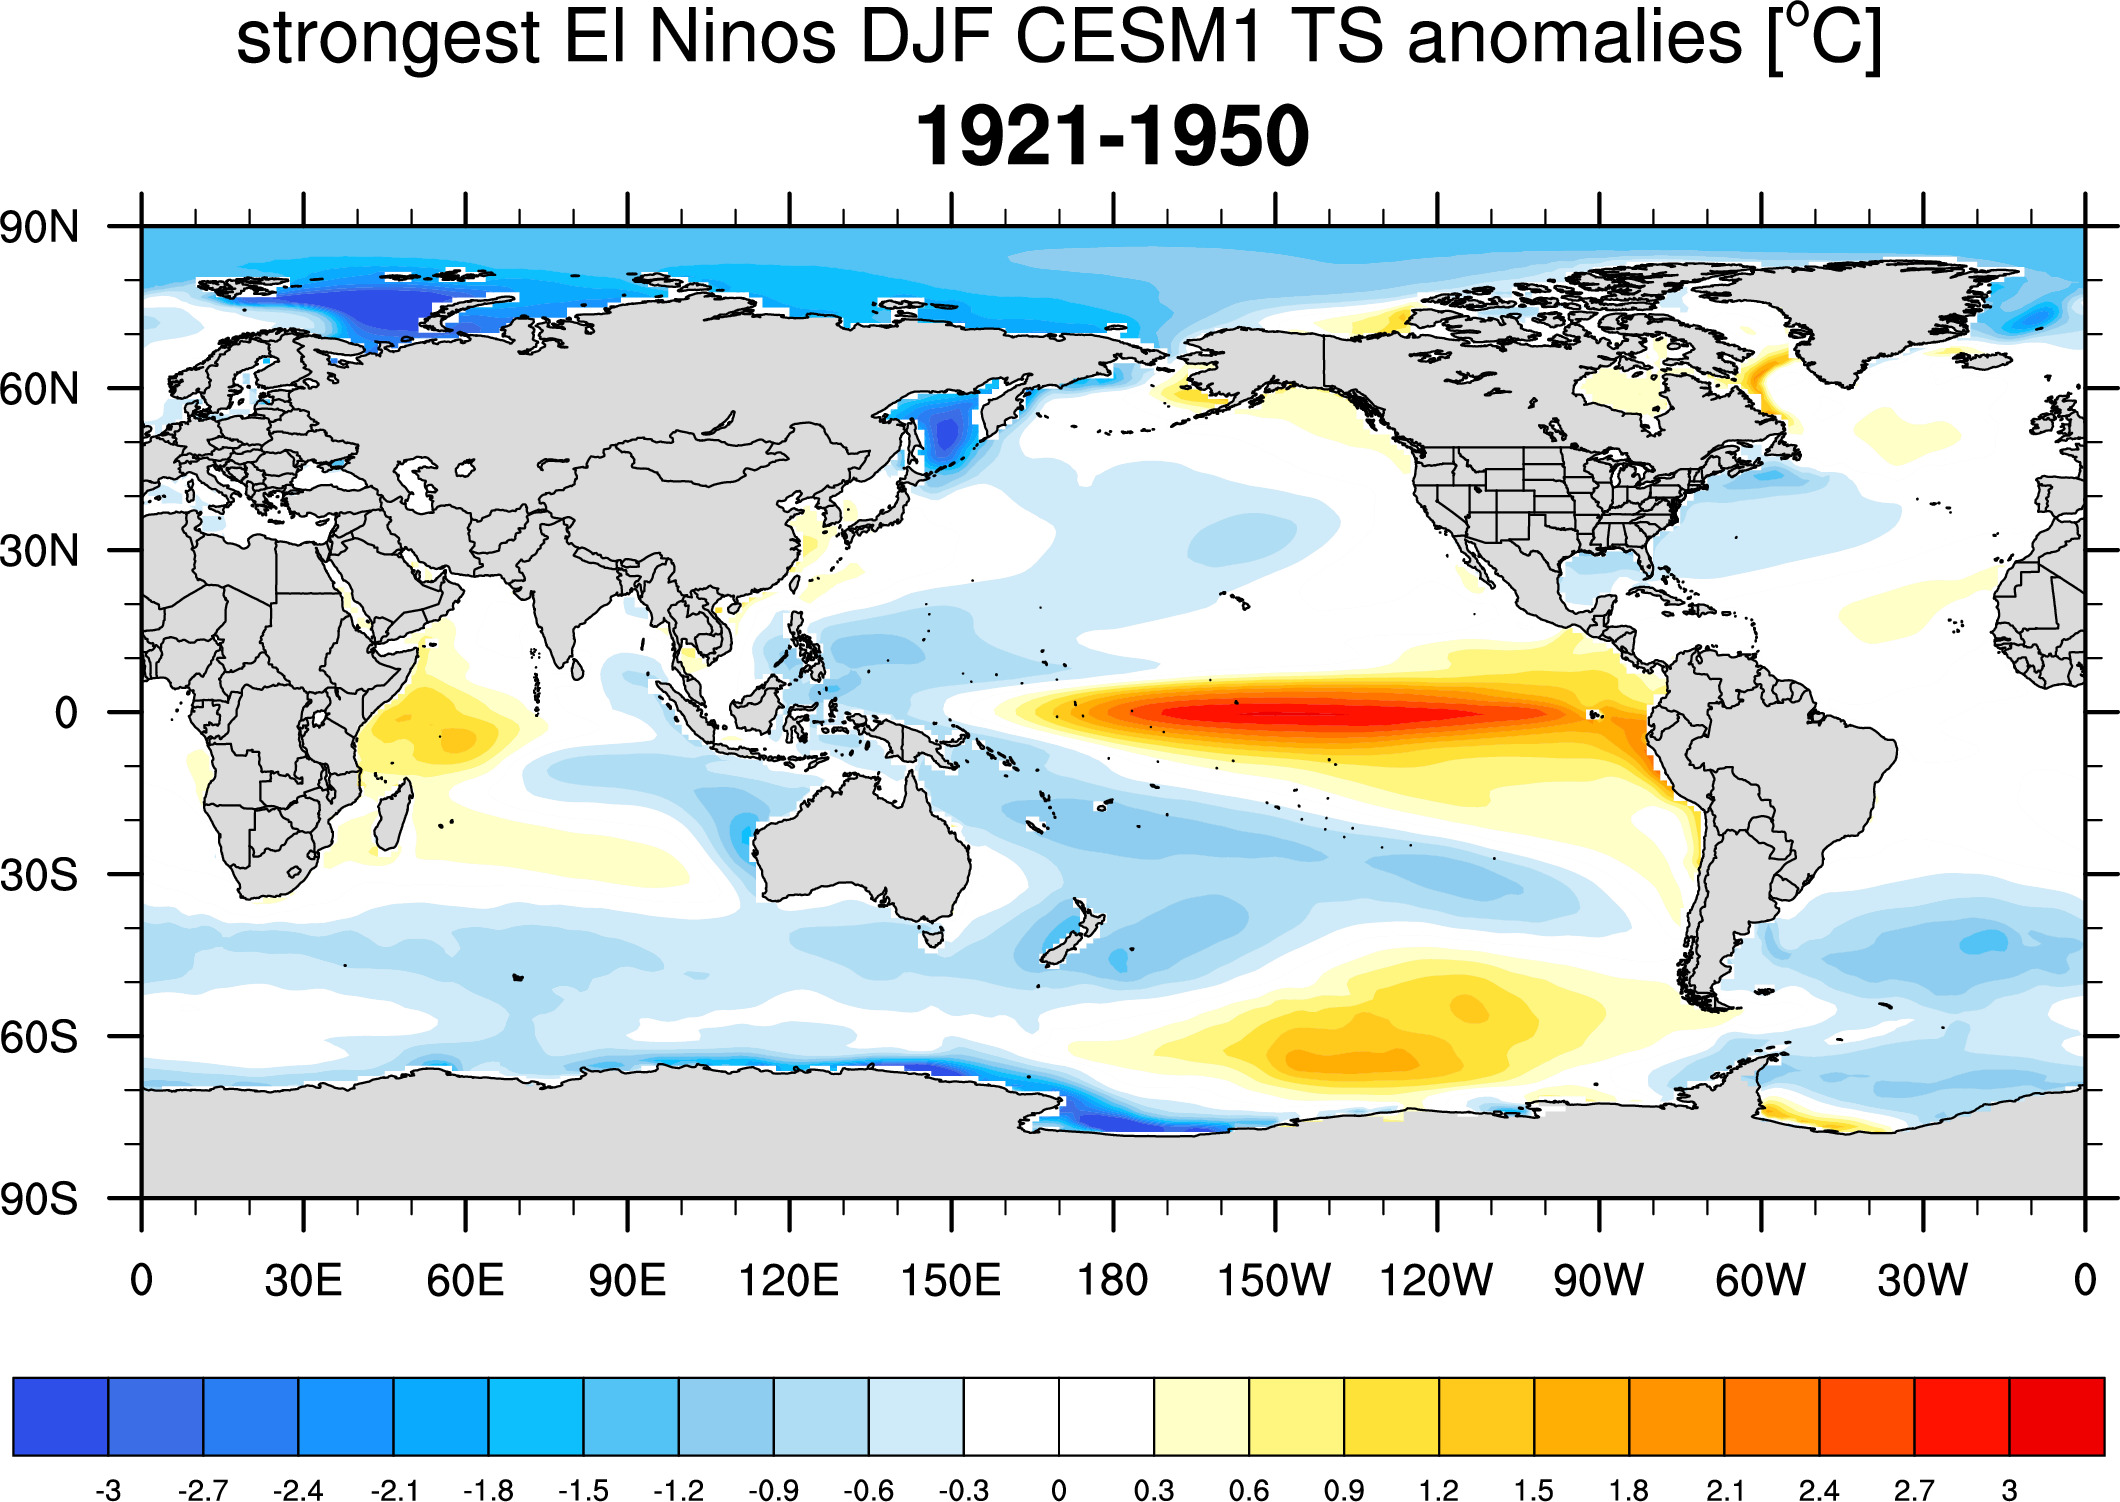
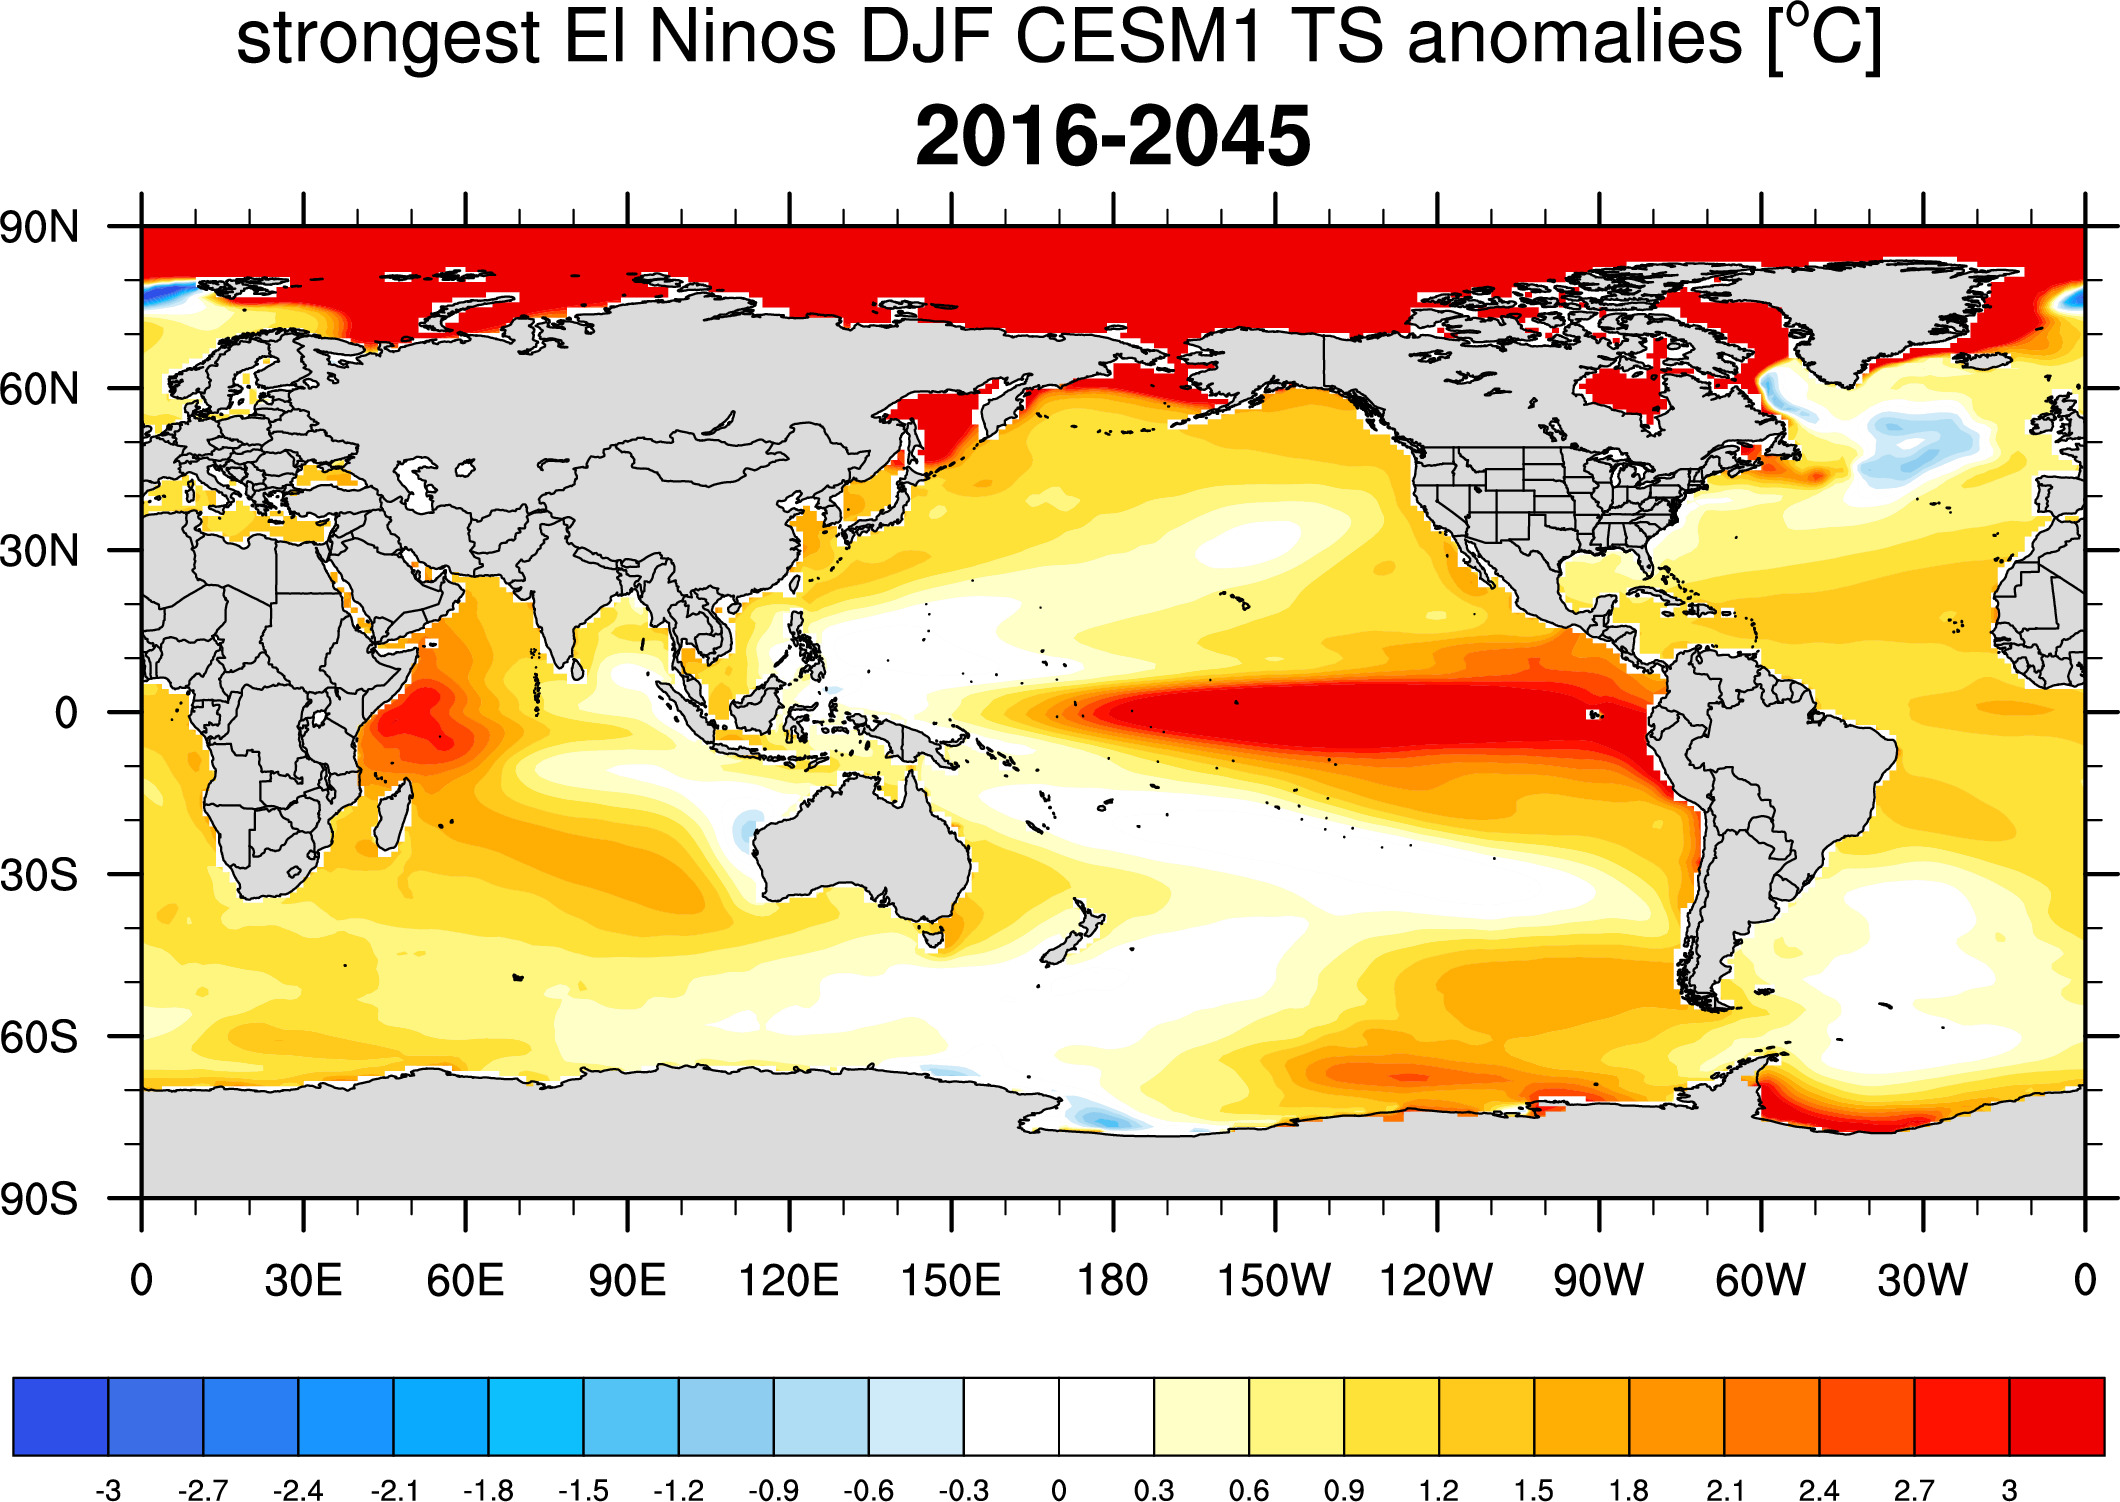
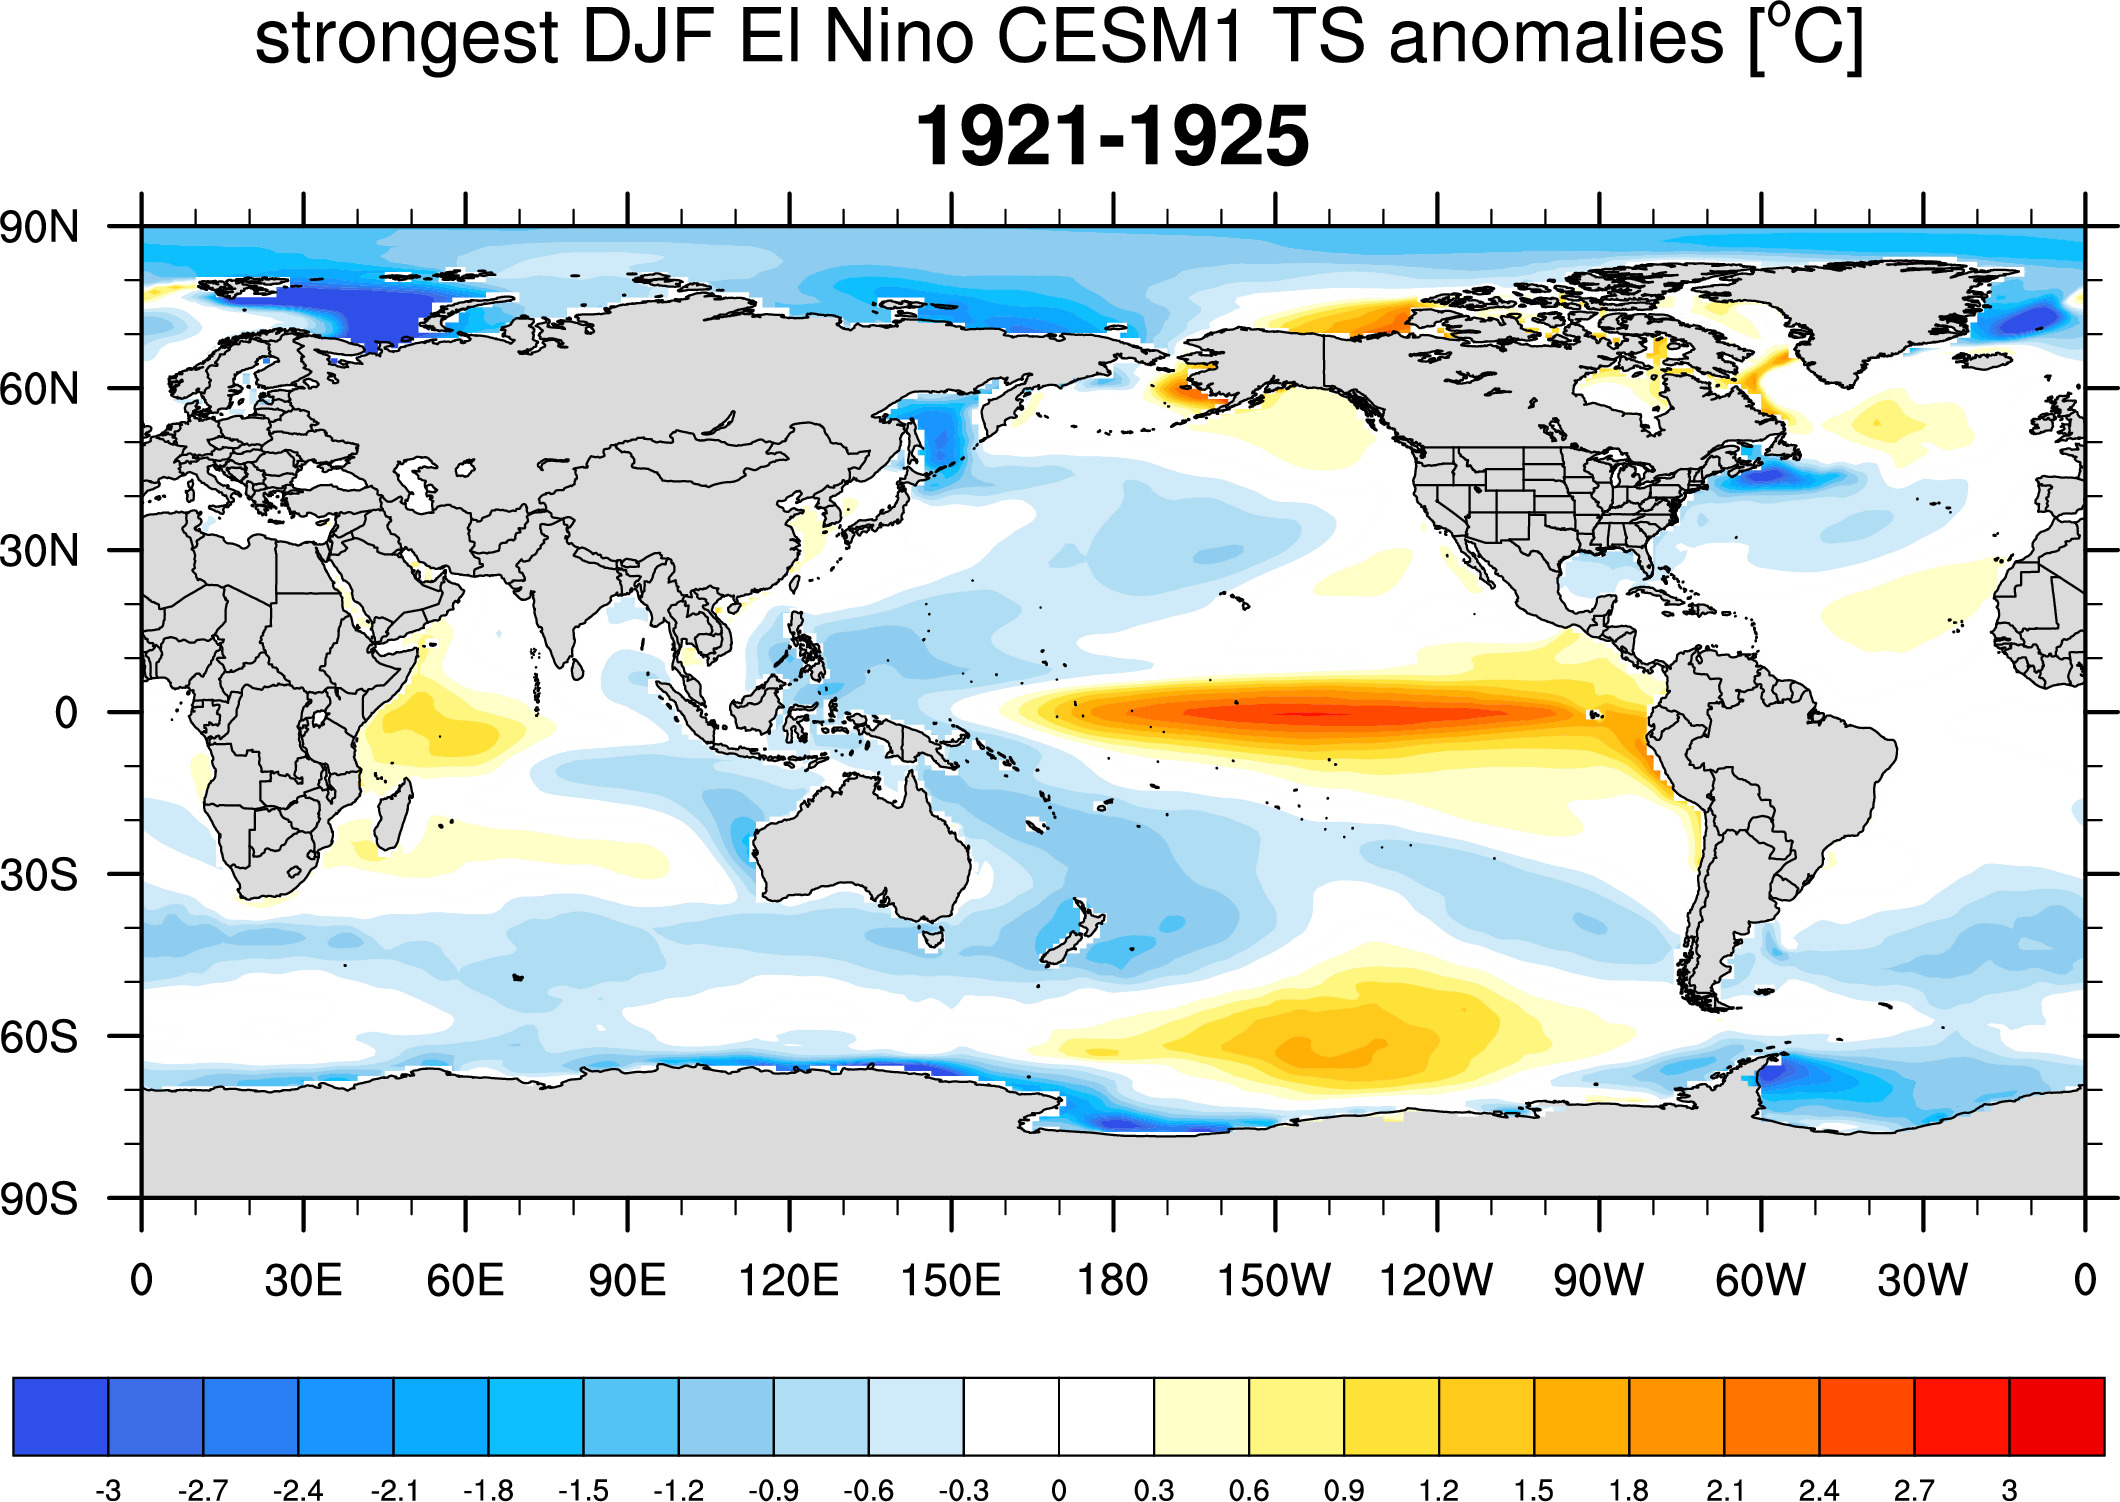
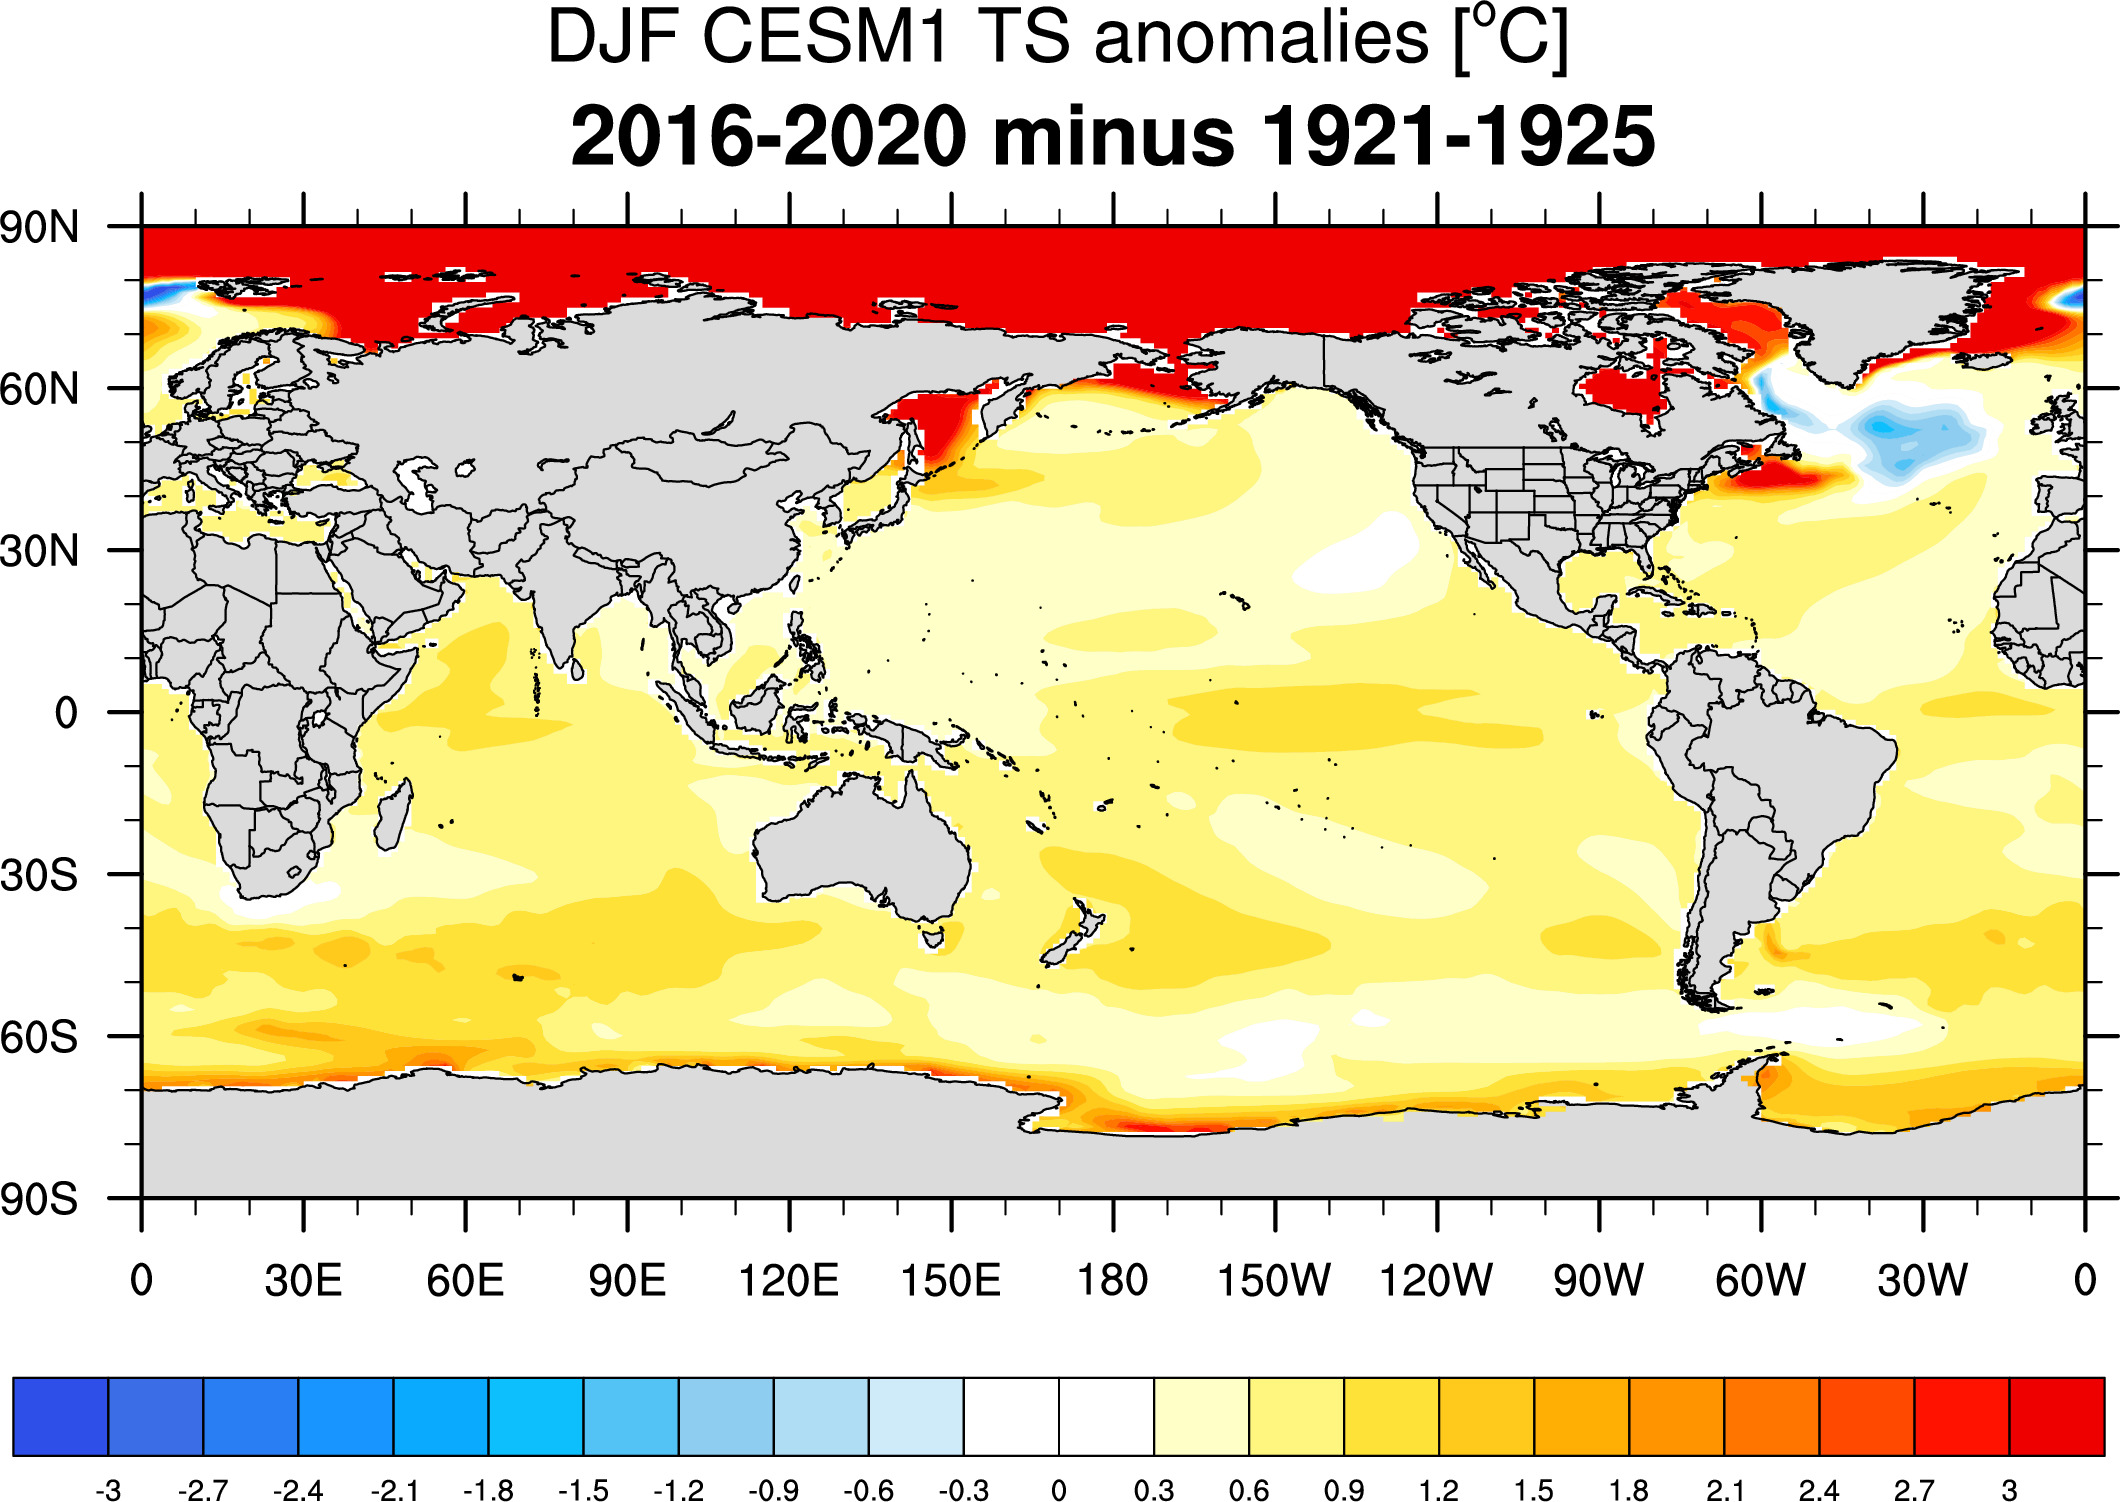
SST Anomaly Maps
All years:
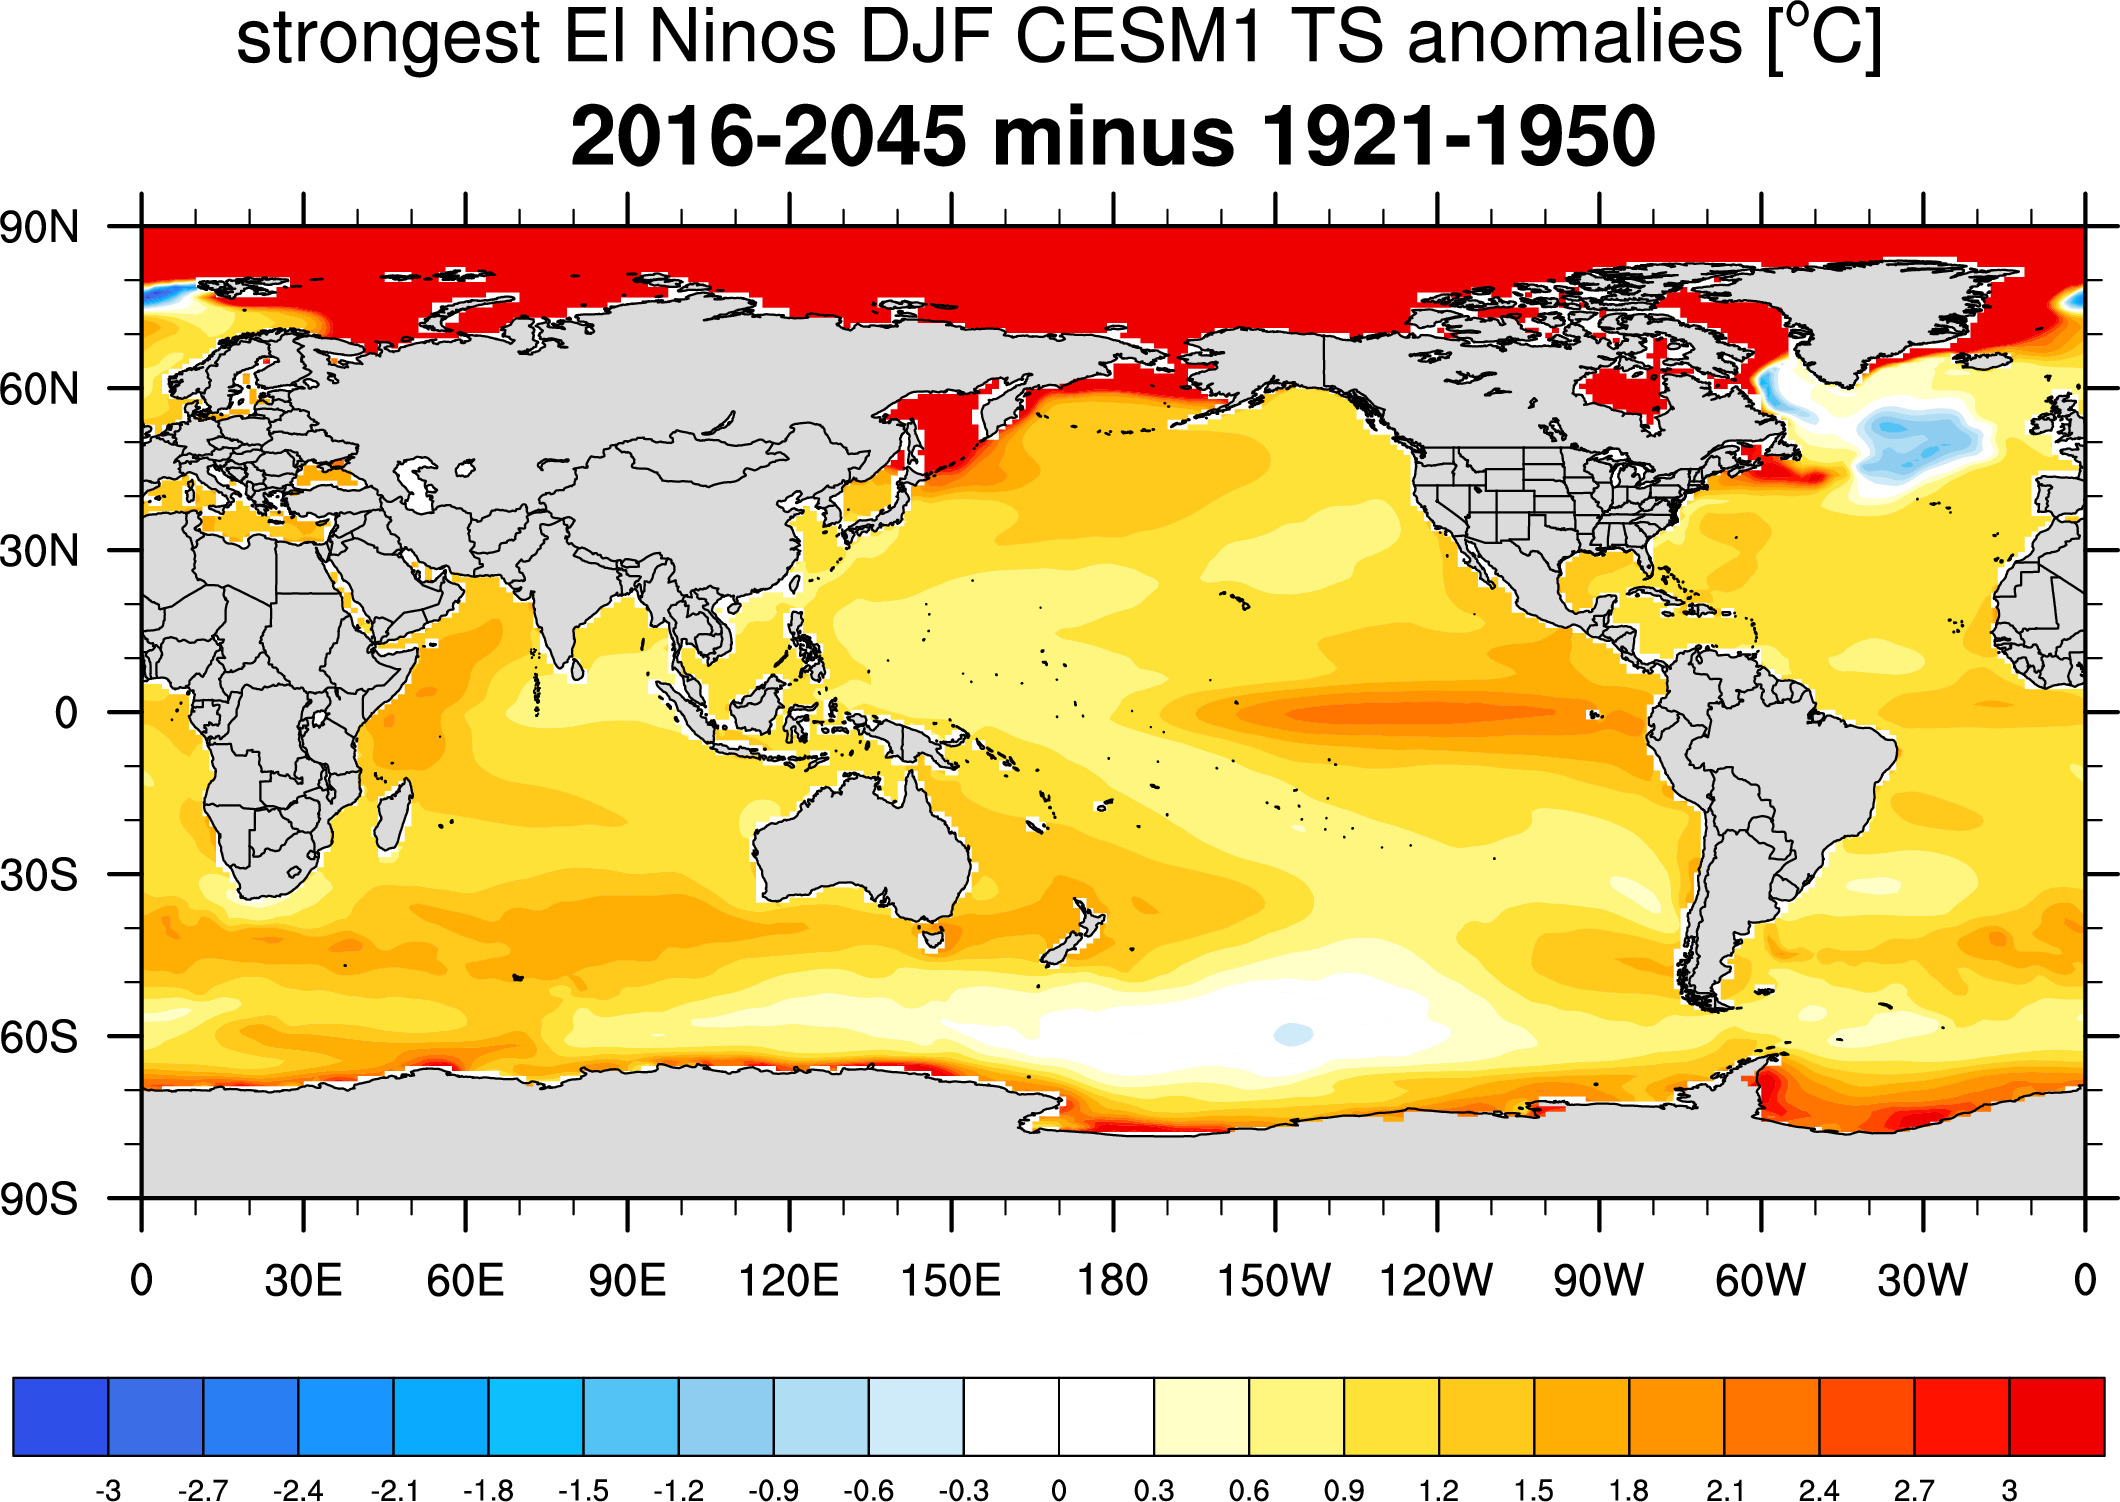
Strongest El Ninos:
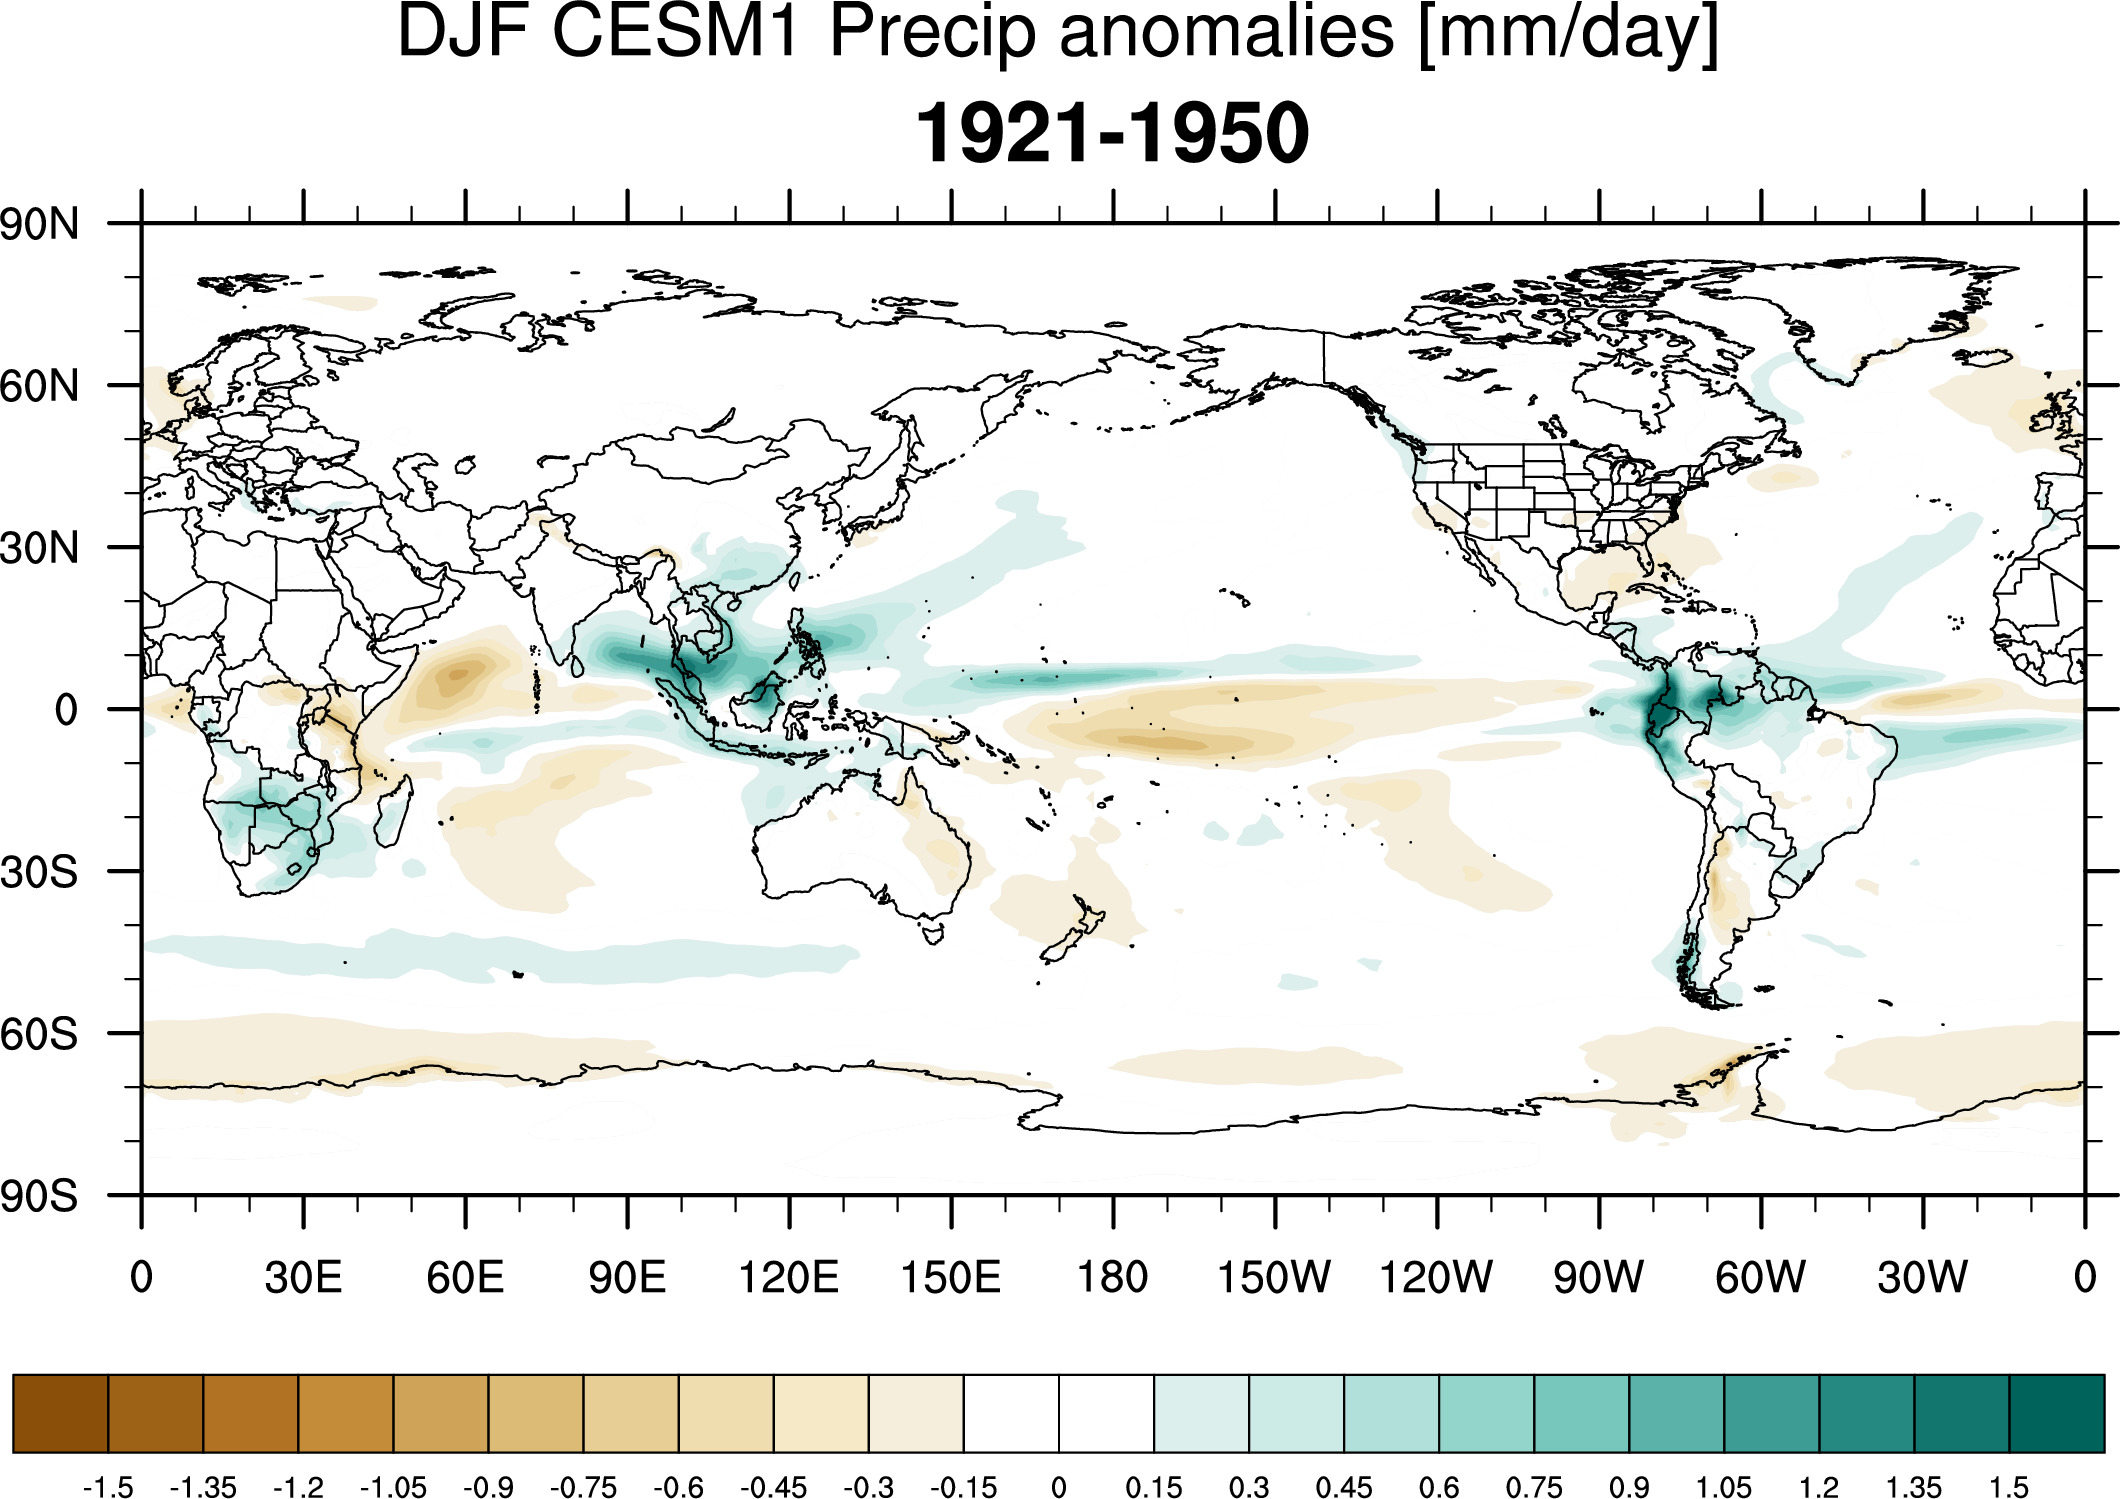
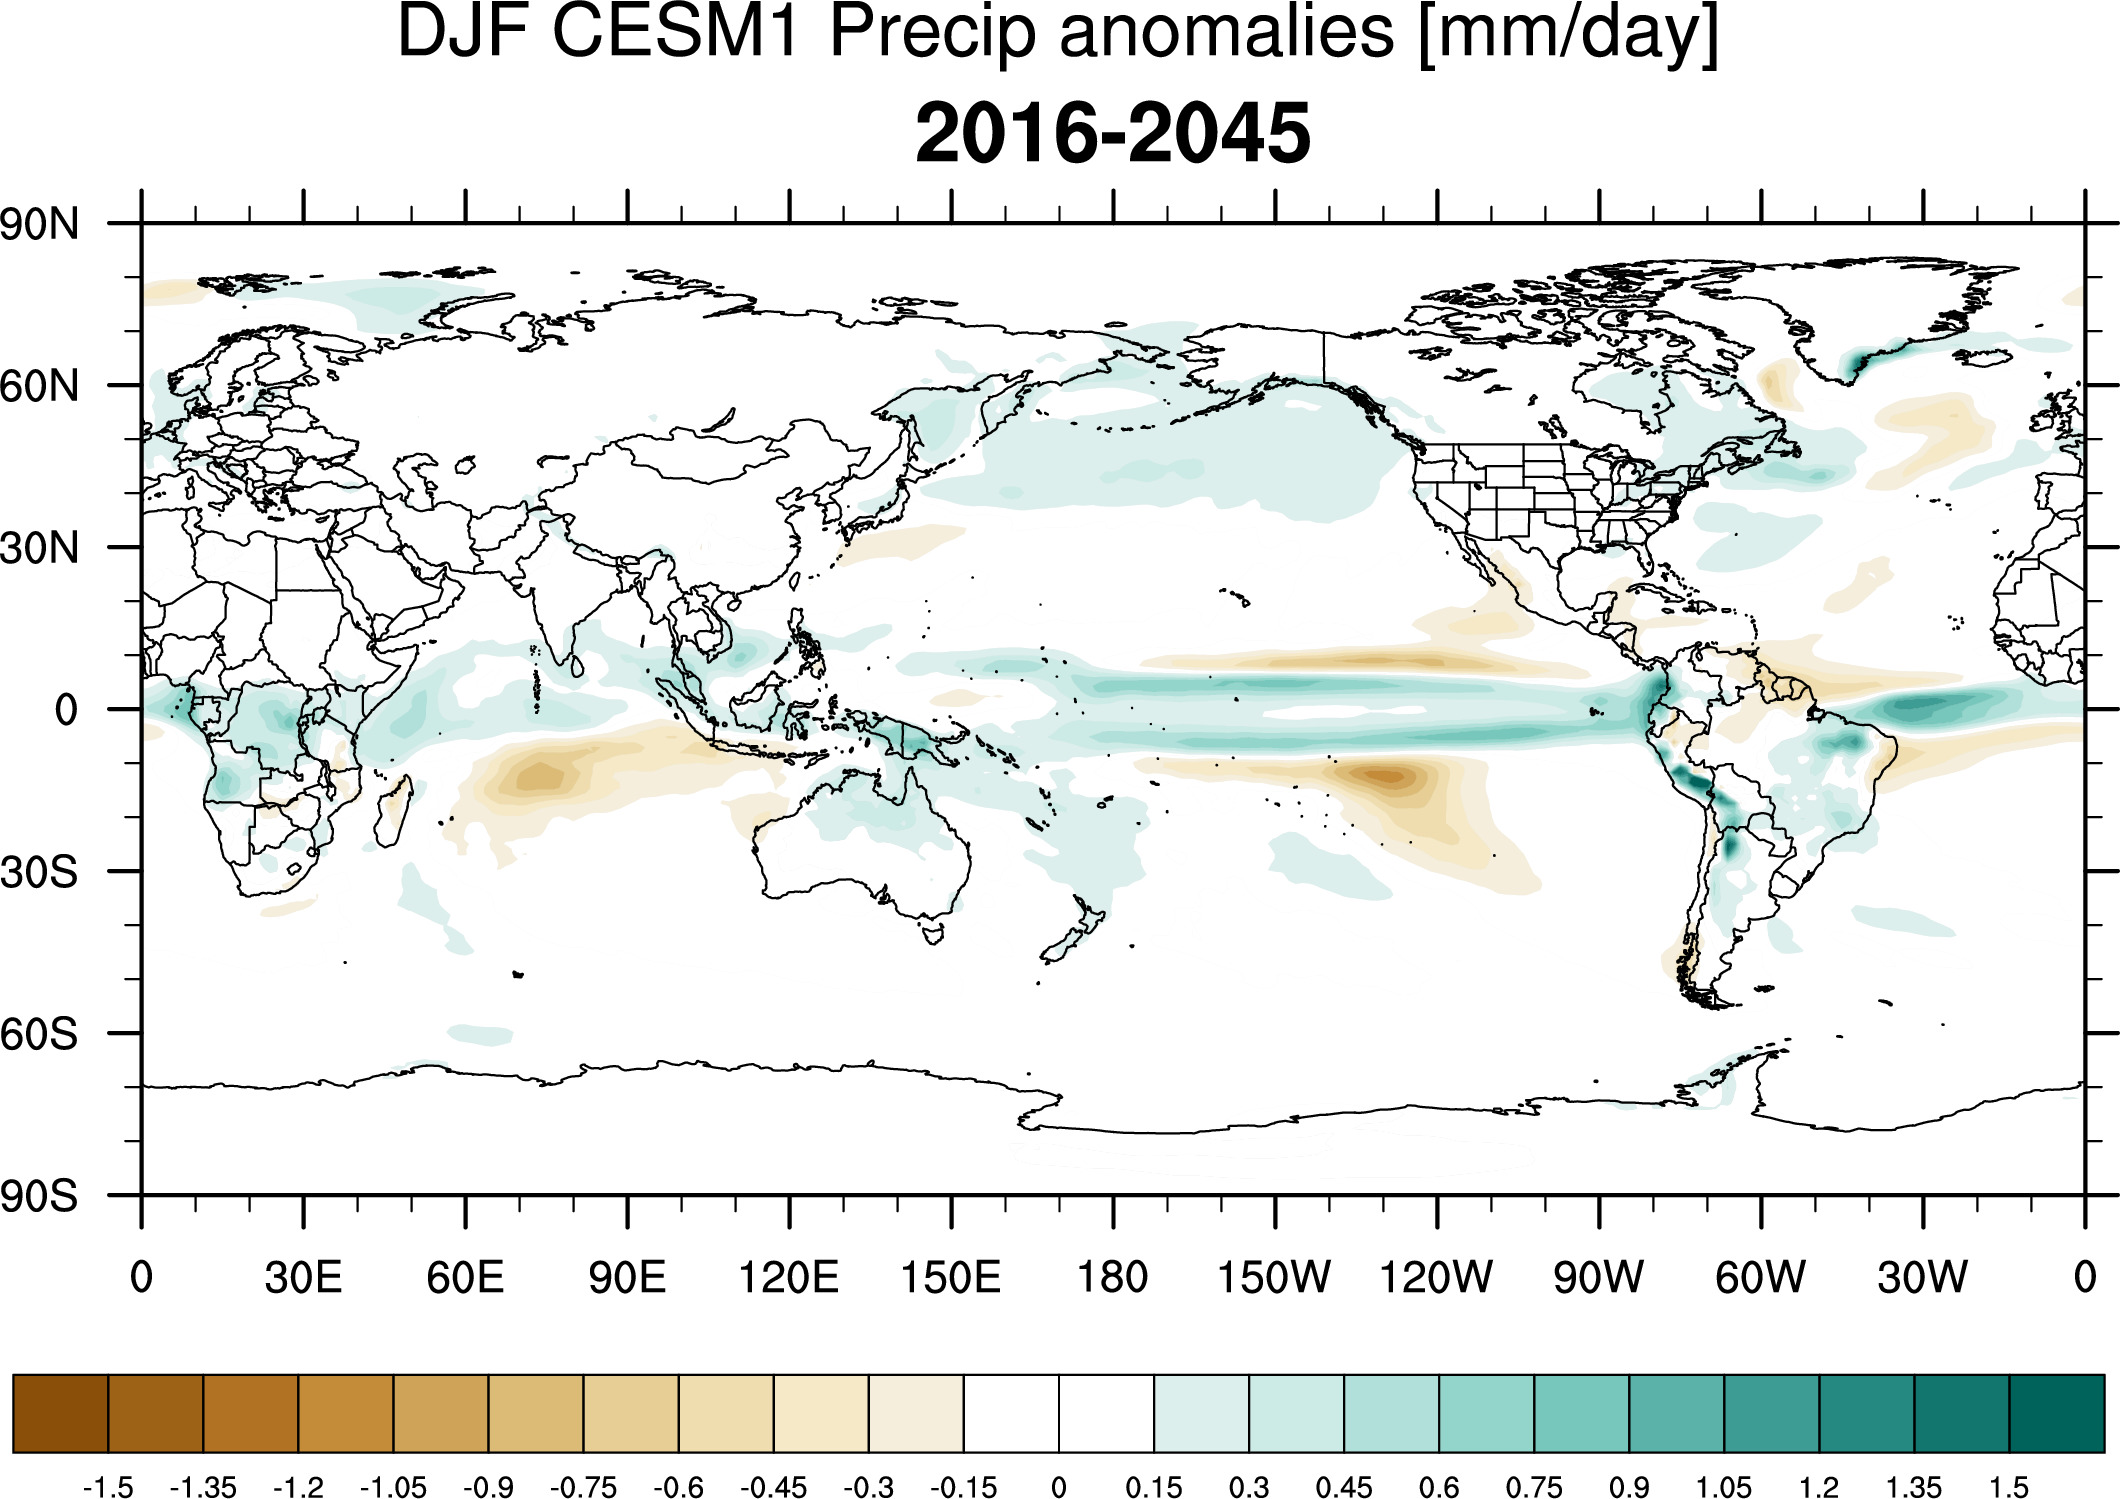
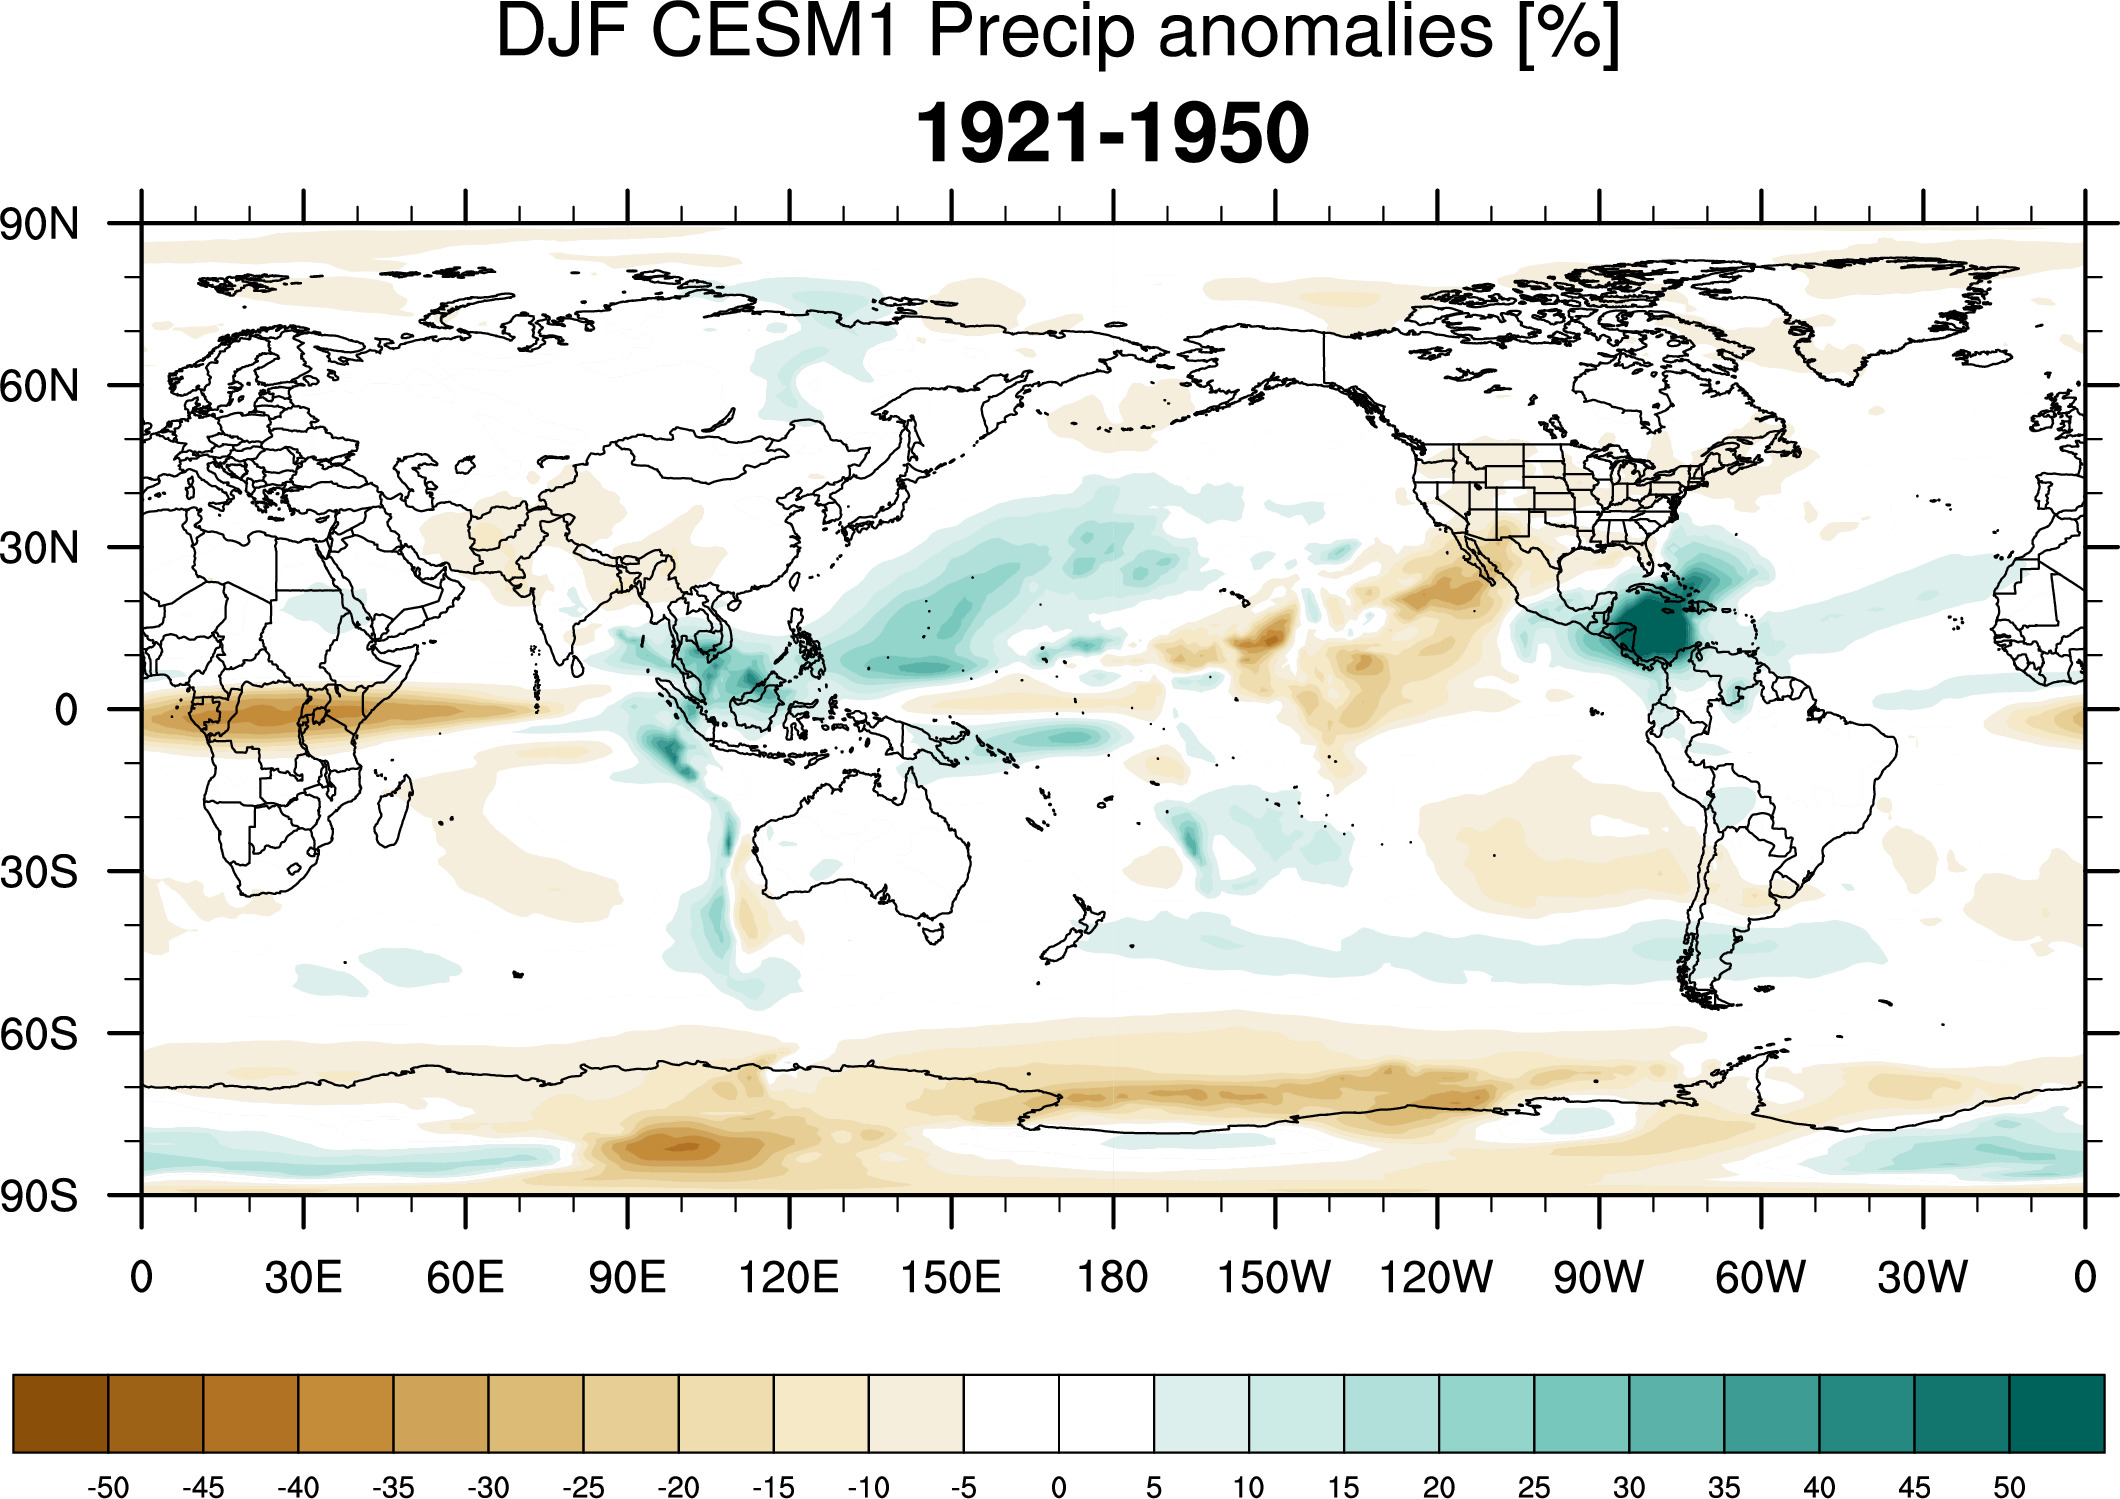
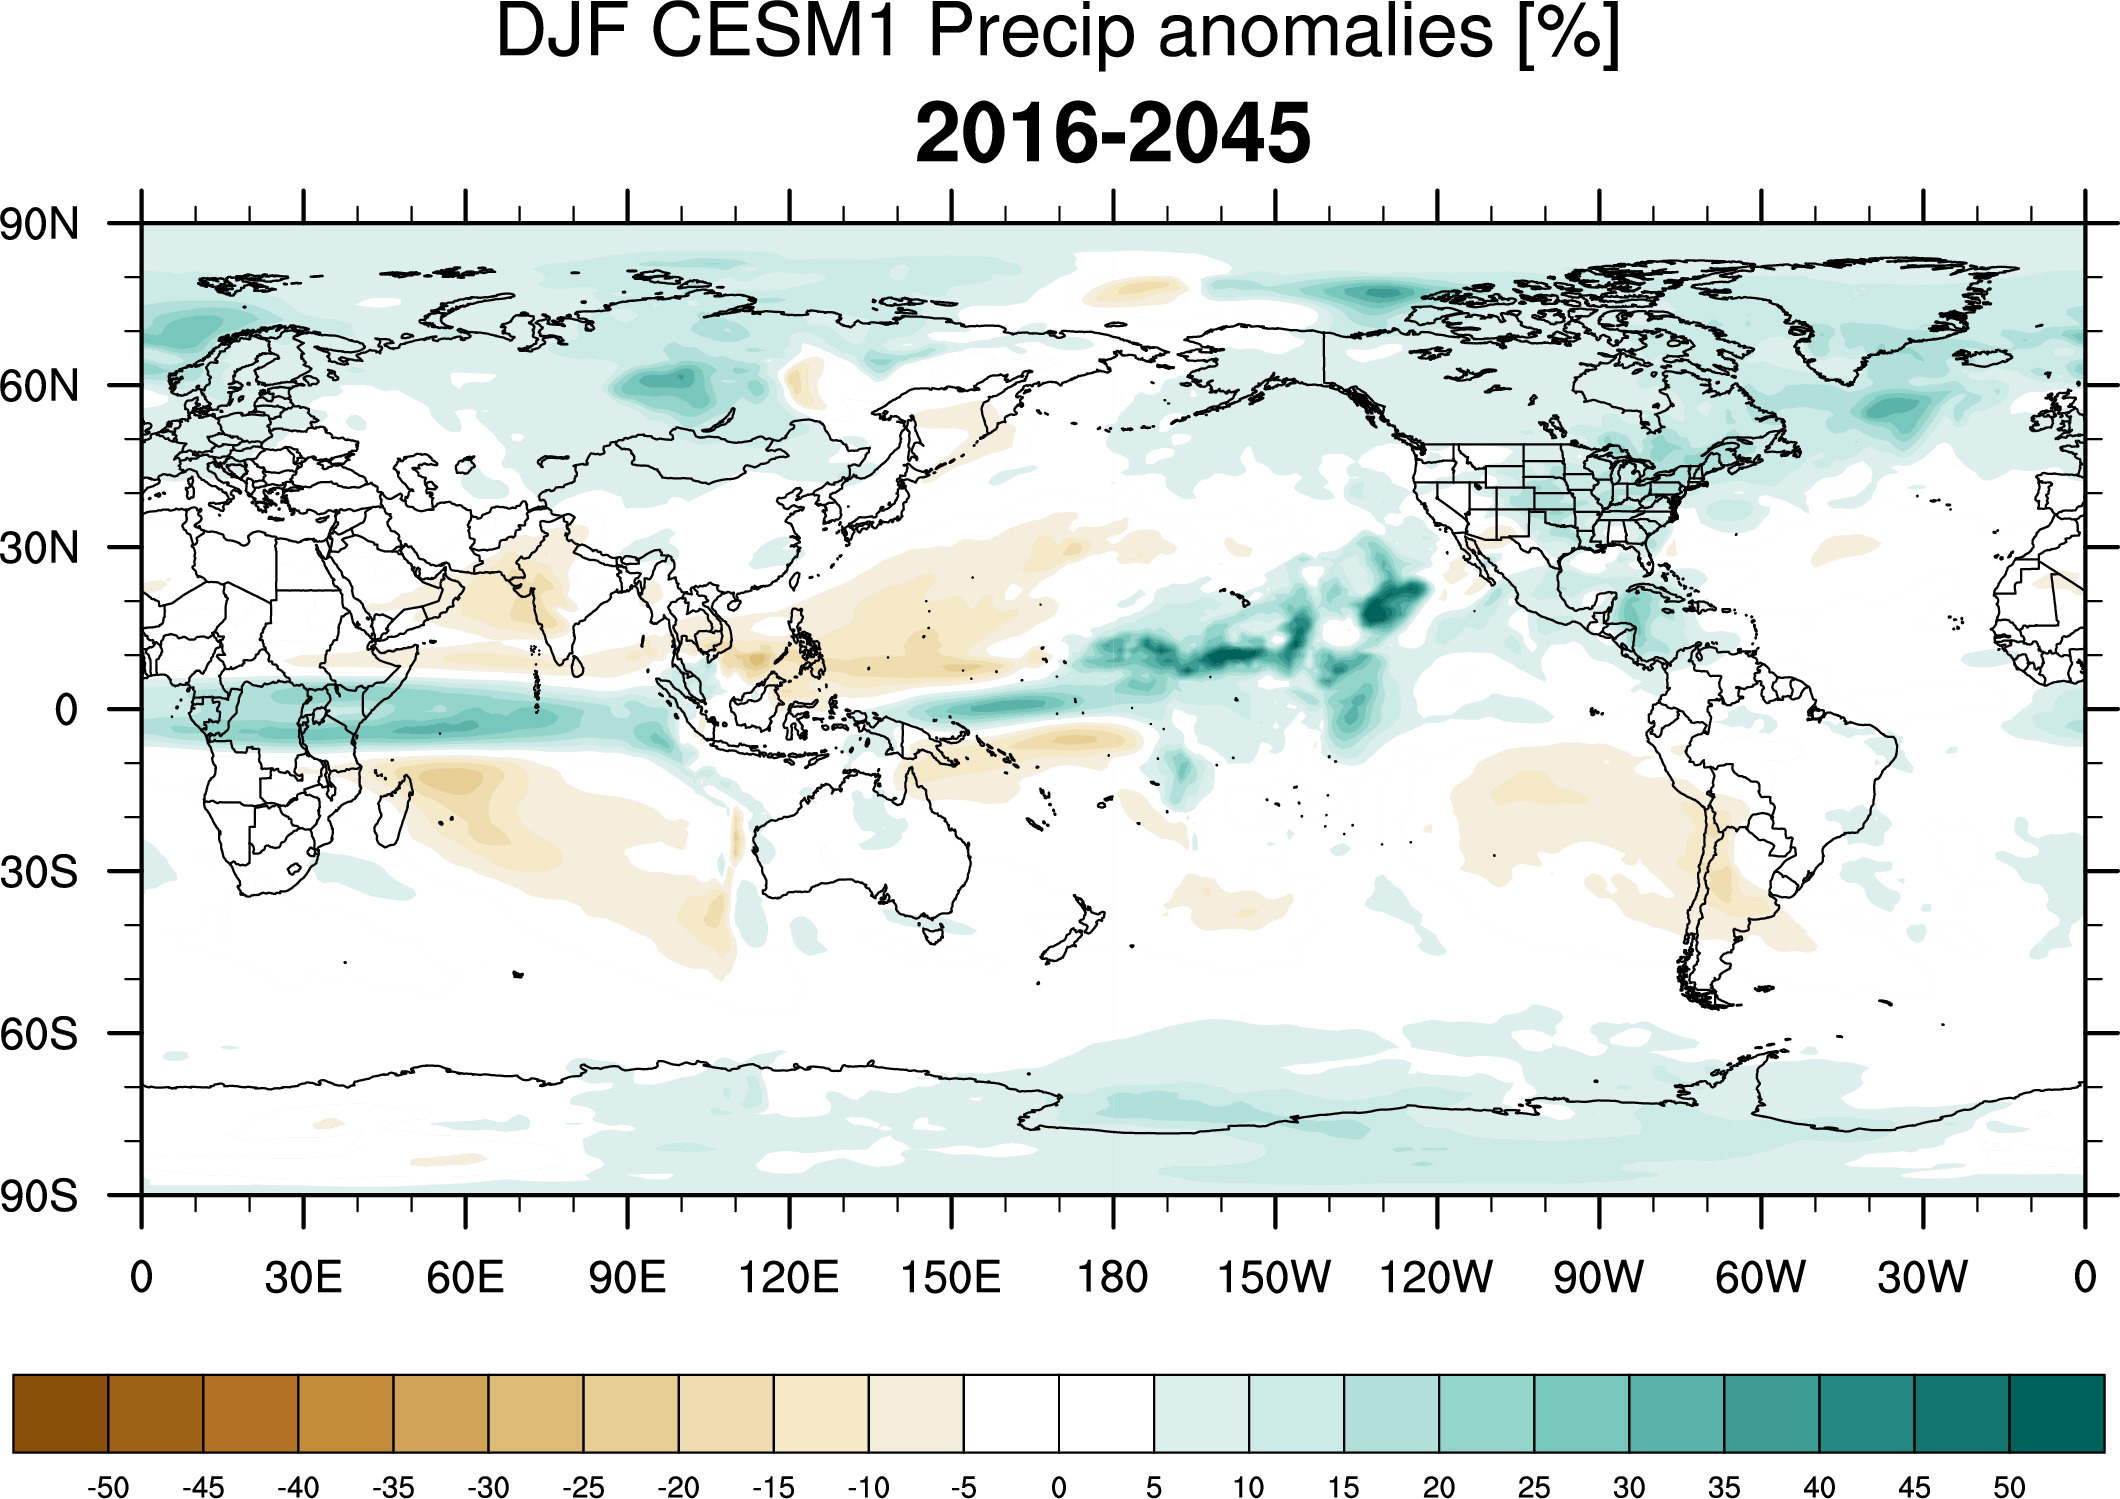
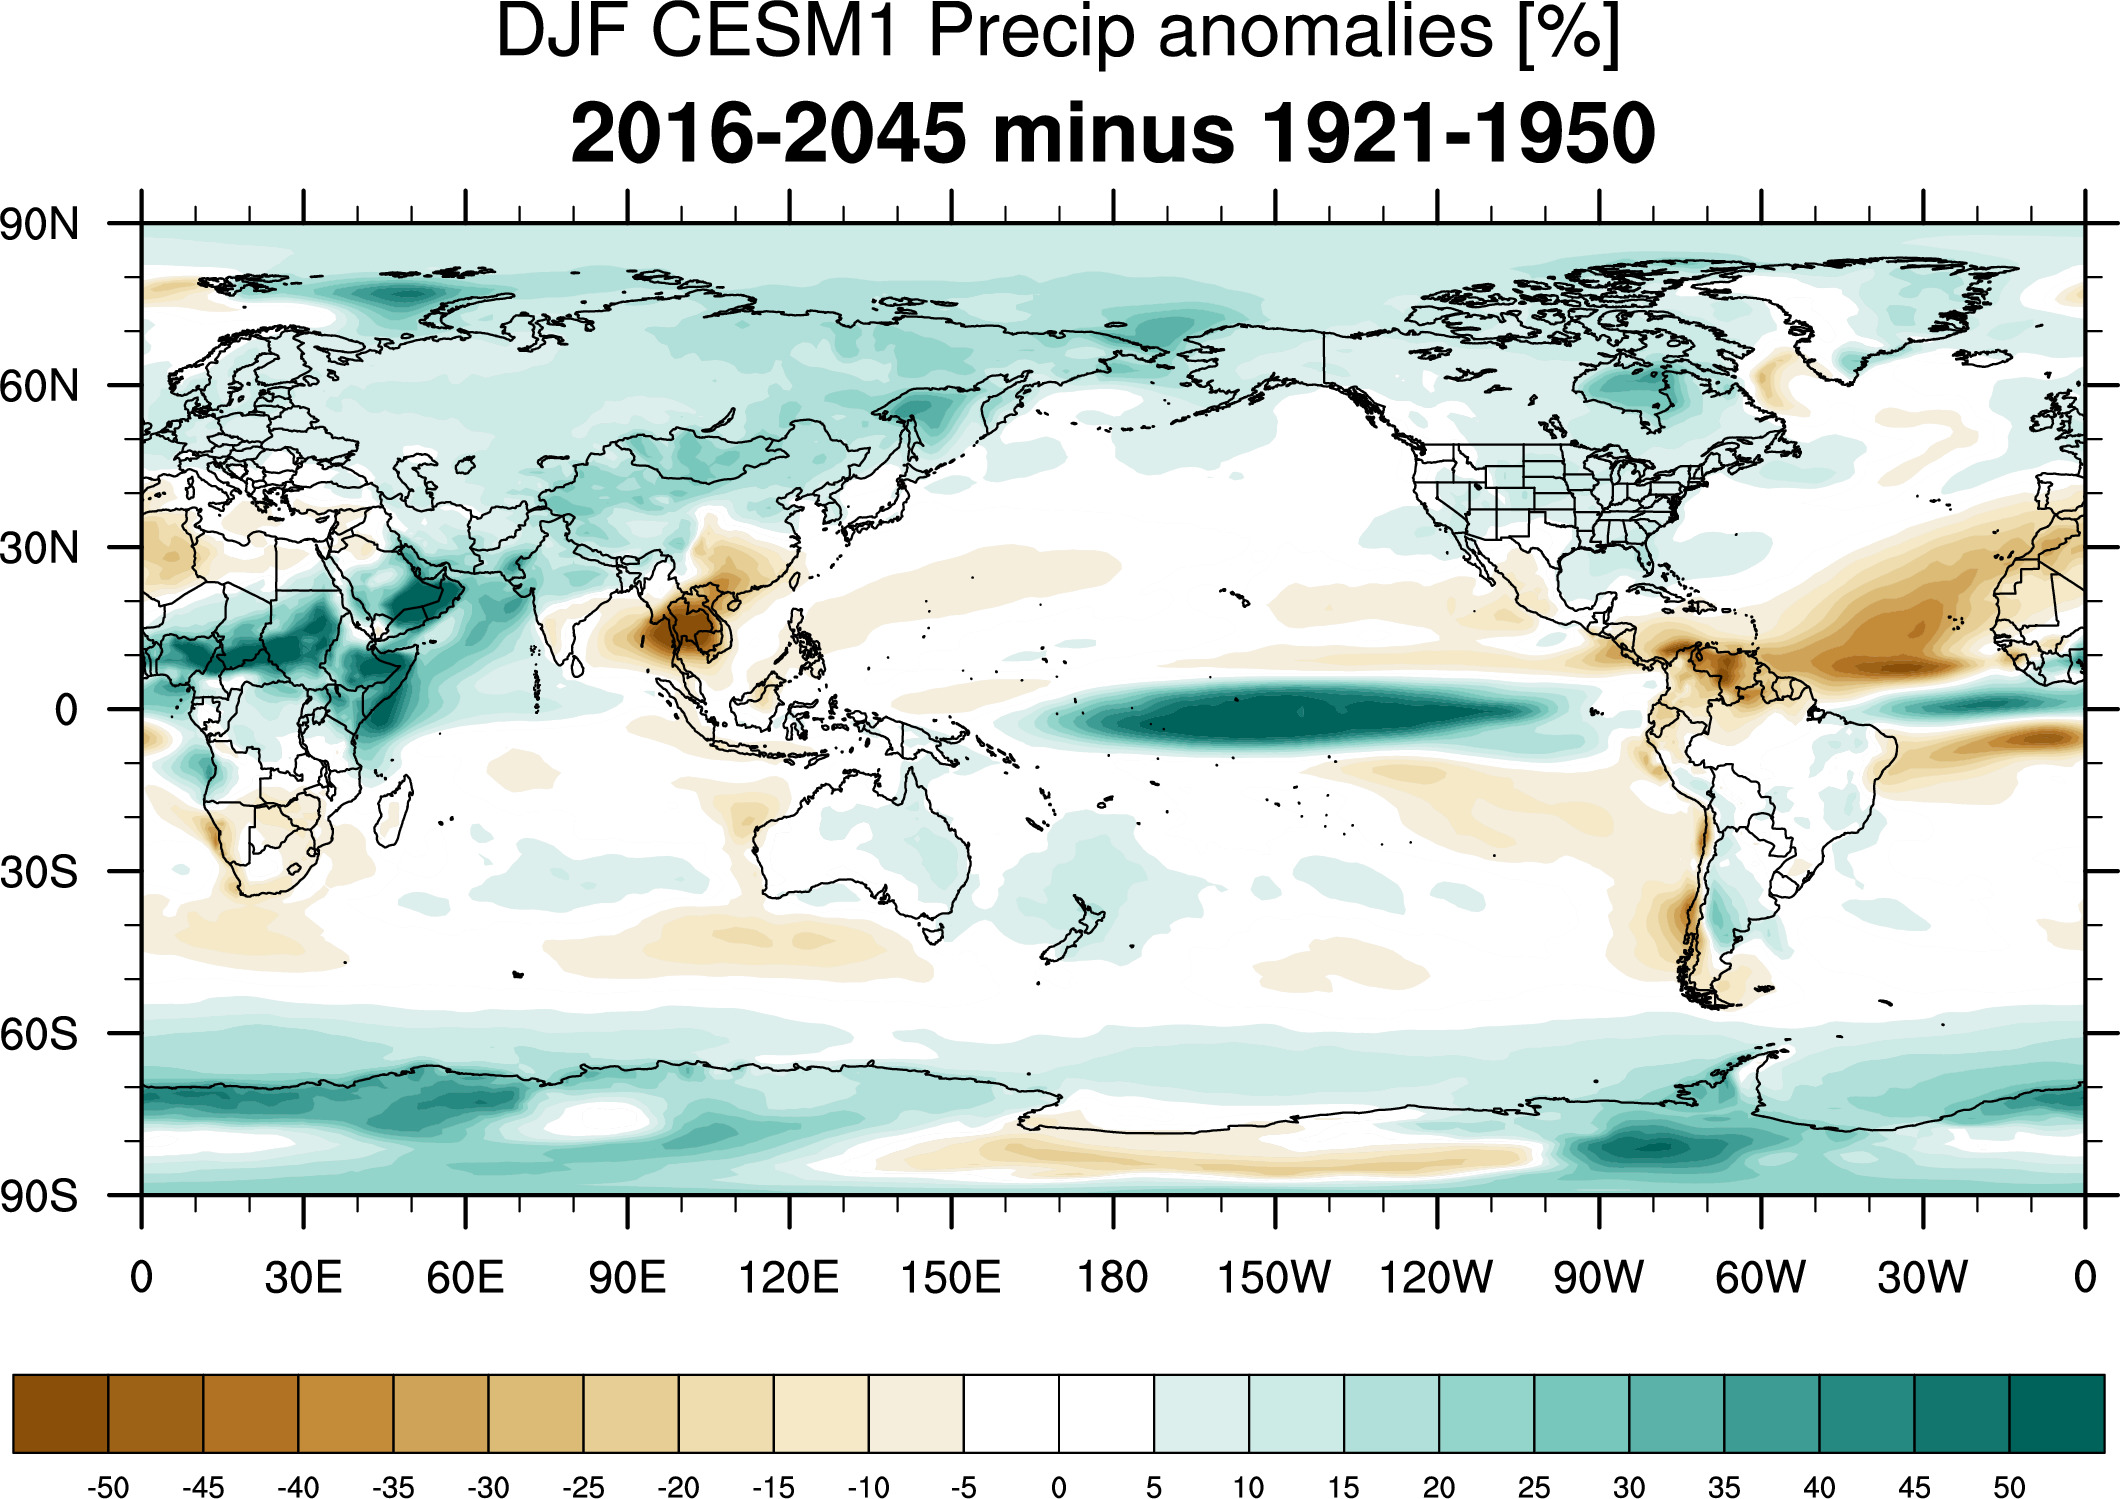
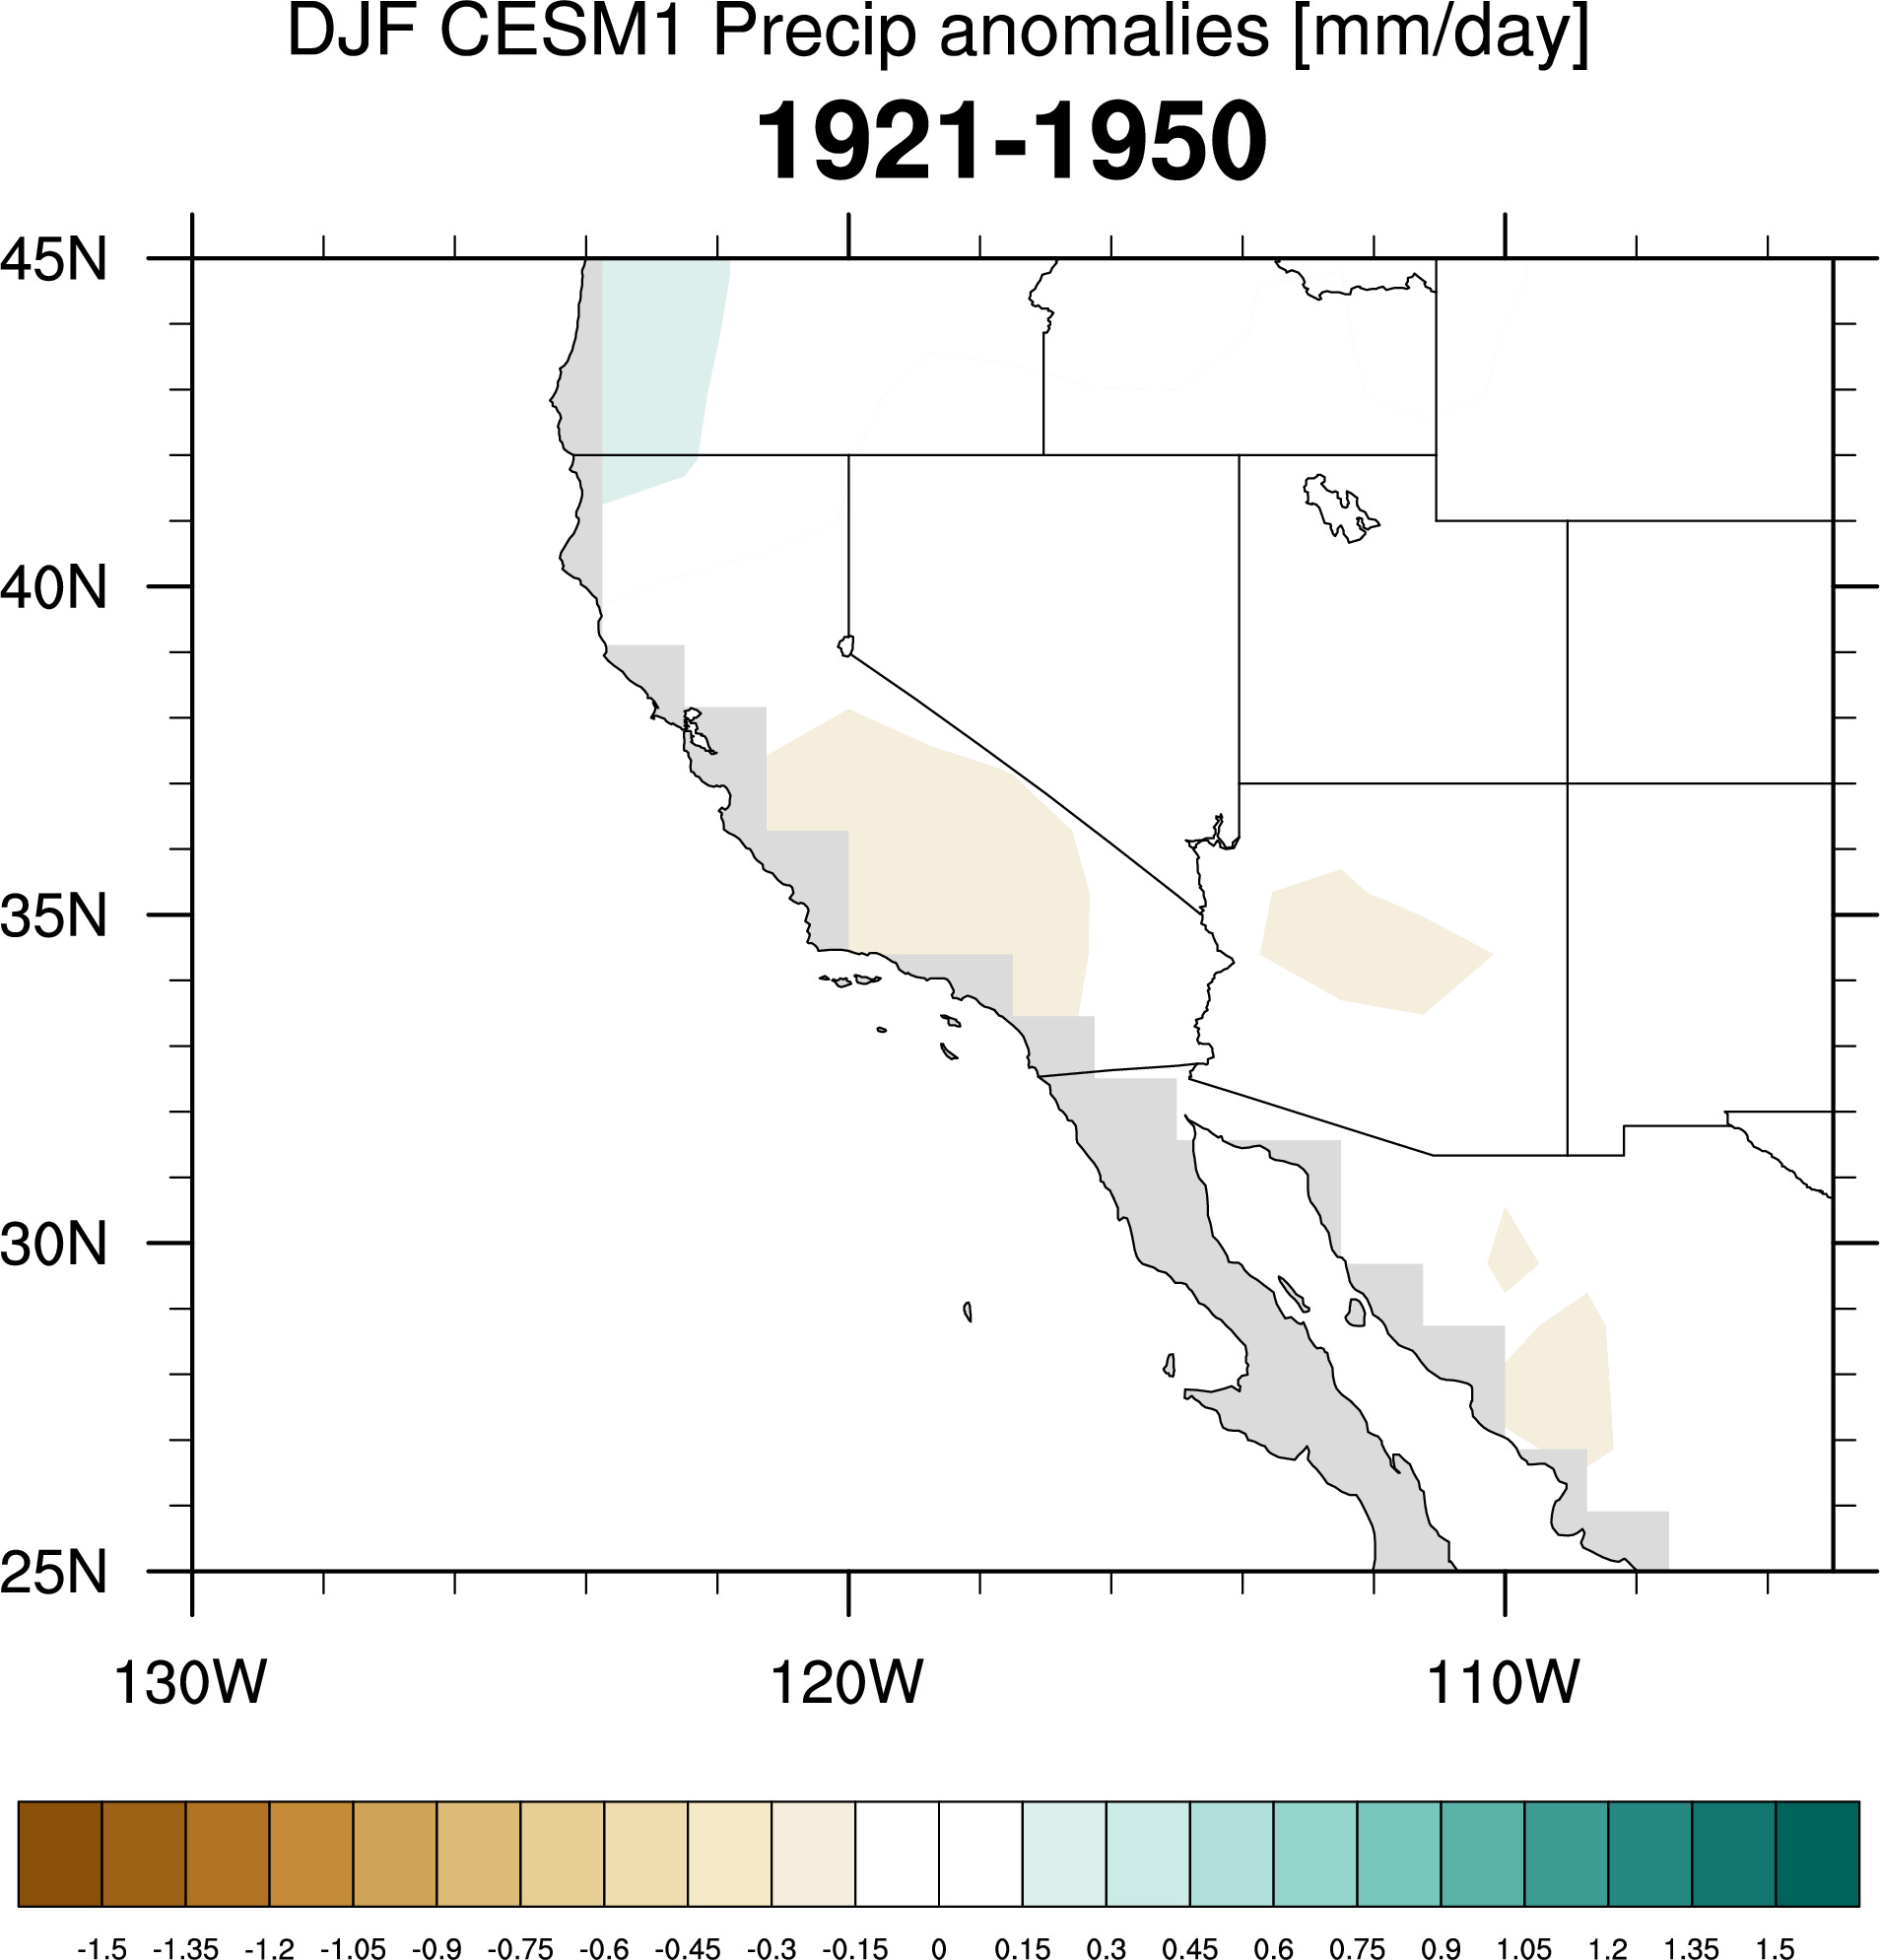
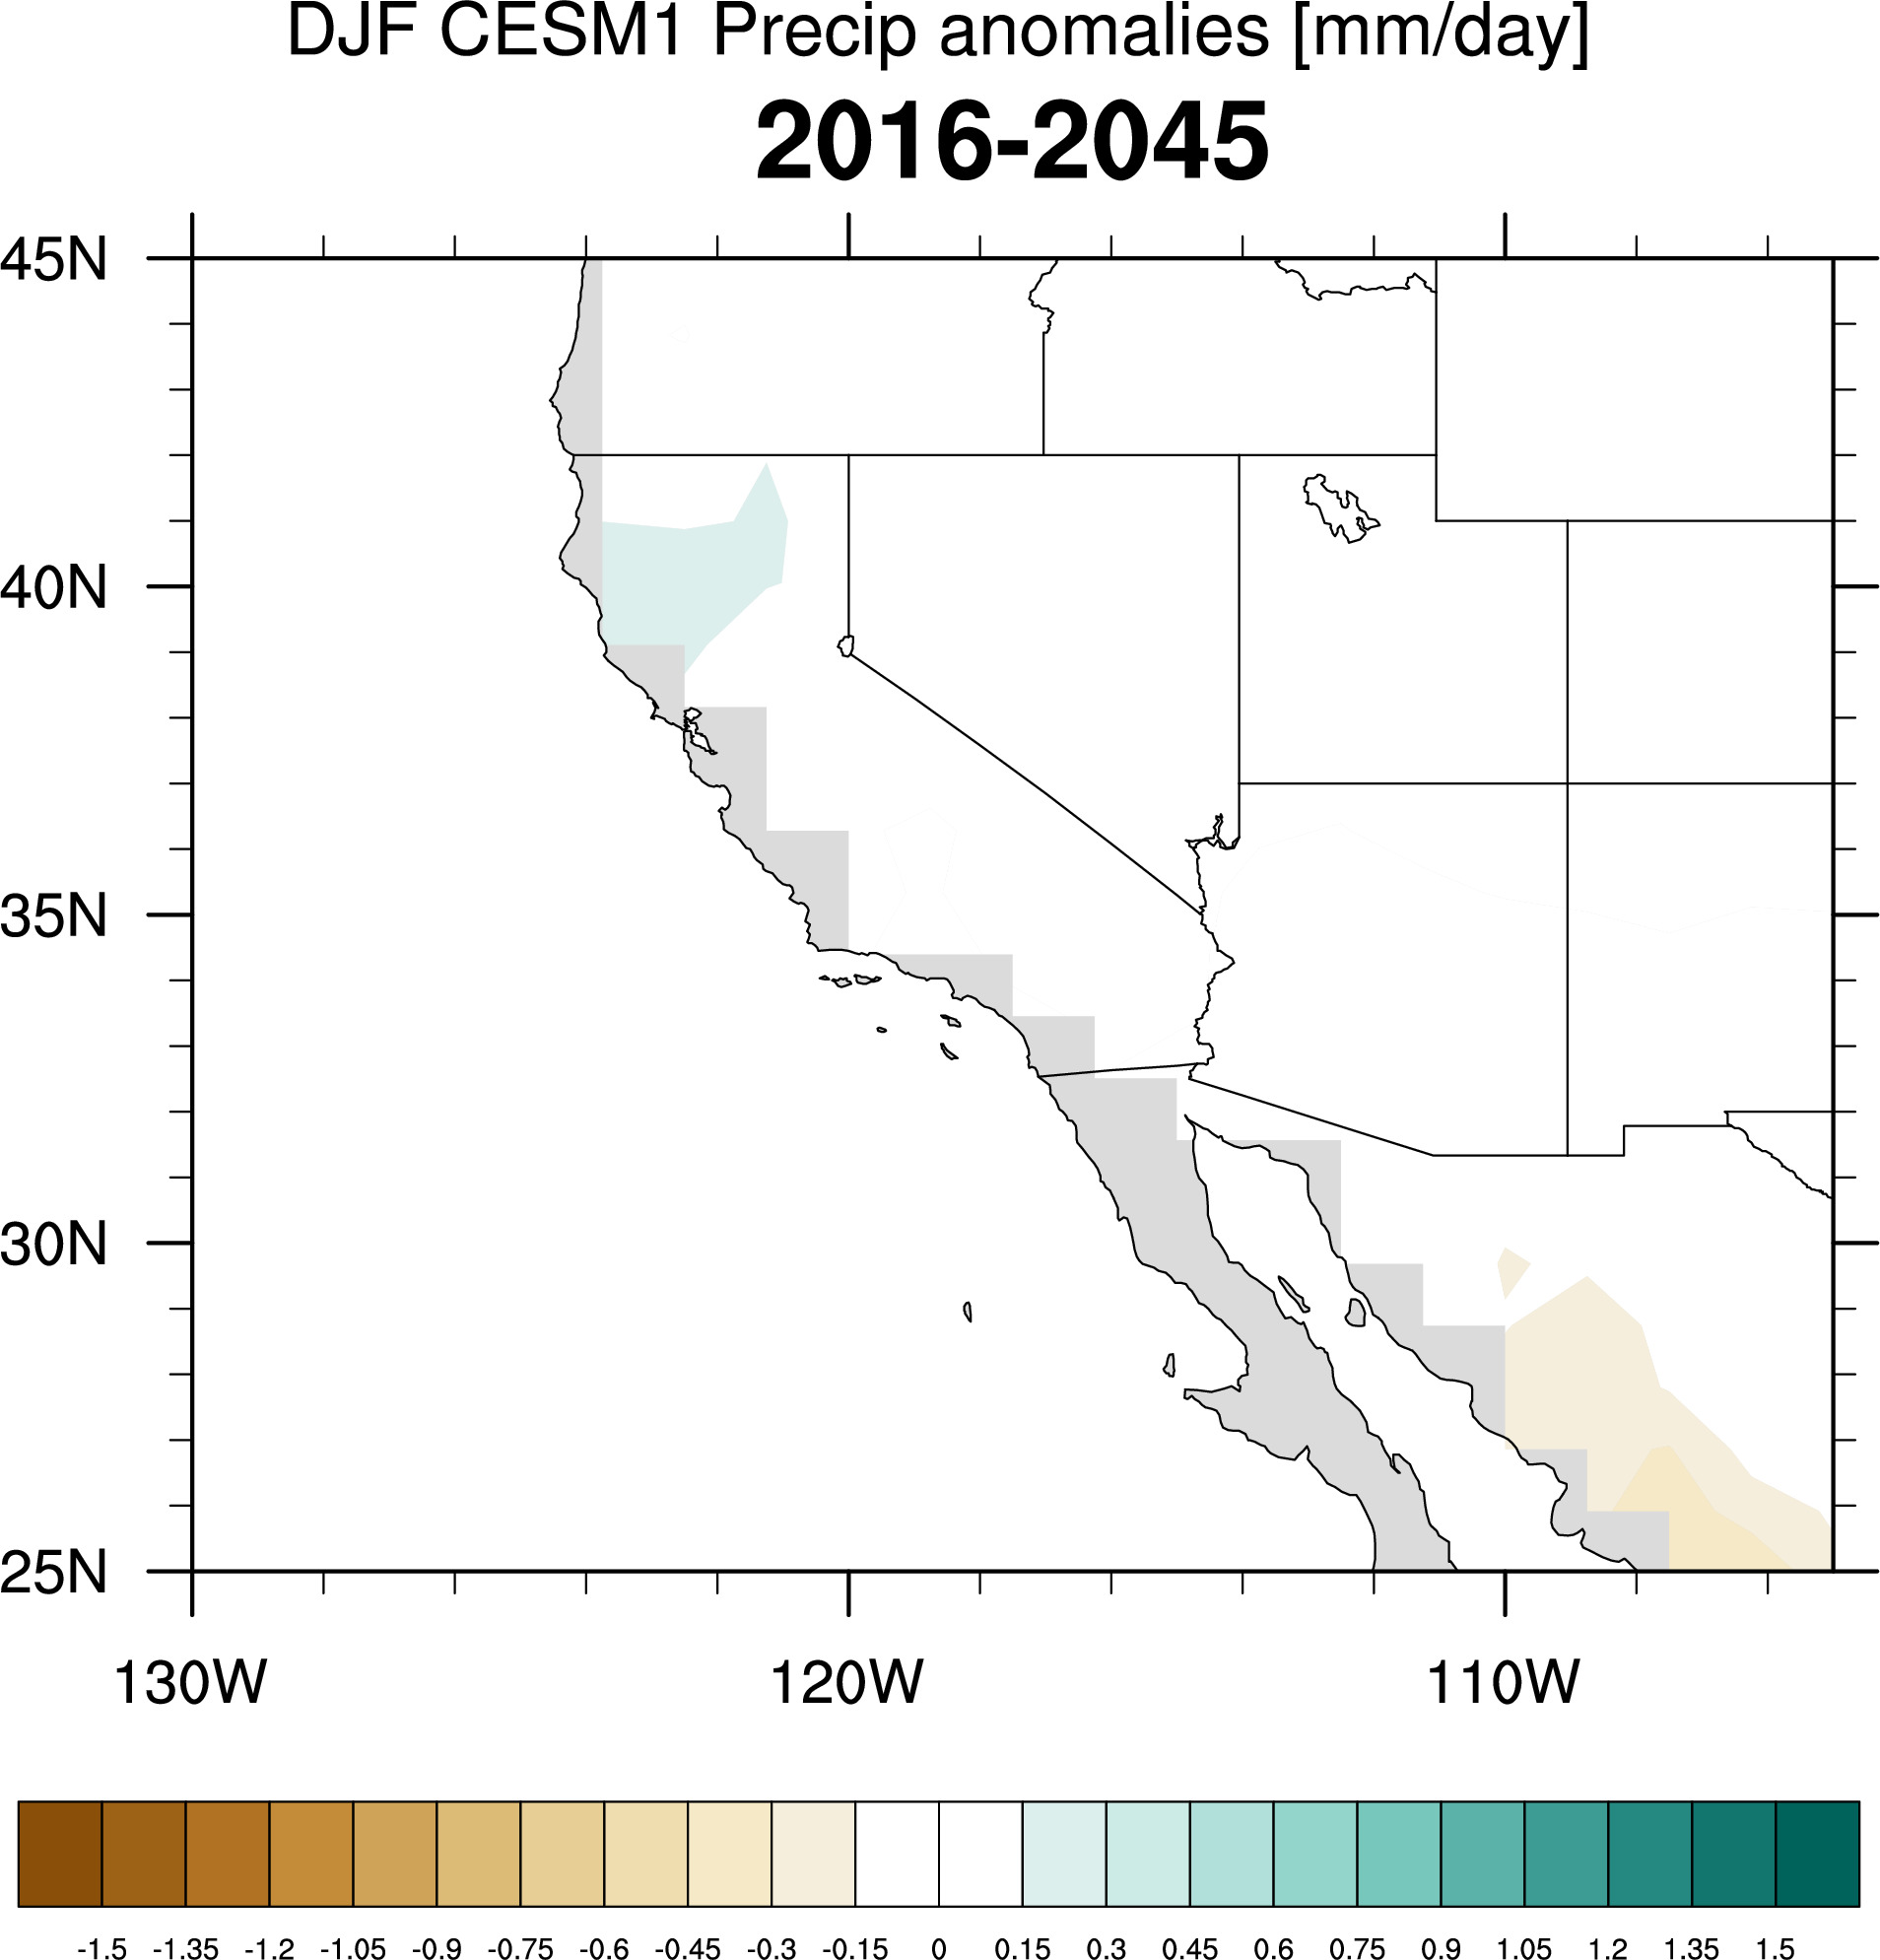
Precip Anomaly Maps
All years:
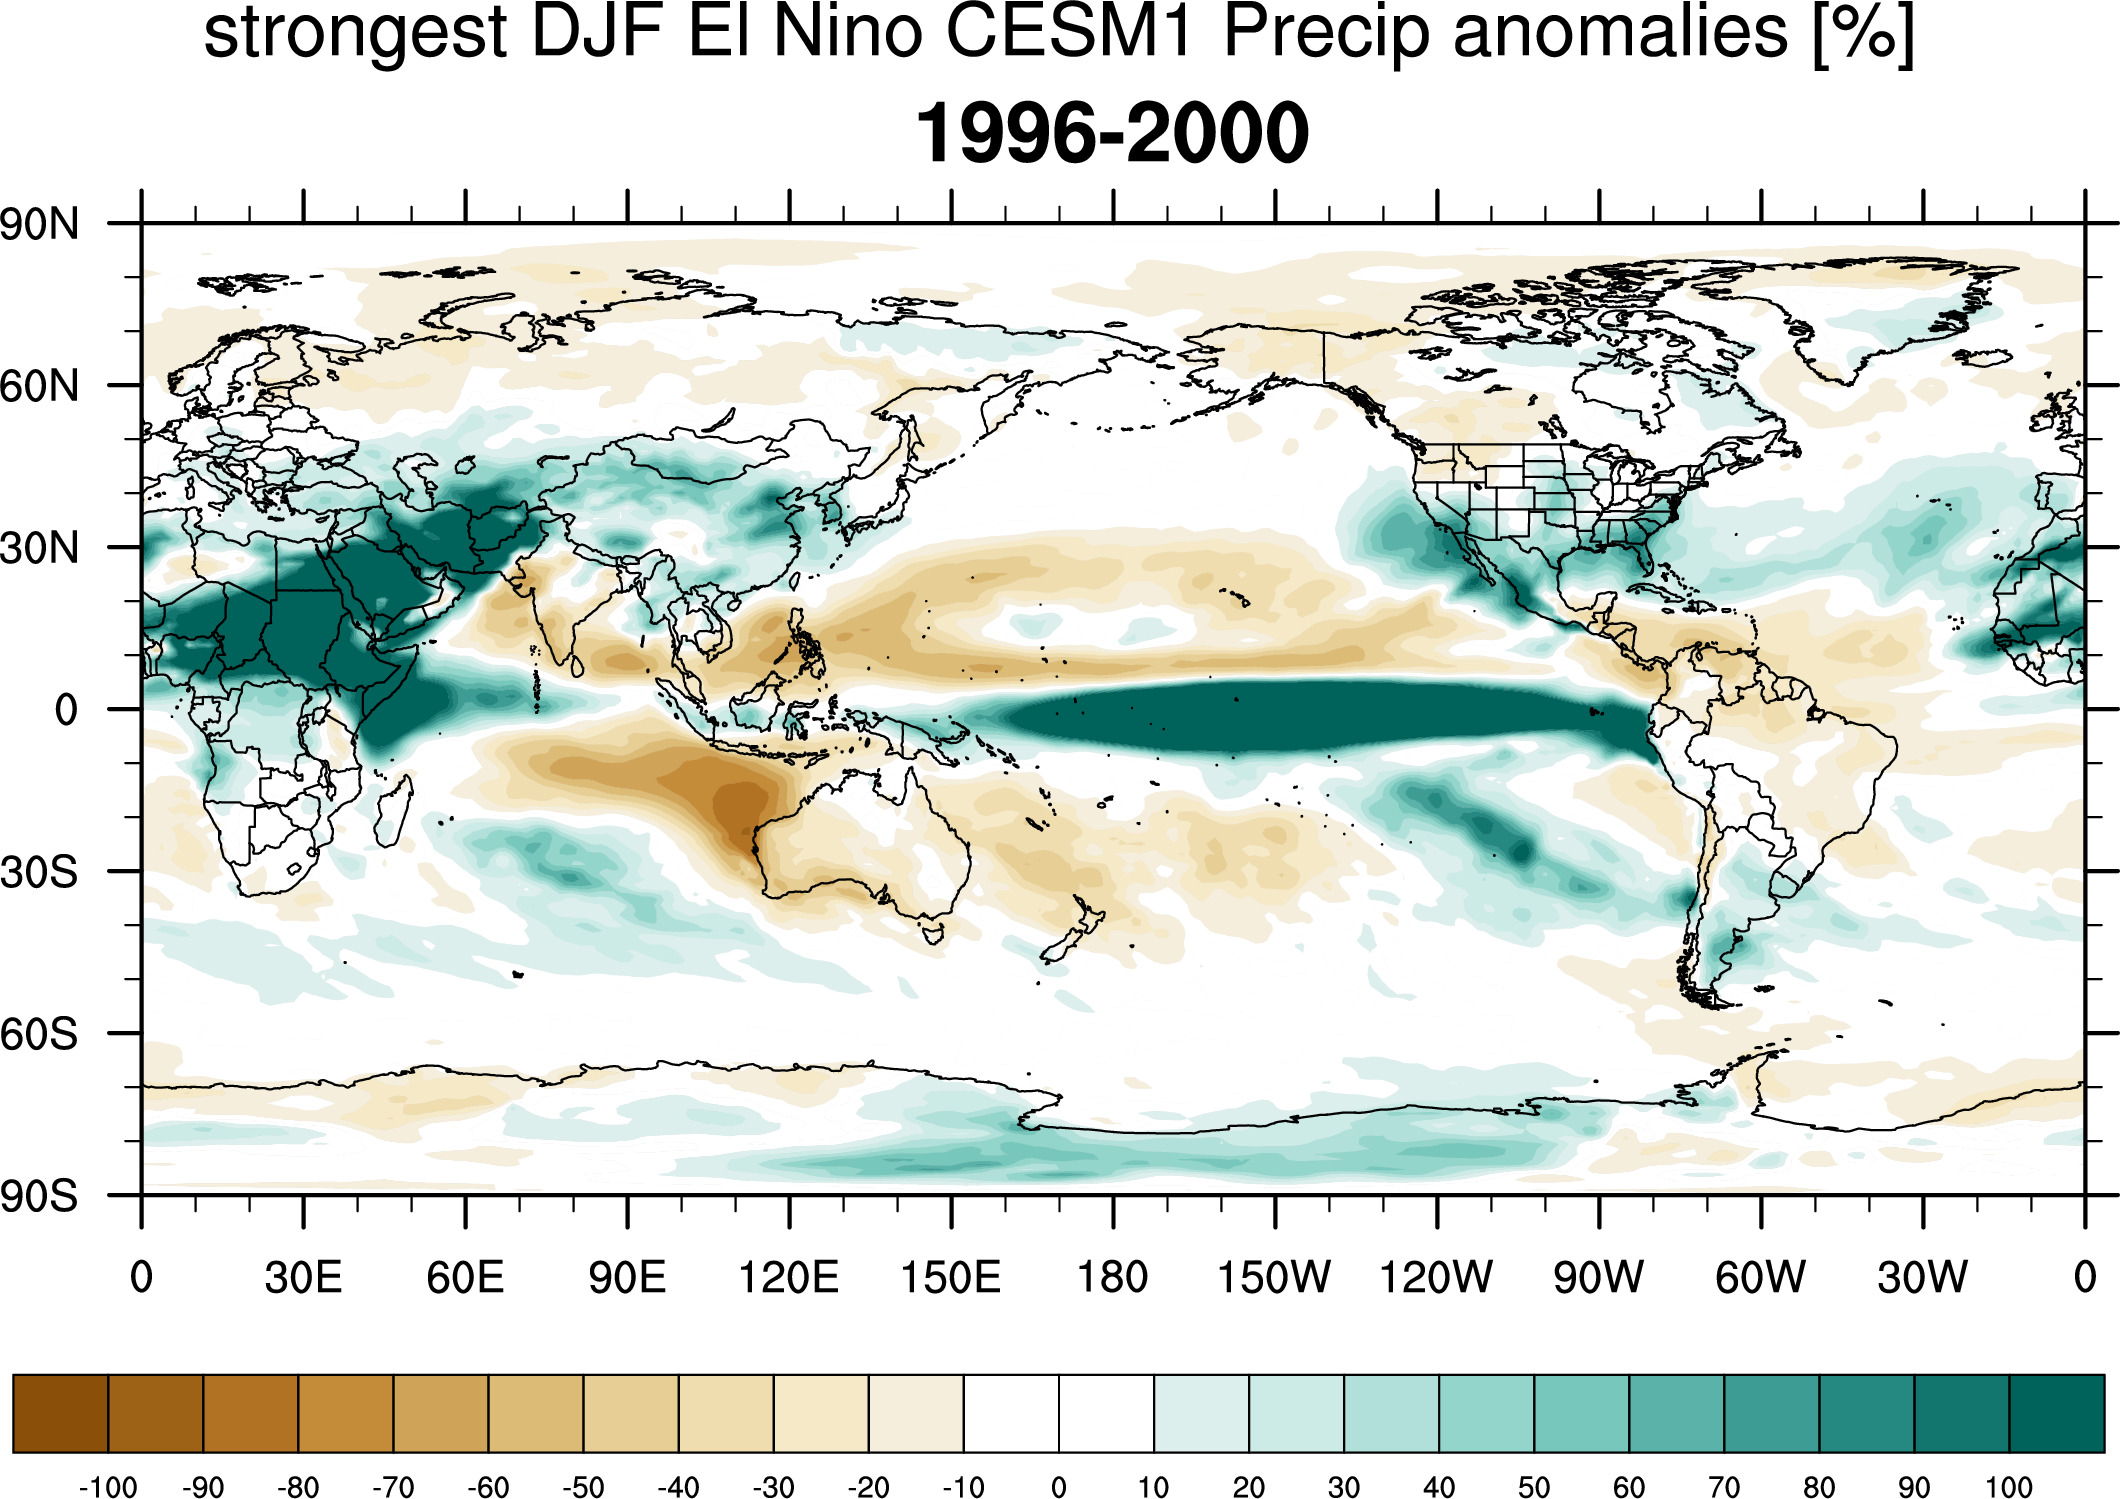
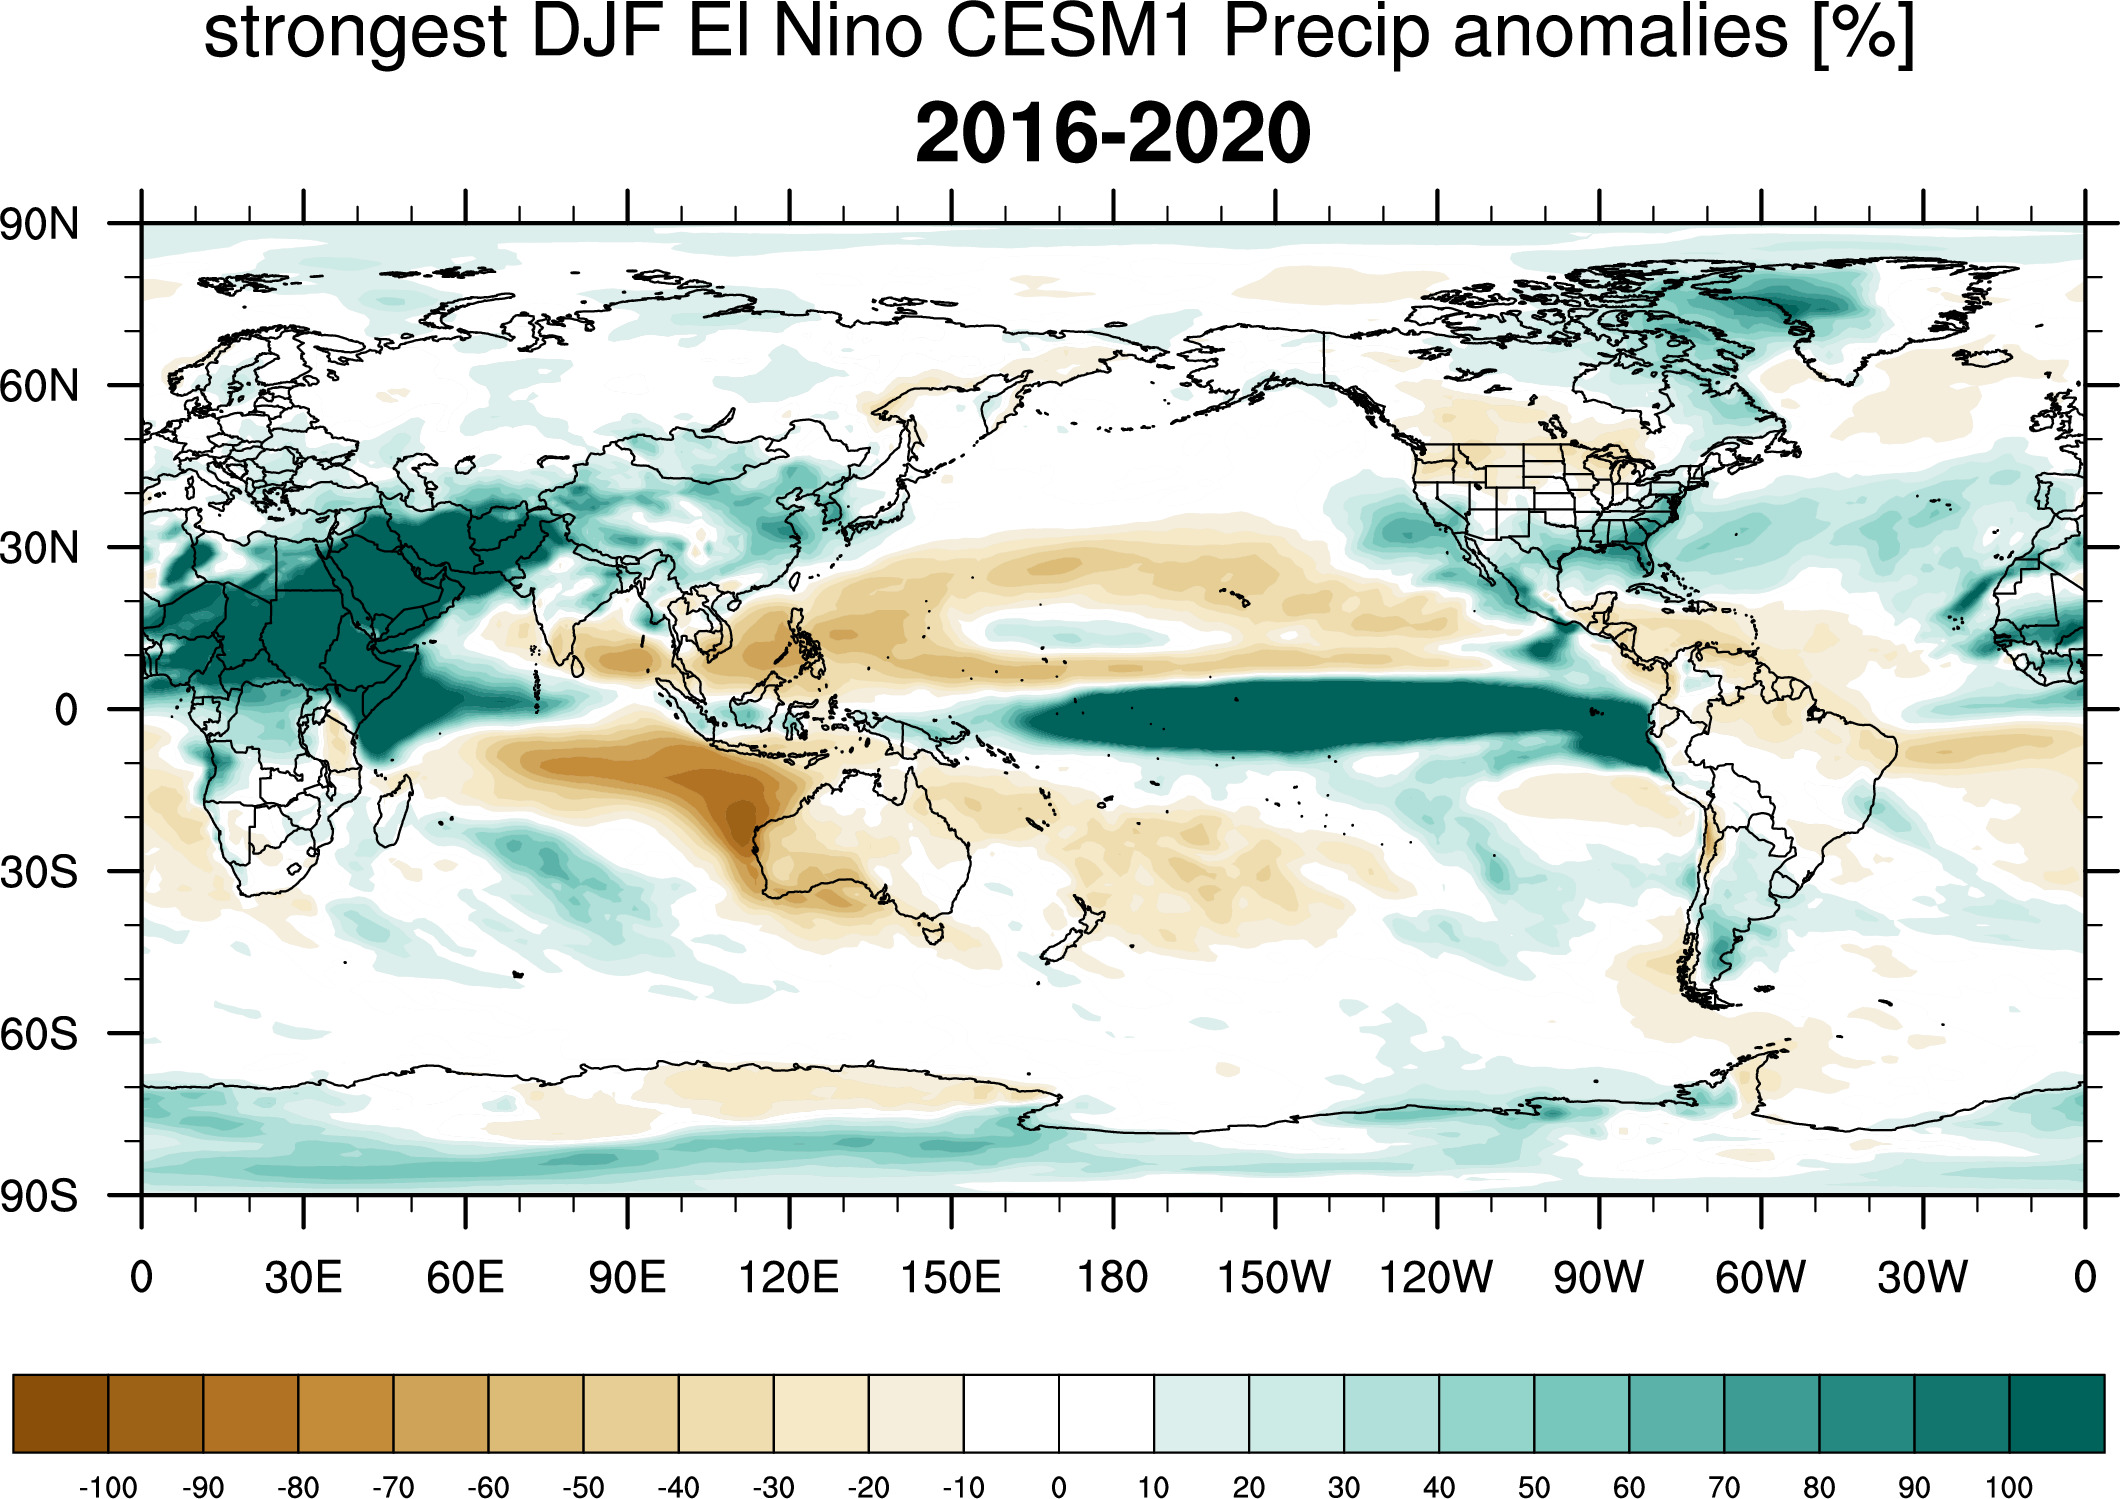
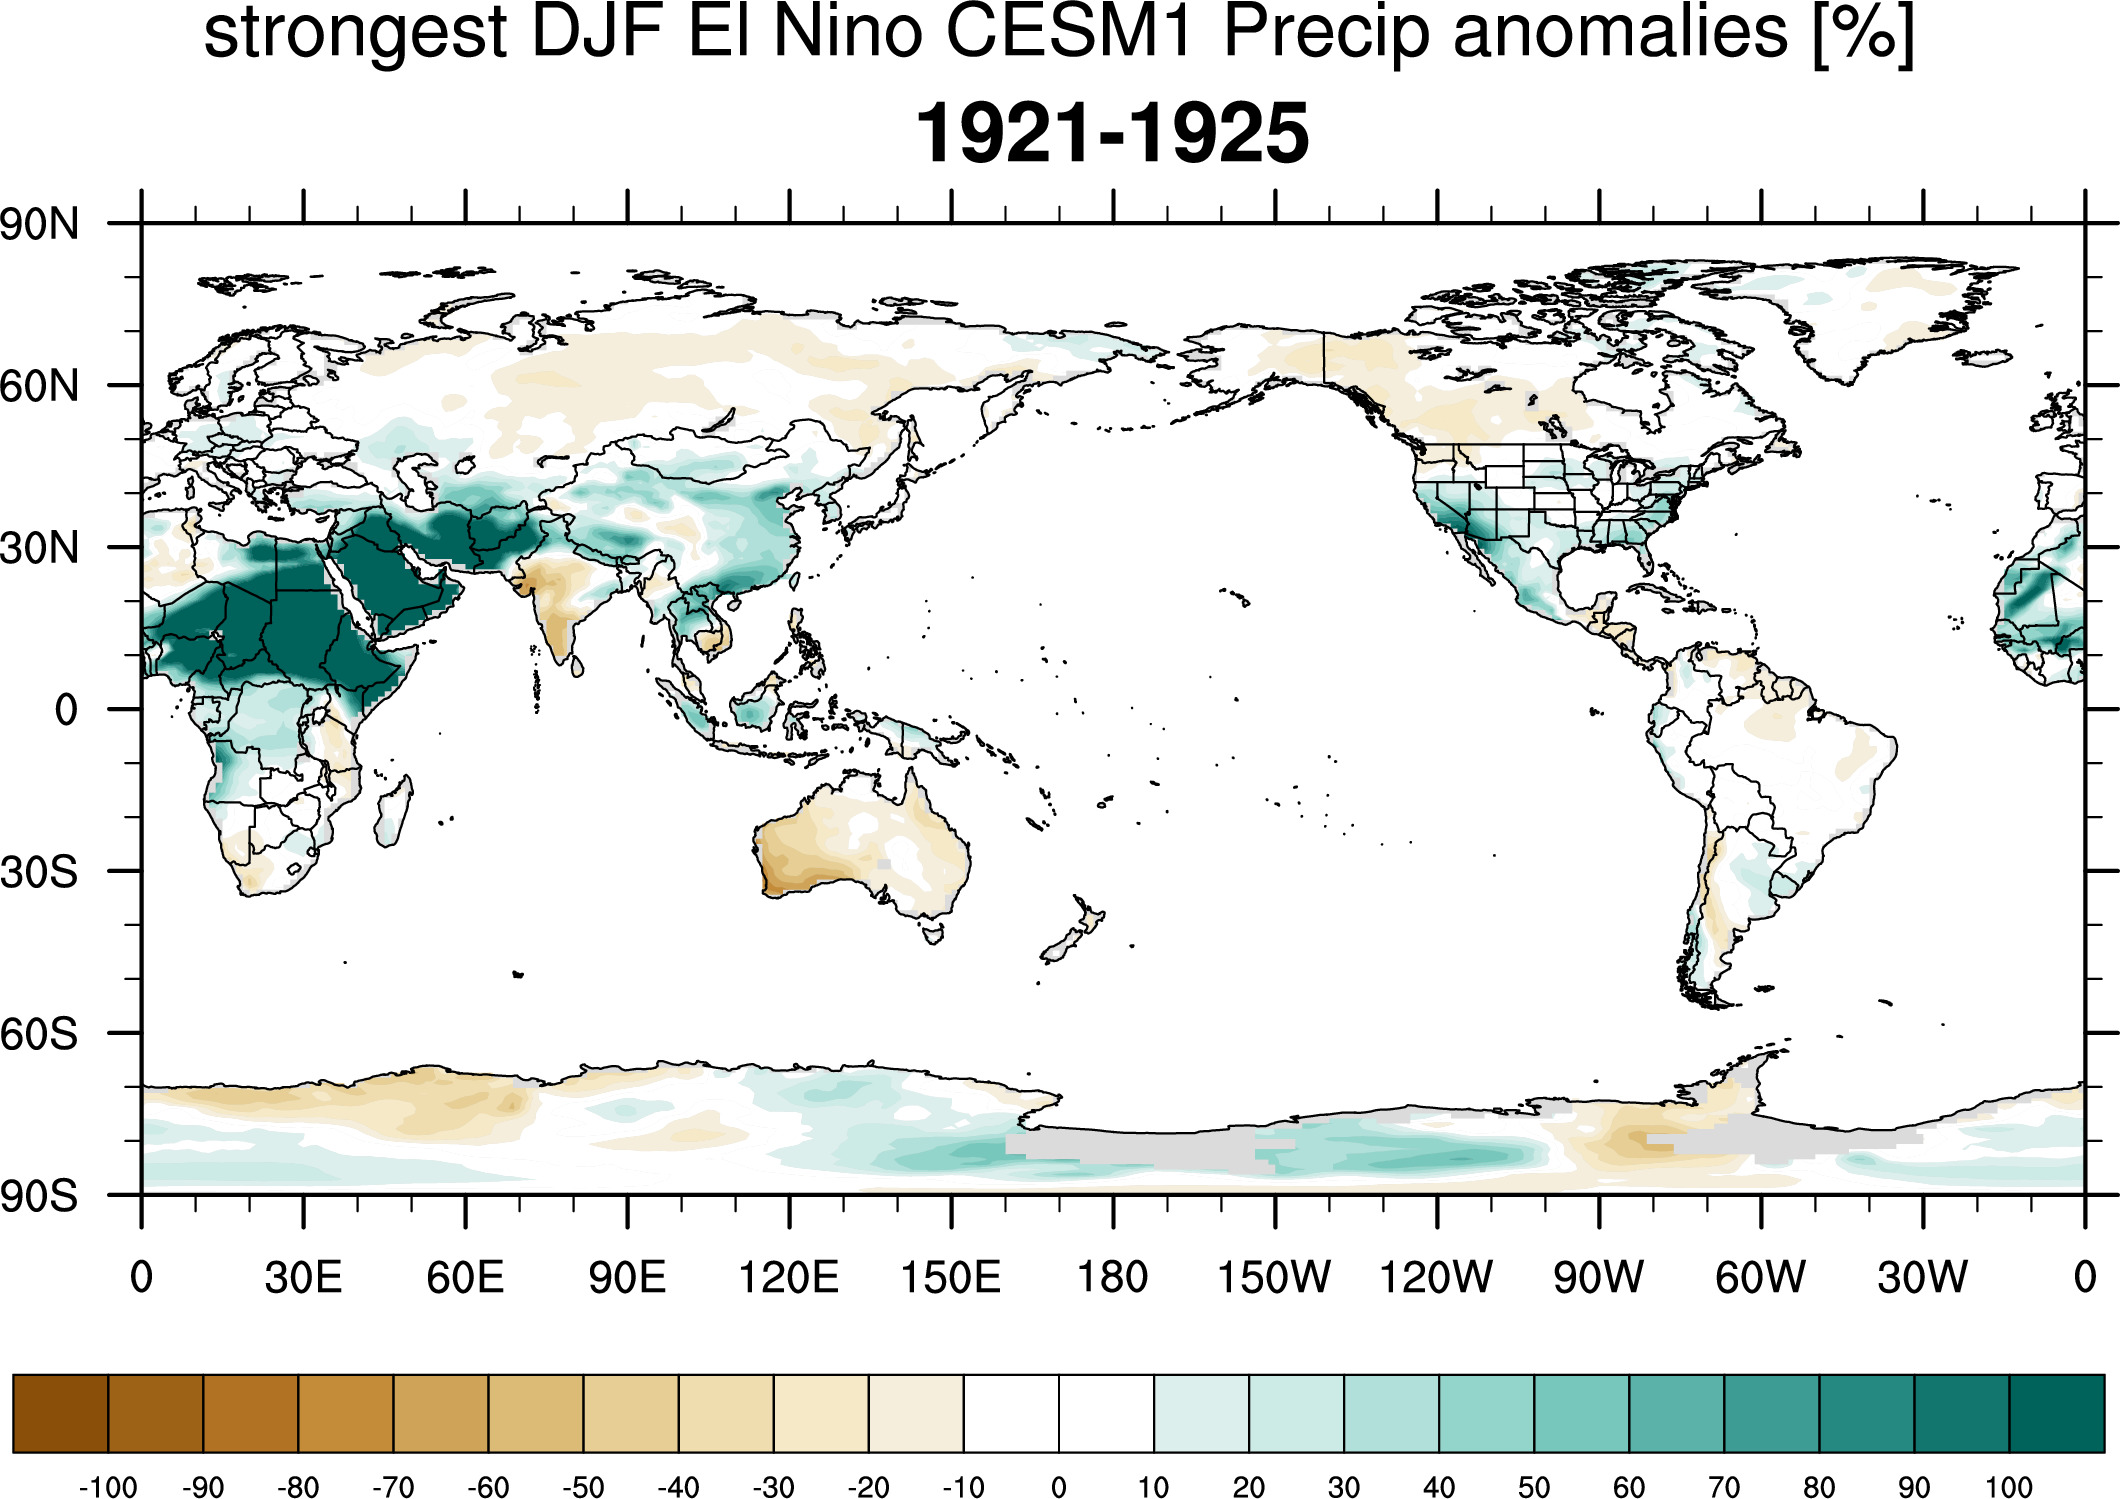
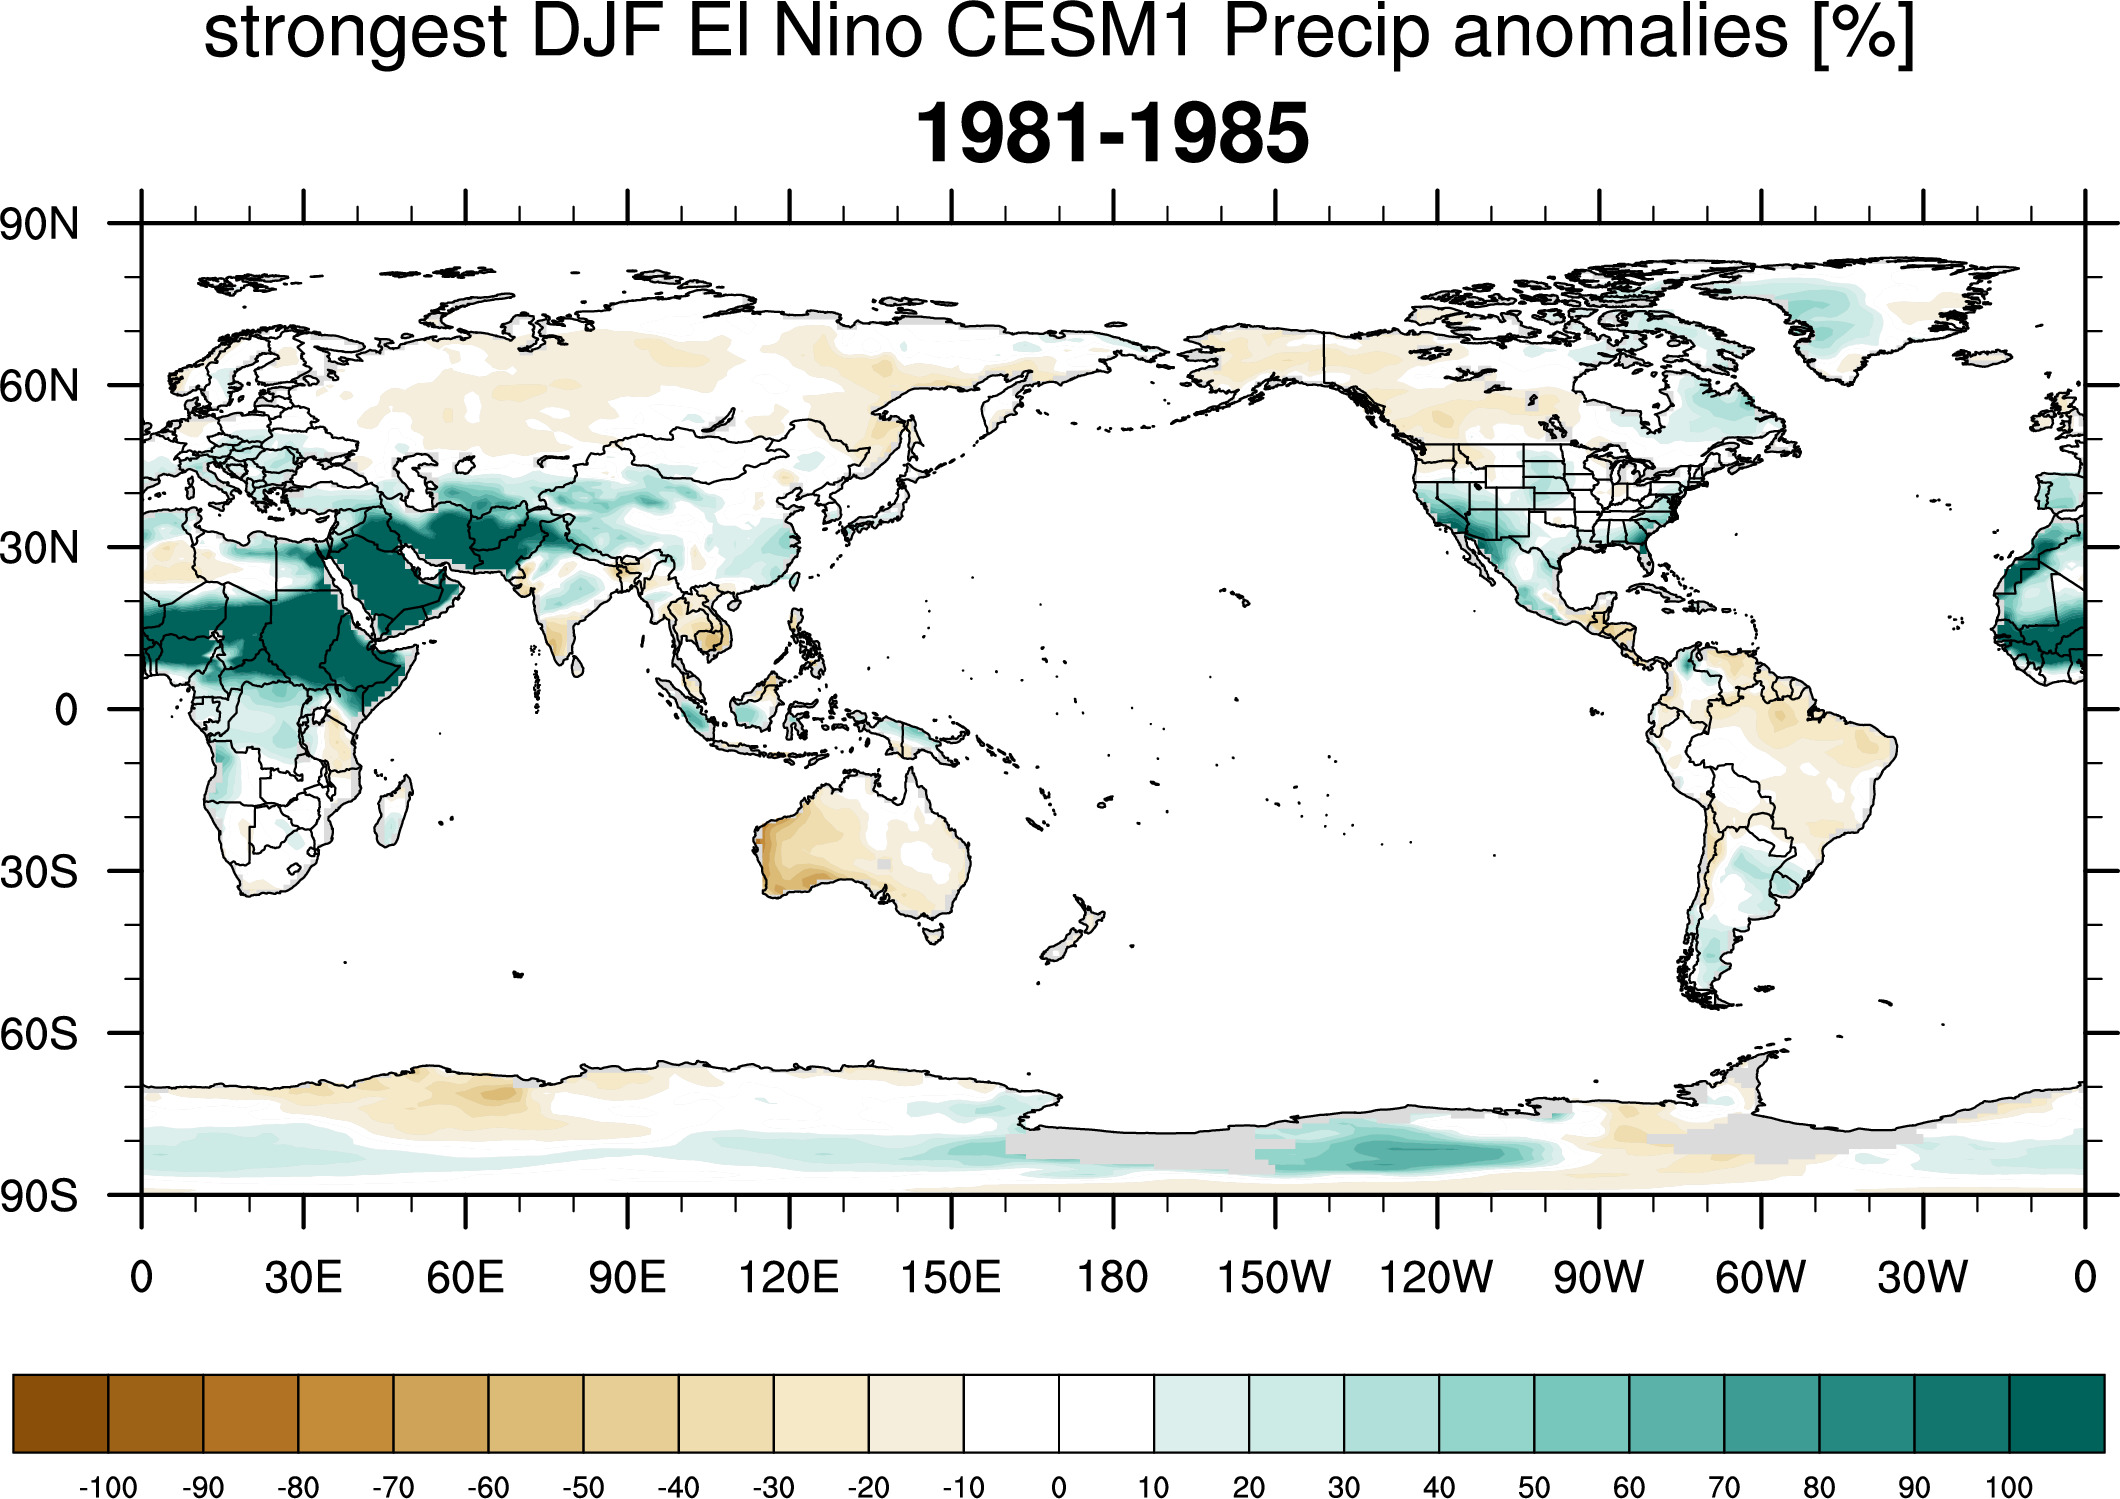
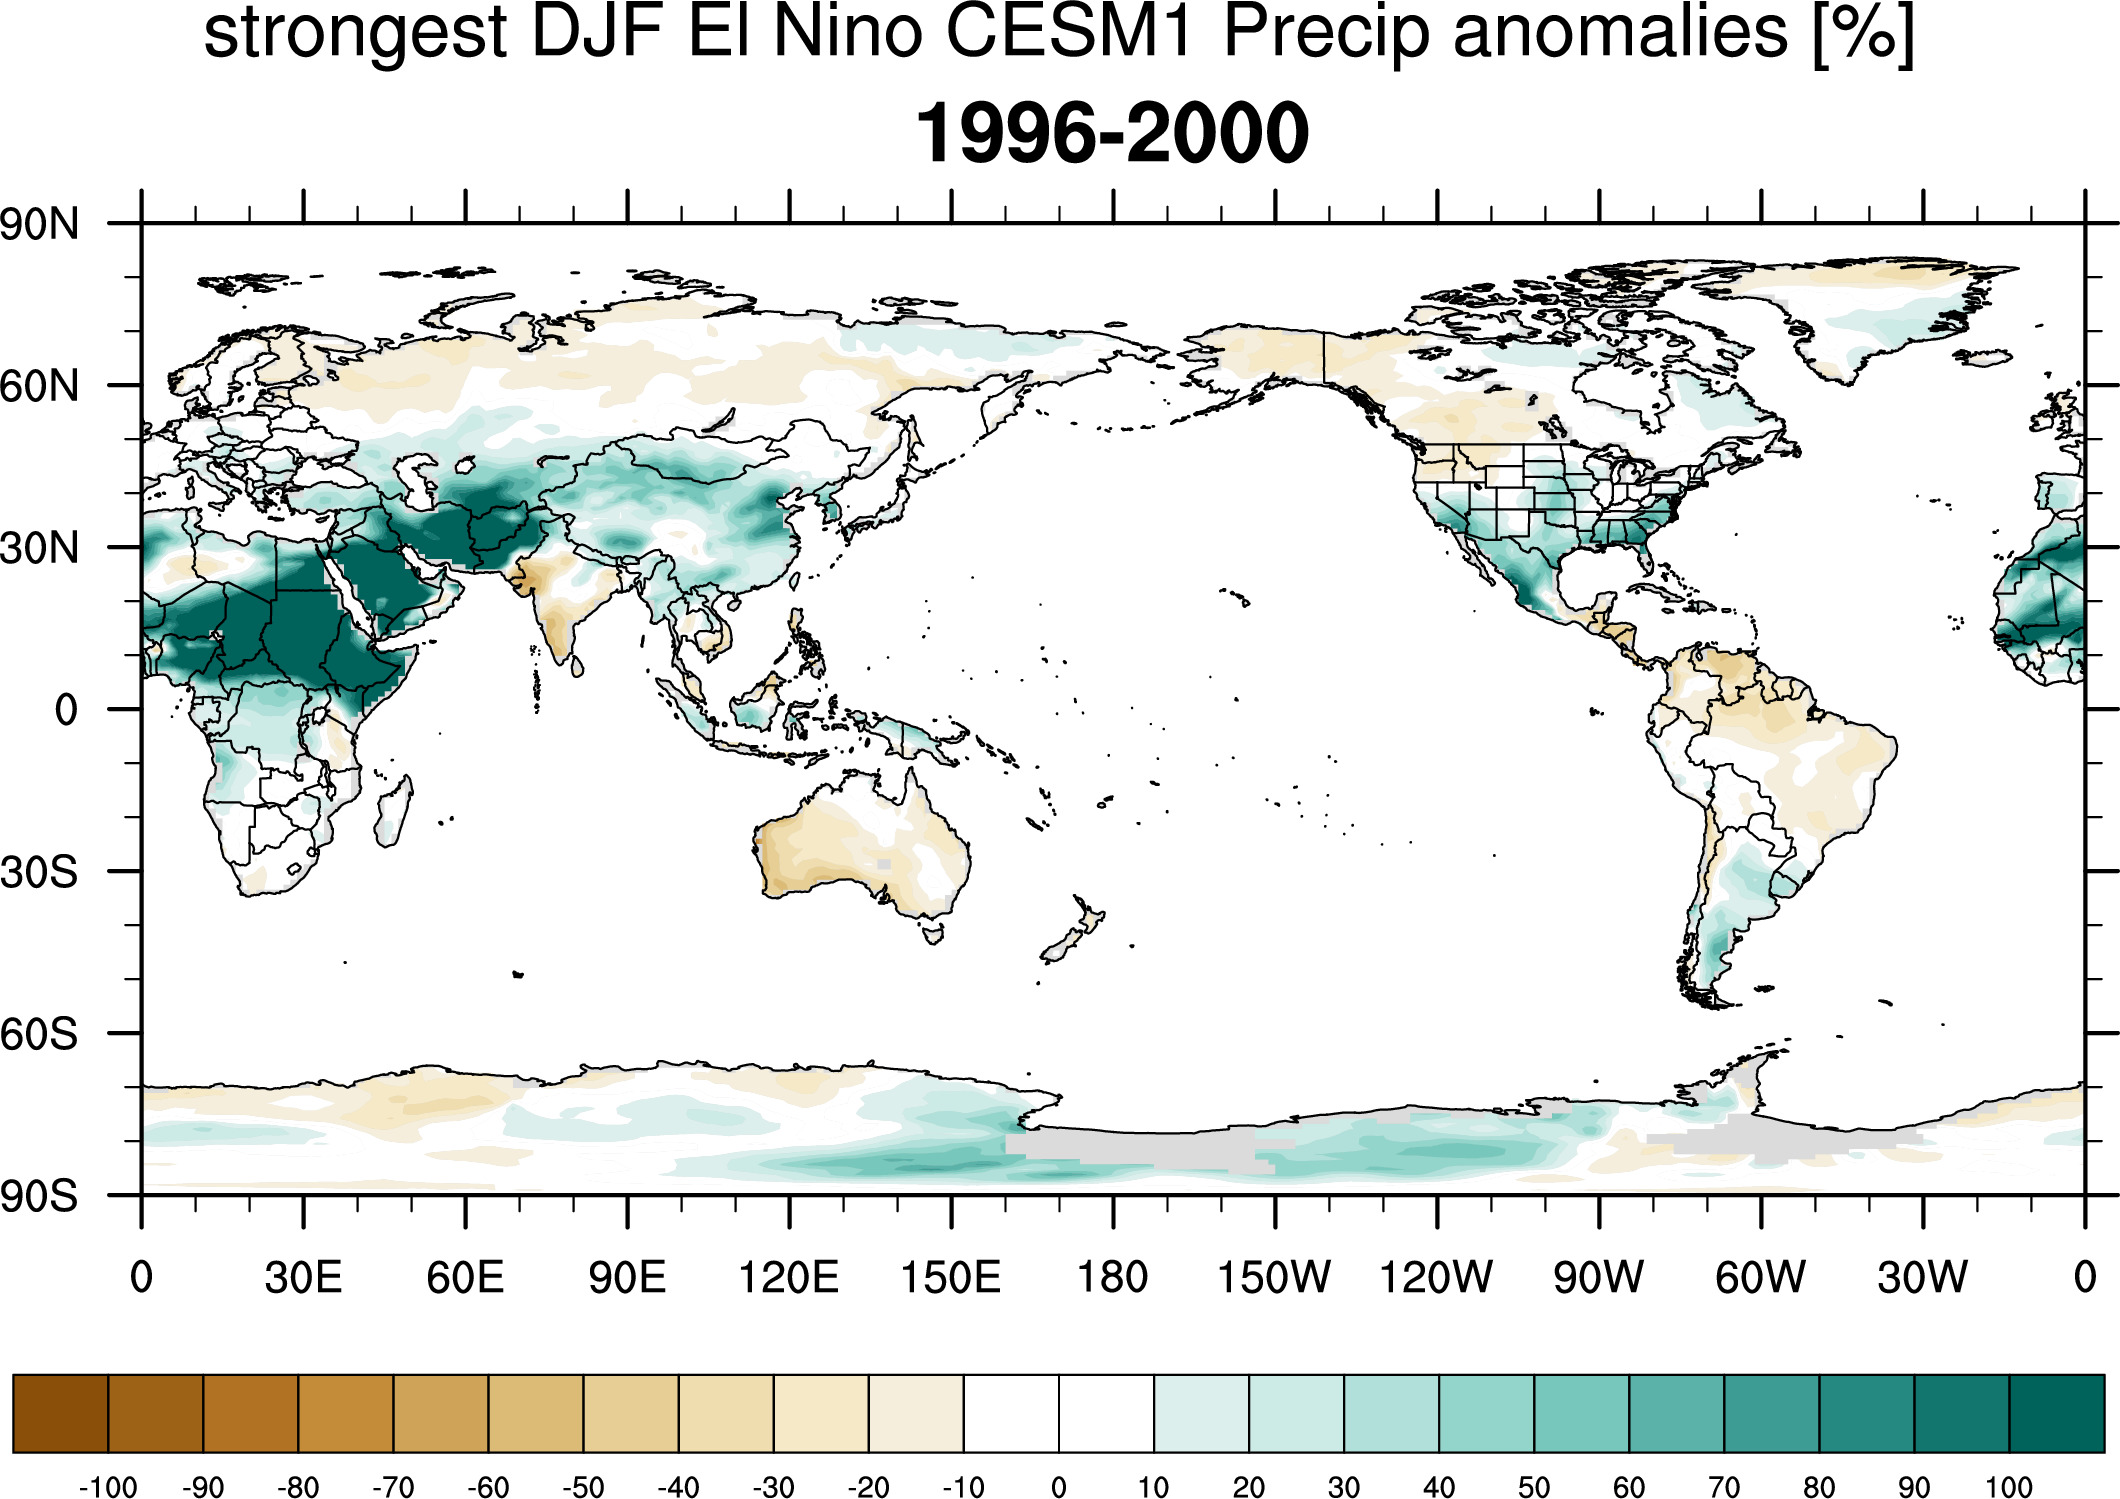
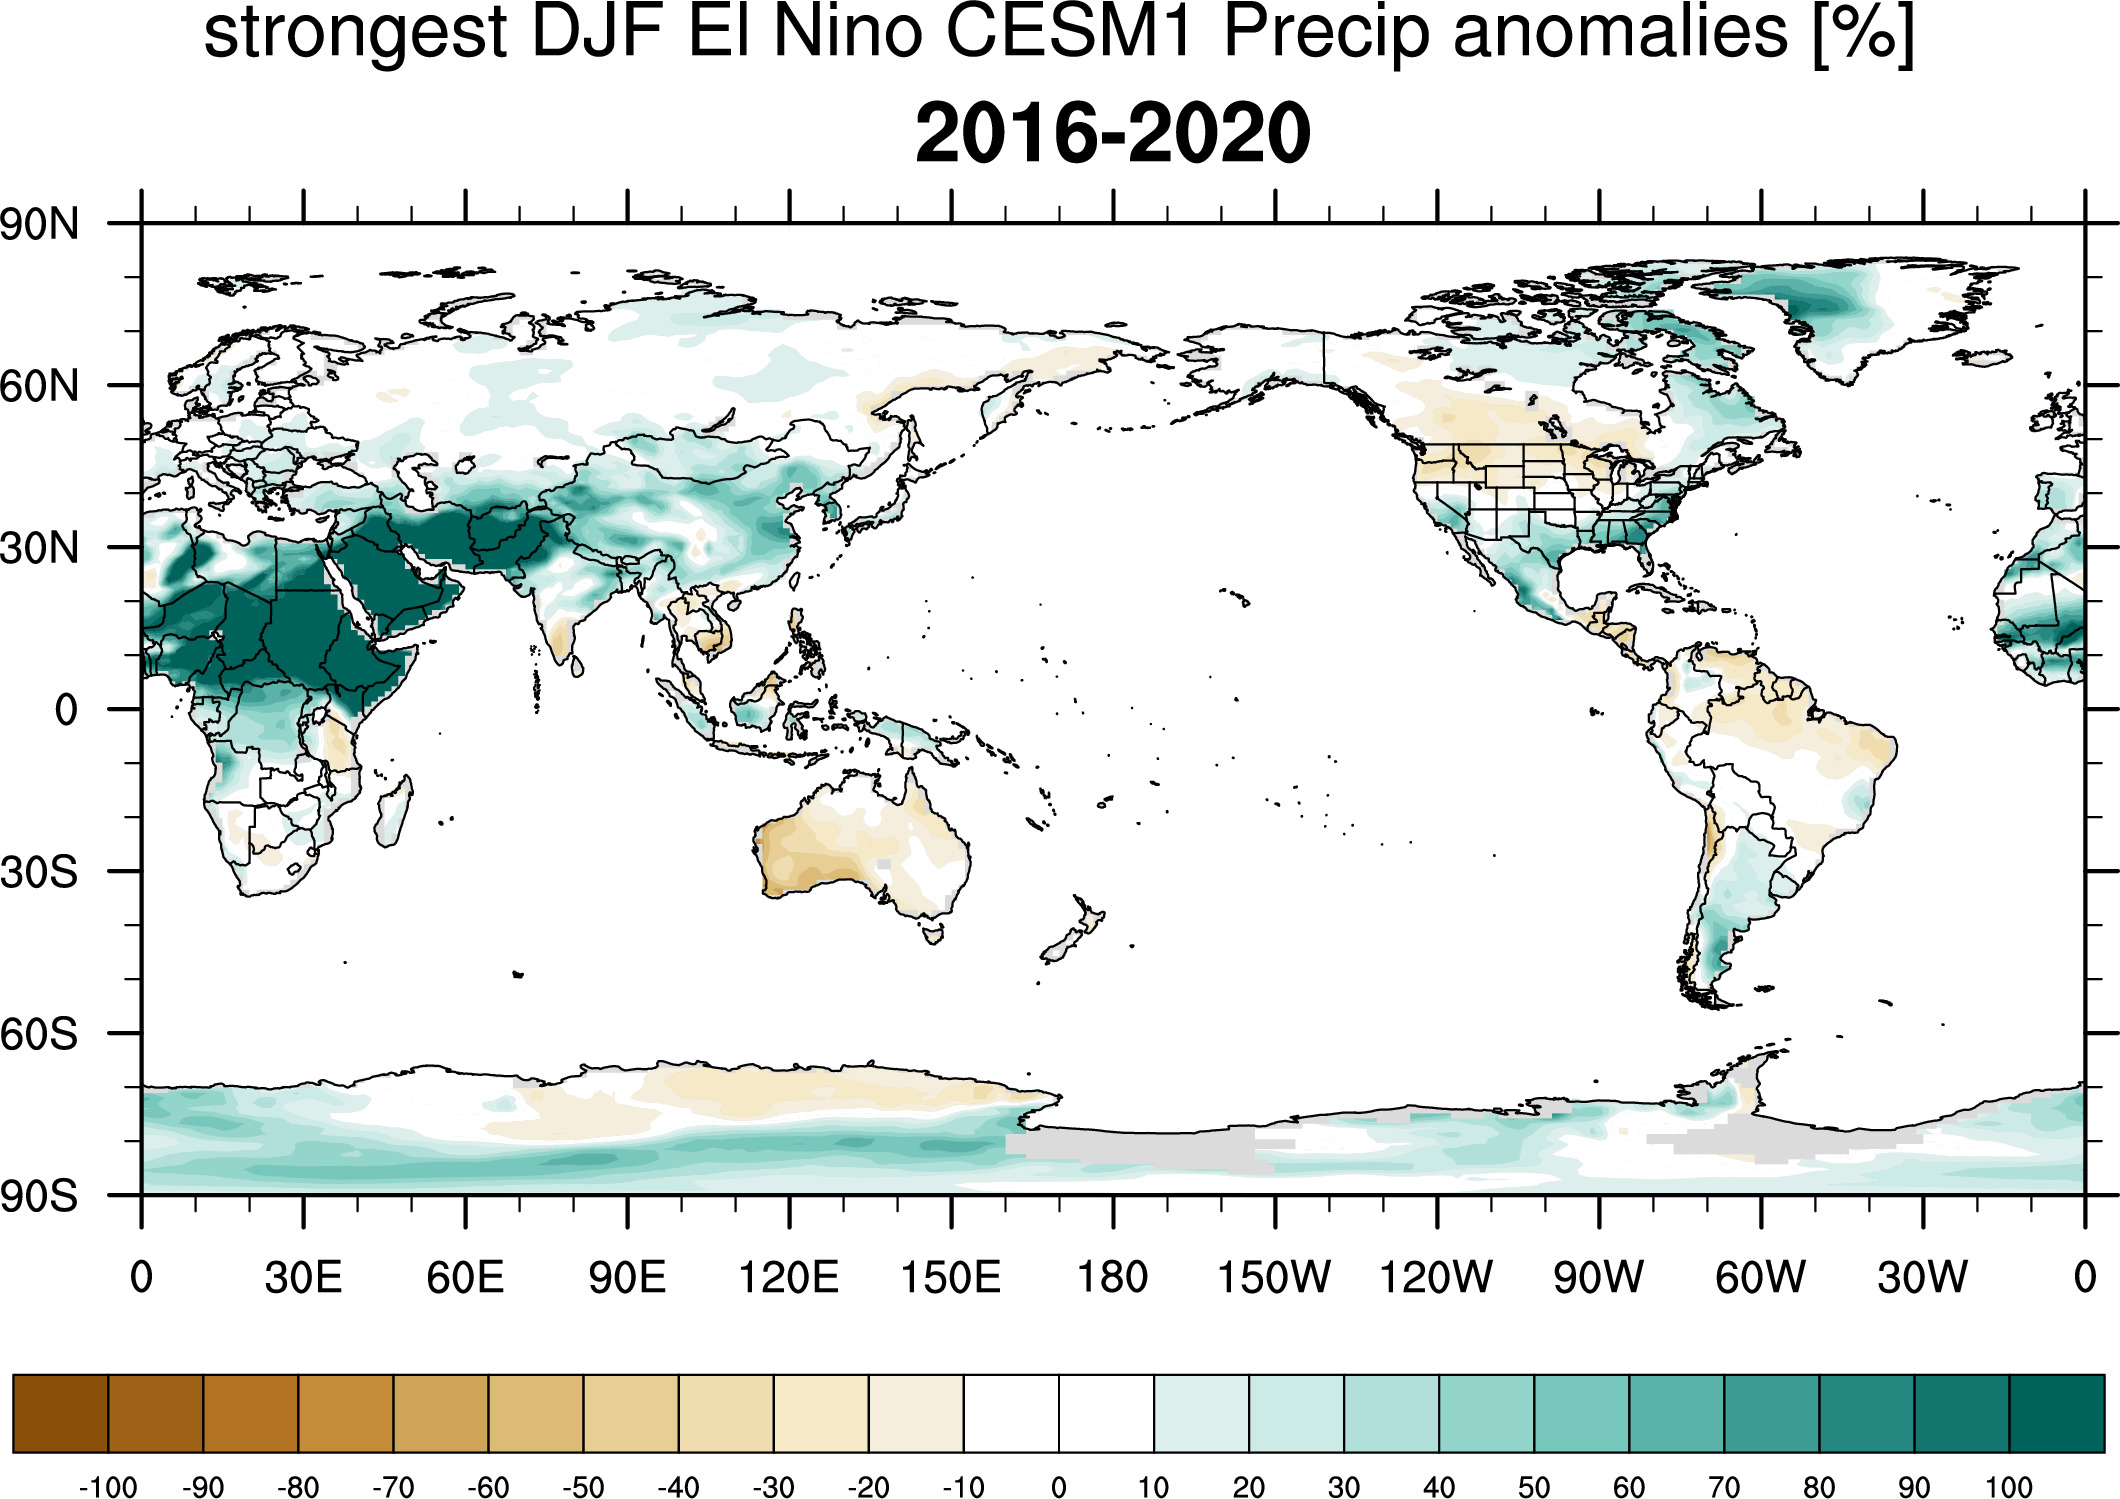
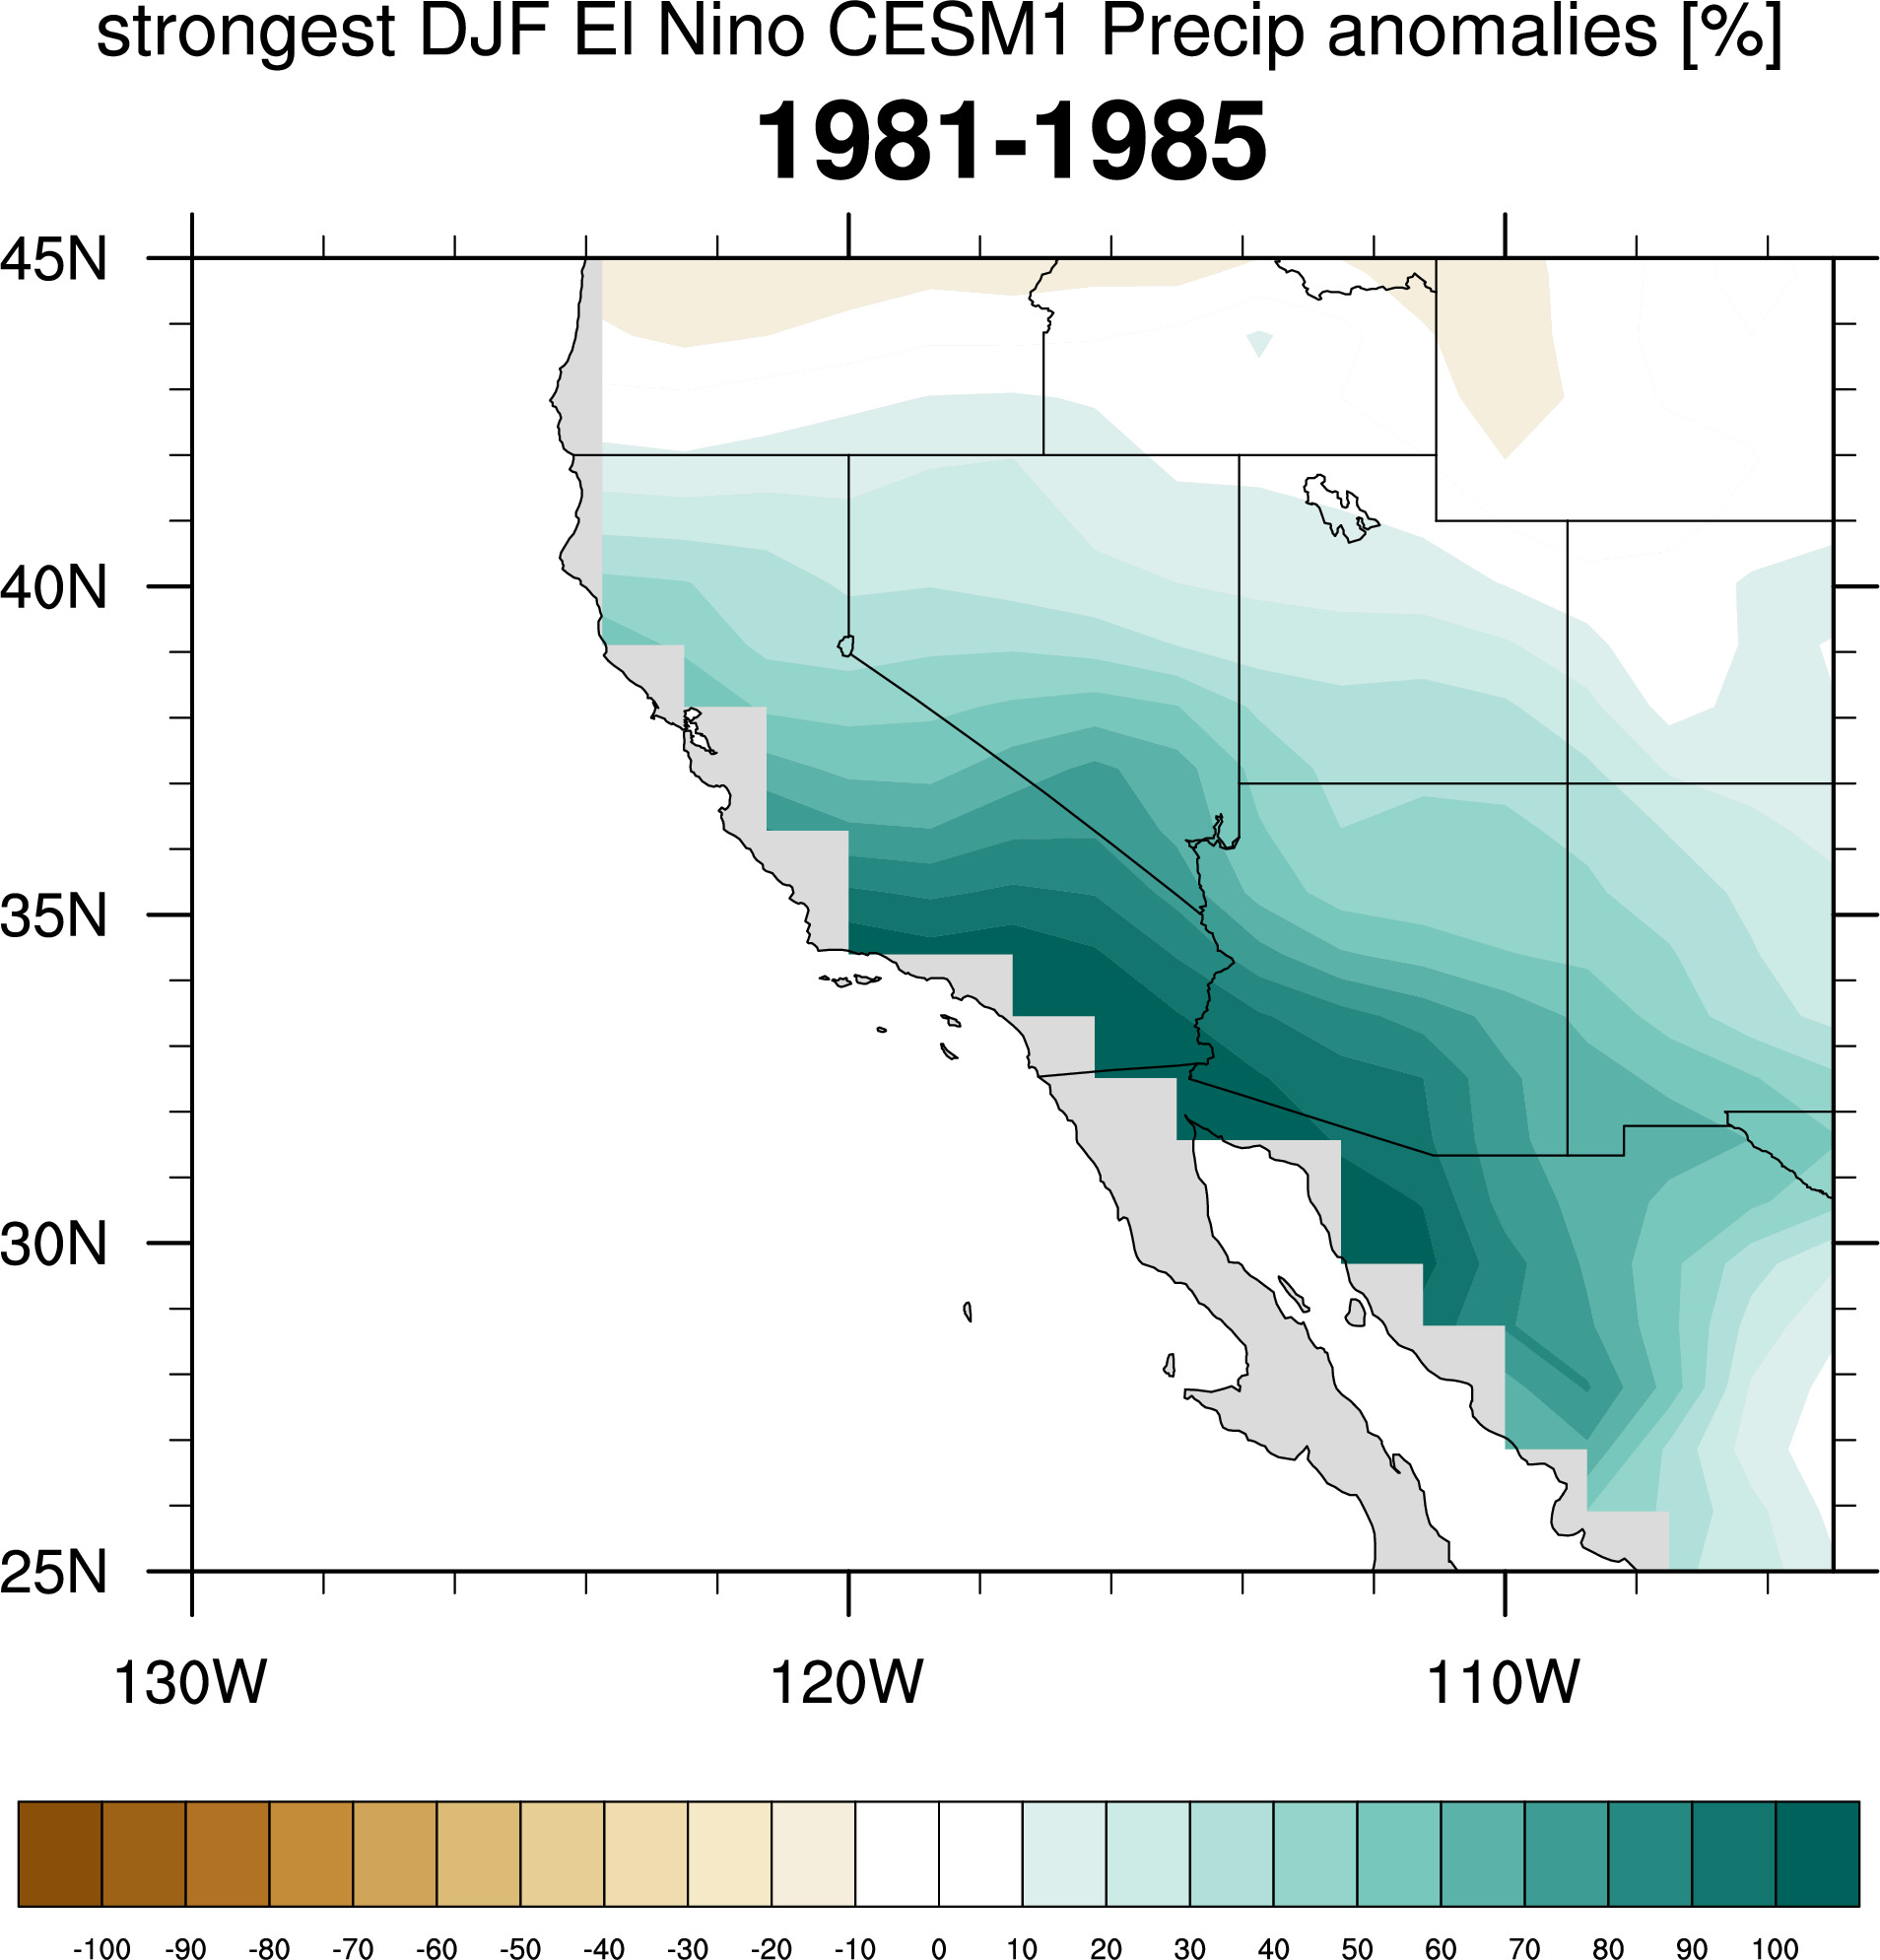
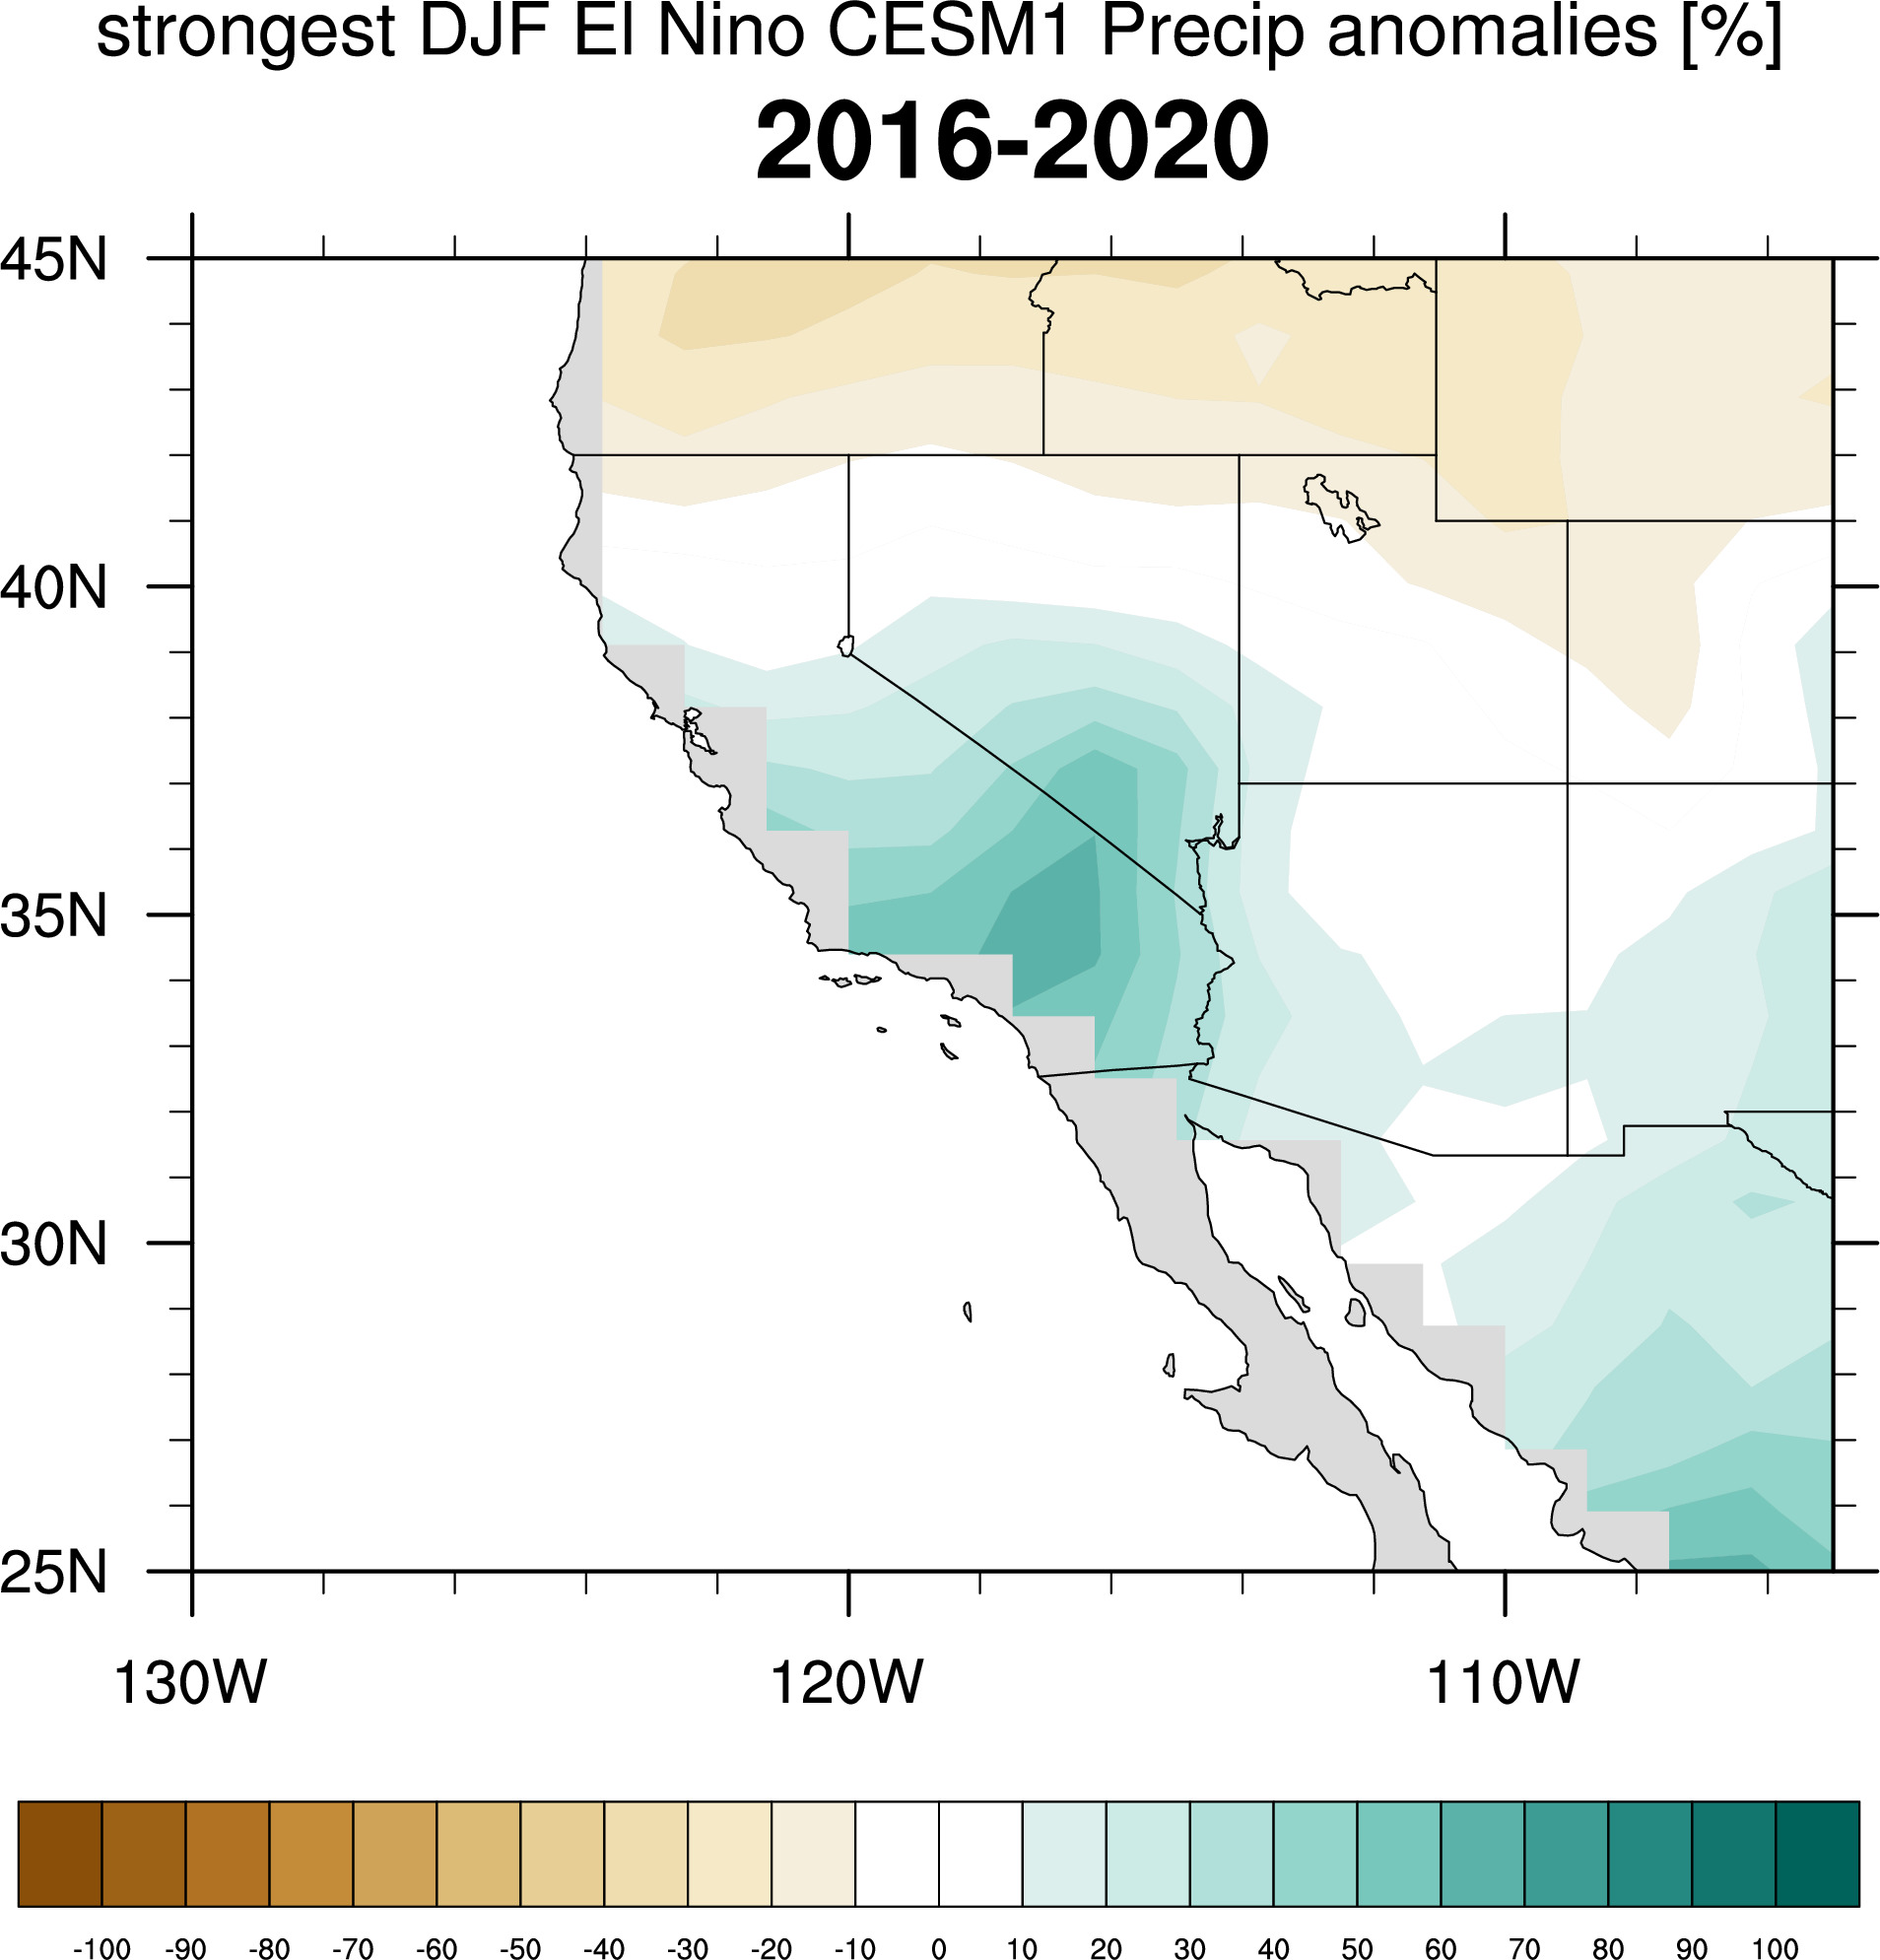
Strongest El Ninos:
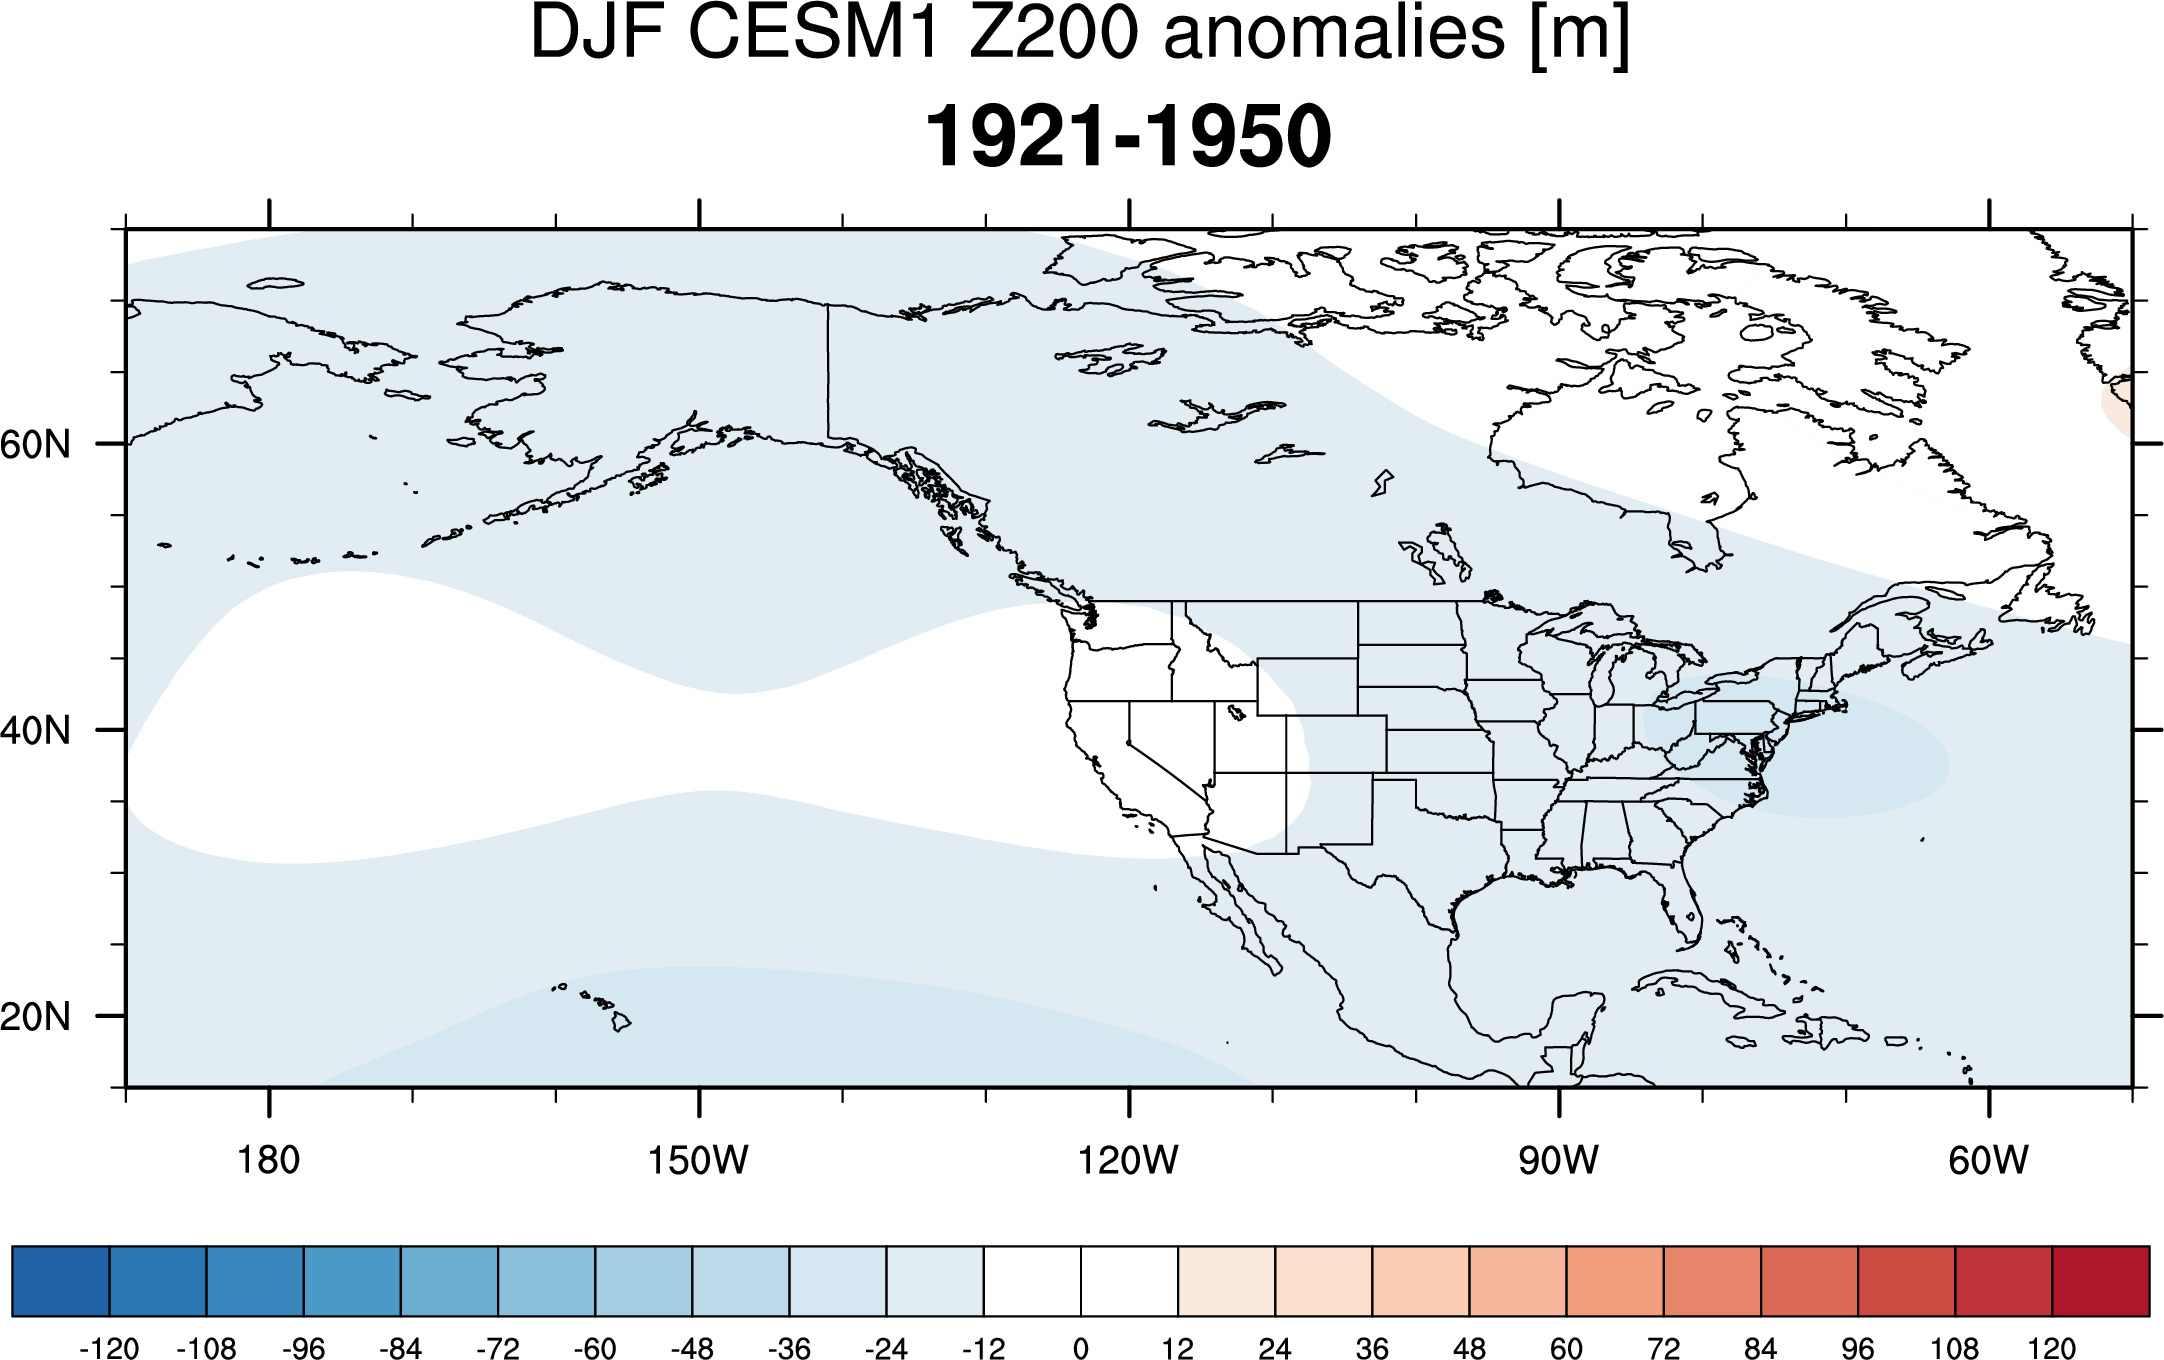
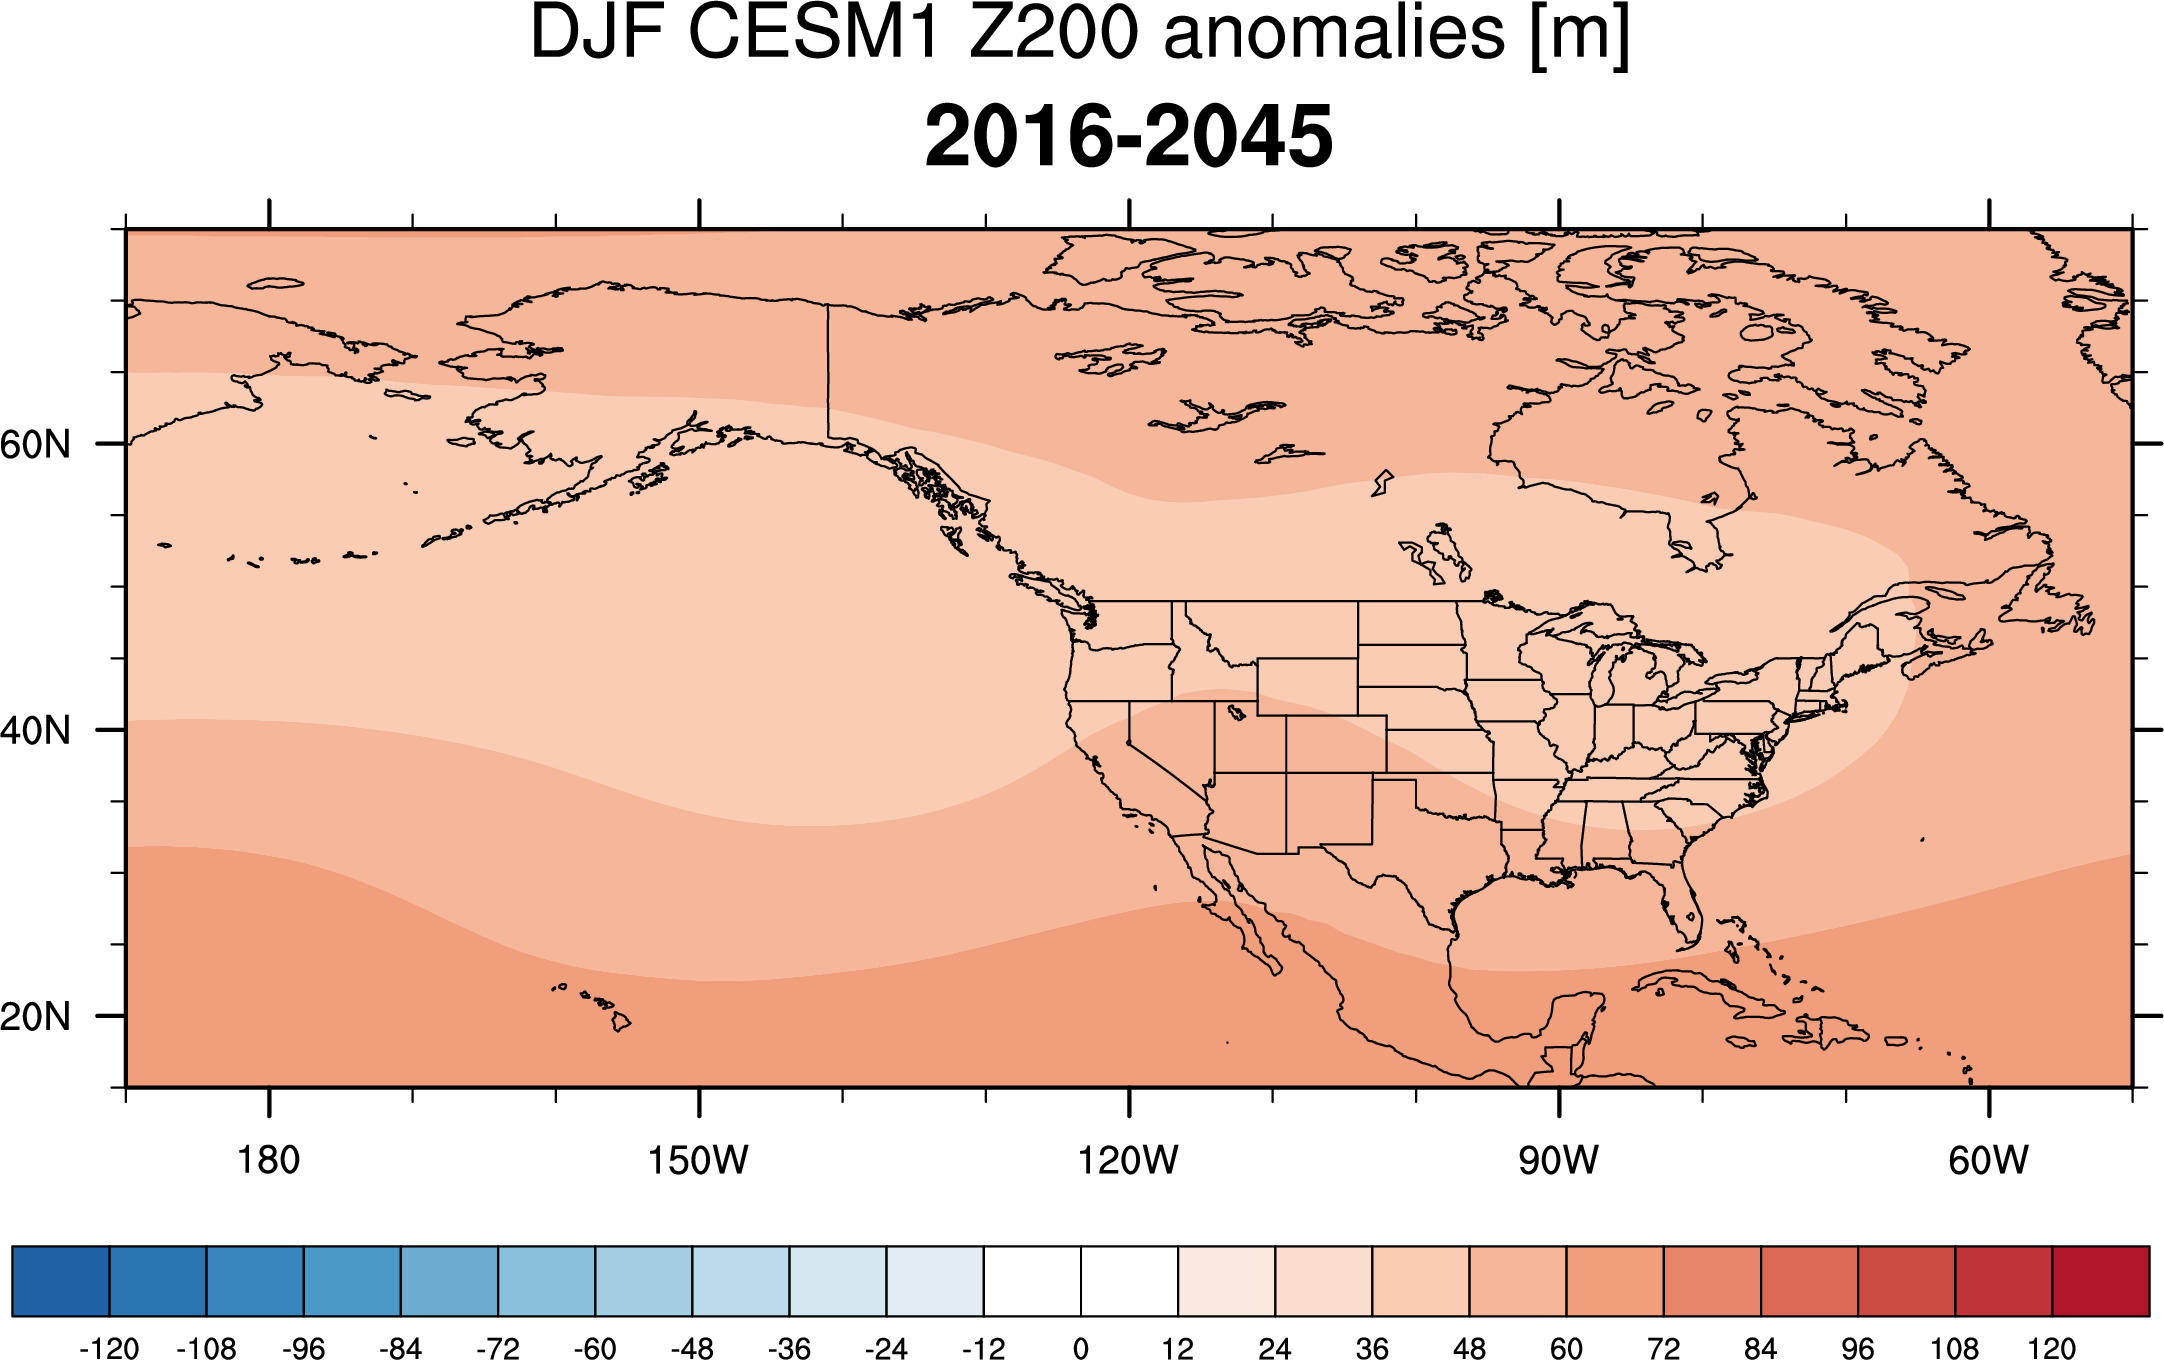
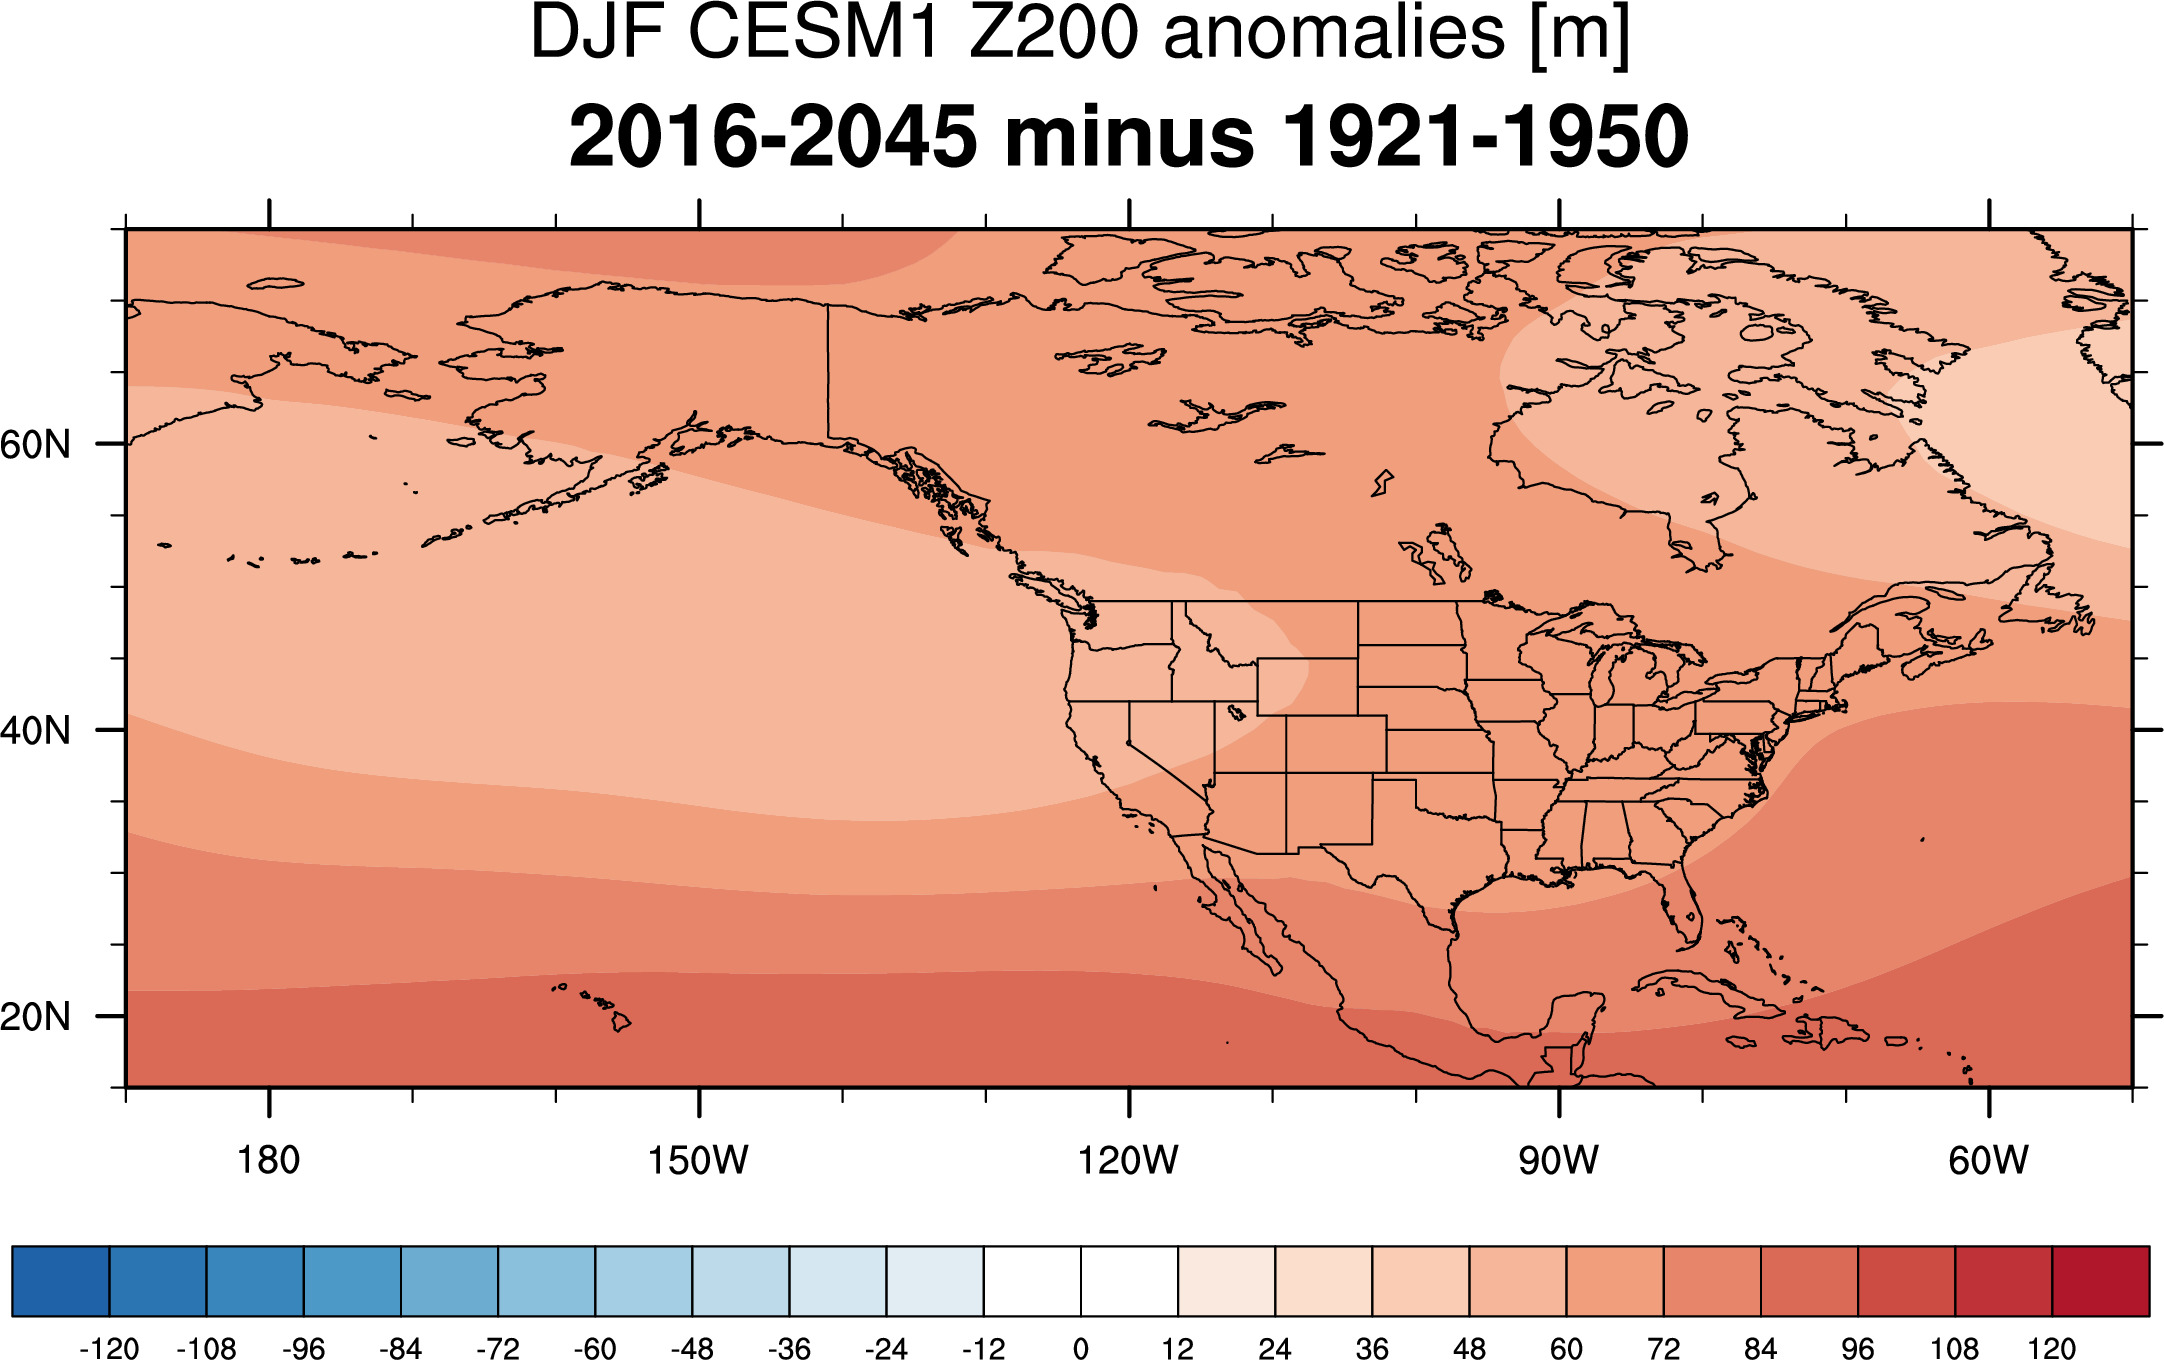
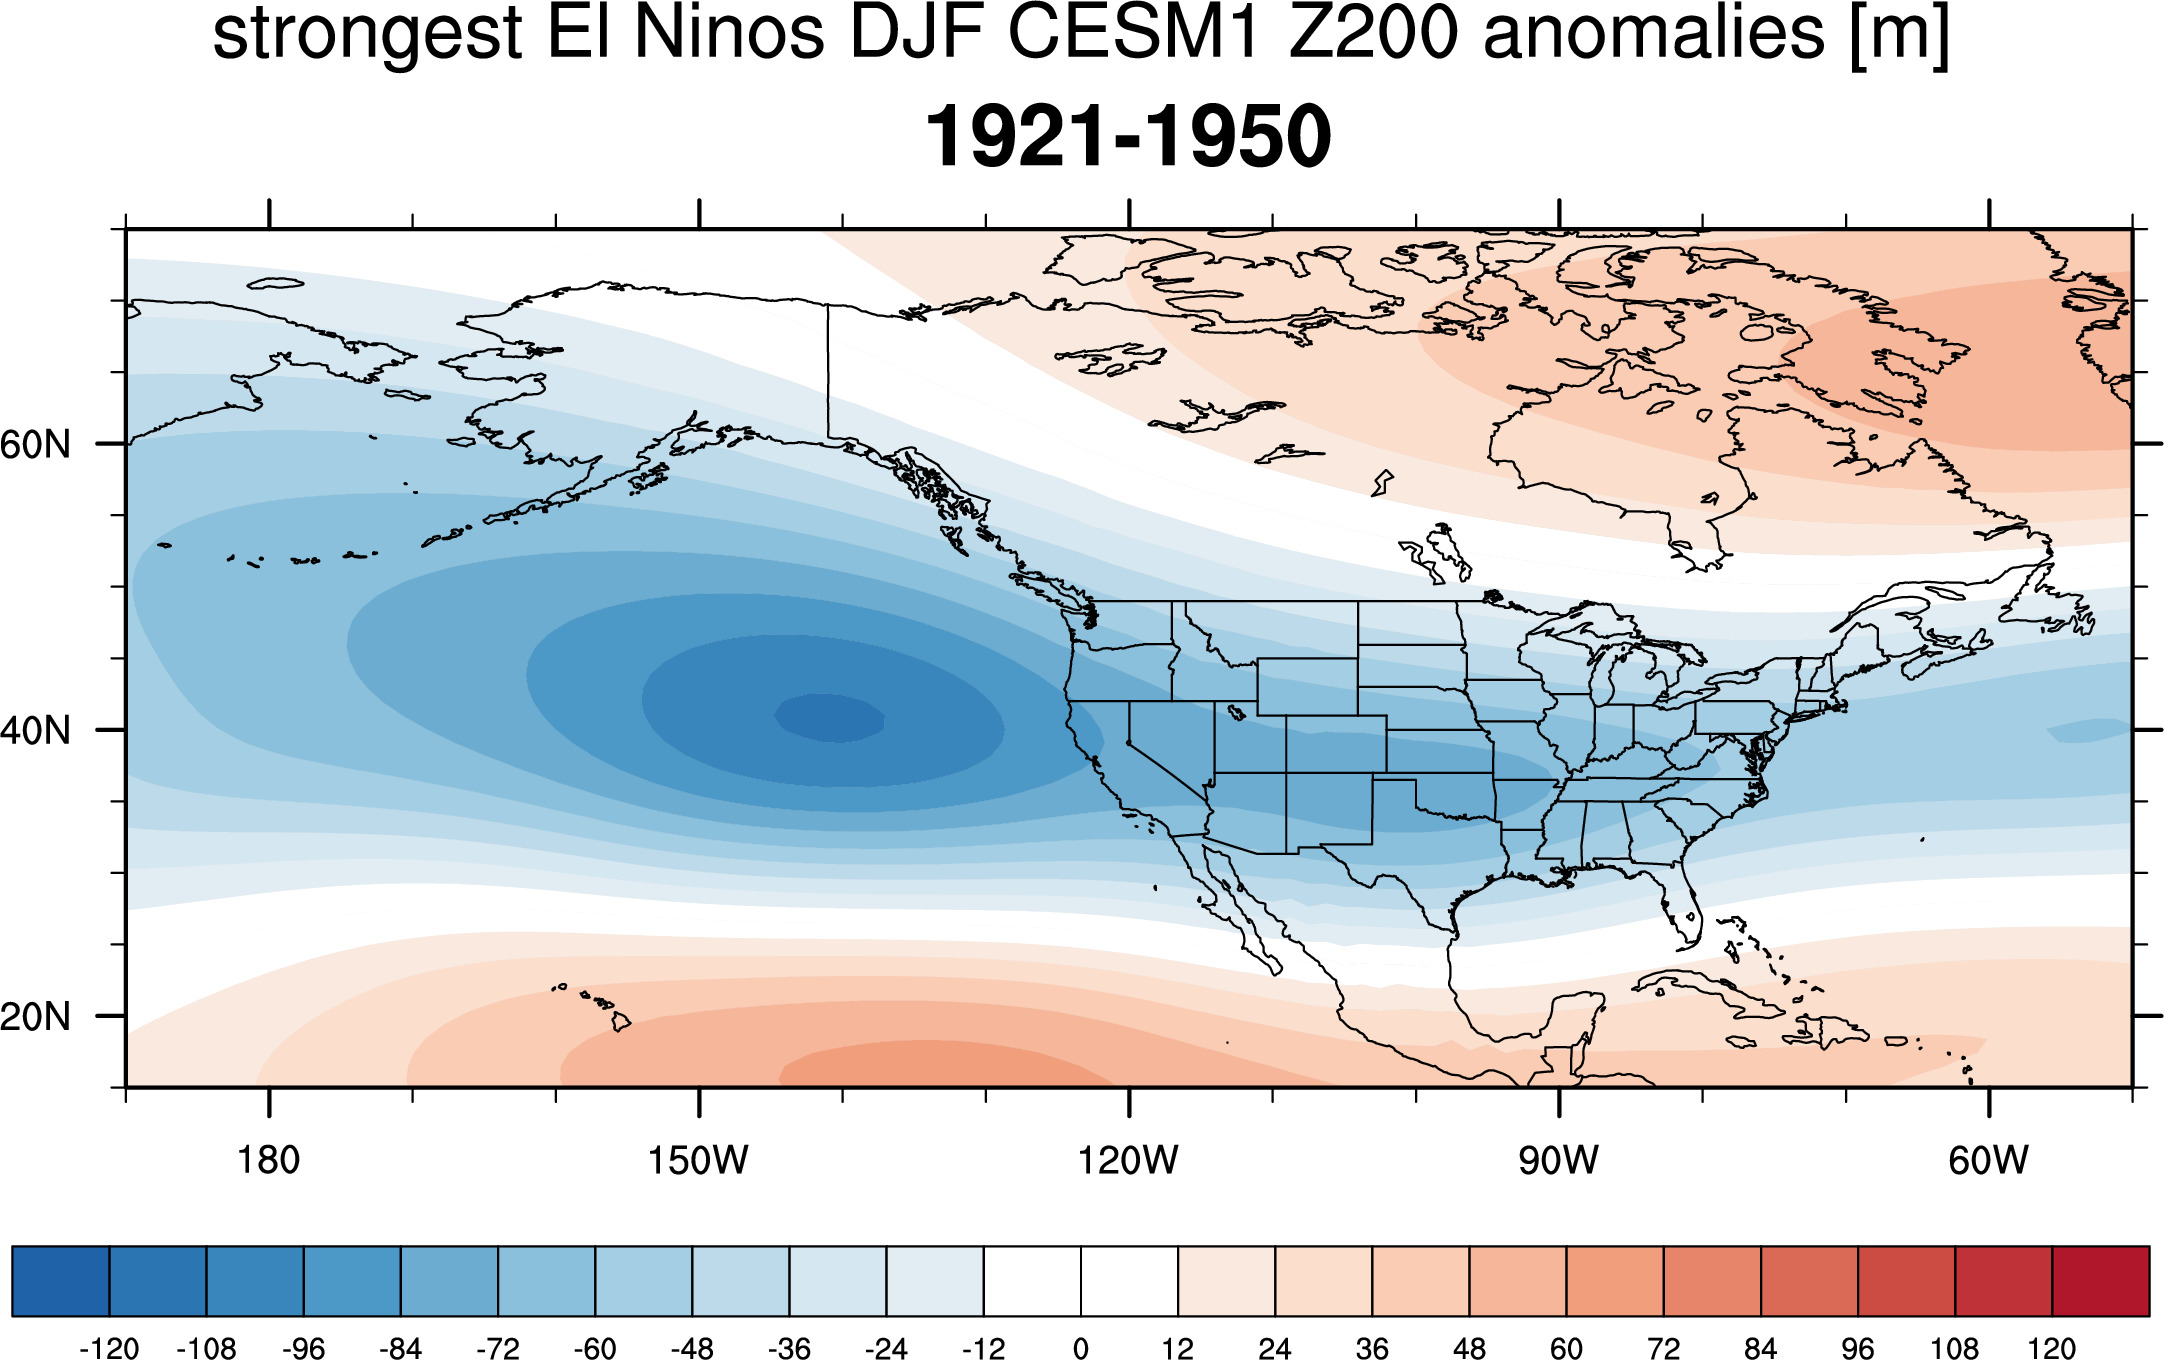
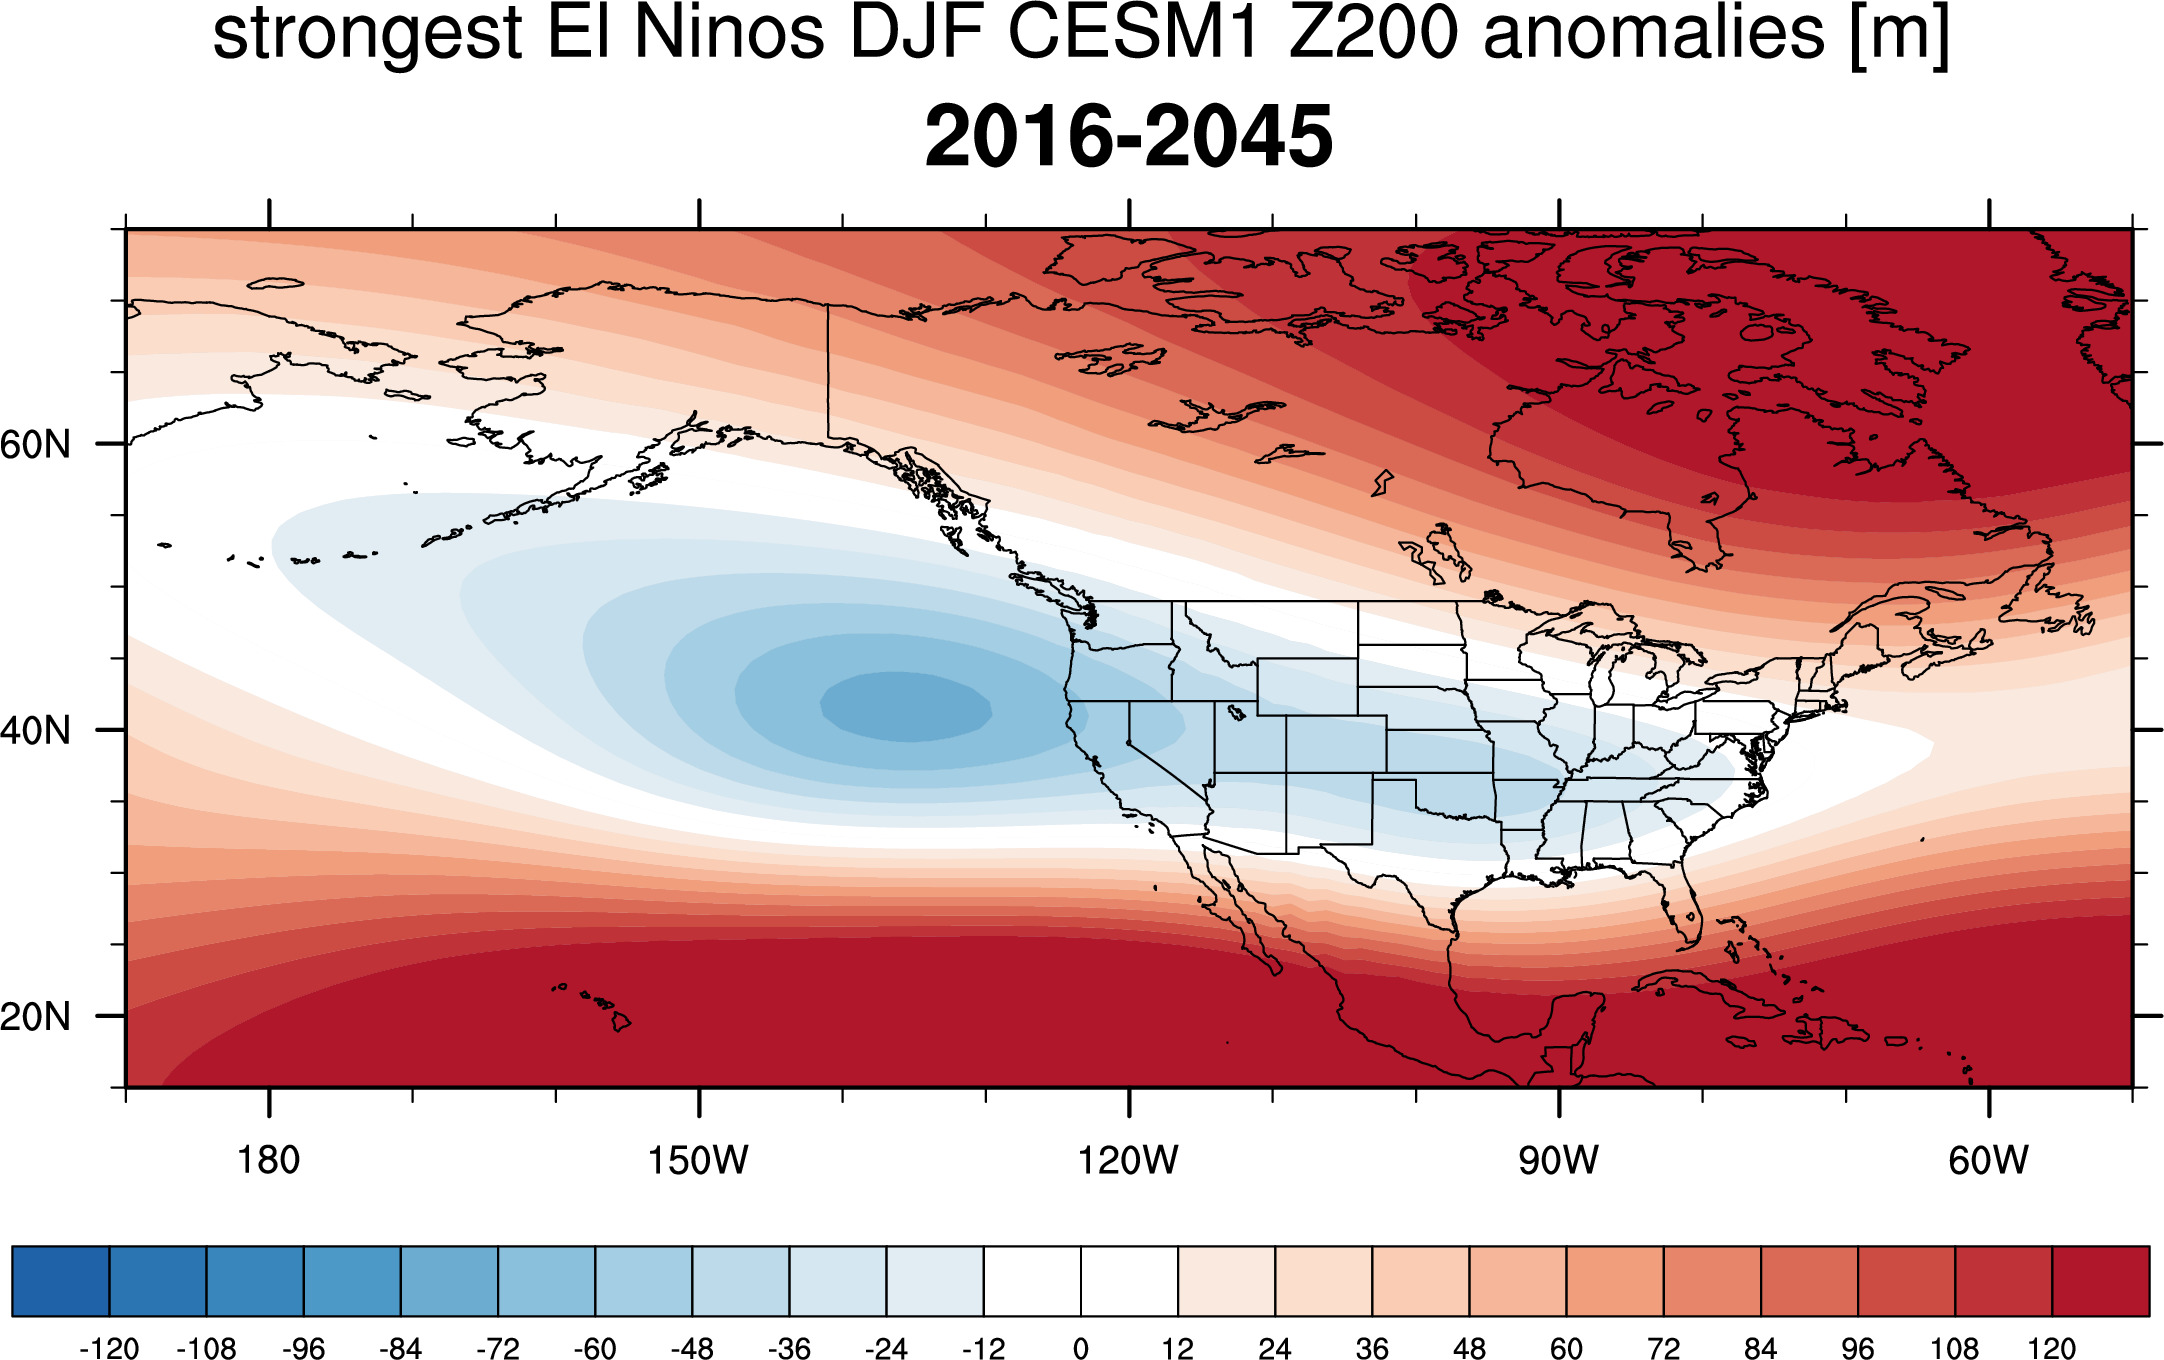
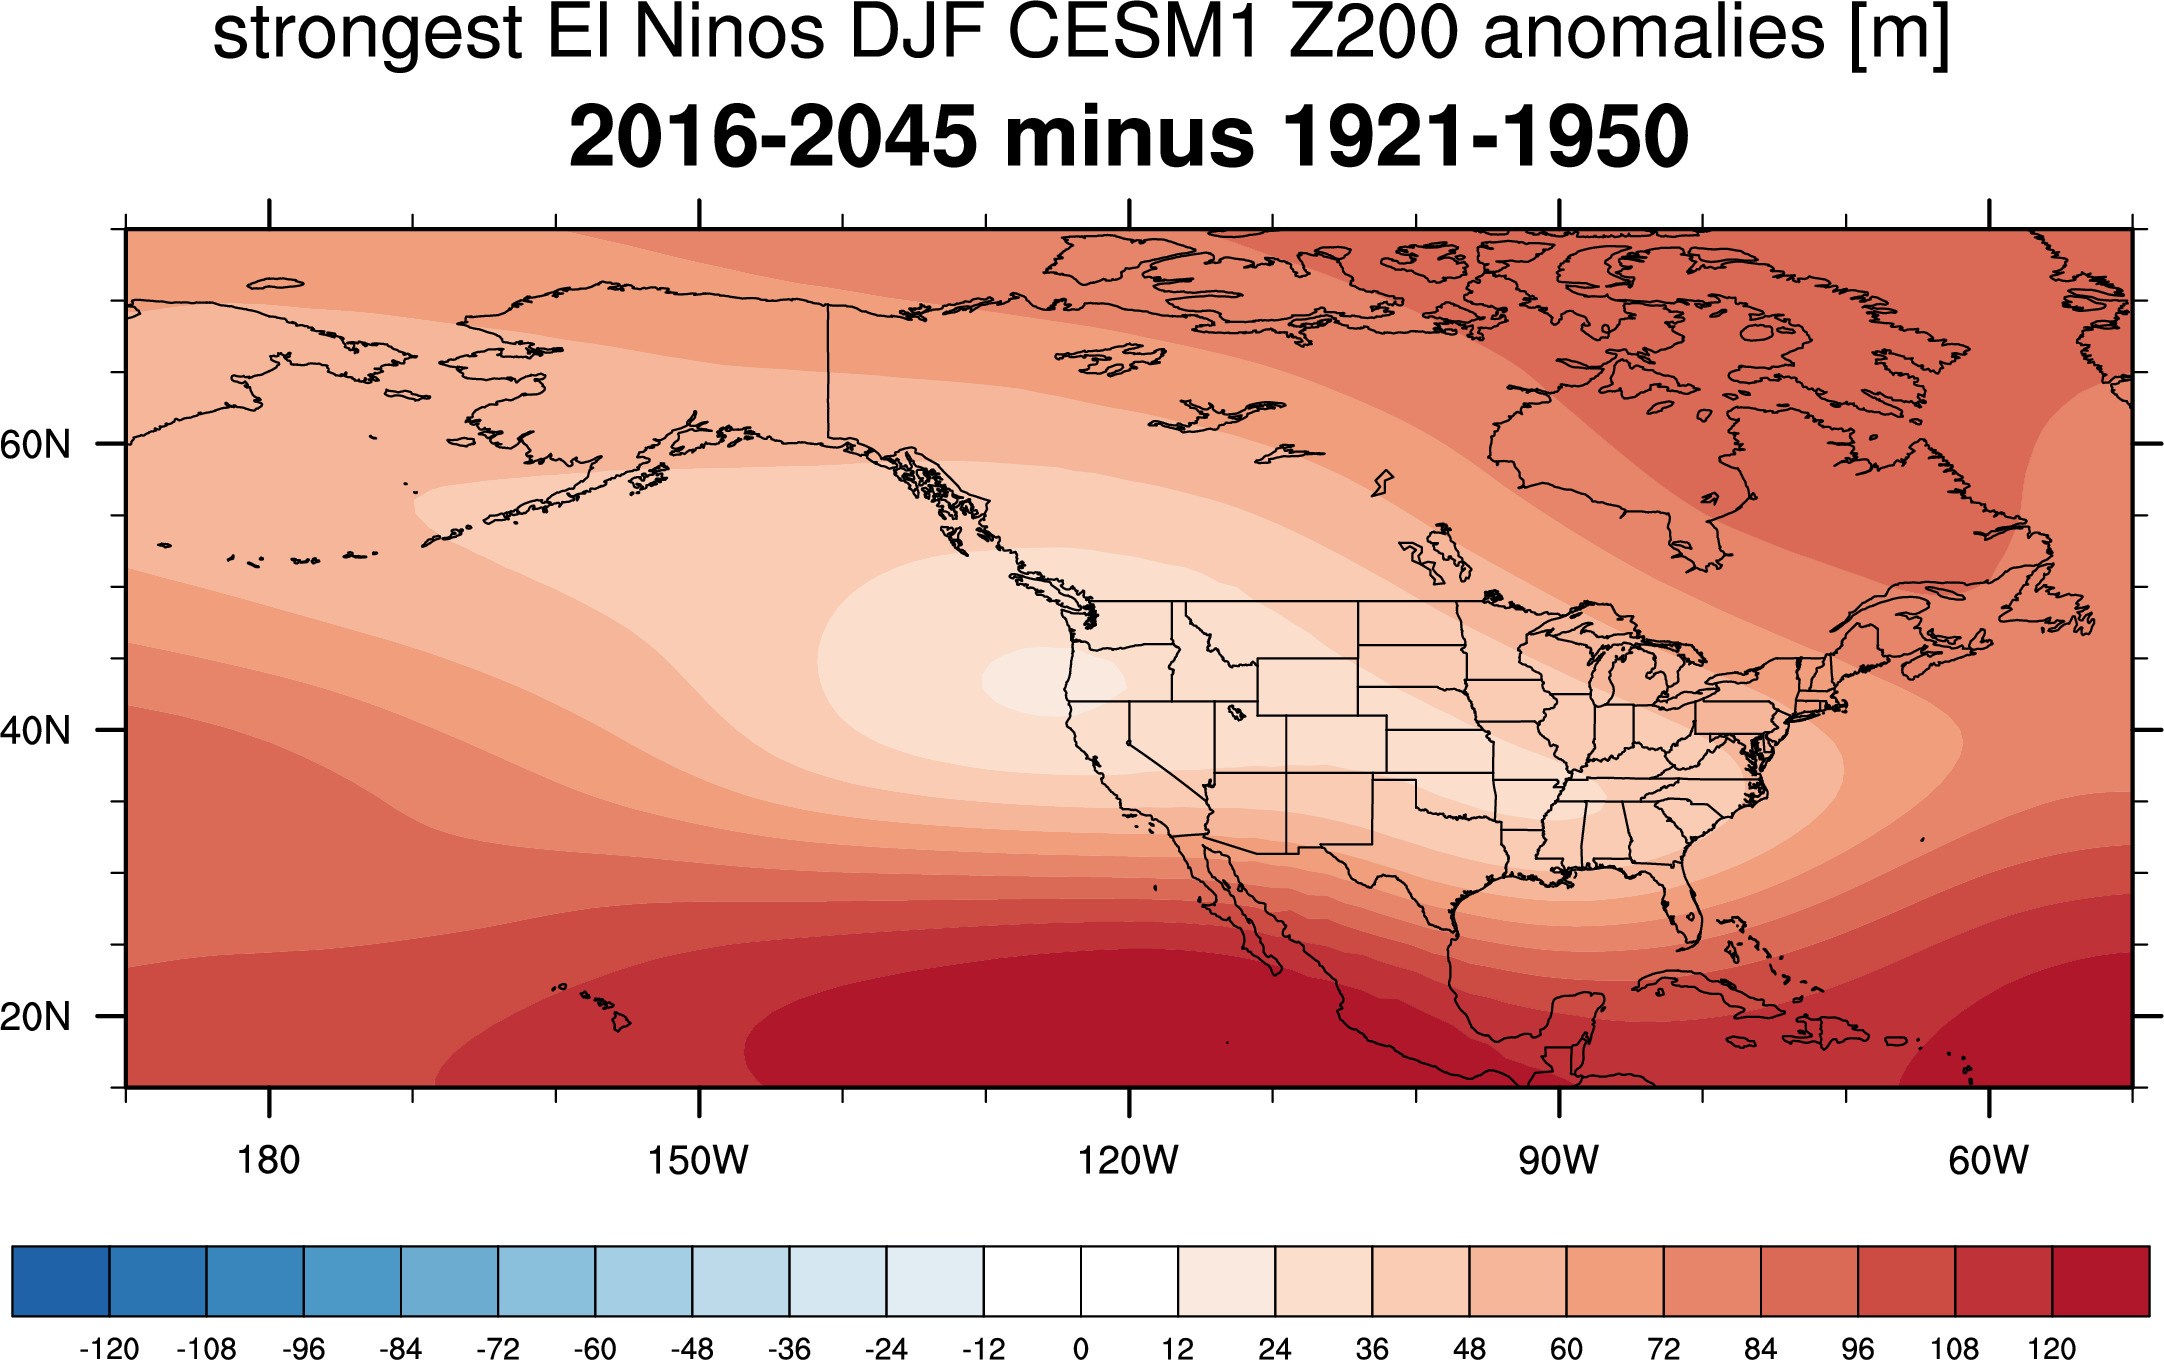
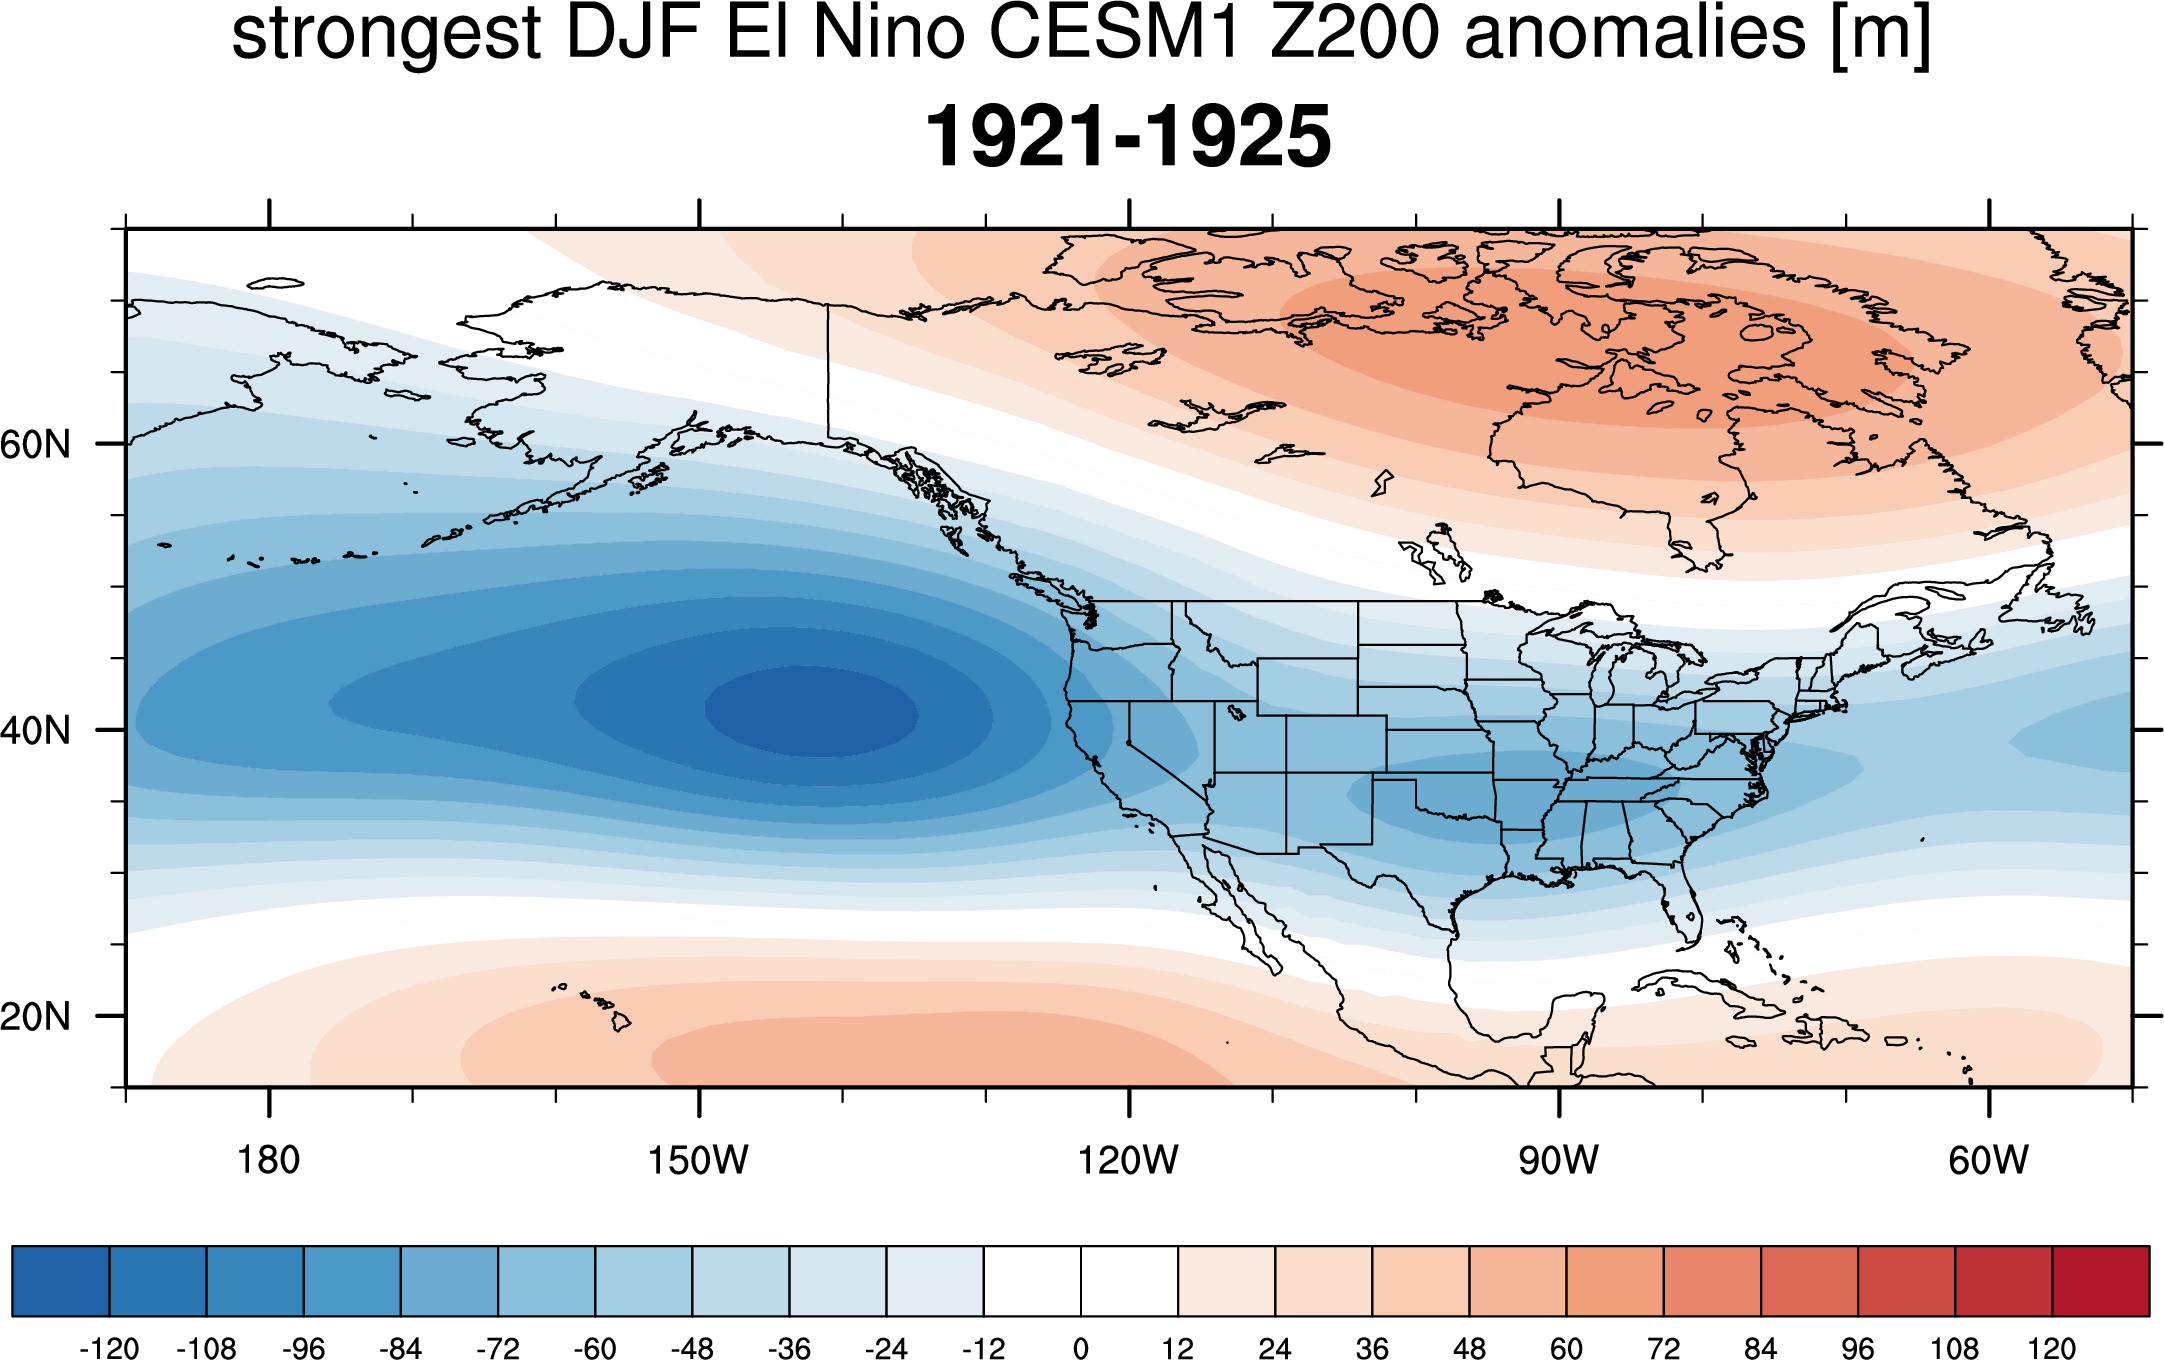
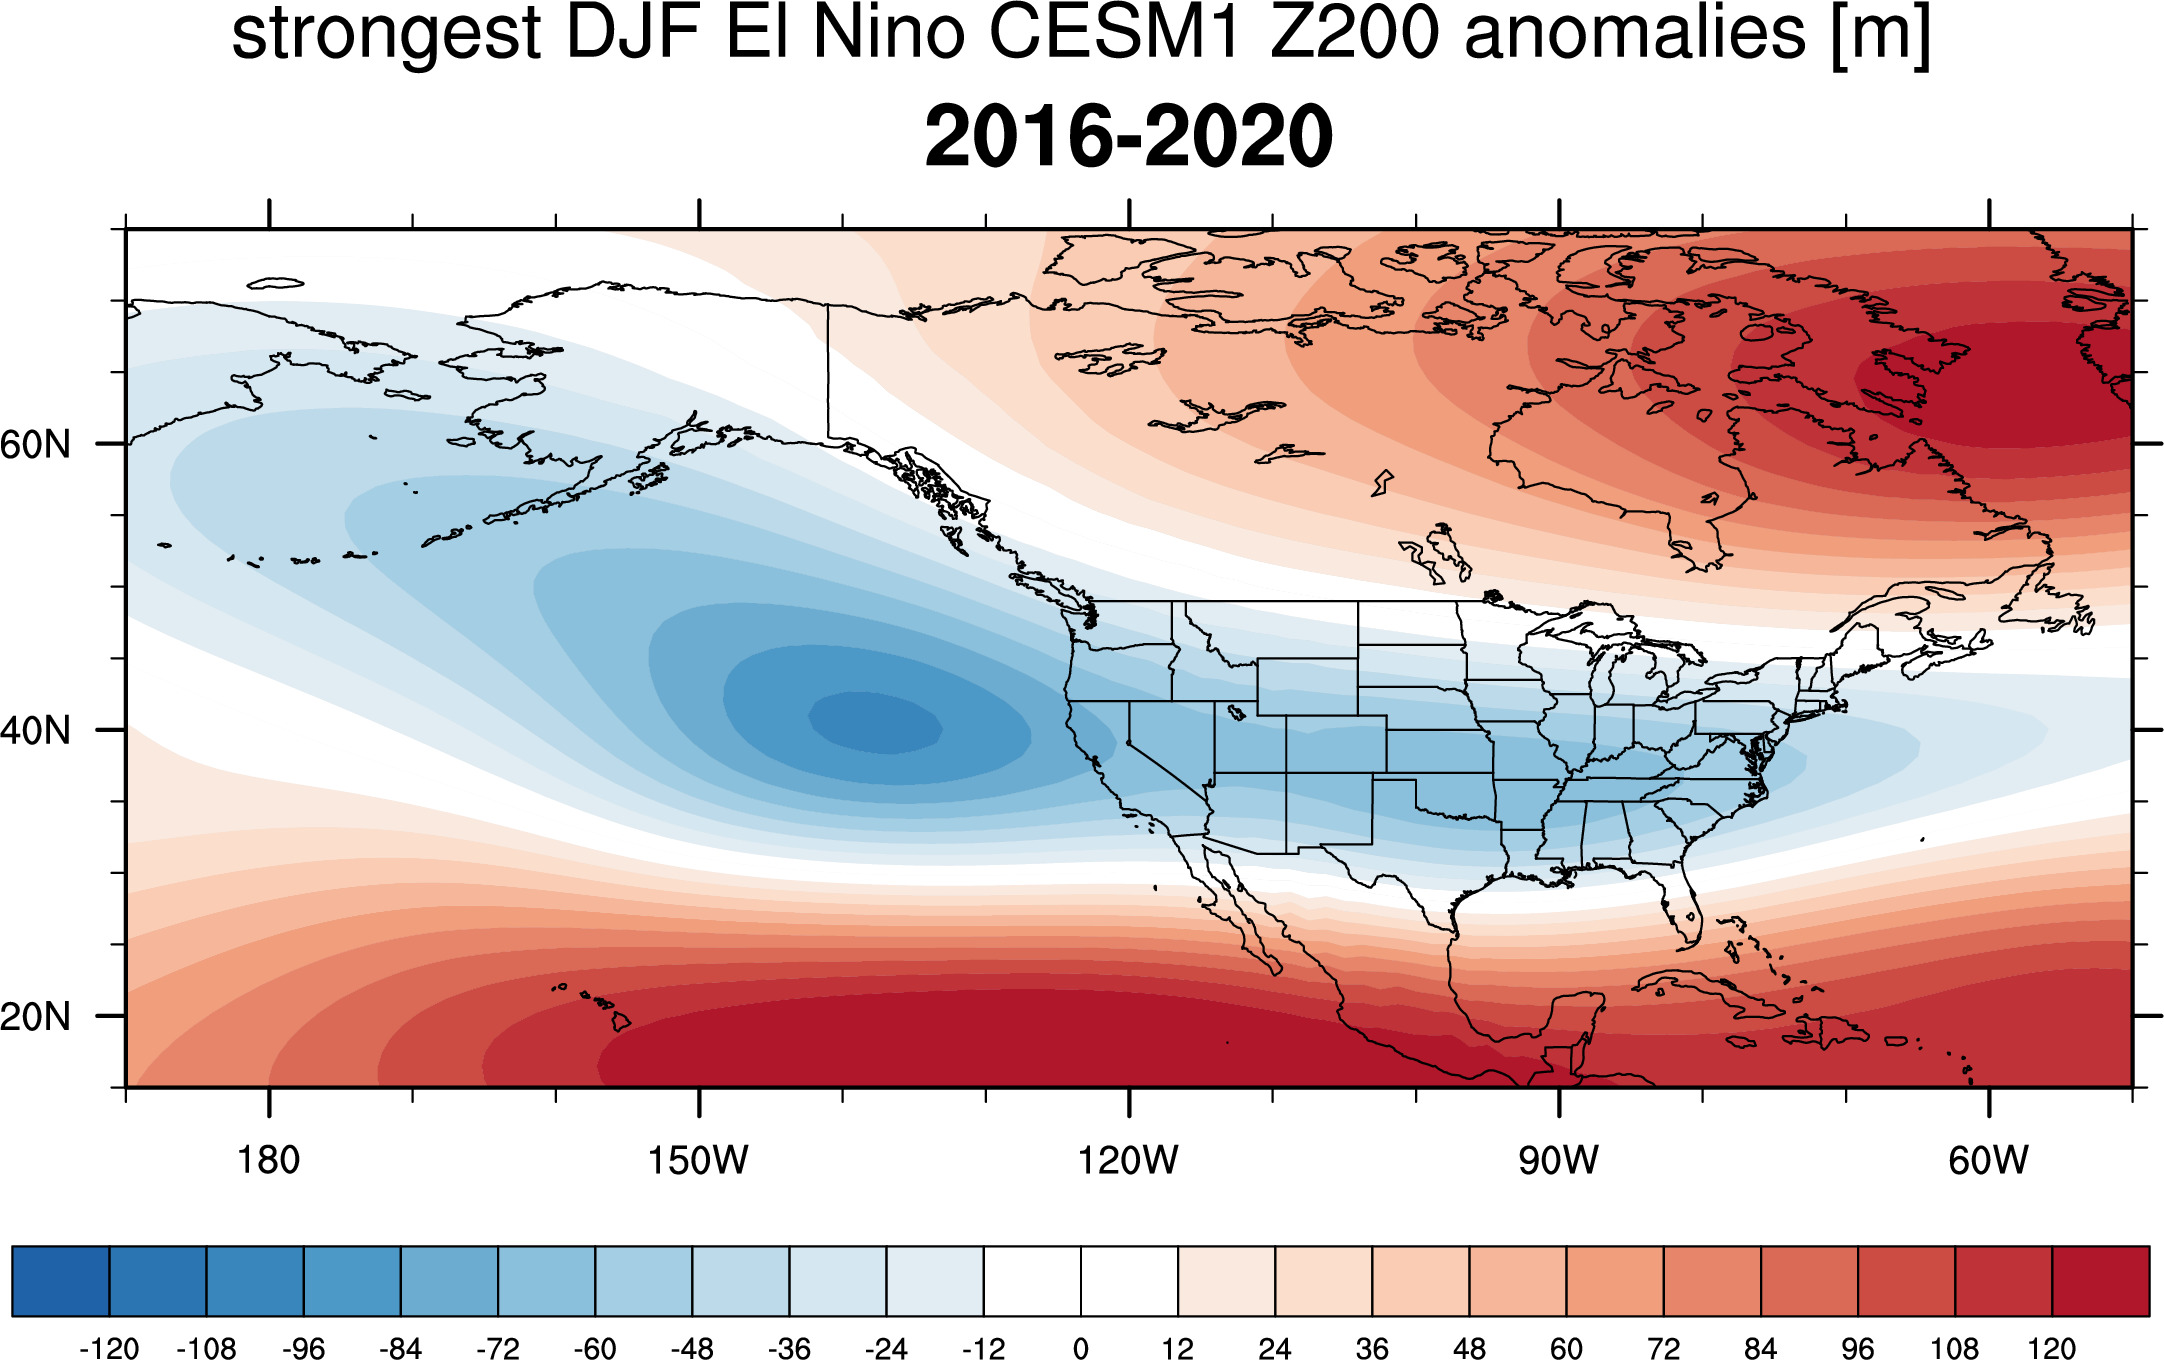
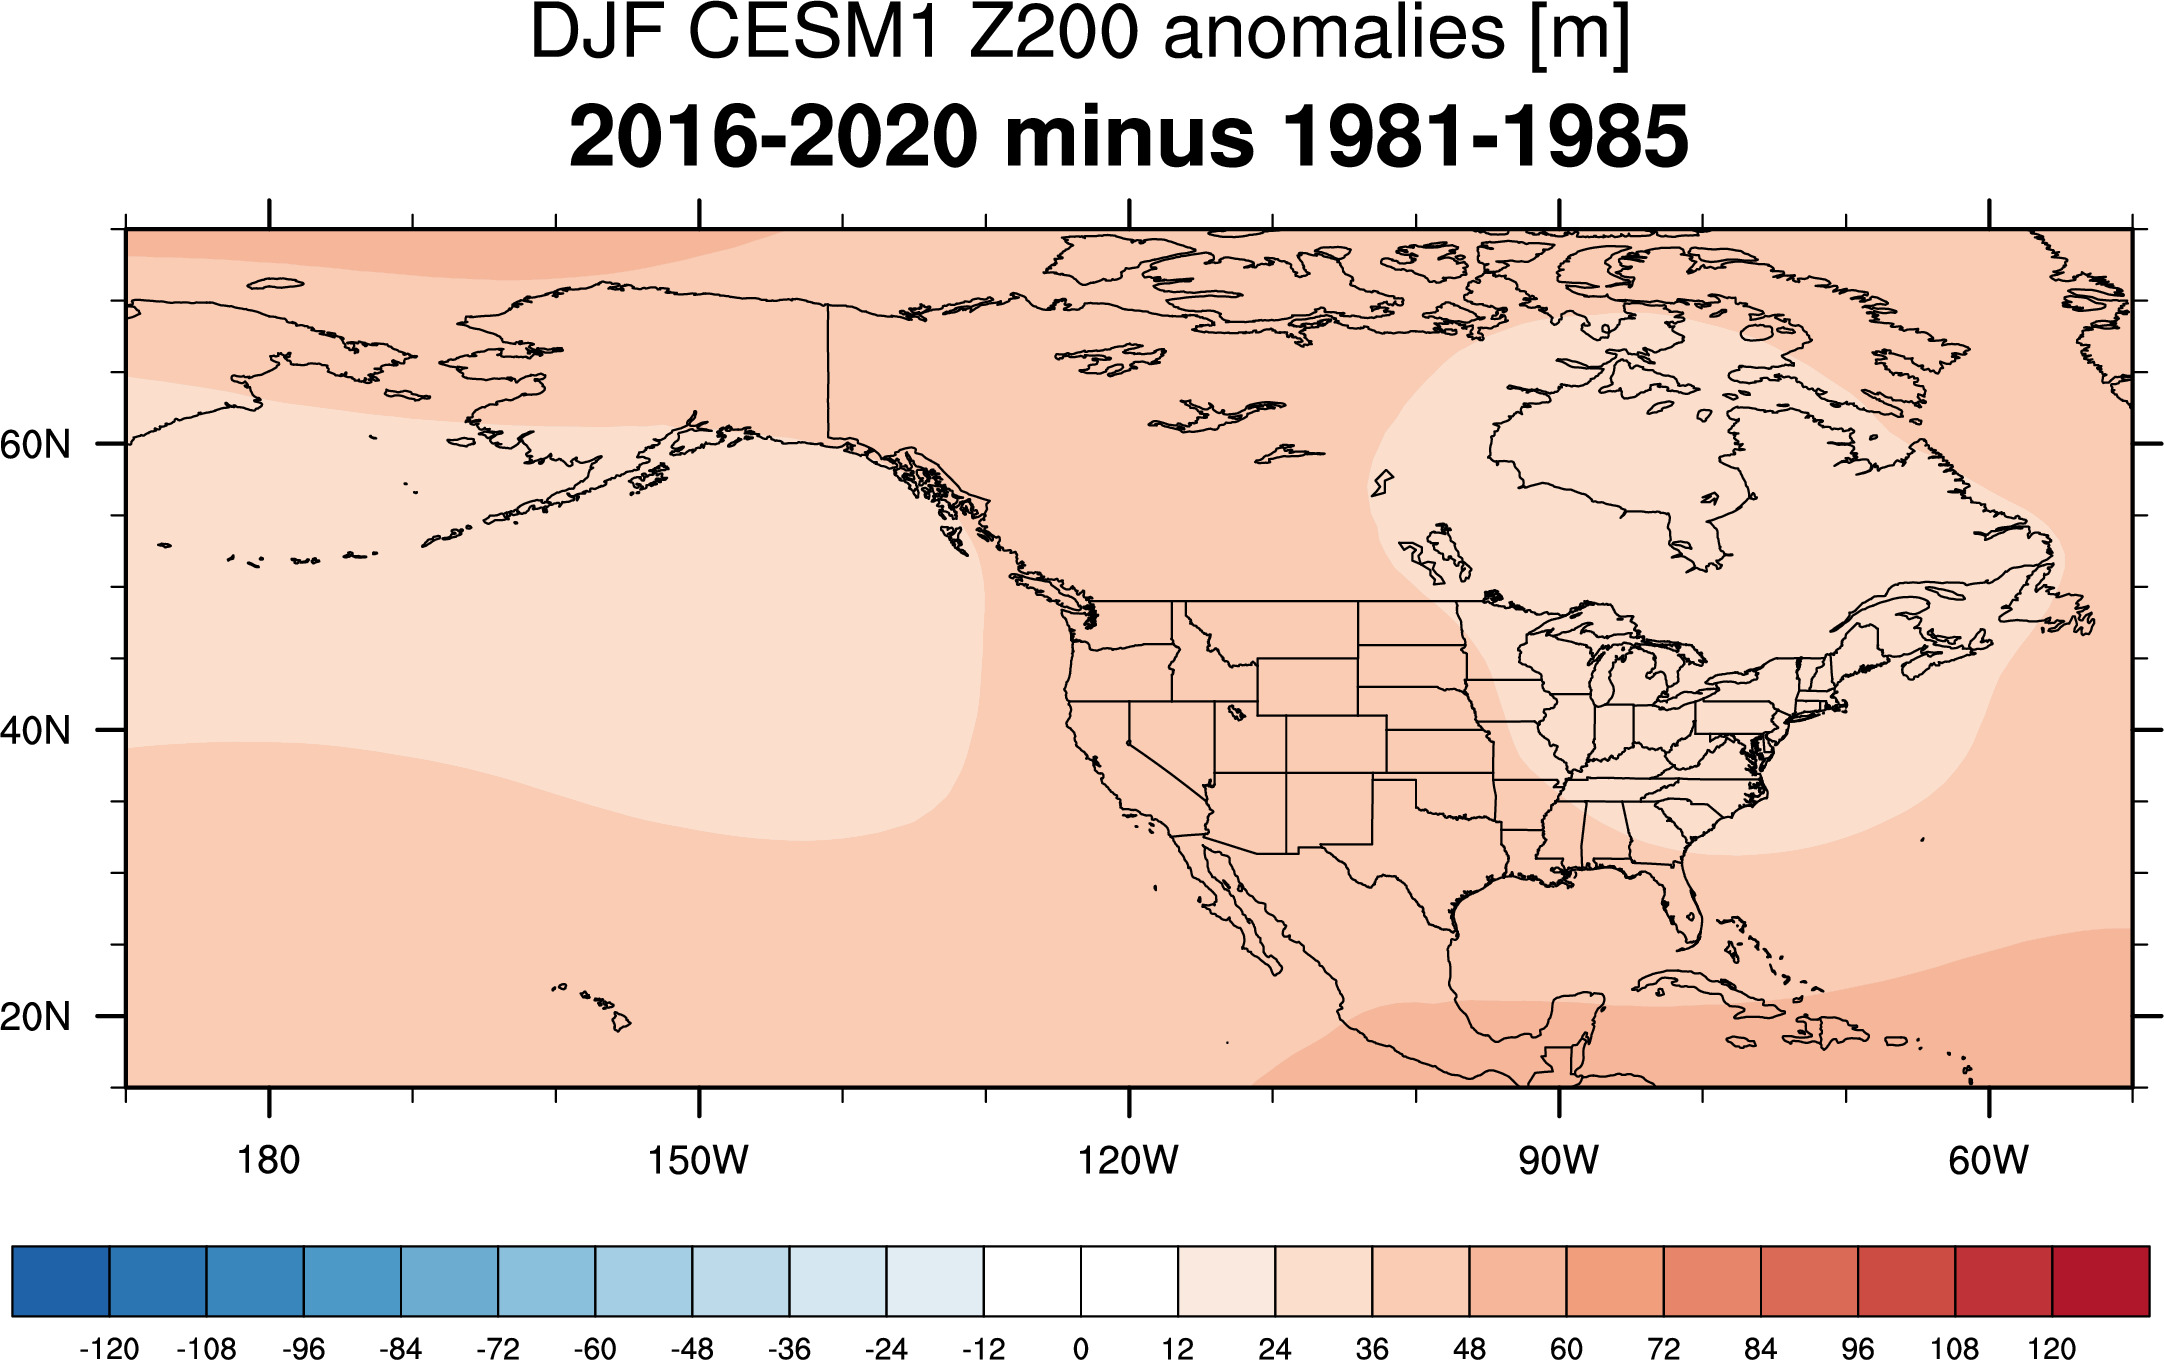
Z200 Anomaly Maps
All years:
Strongest El Ninos:
-------------------------------------------------------
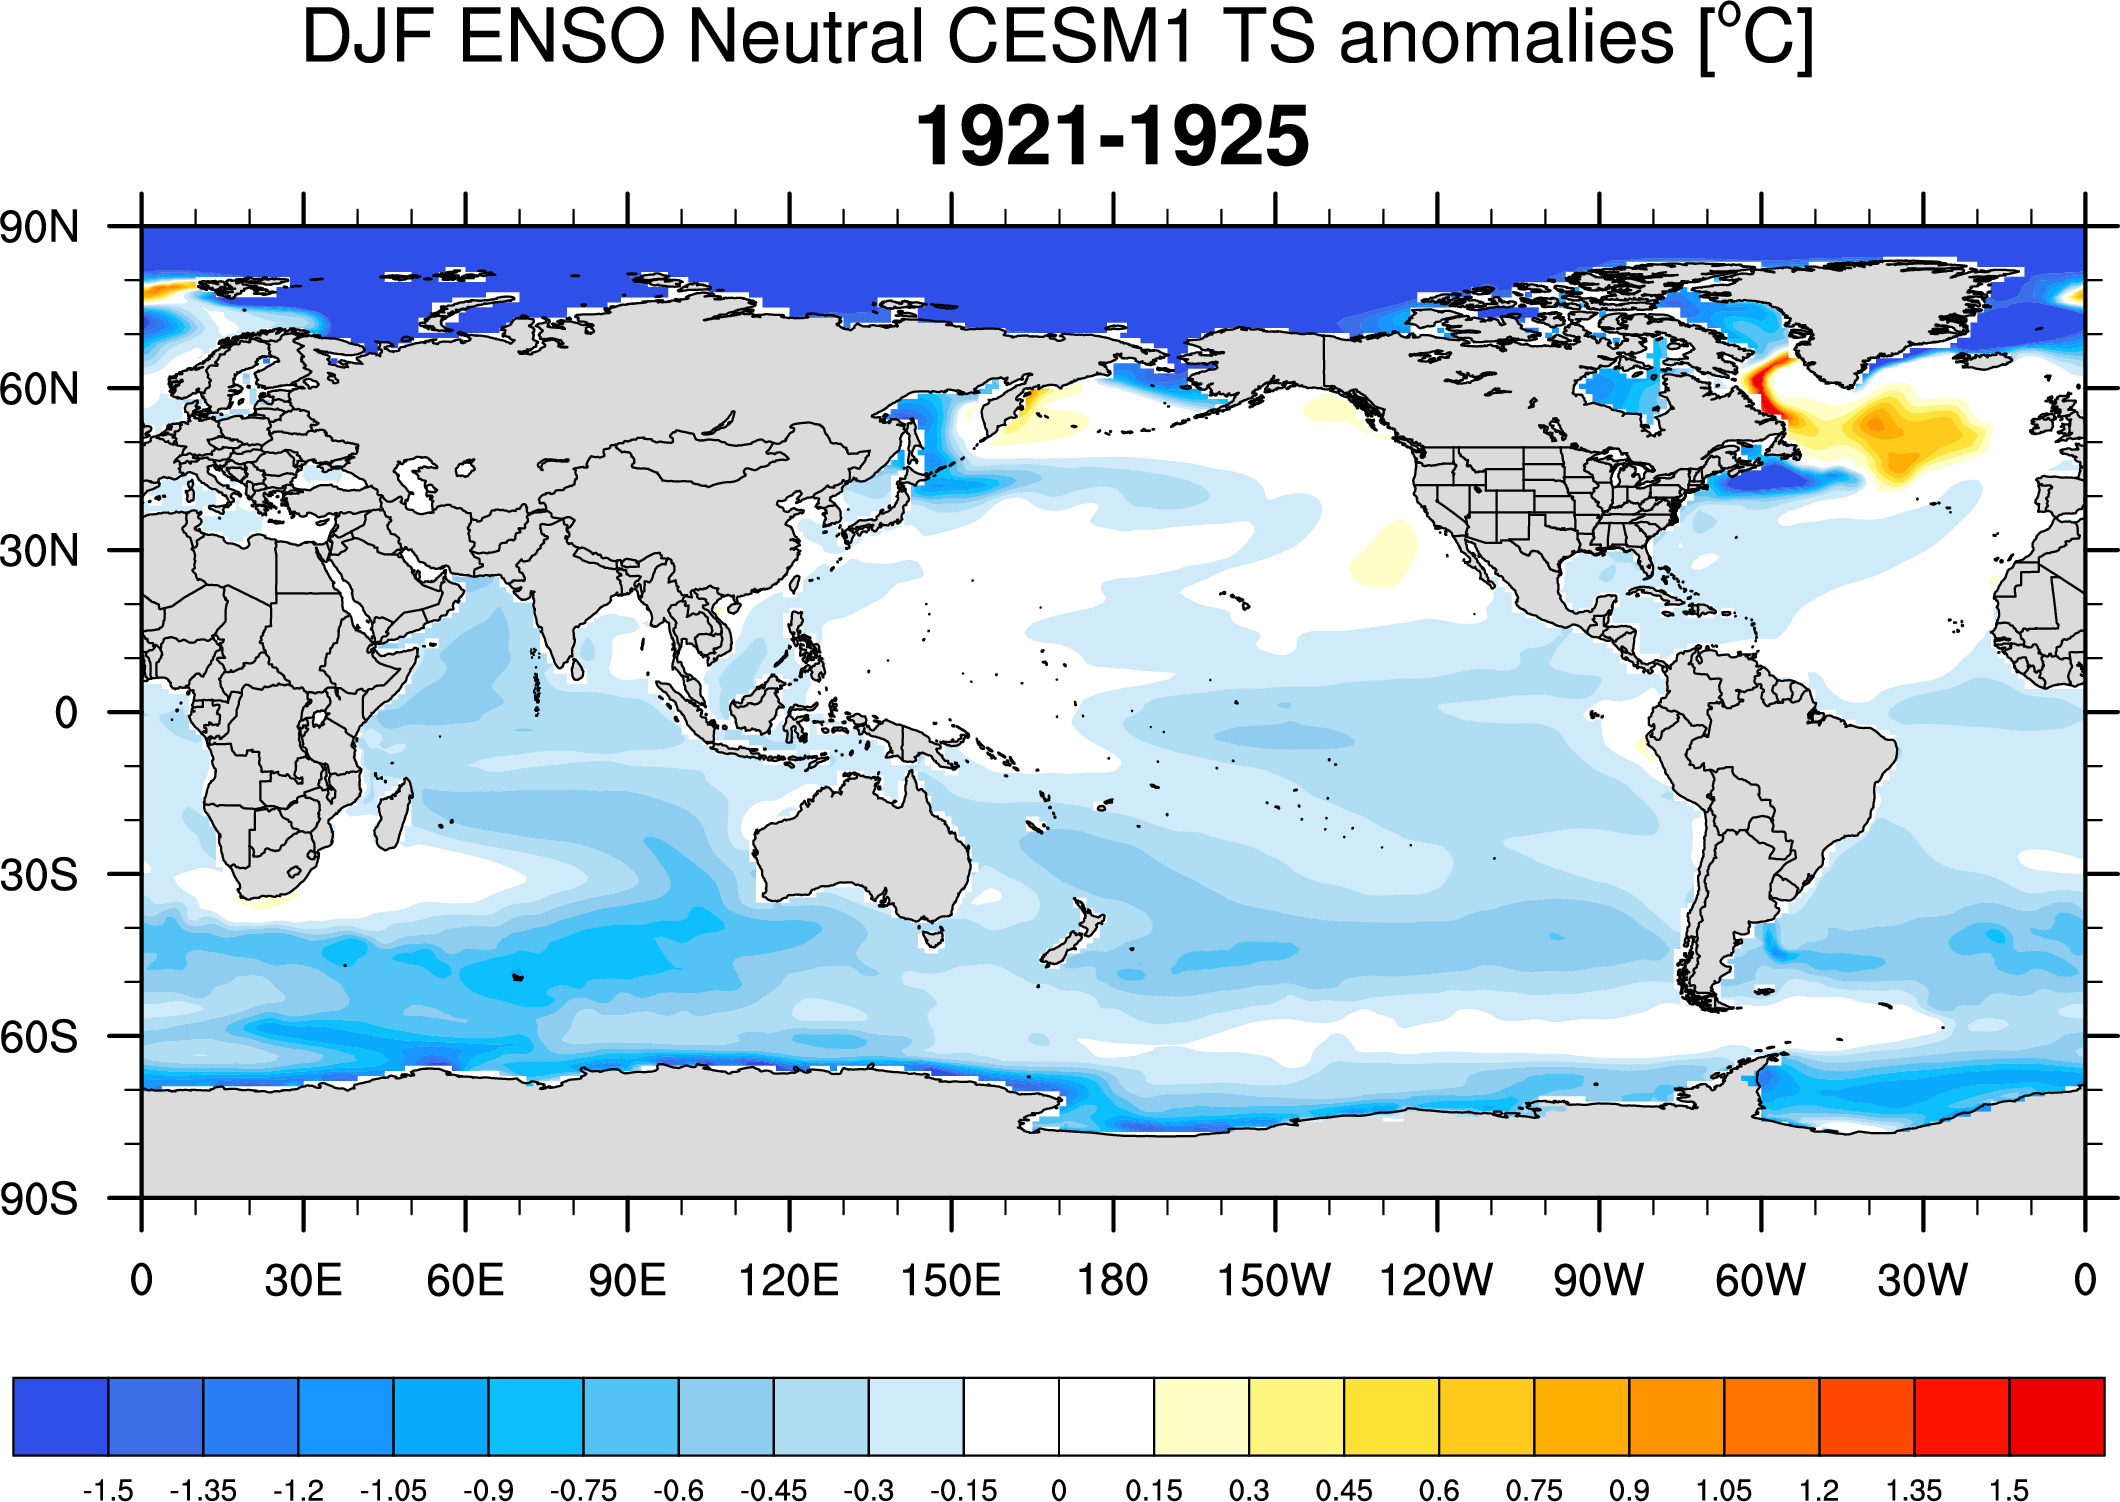
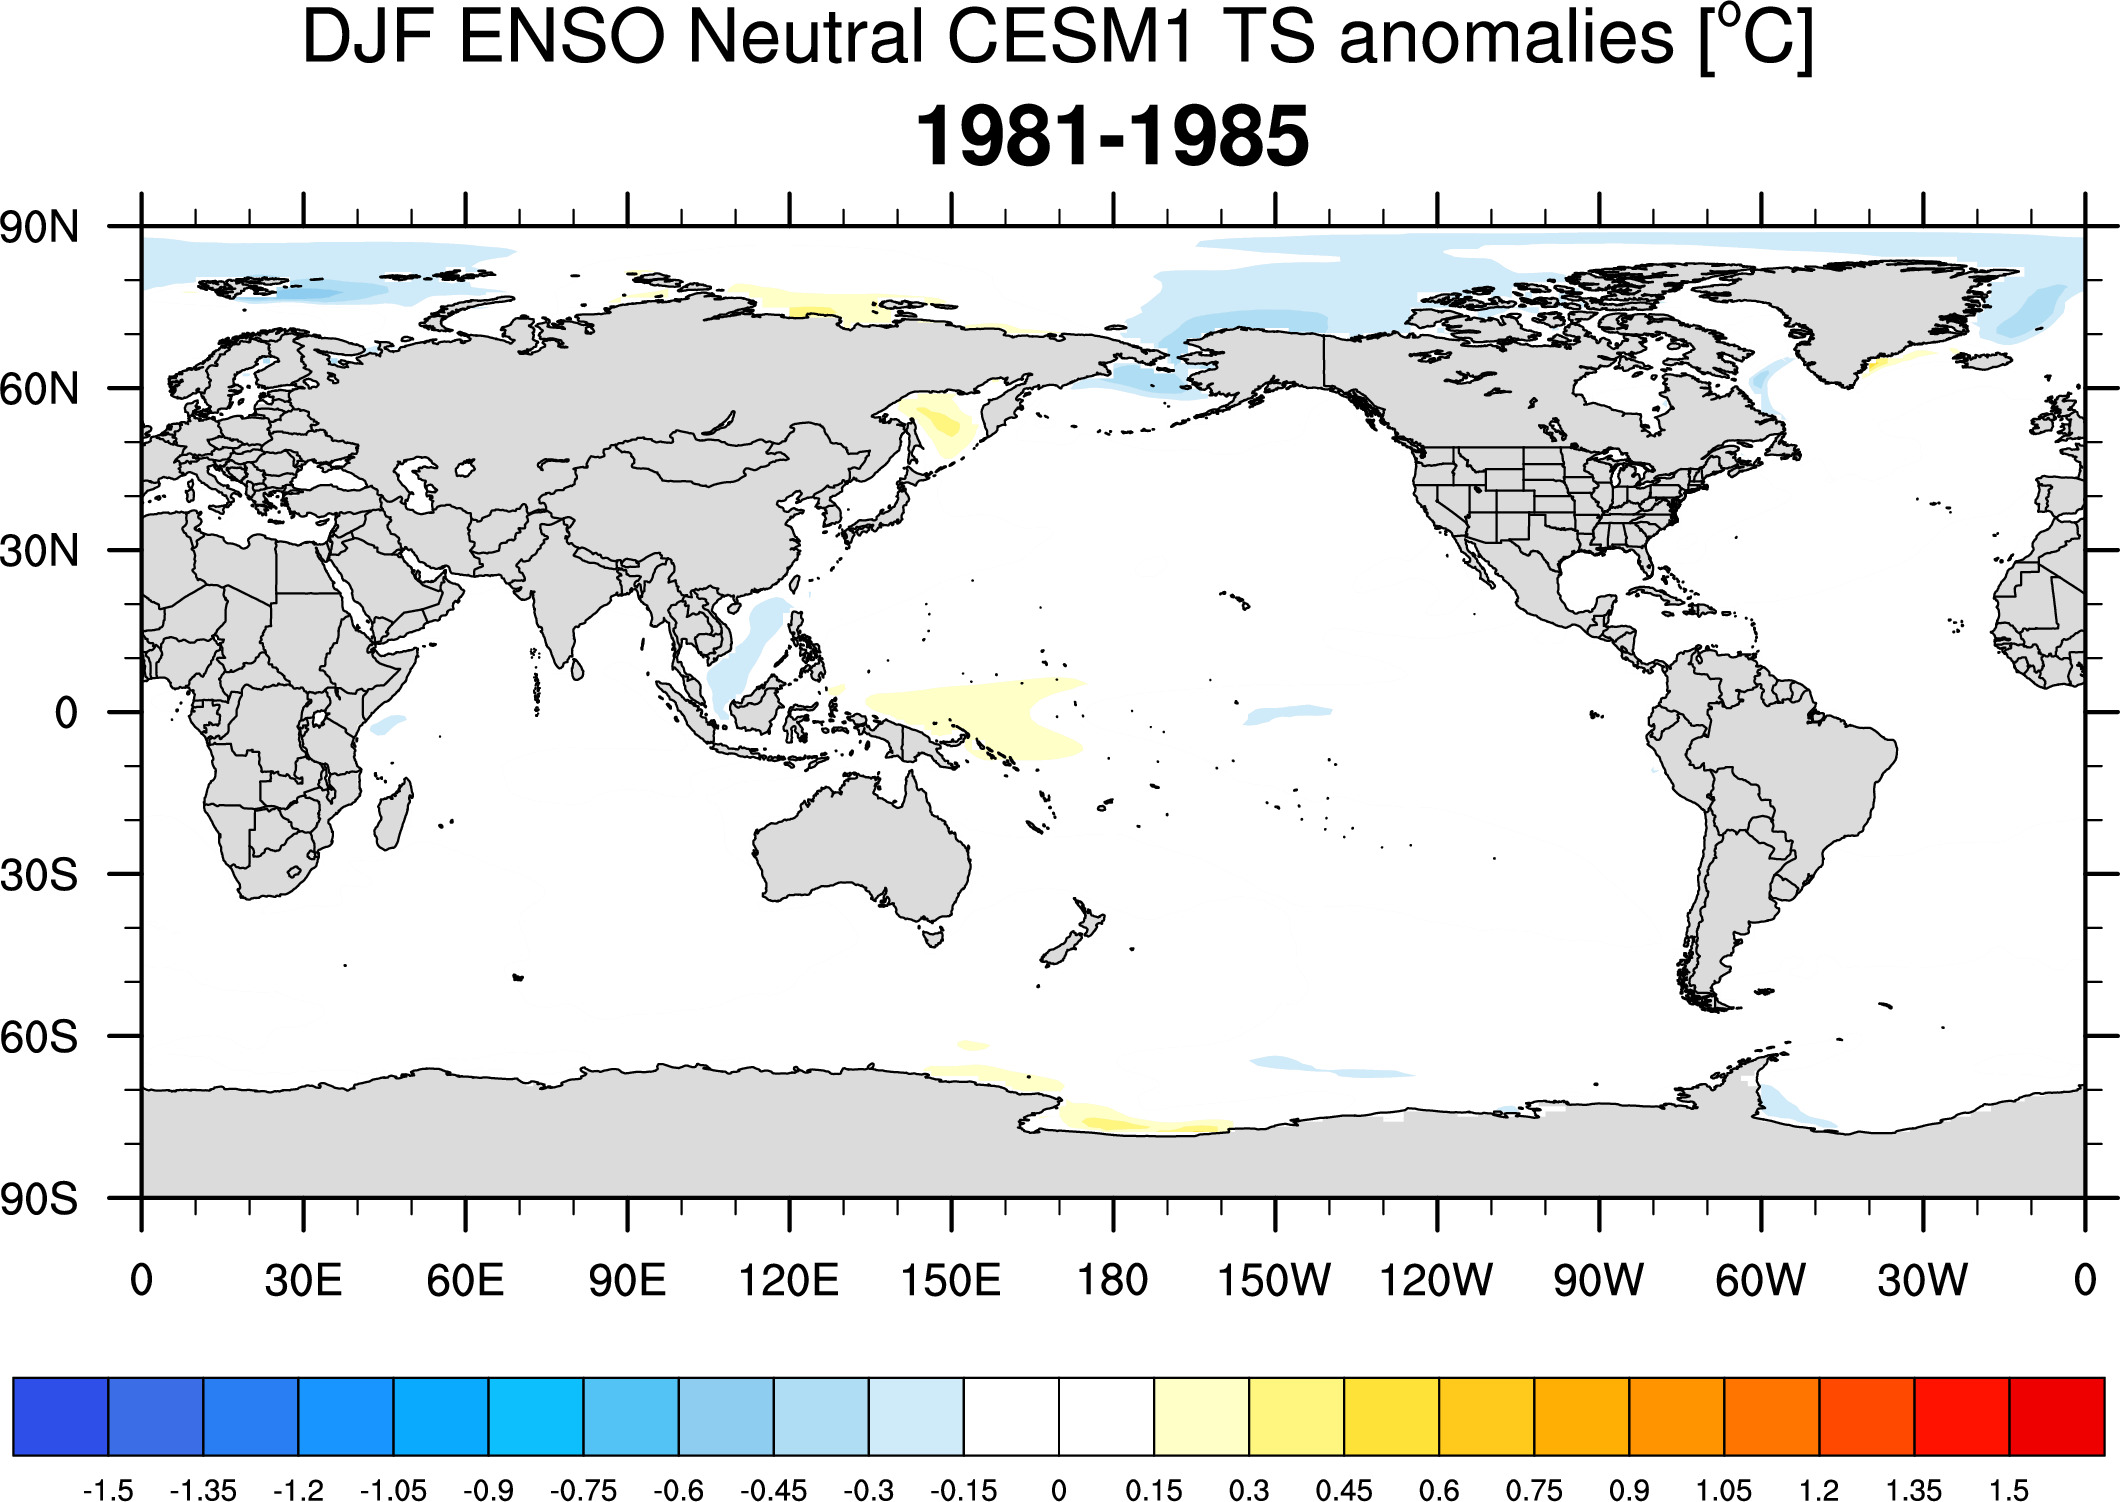
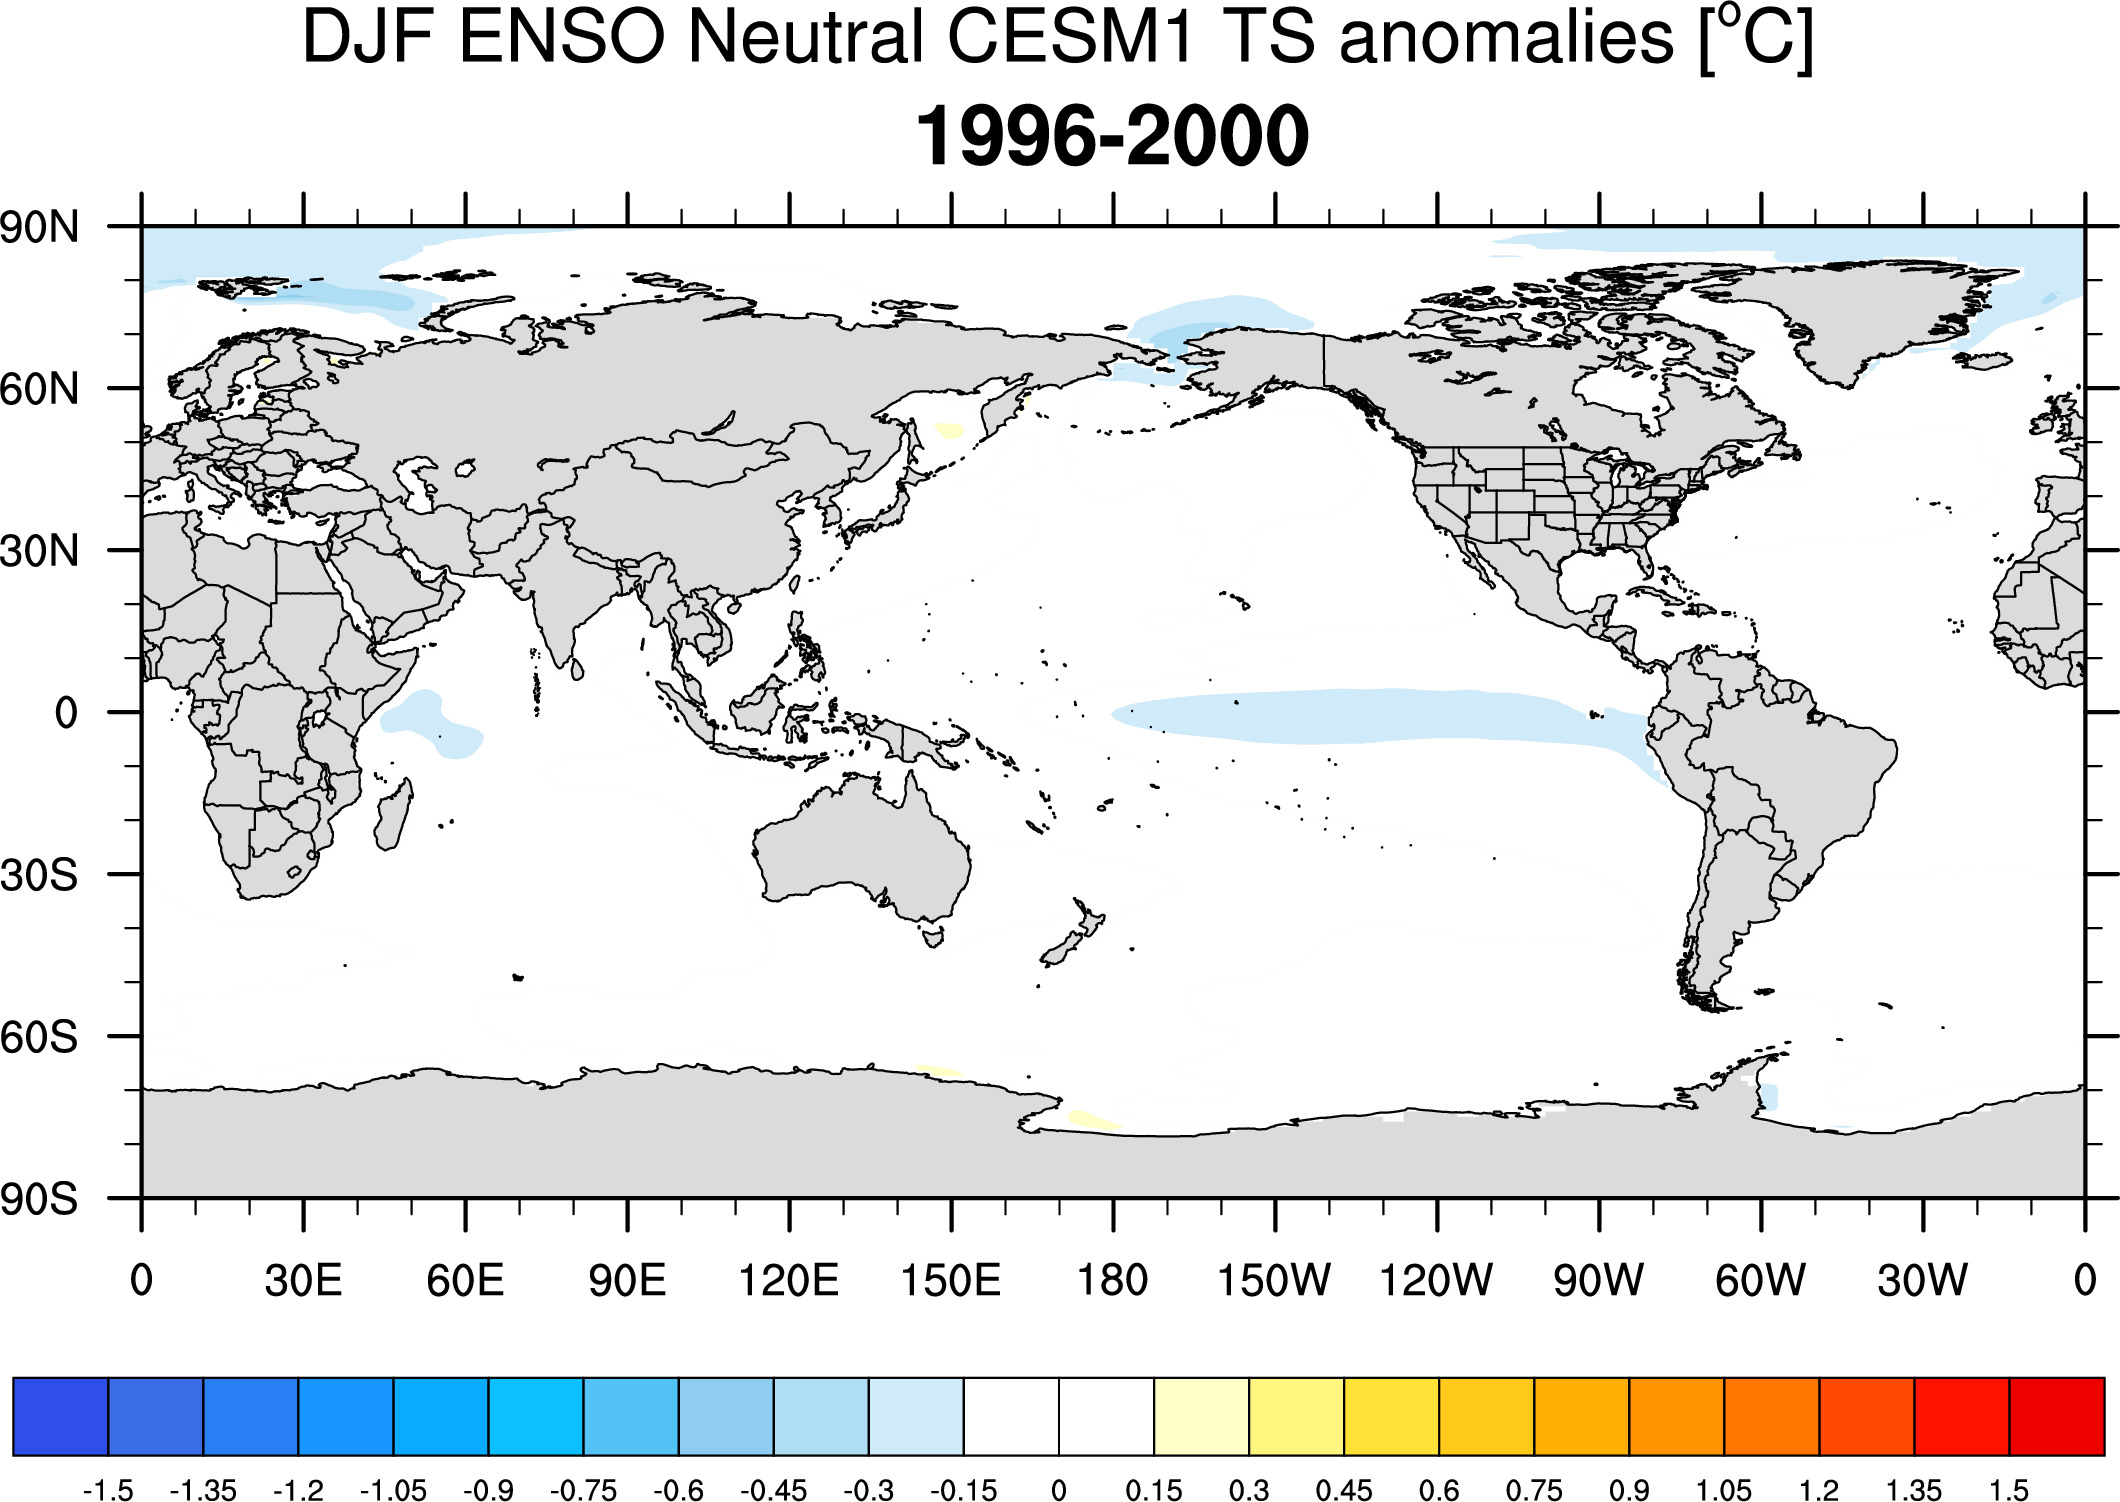
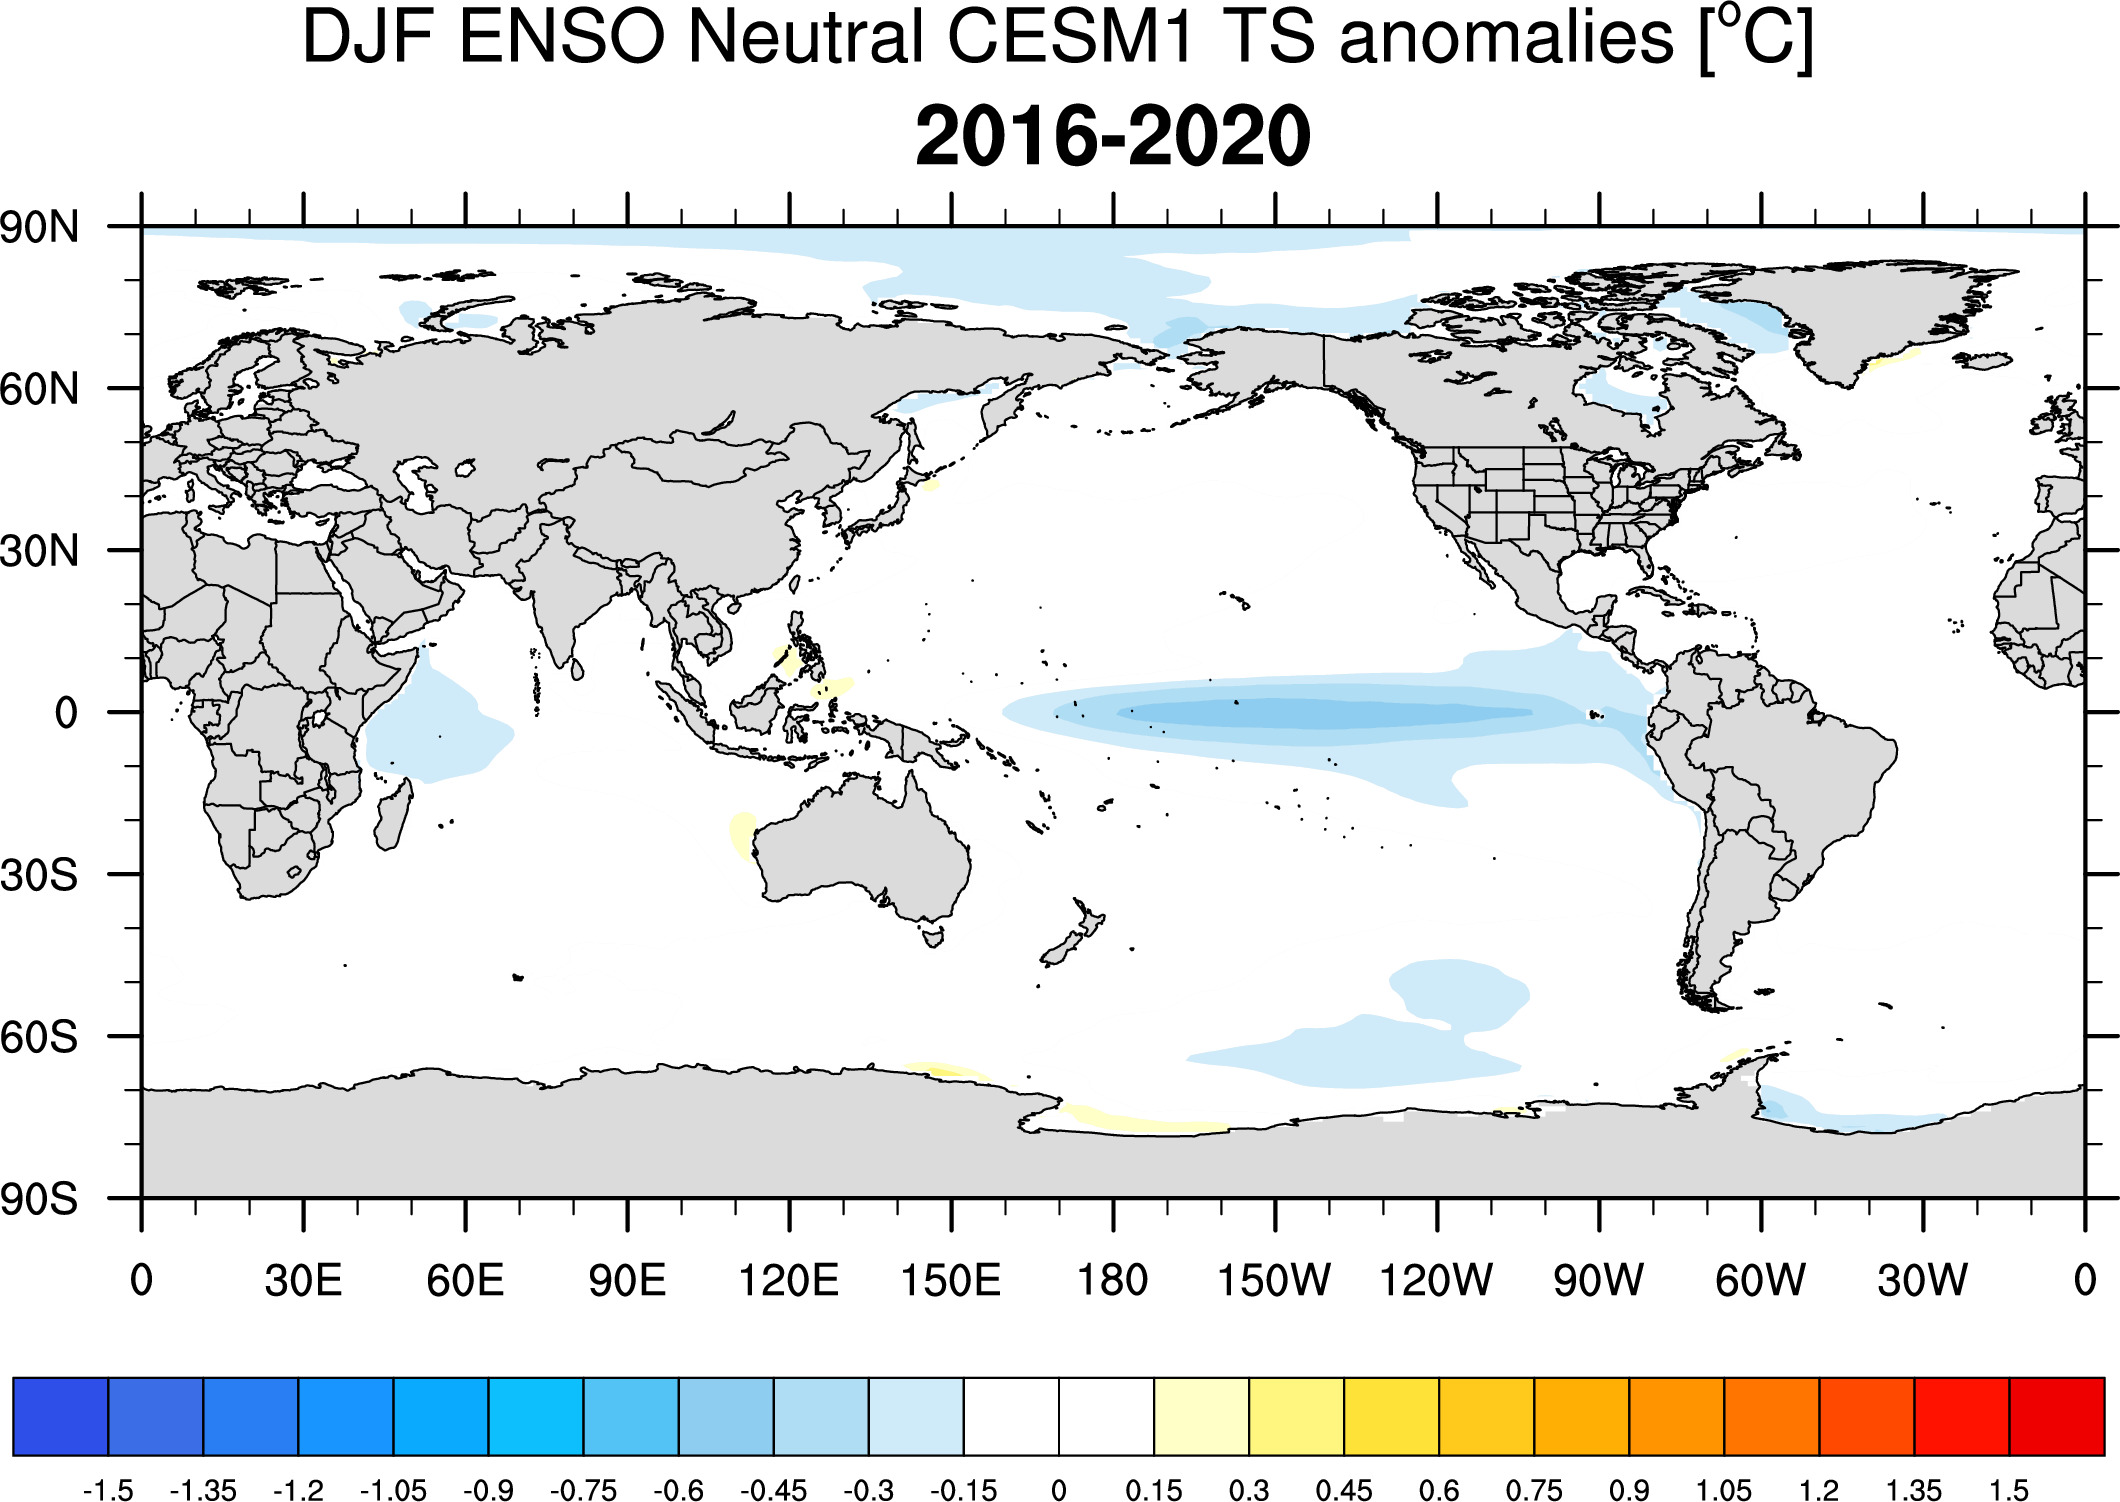
5 year periods
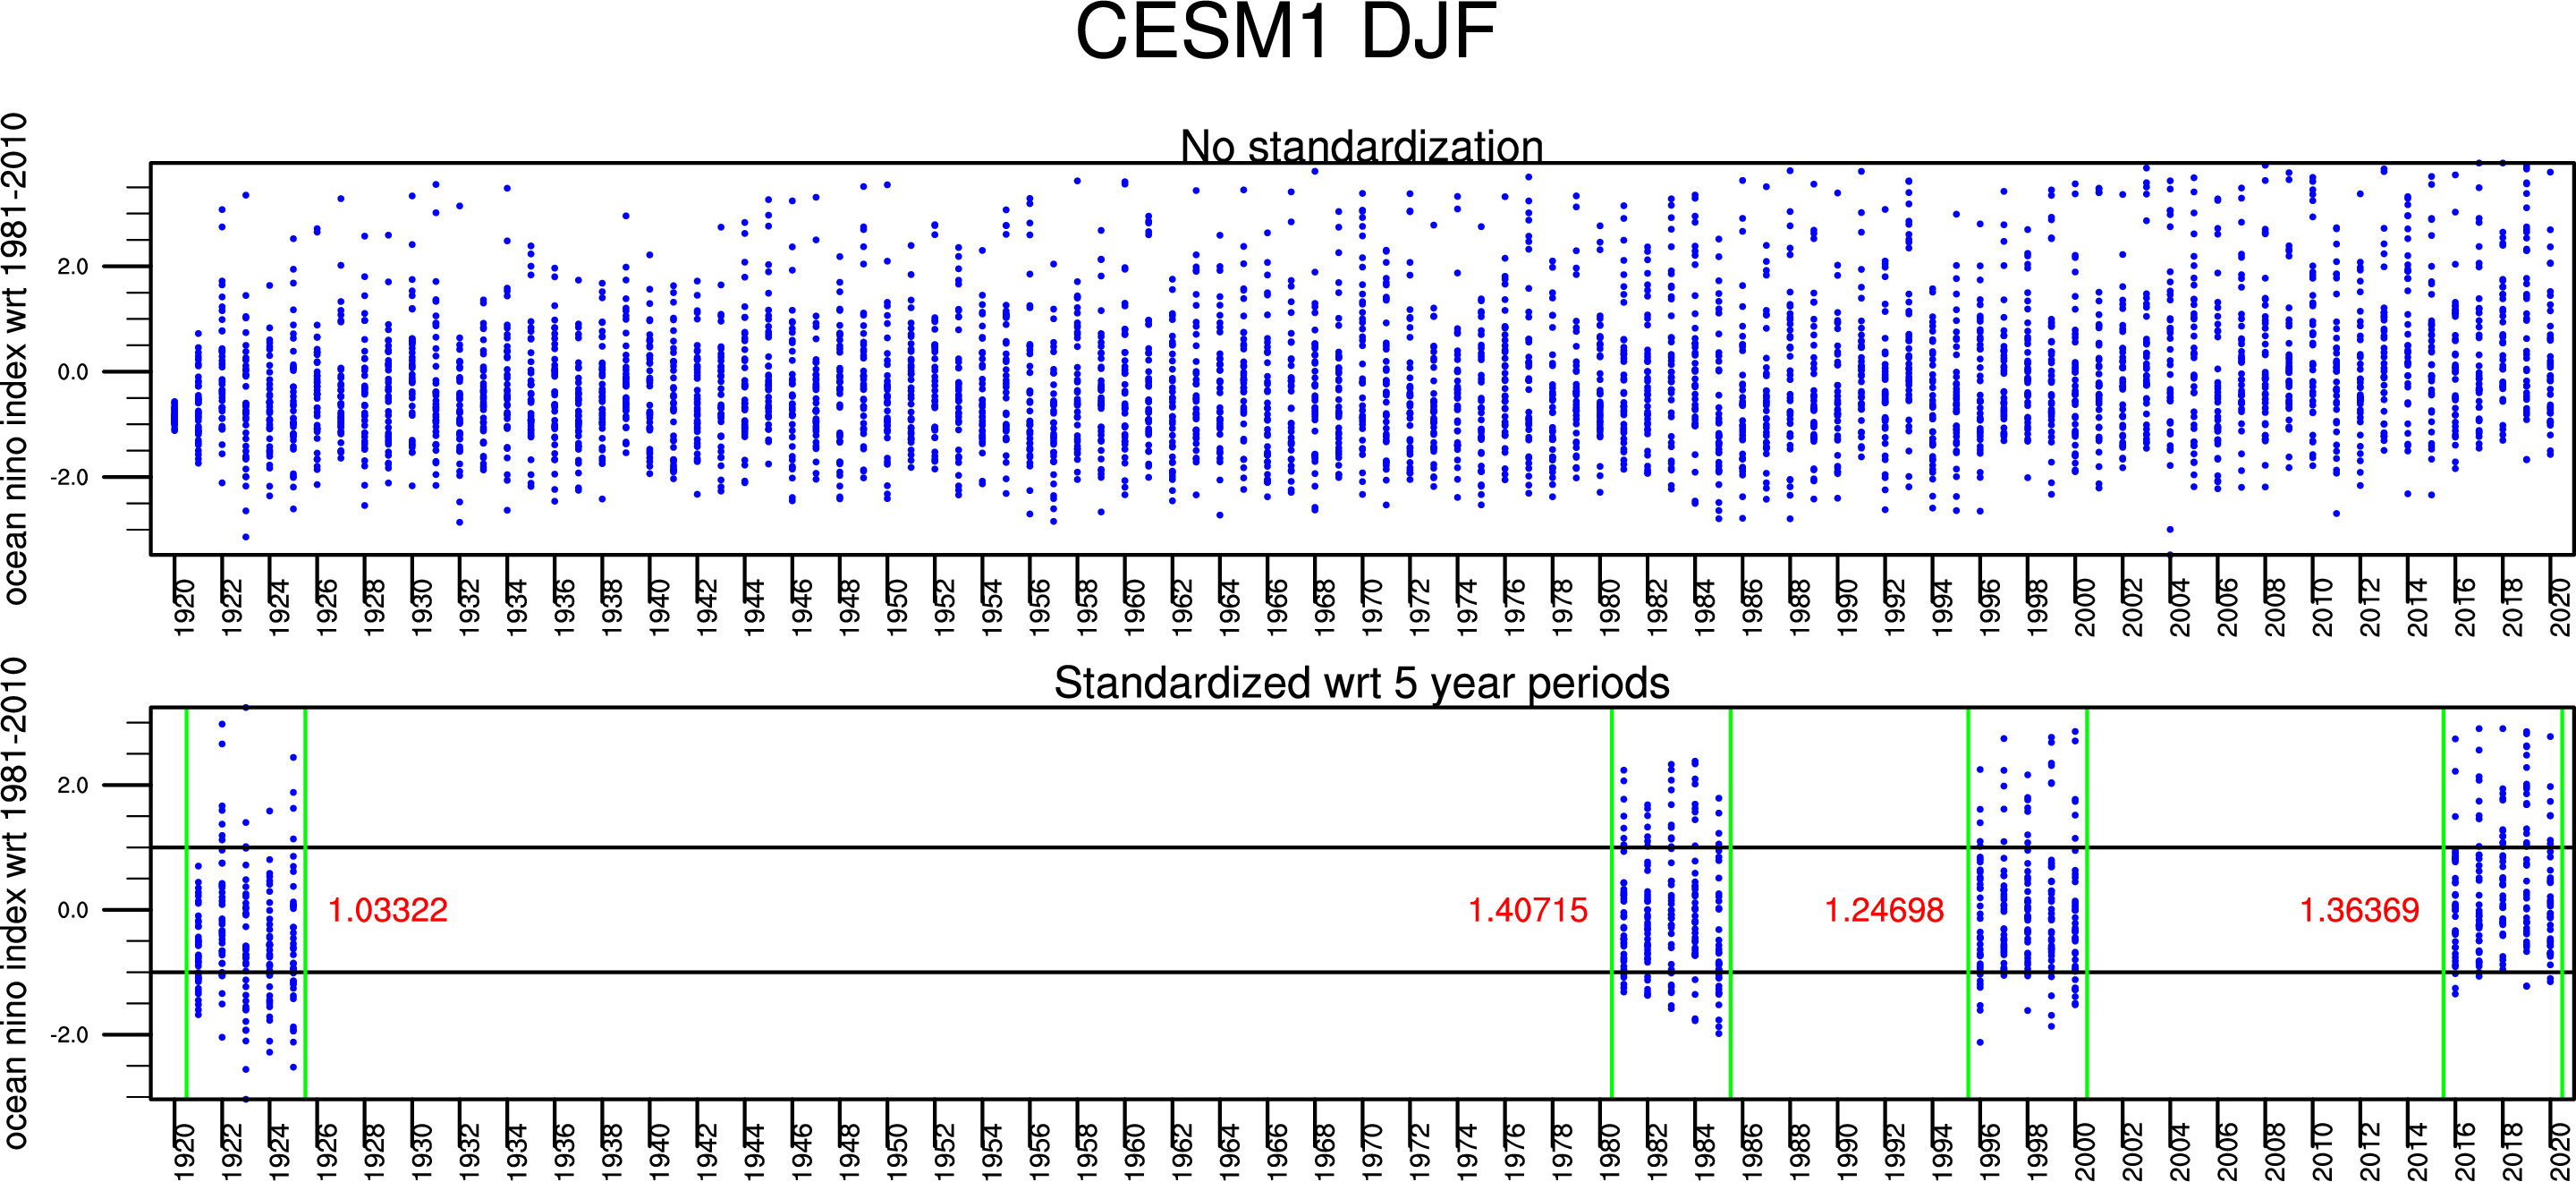
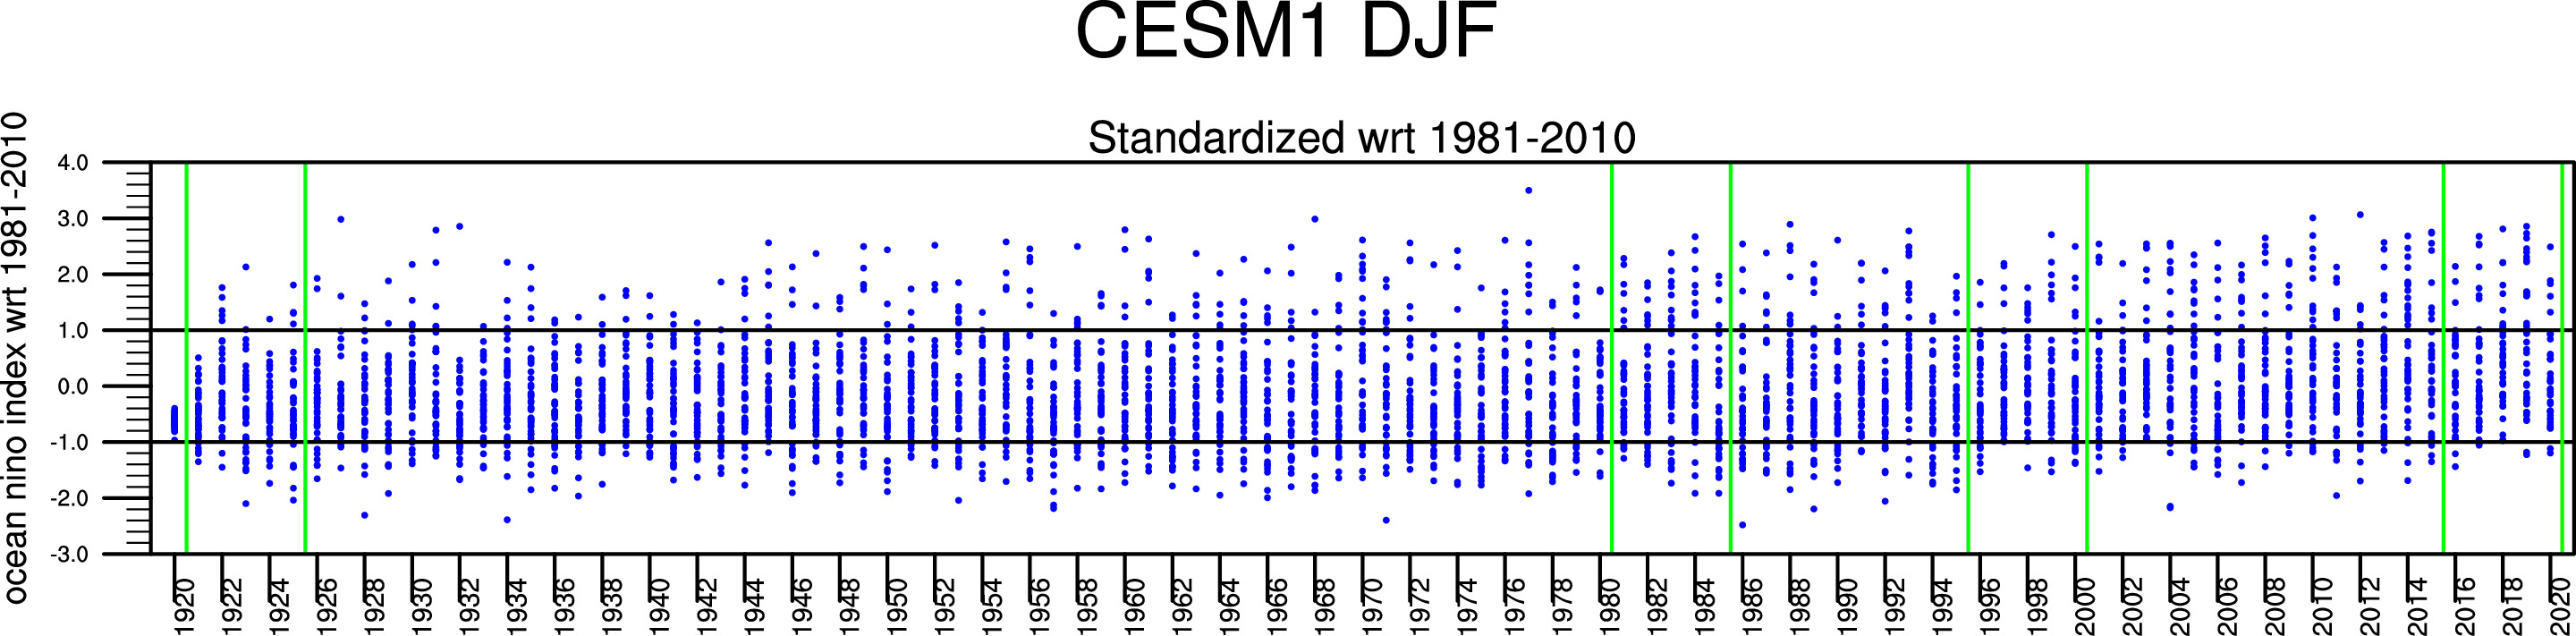
where red numbers above are the standard deviations for the adjacent 5-year period.
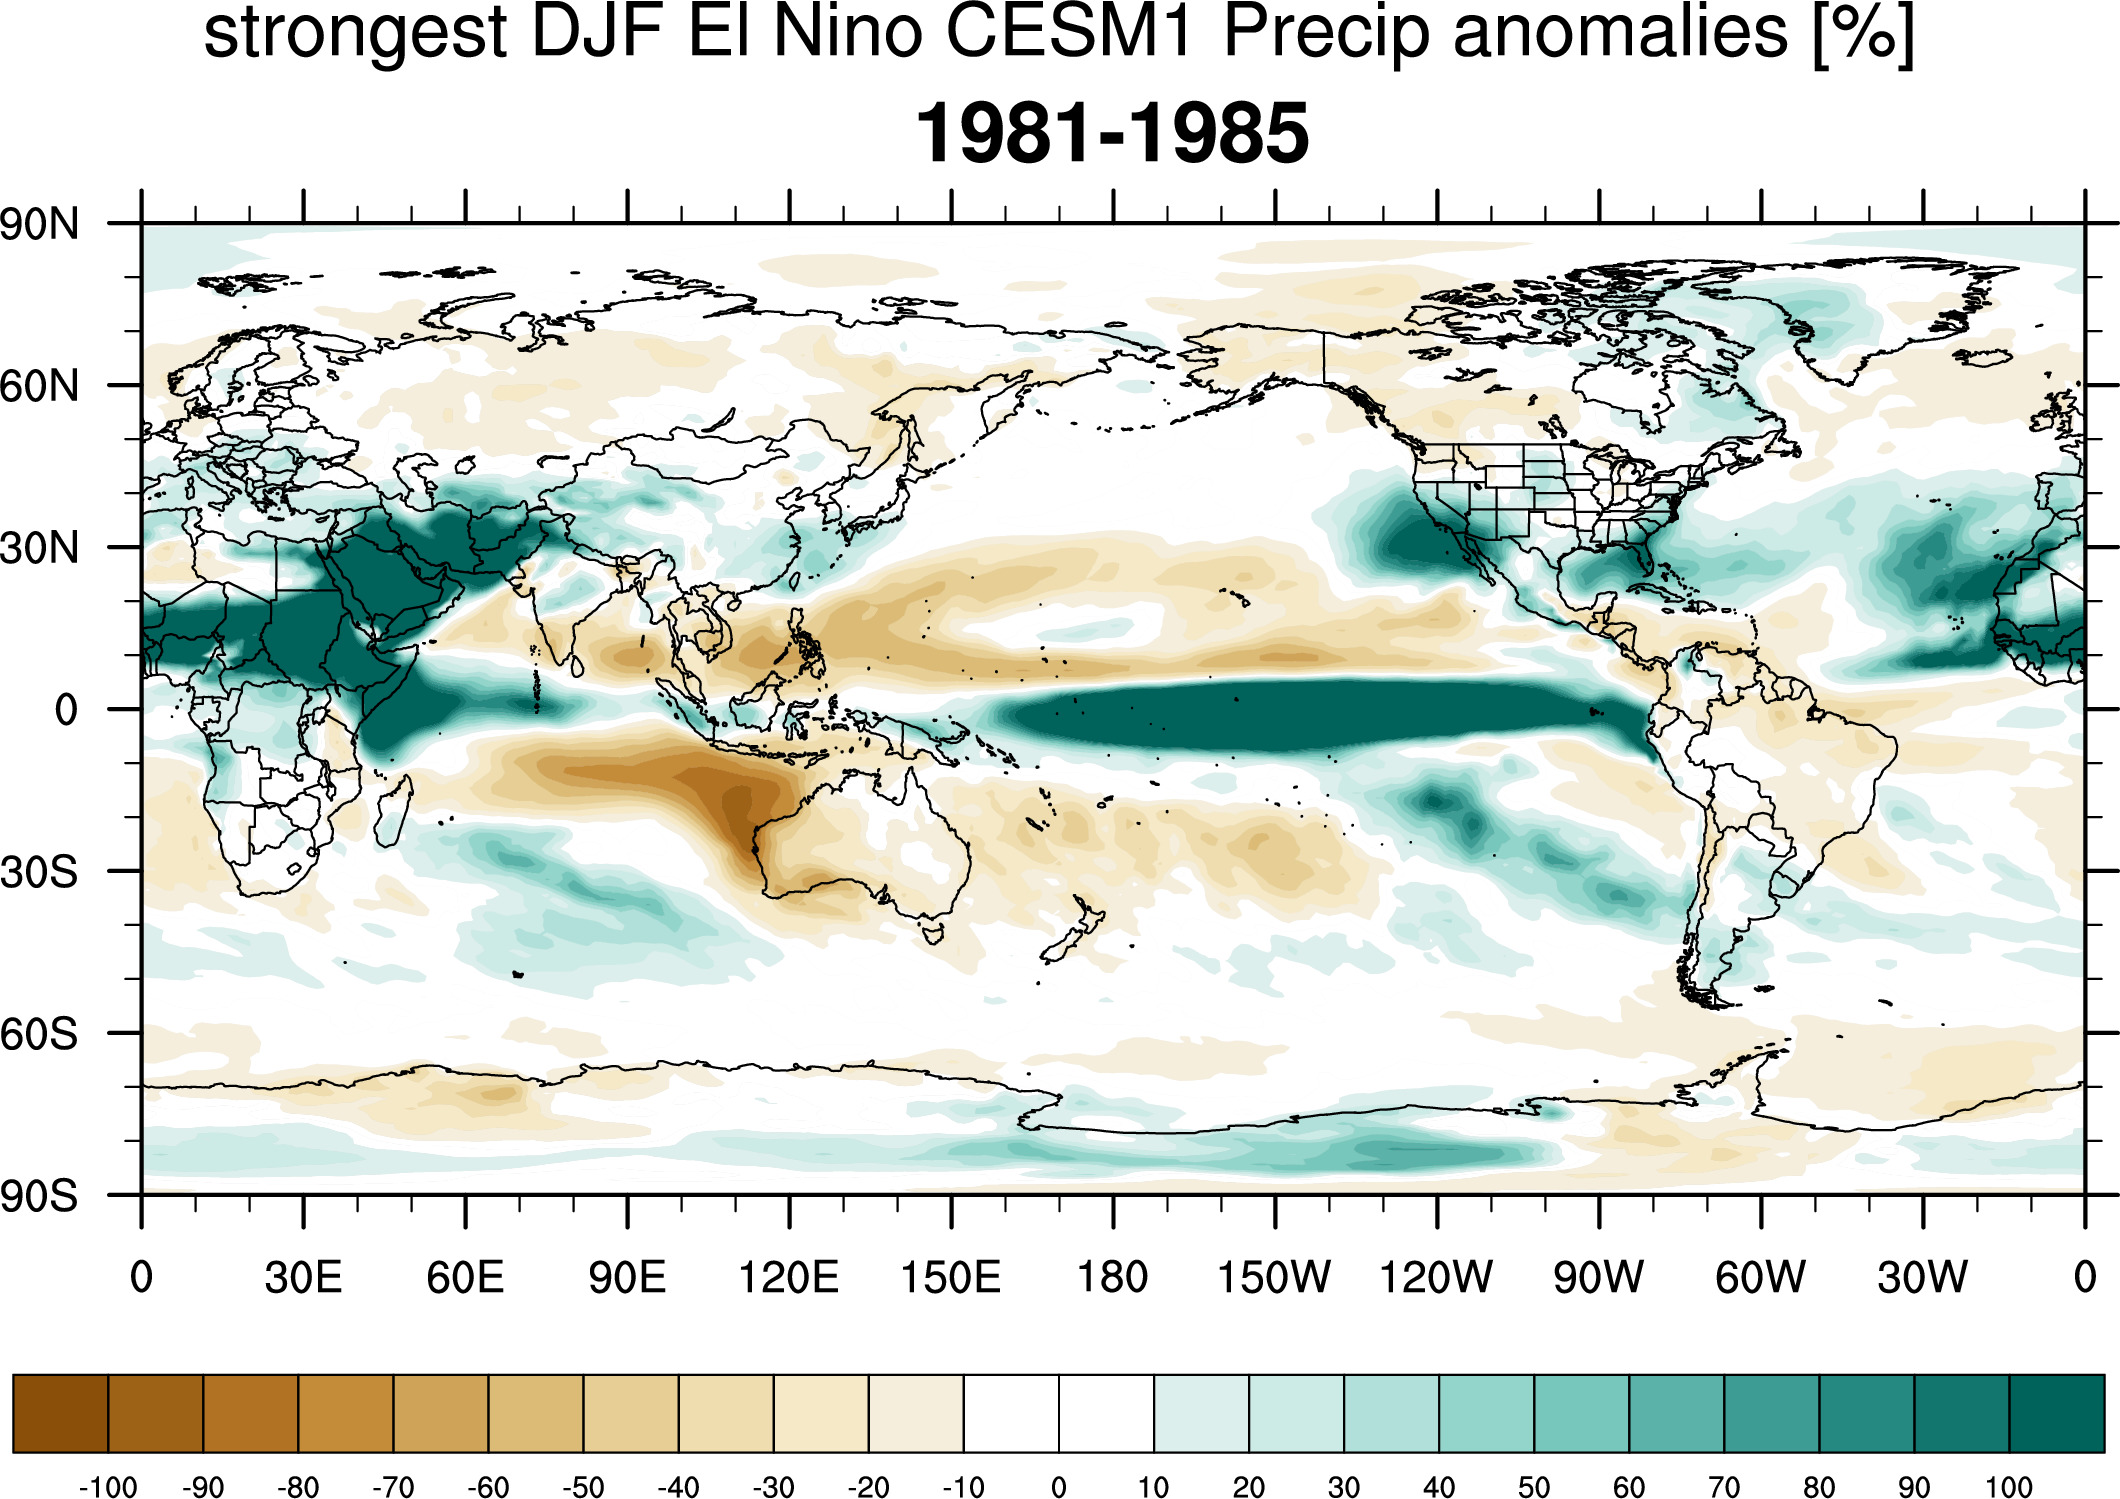
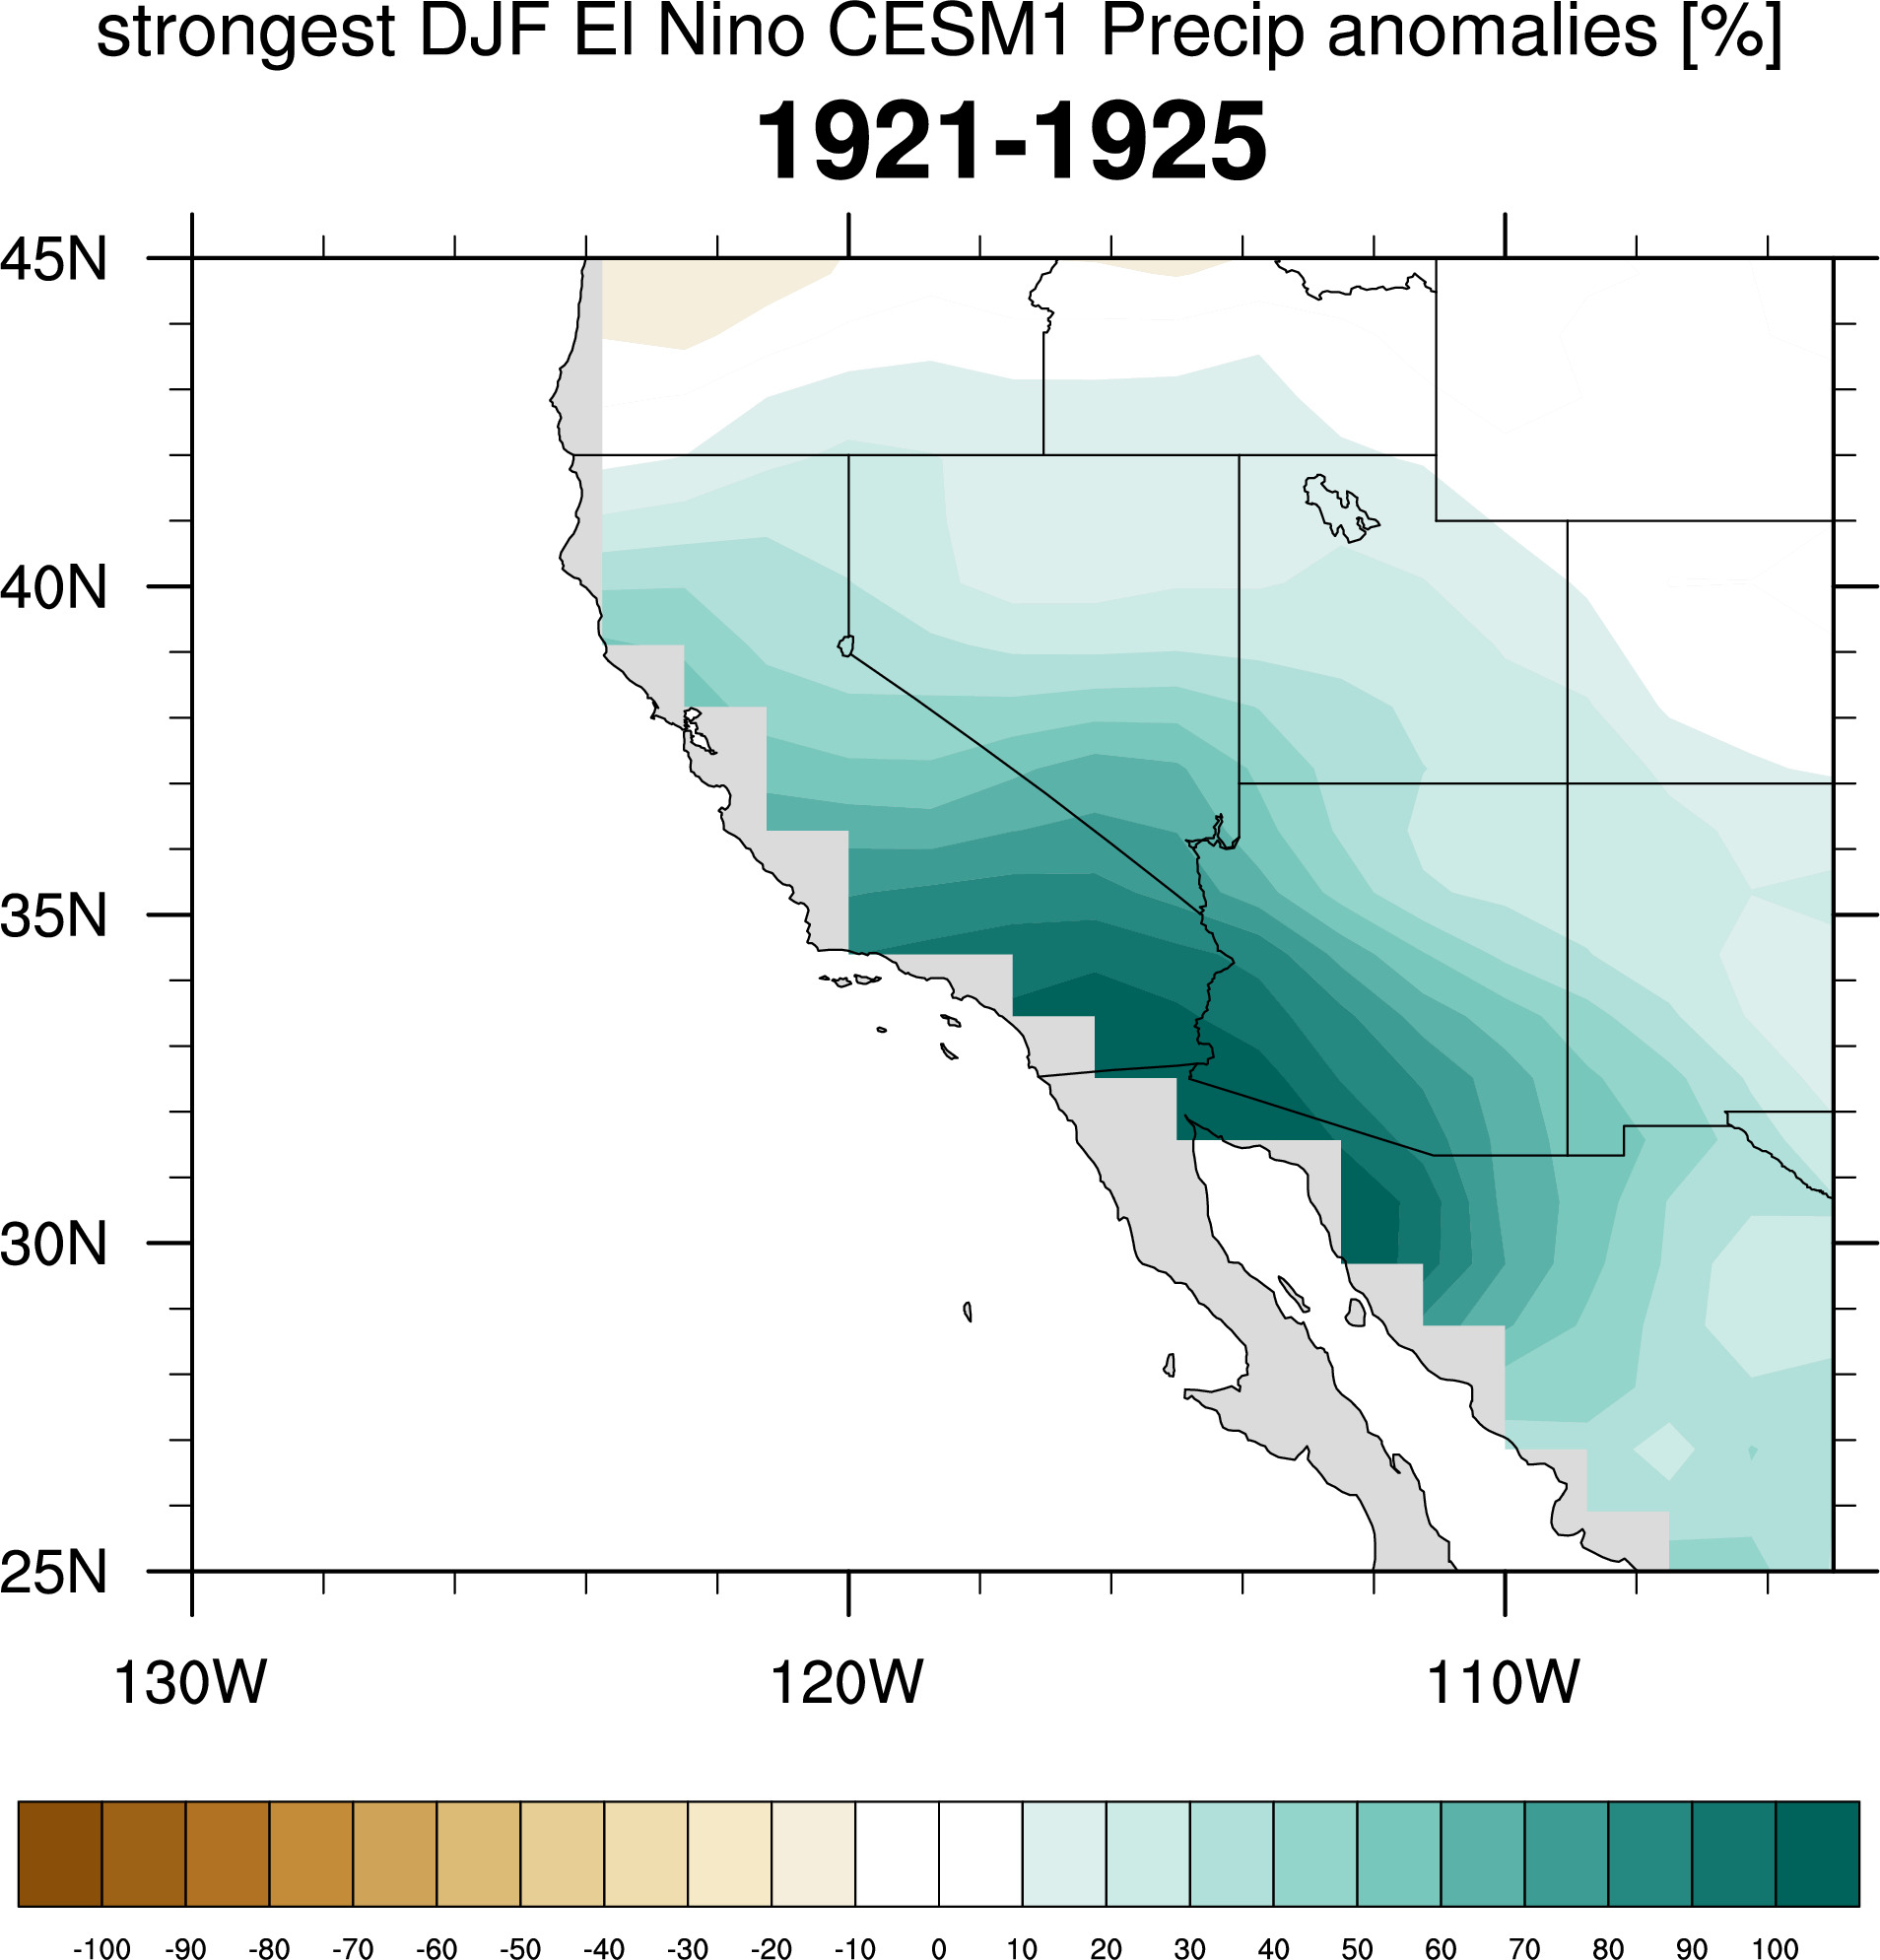
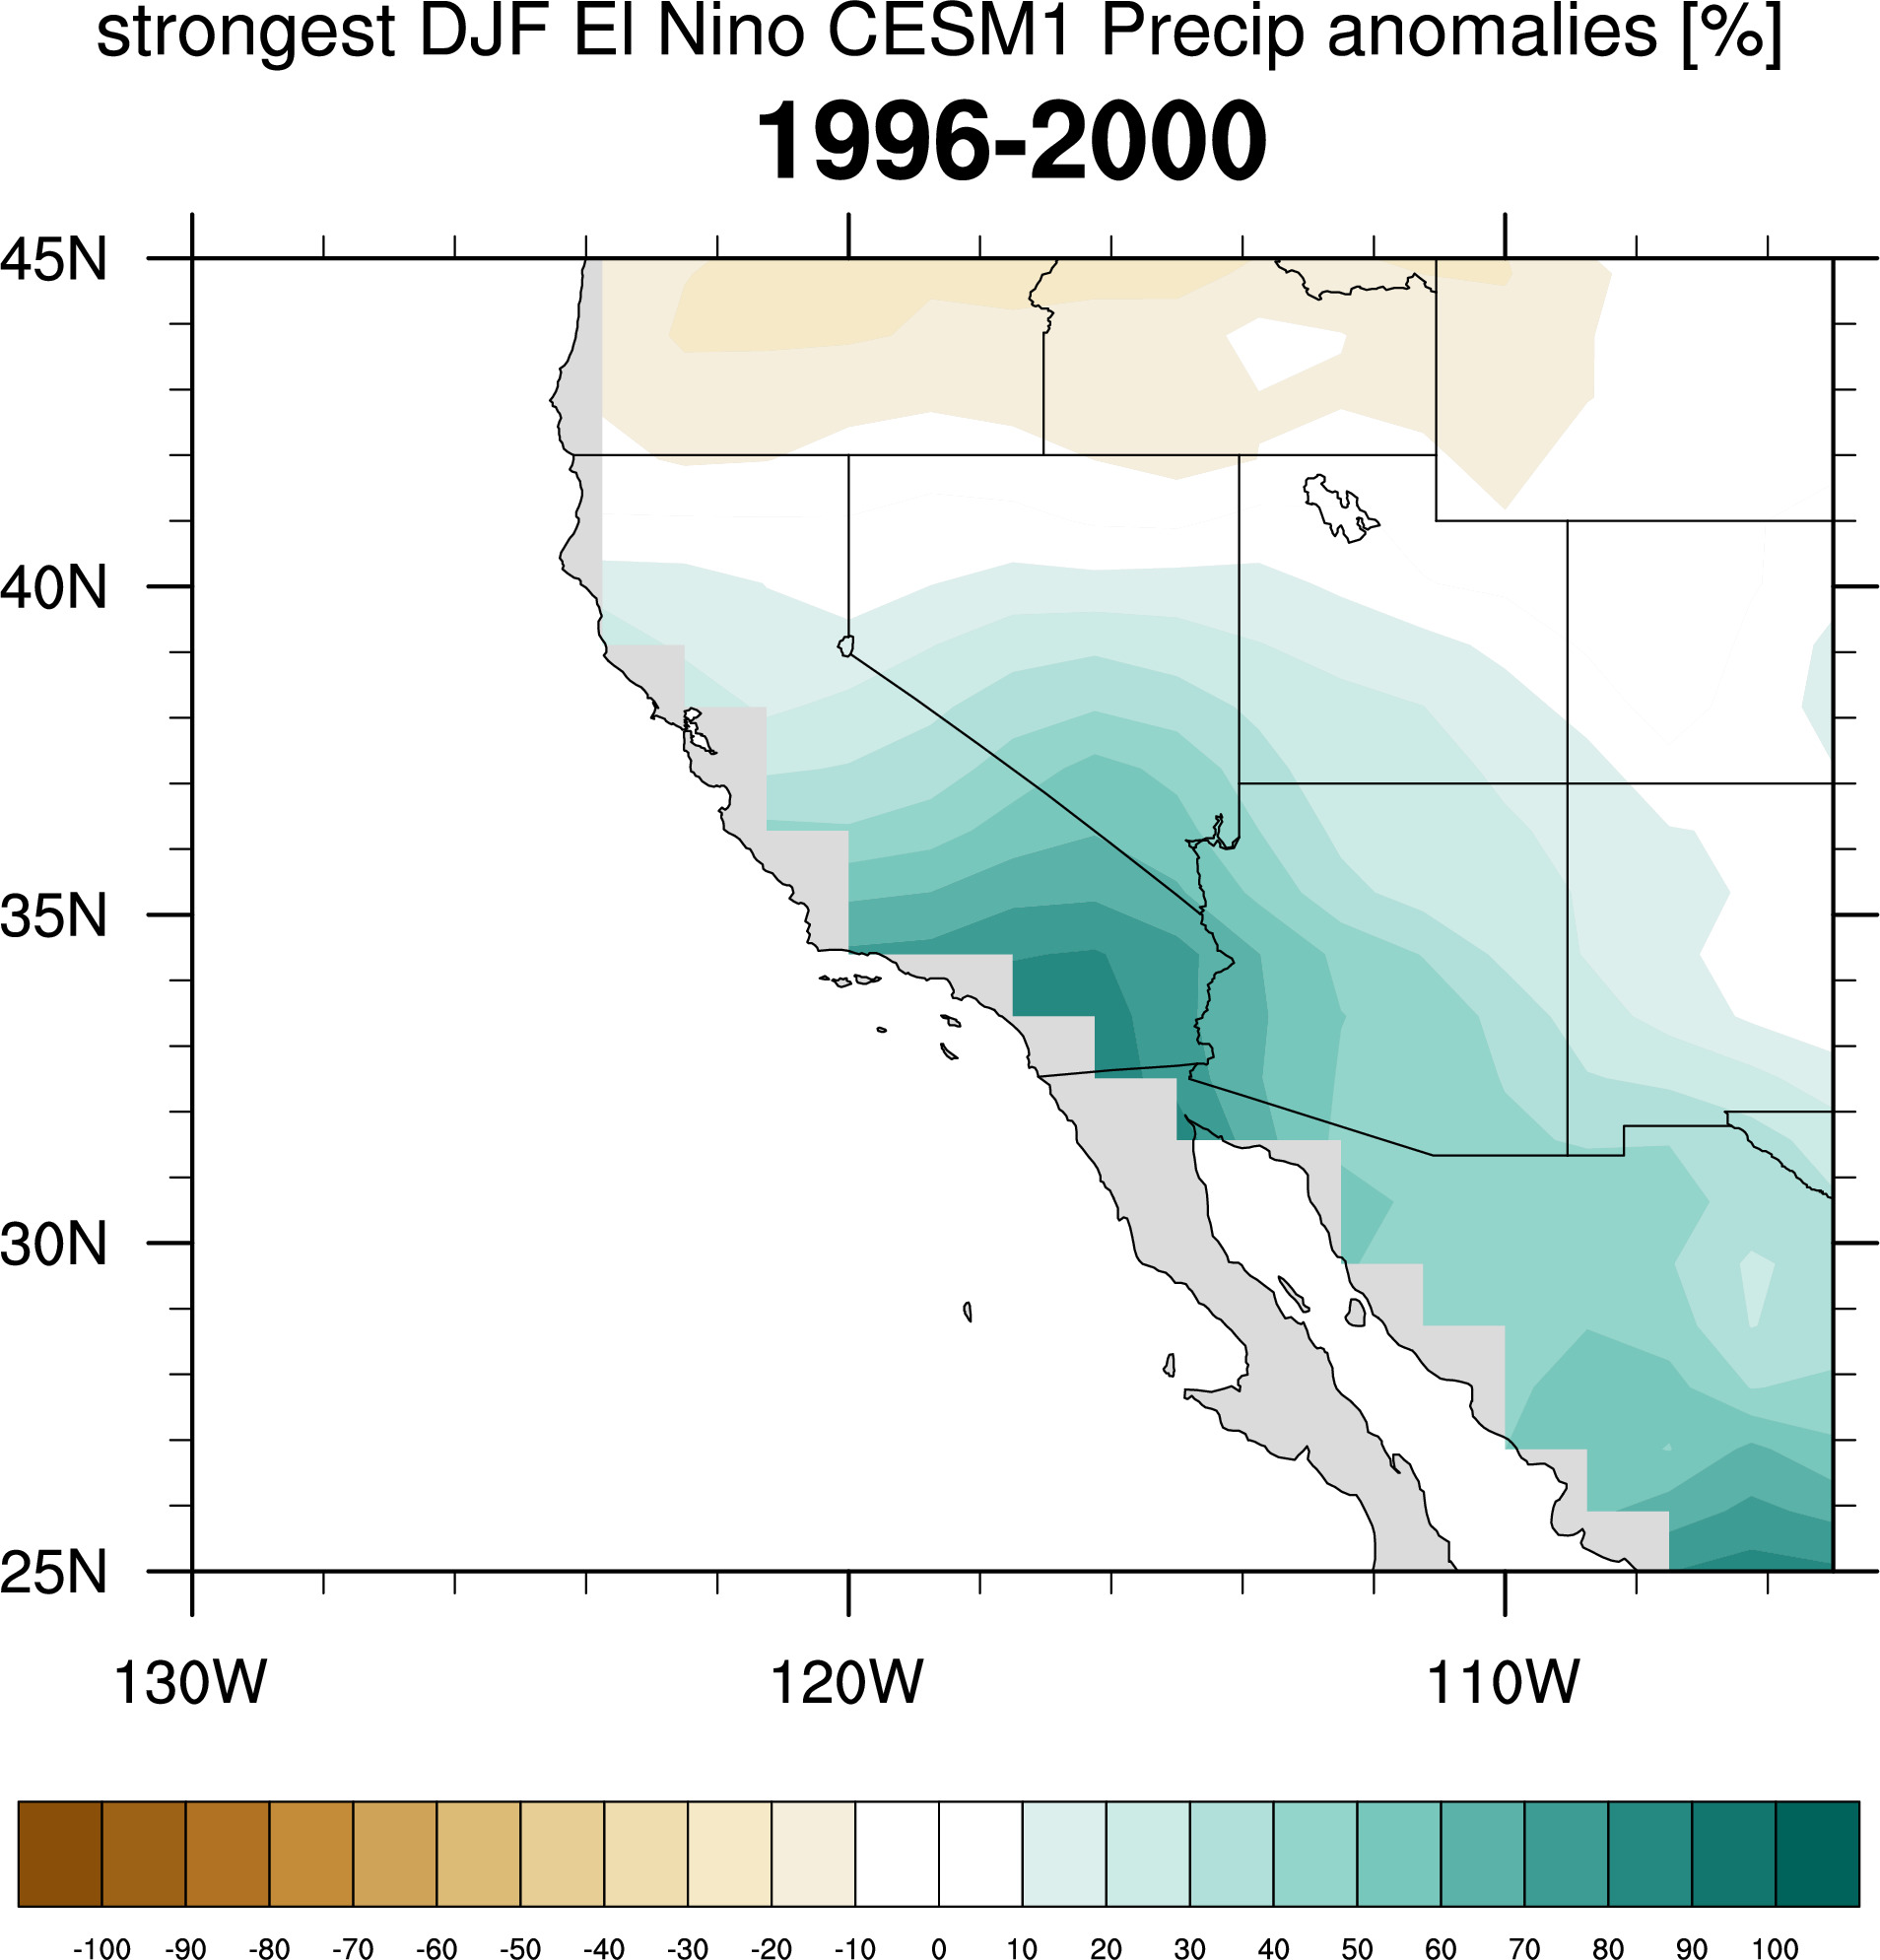
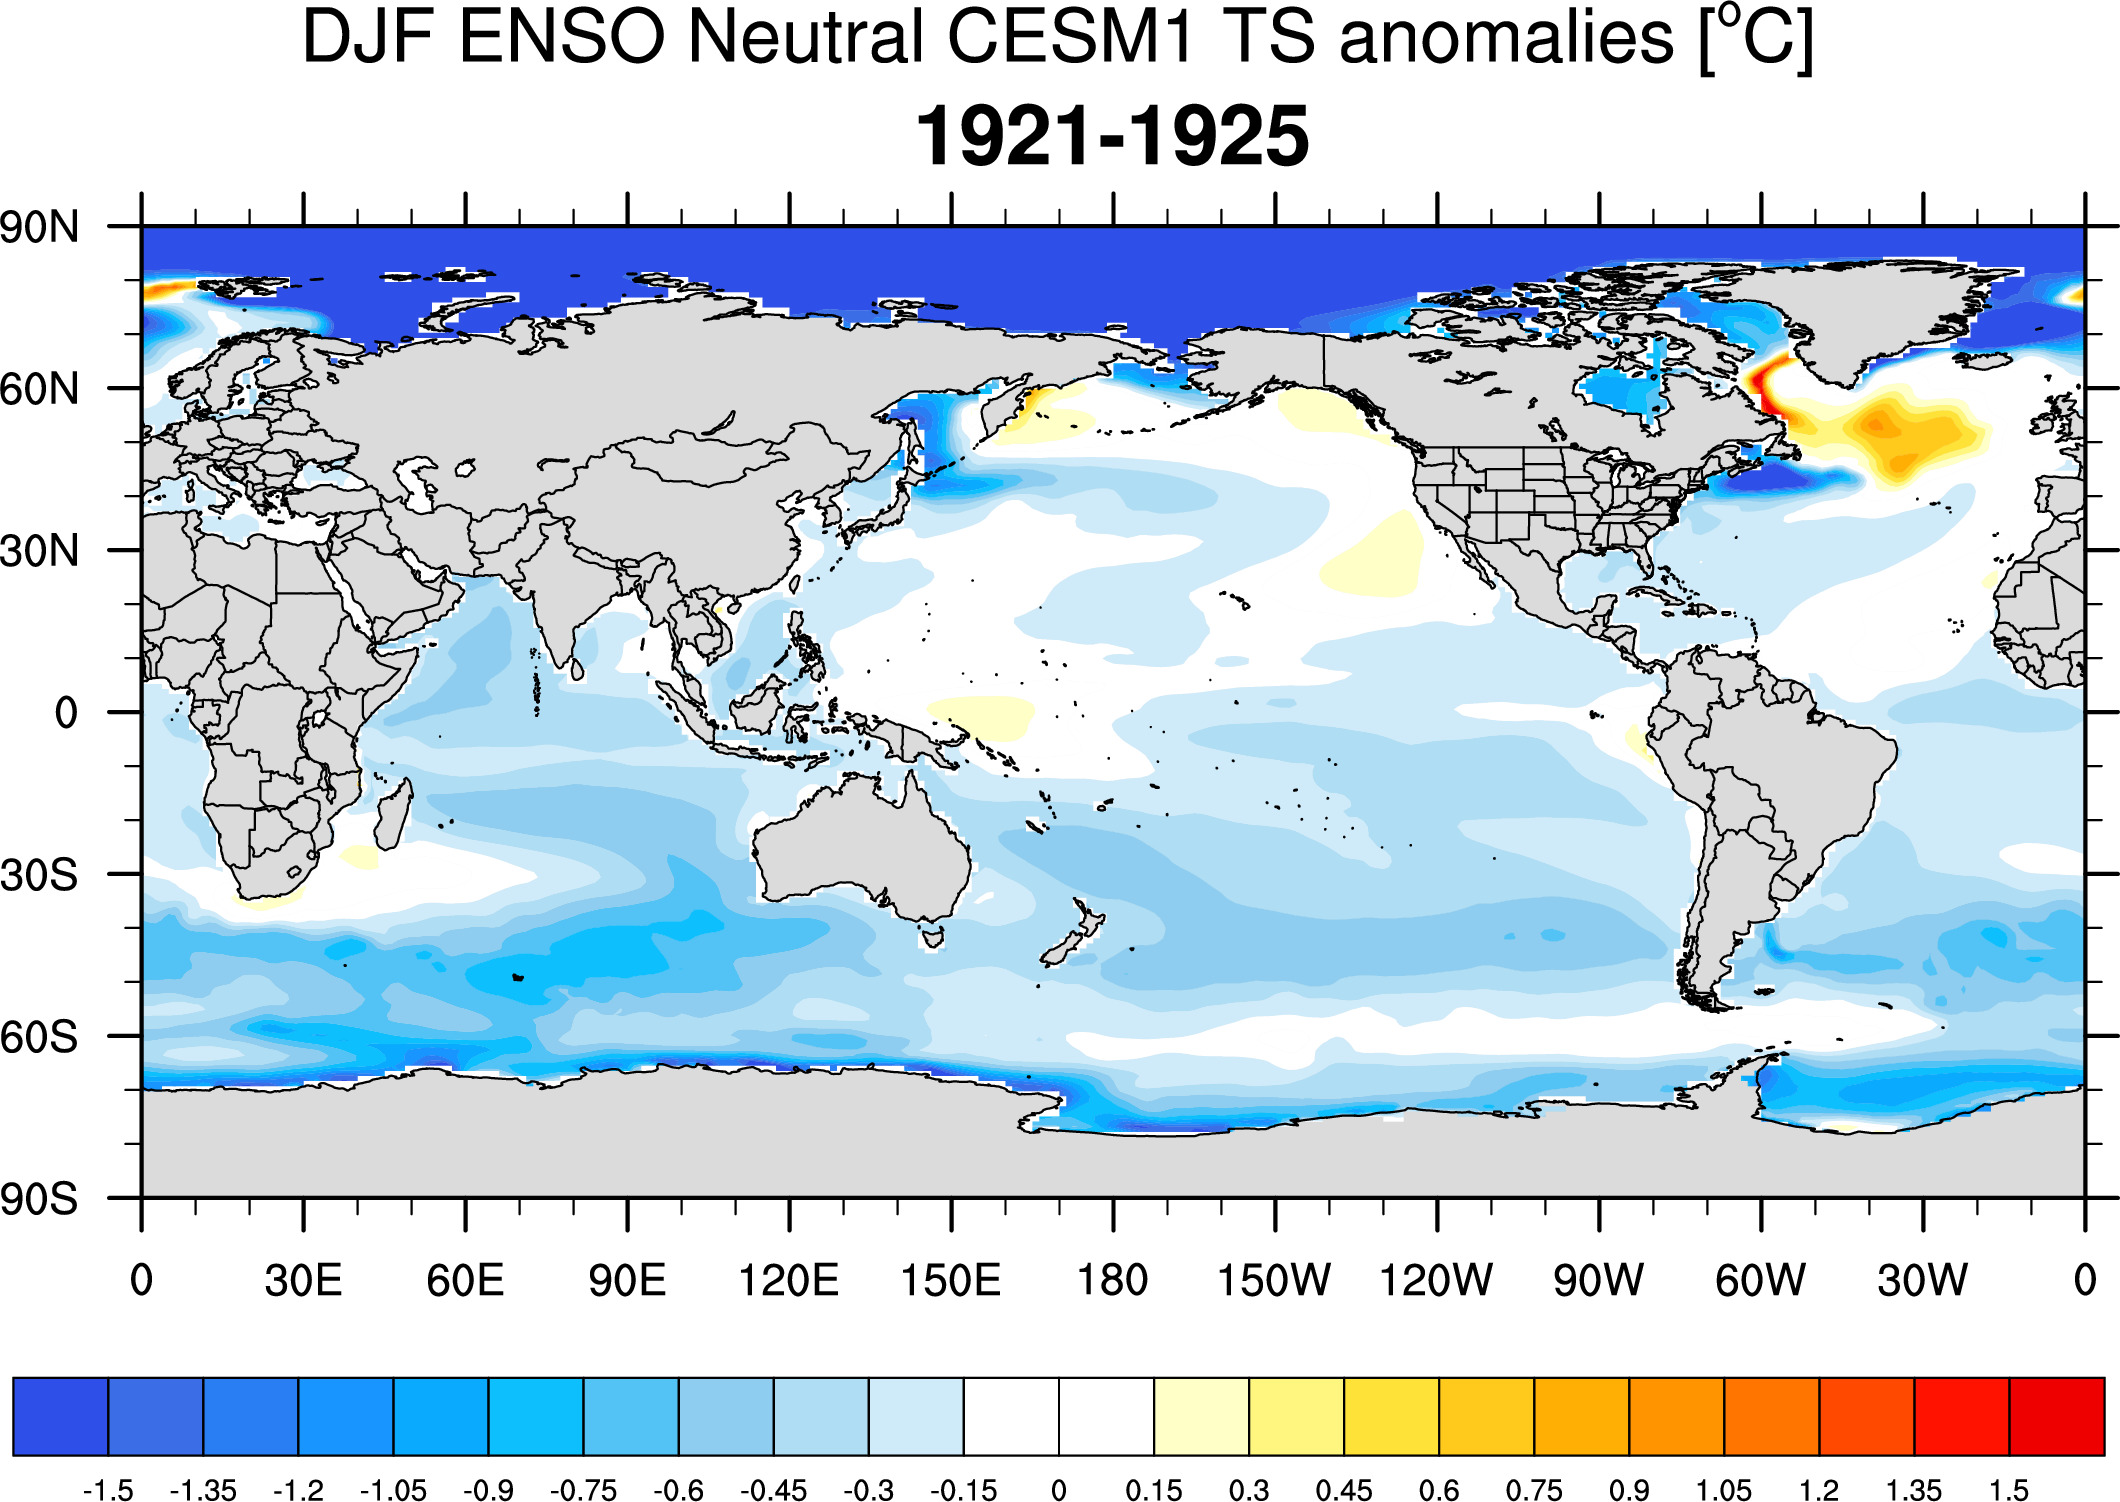
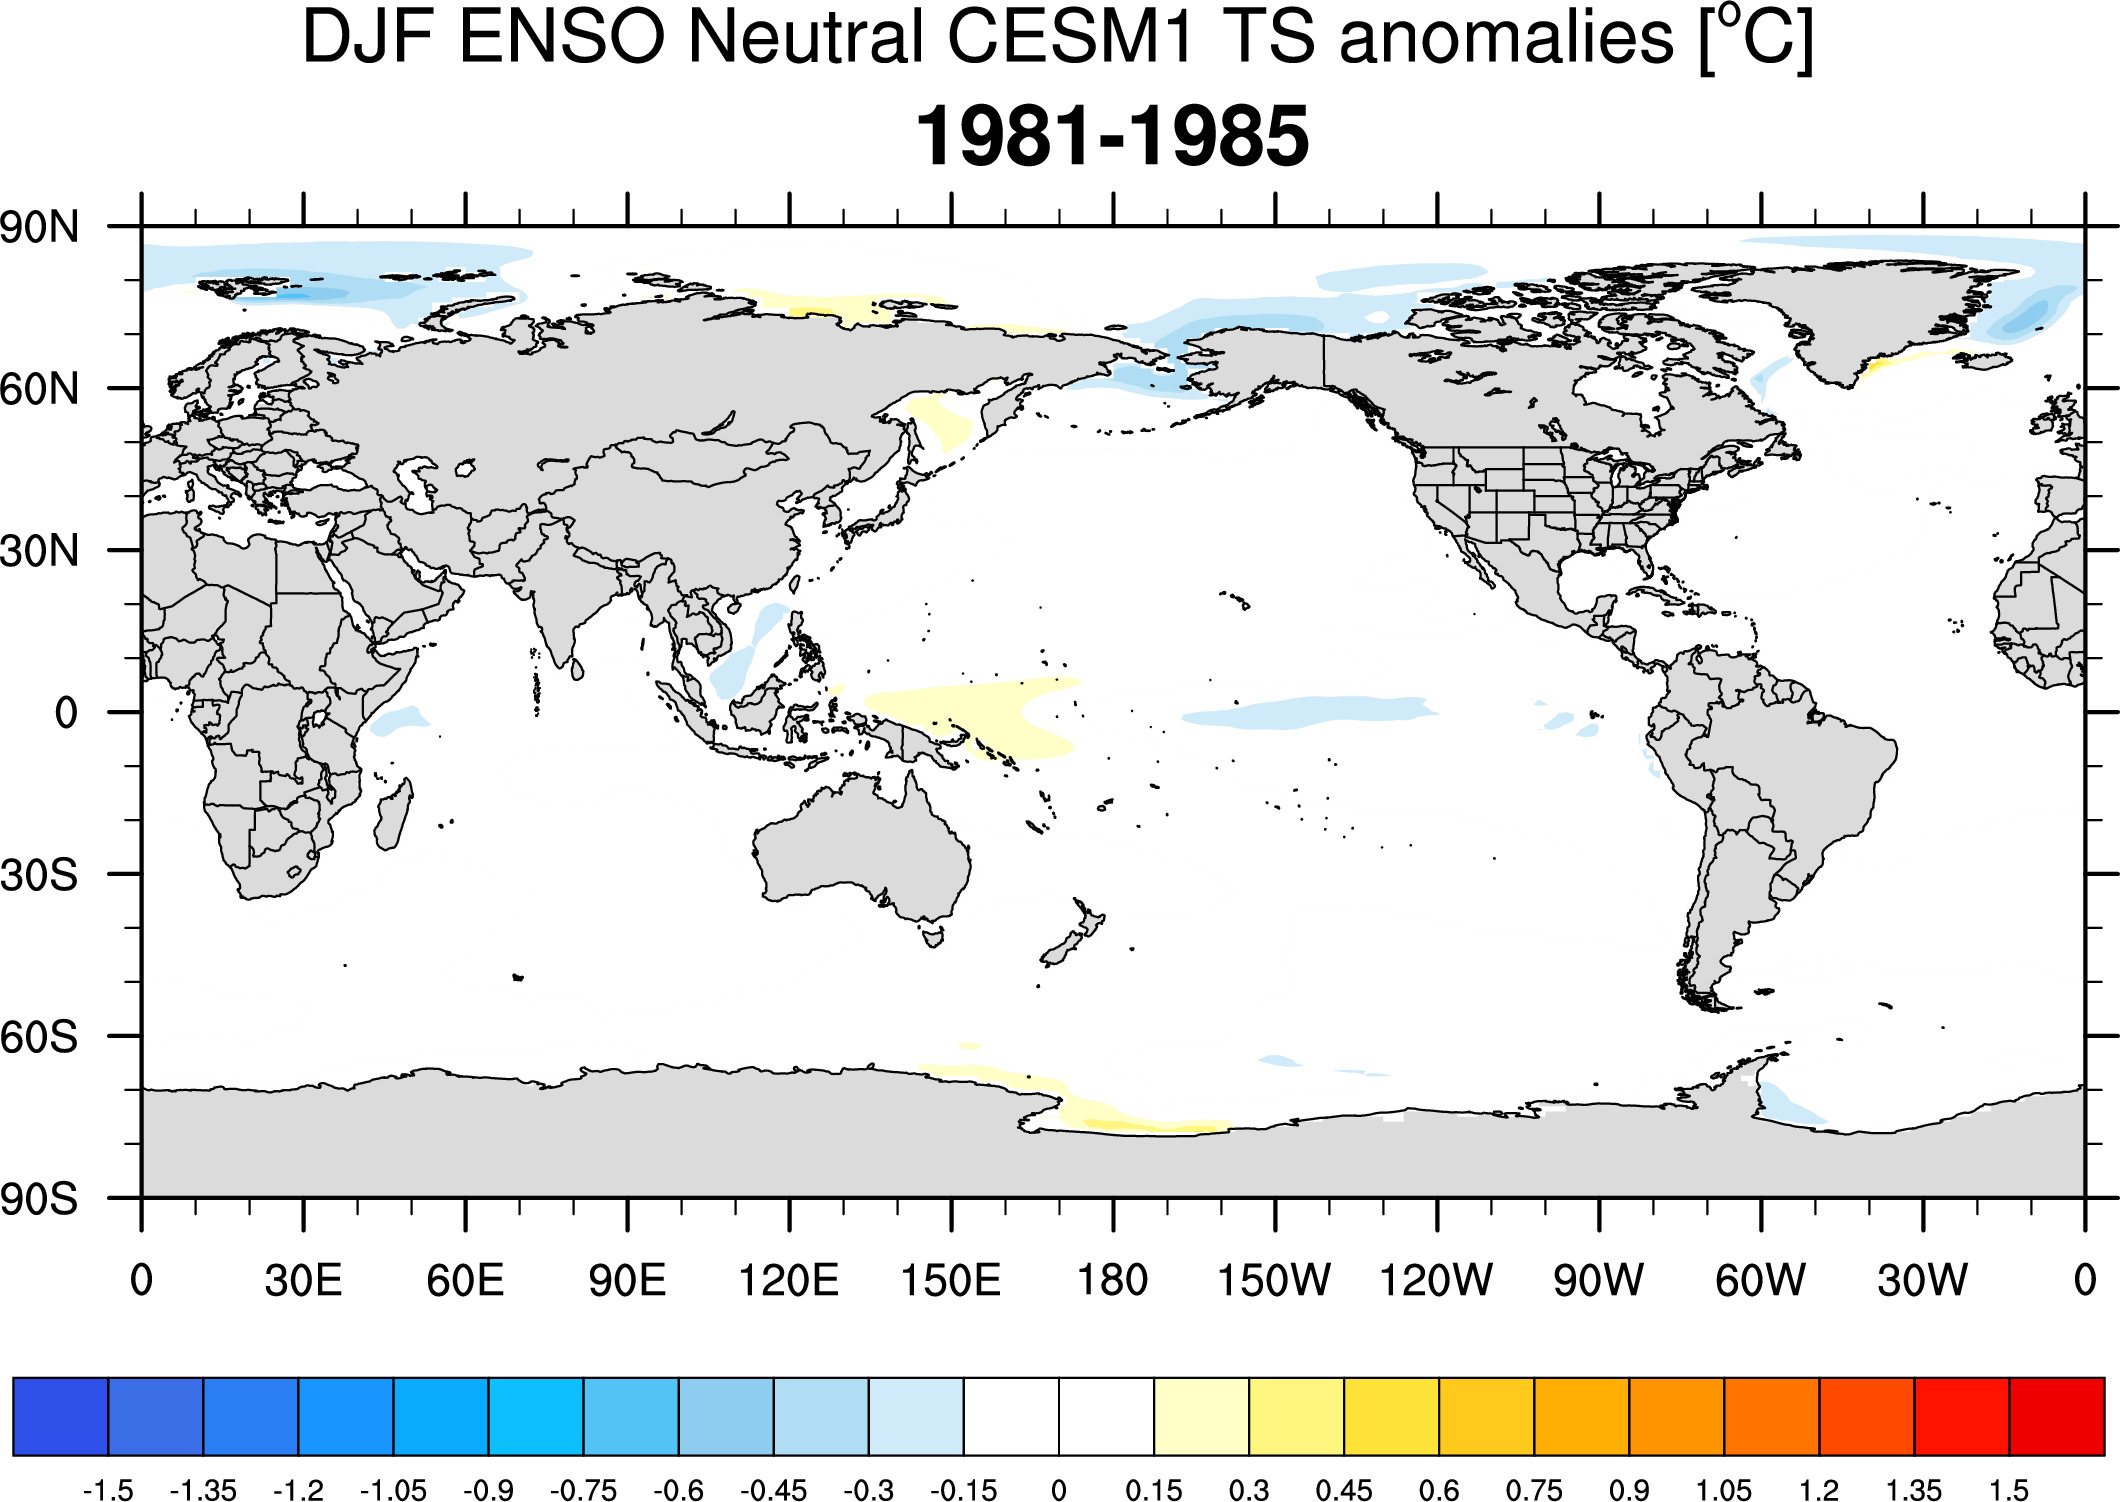
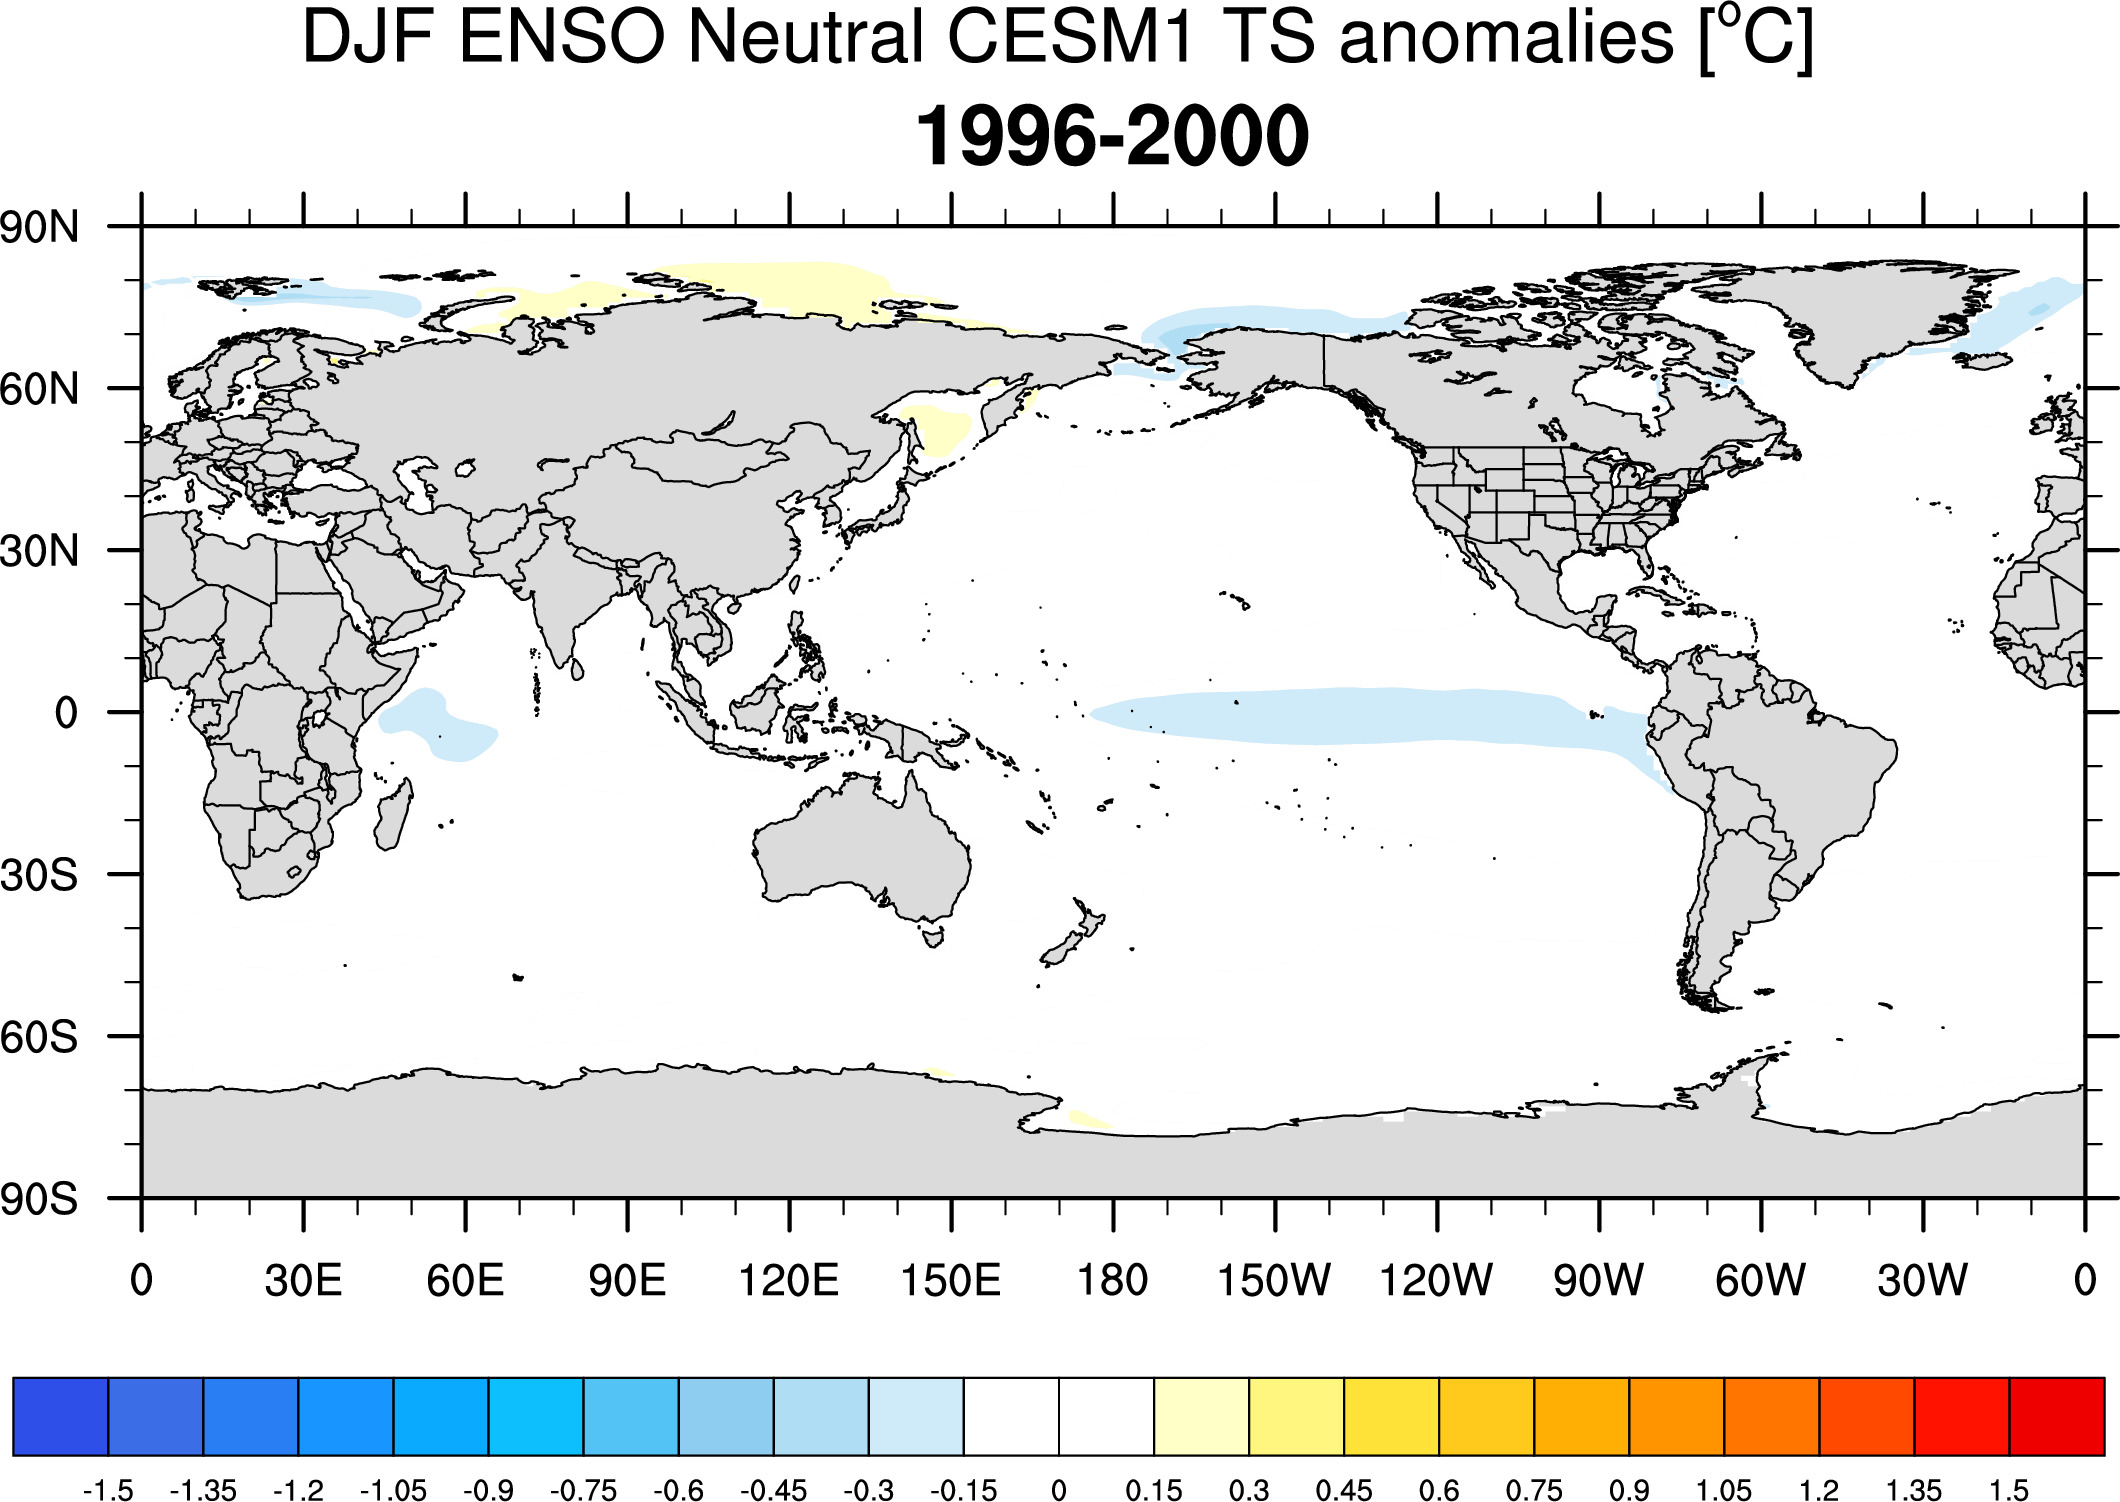
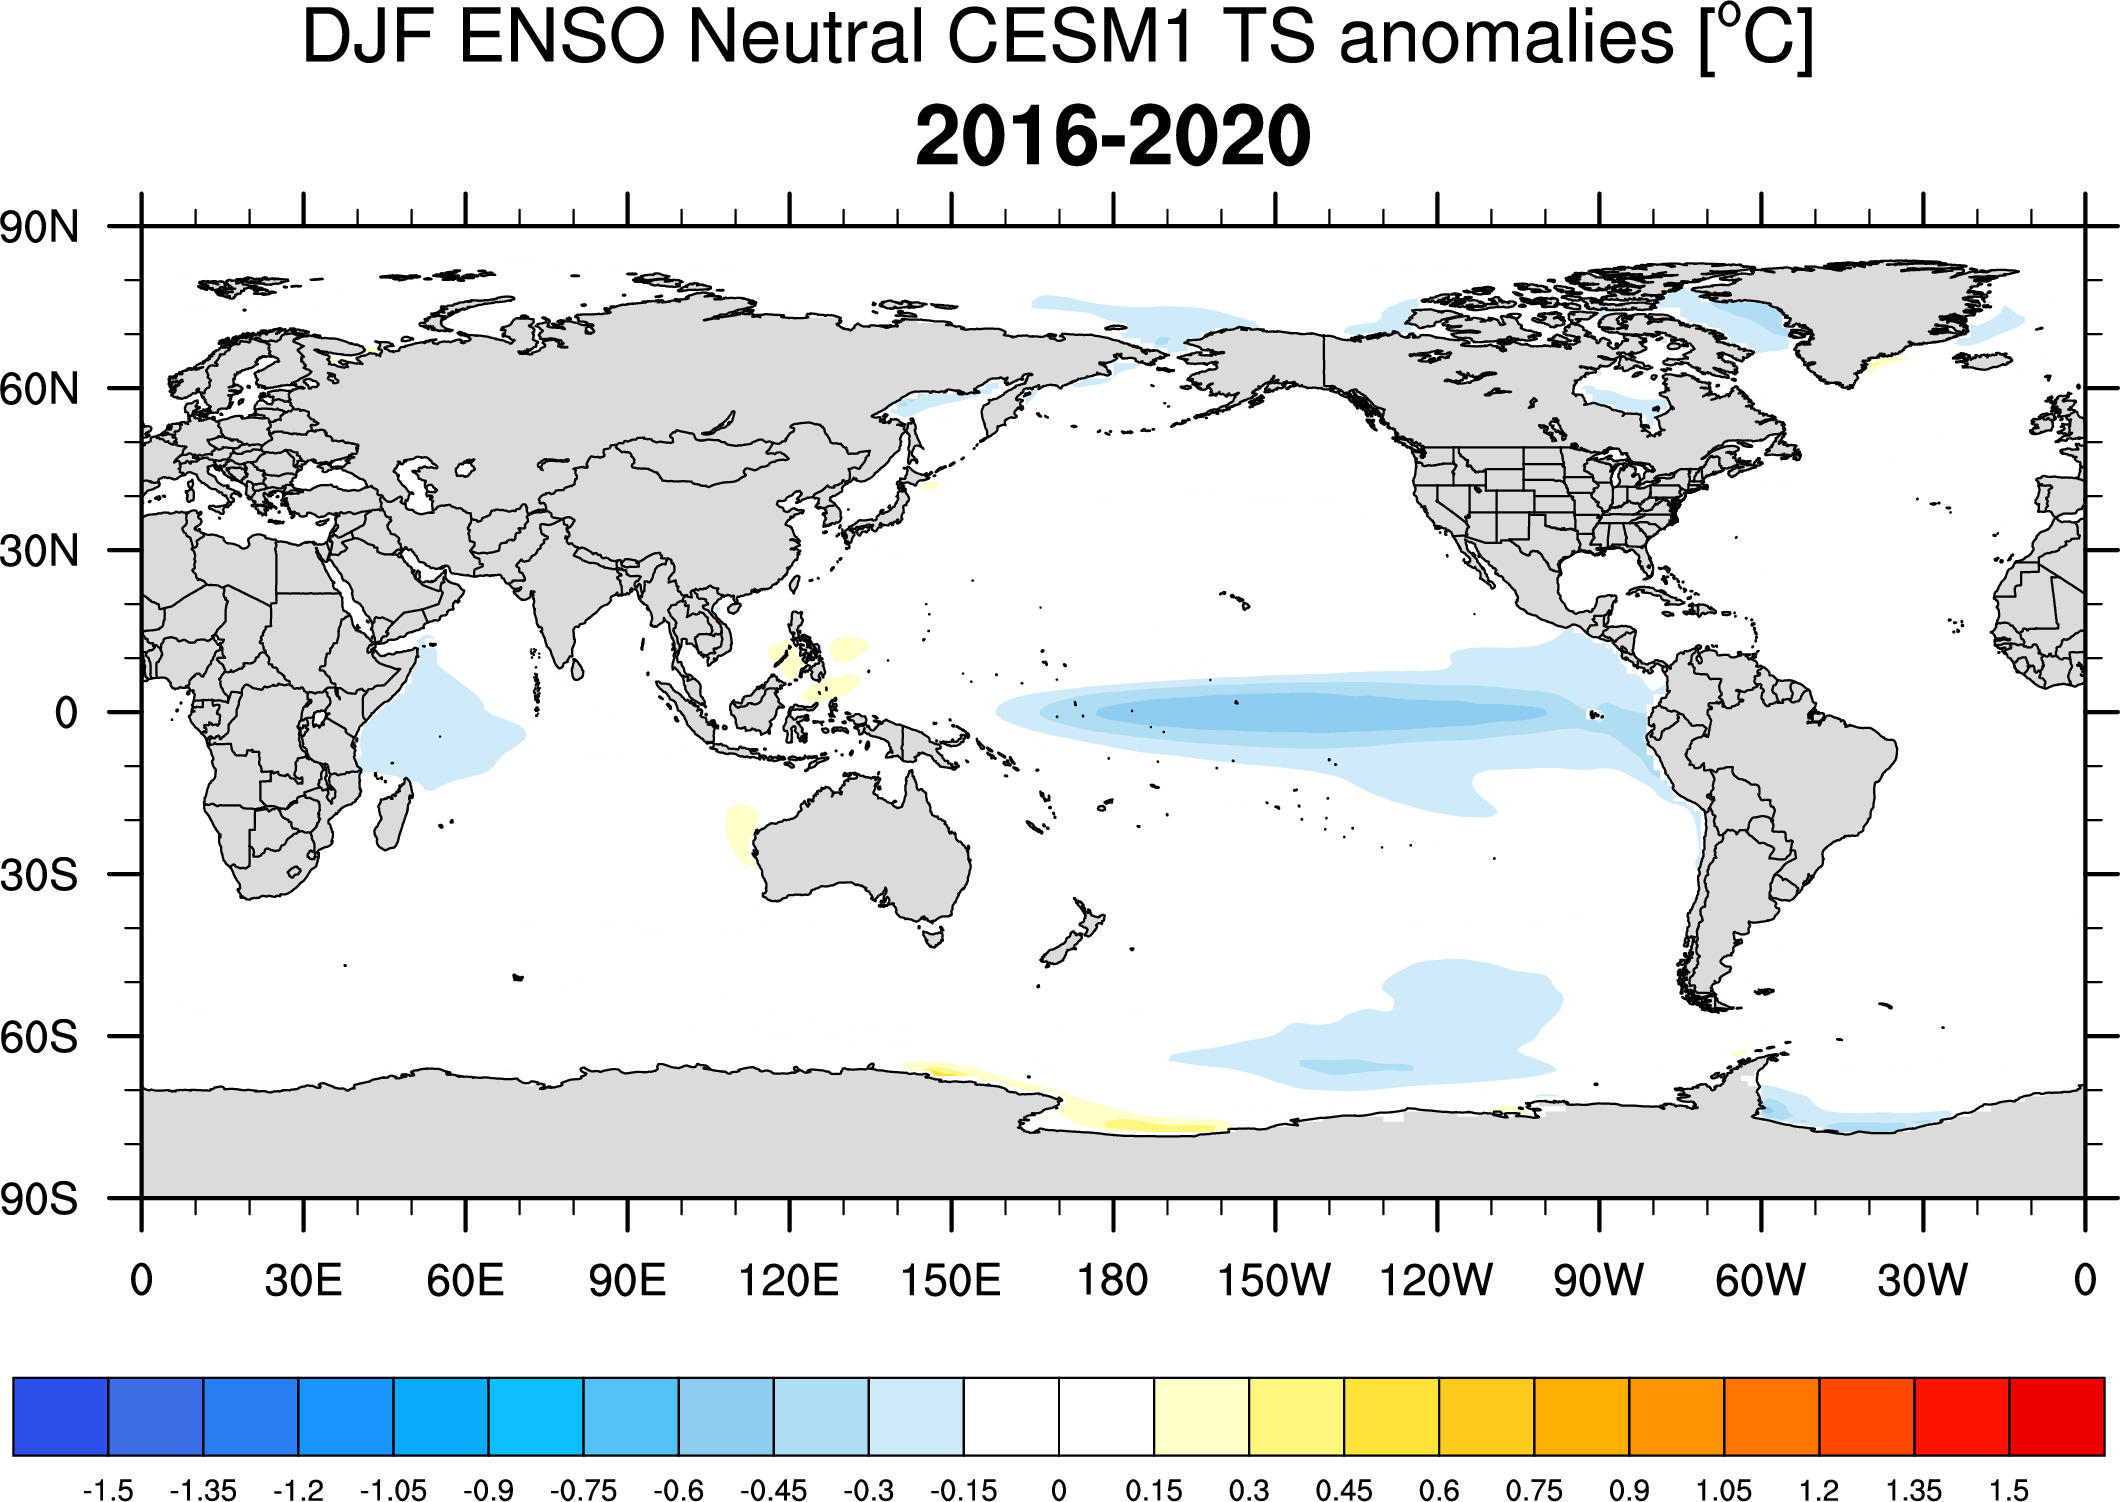
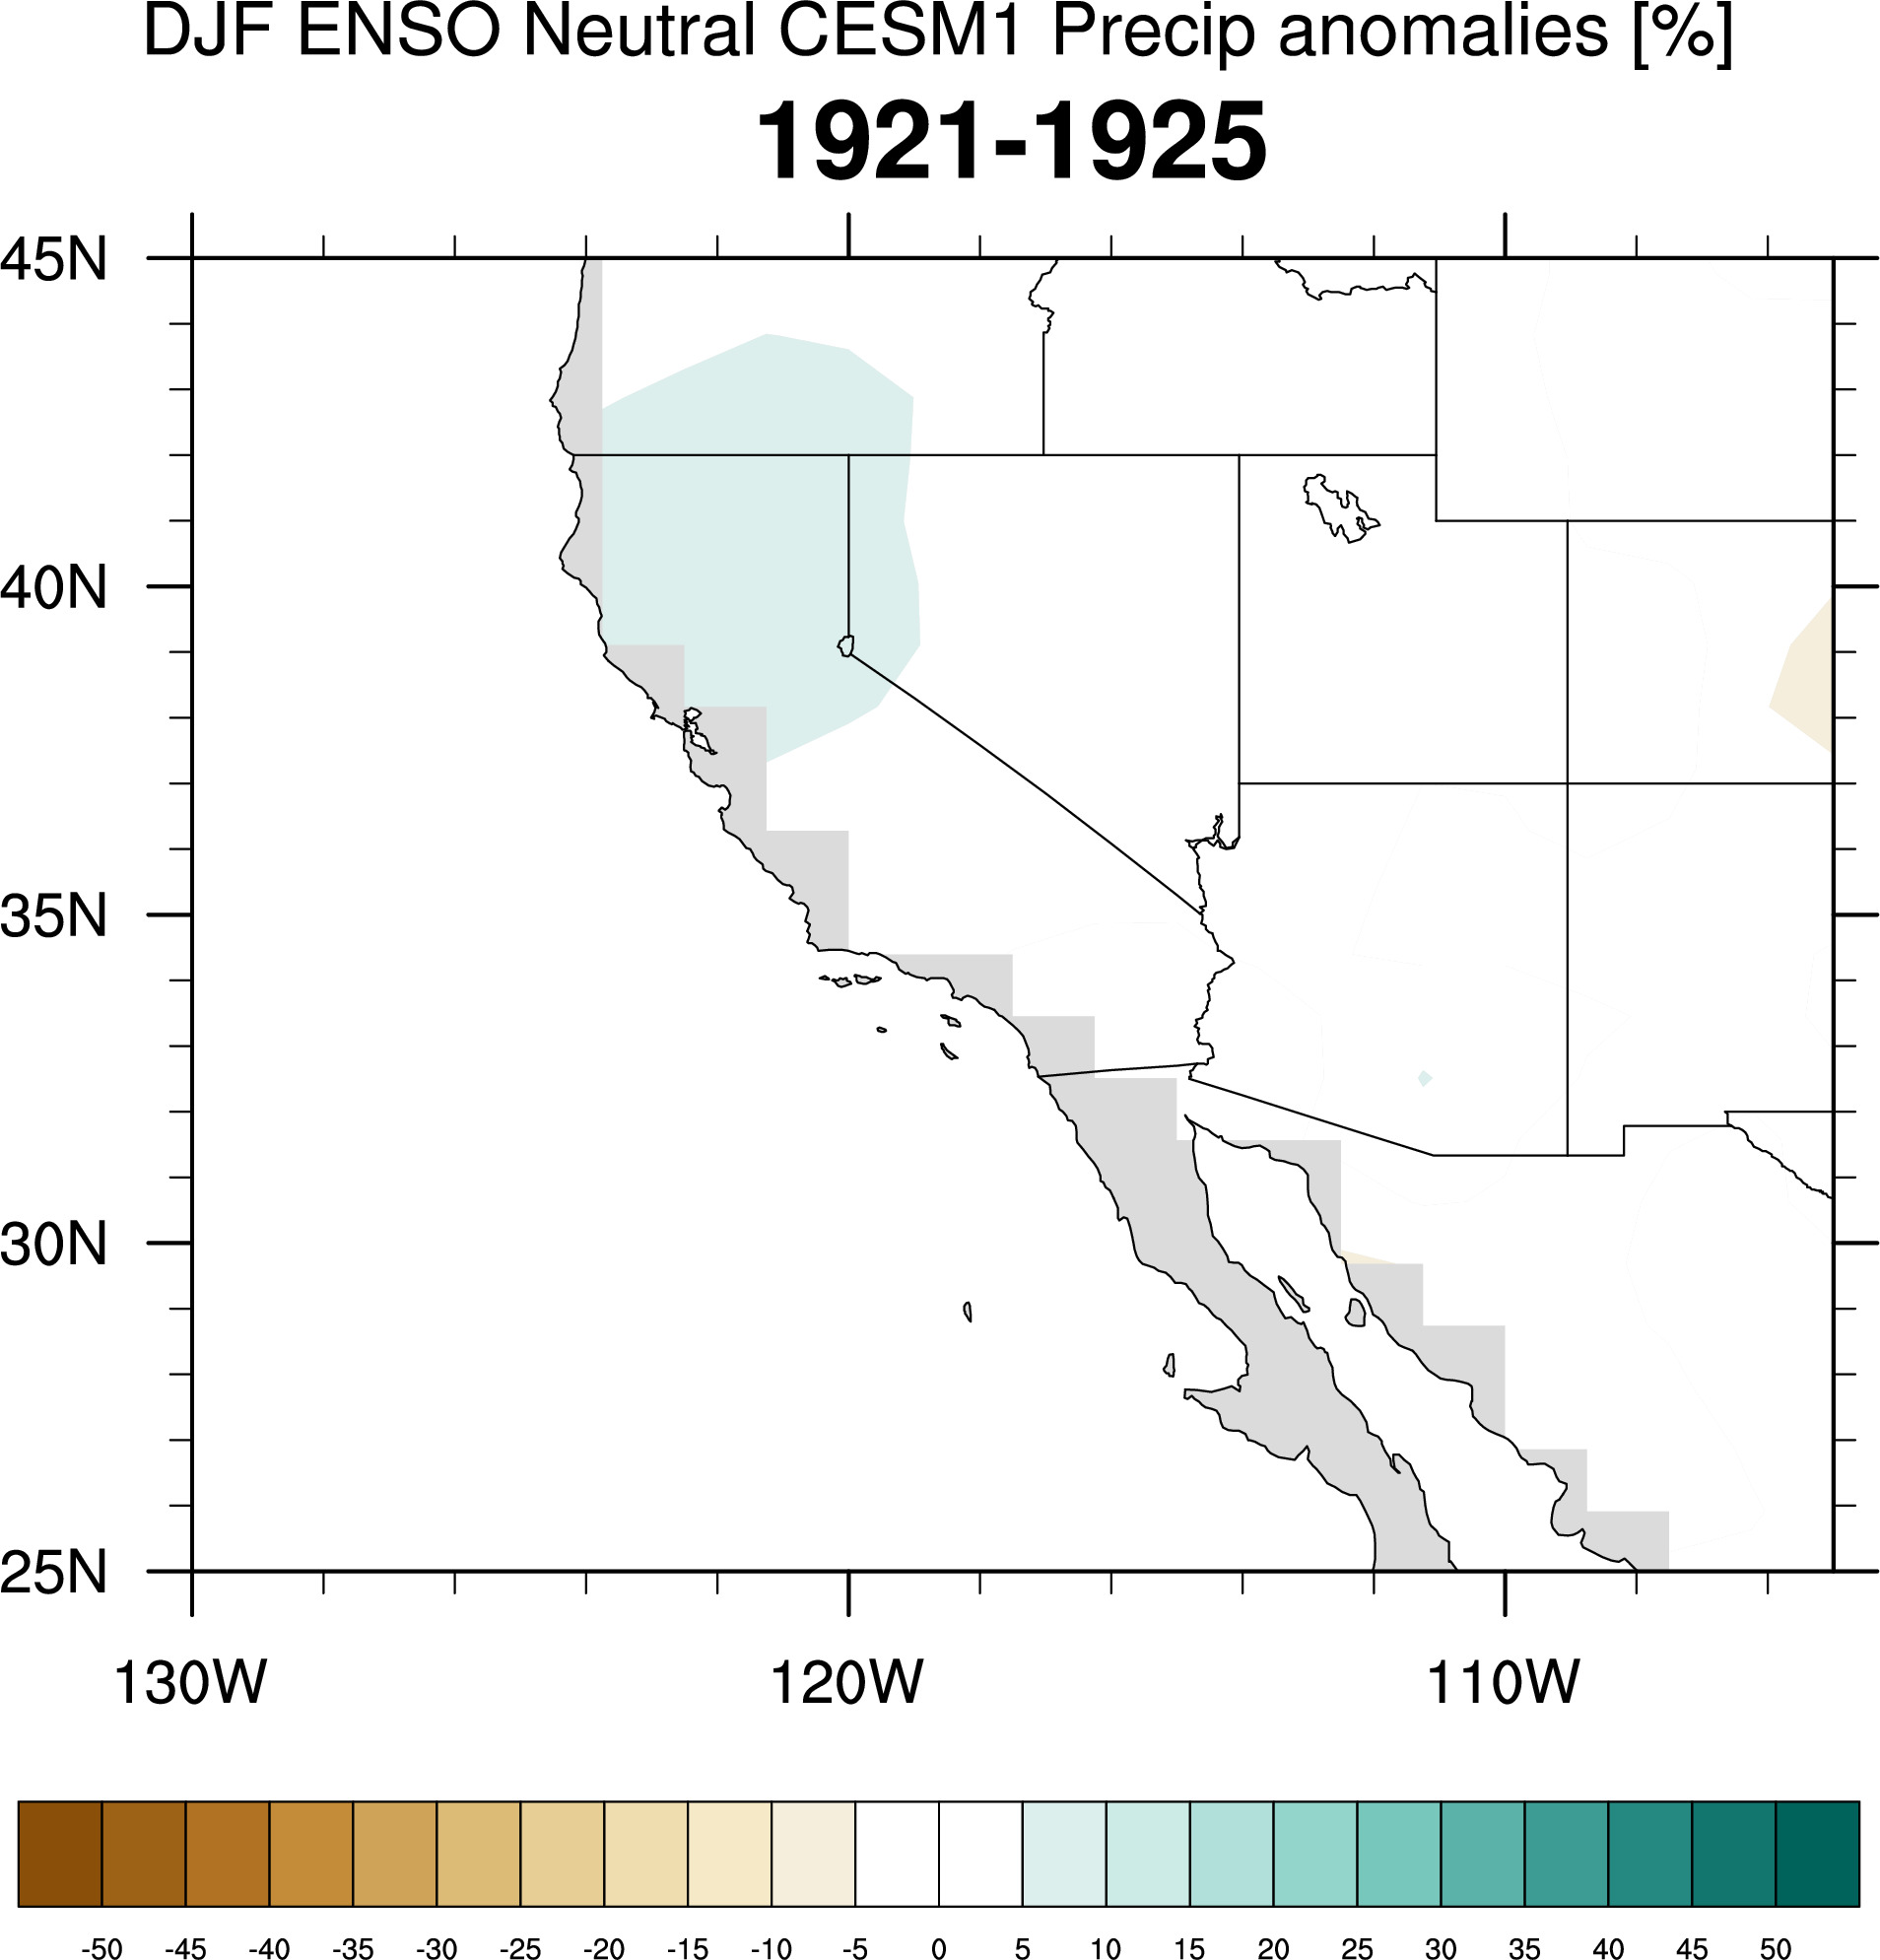
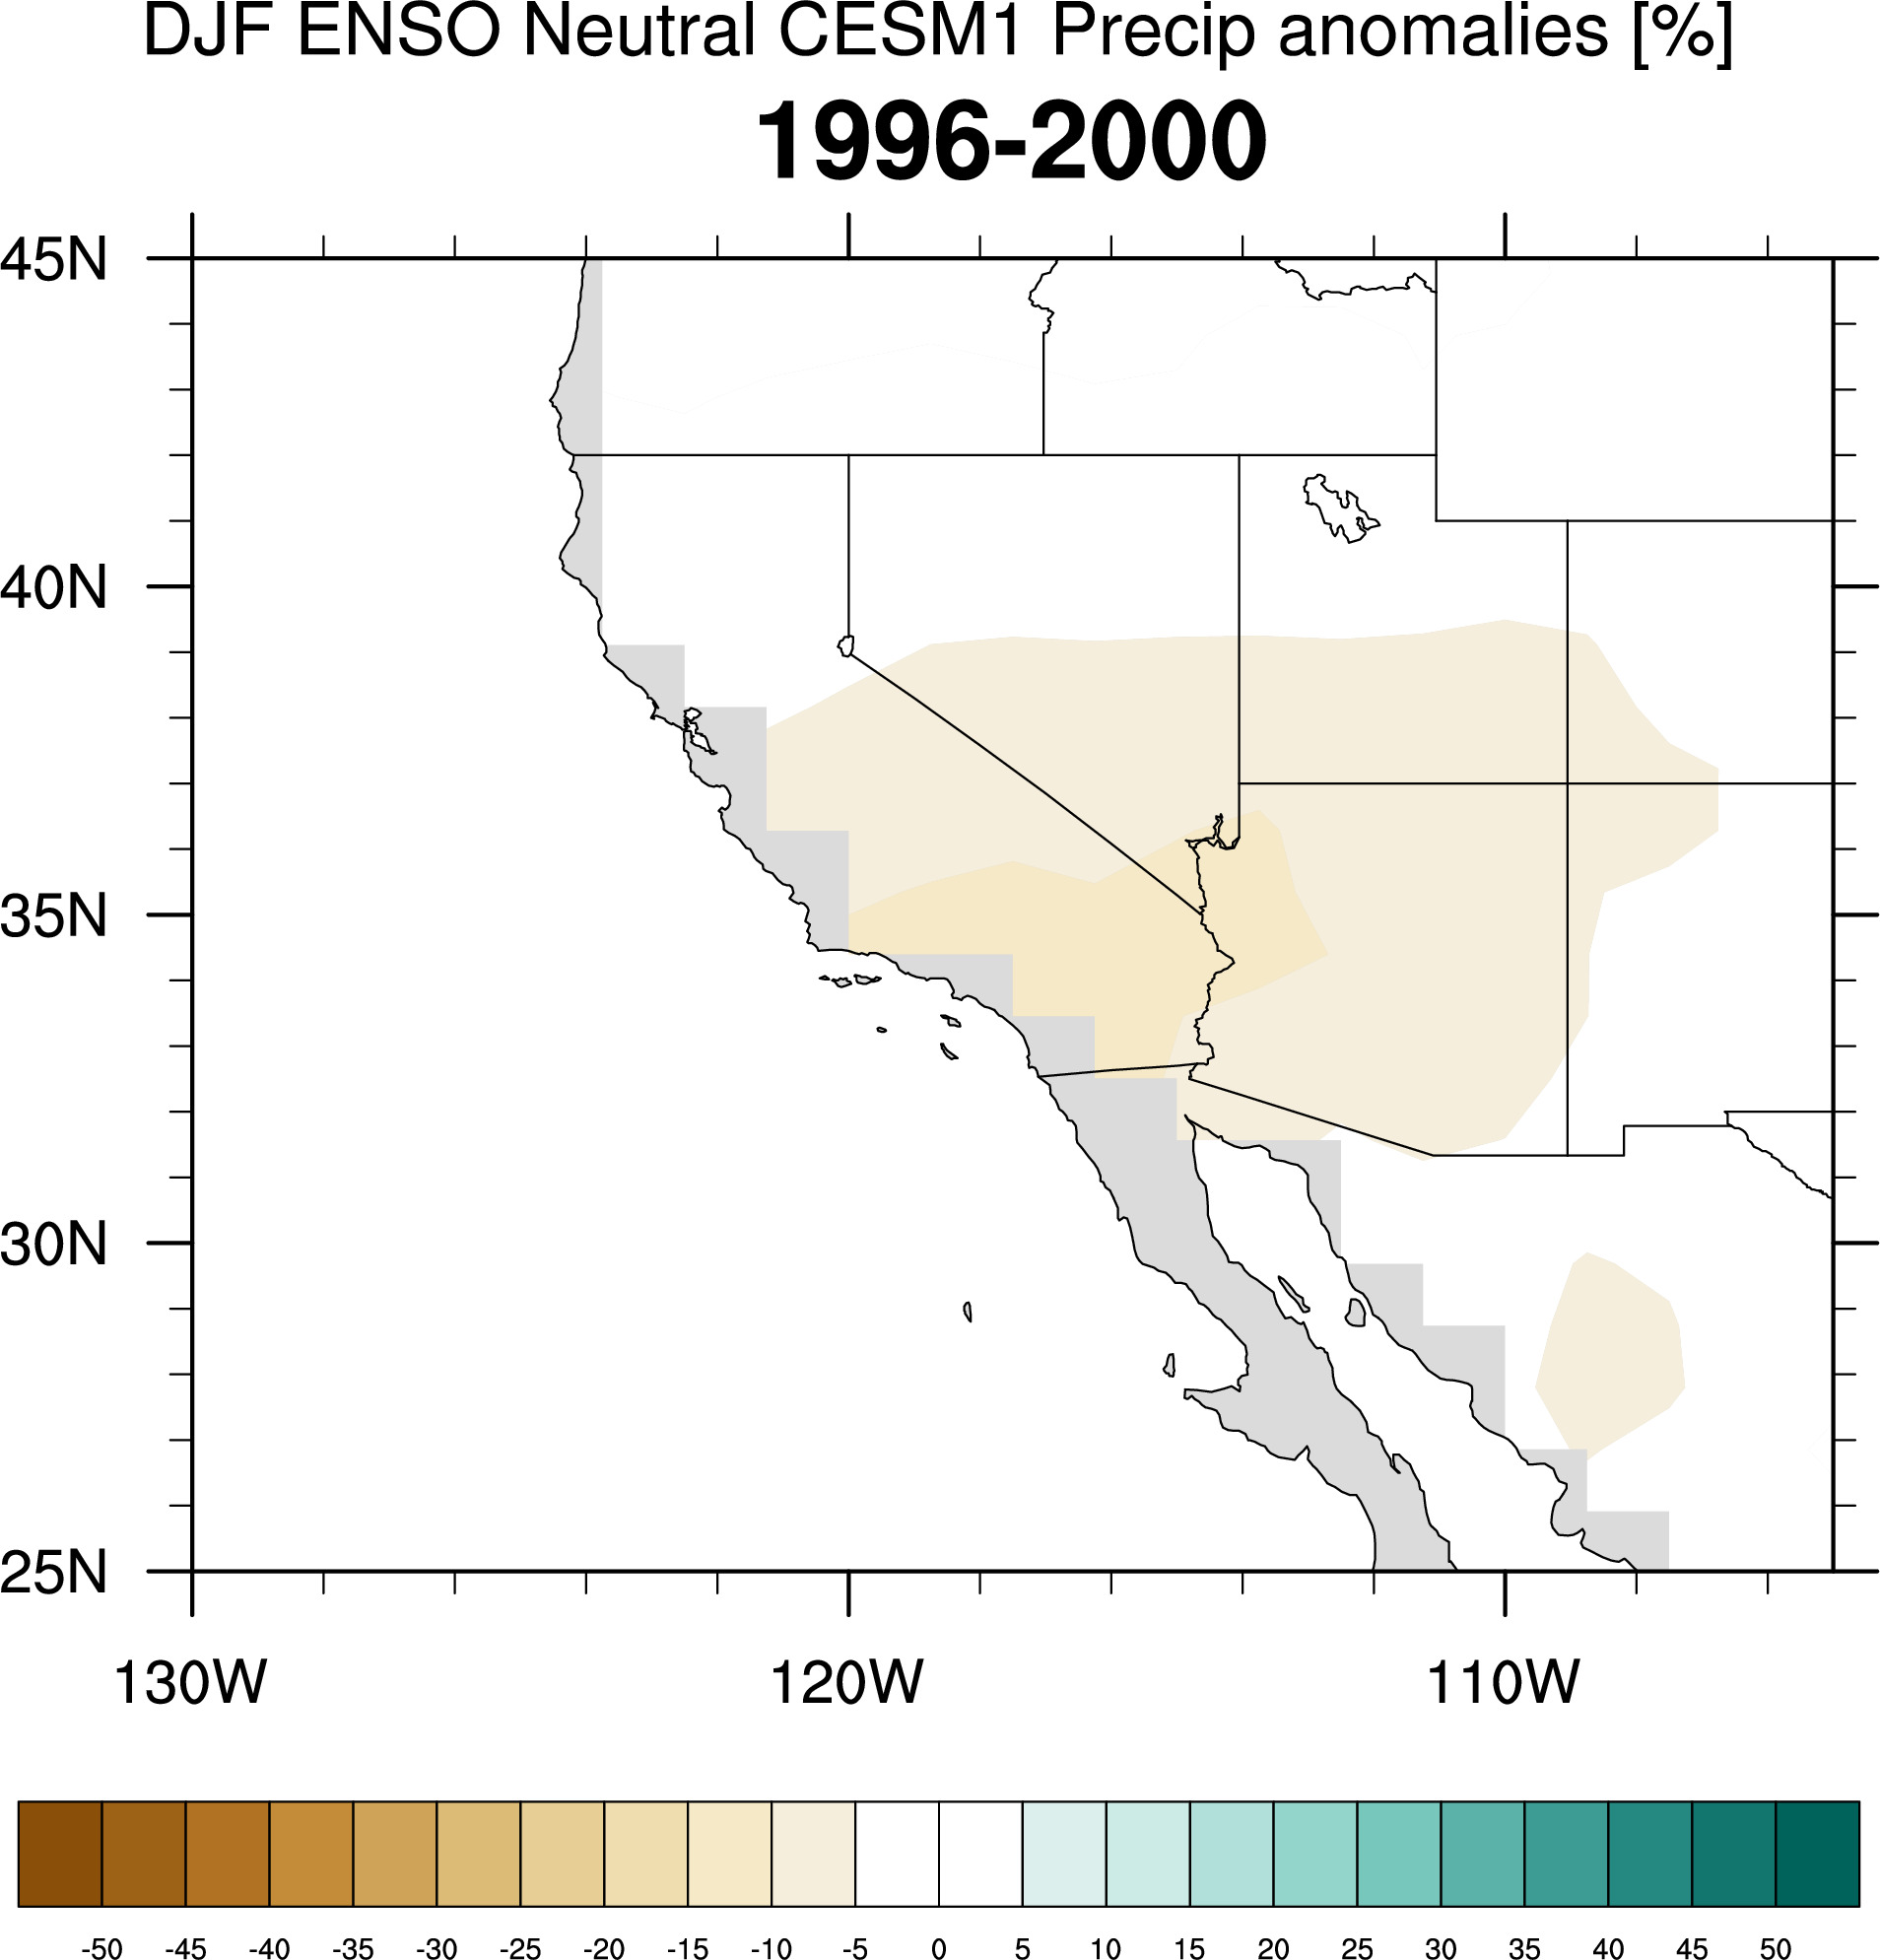
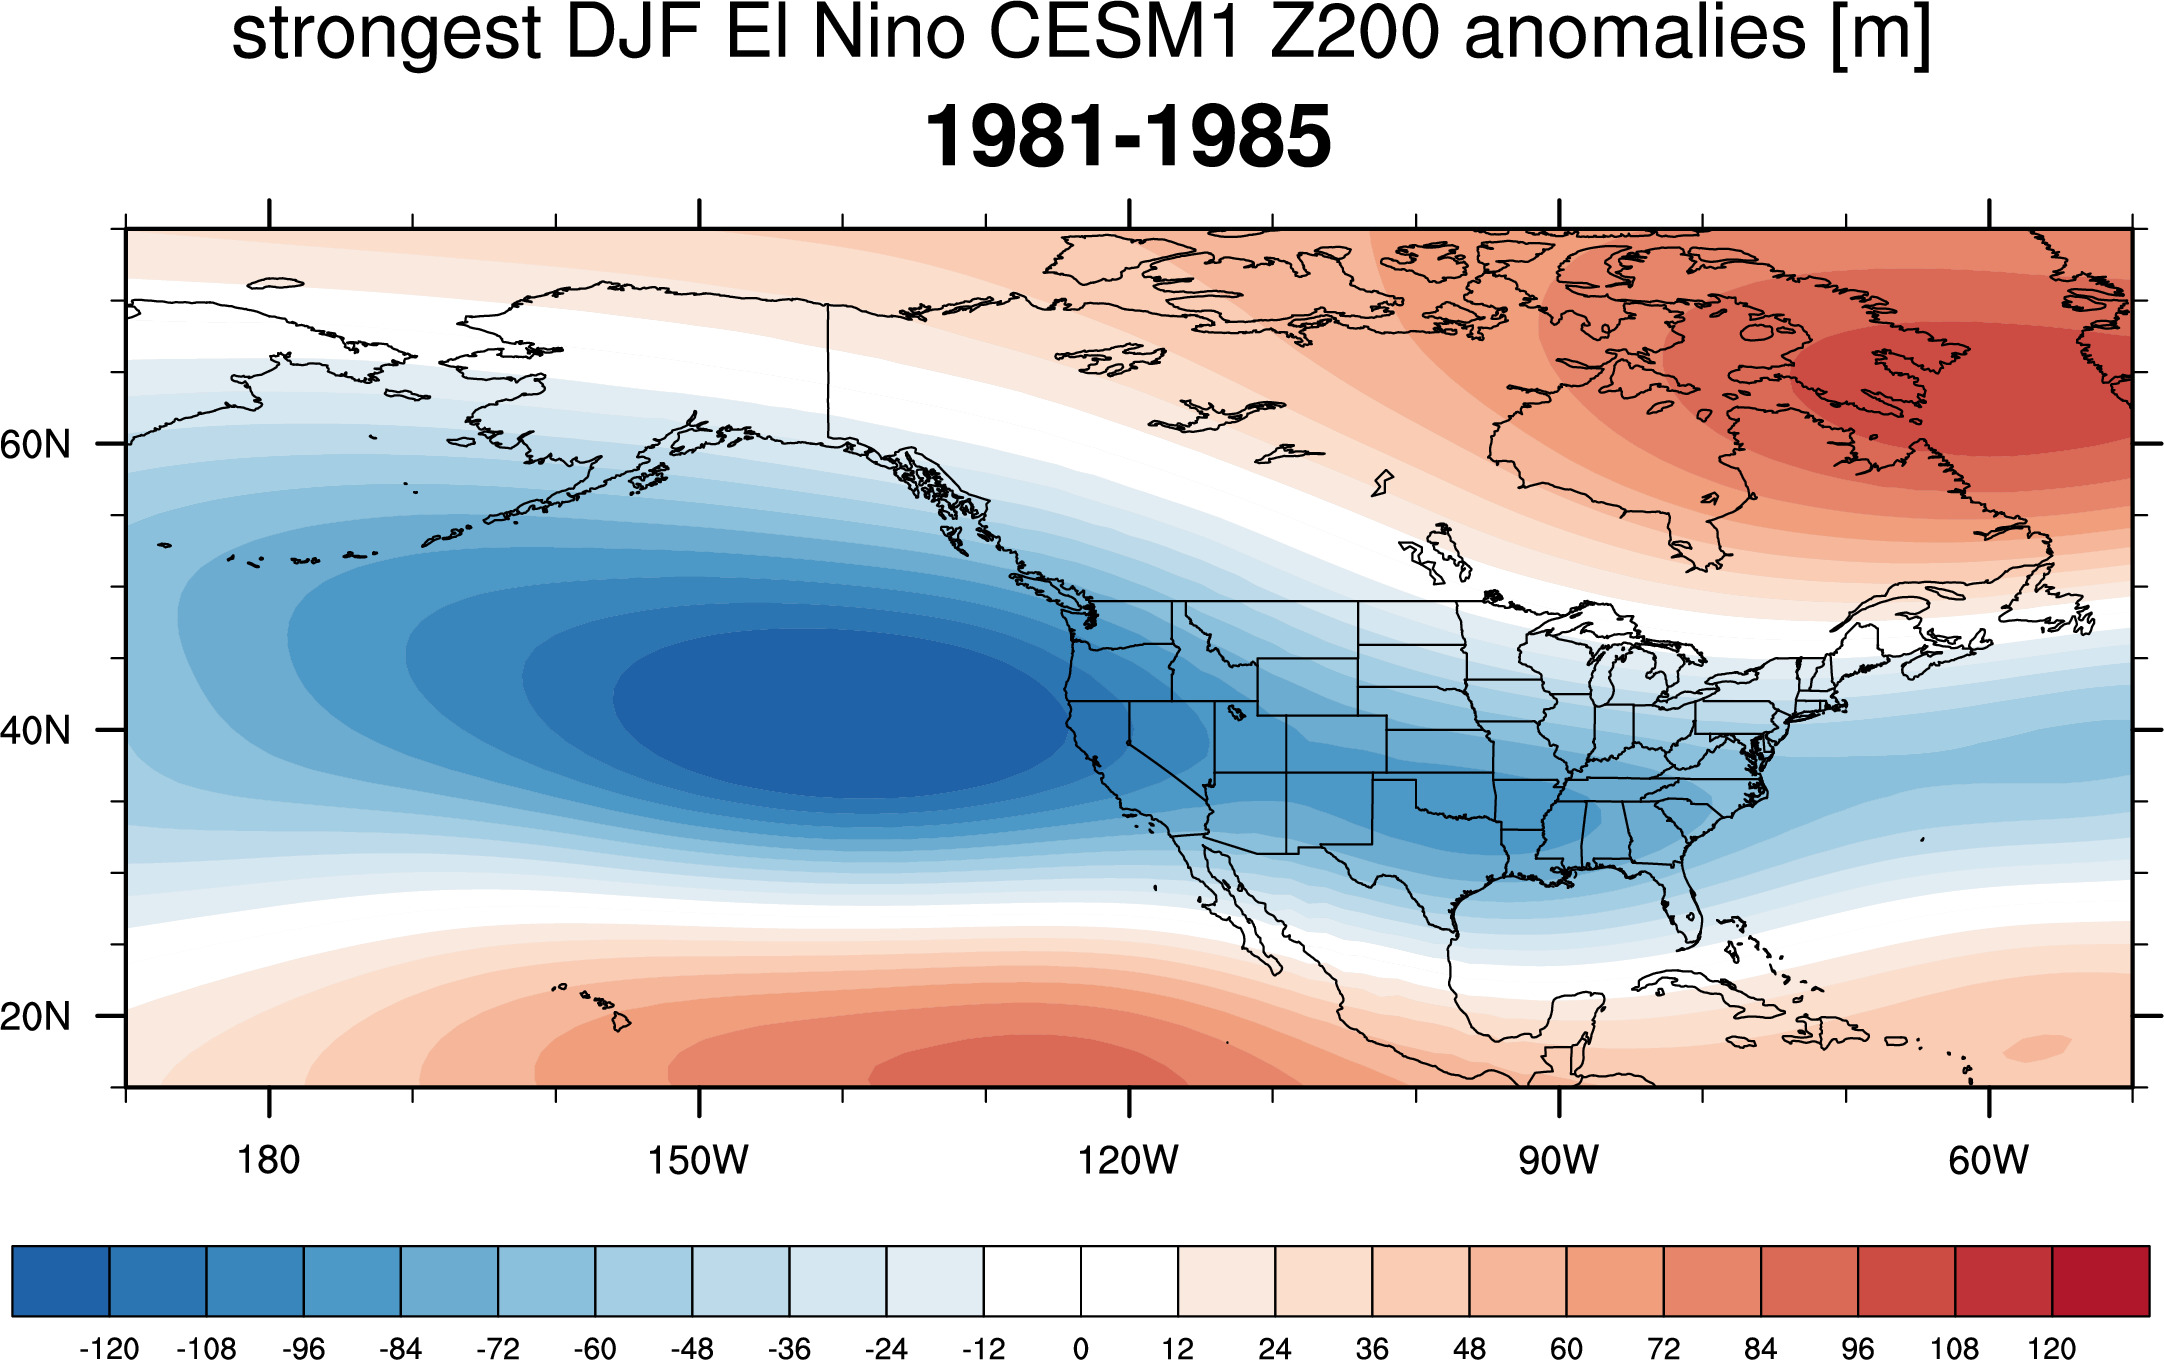
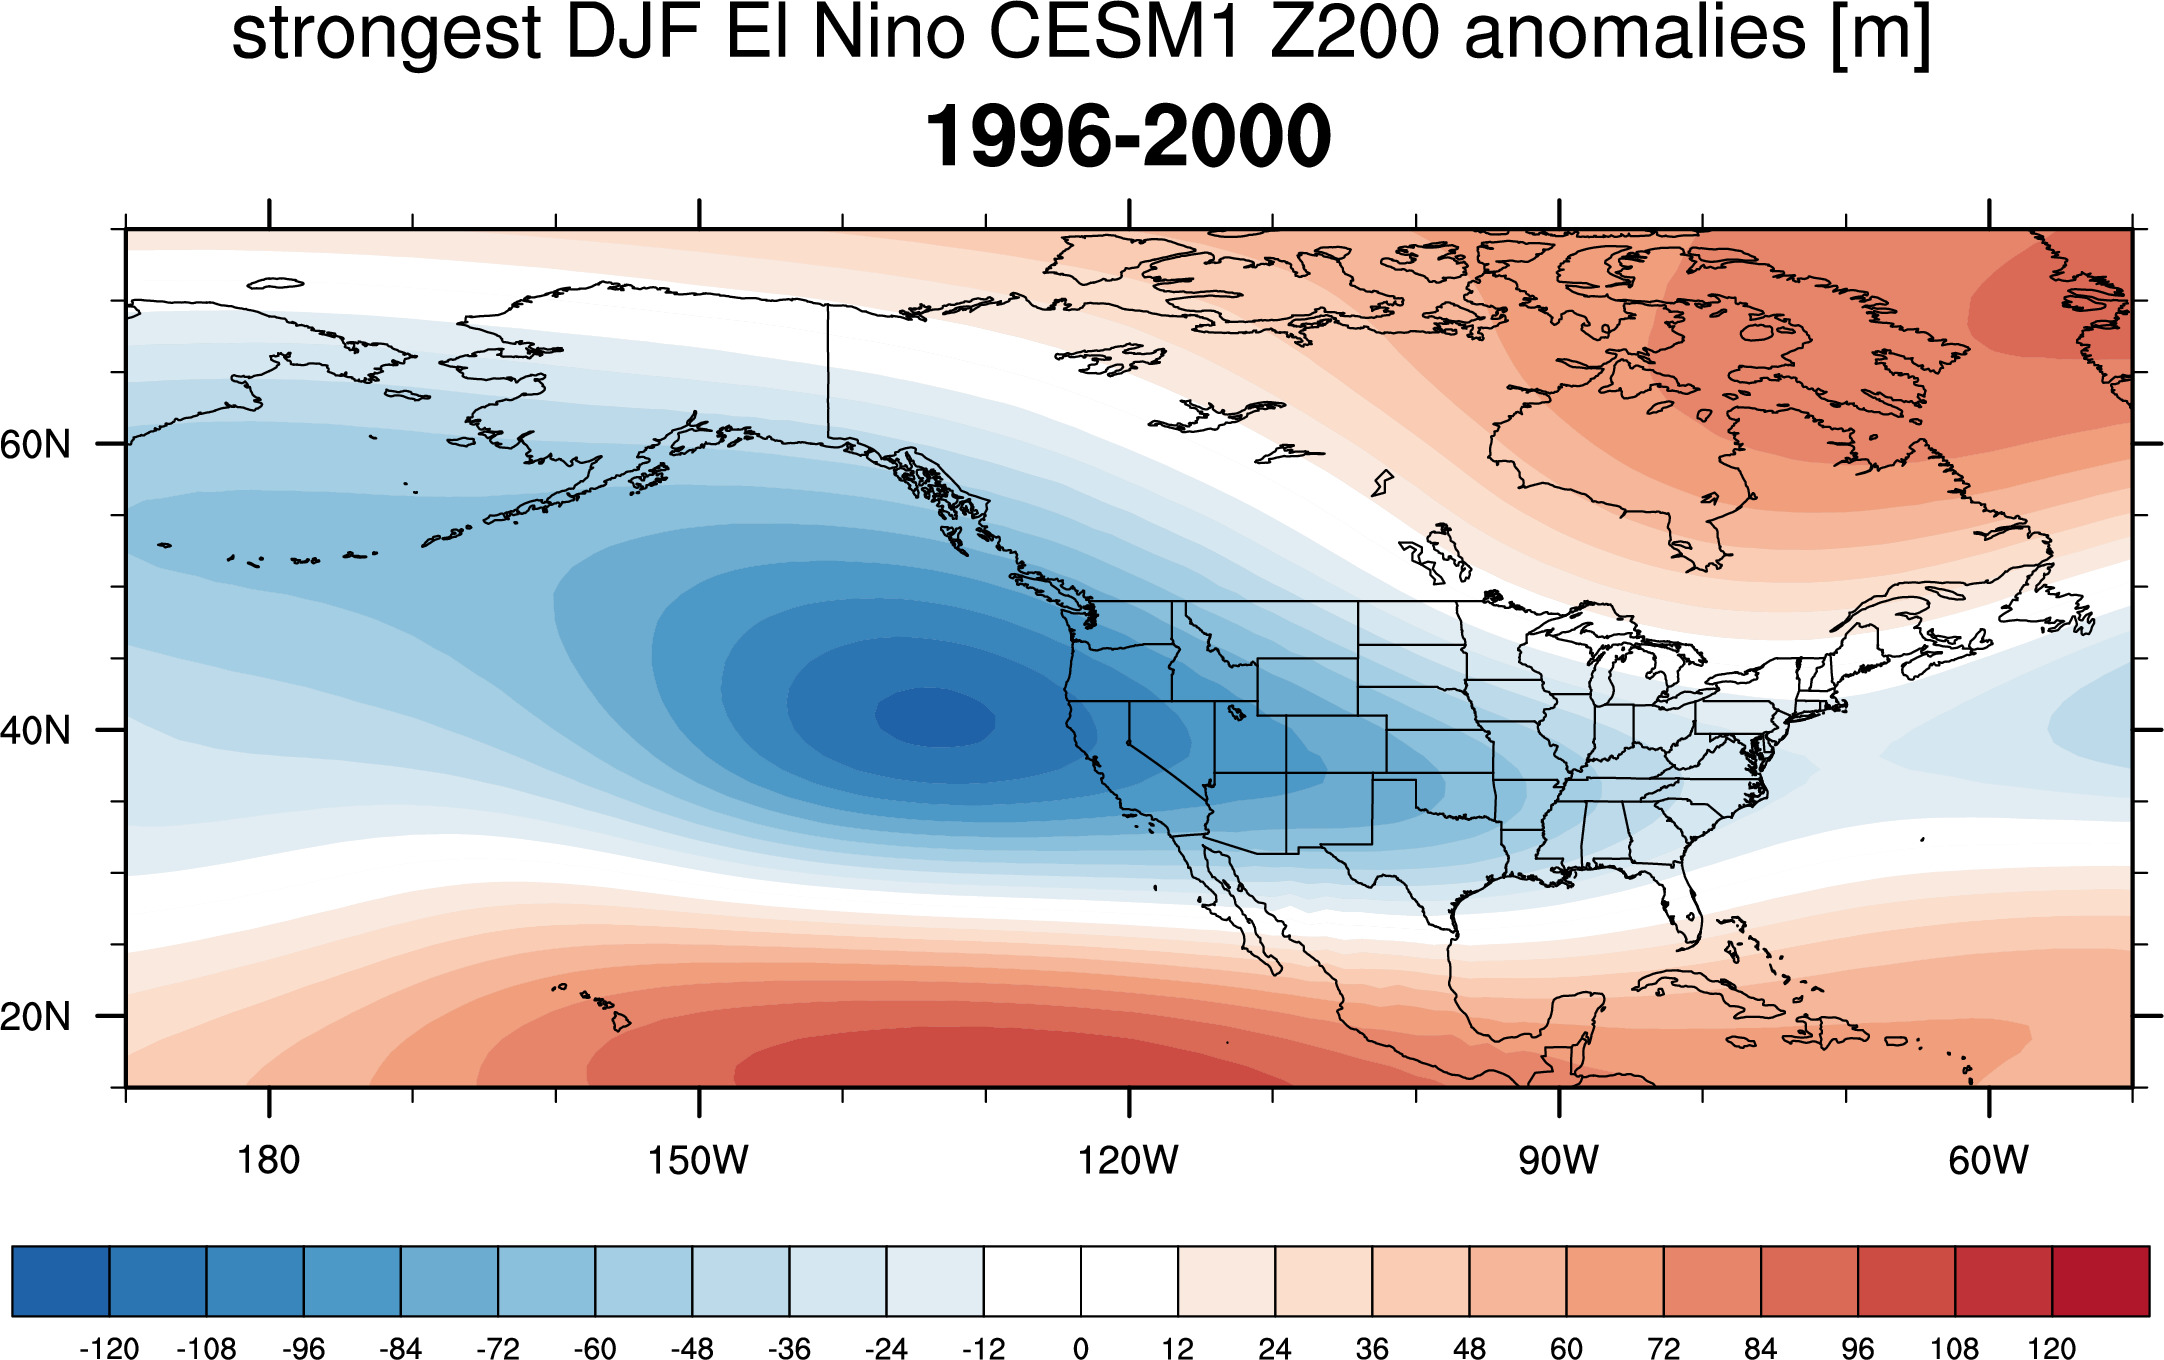
Look at different 5 year periods: 1921-1925, 1981-1985, 1996-2000, 2016-2020
non-El Nino regimes at bottom.
----------------------------------------------------------
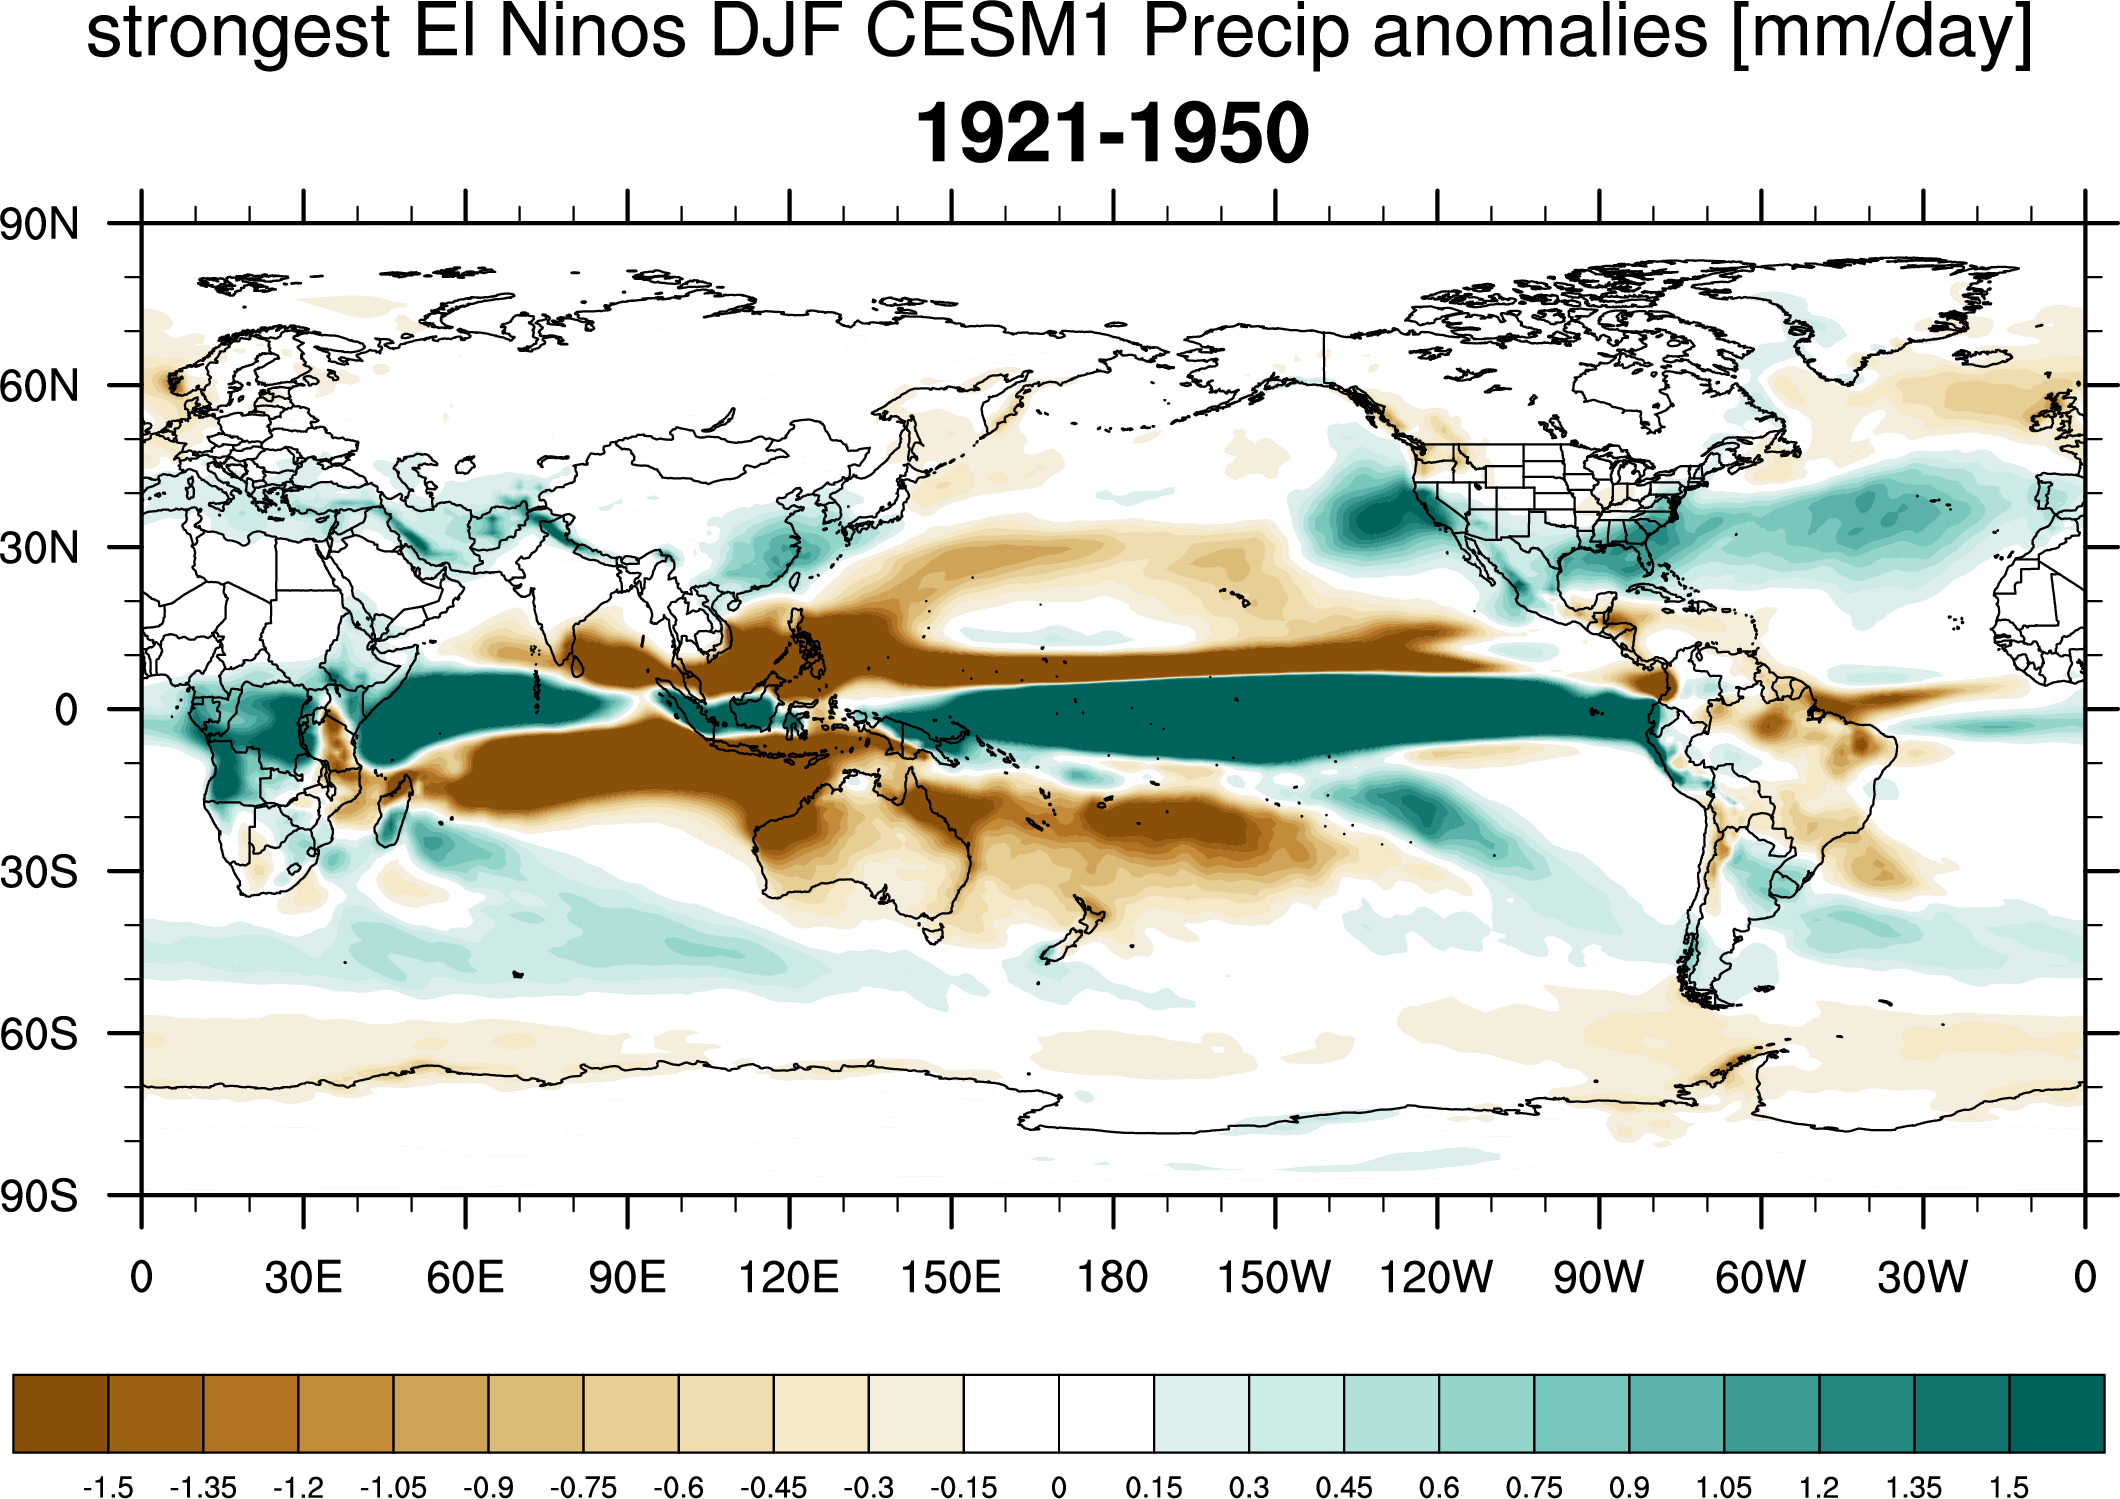
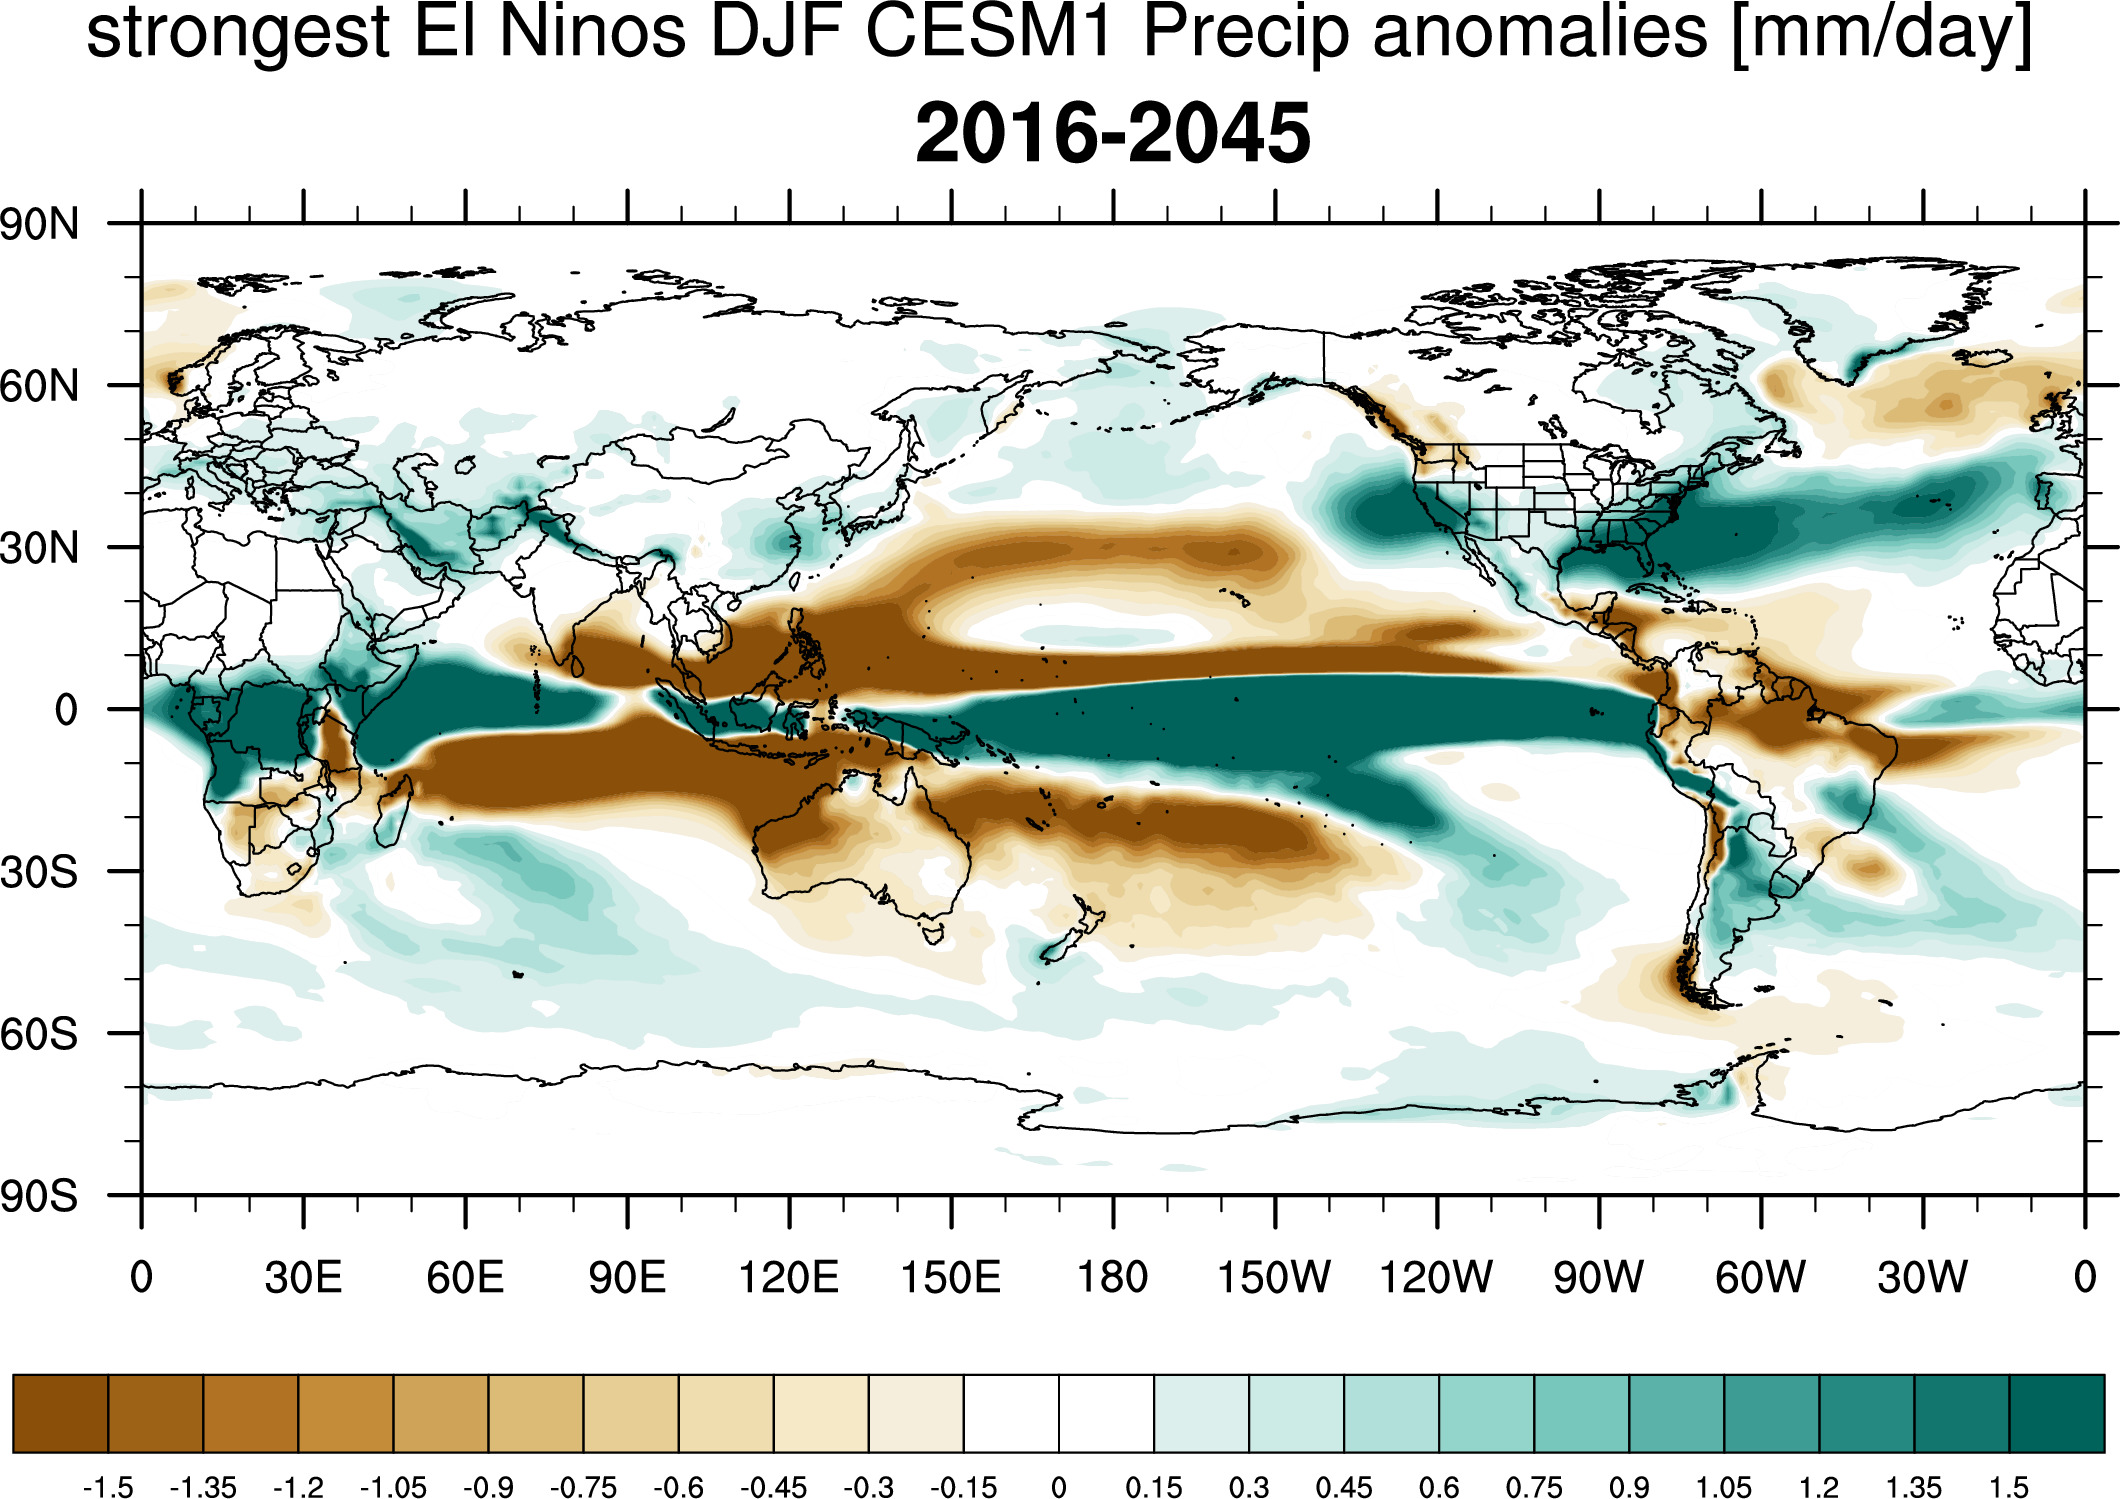
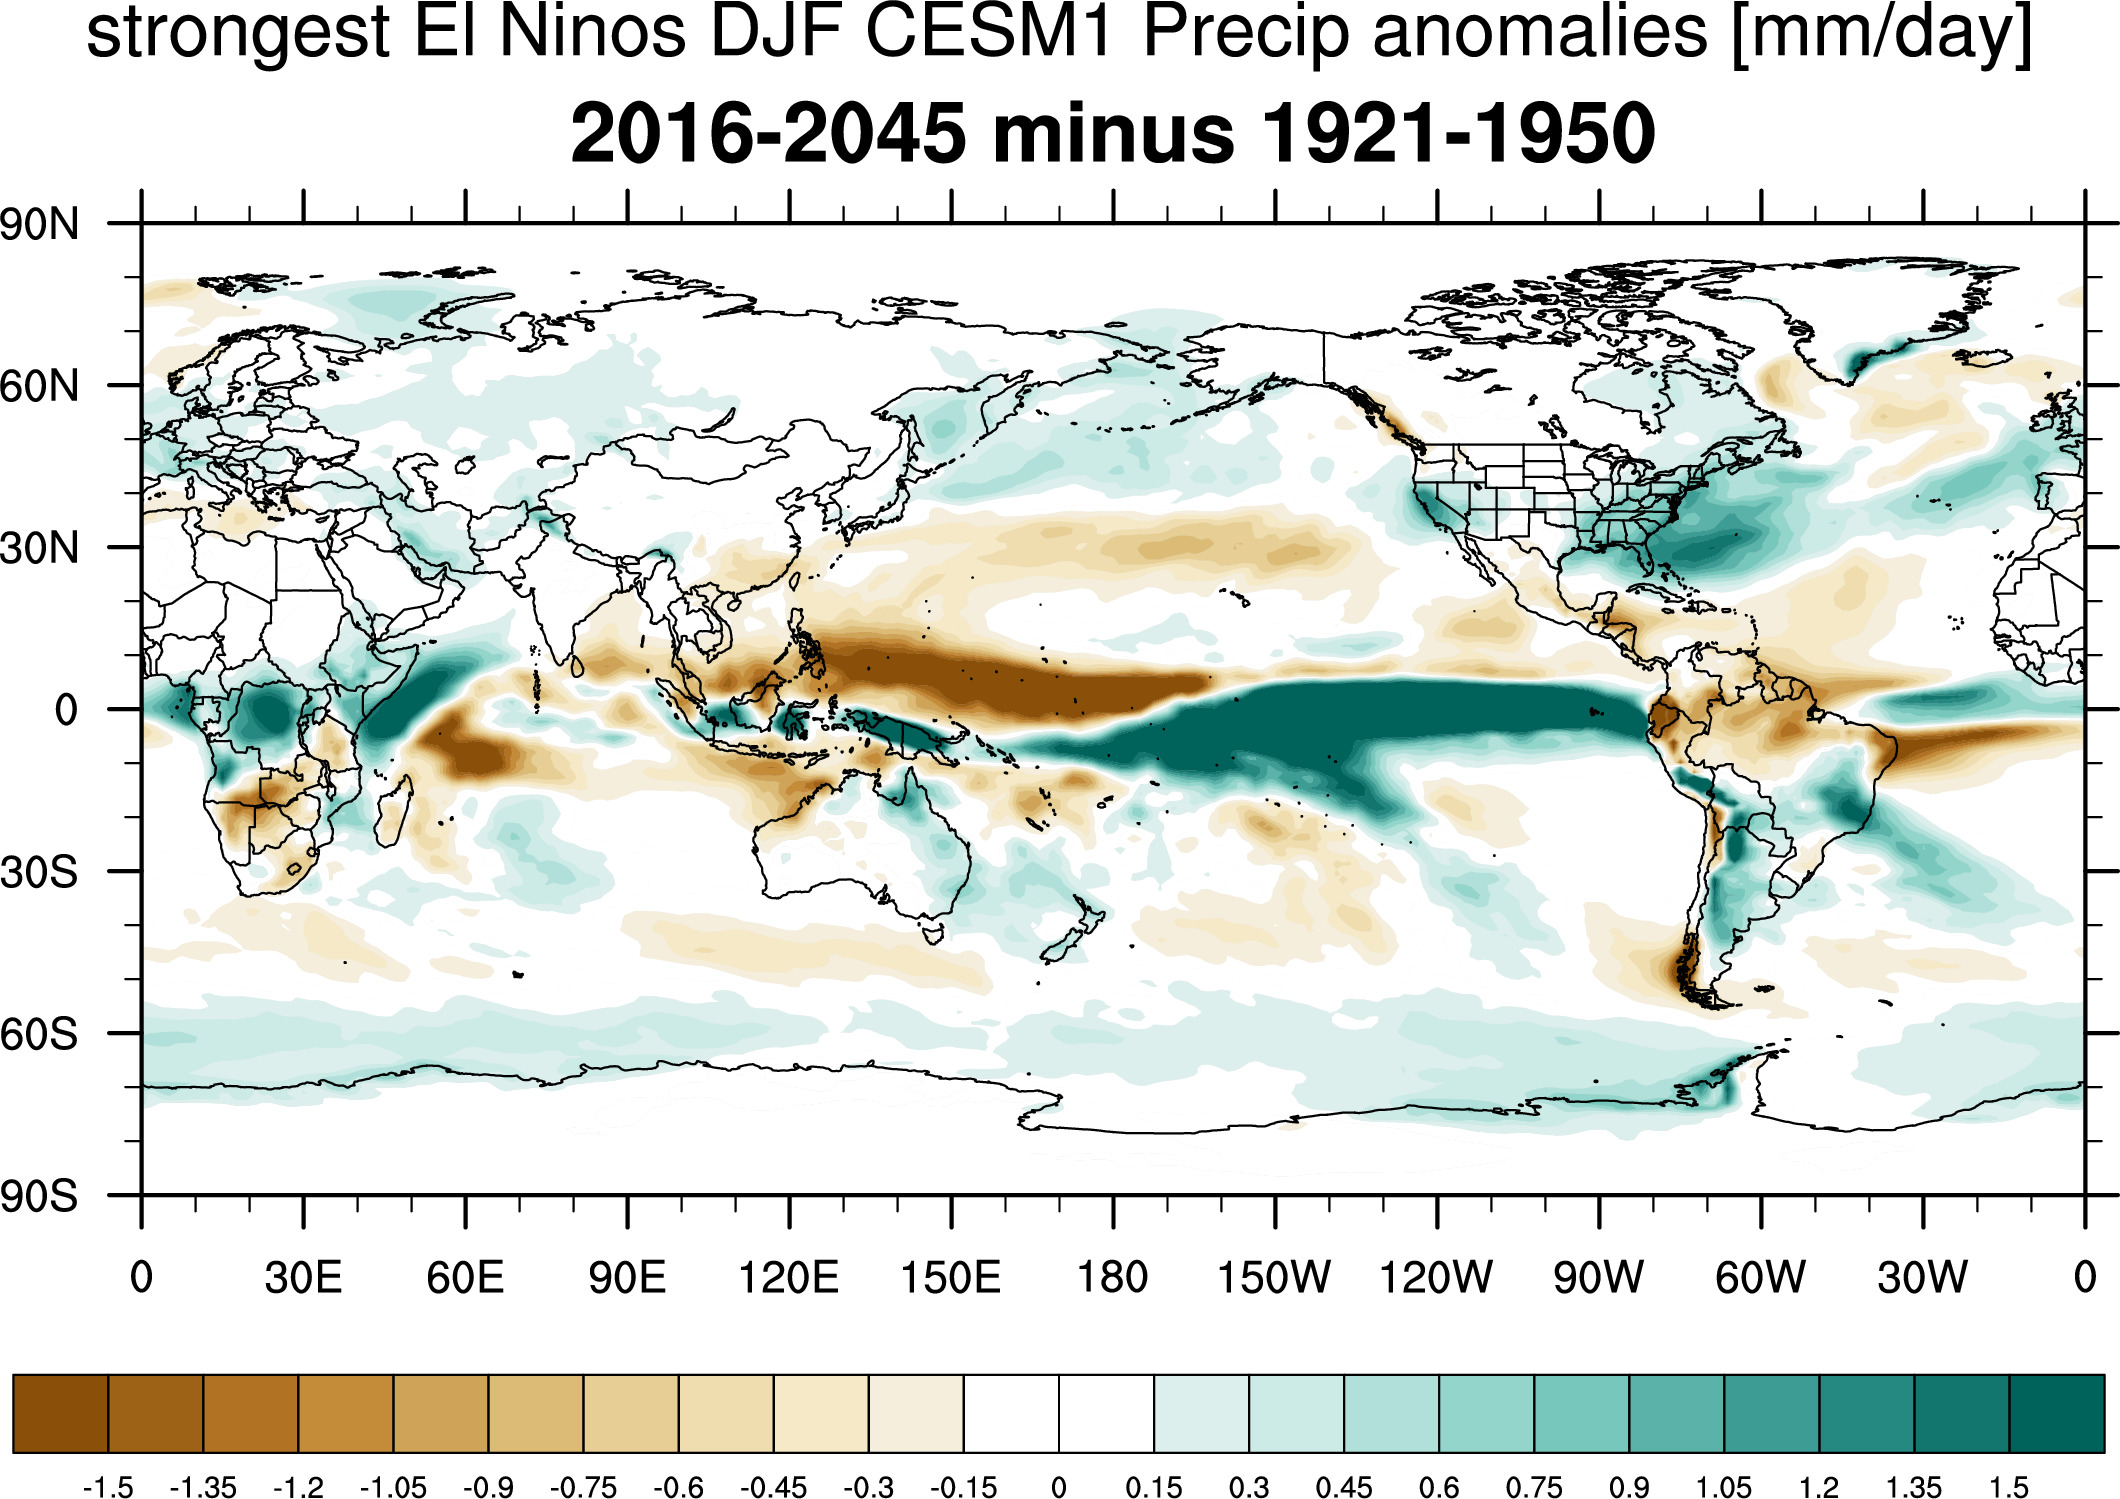
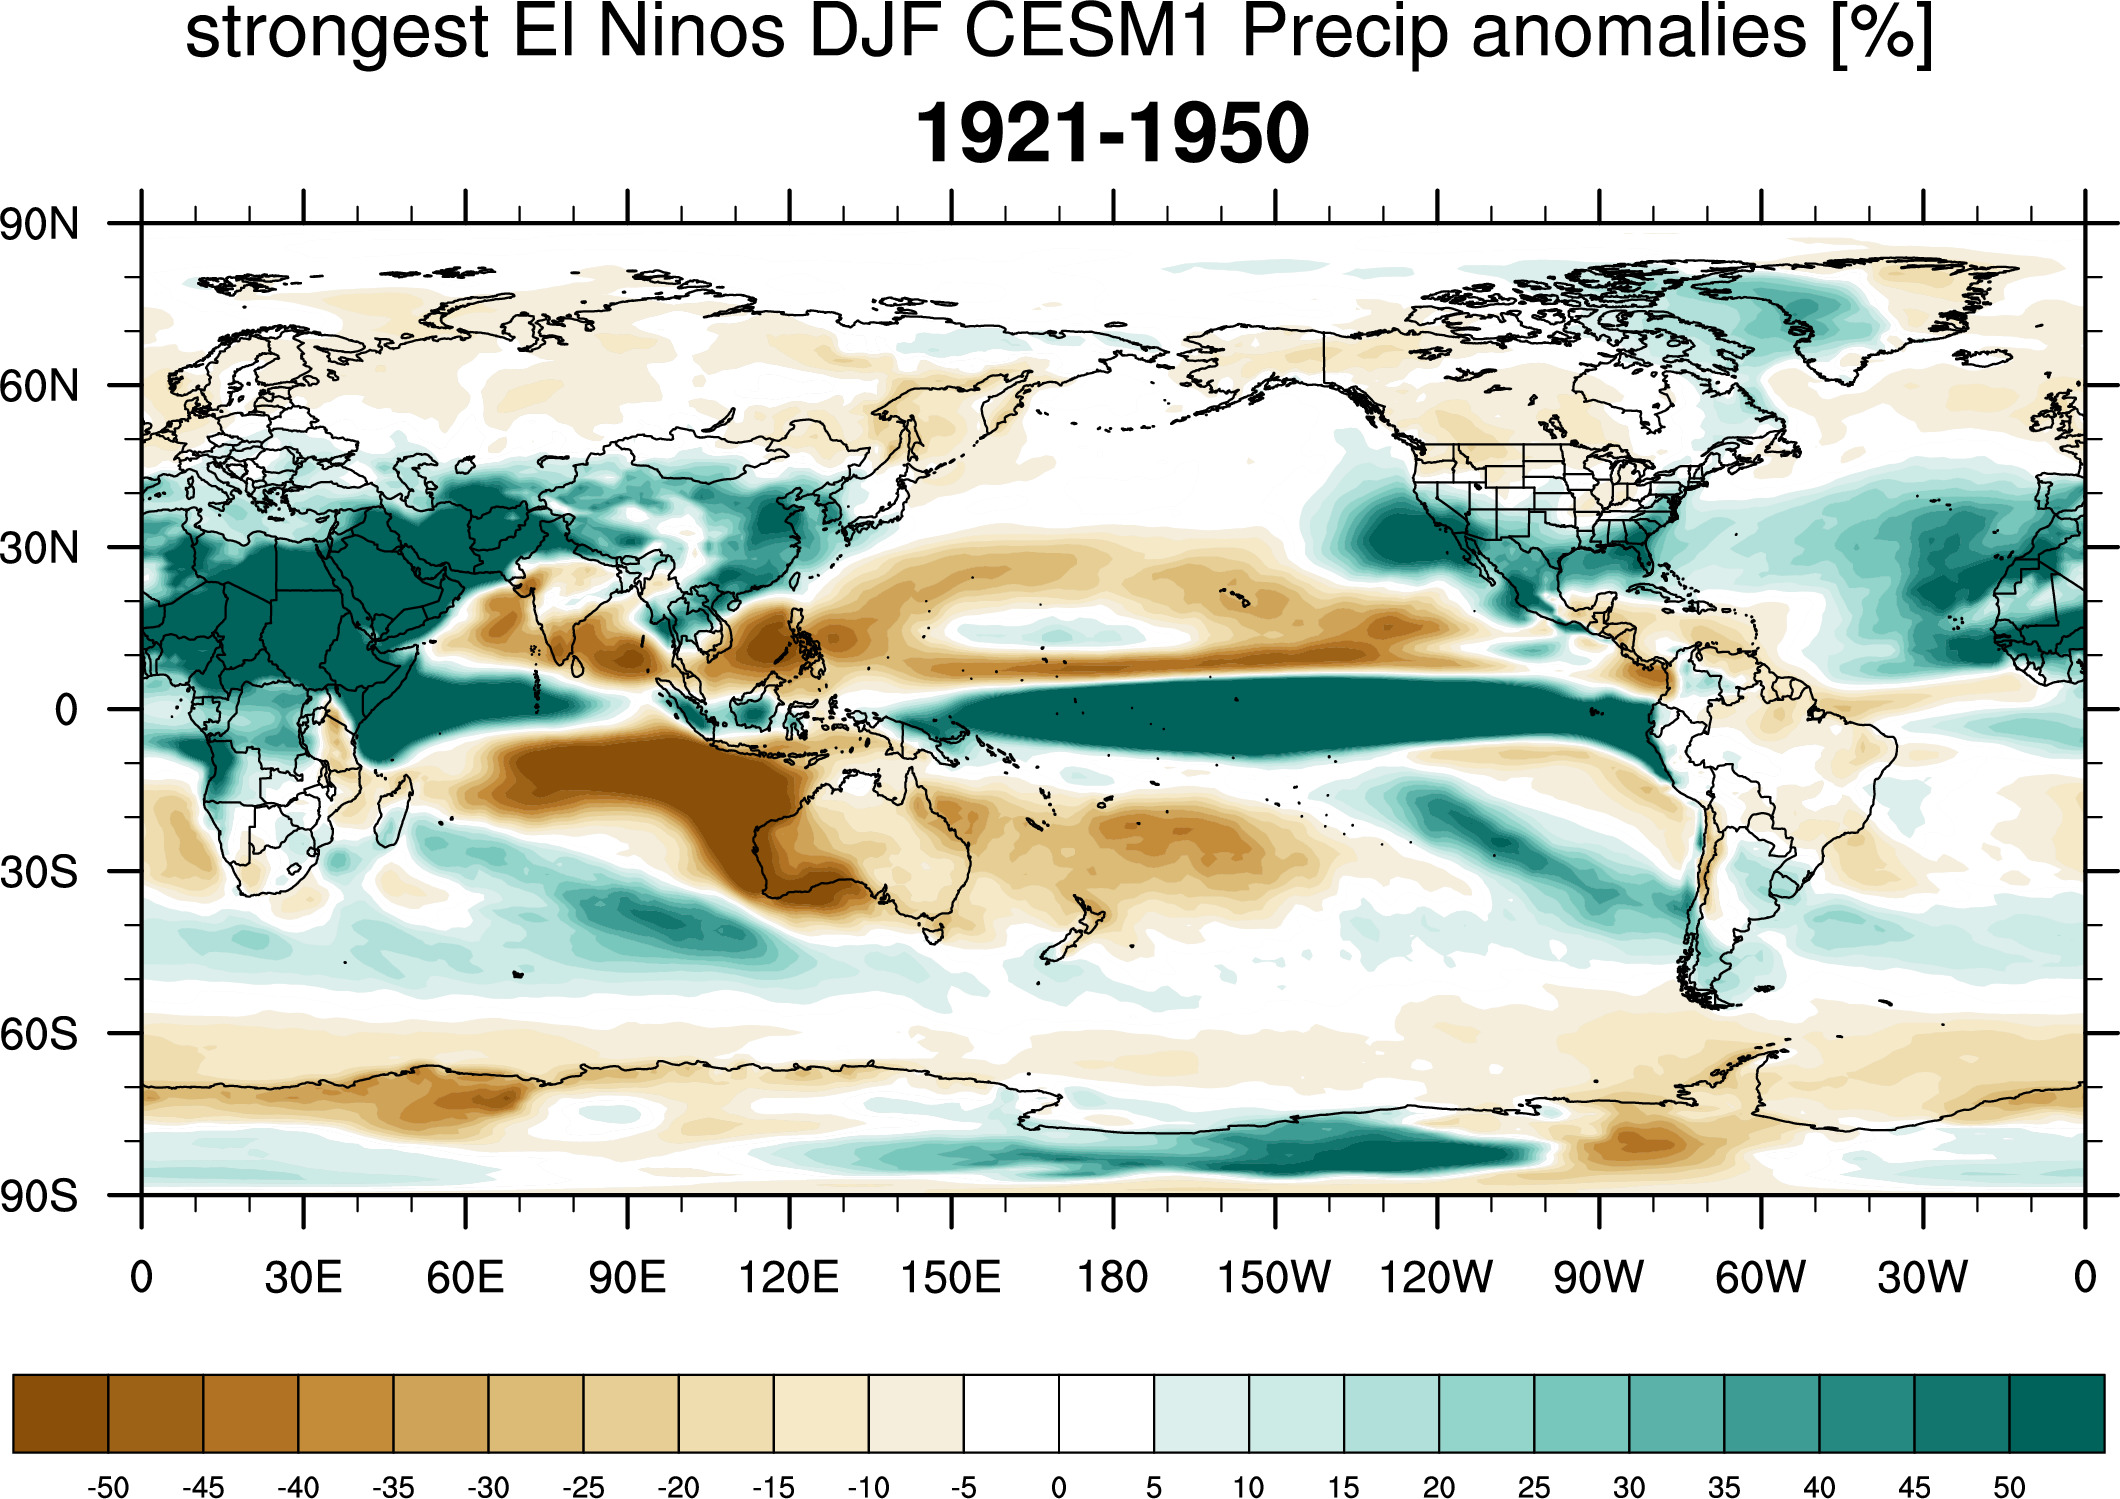
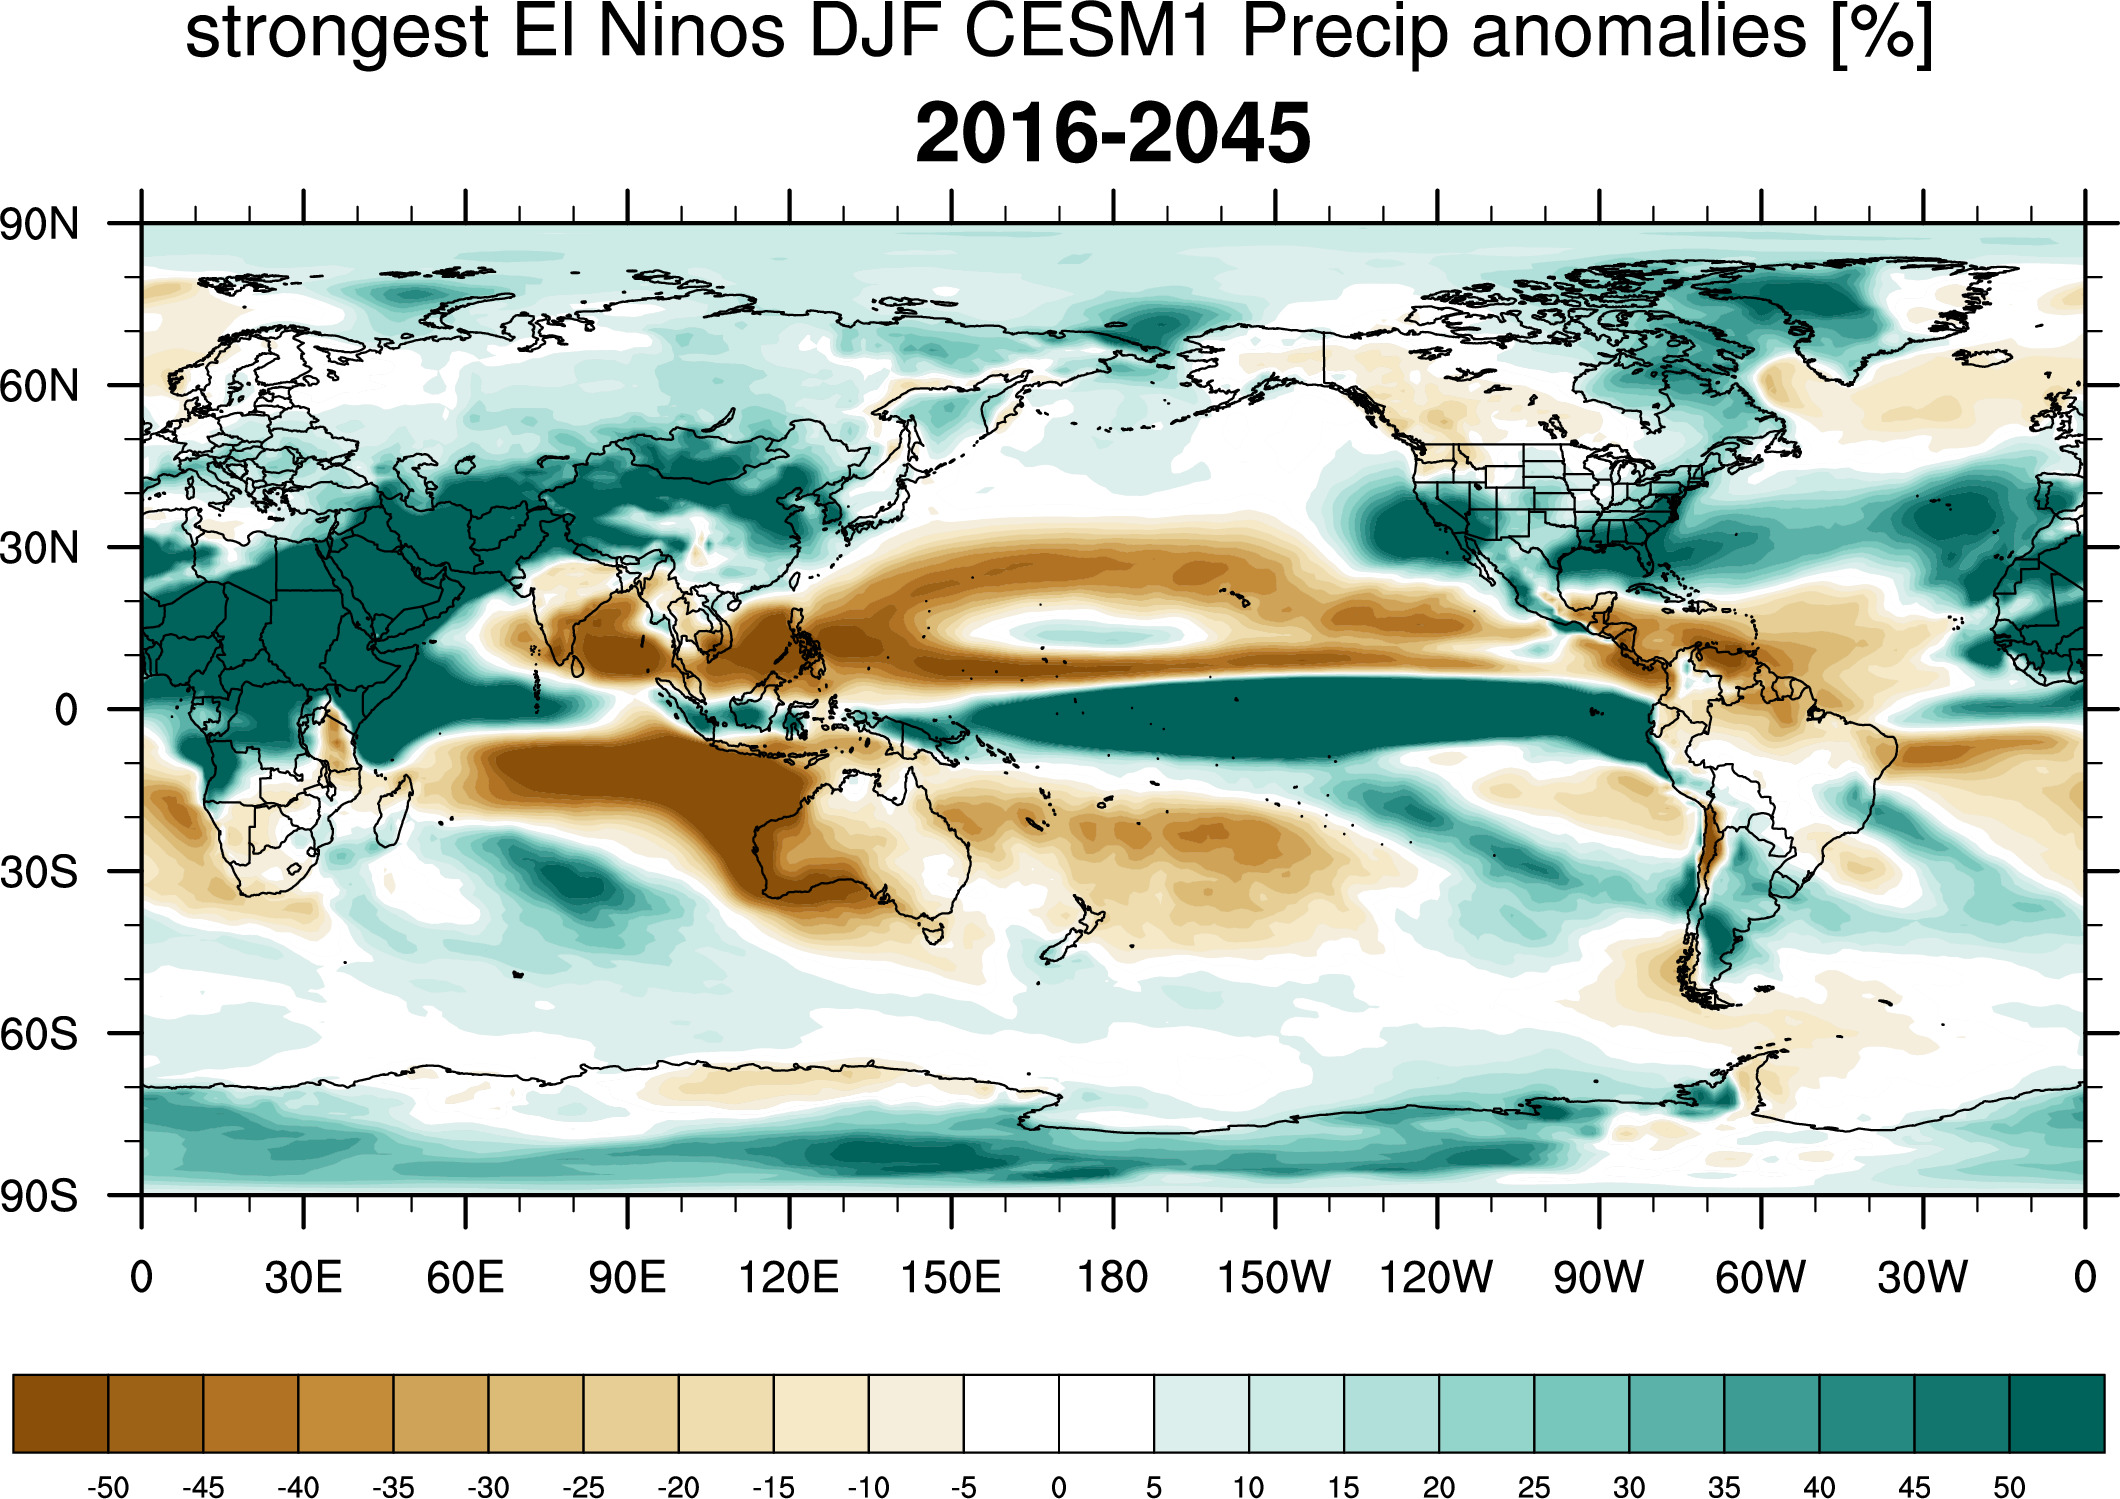
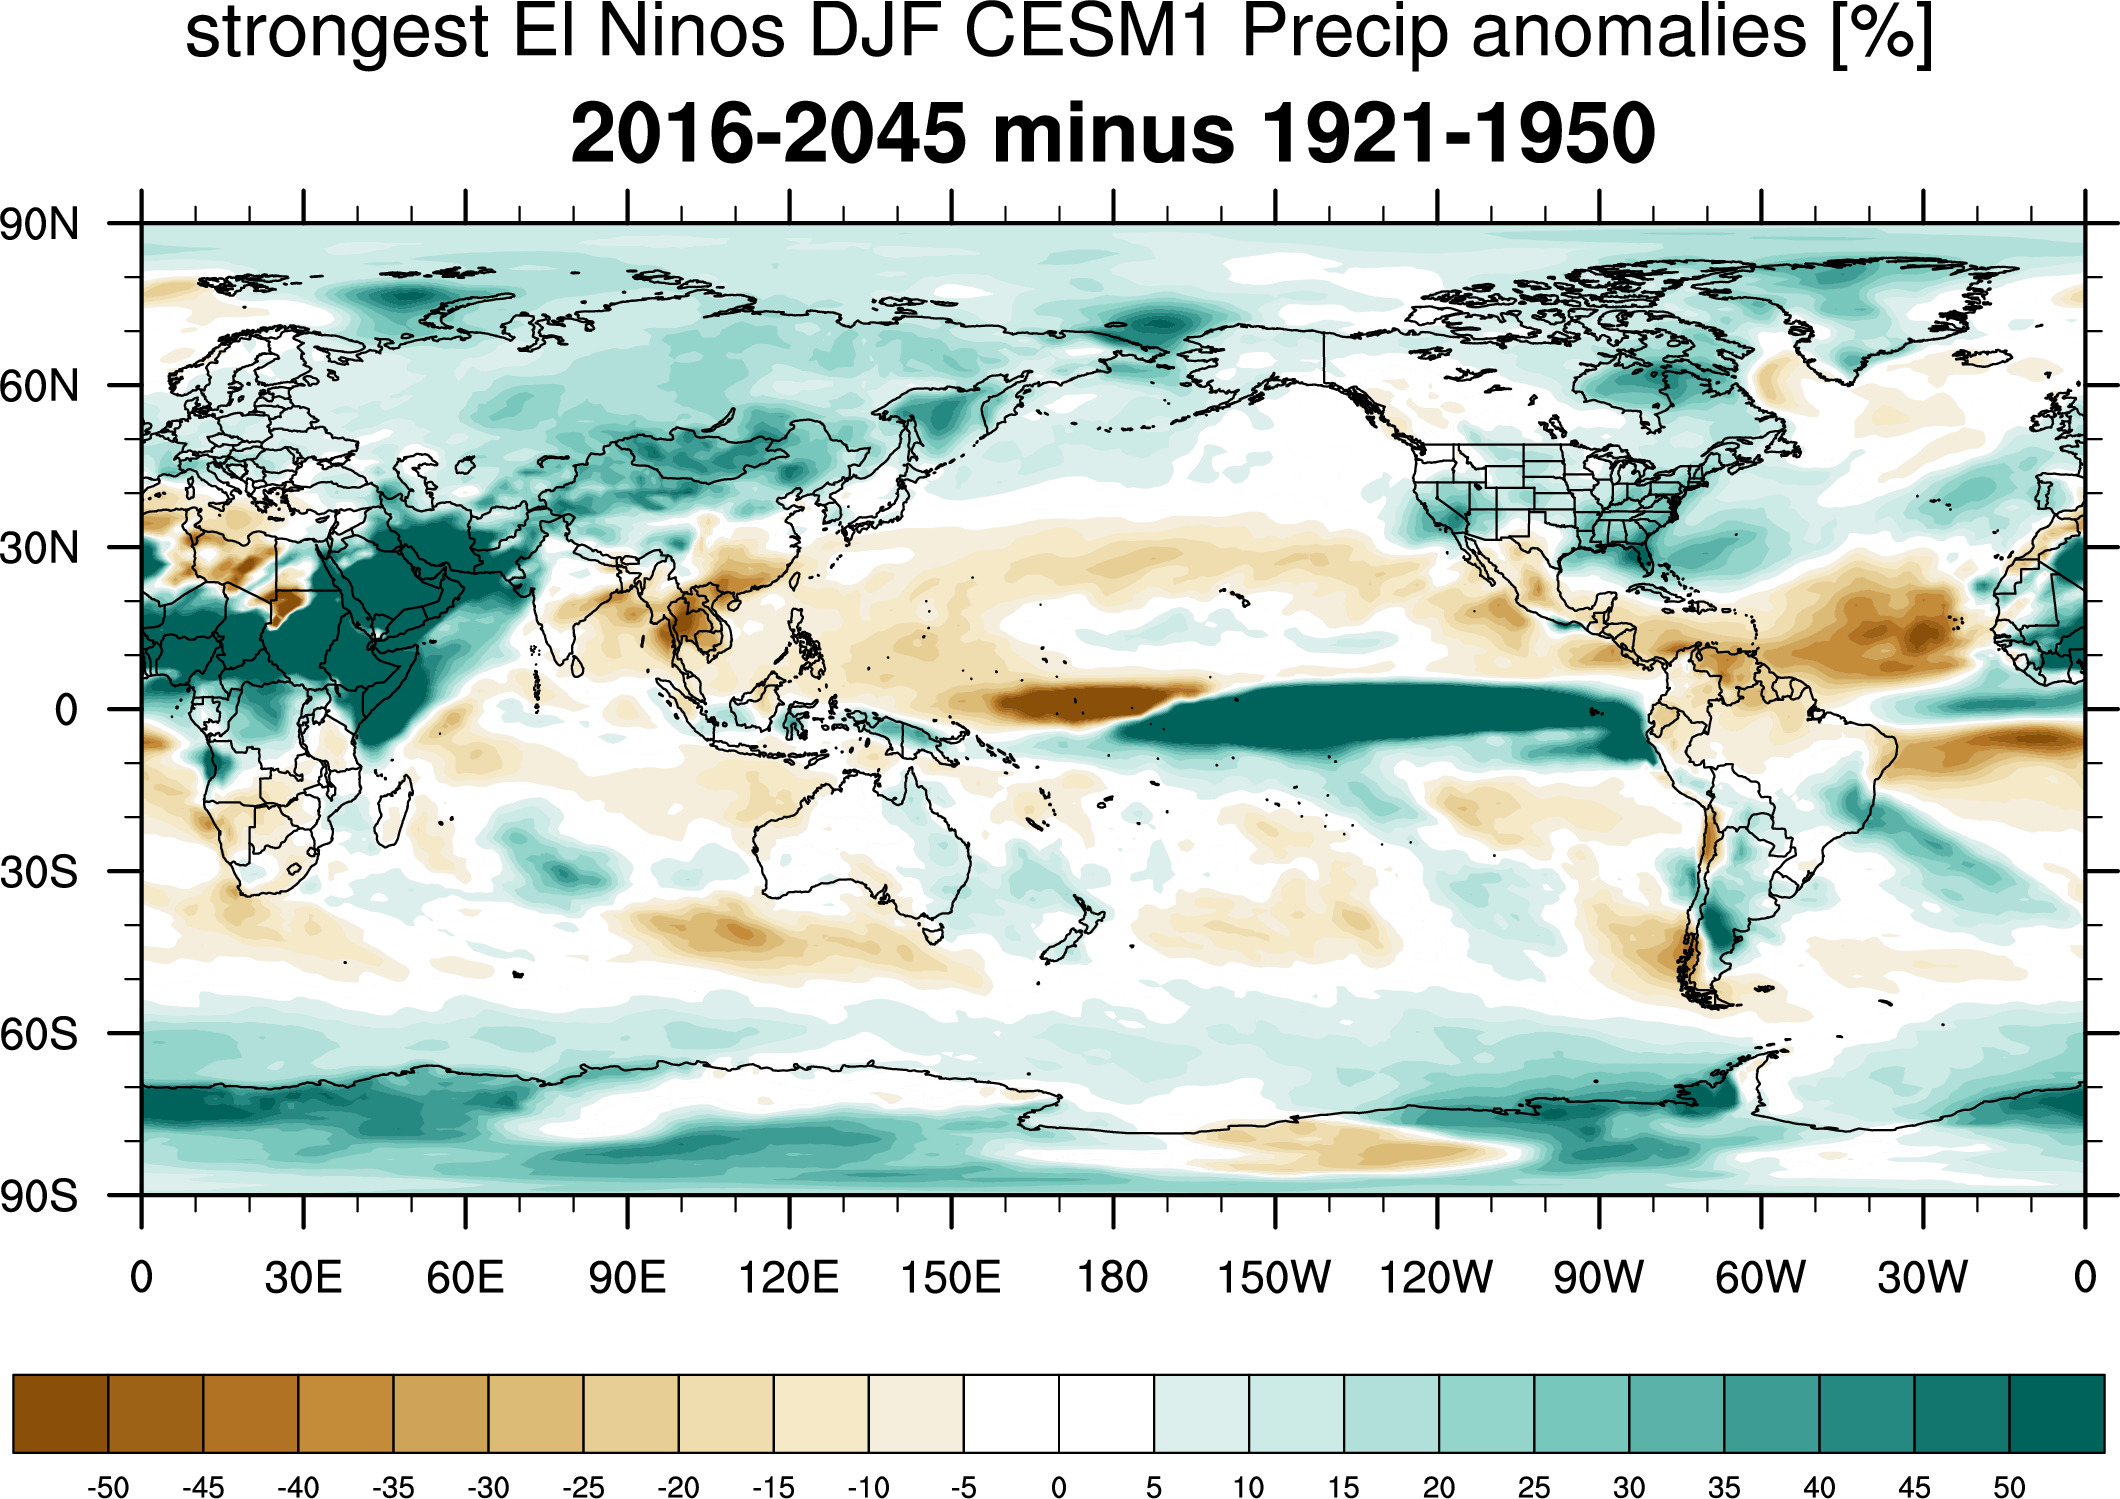
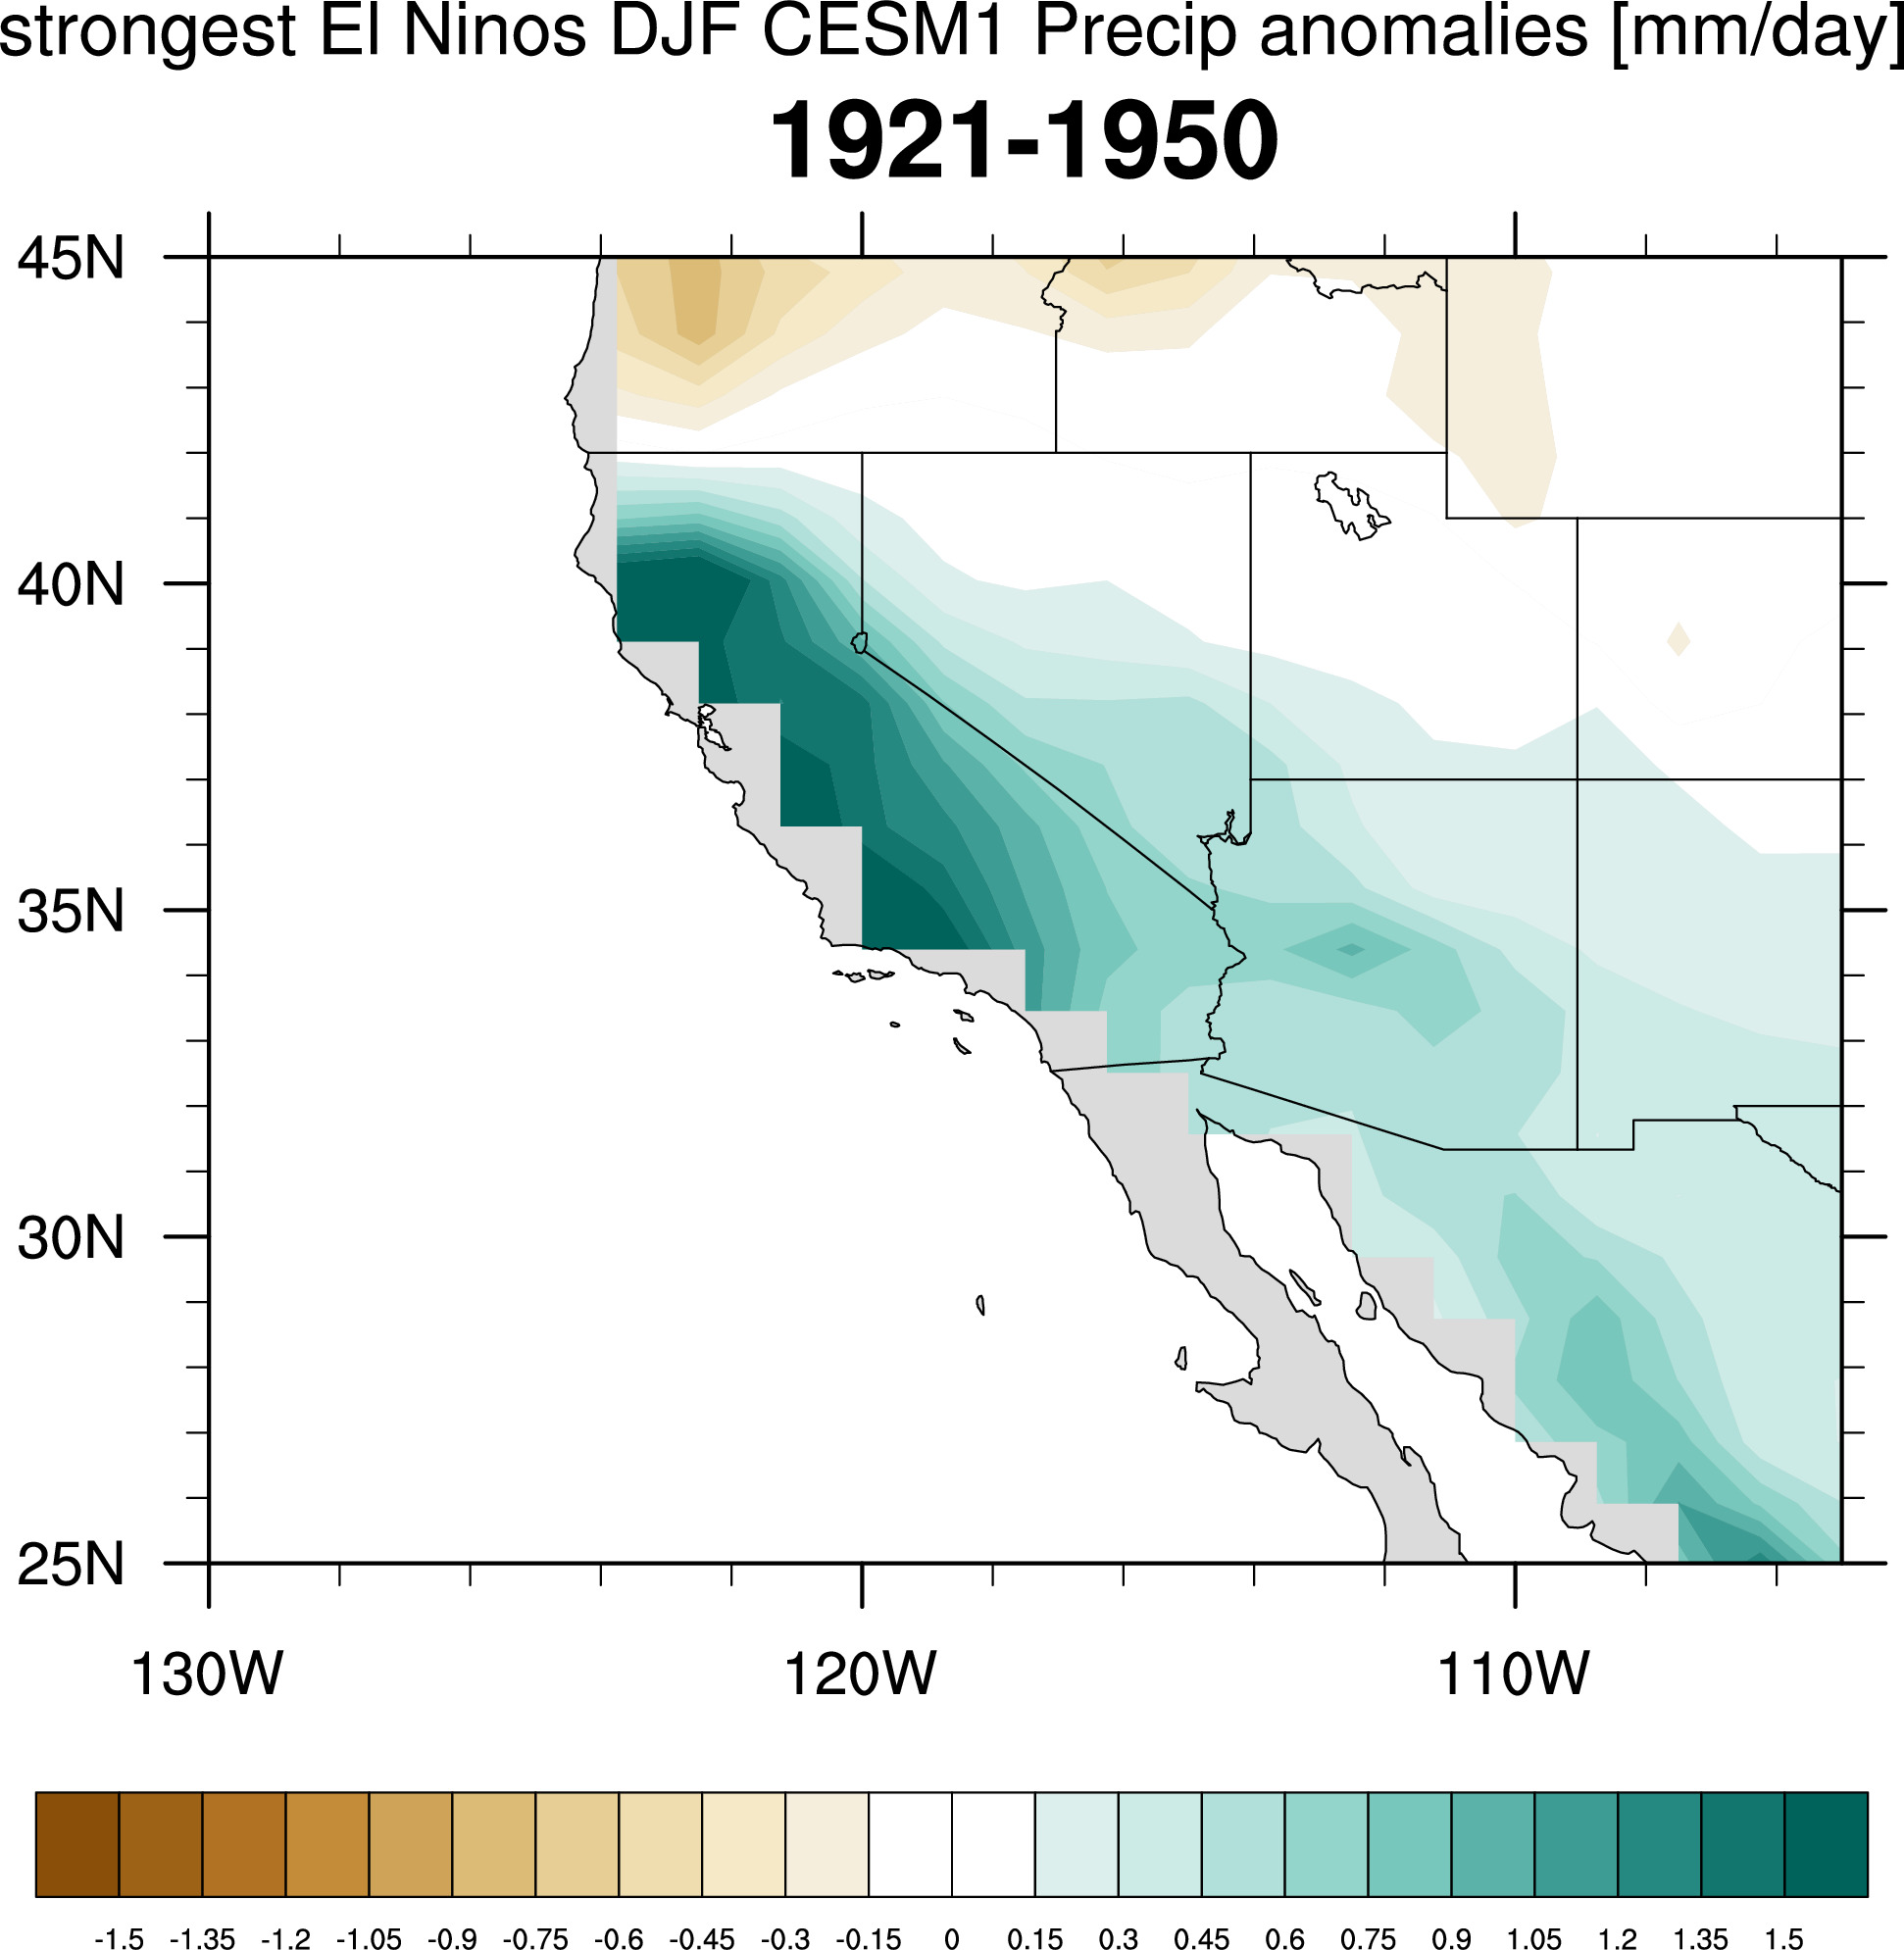
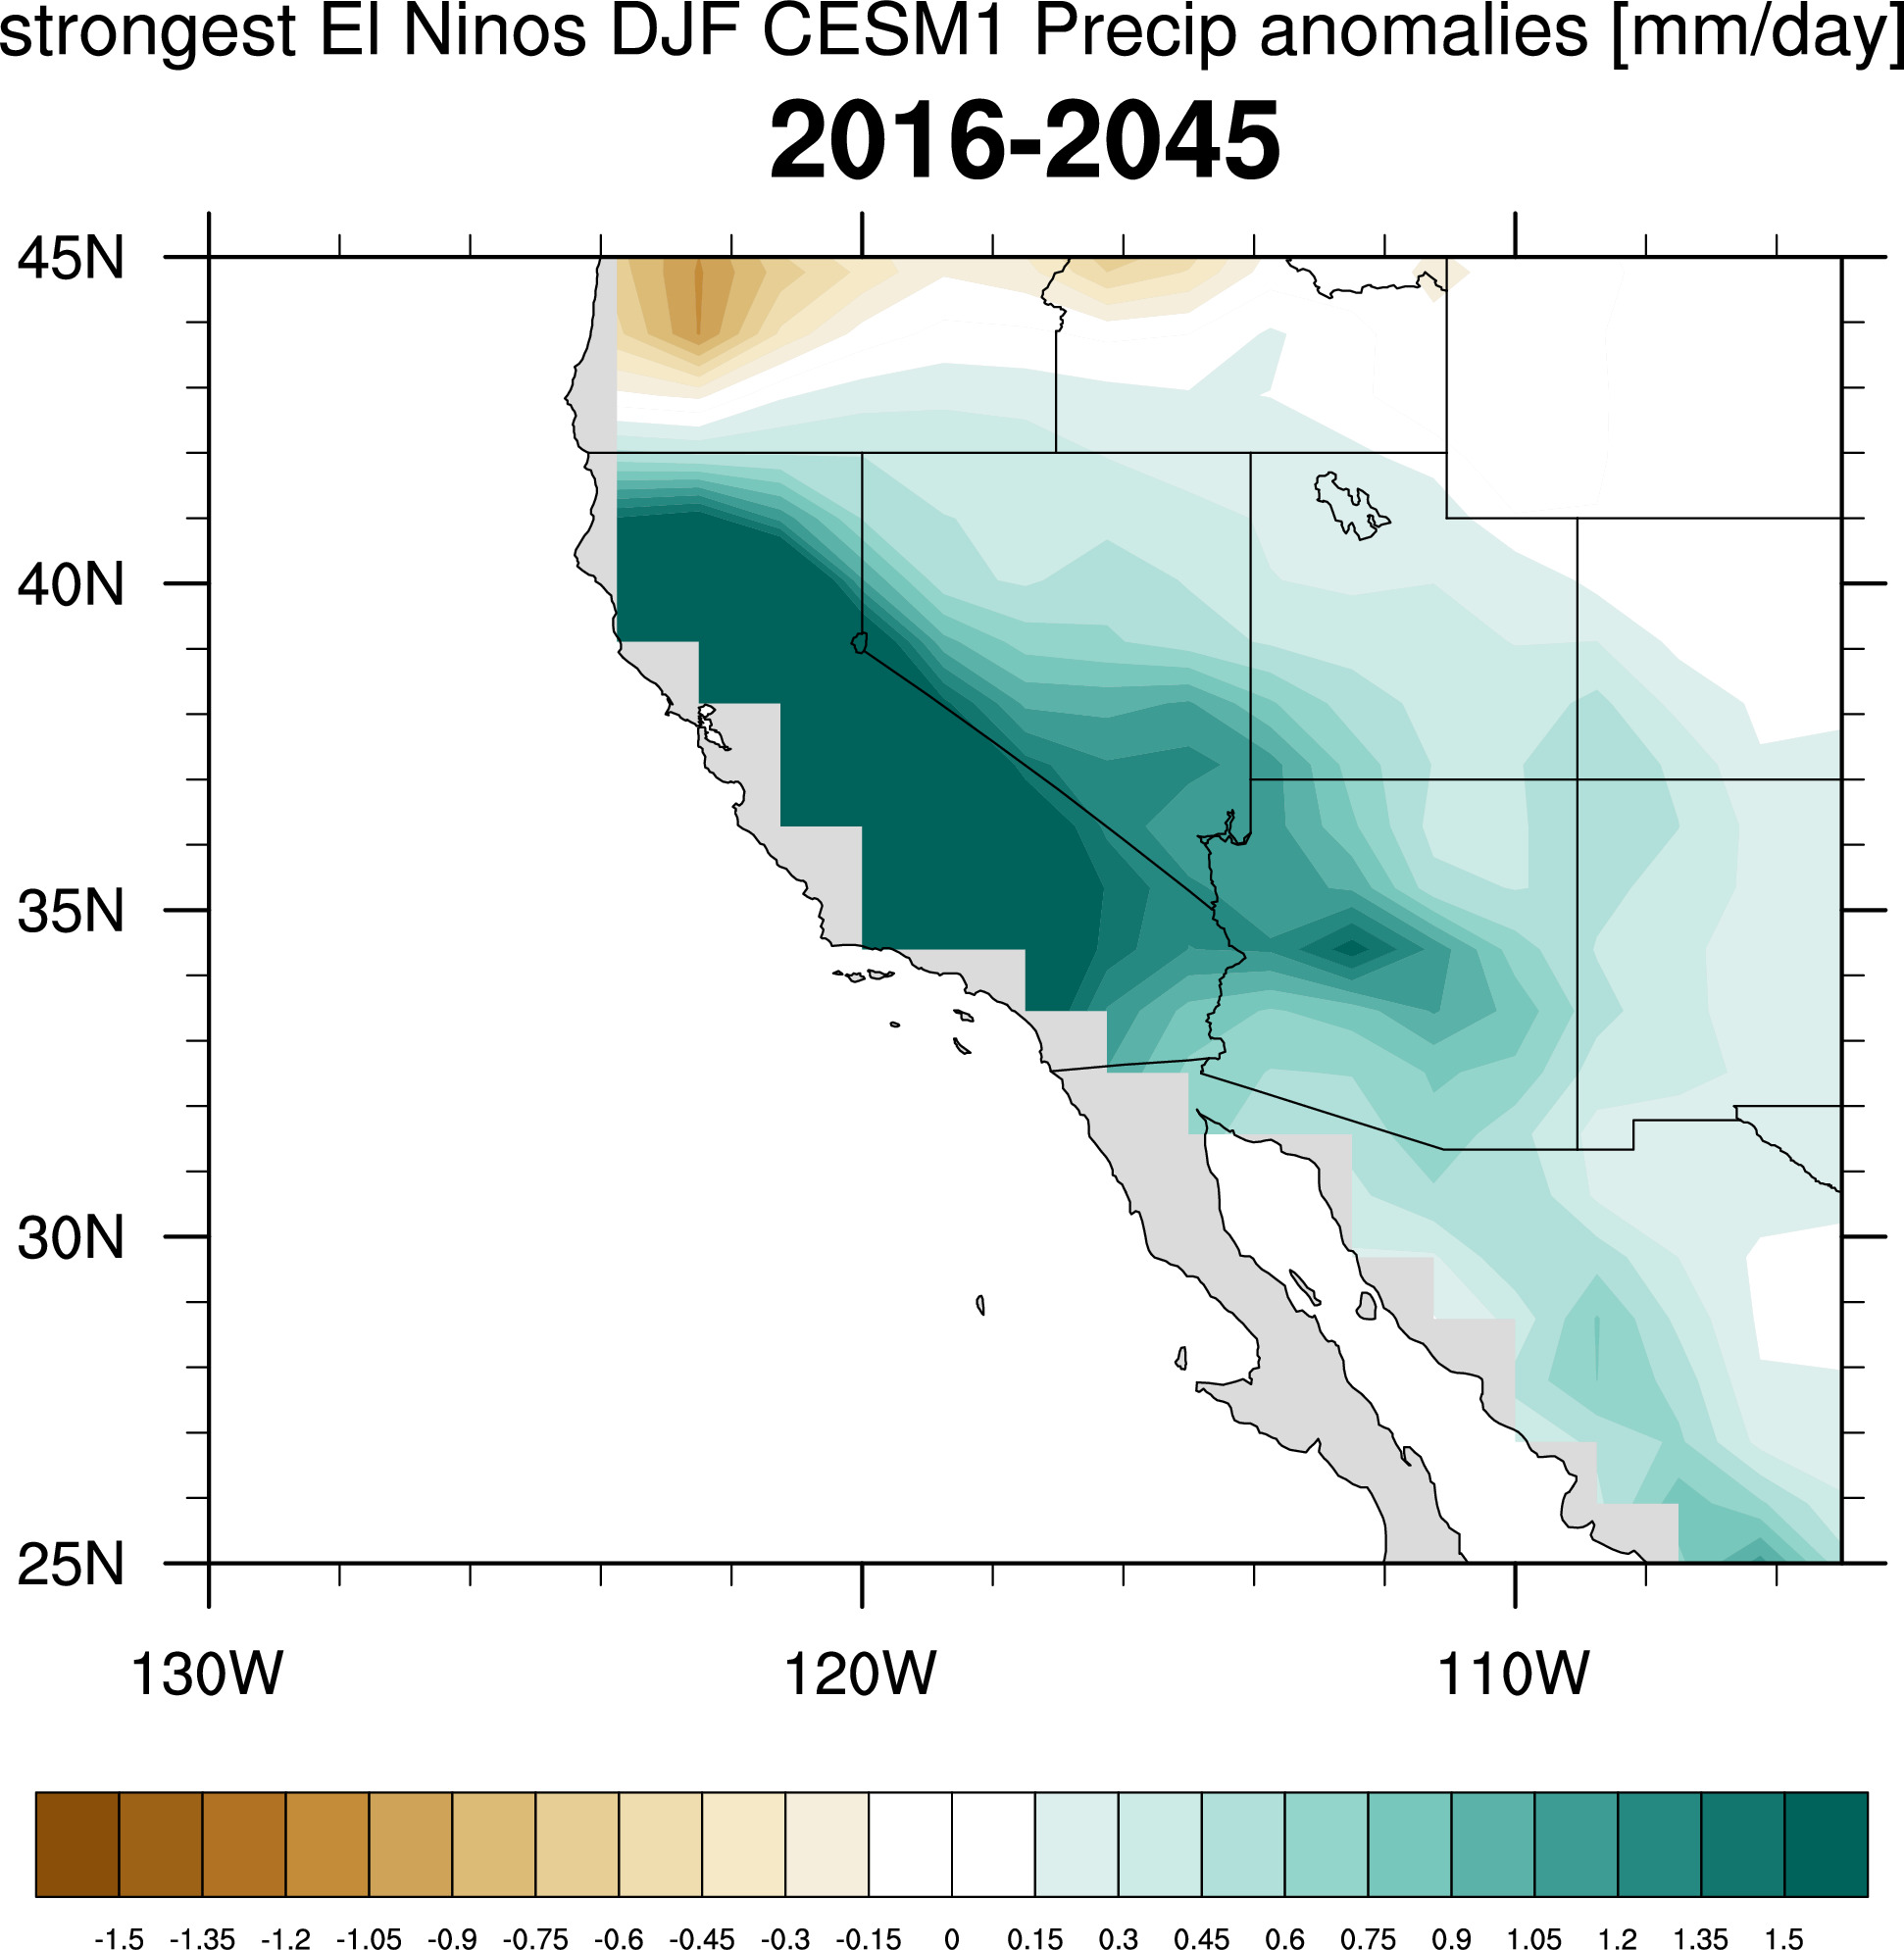
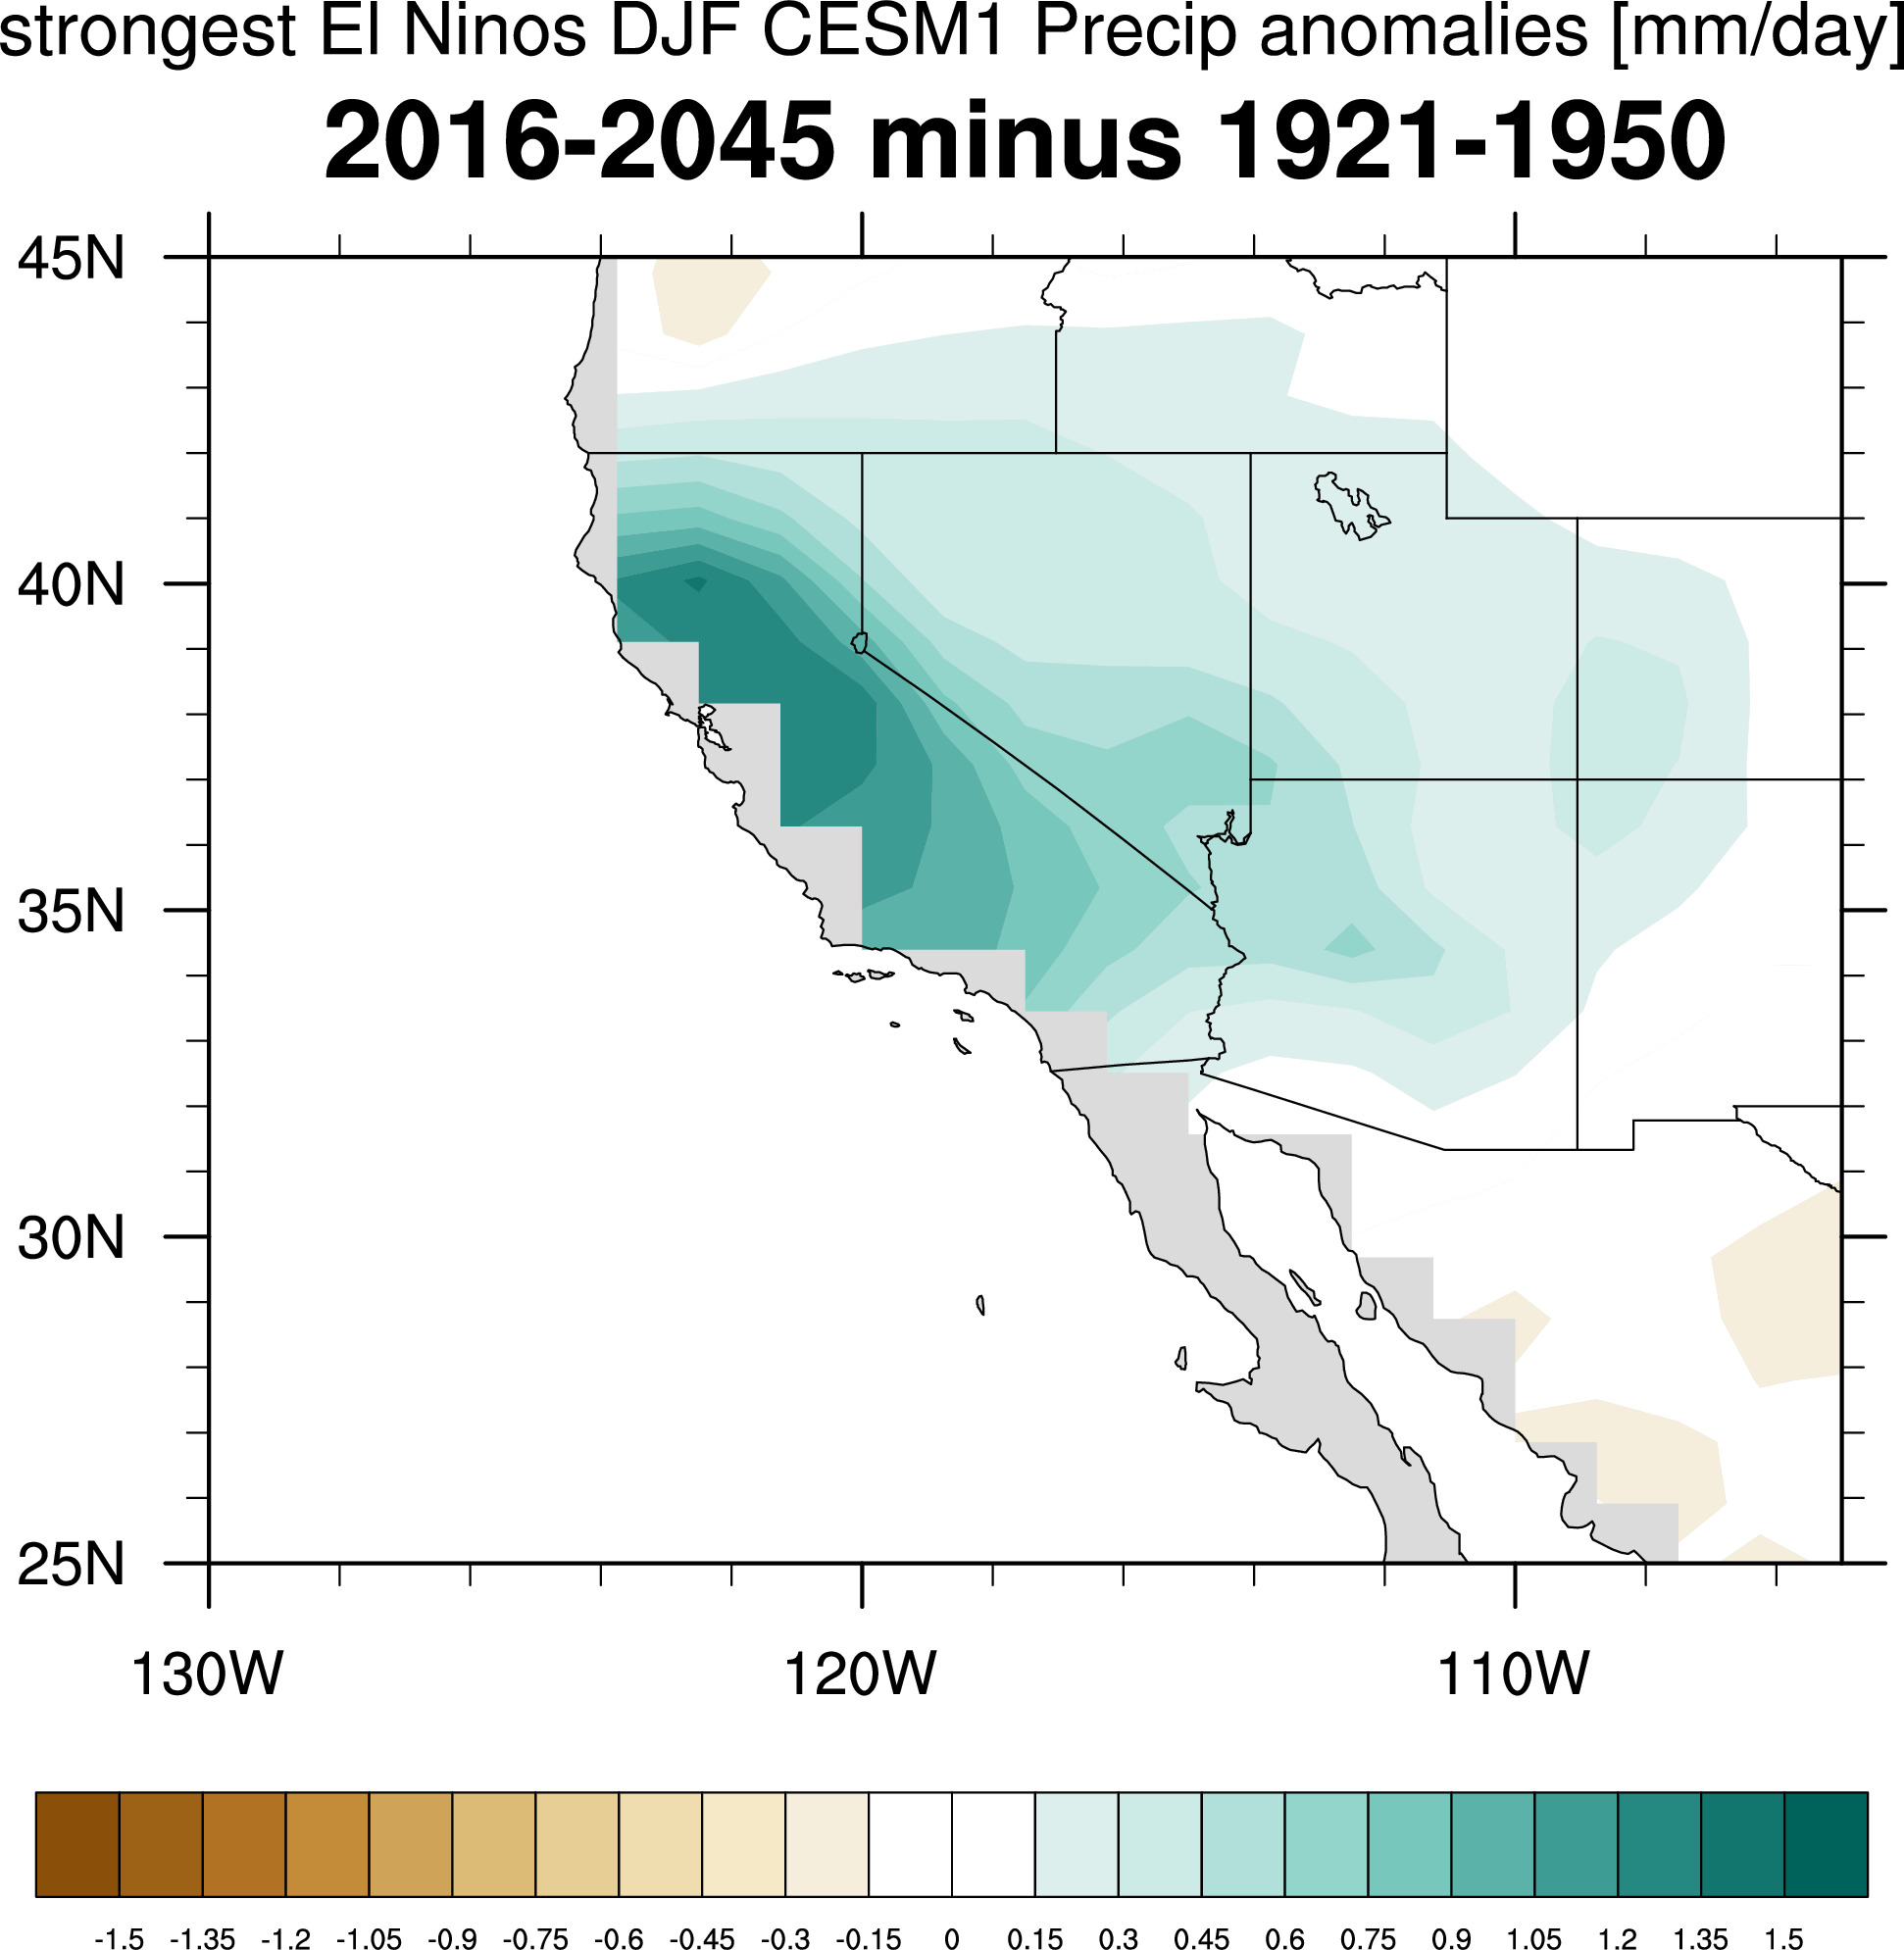
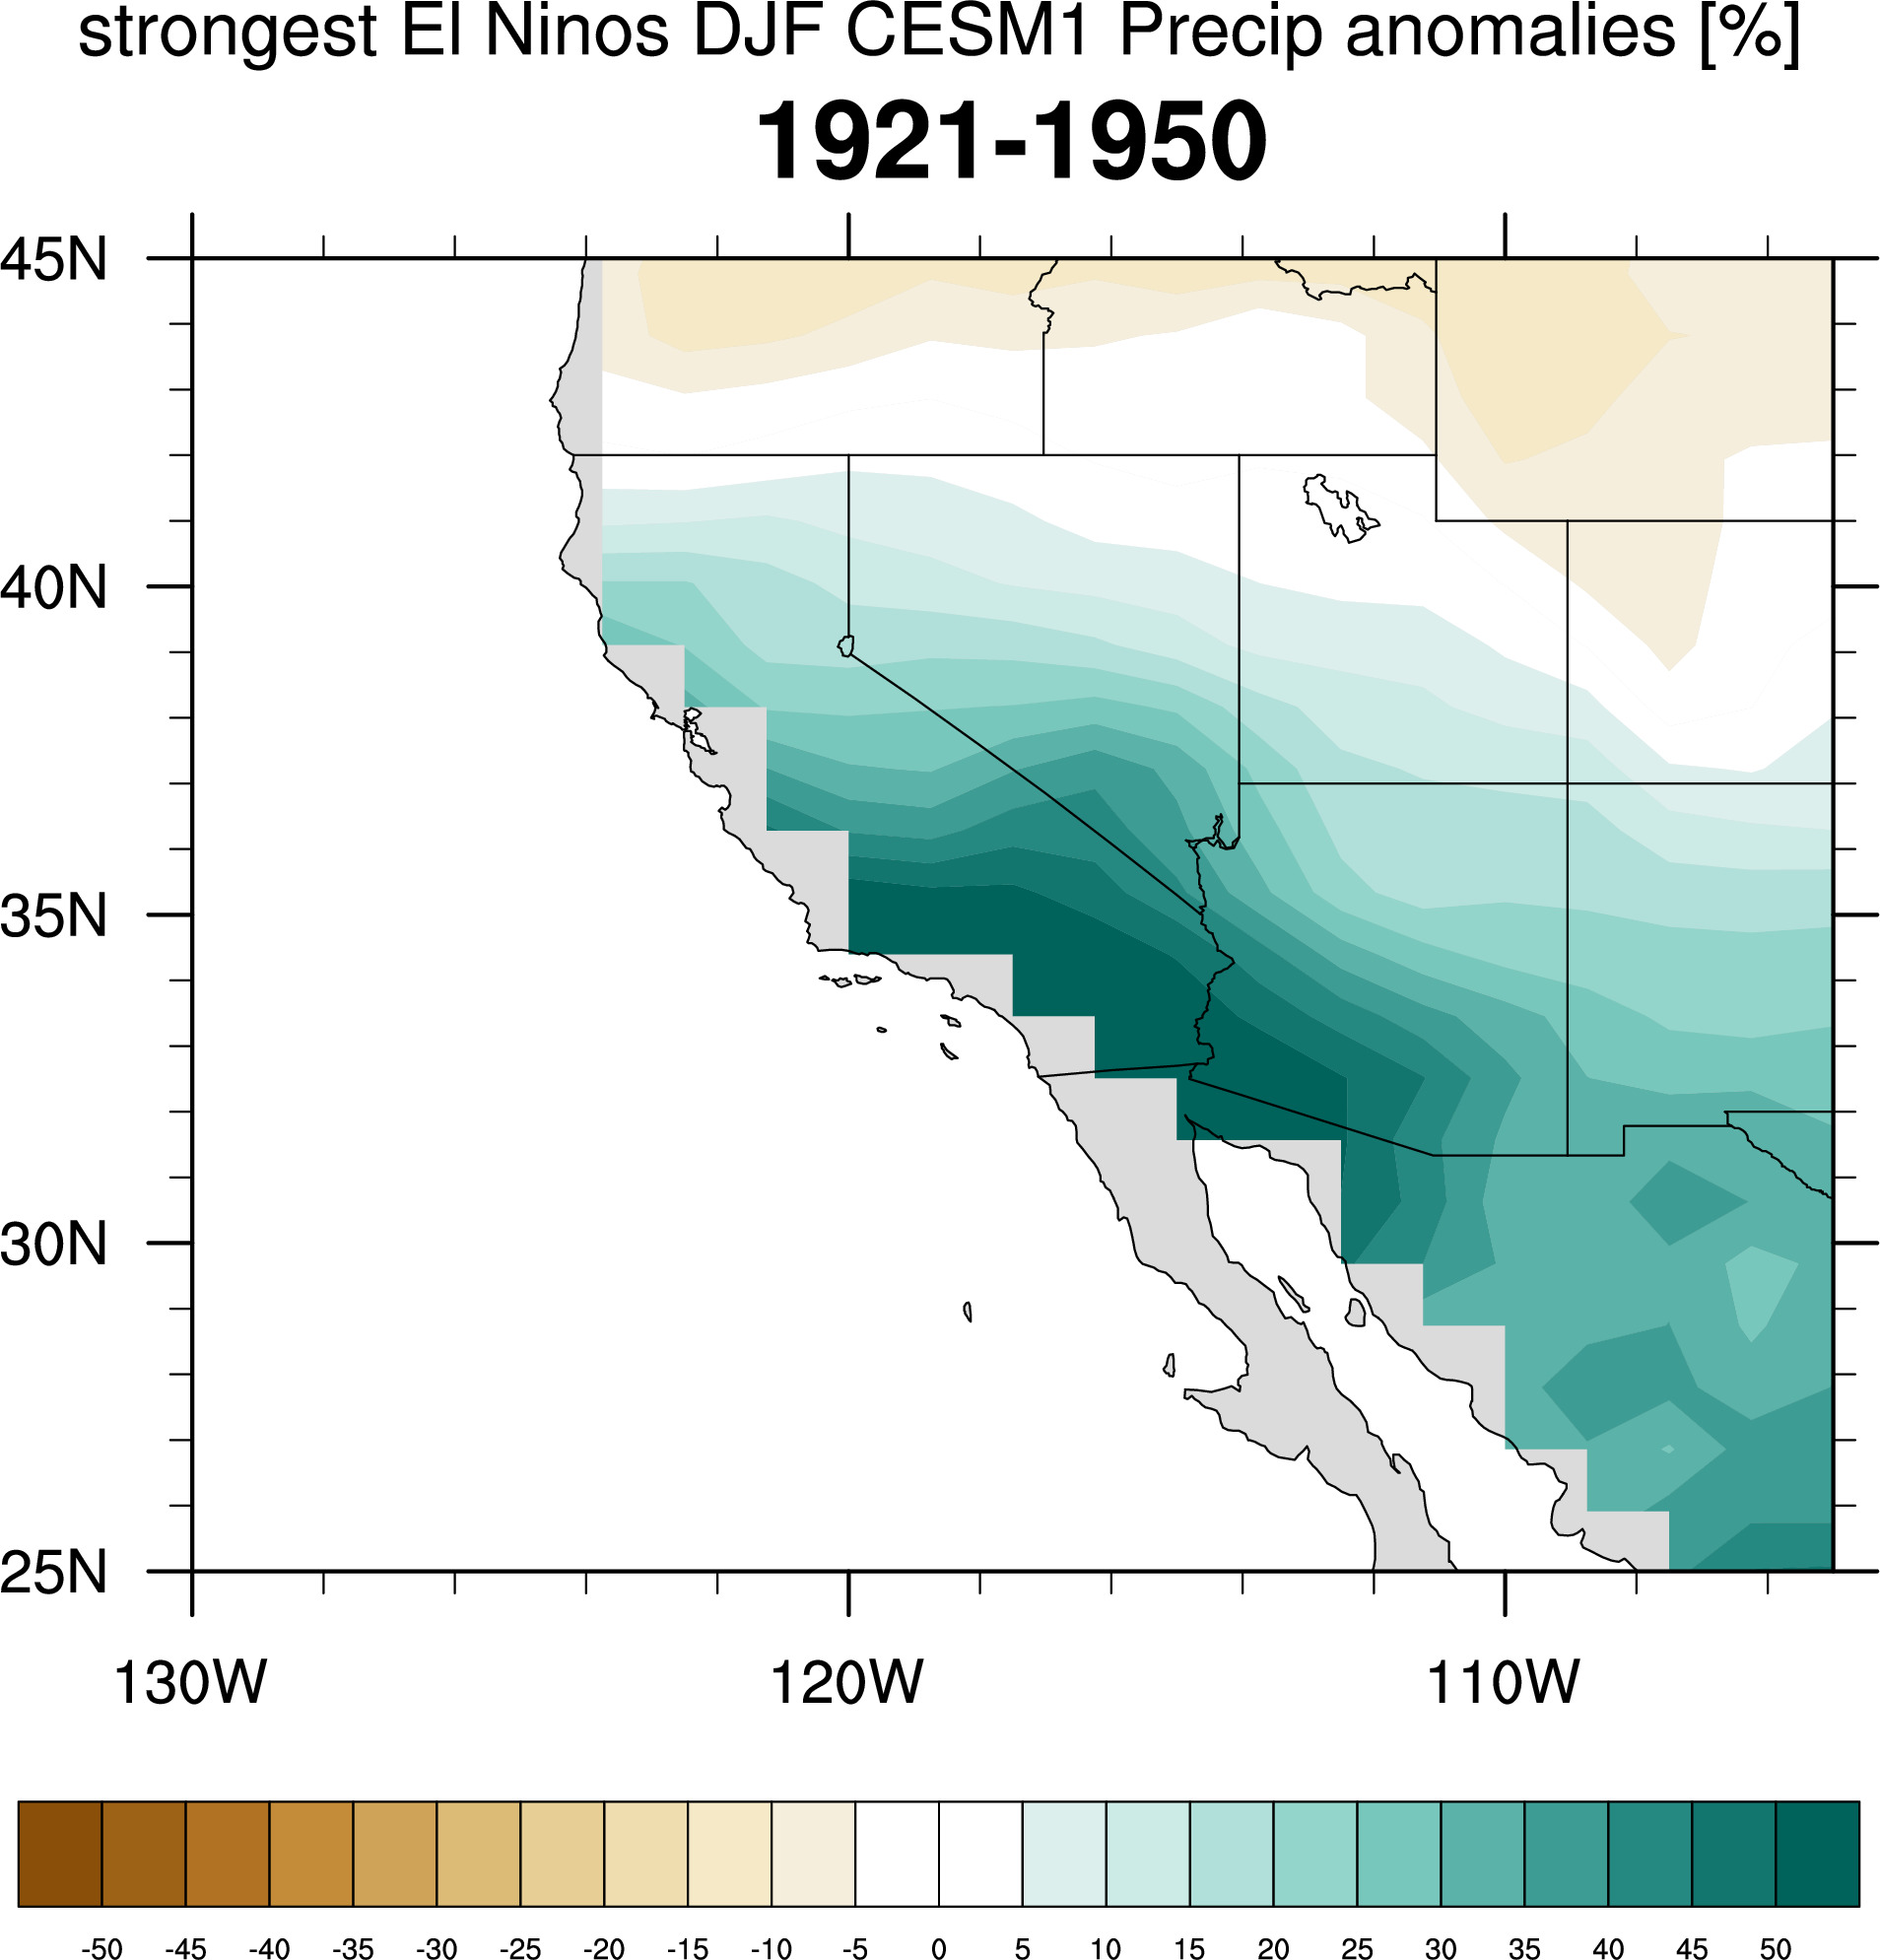
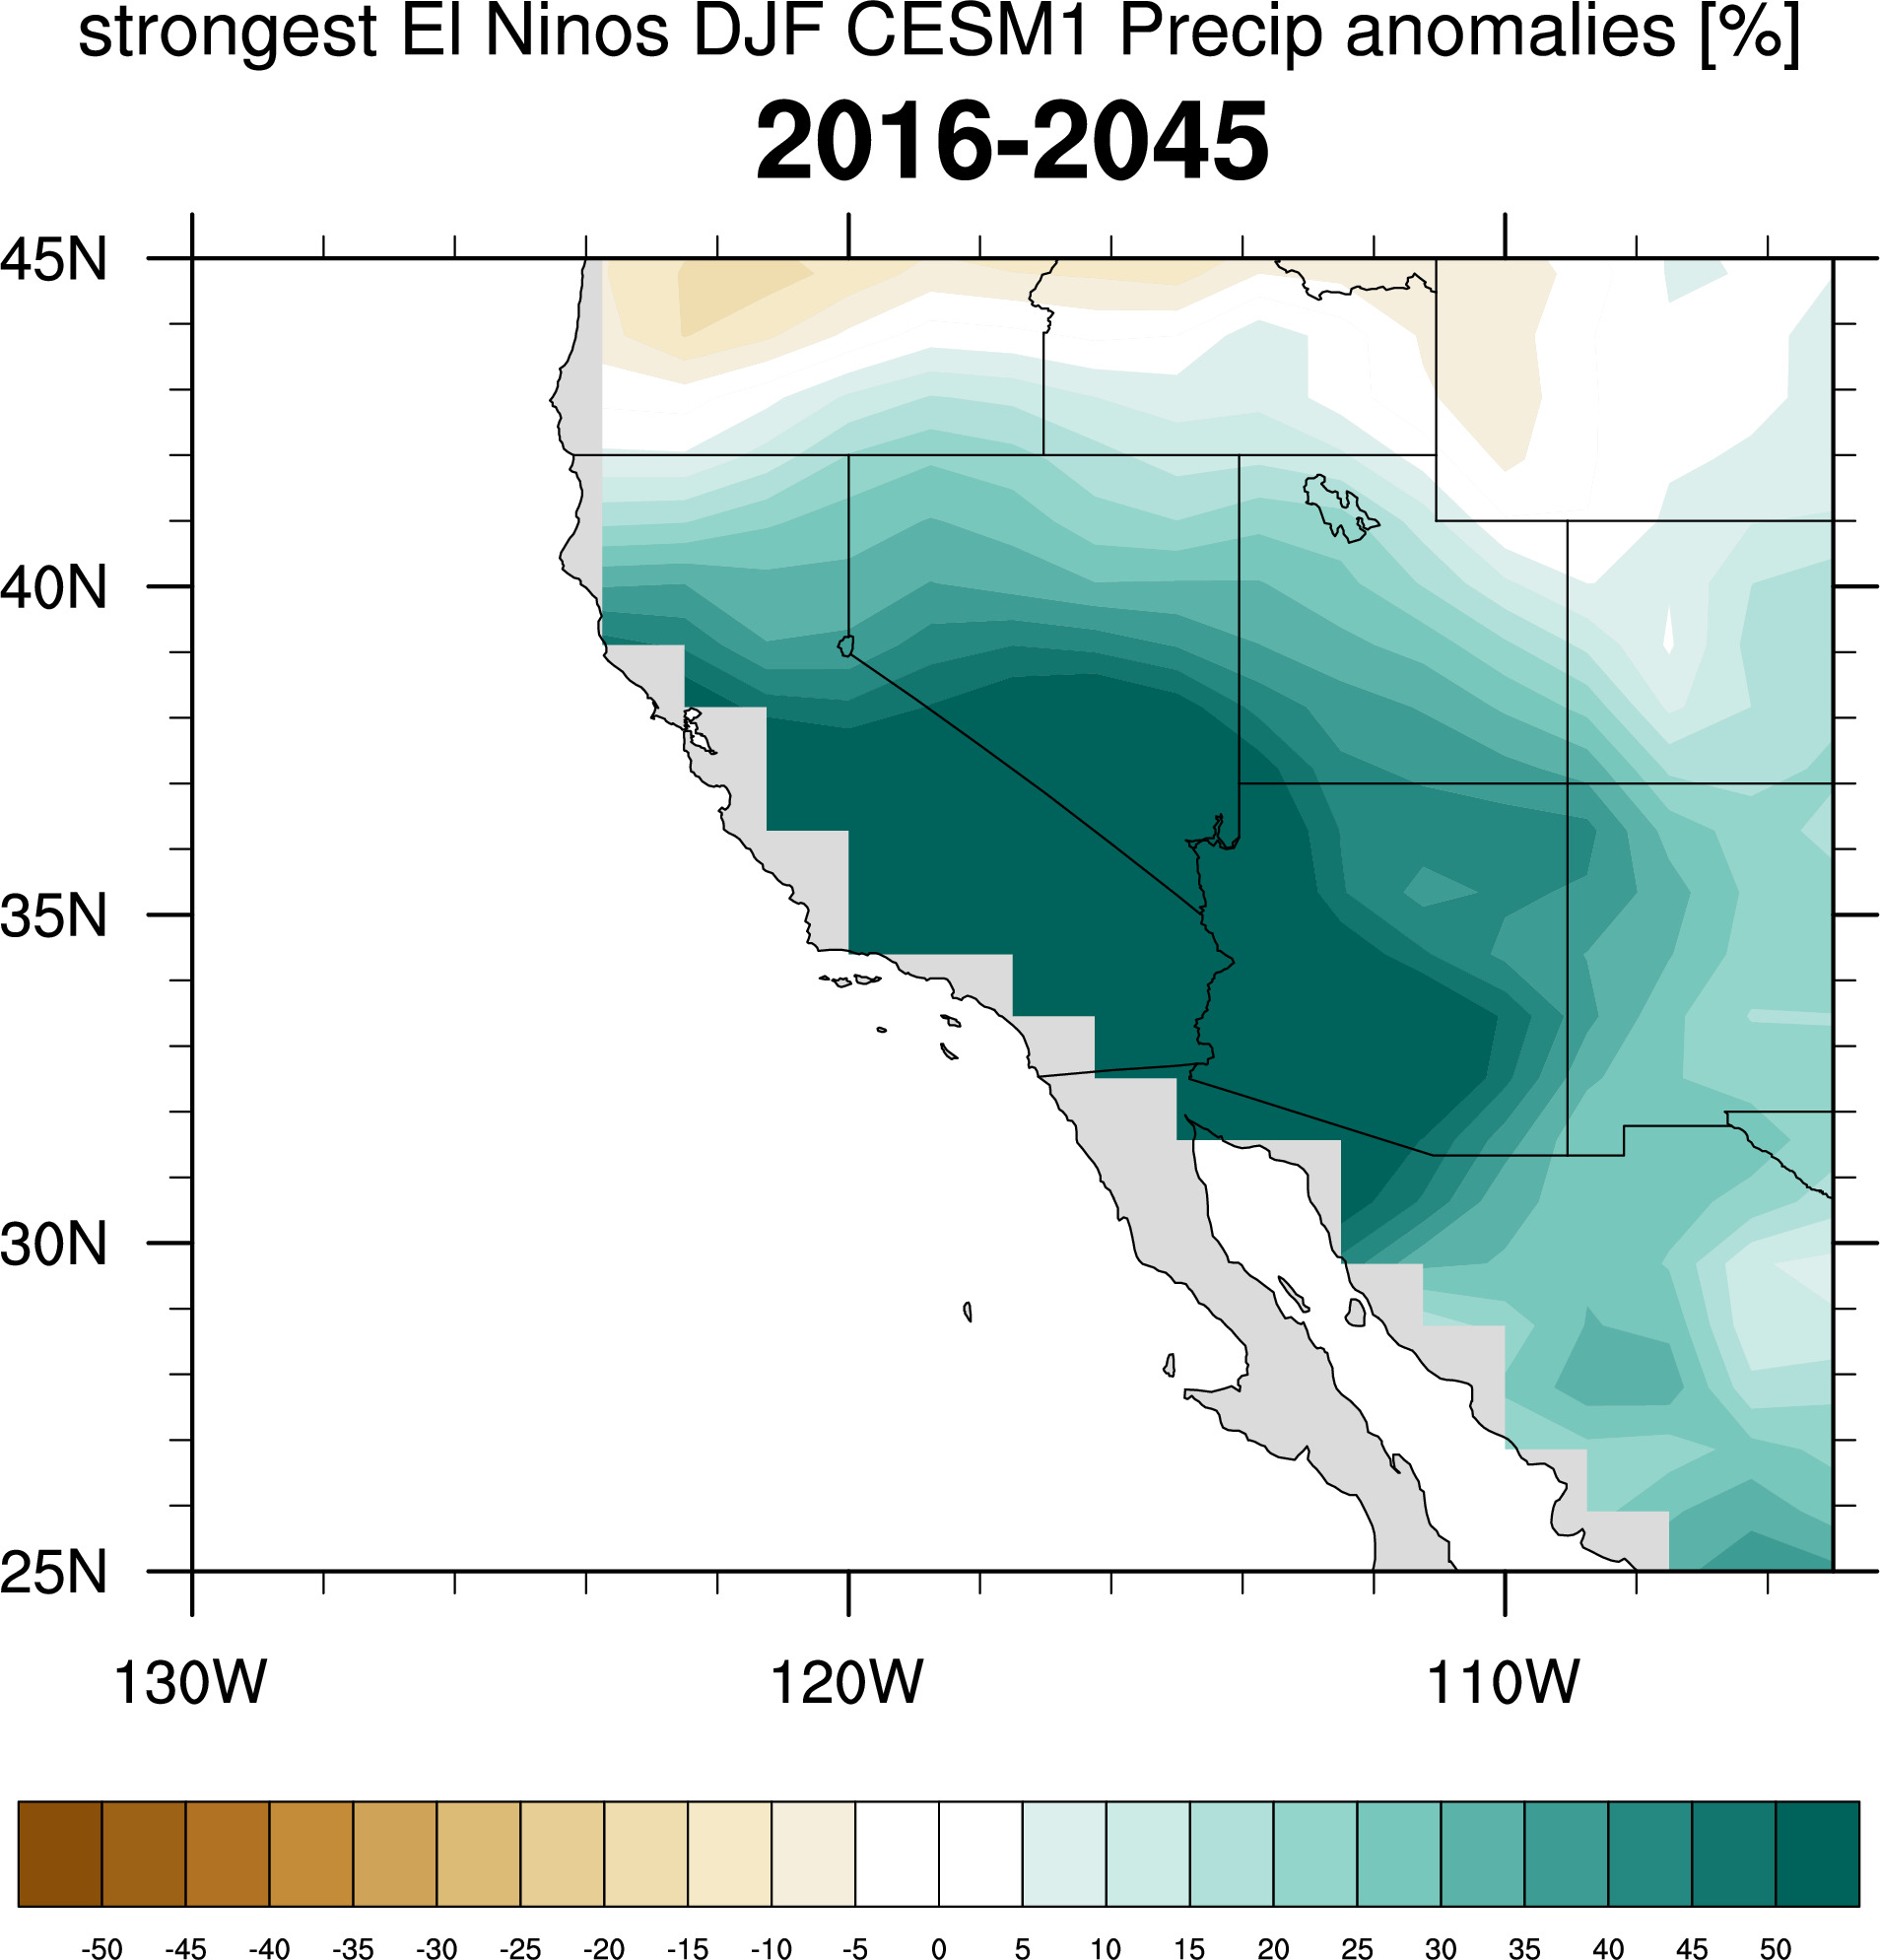
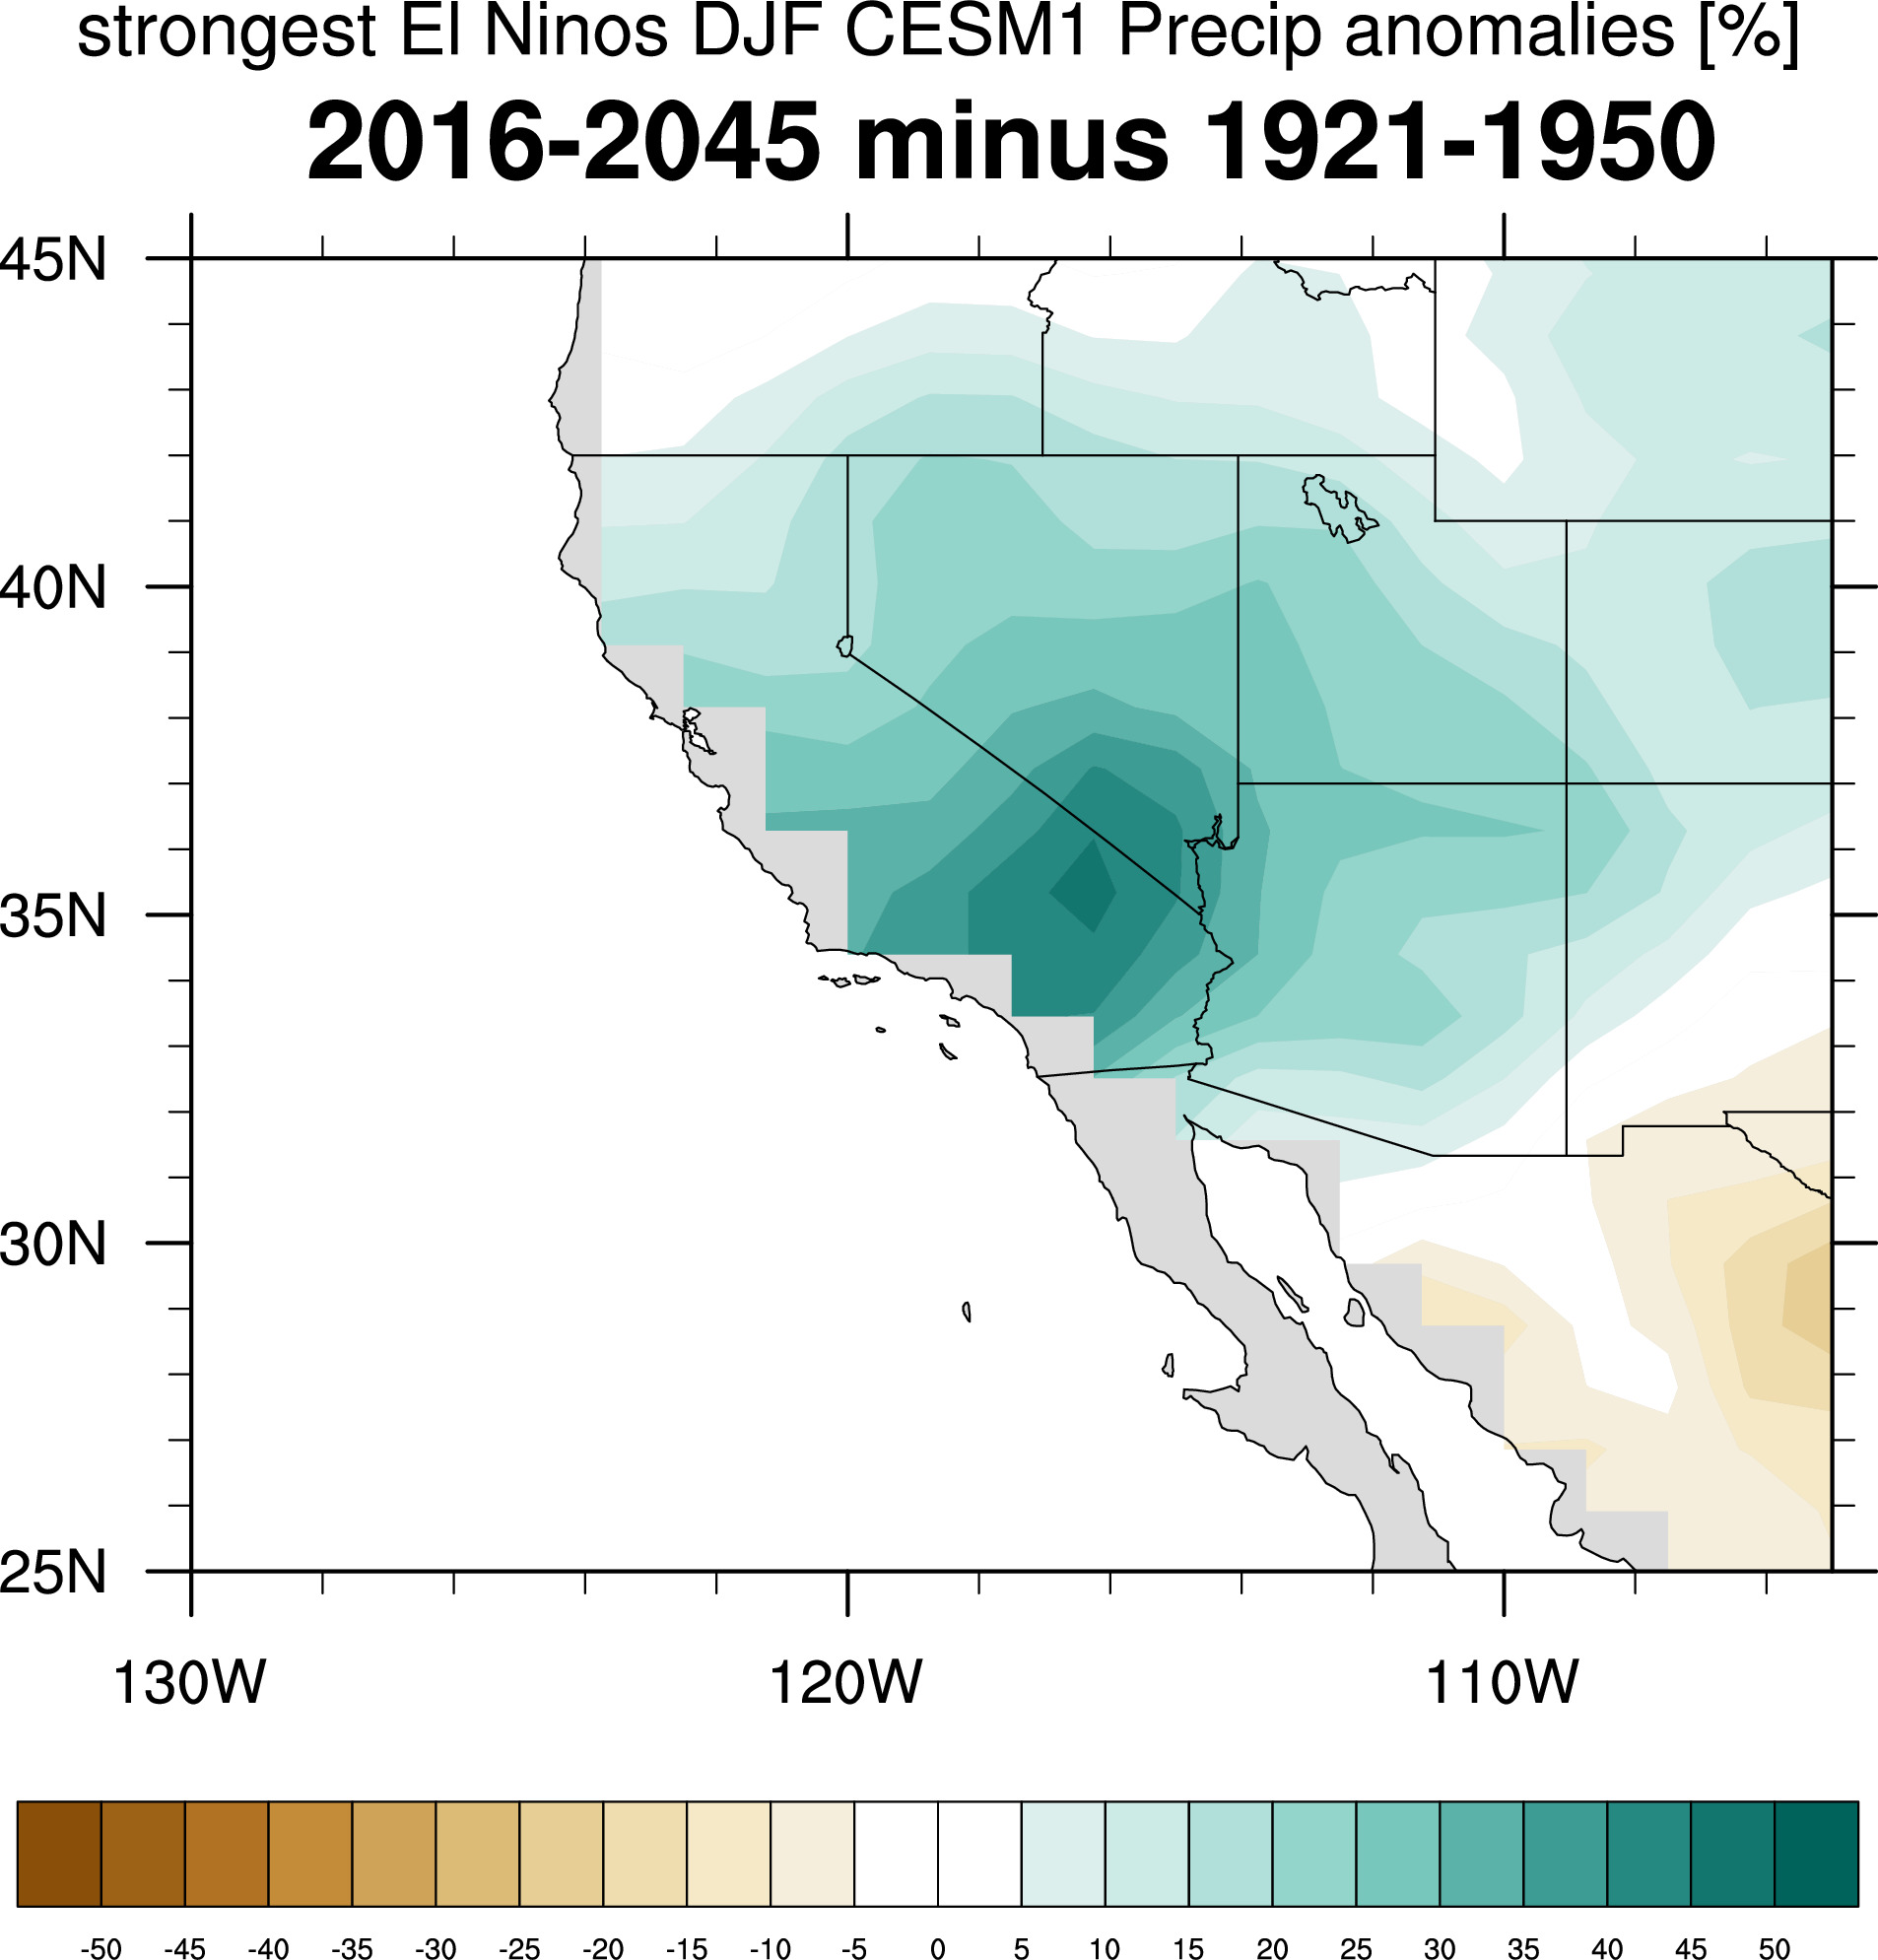
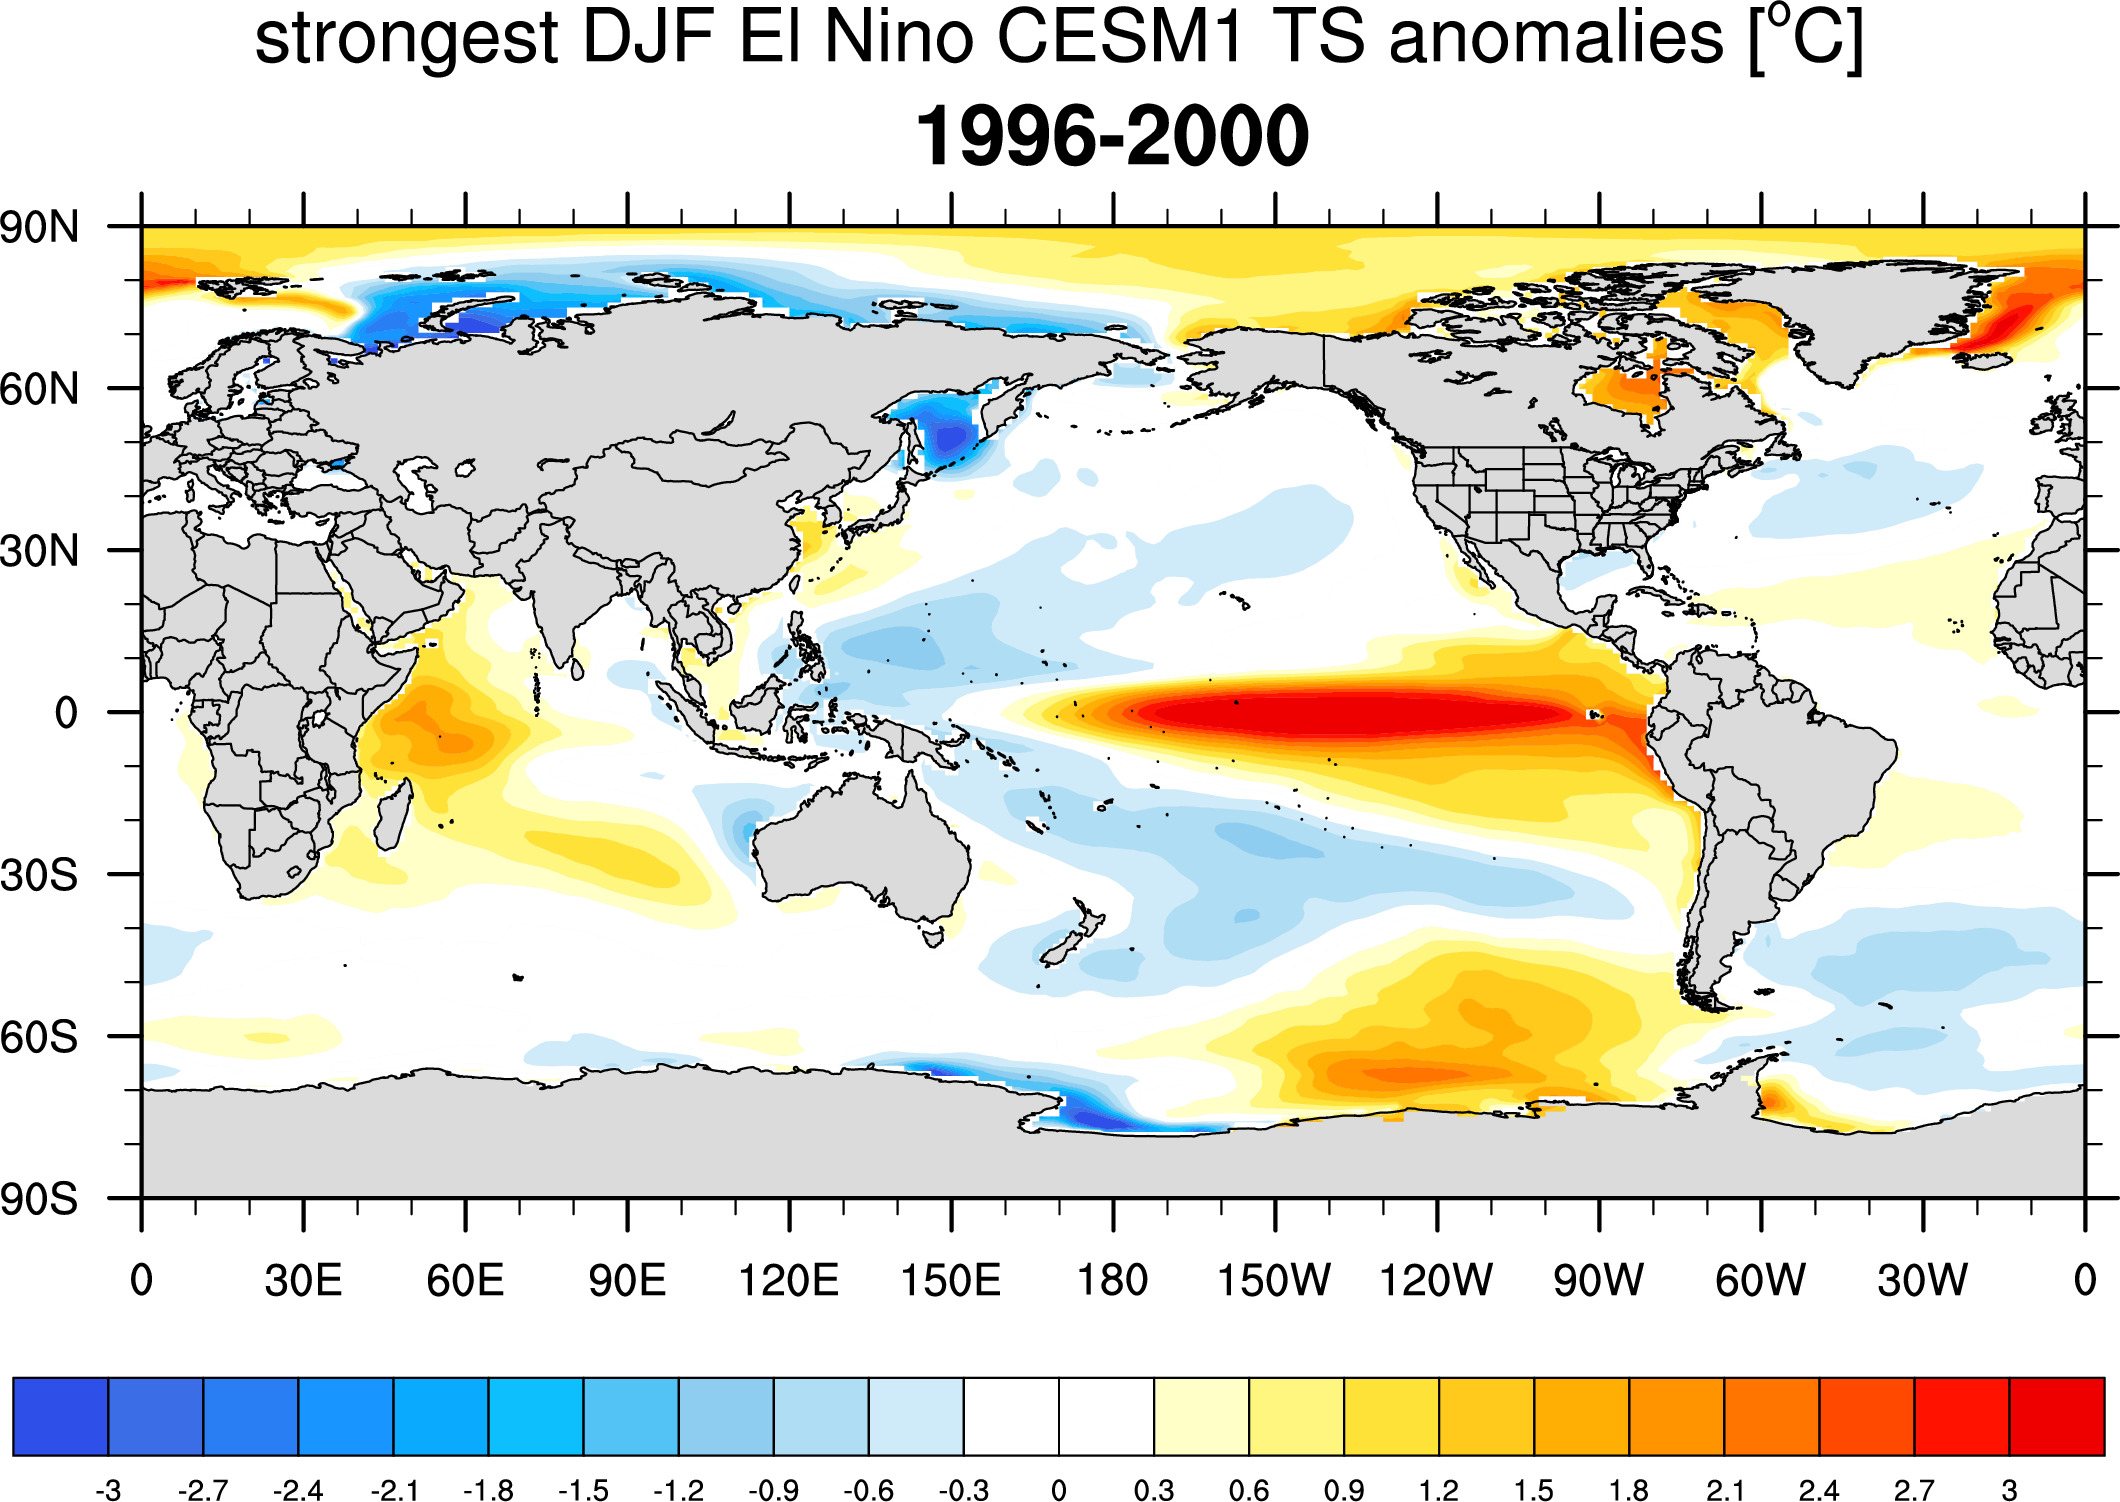
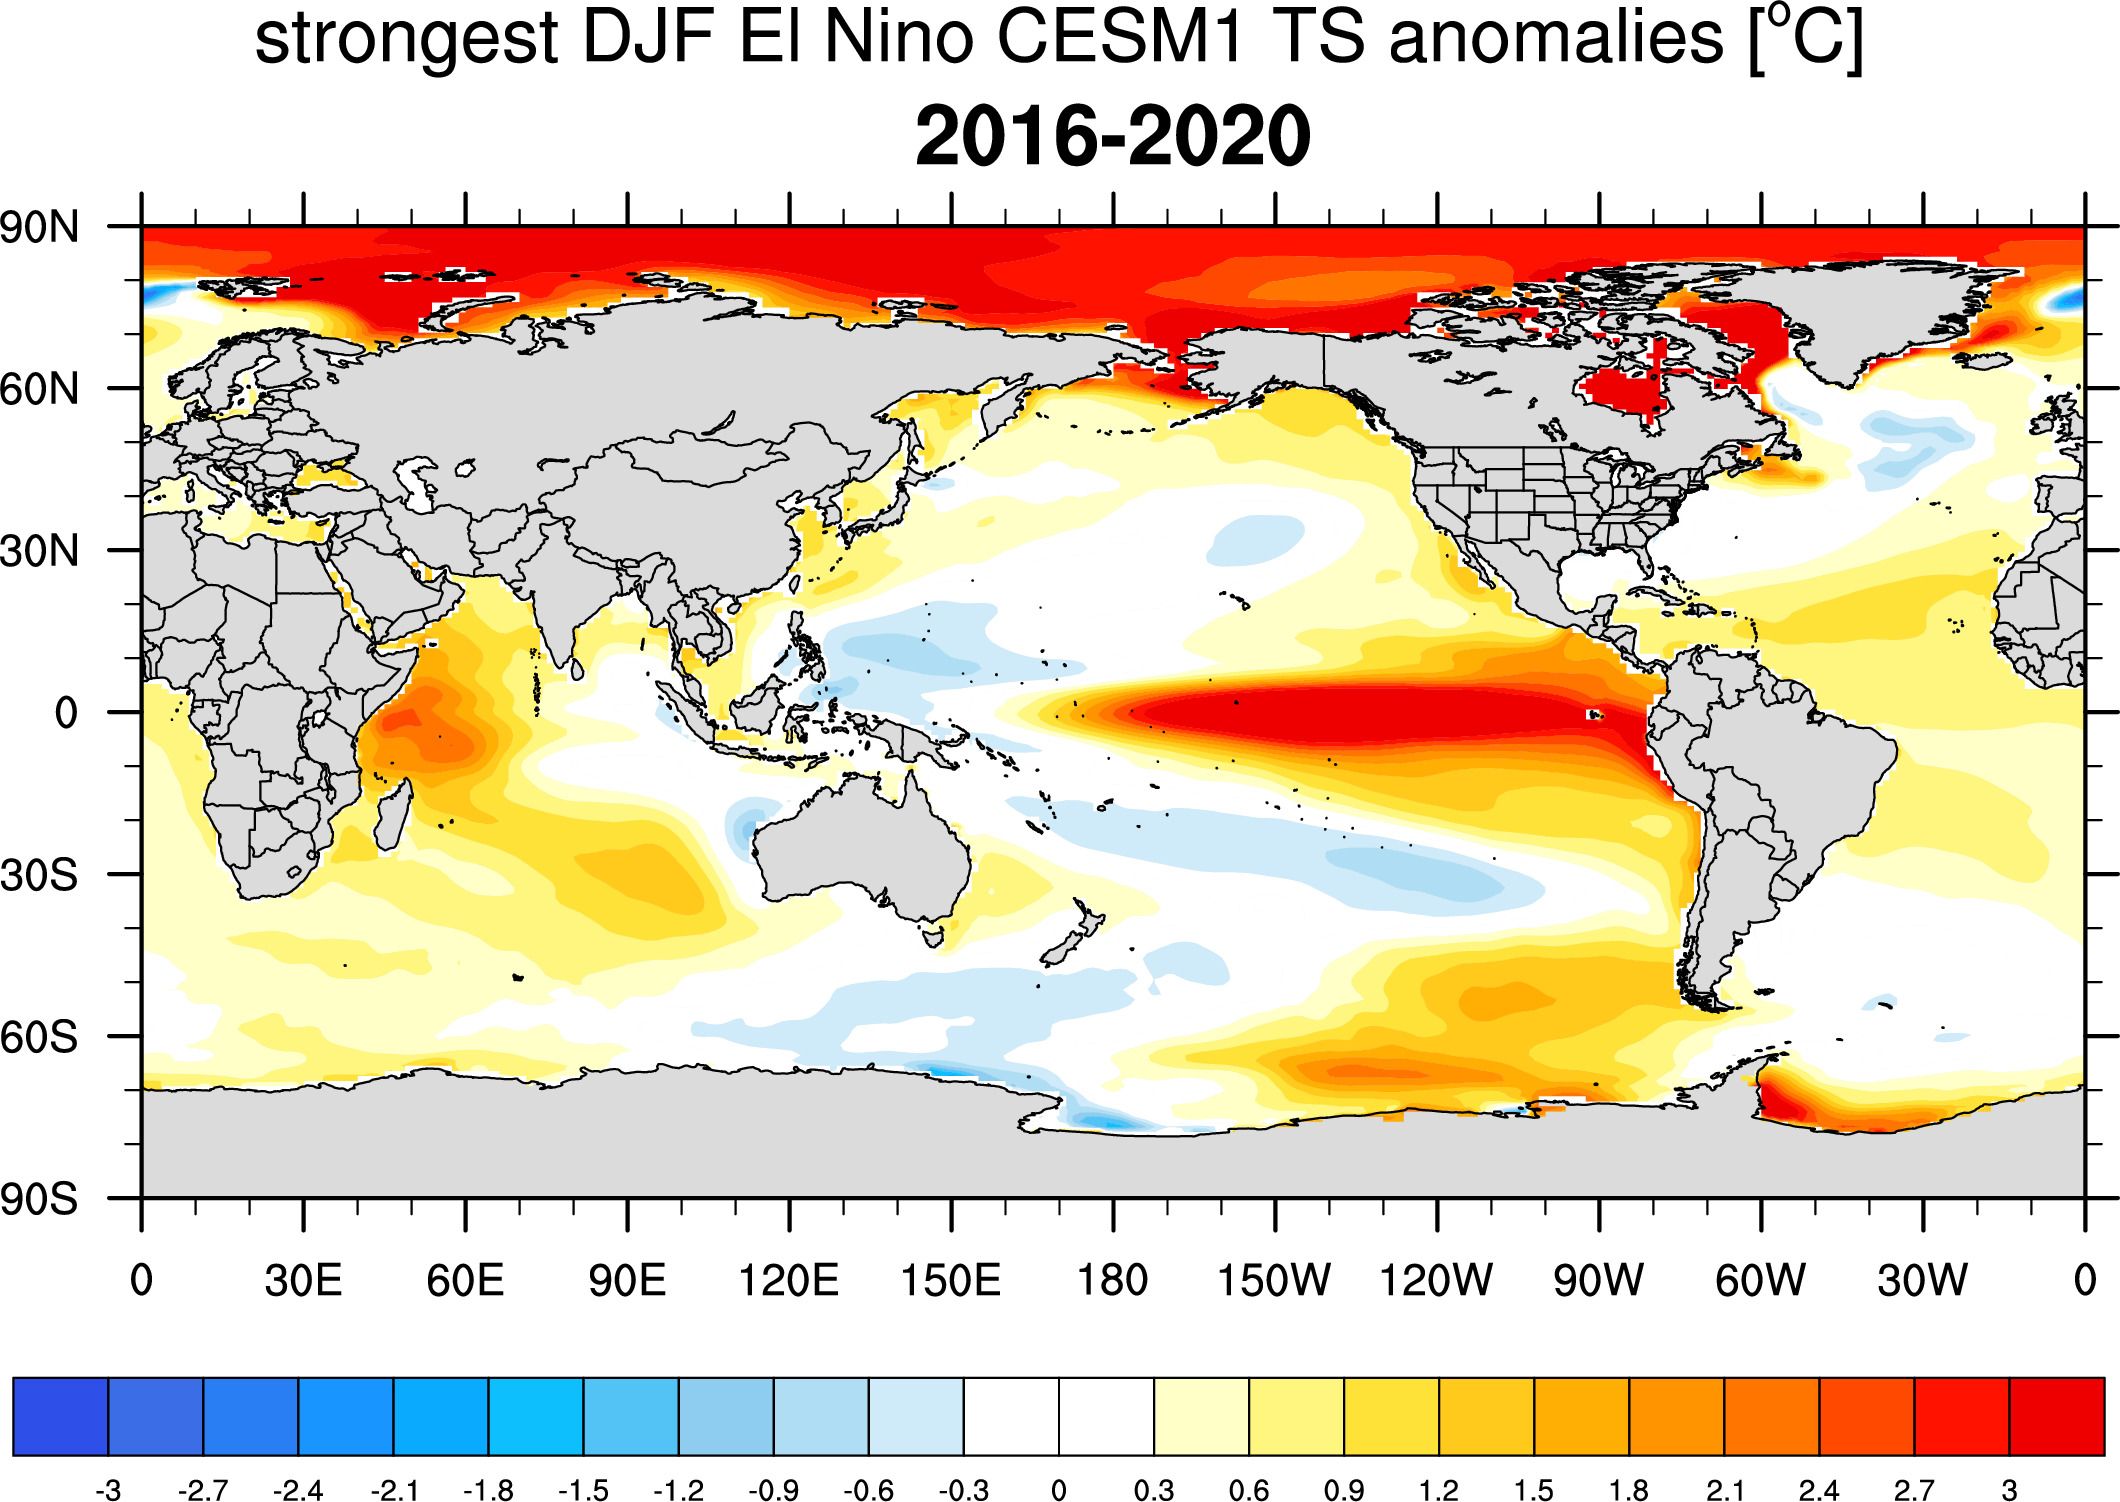
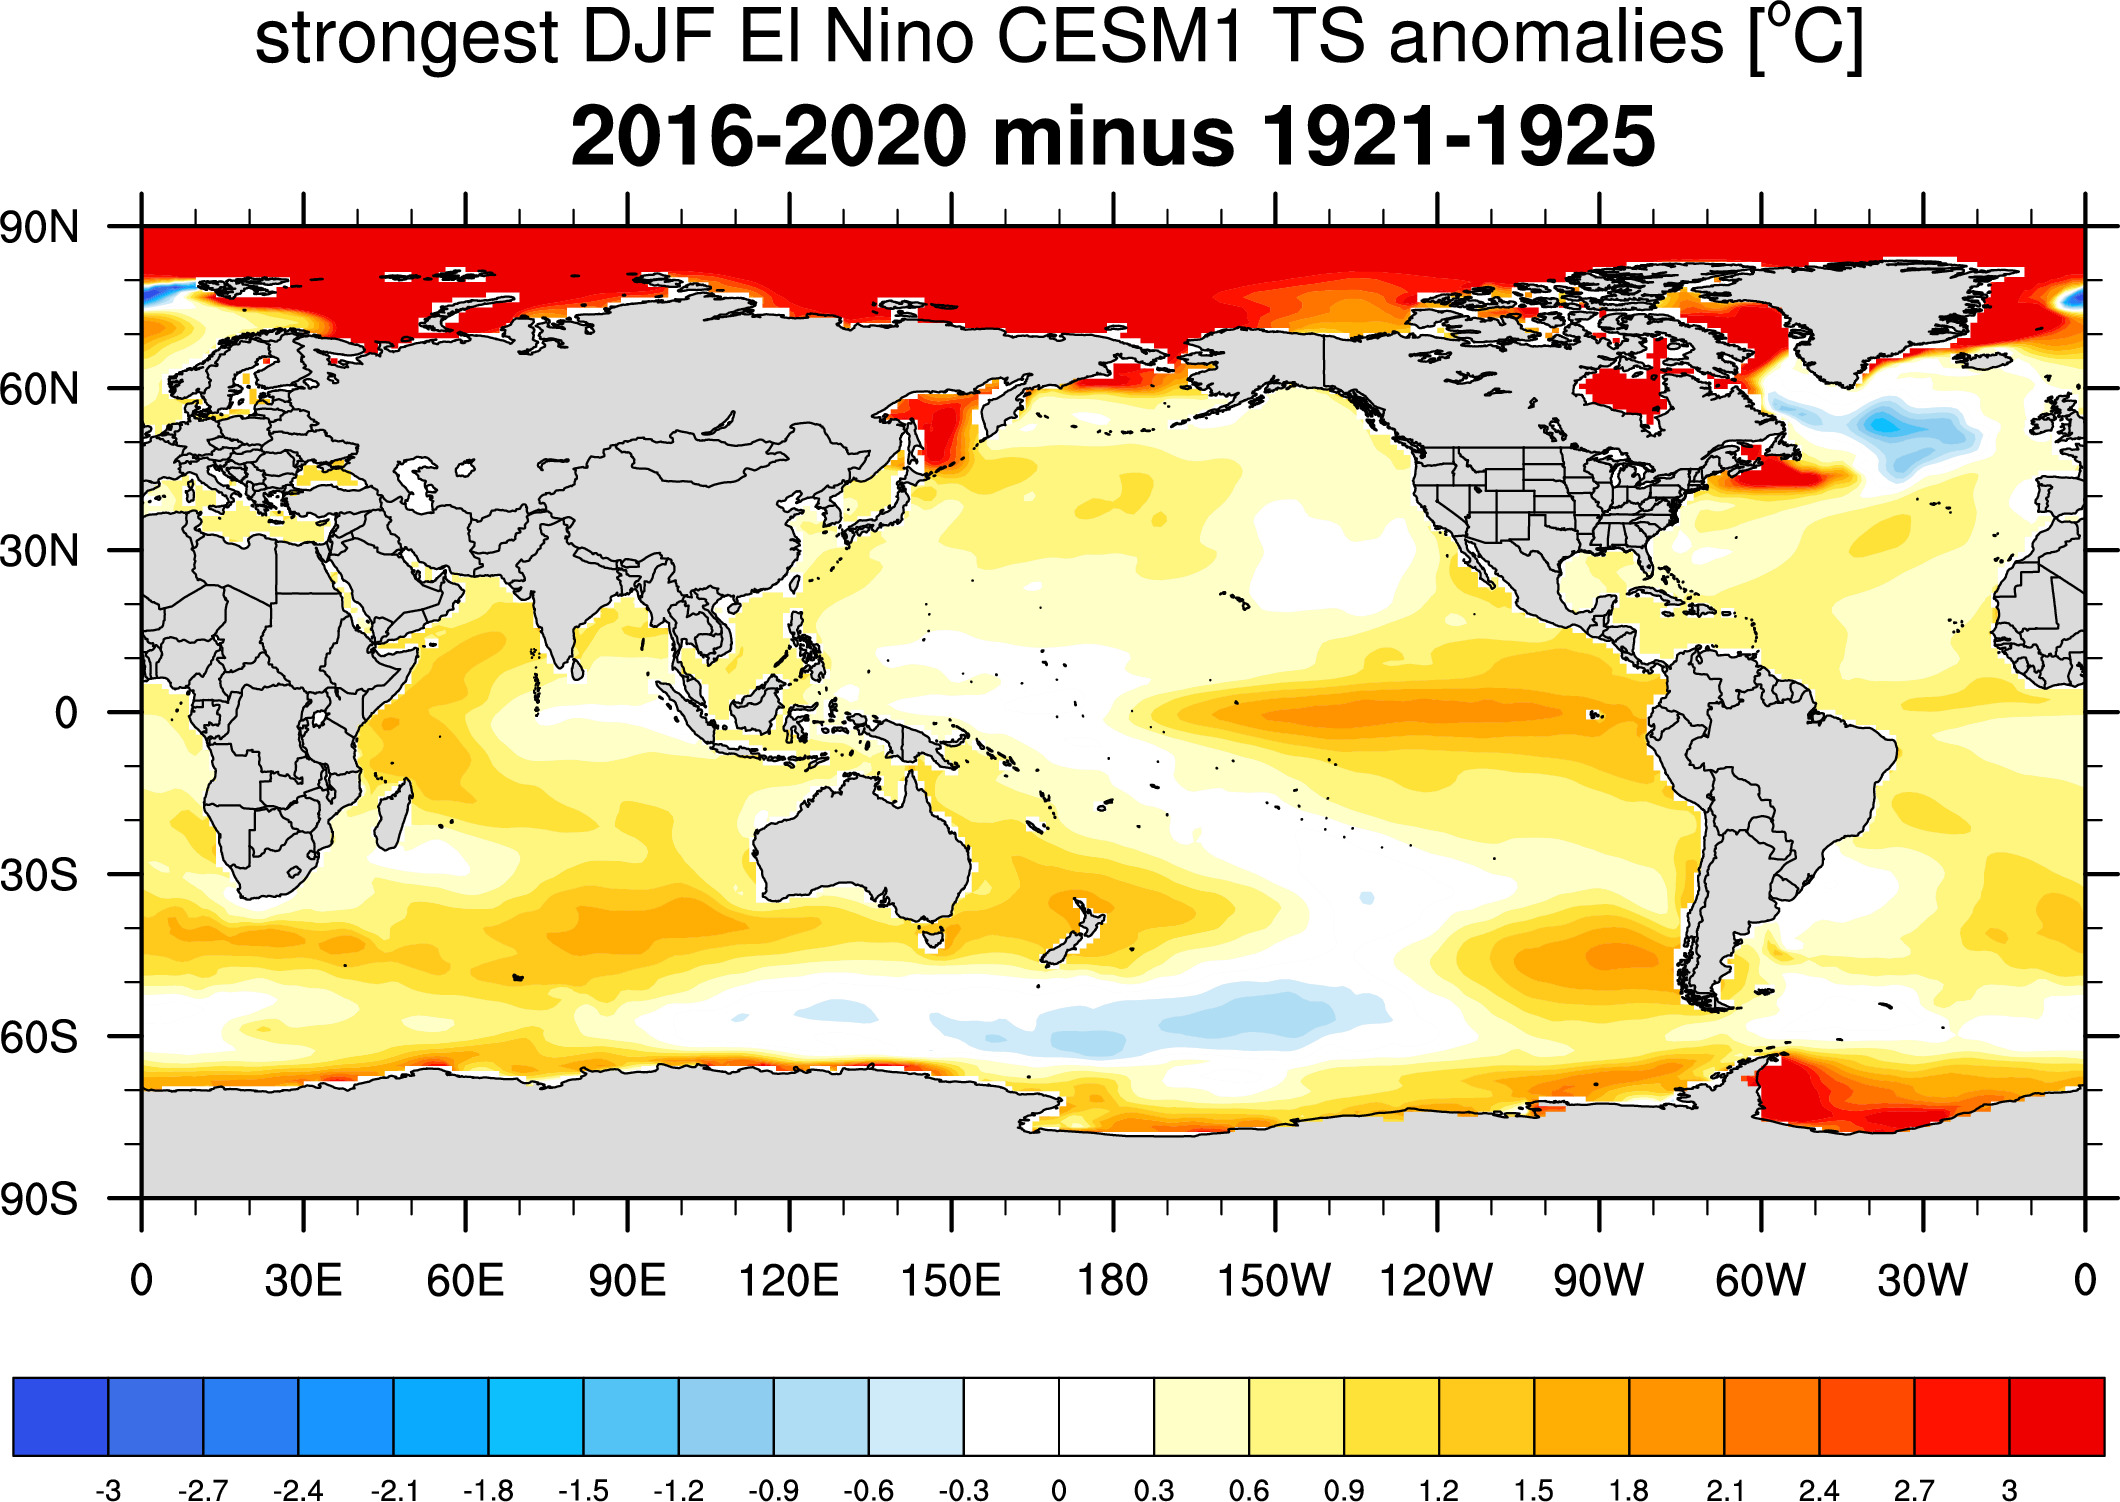
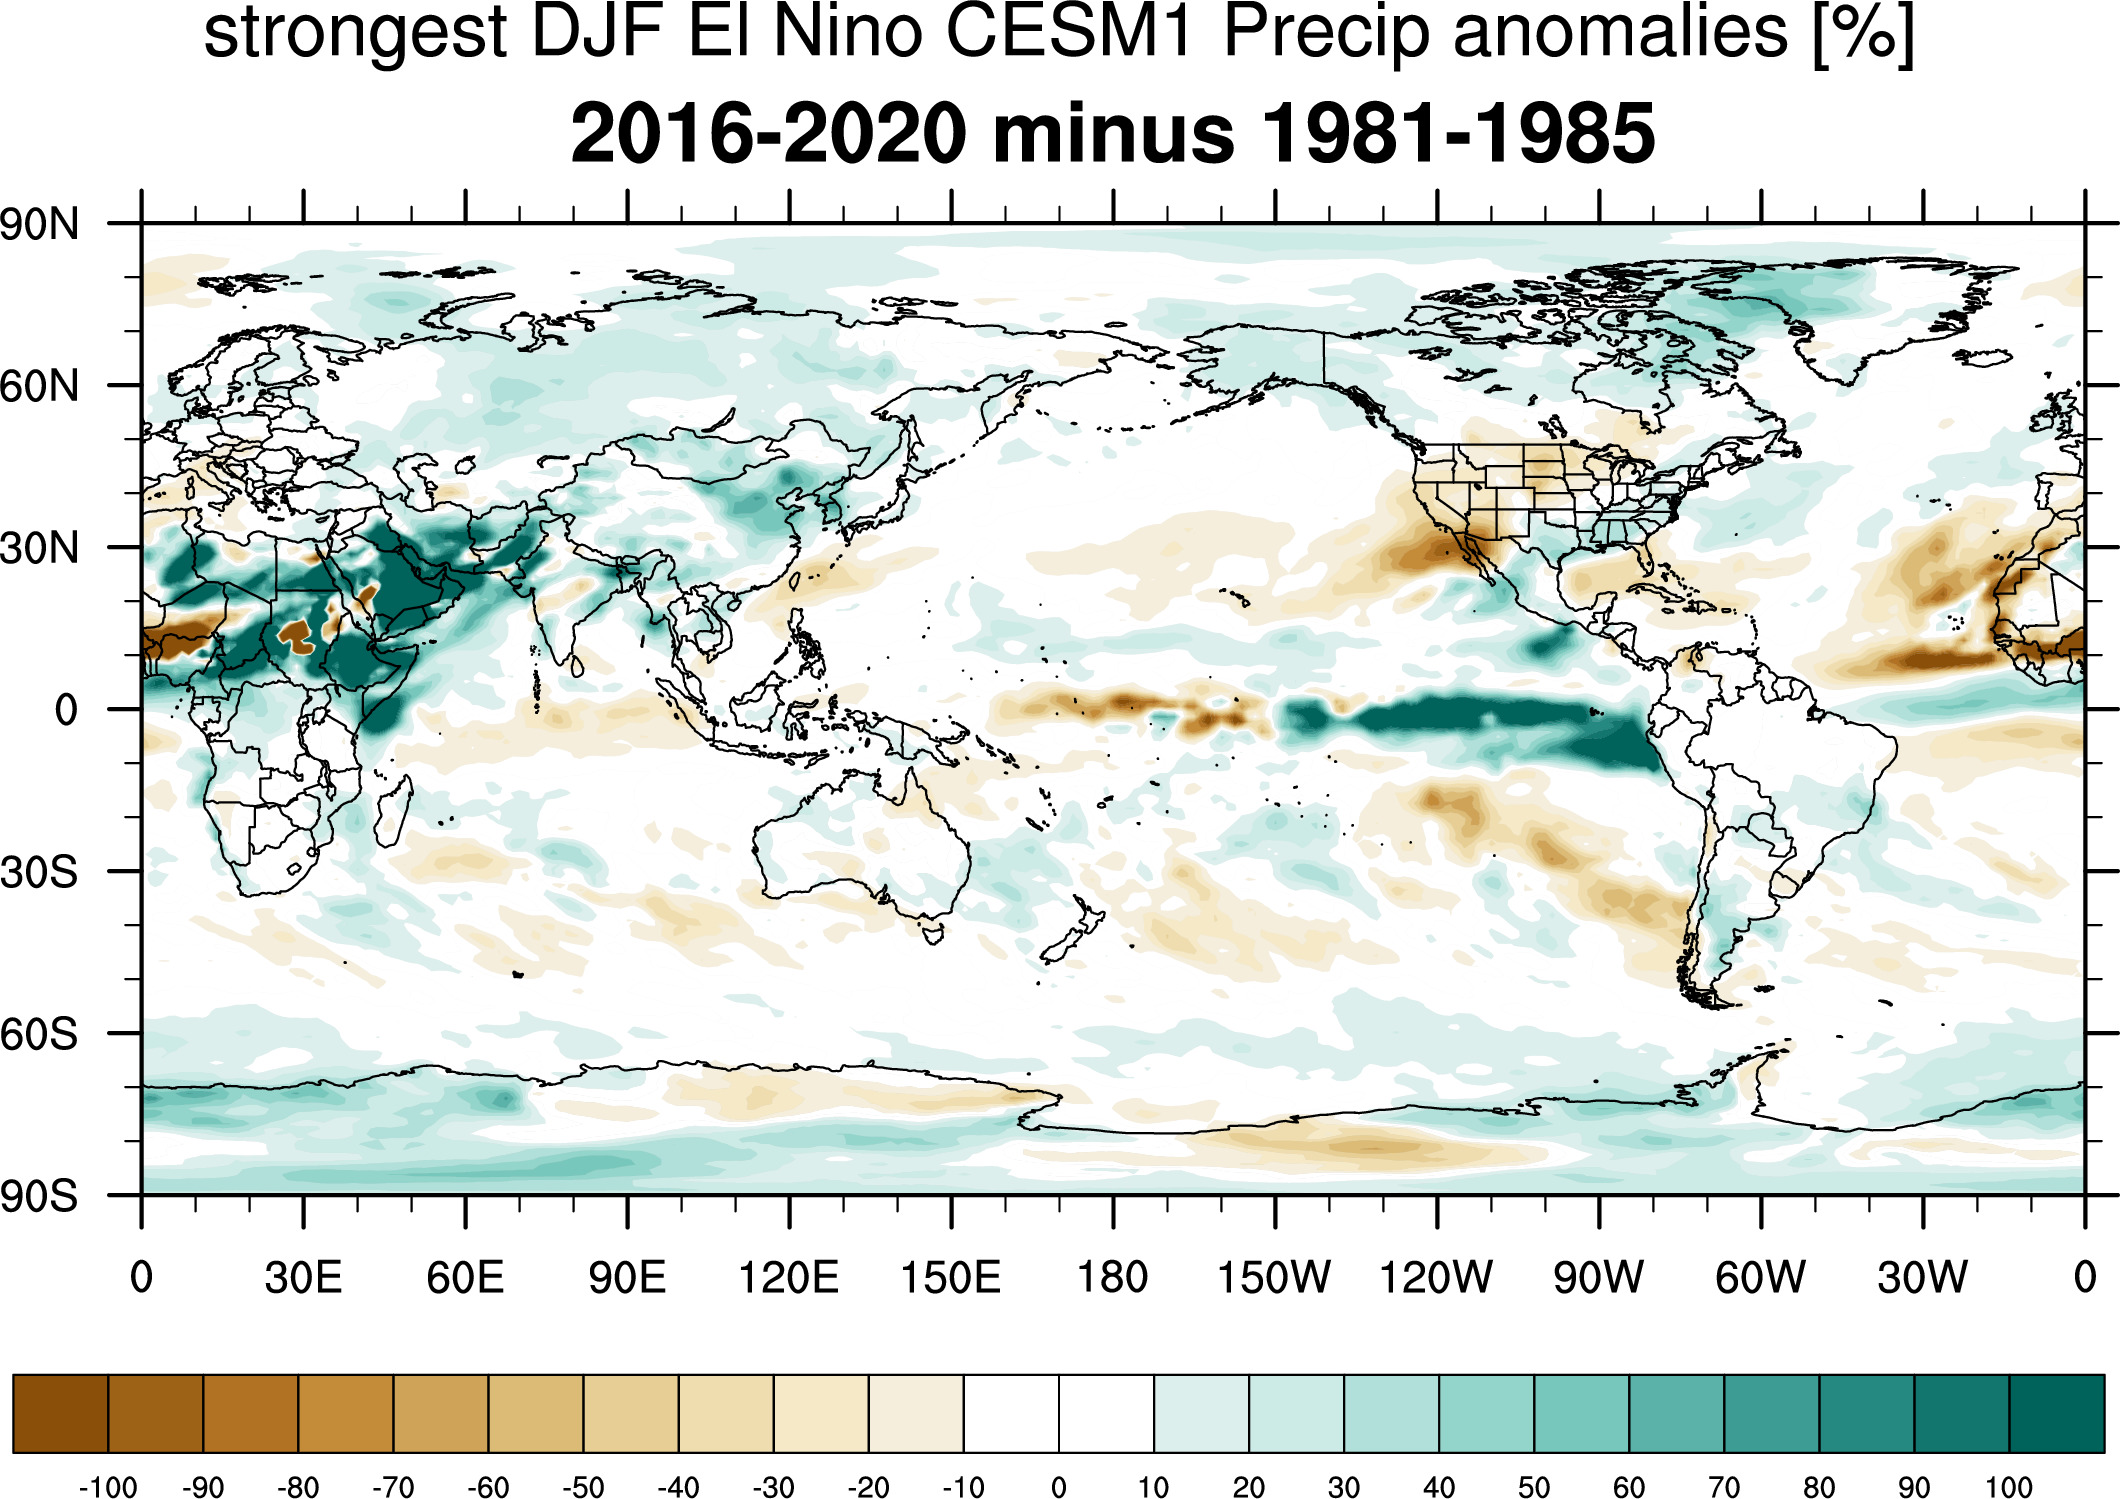
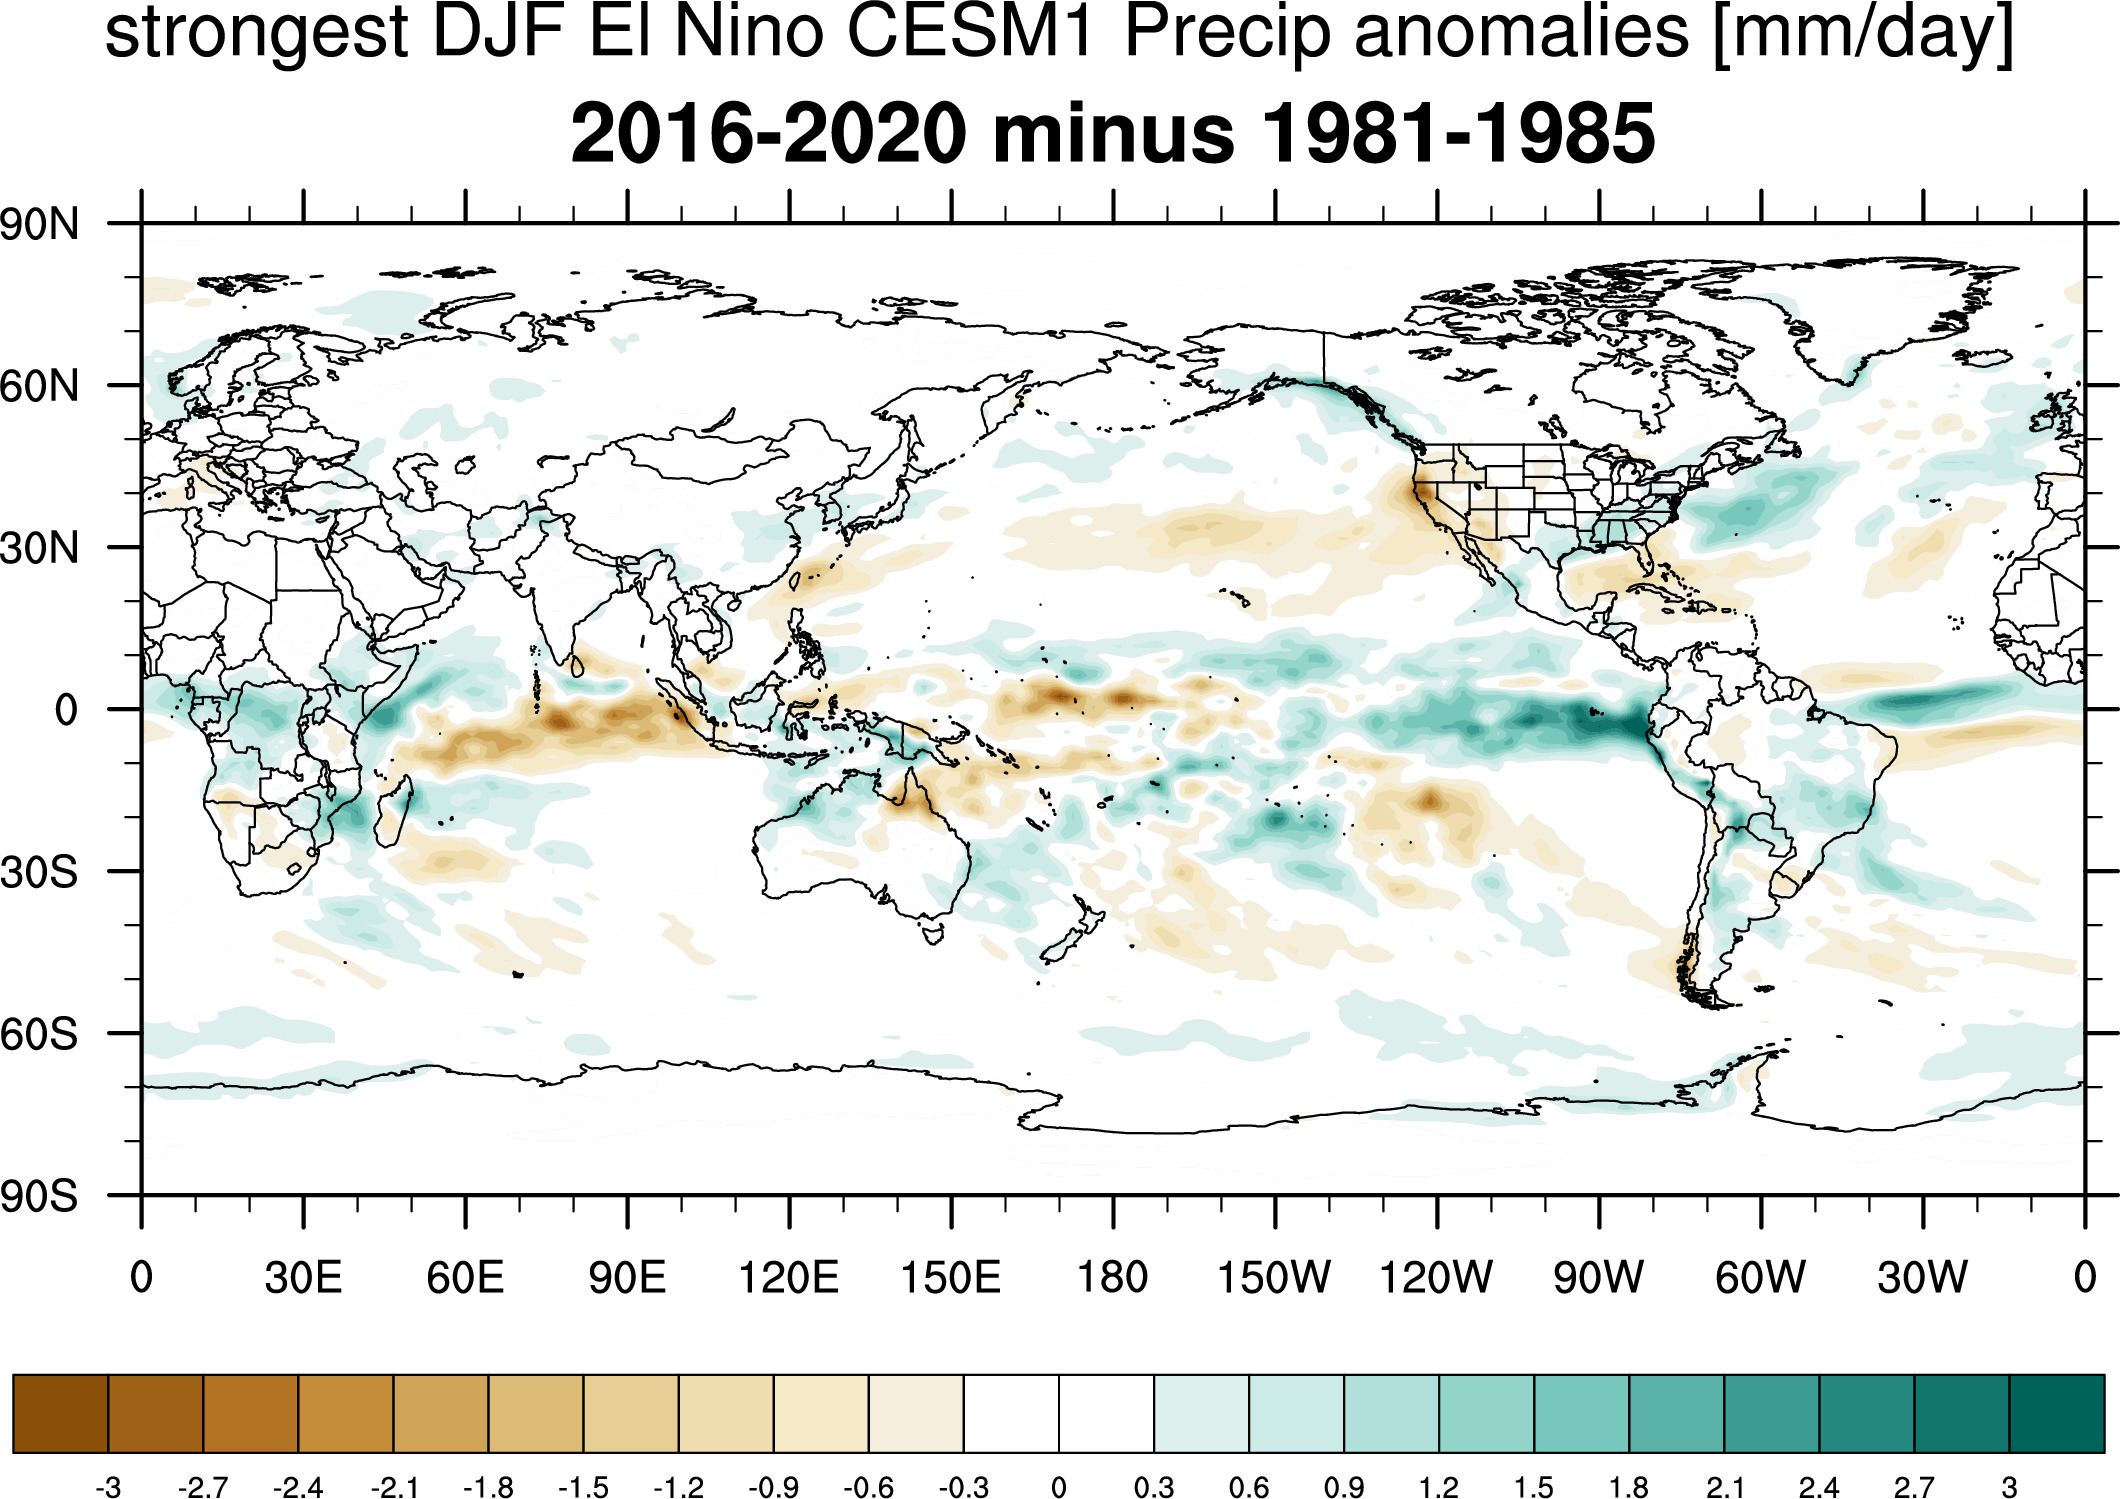
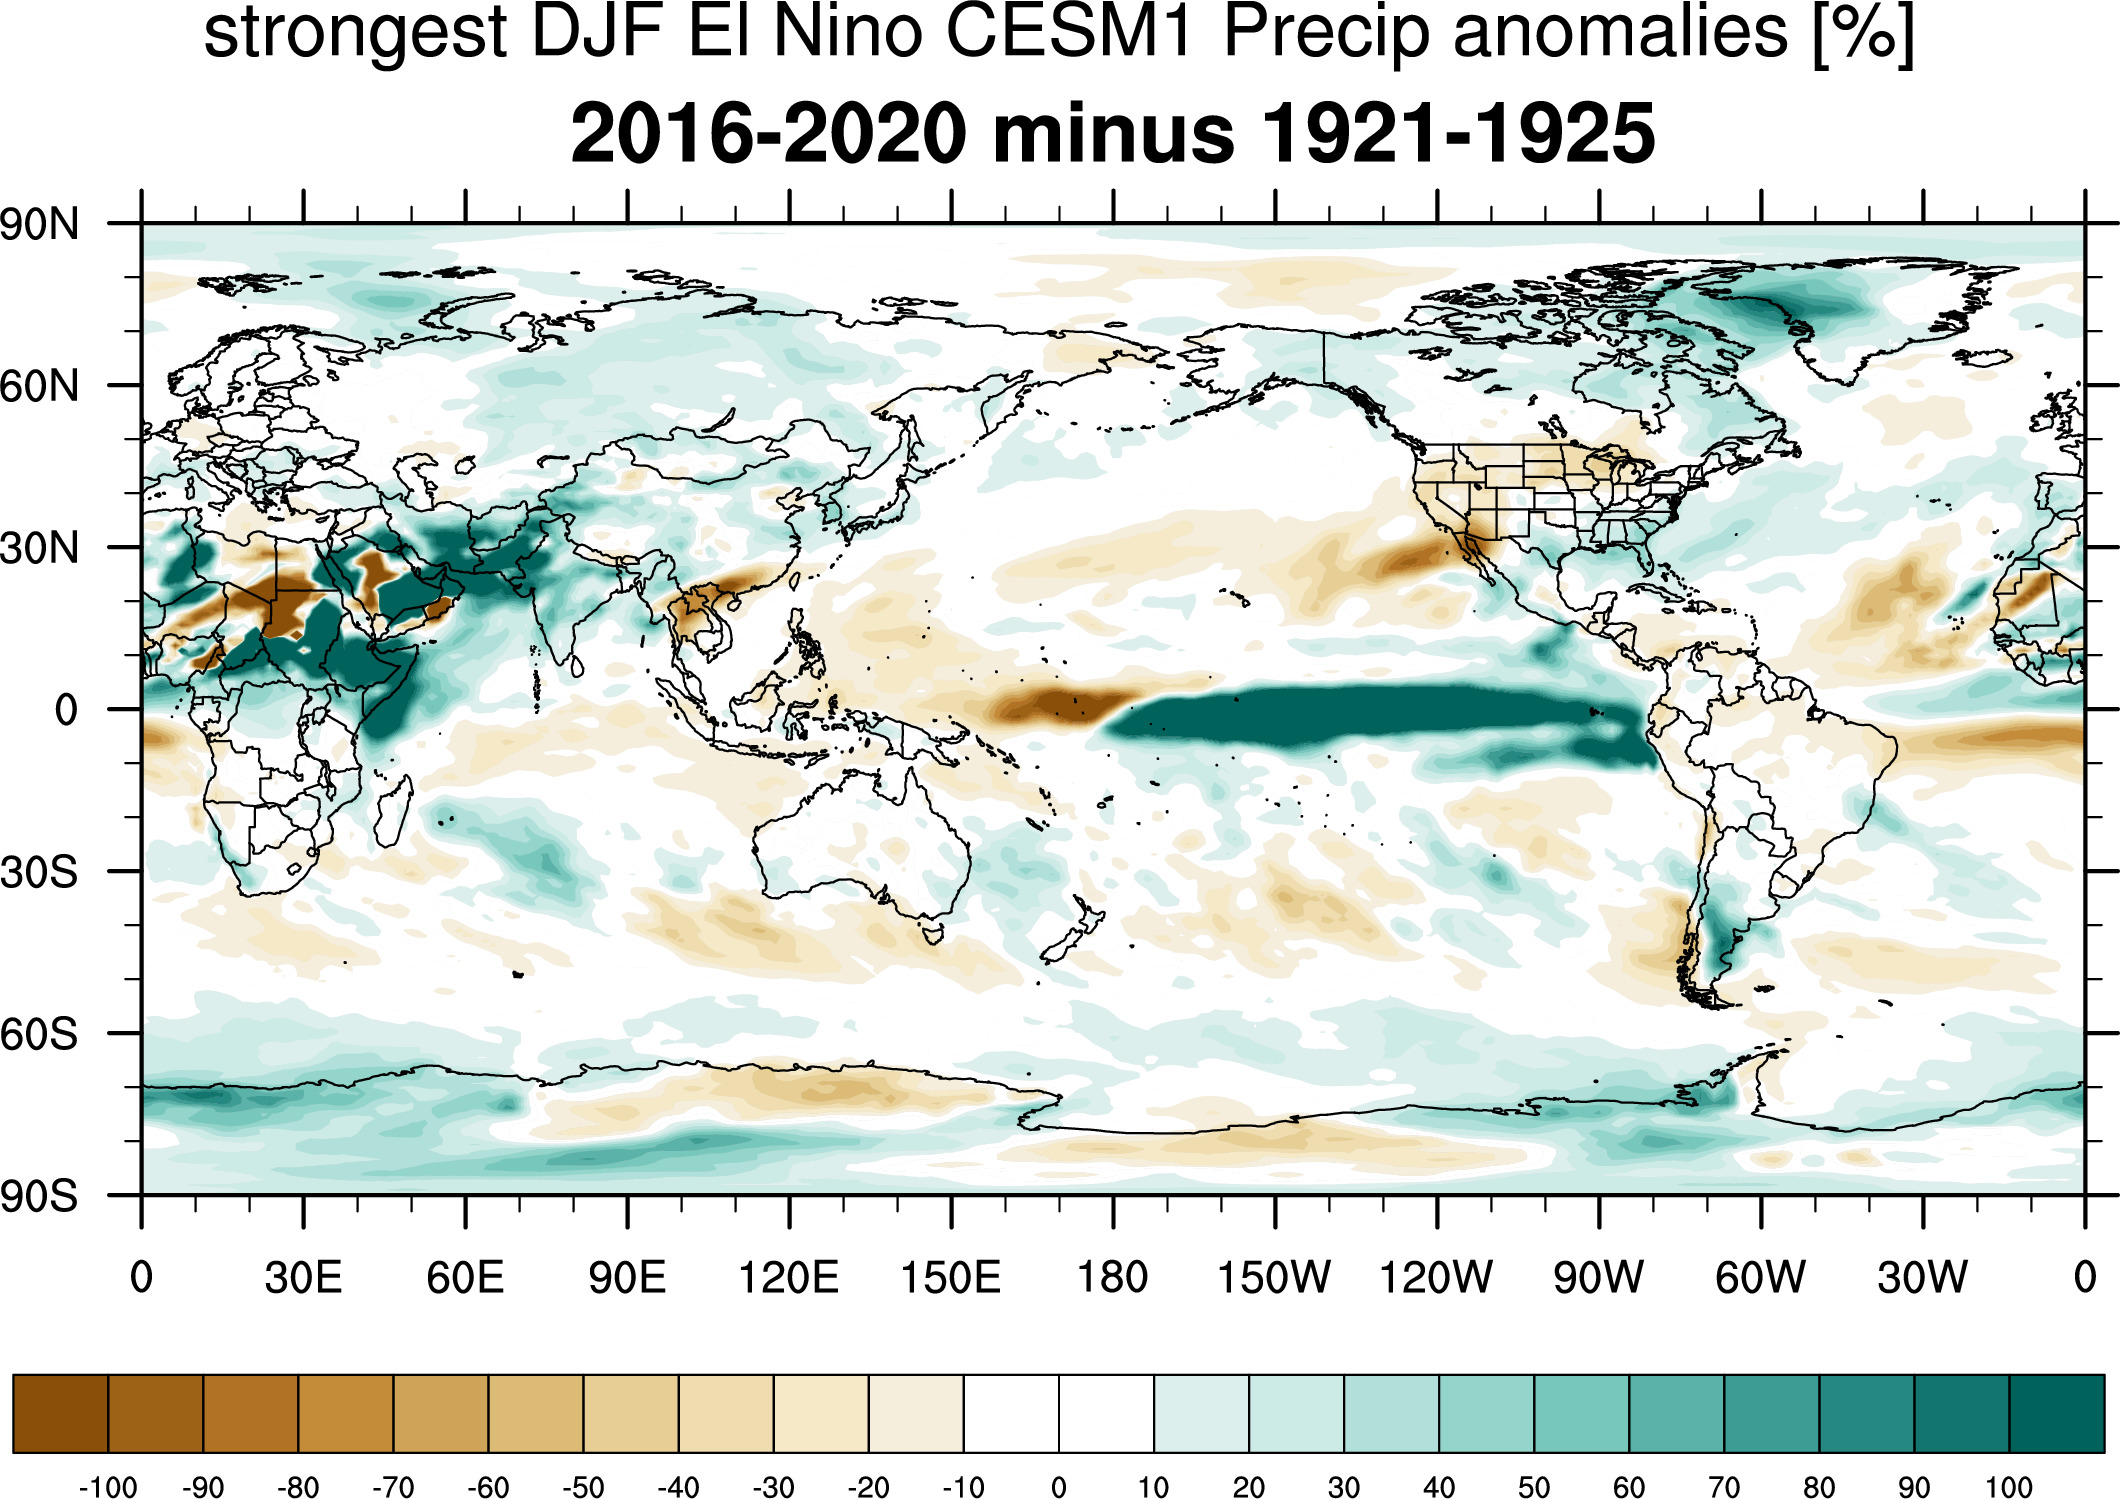
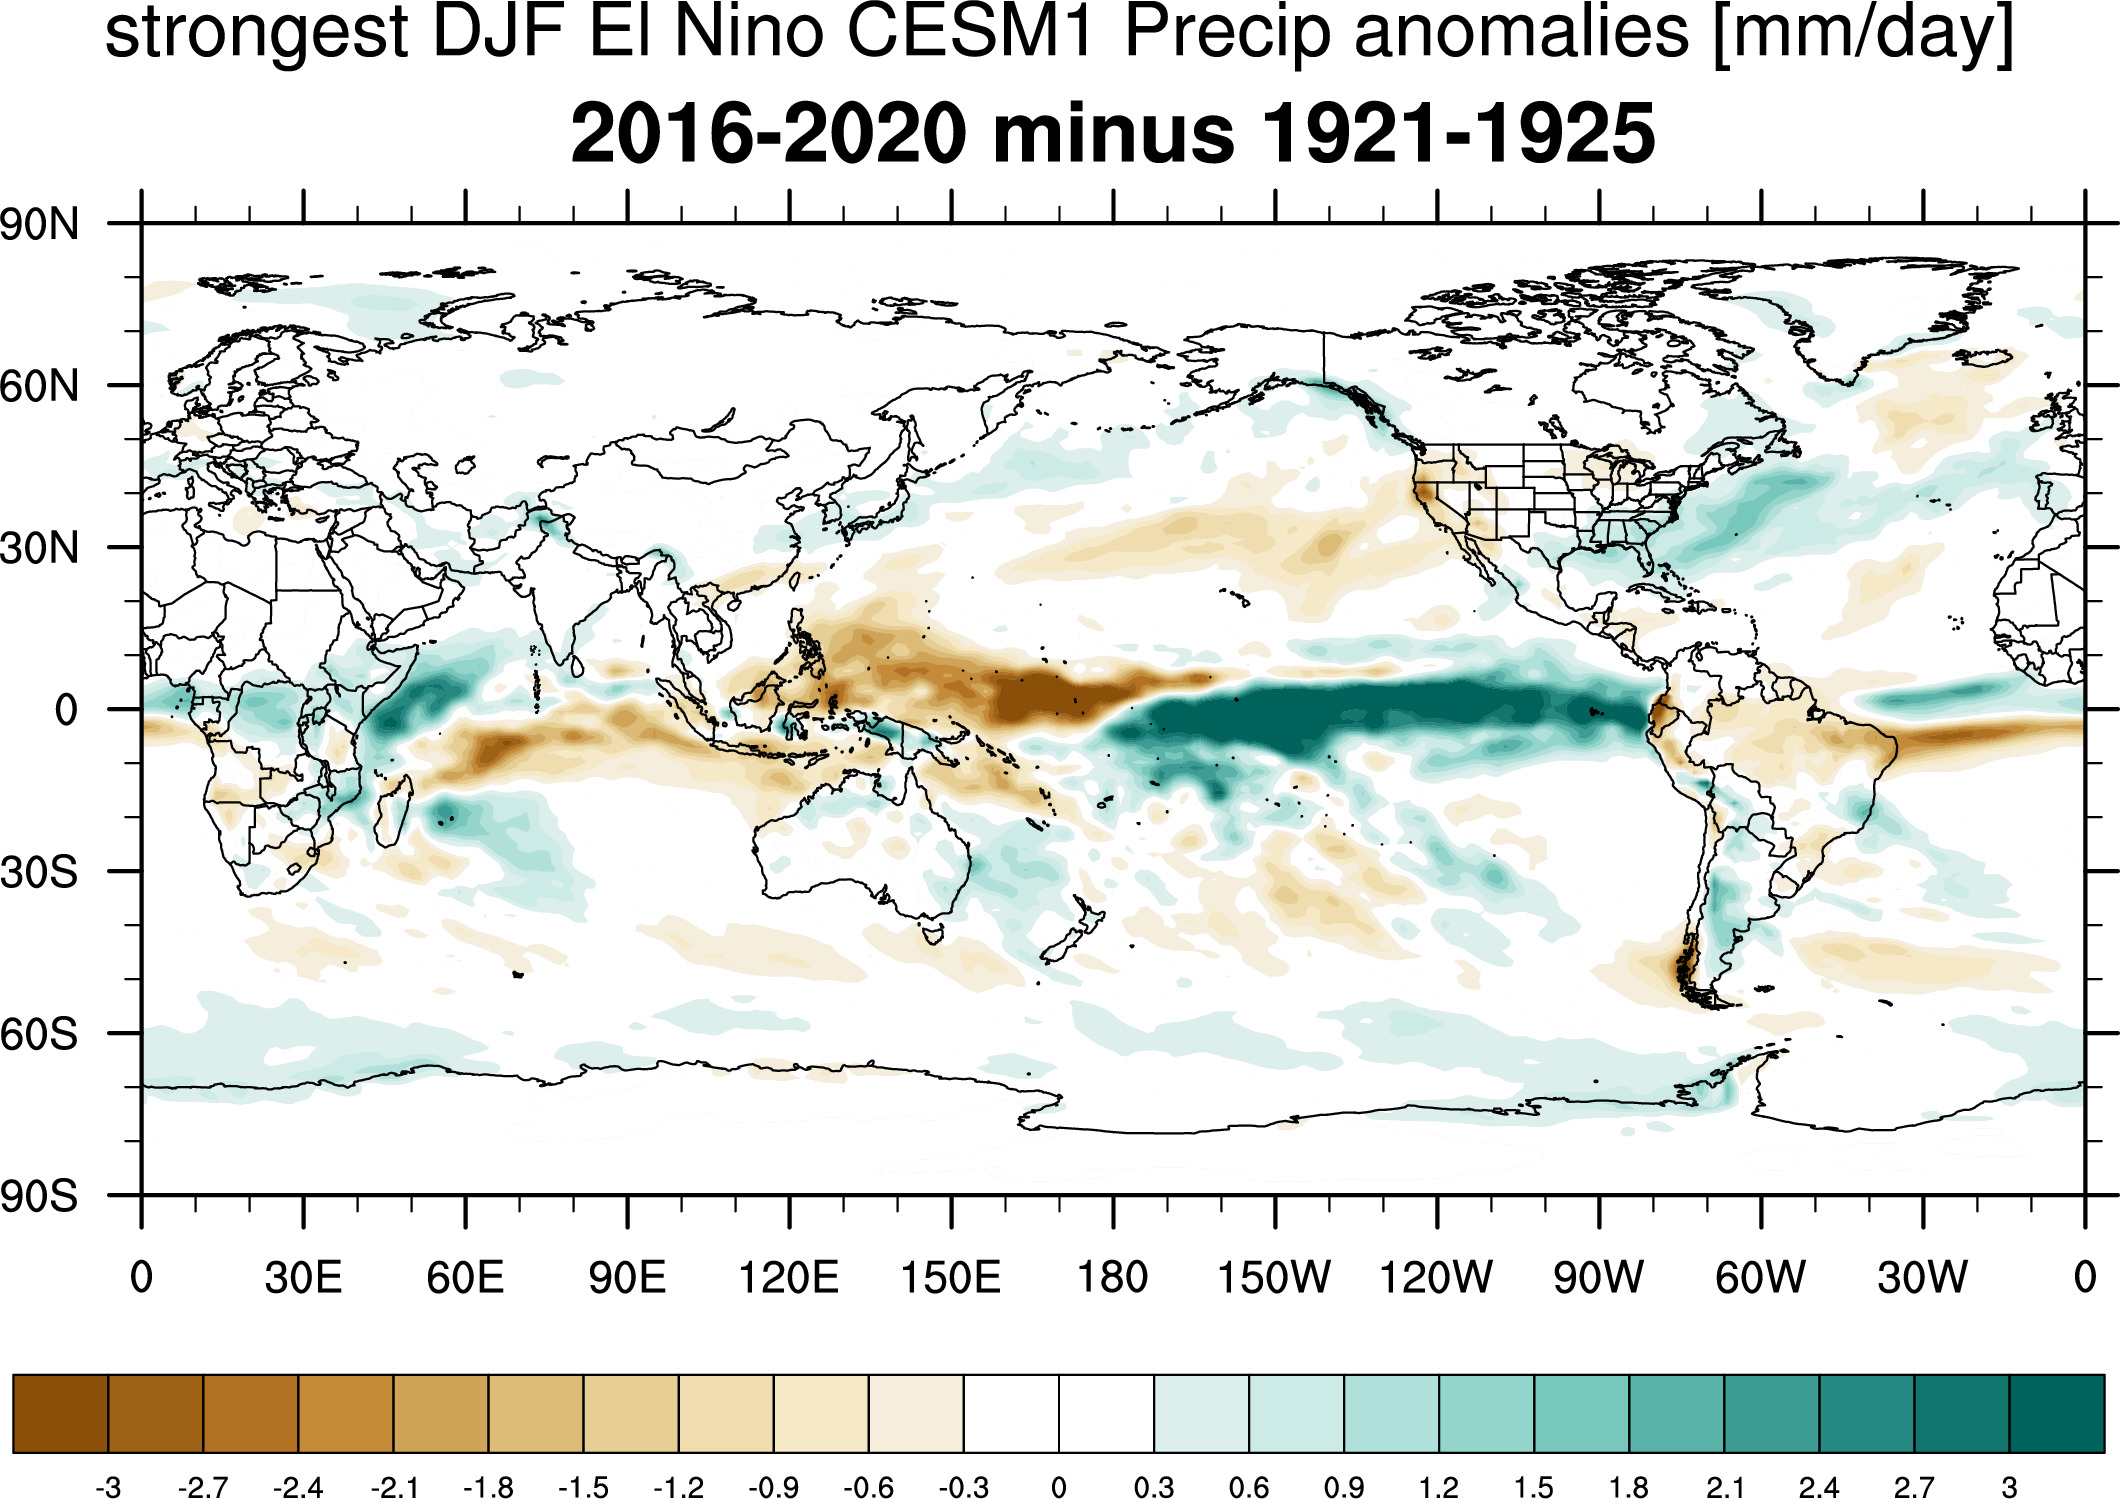
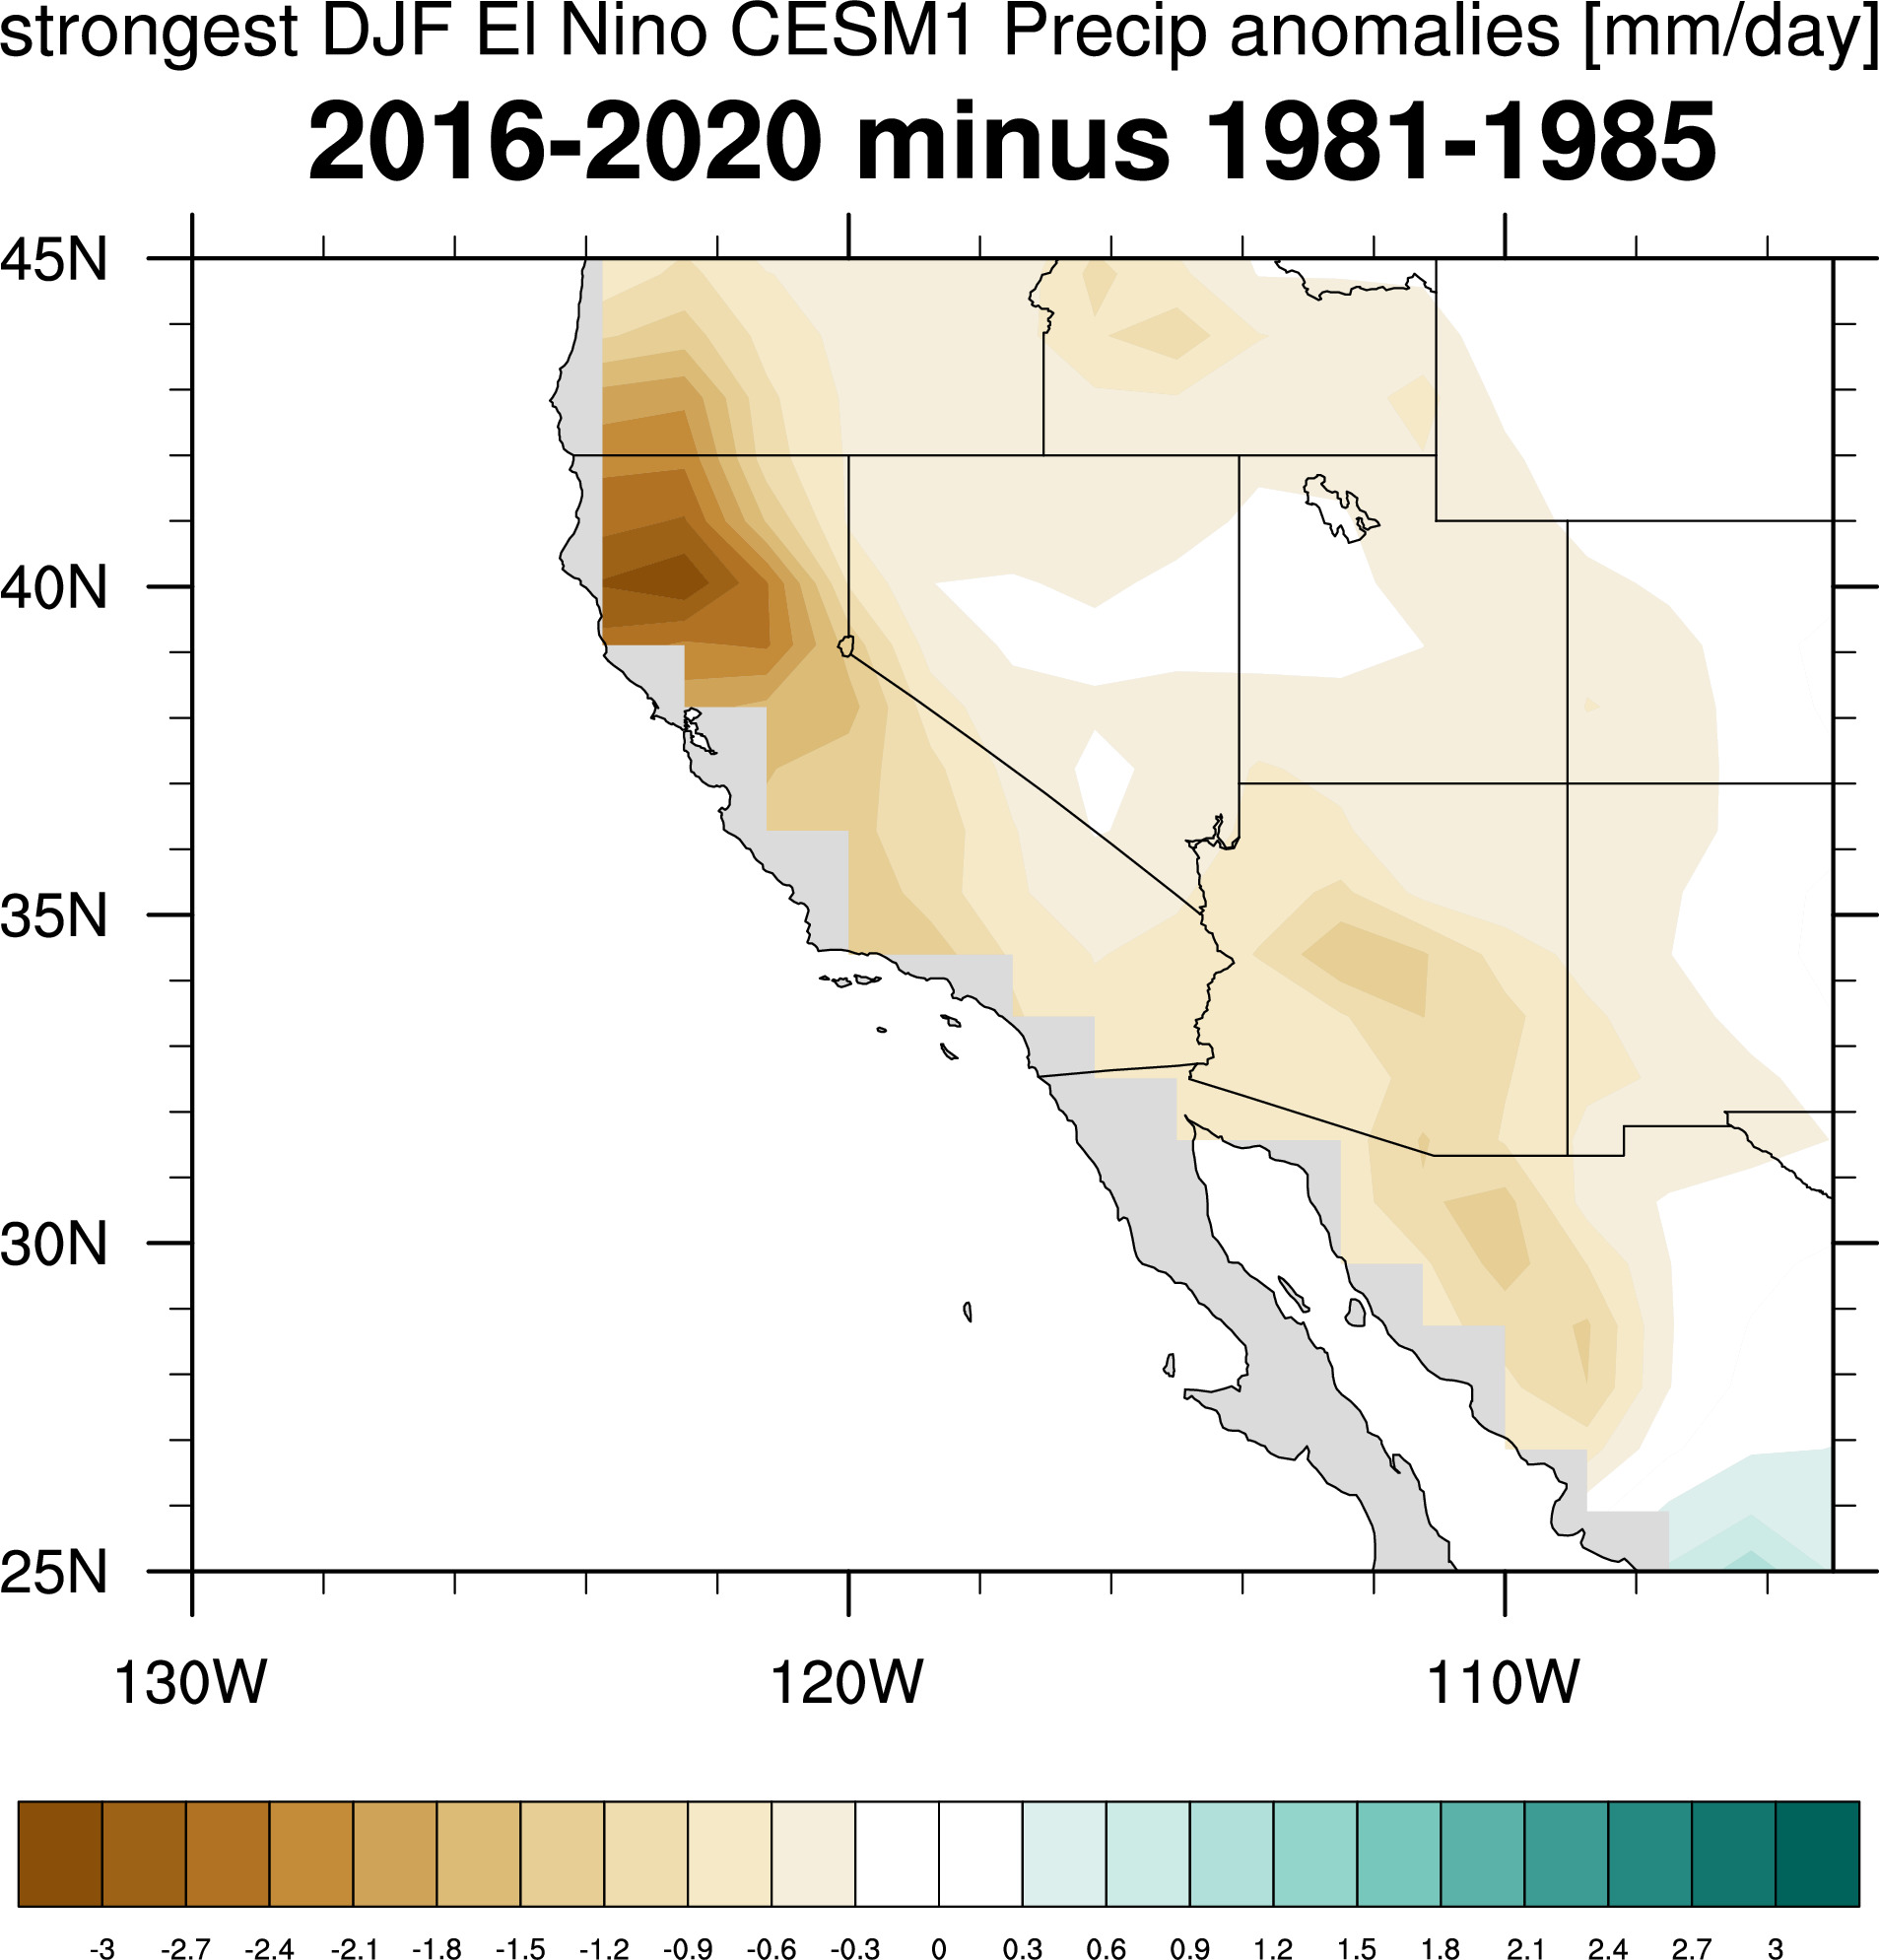
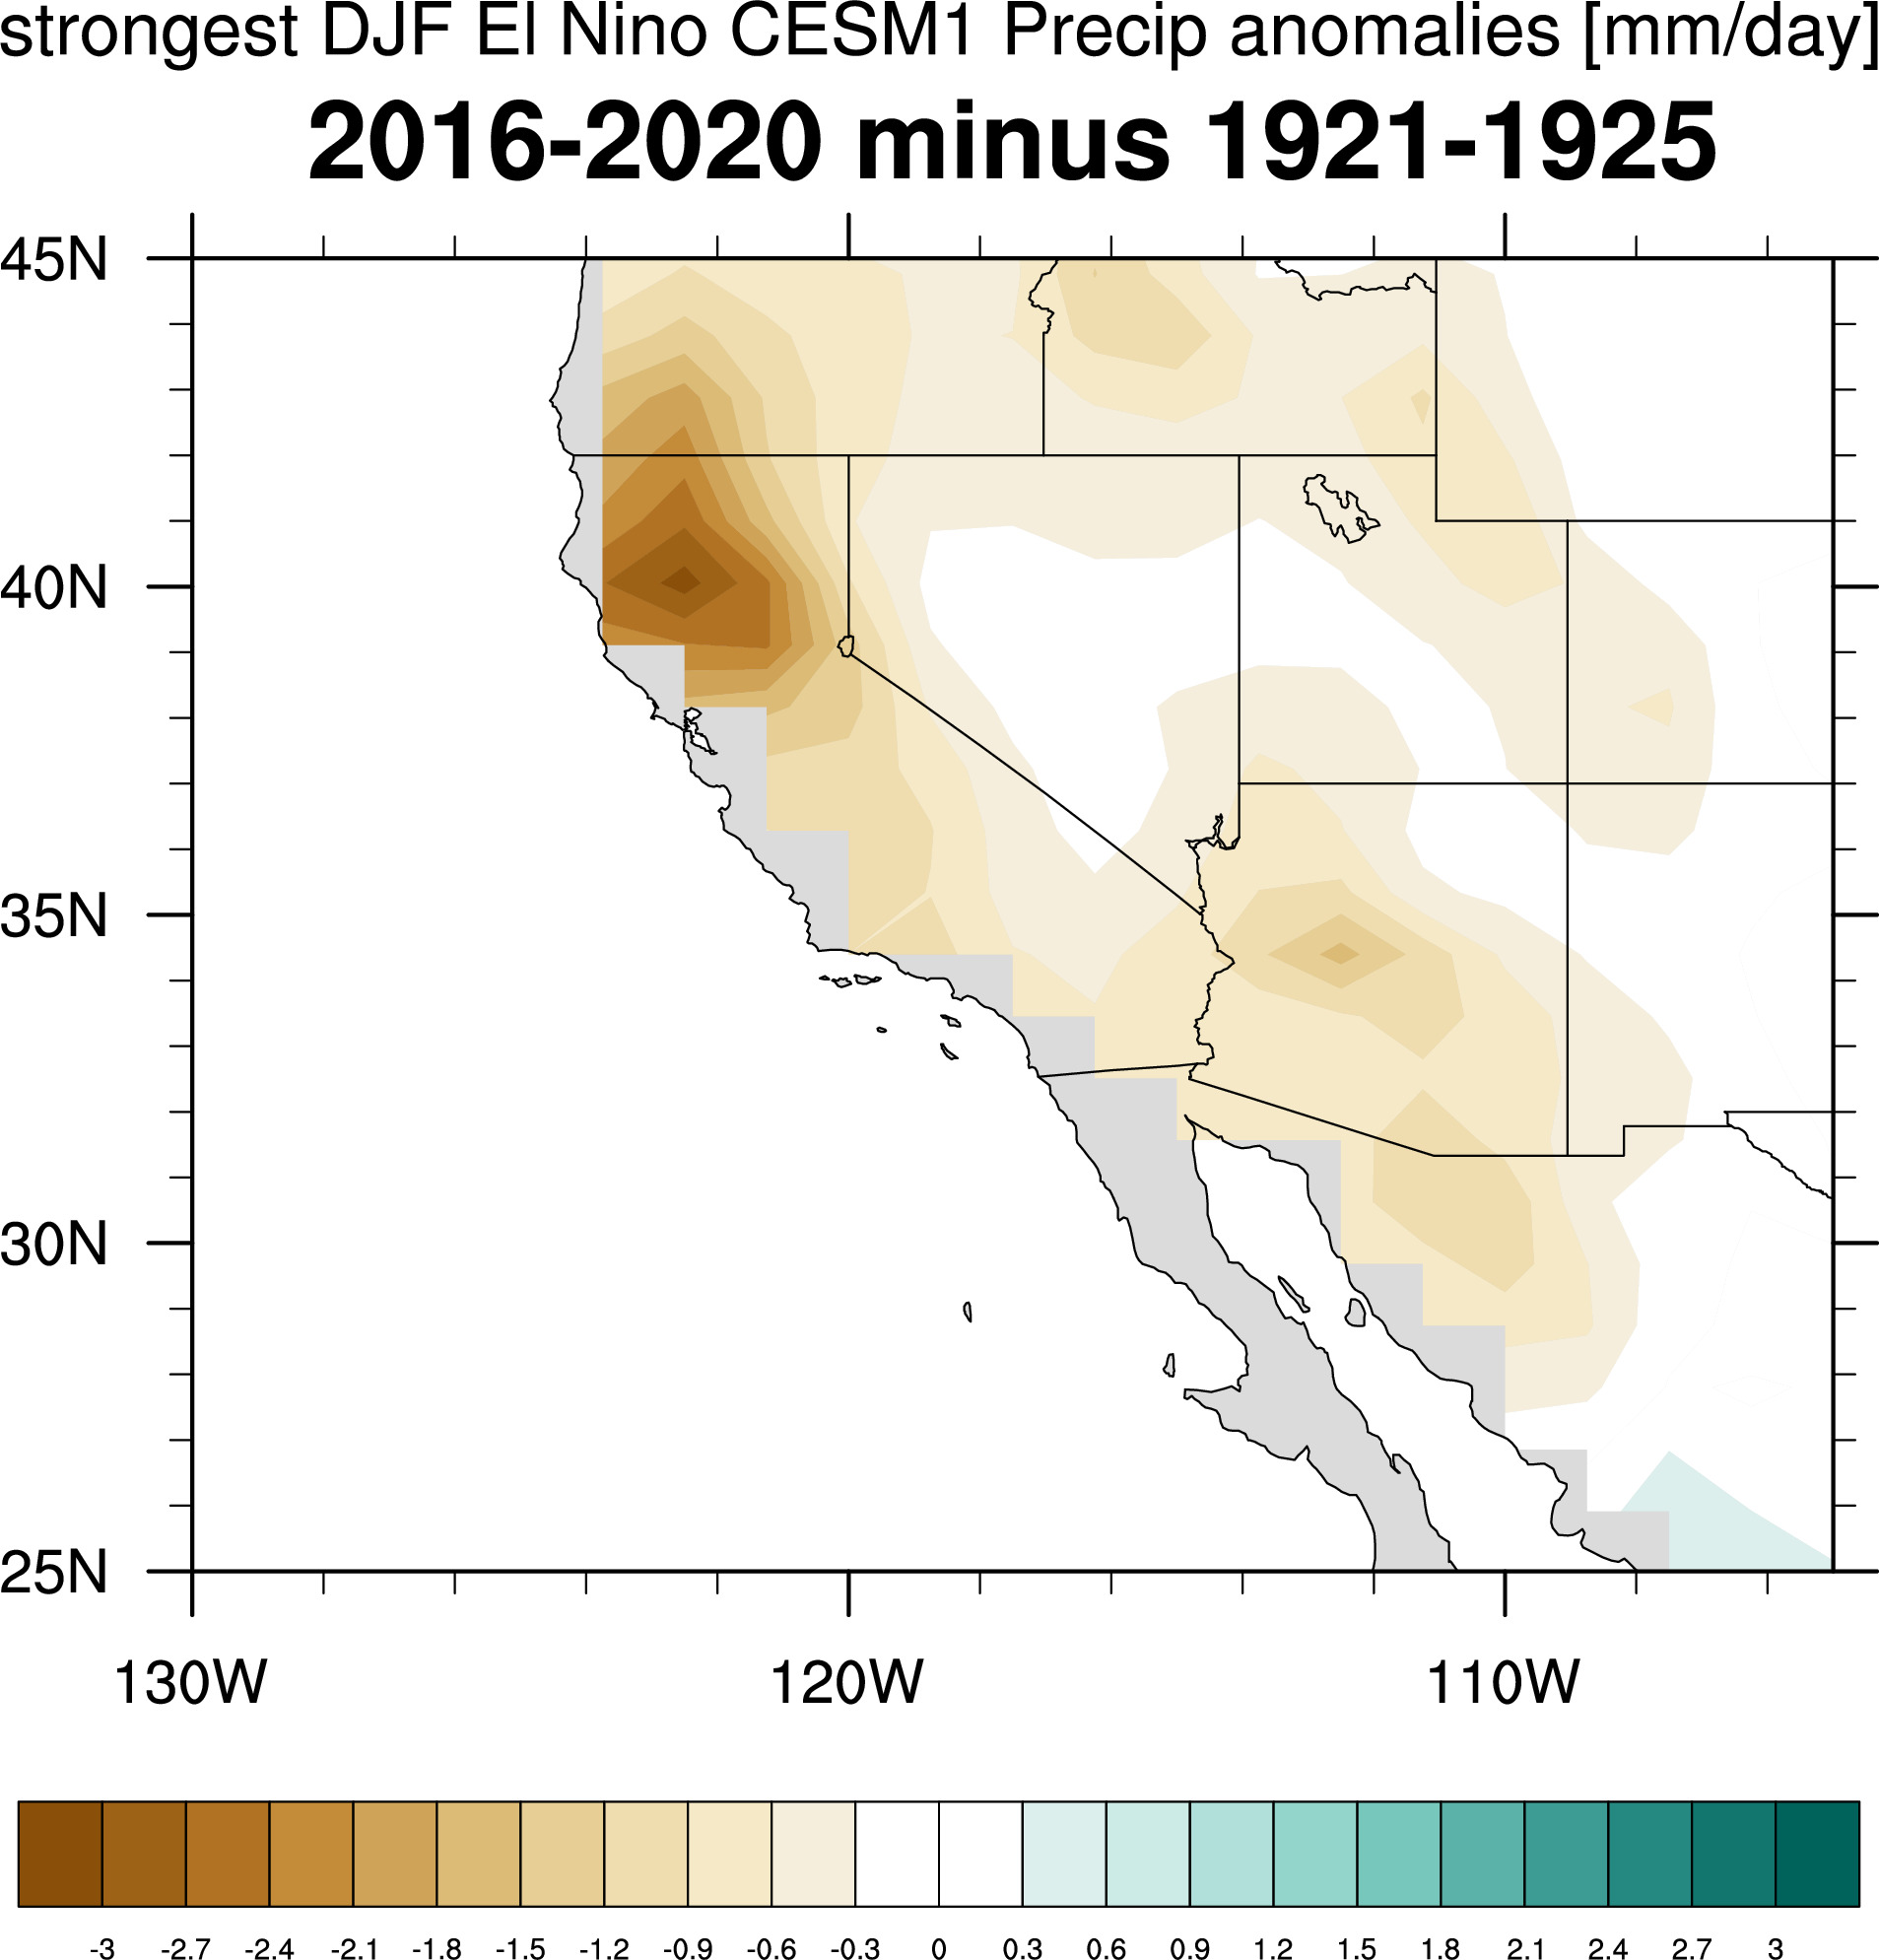
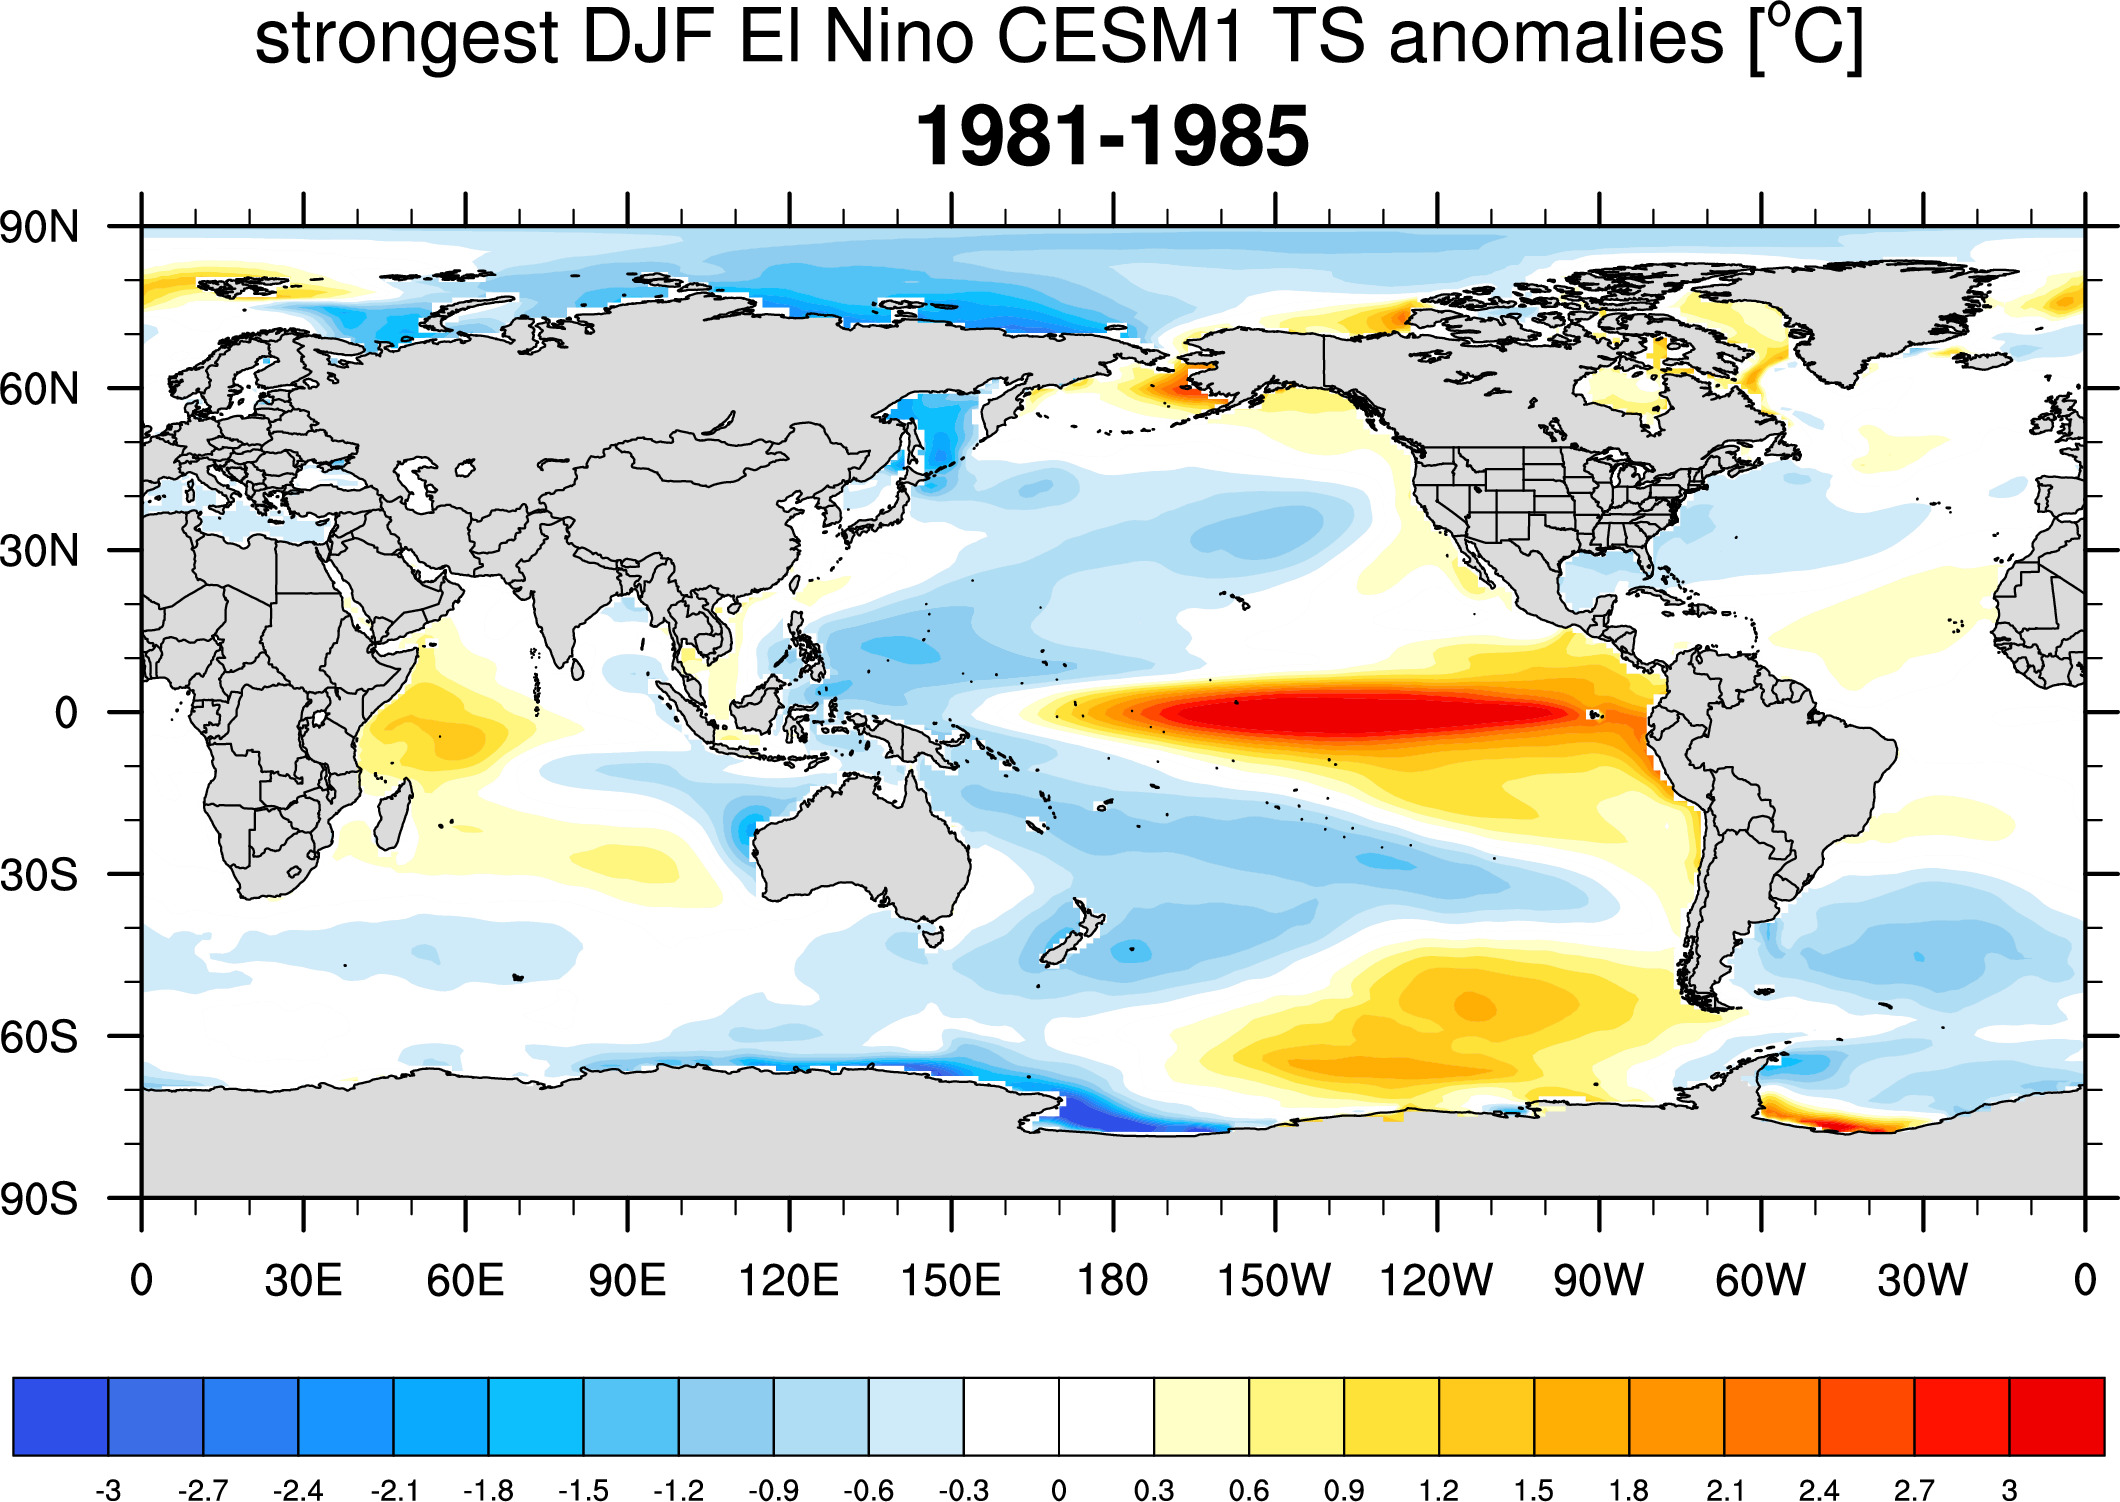
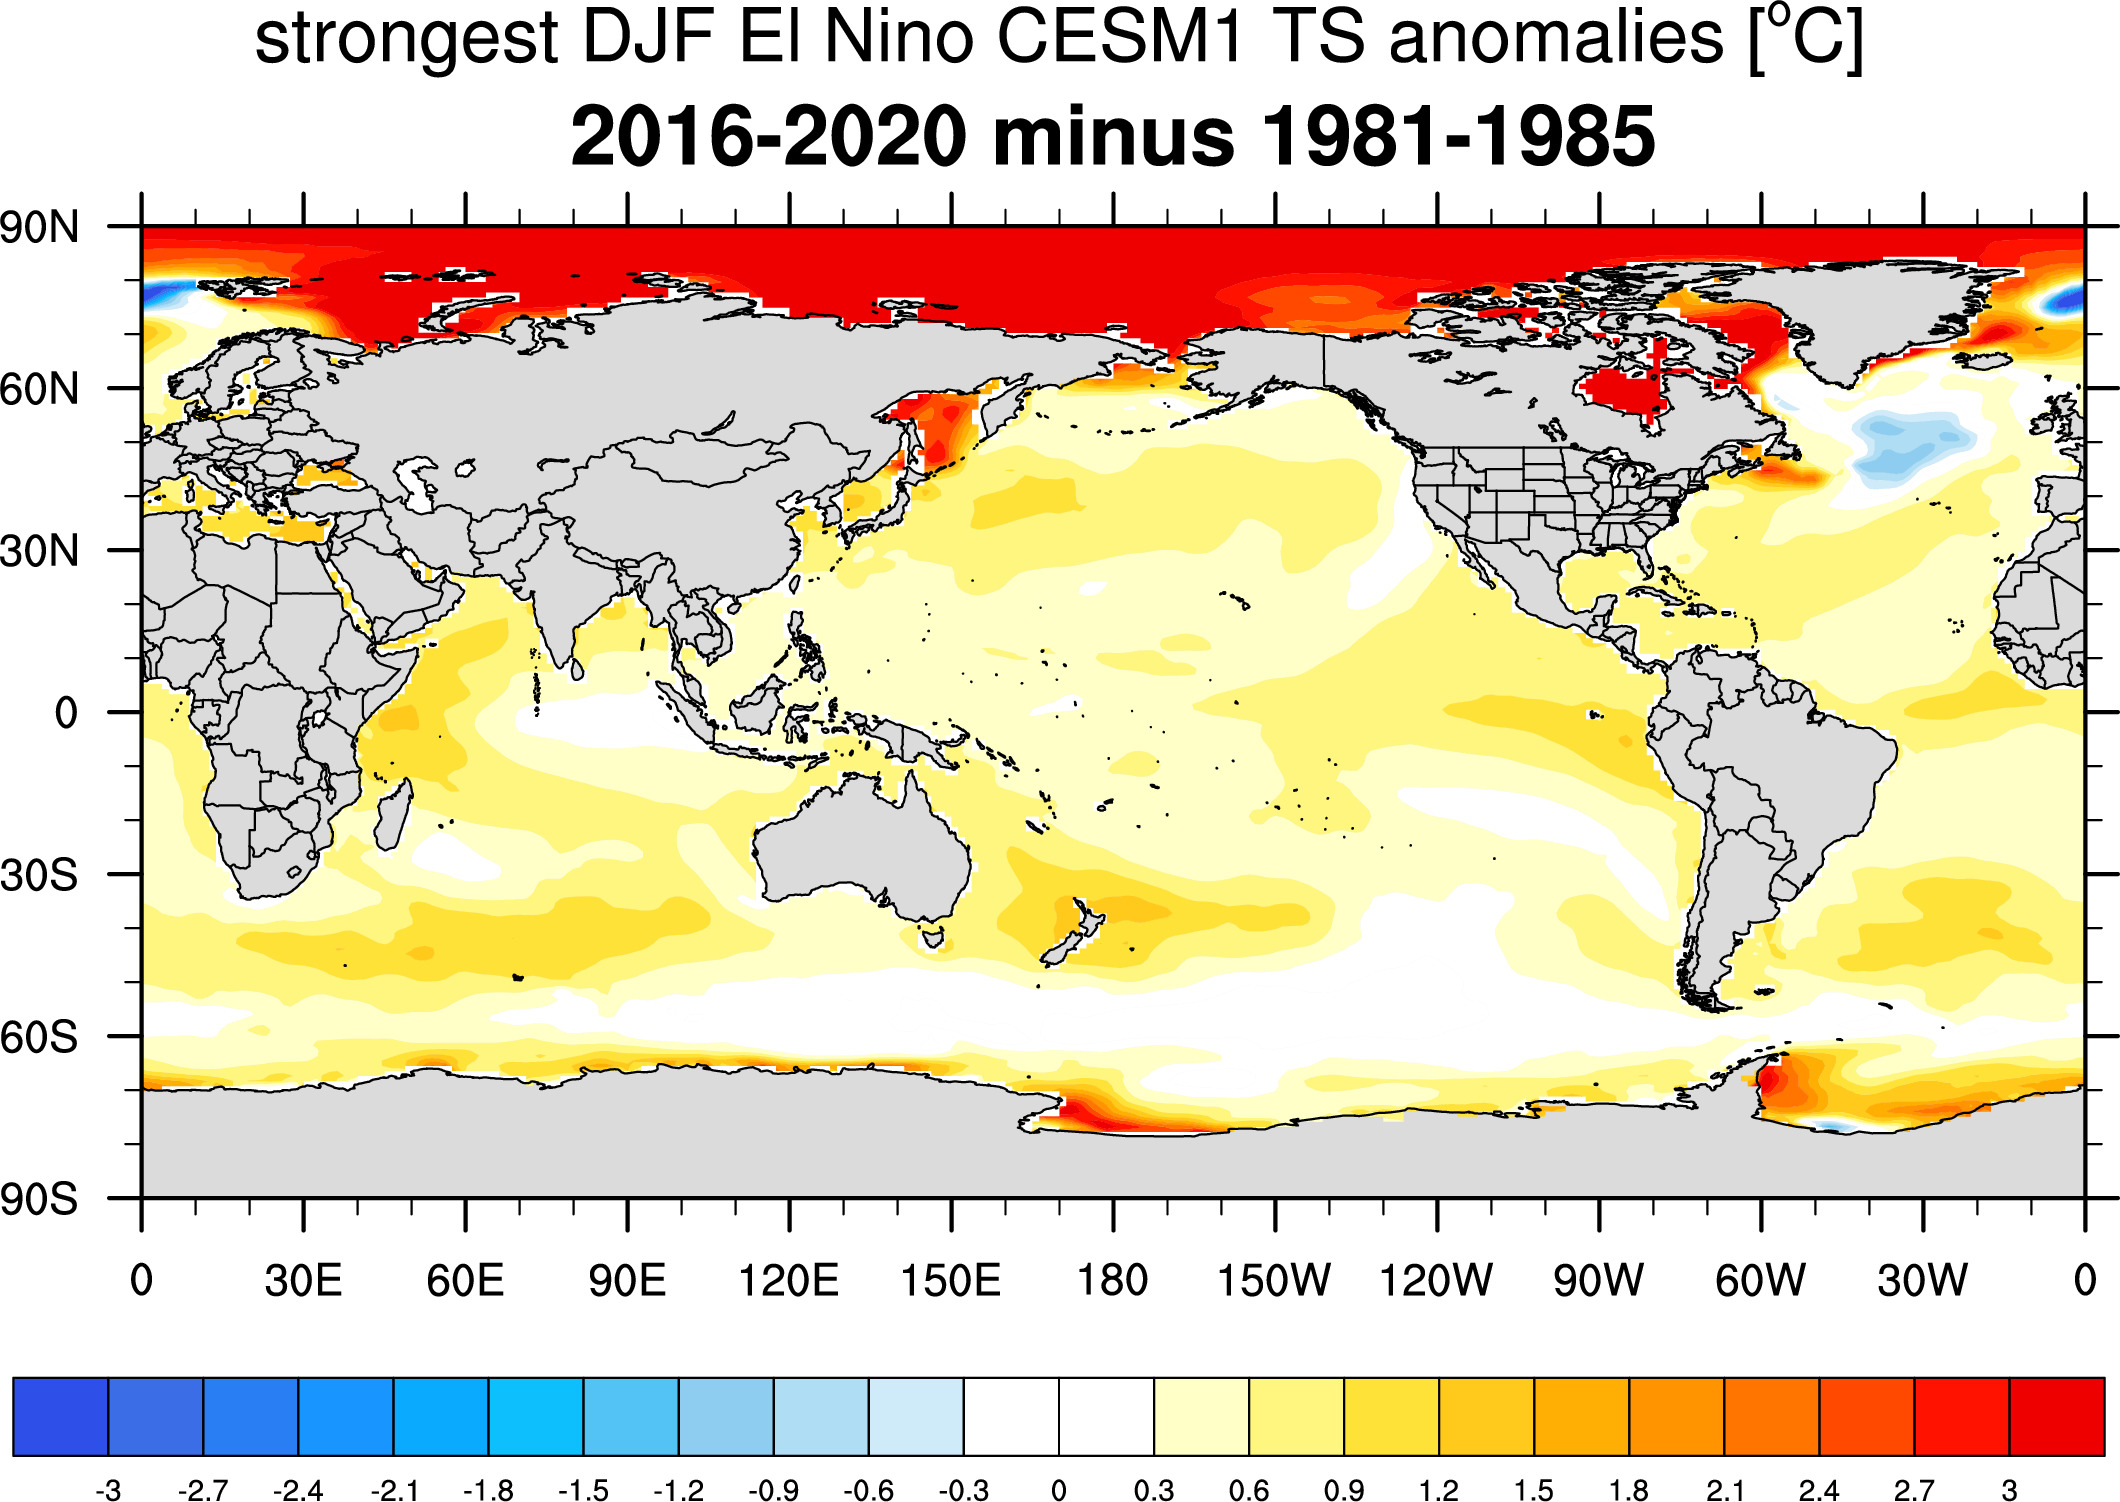
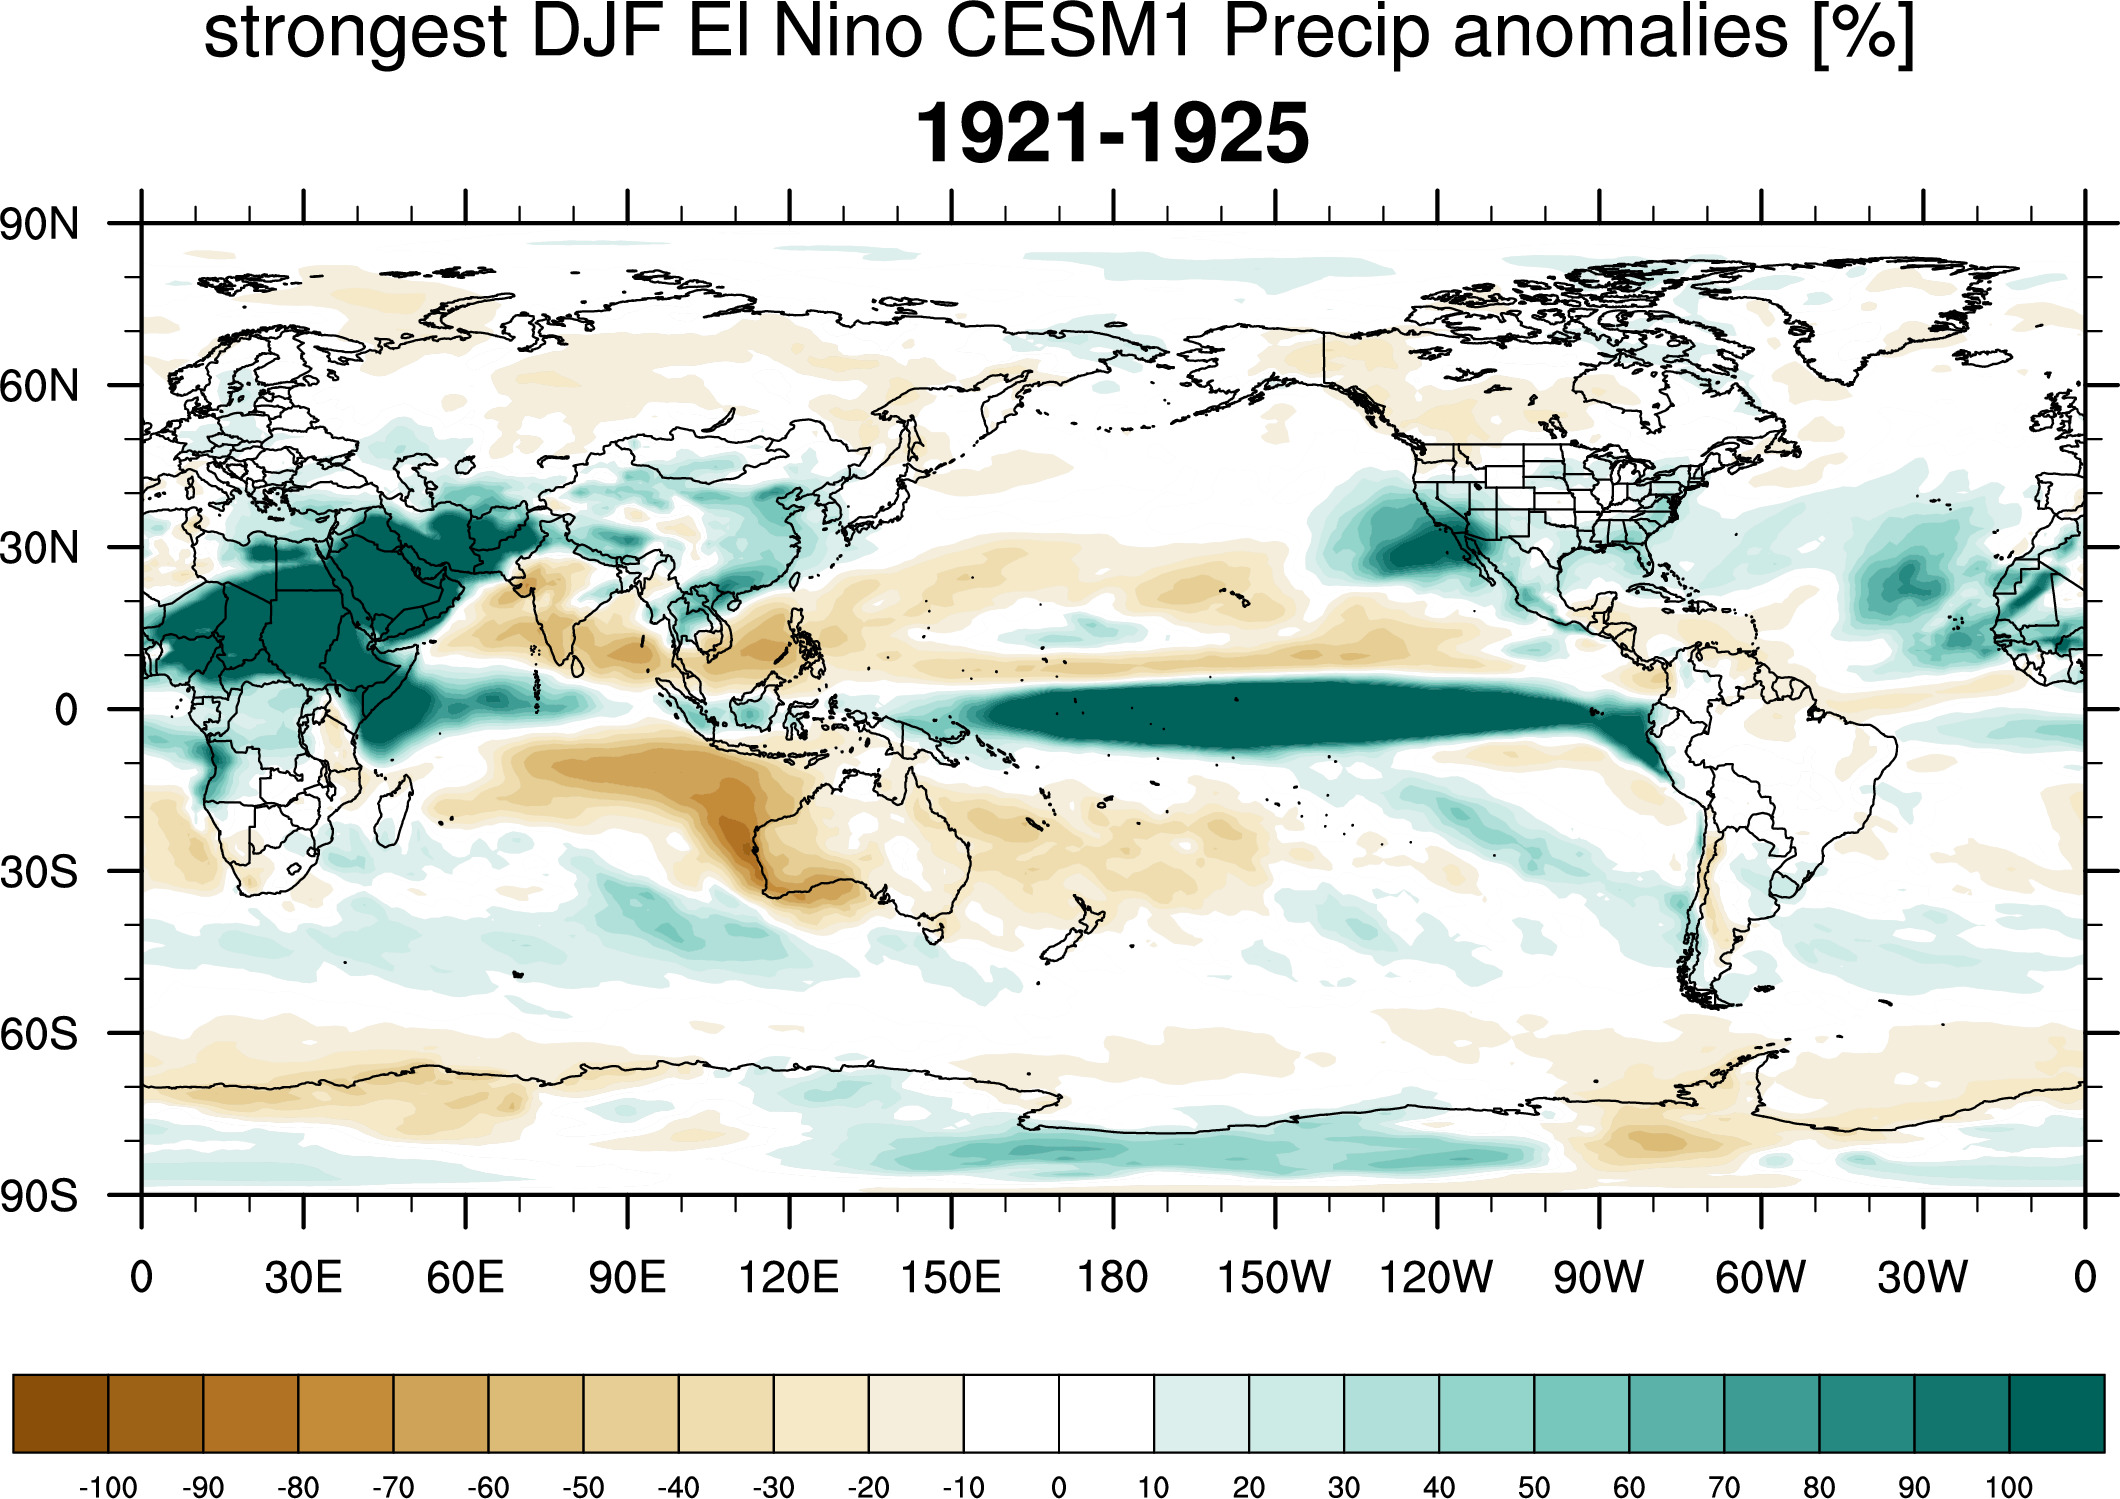
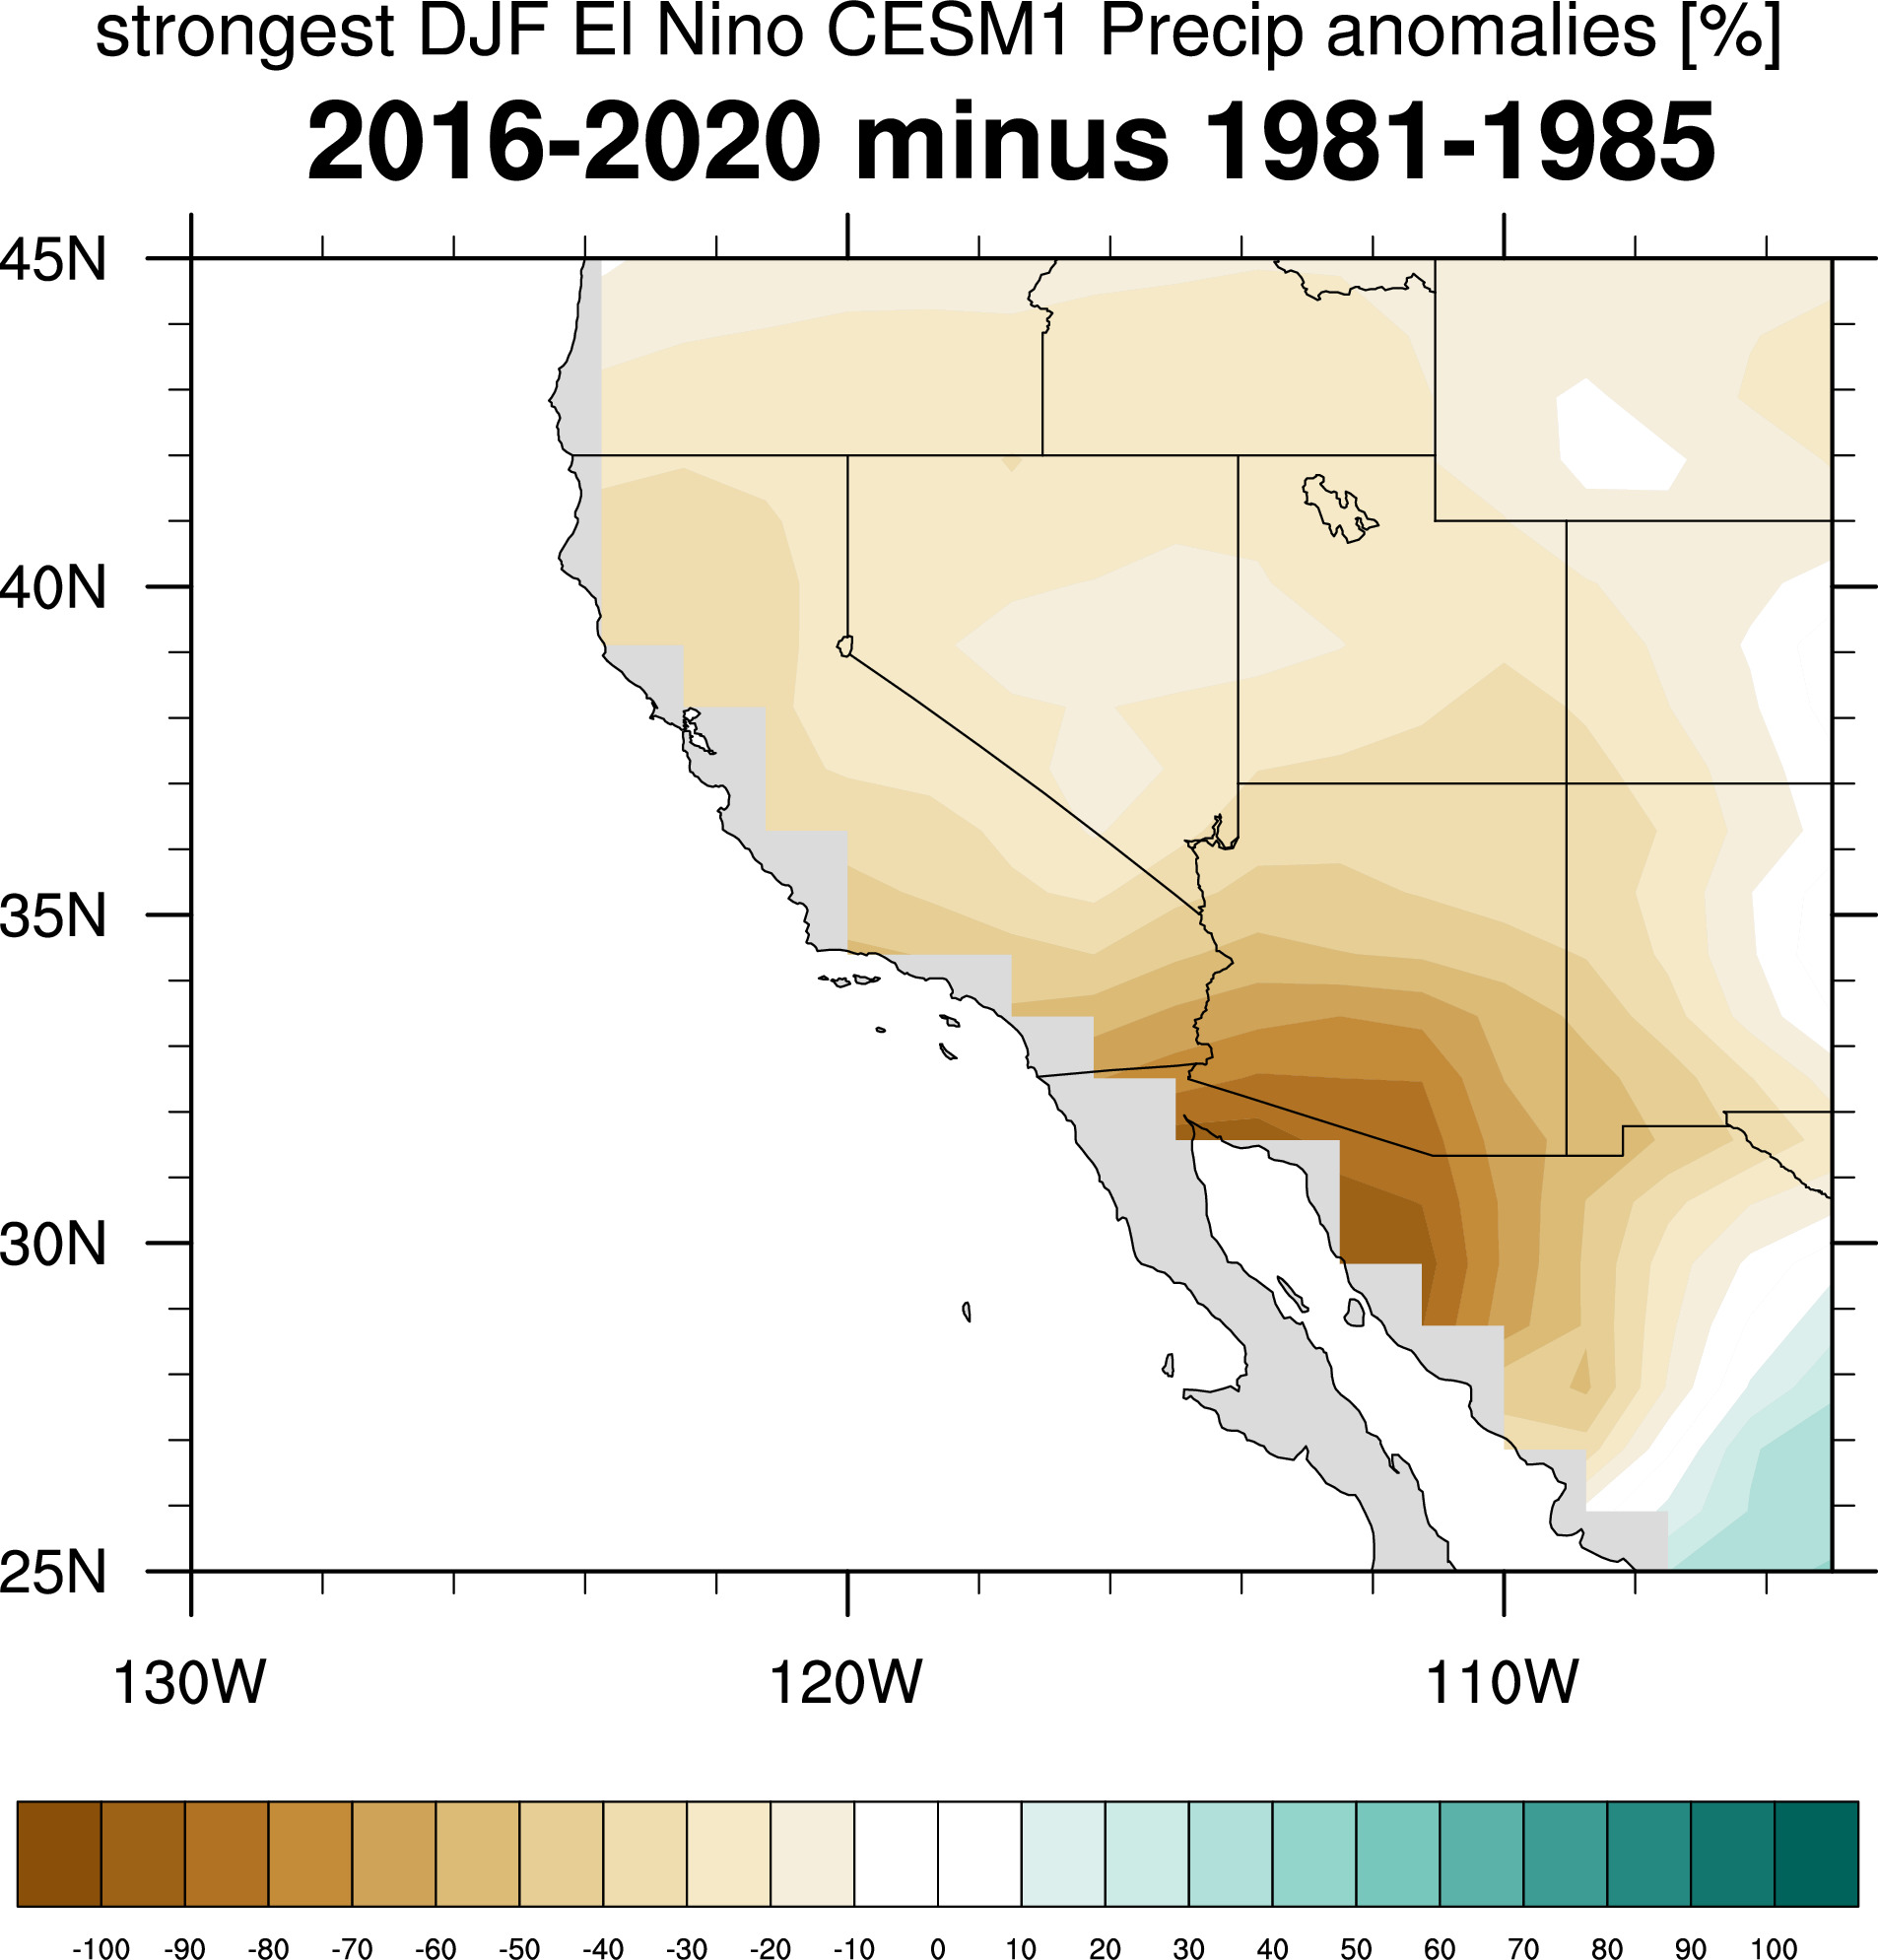
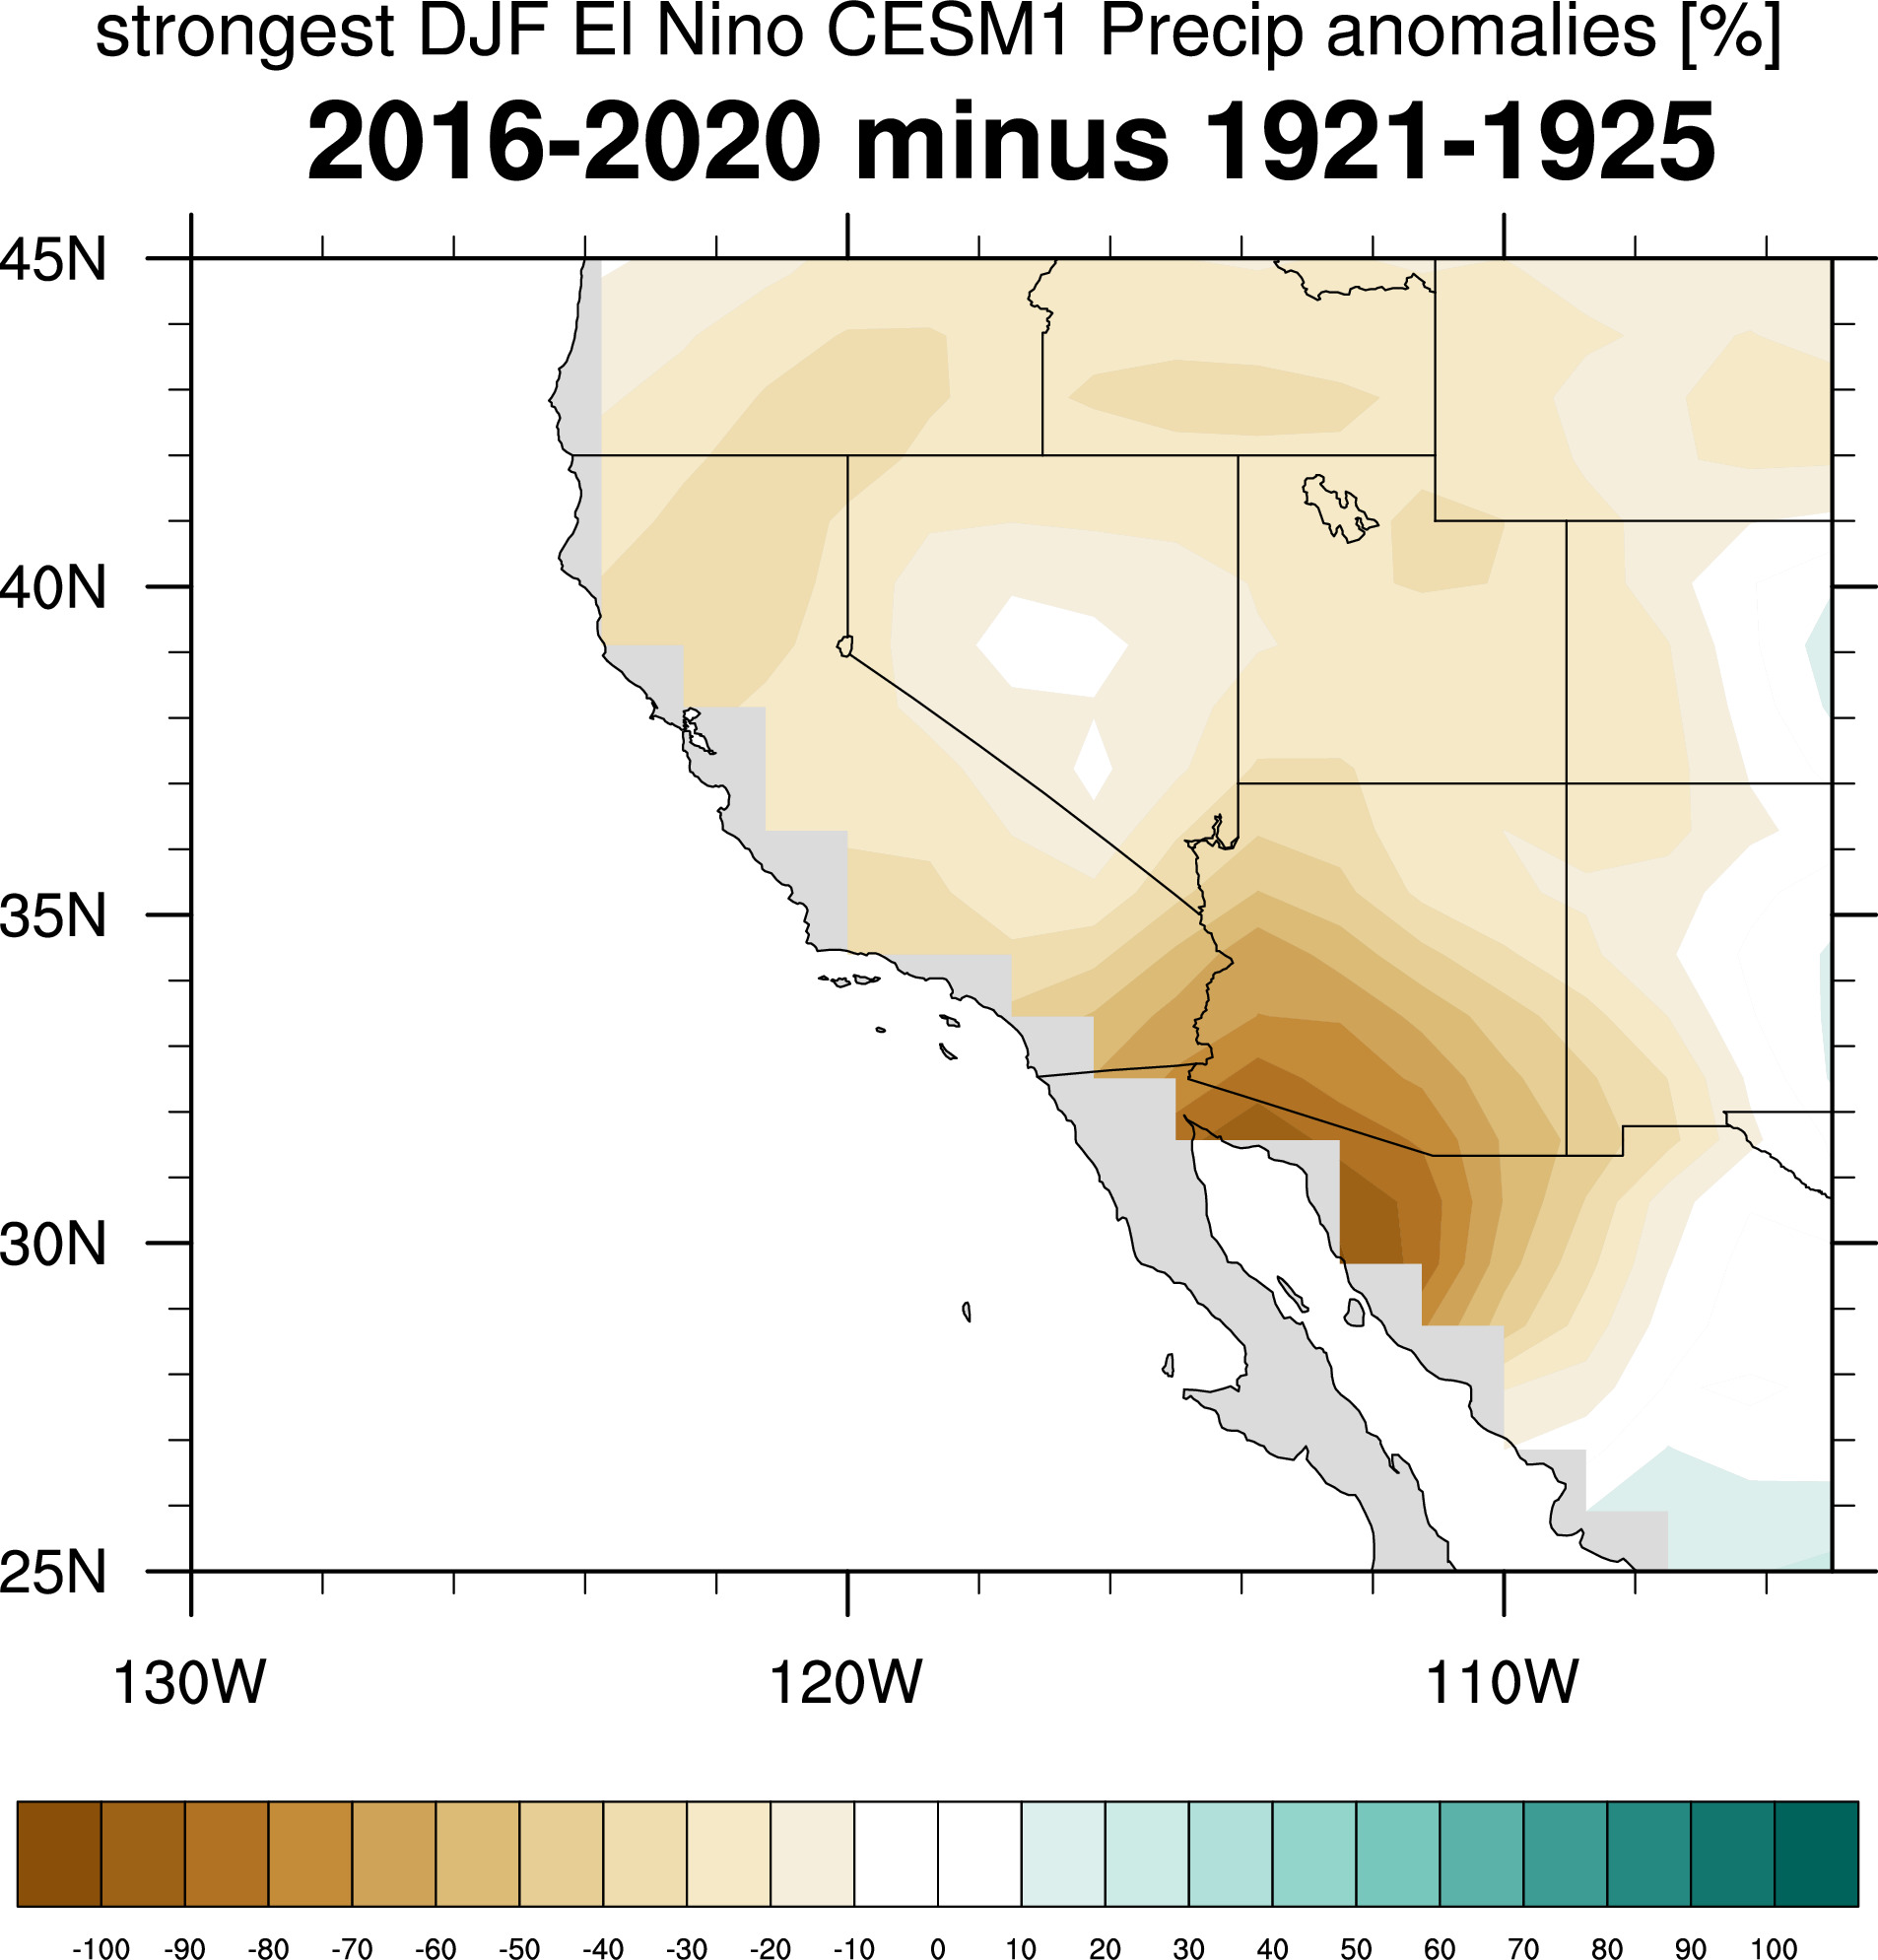
New strongest 10 (~95% +) DJF El Ninos for all periods
SST anomaly maps

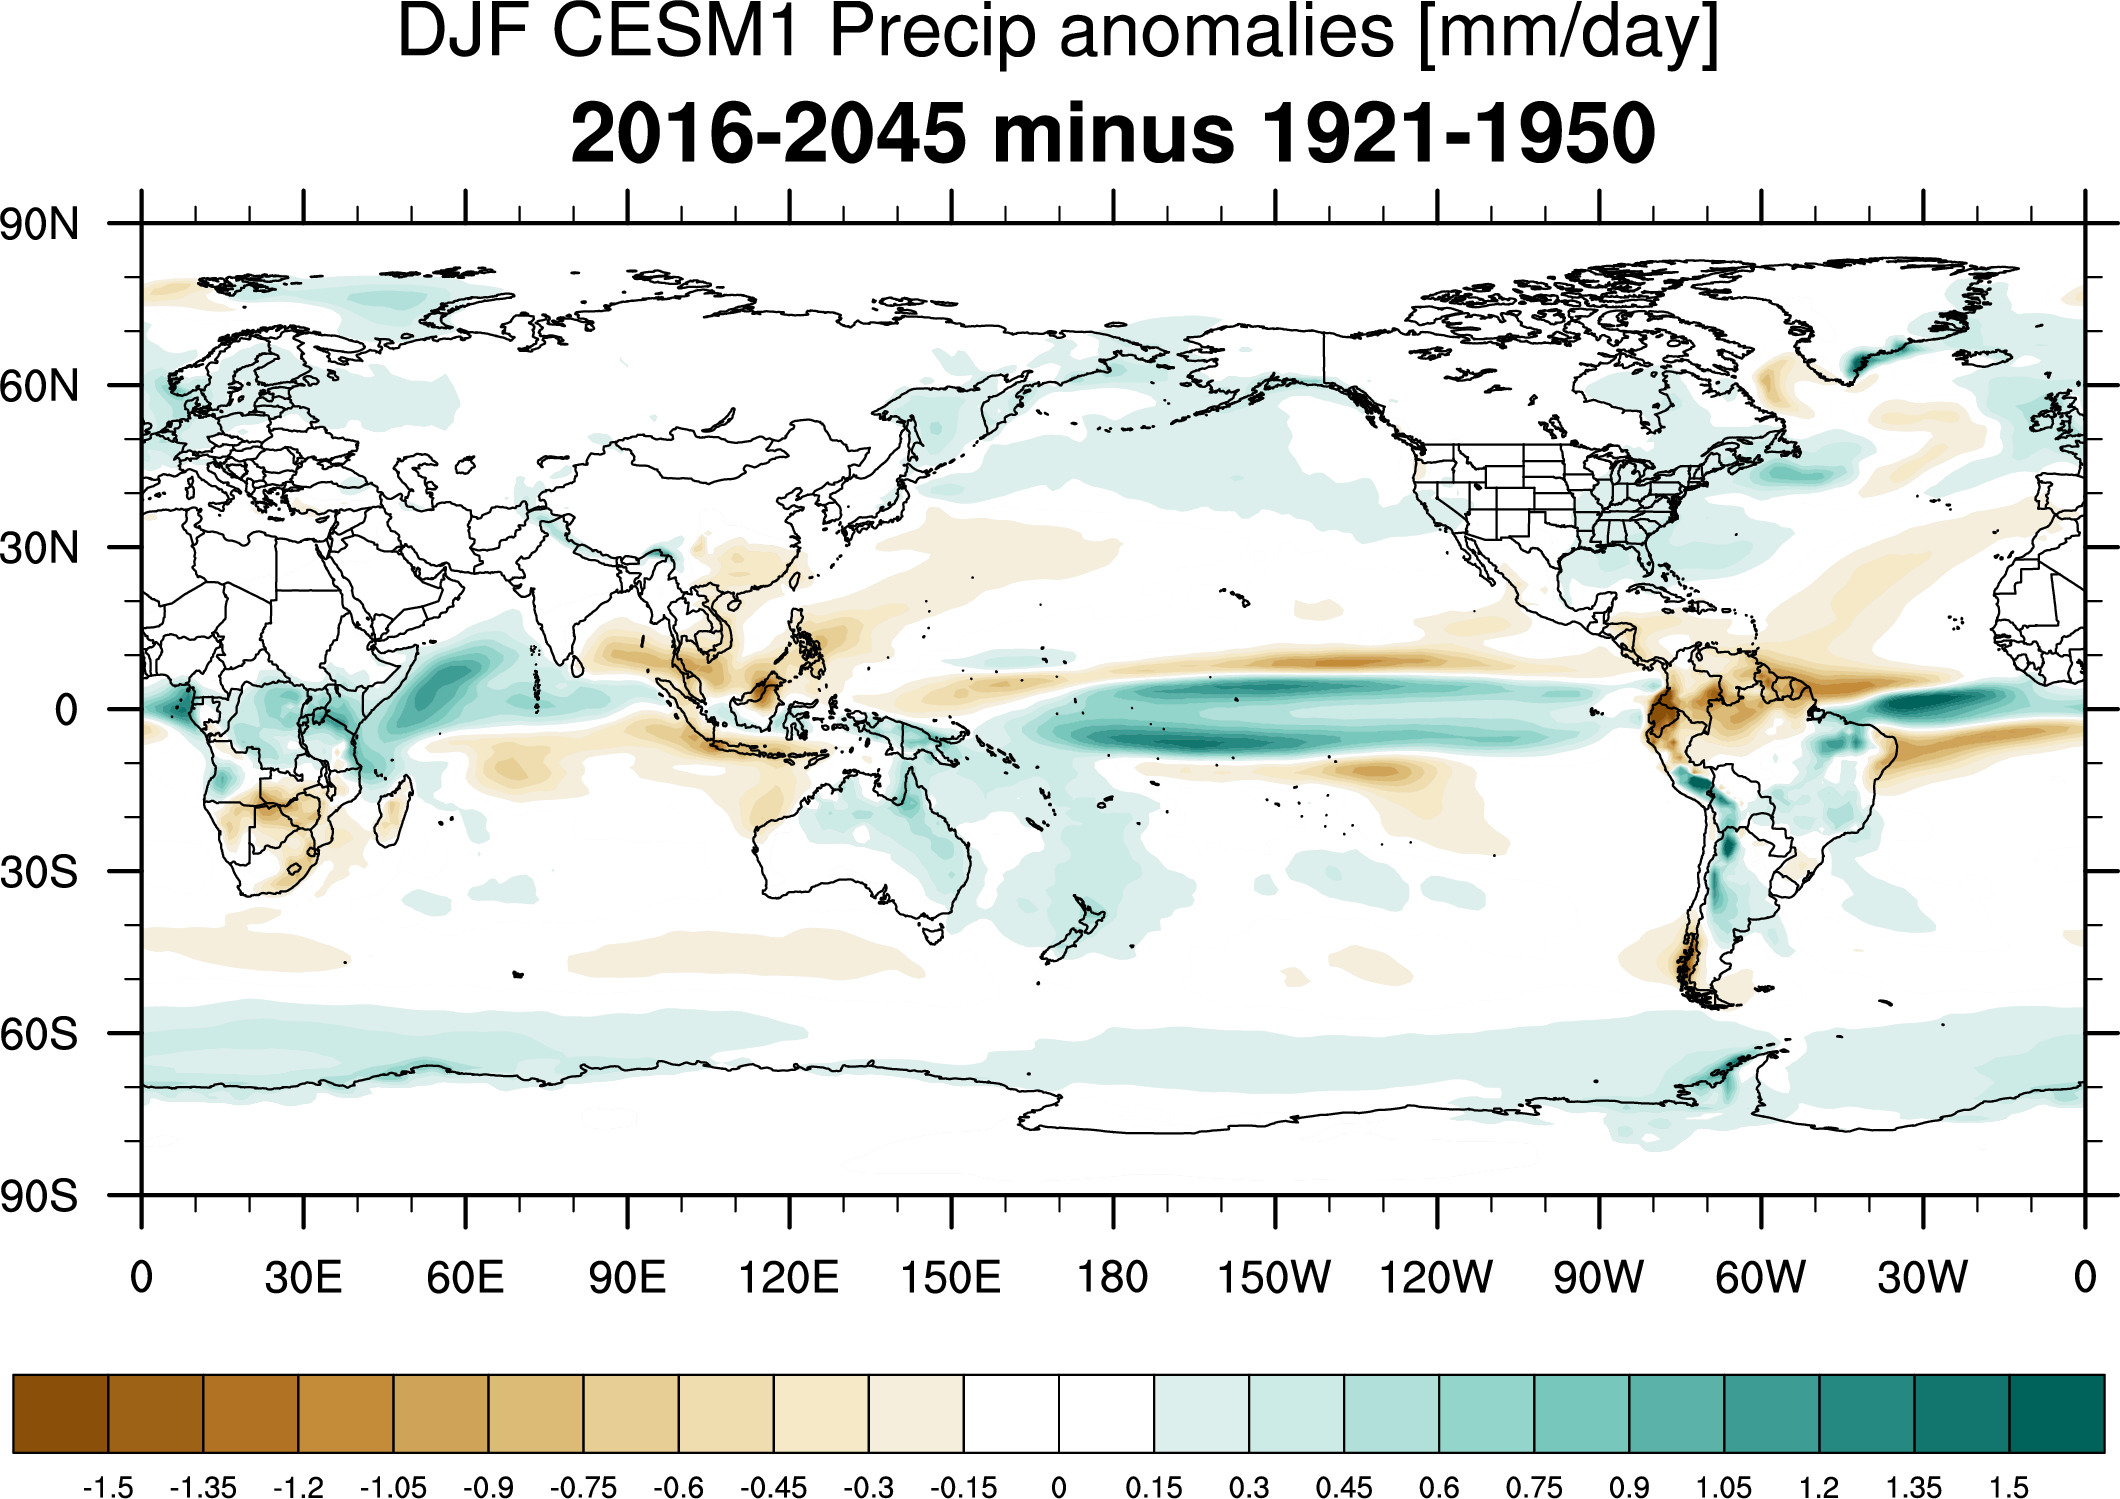
Differences

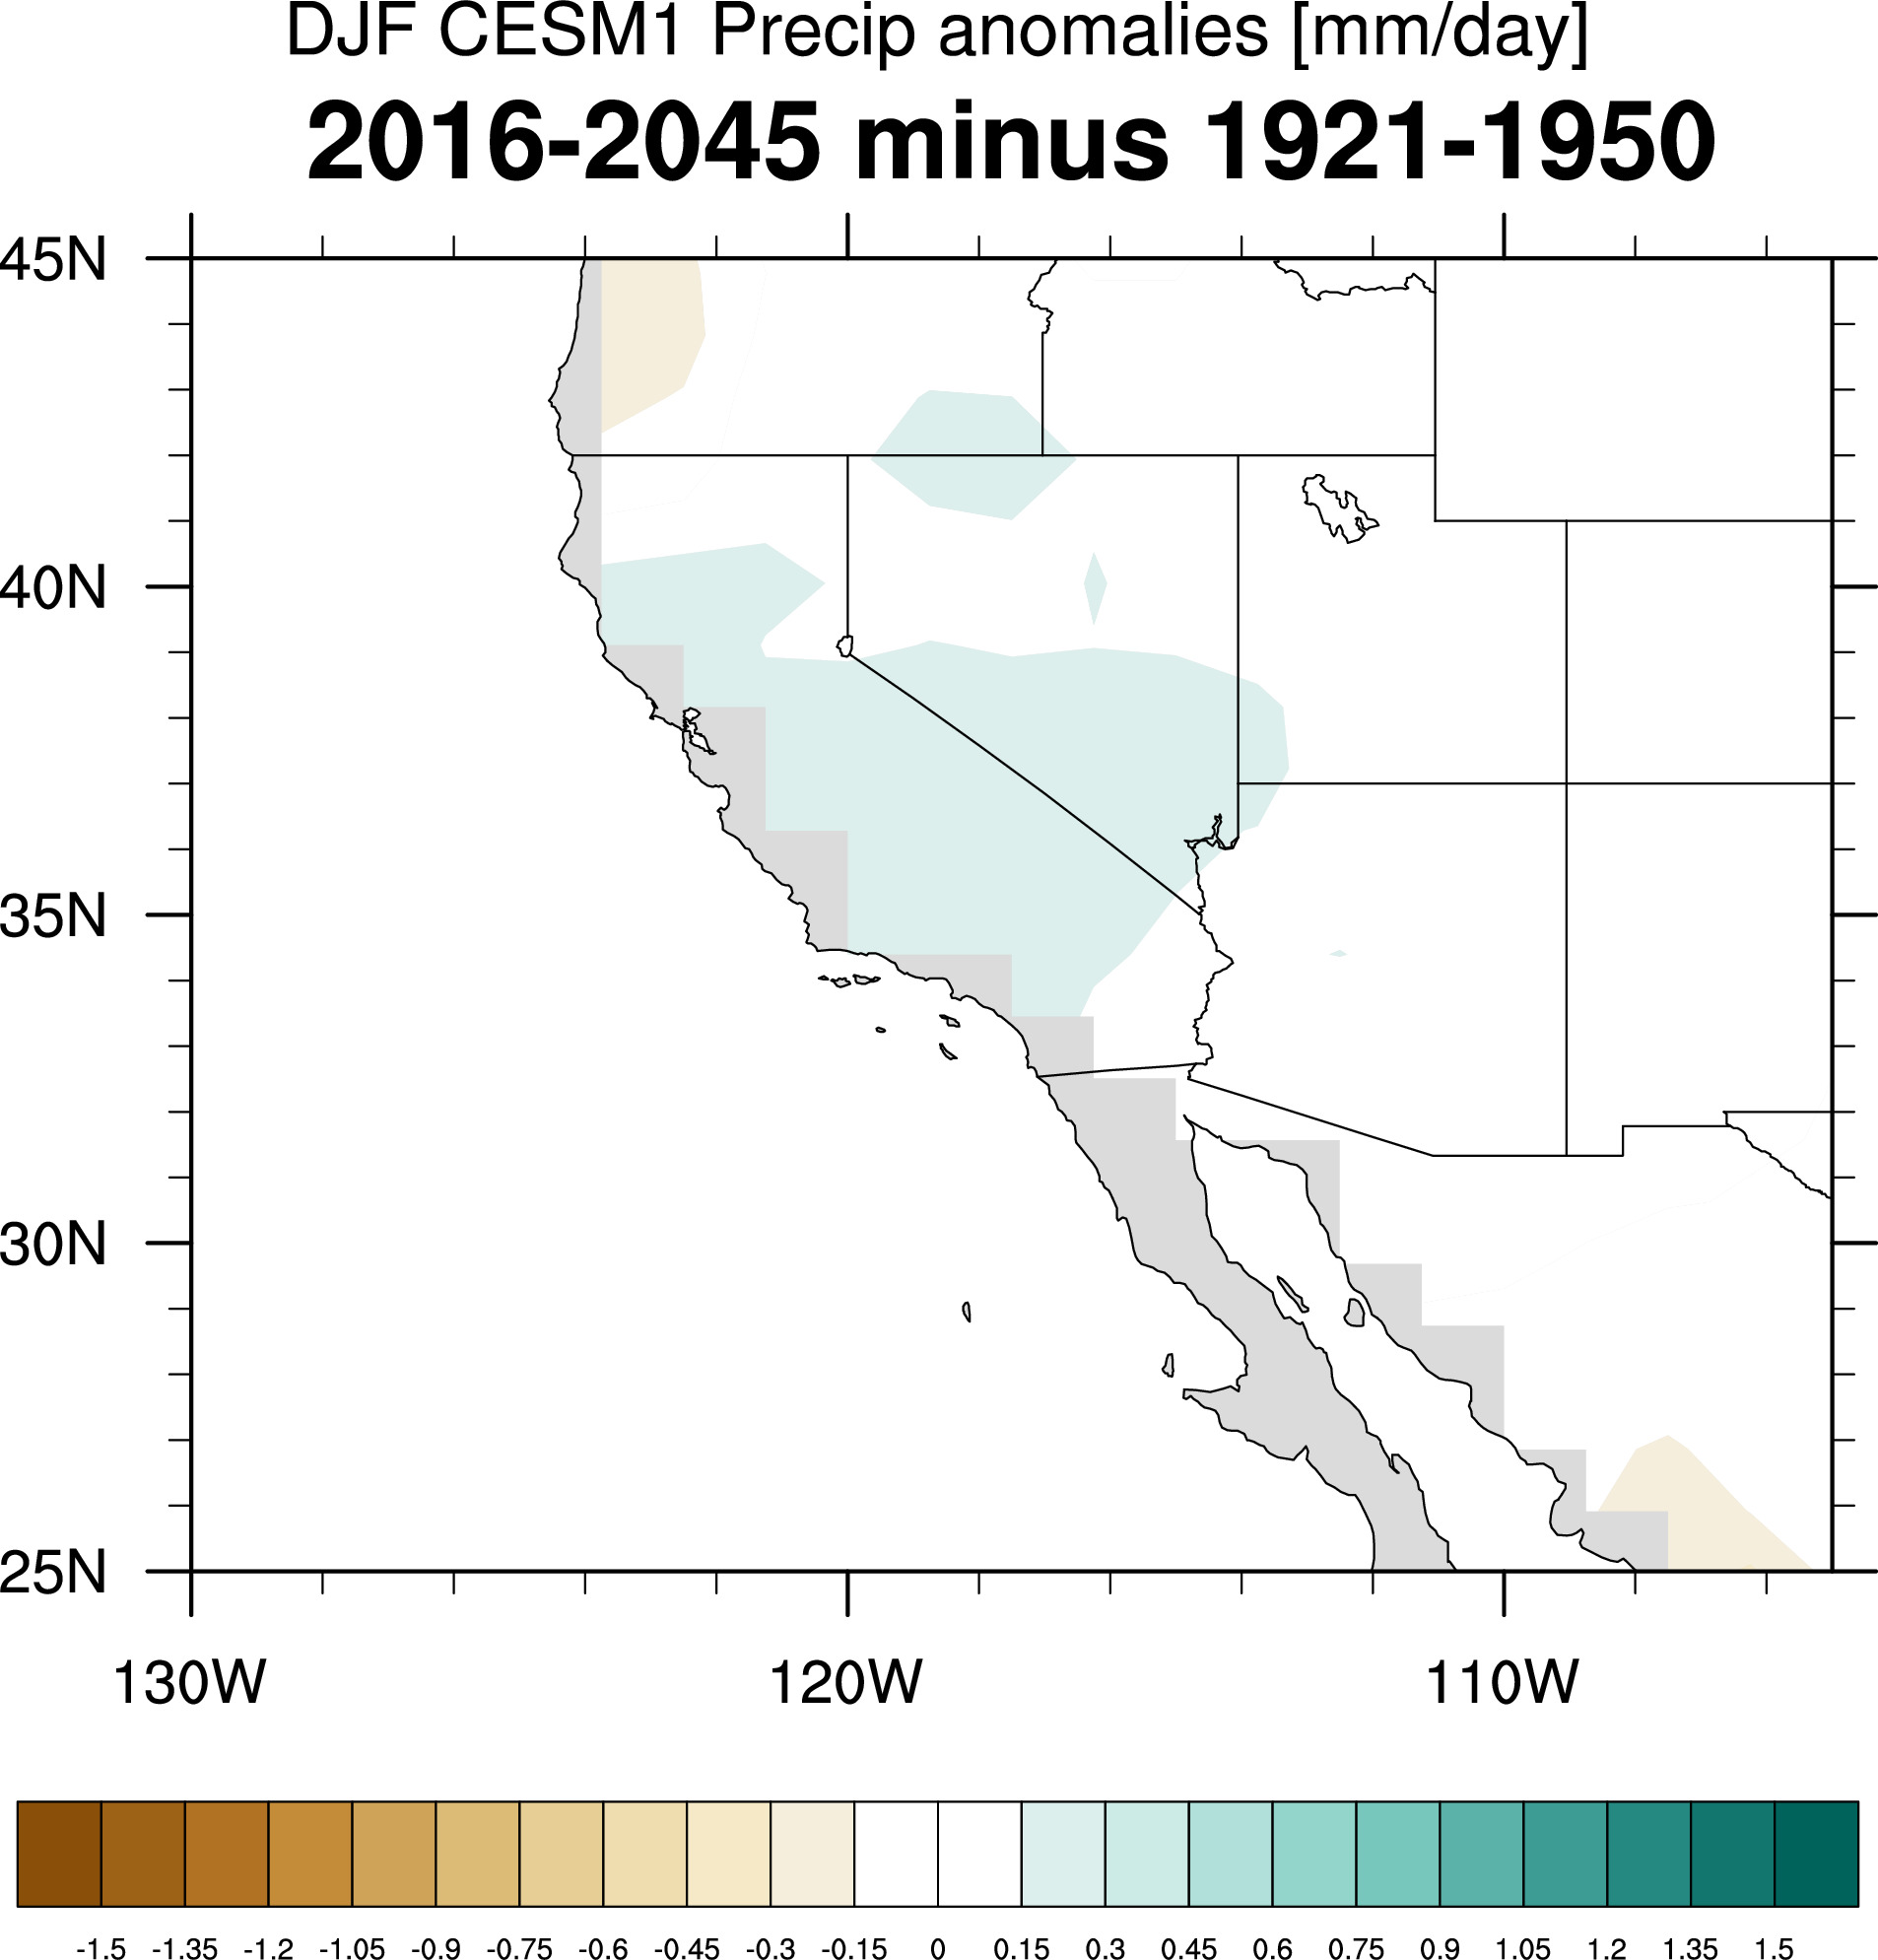
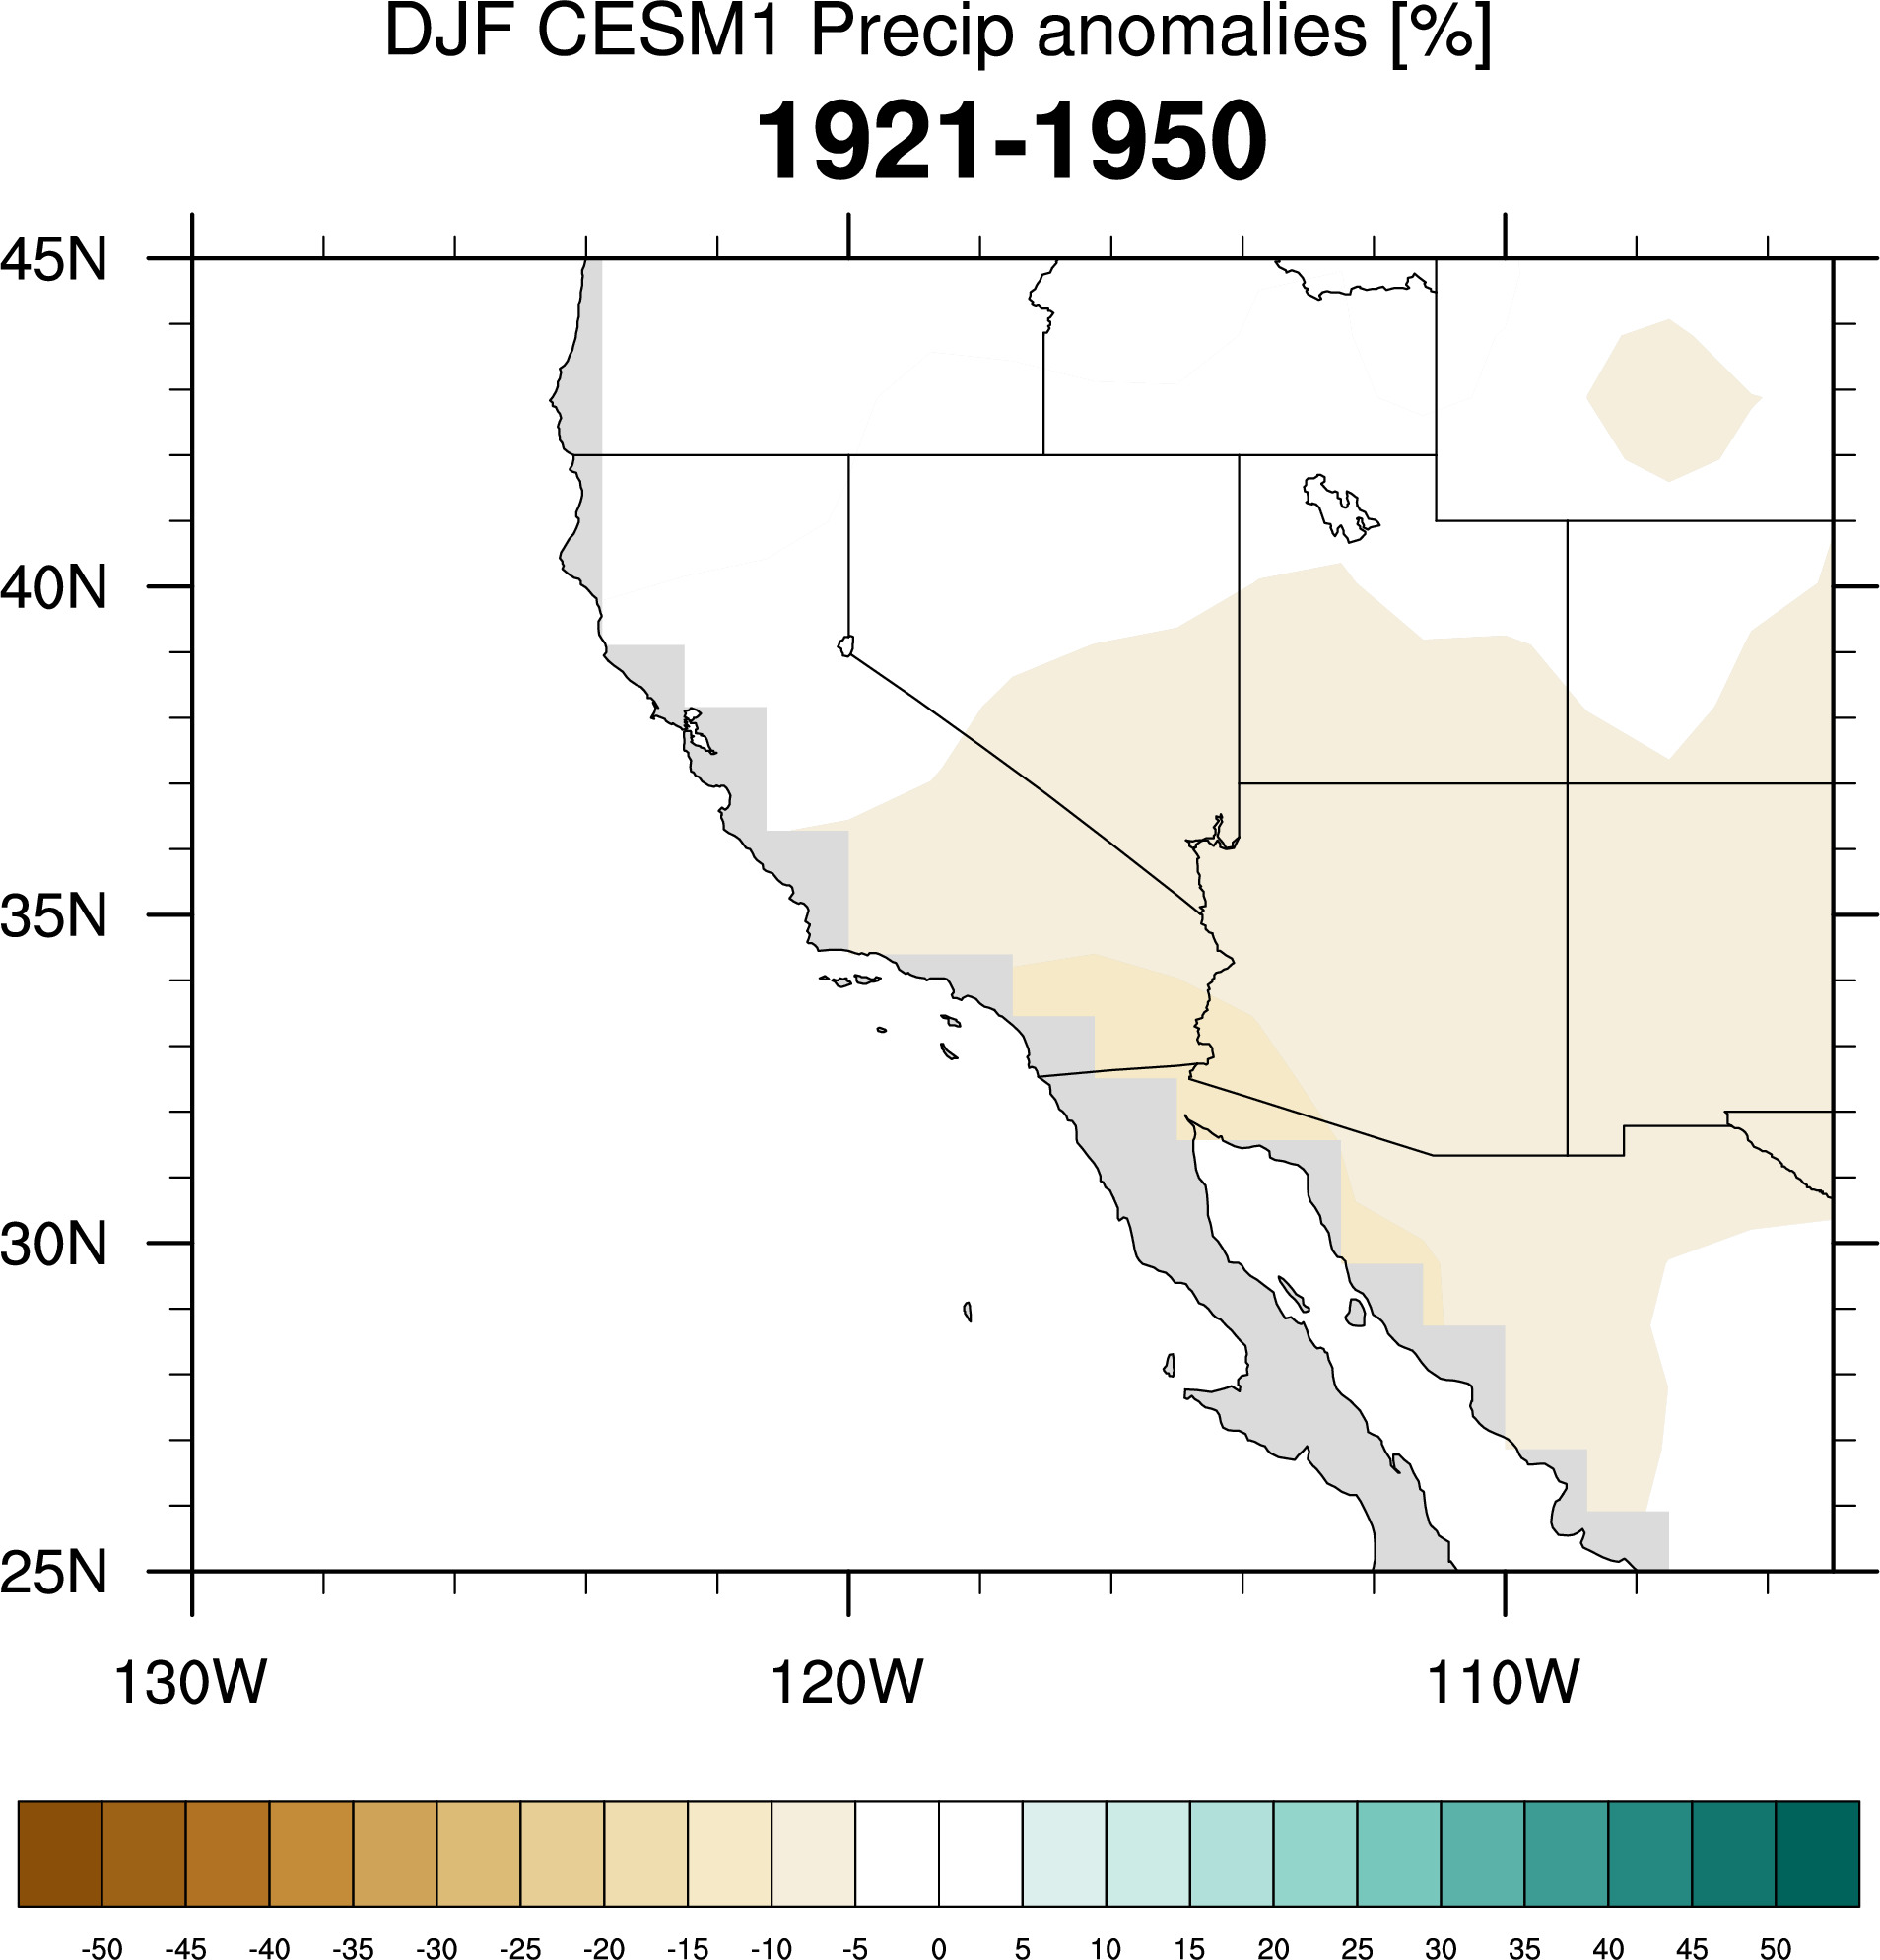
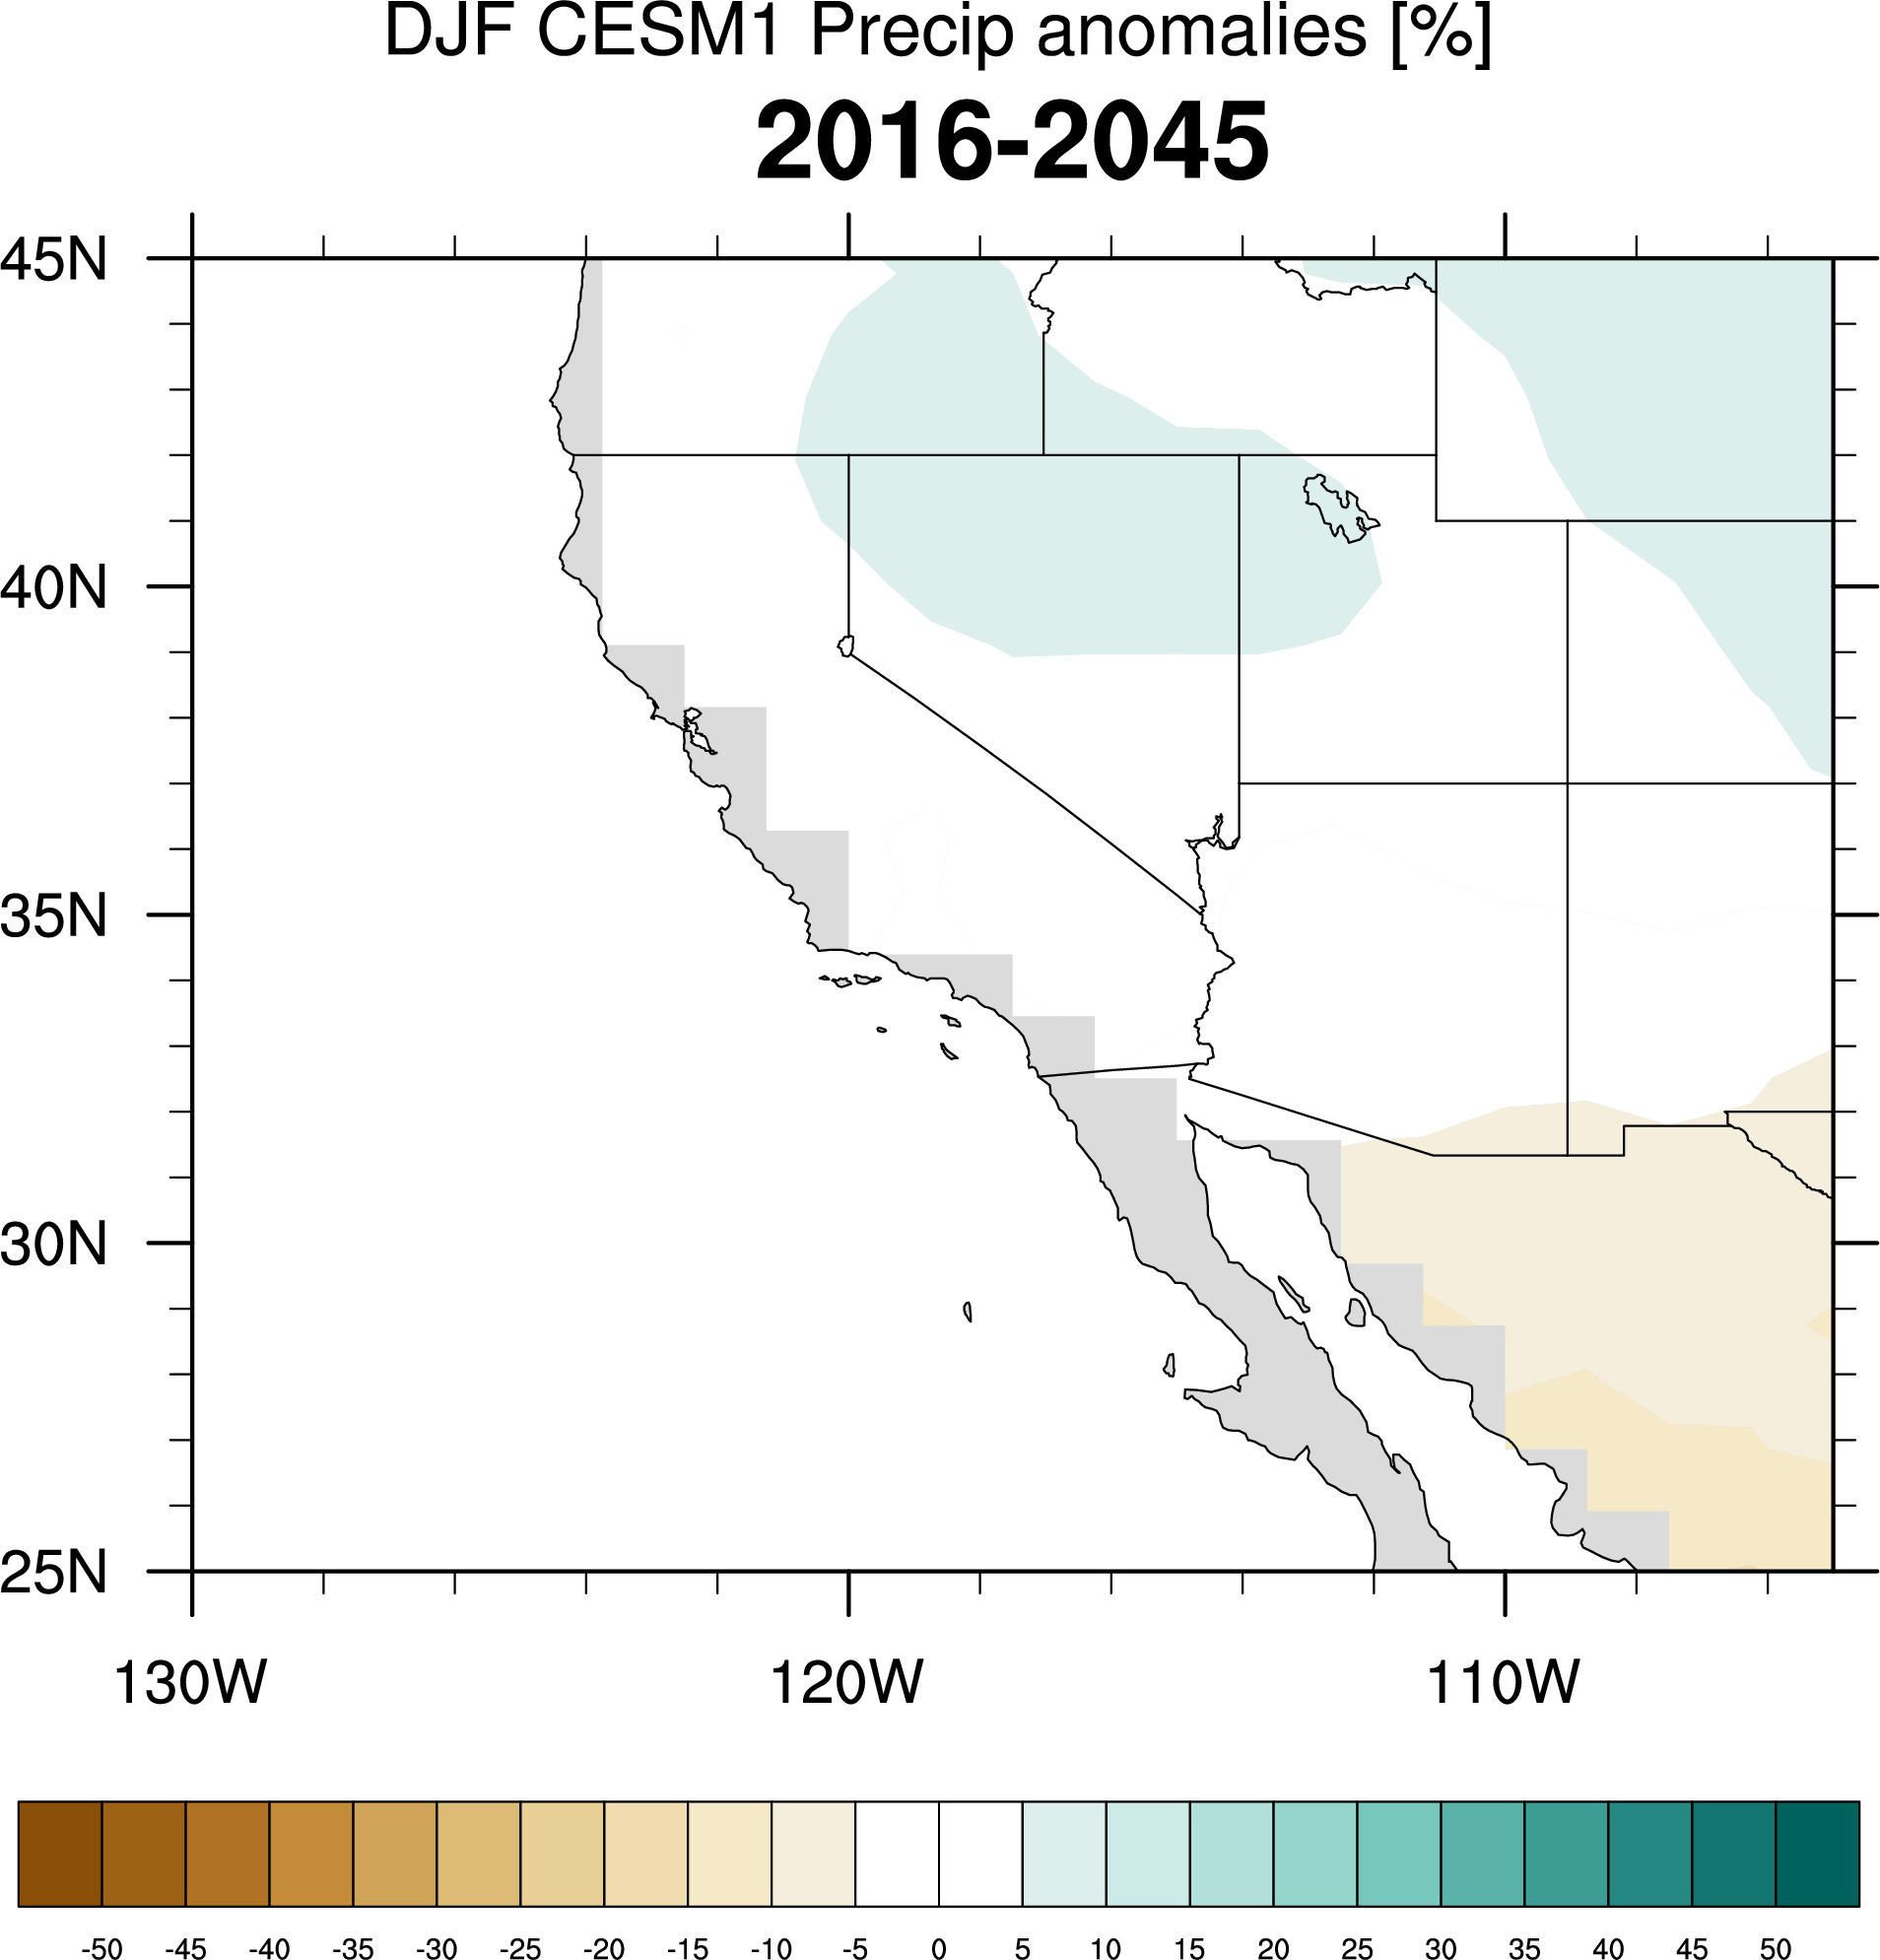
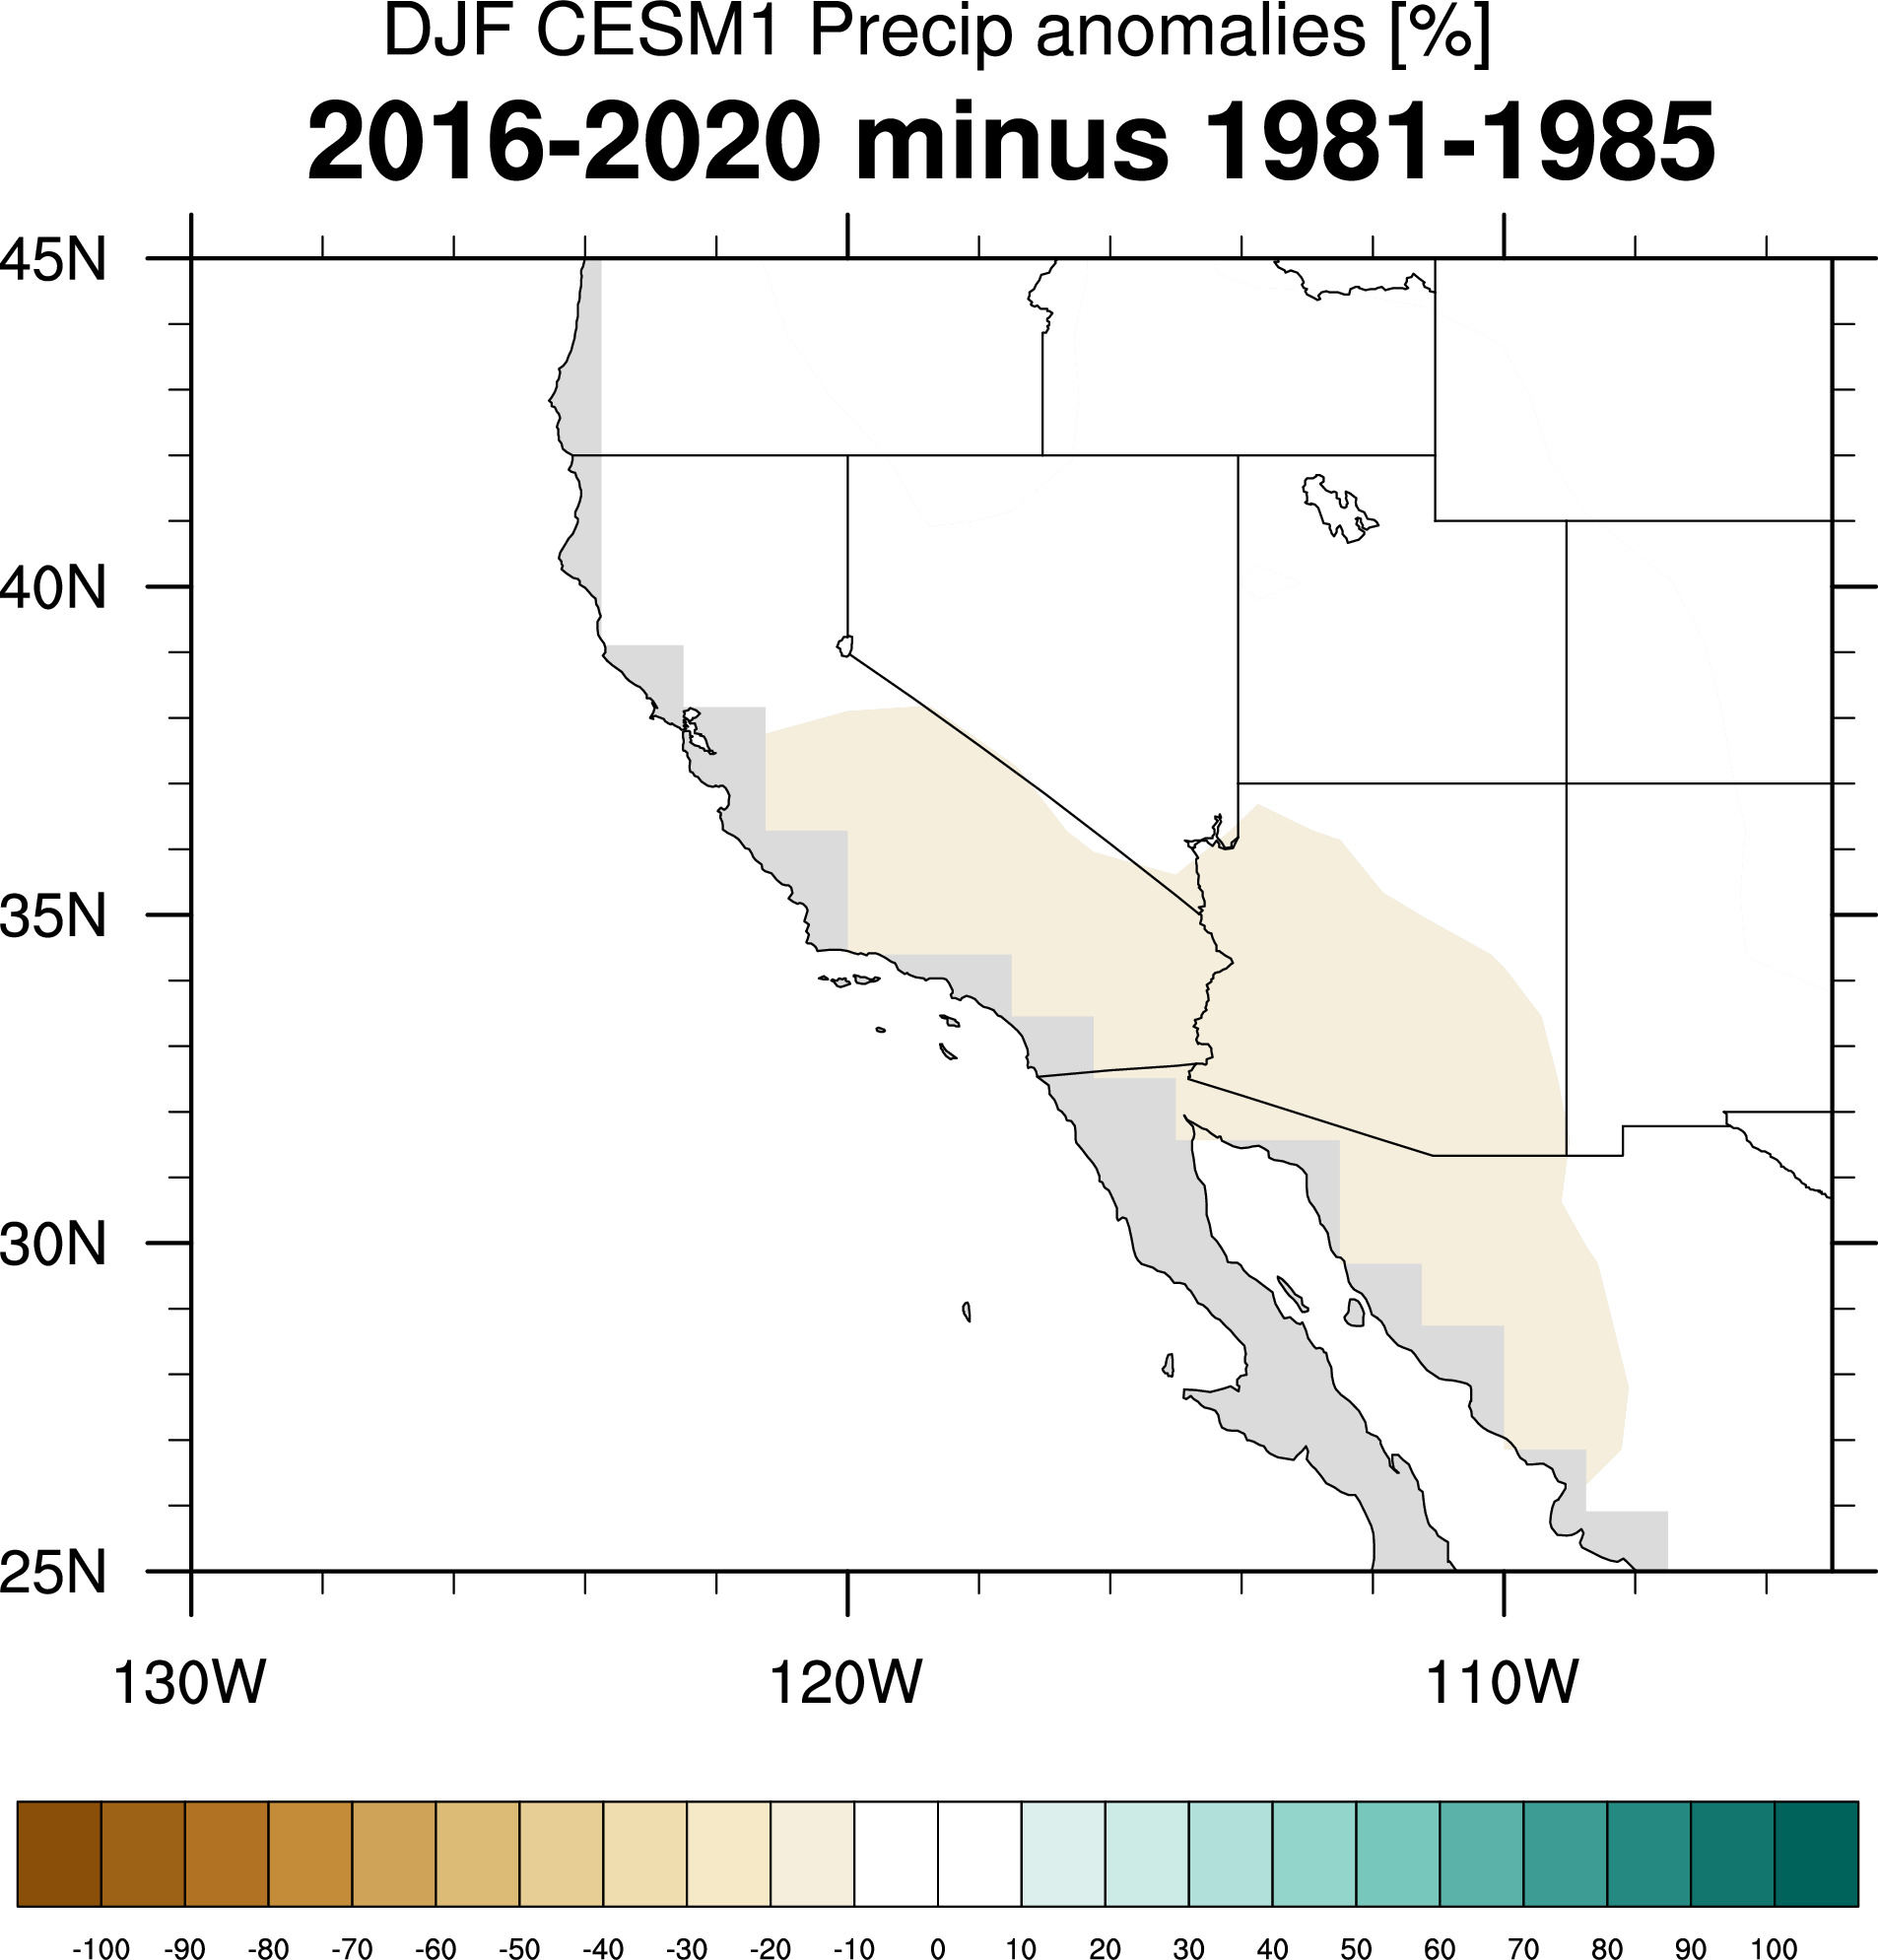
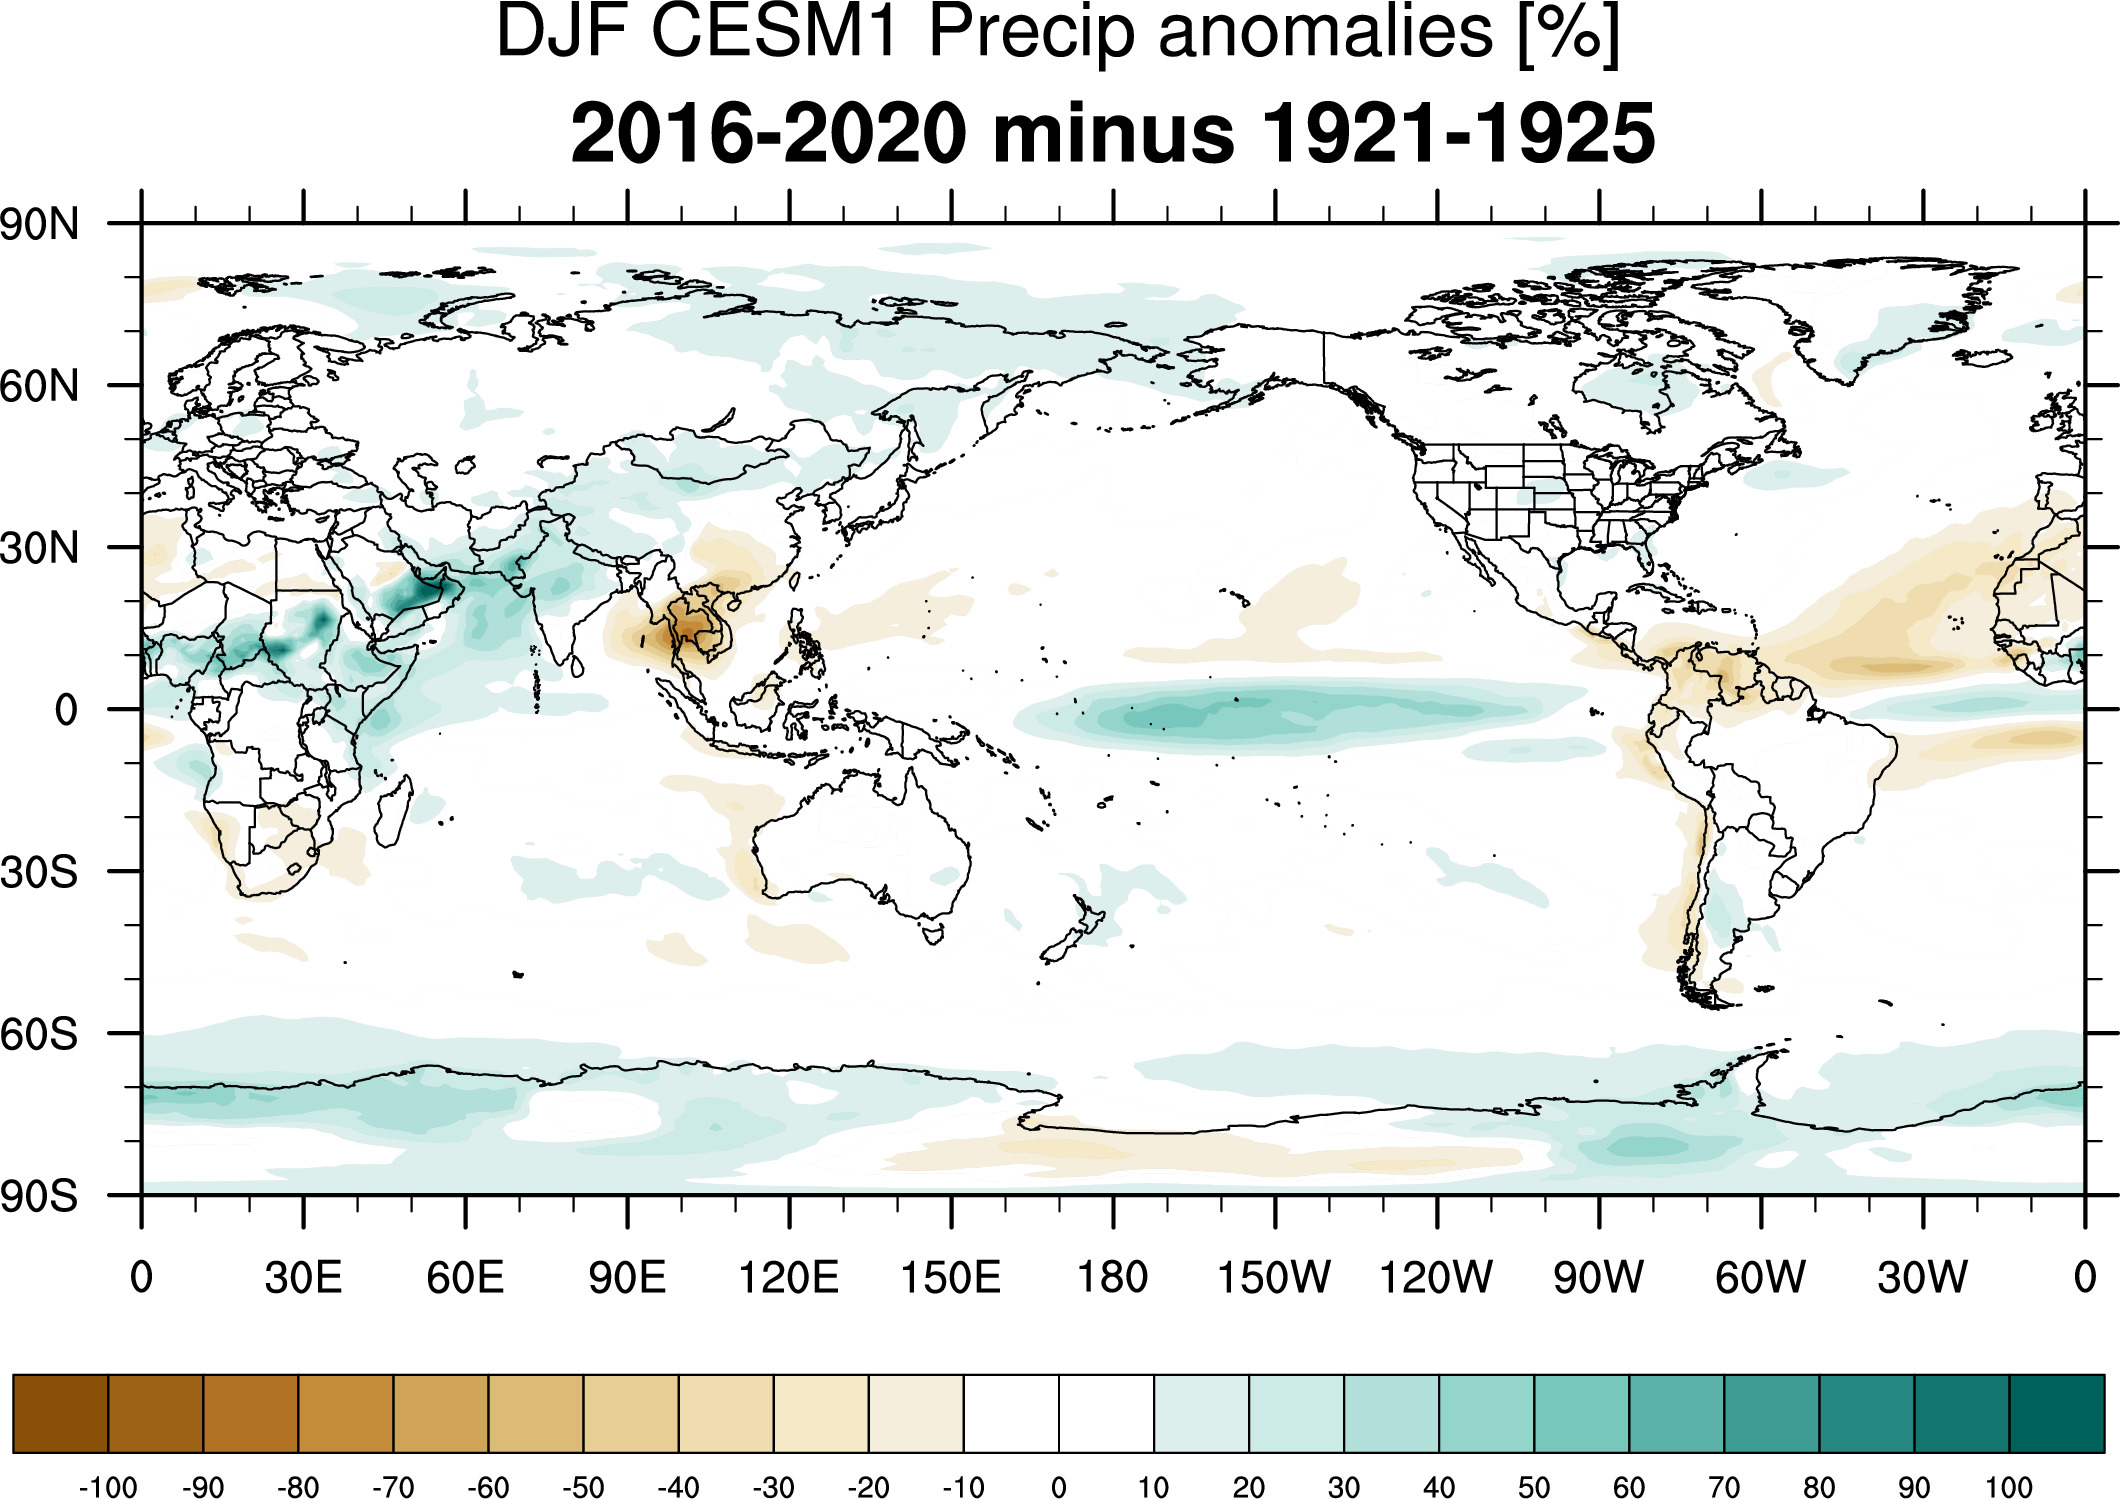
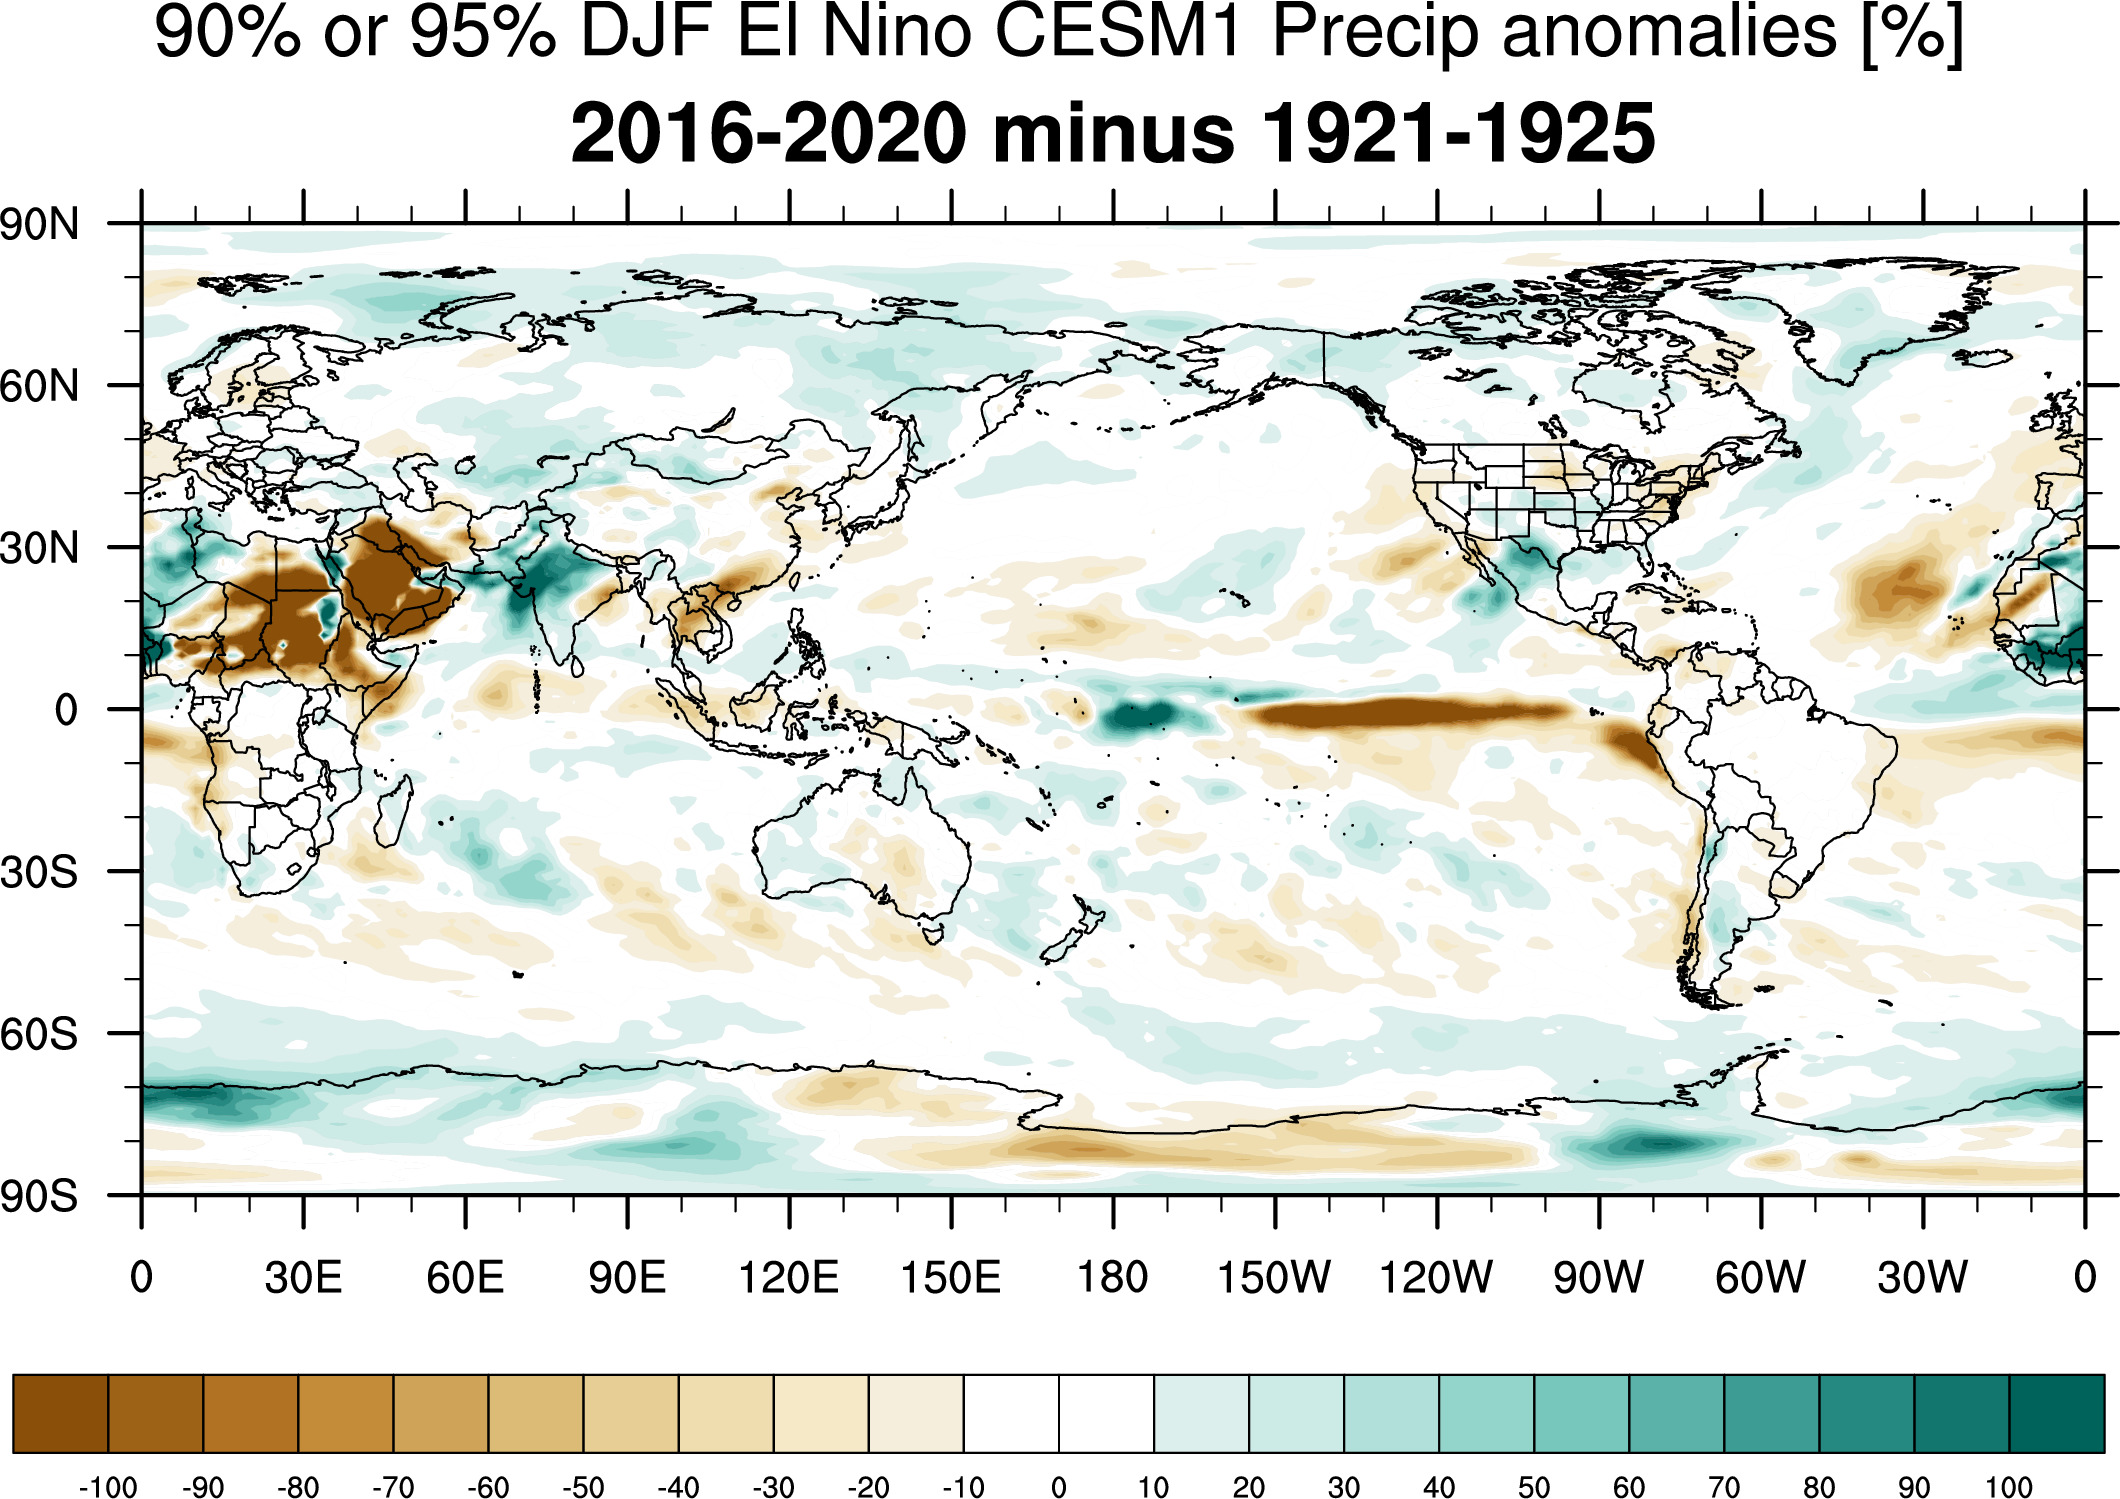
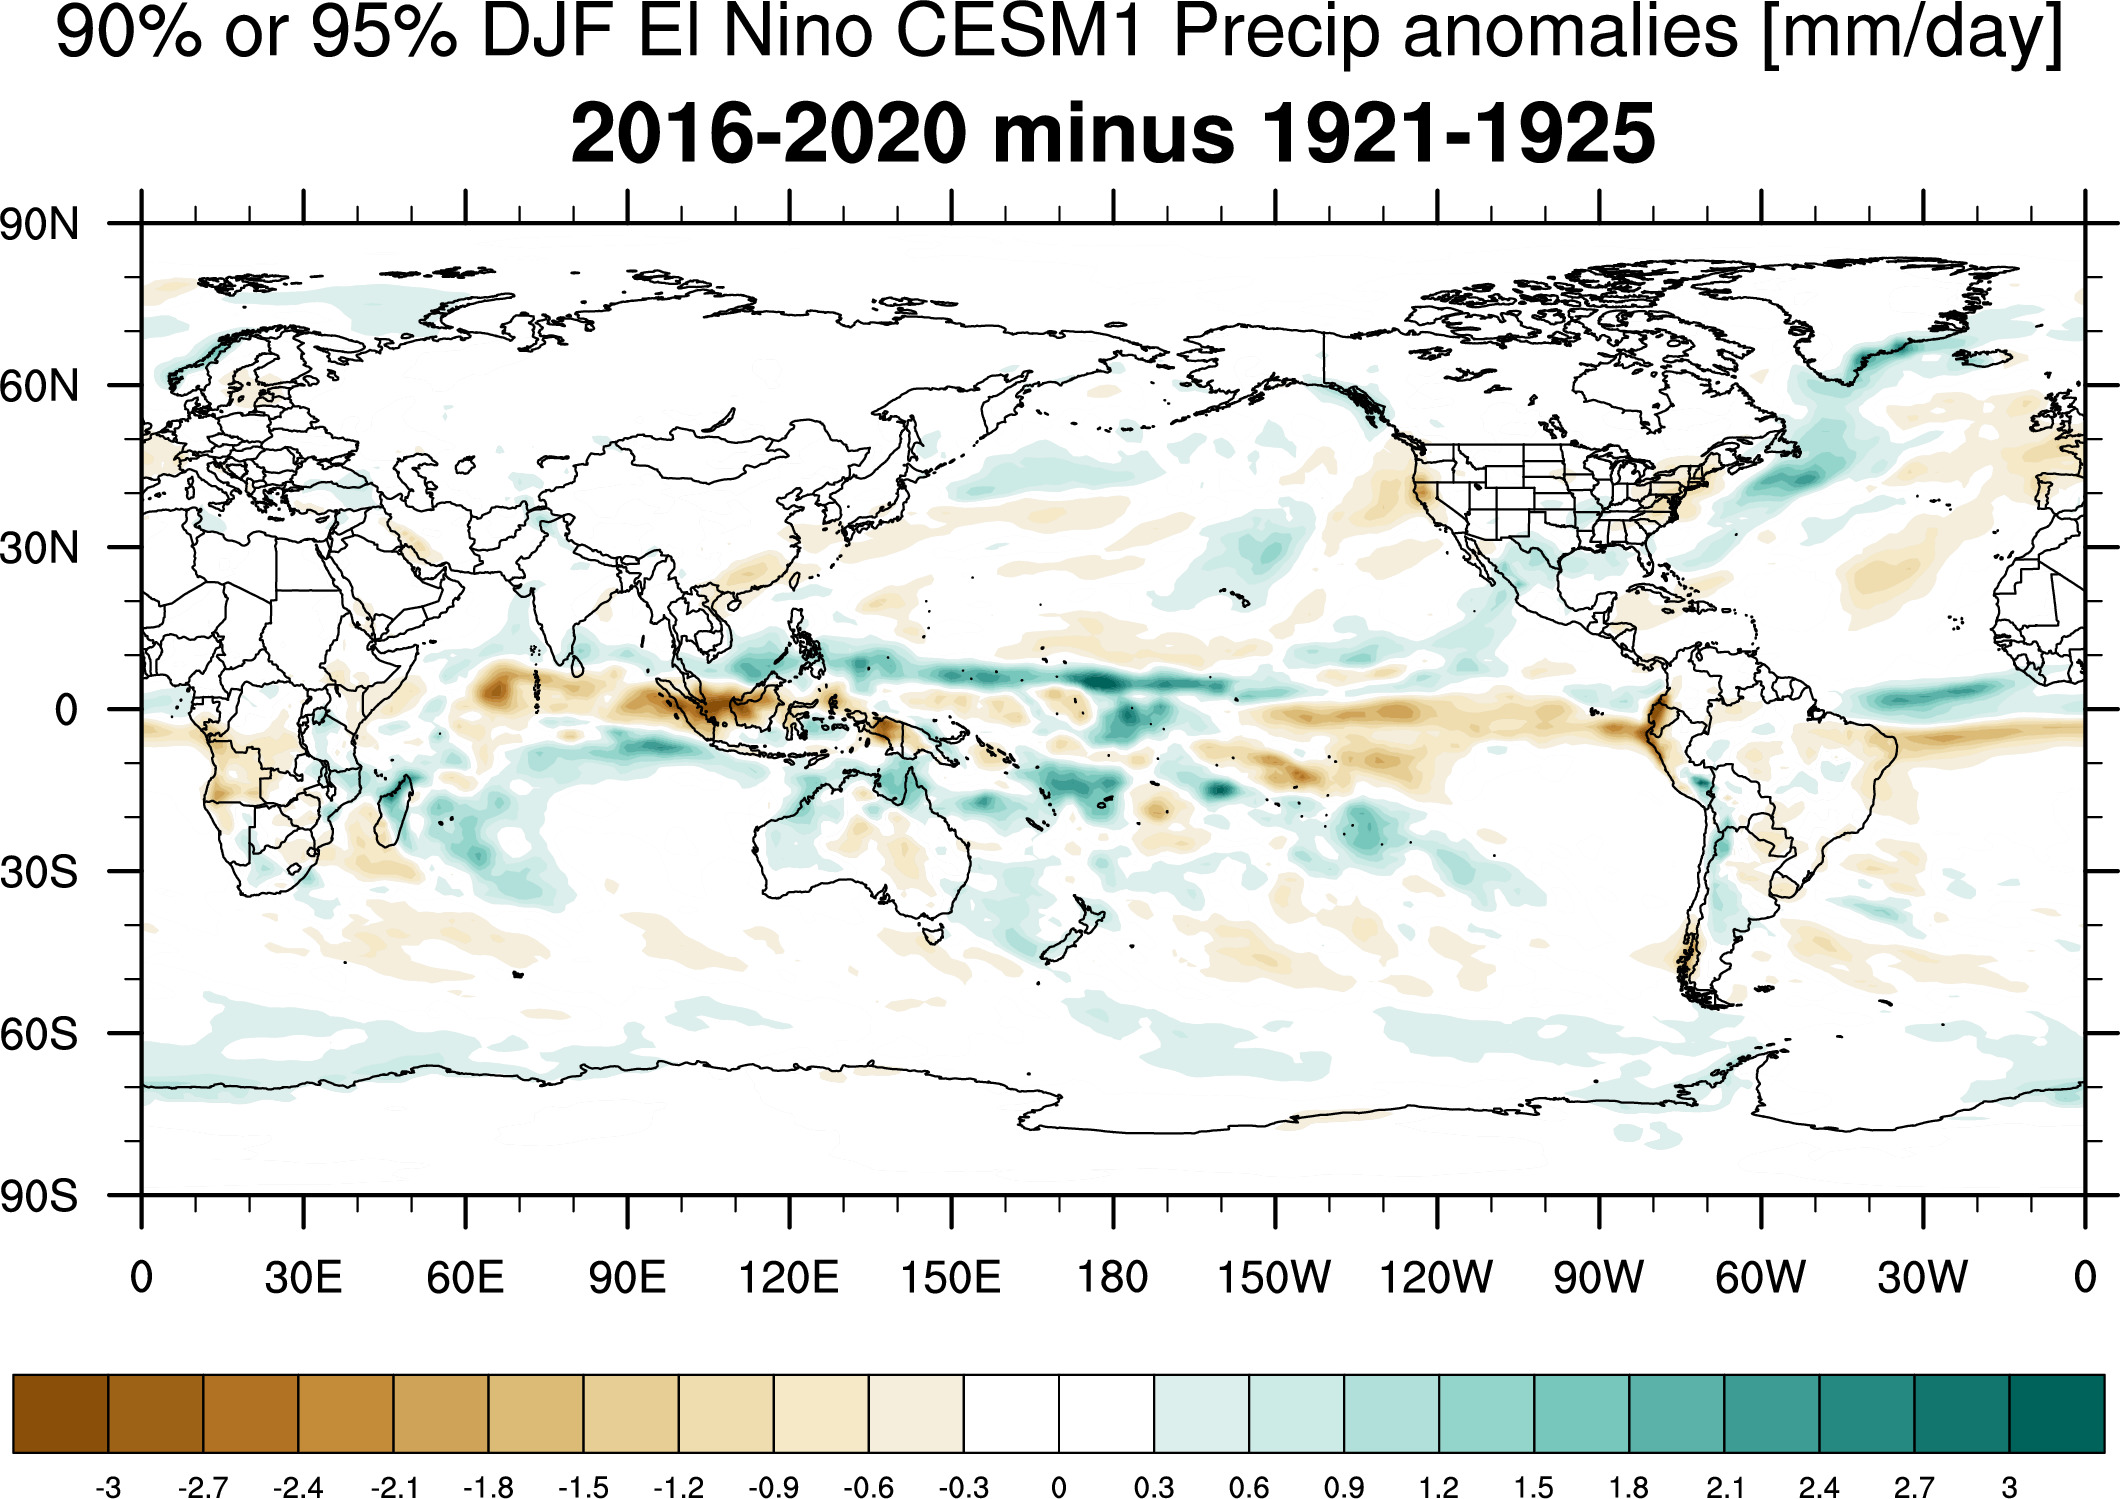
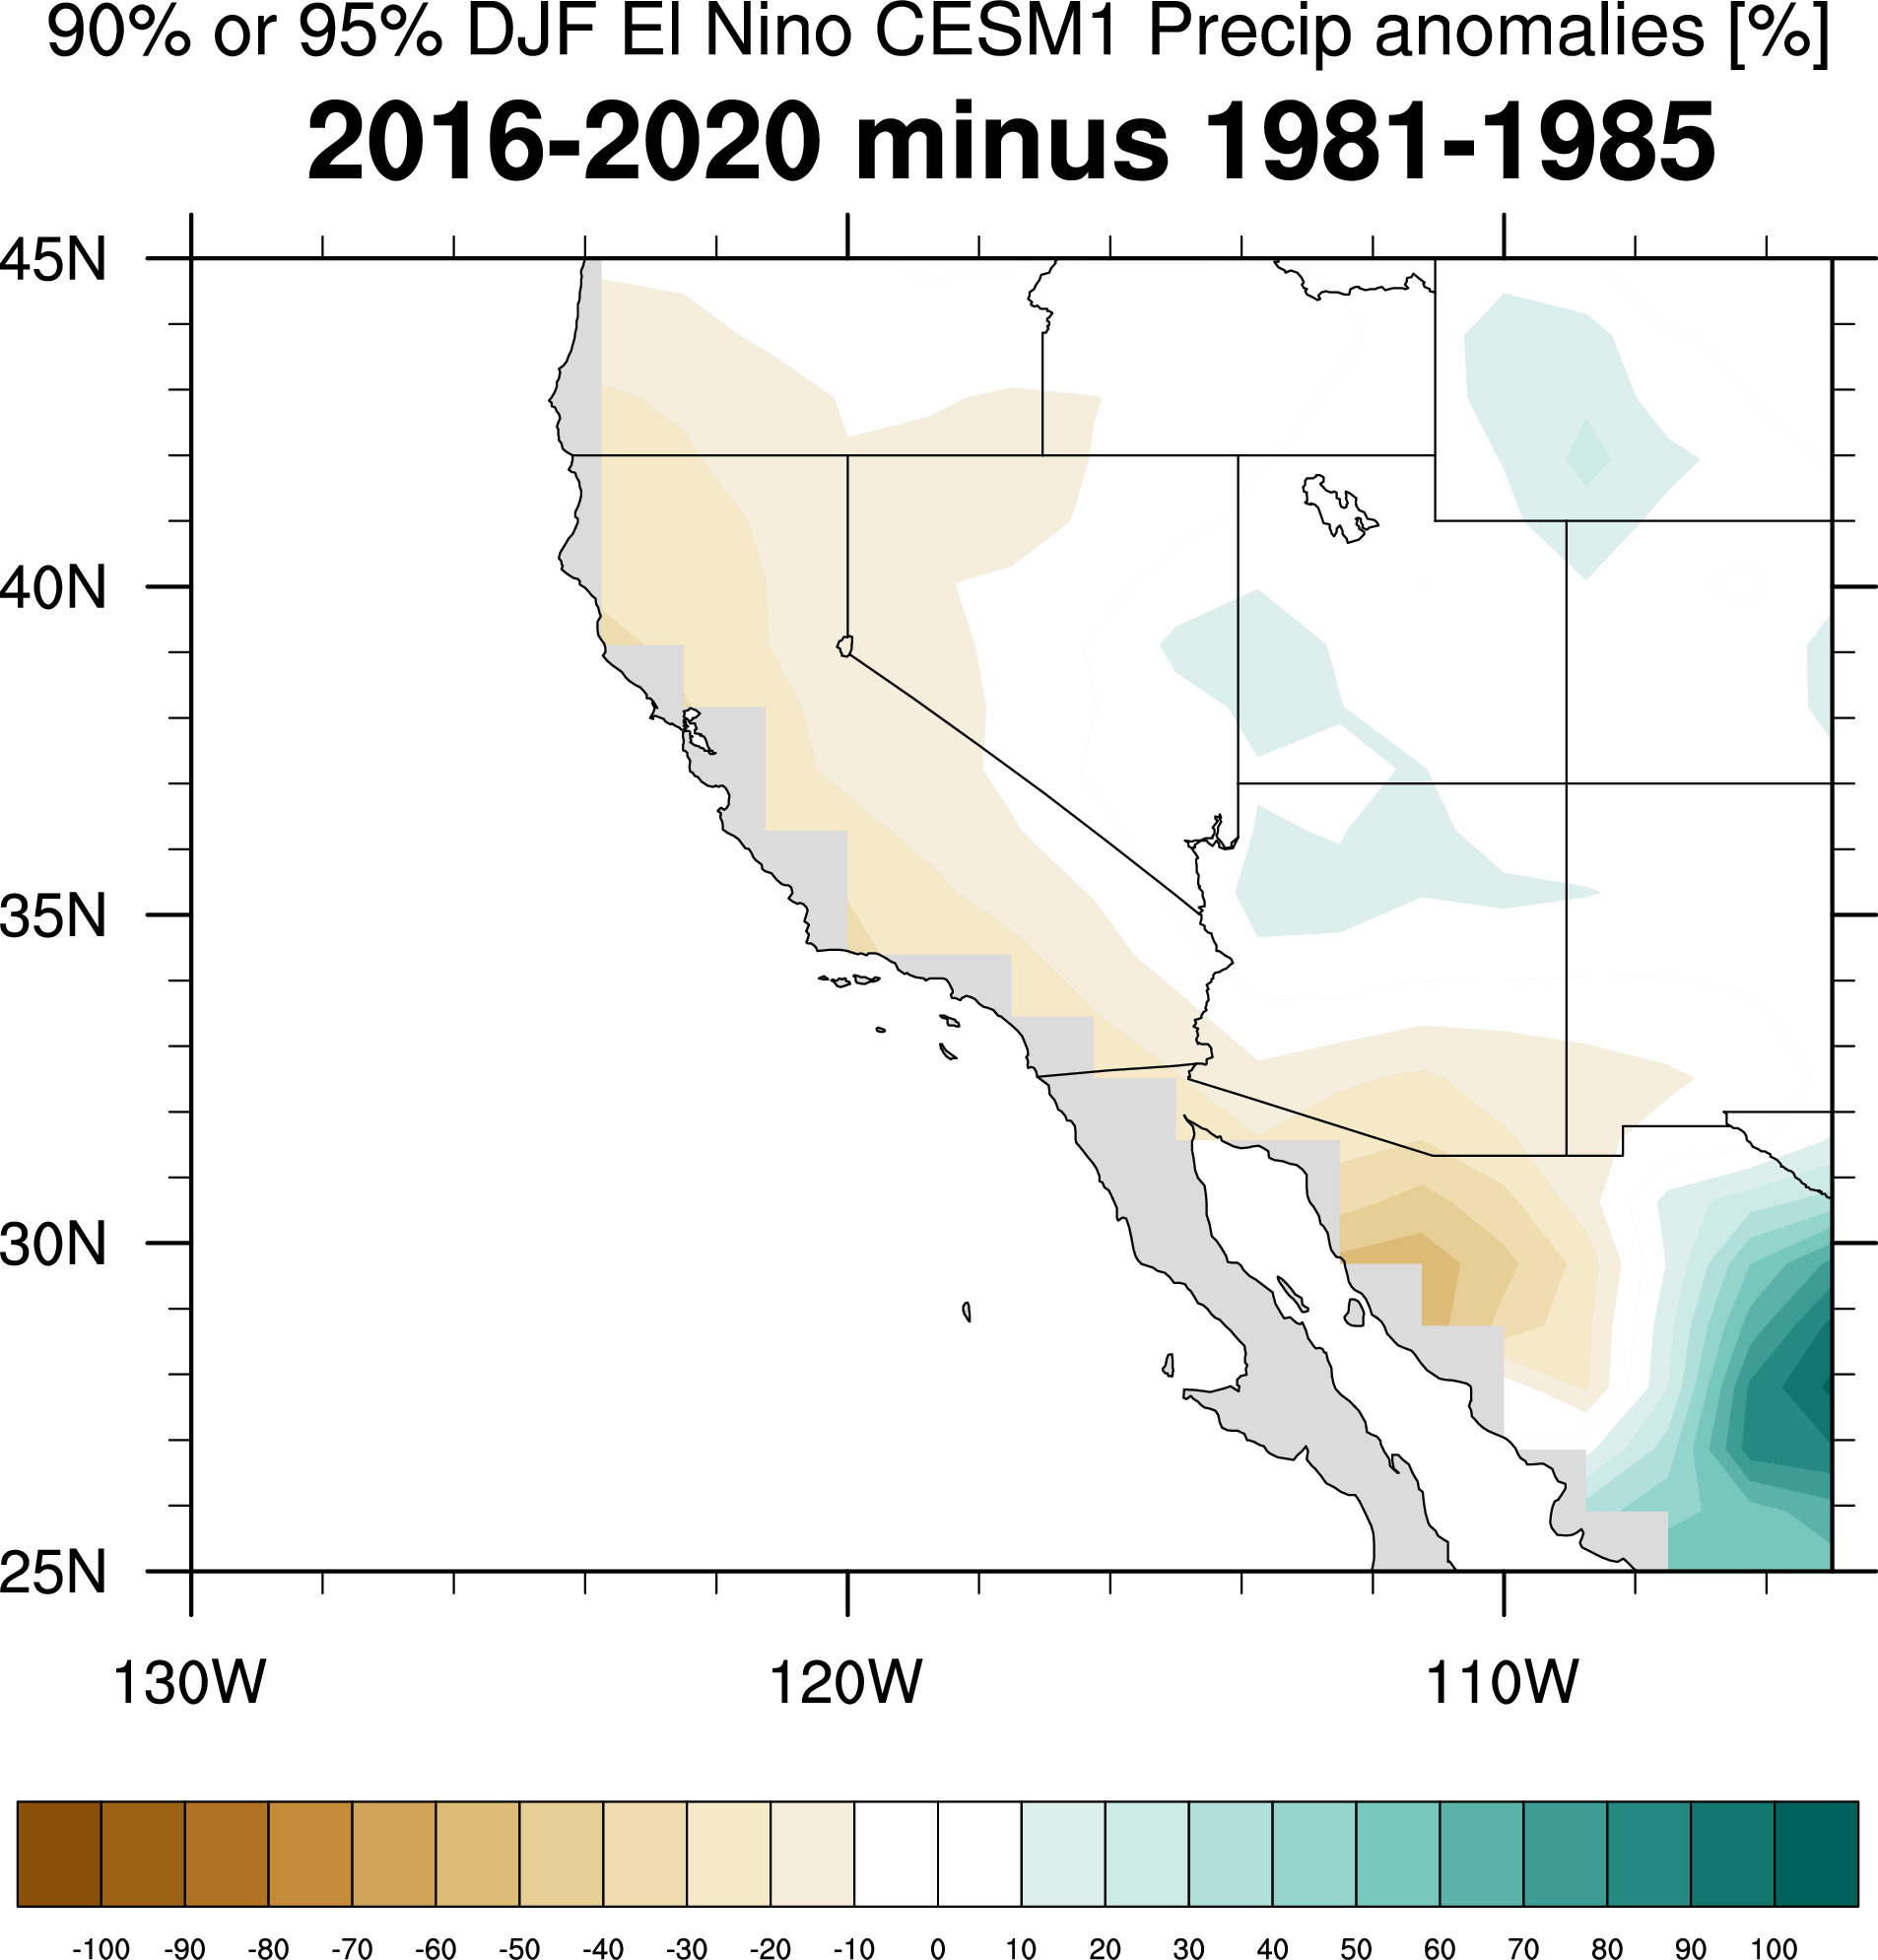
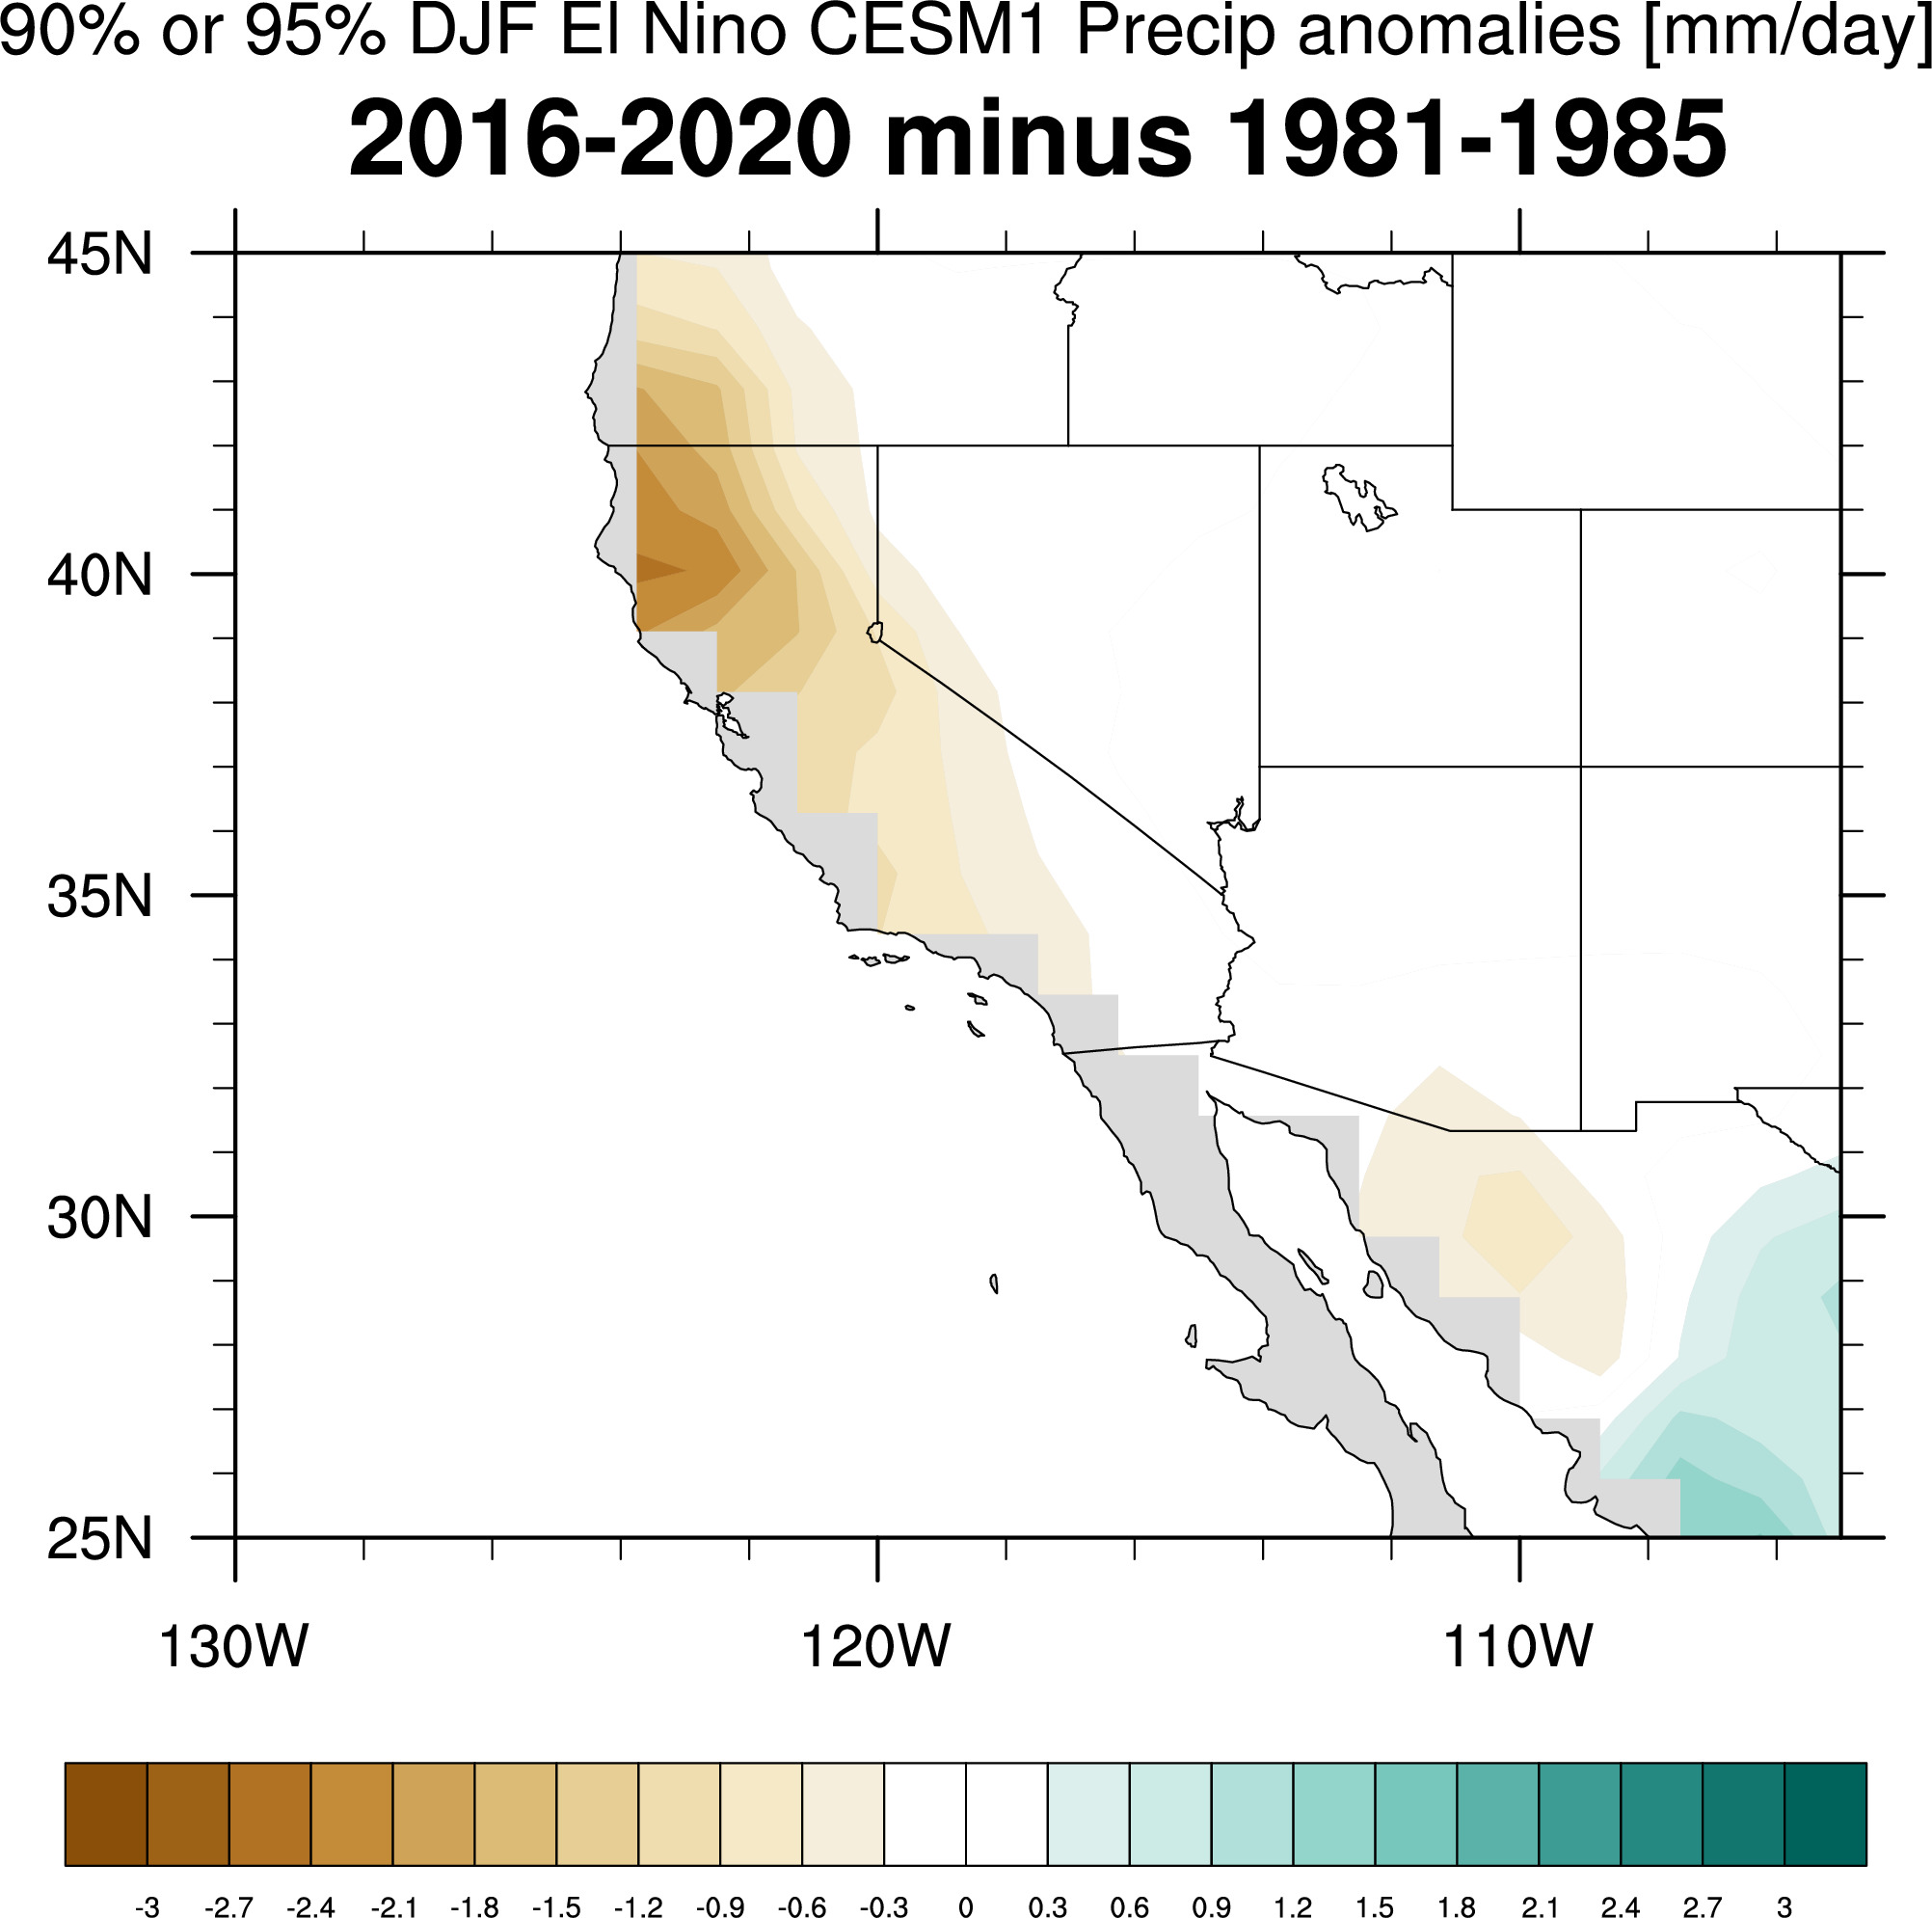
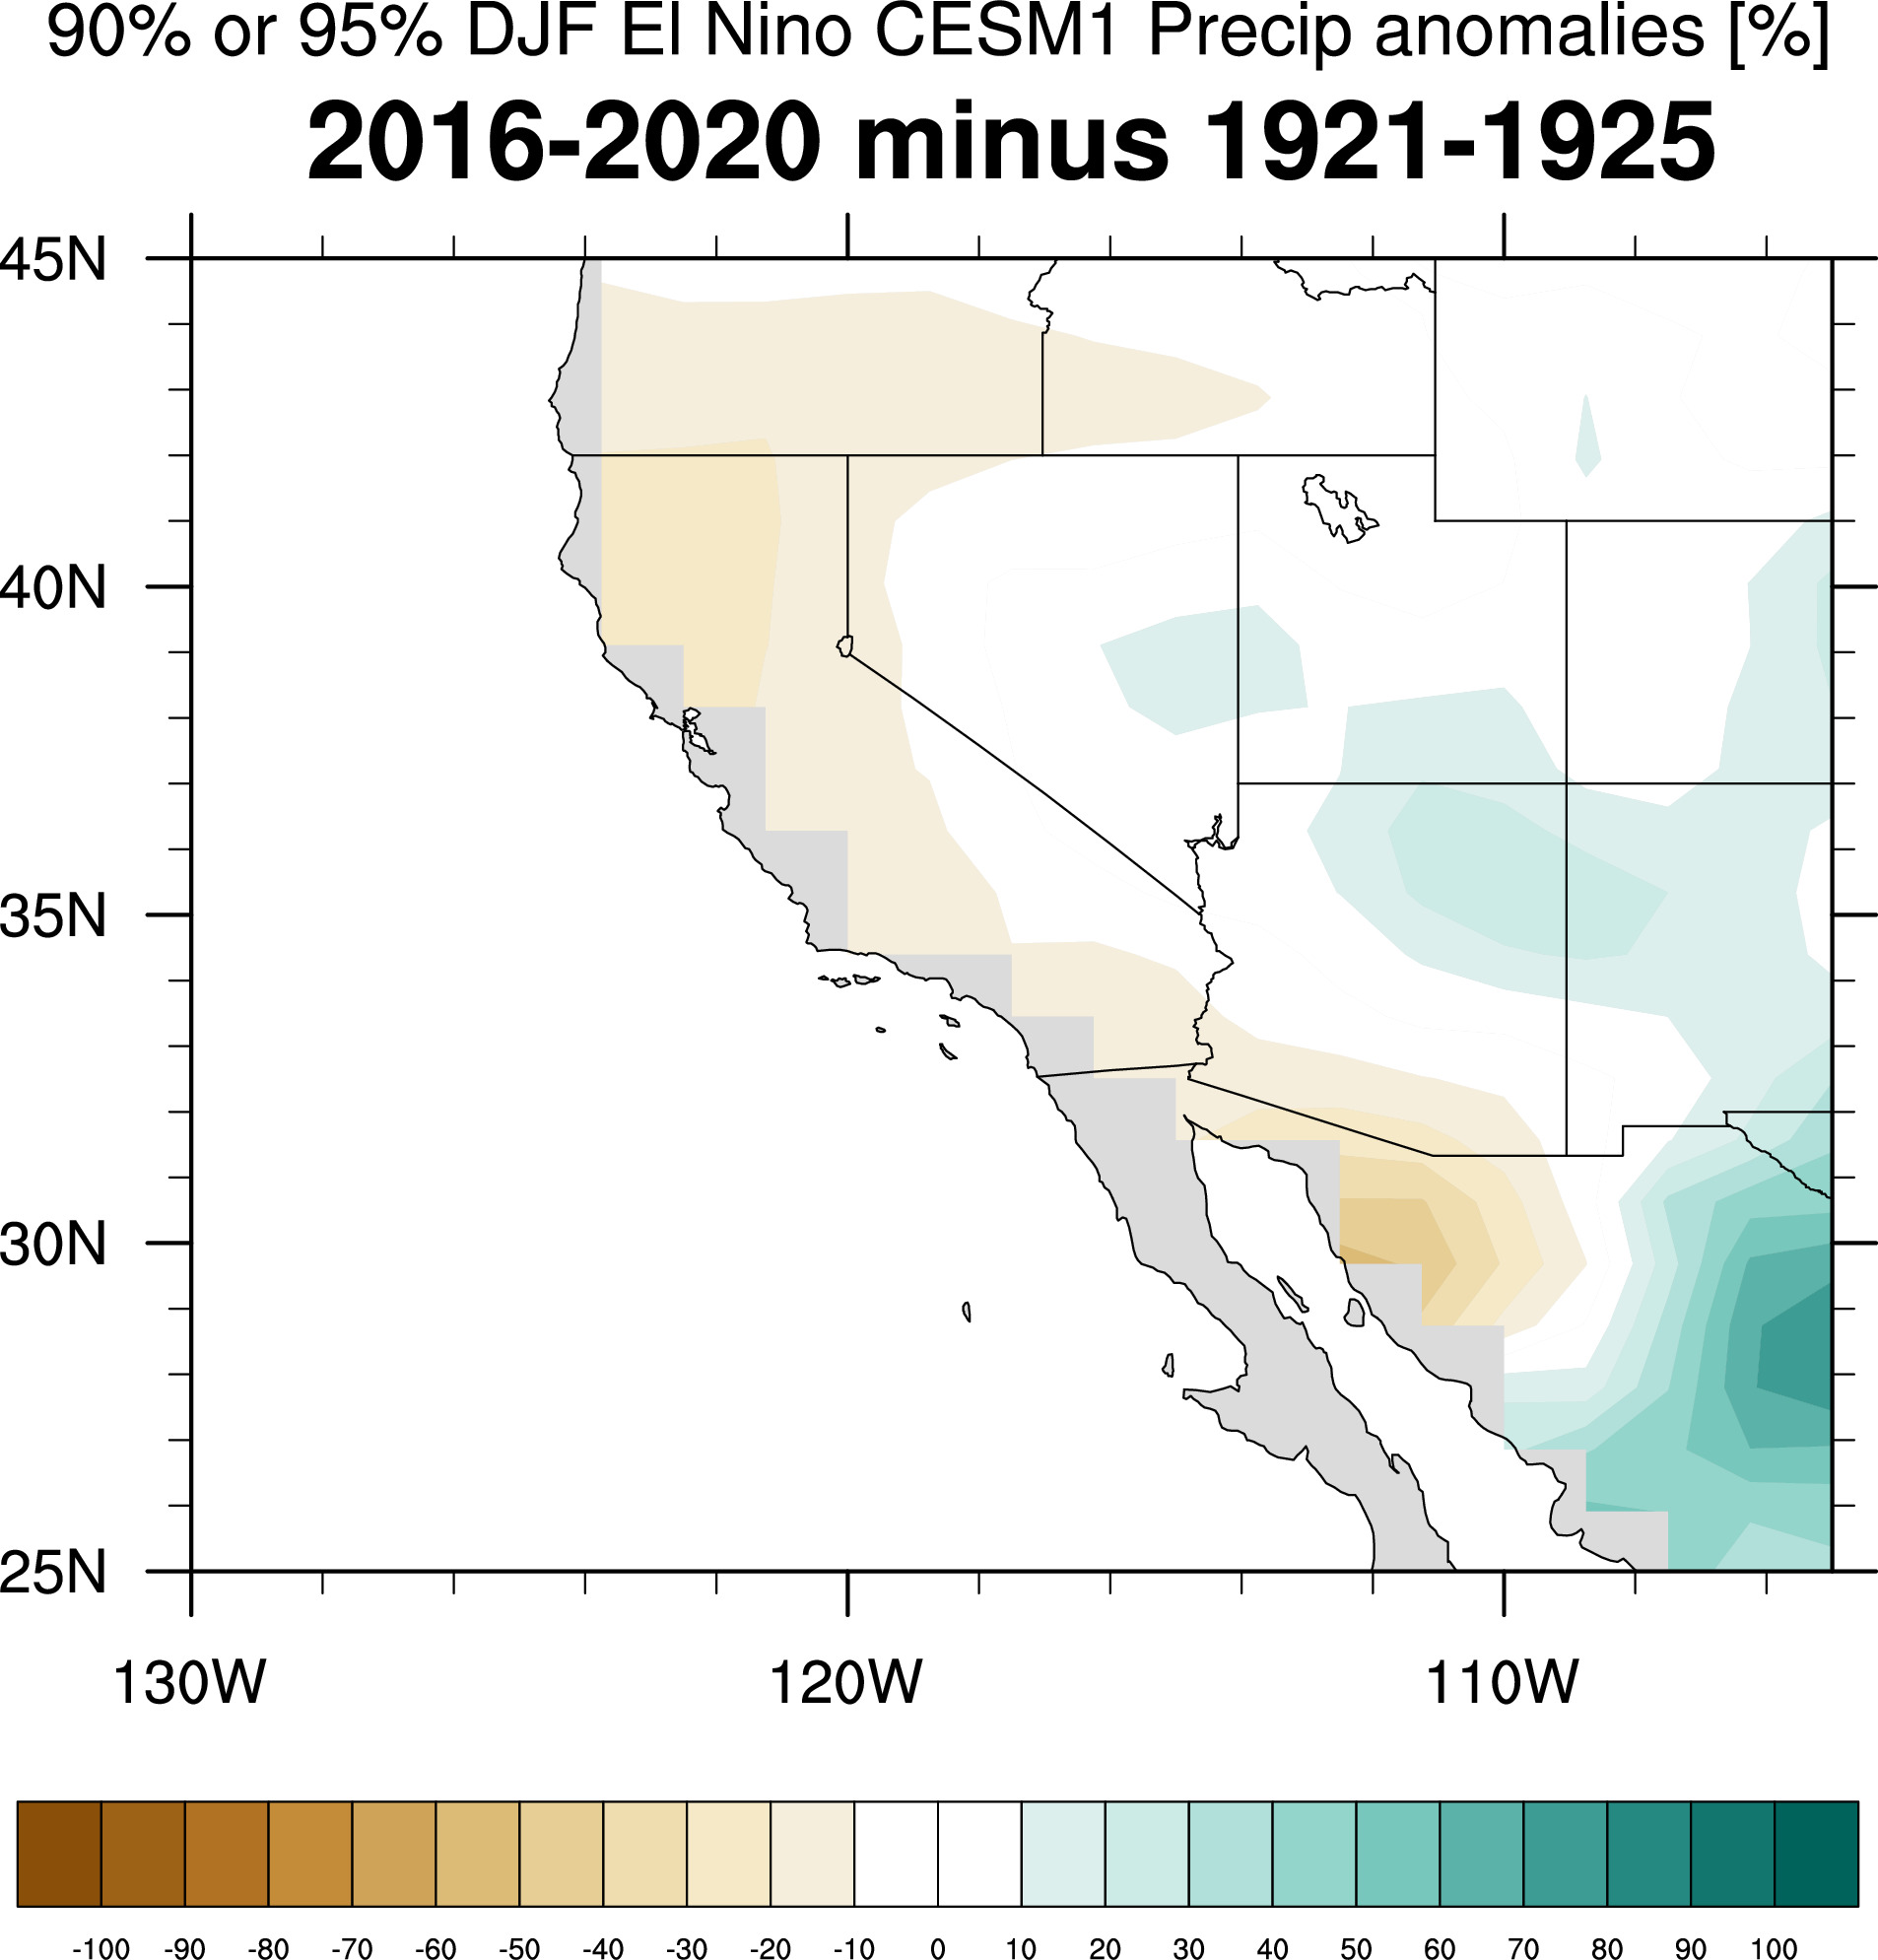
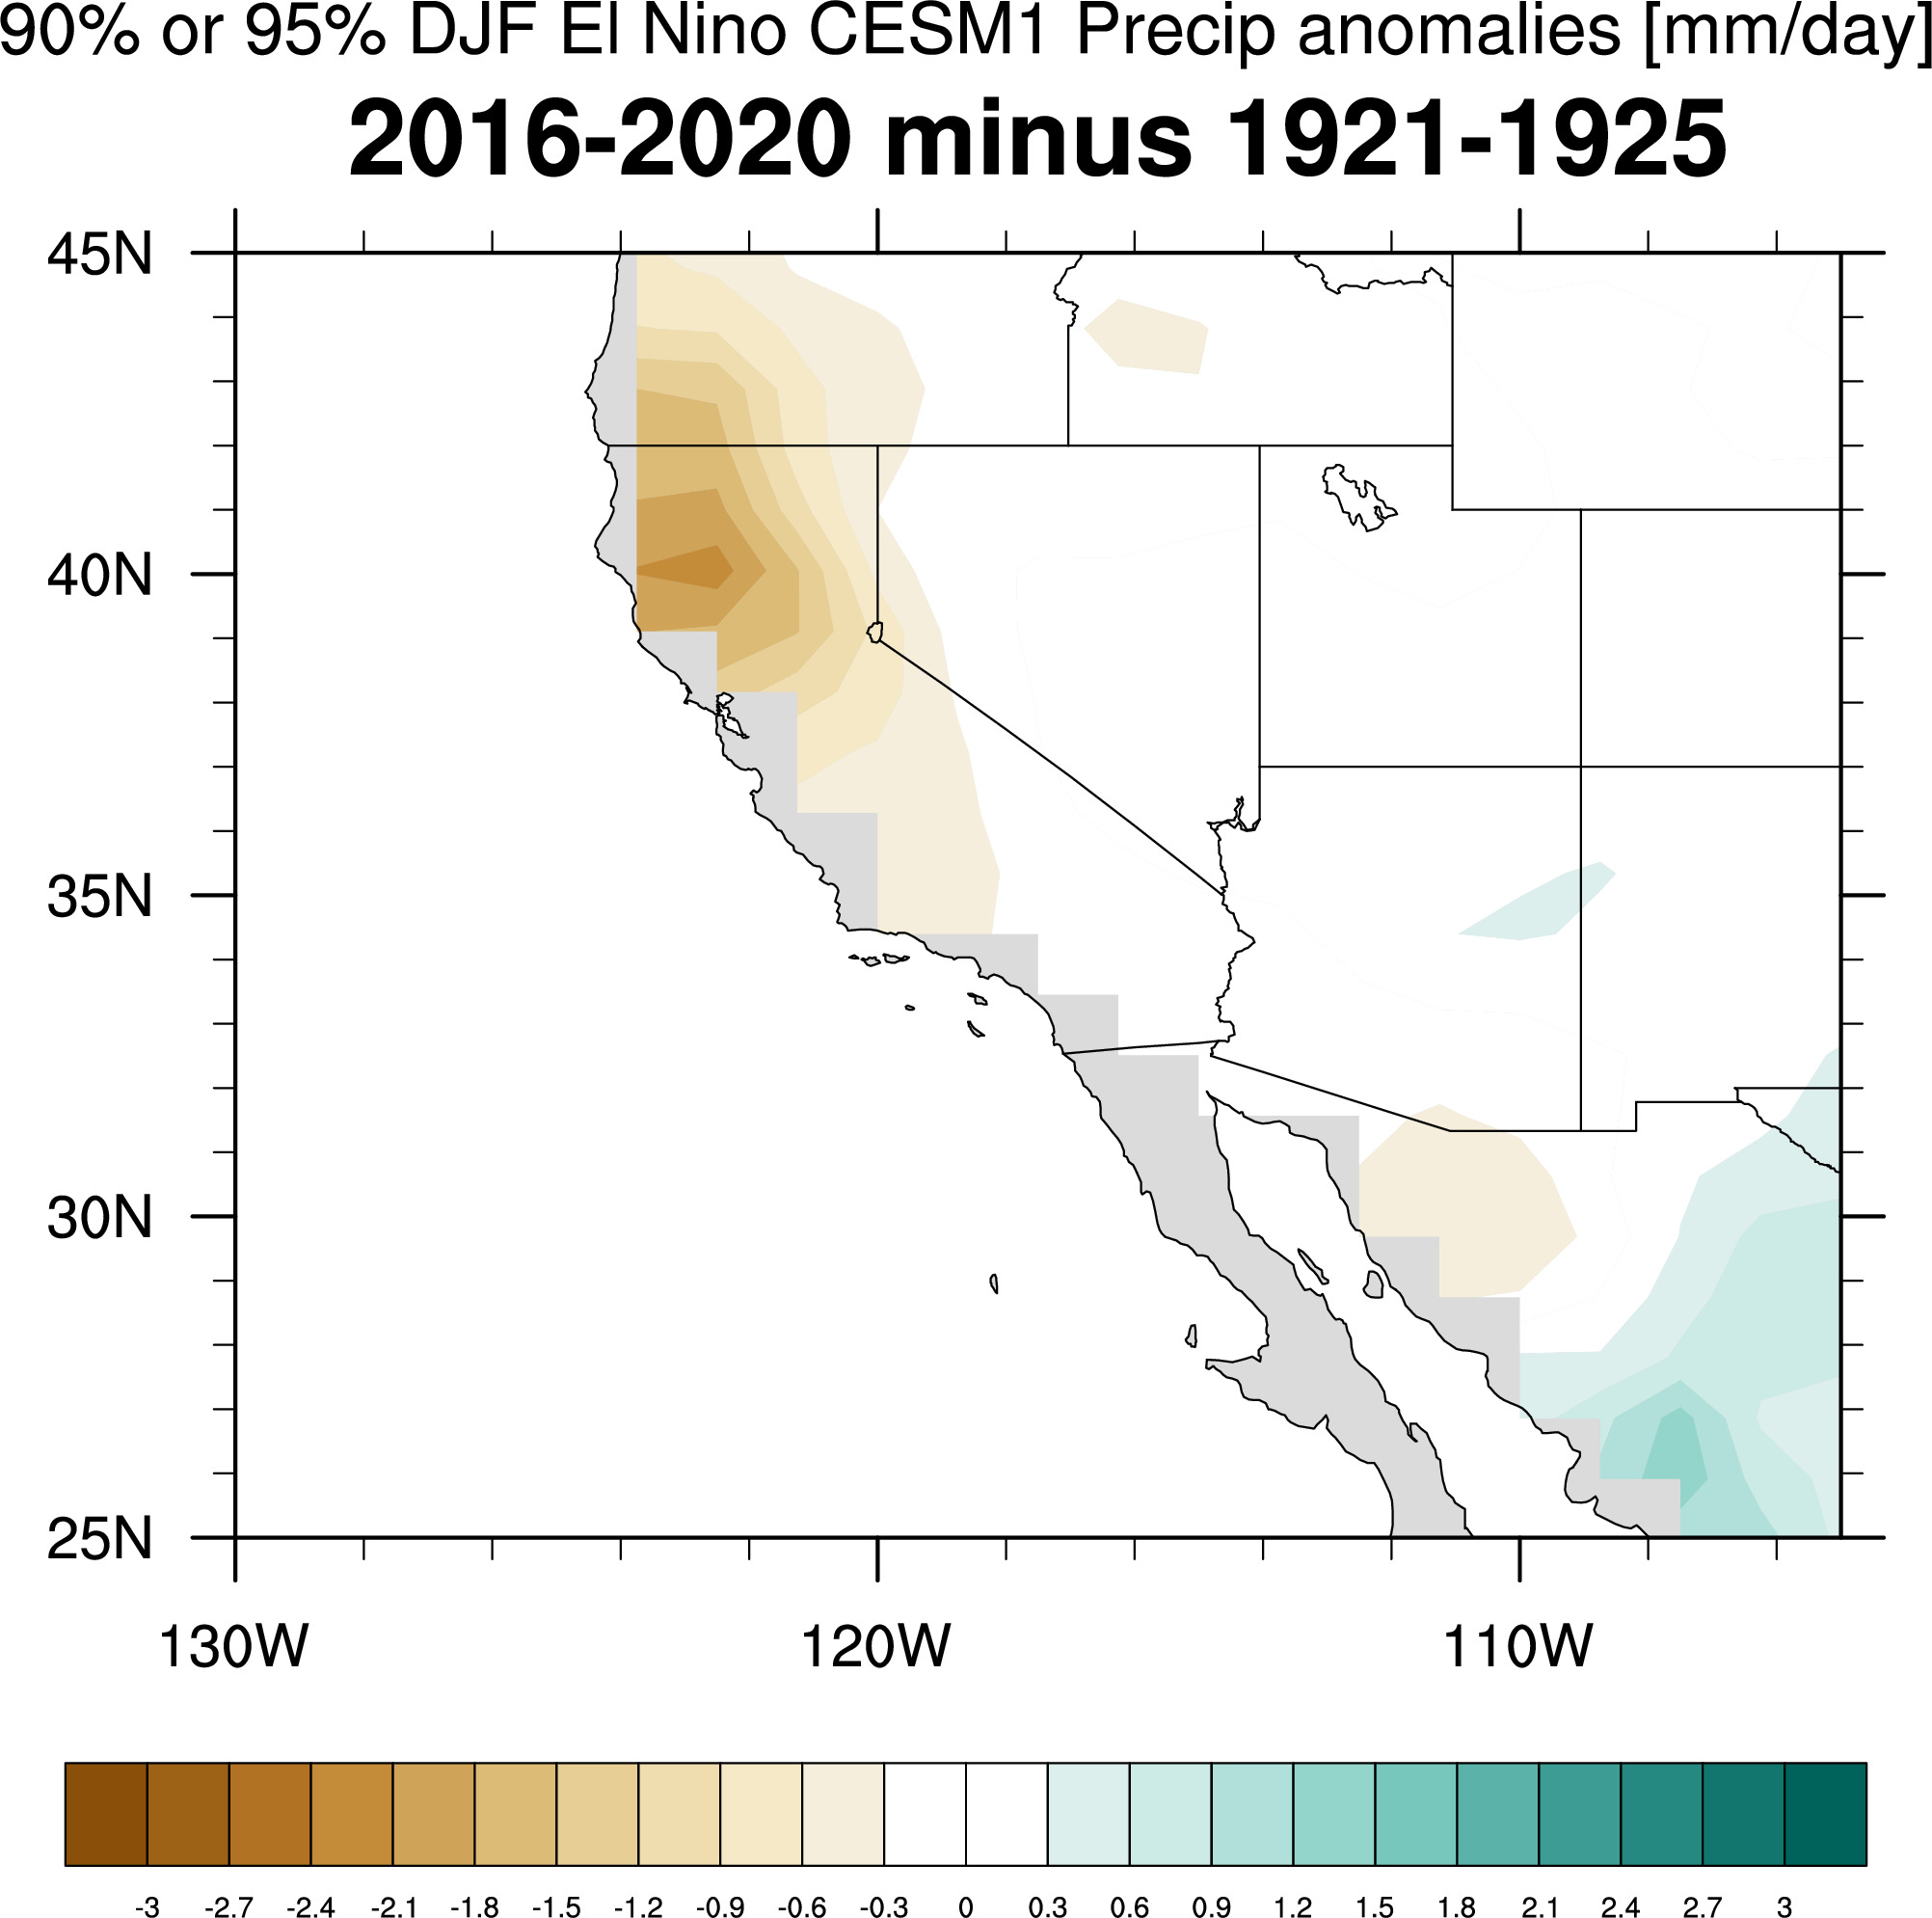
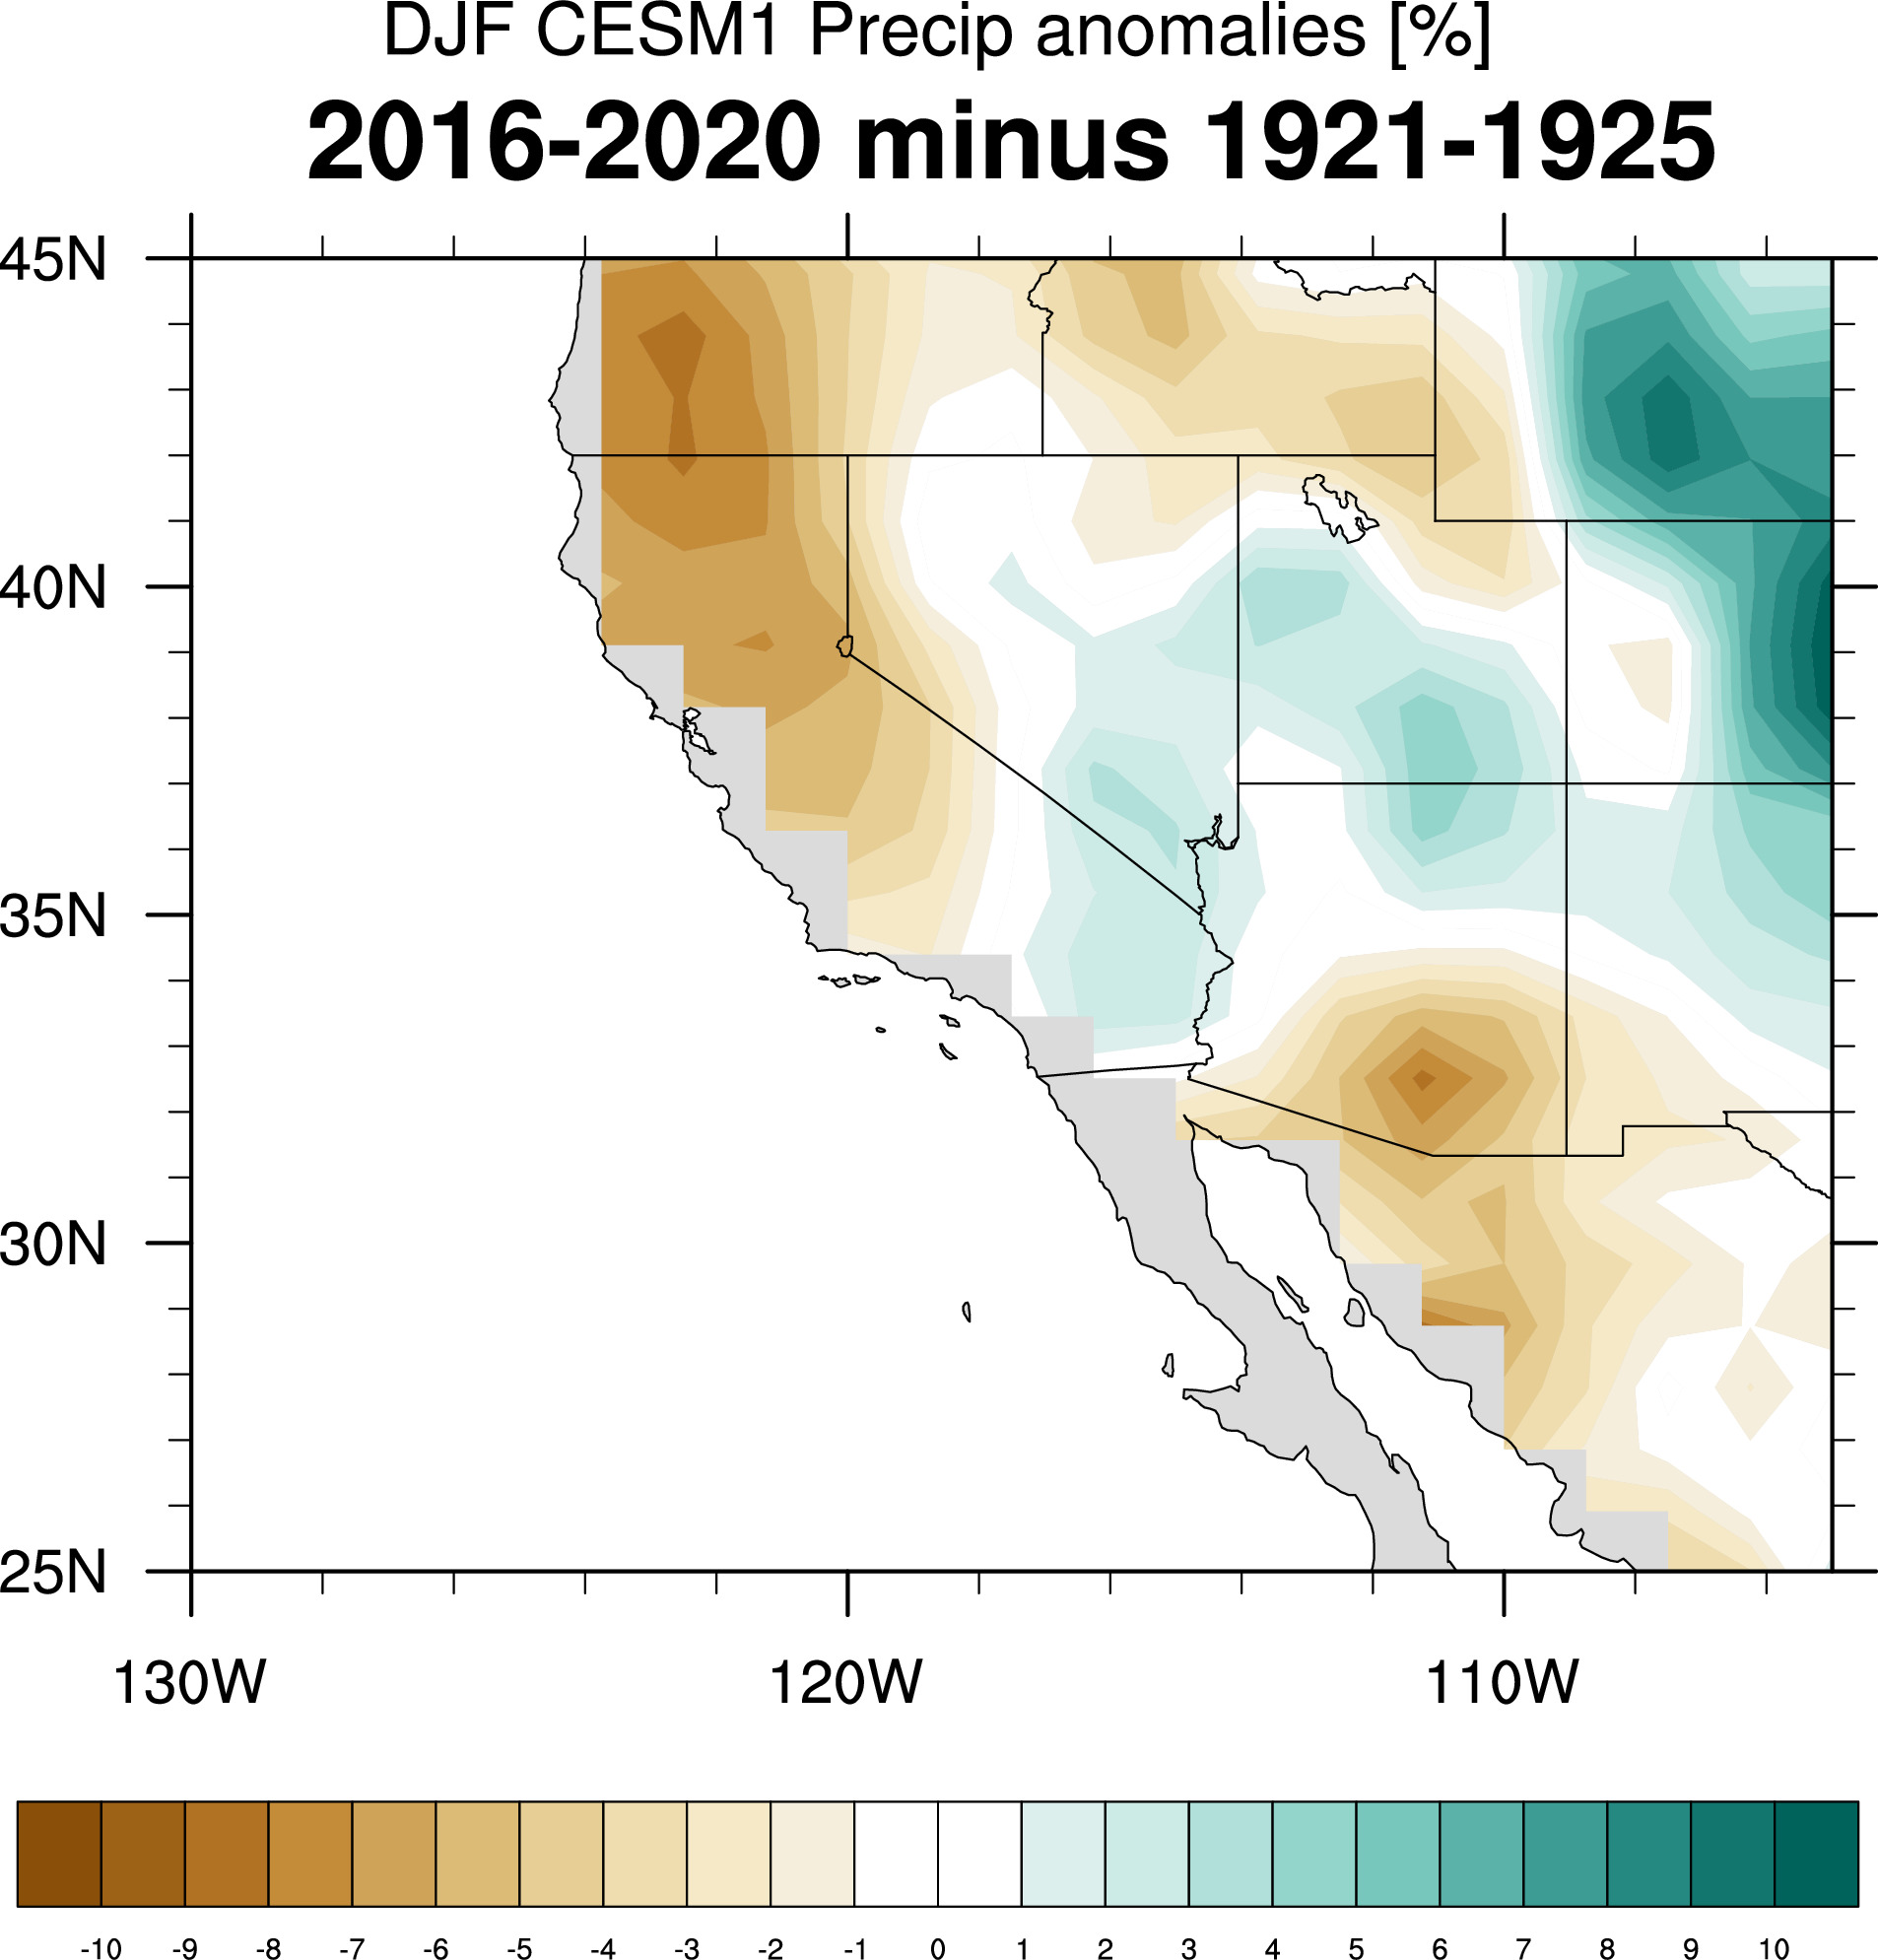
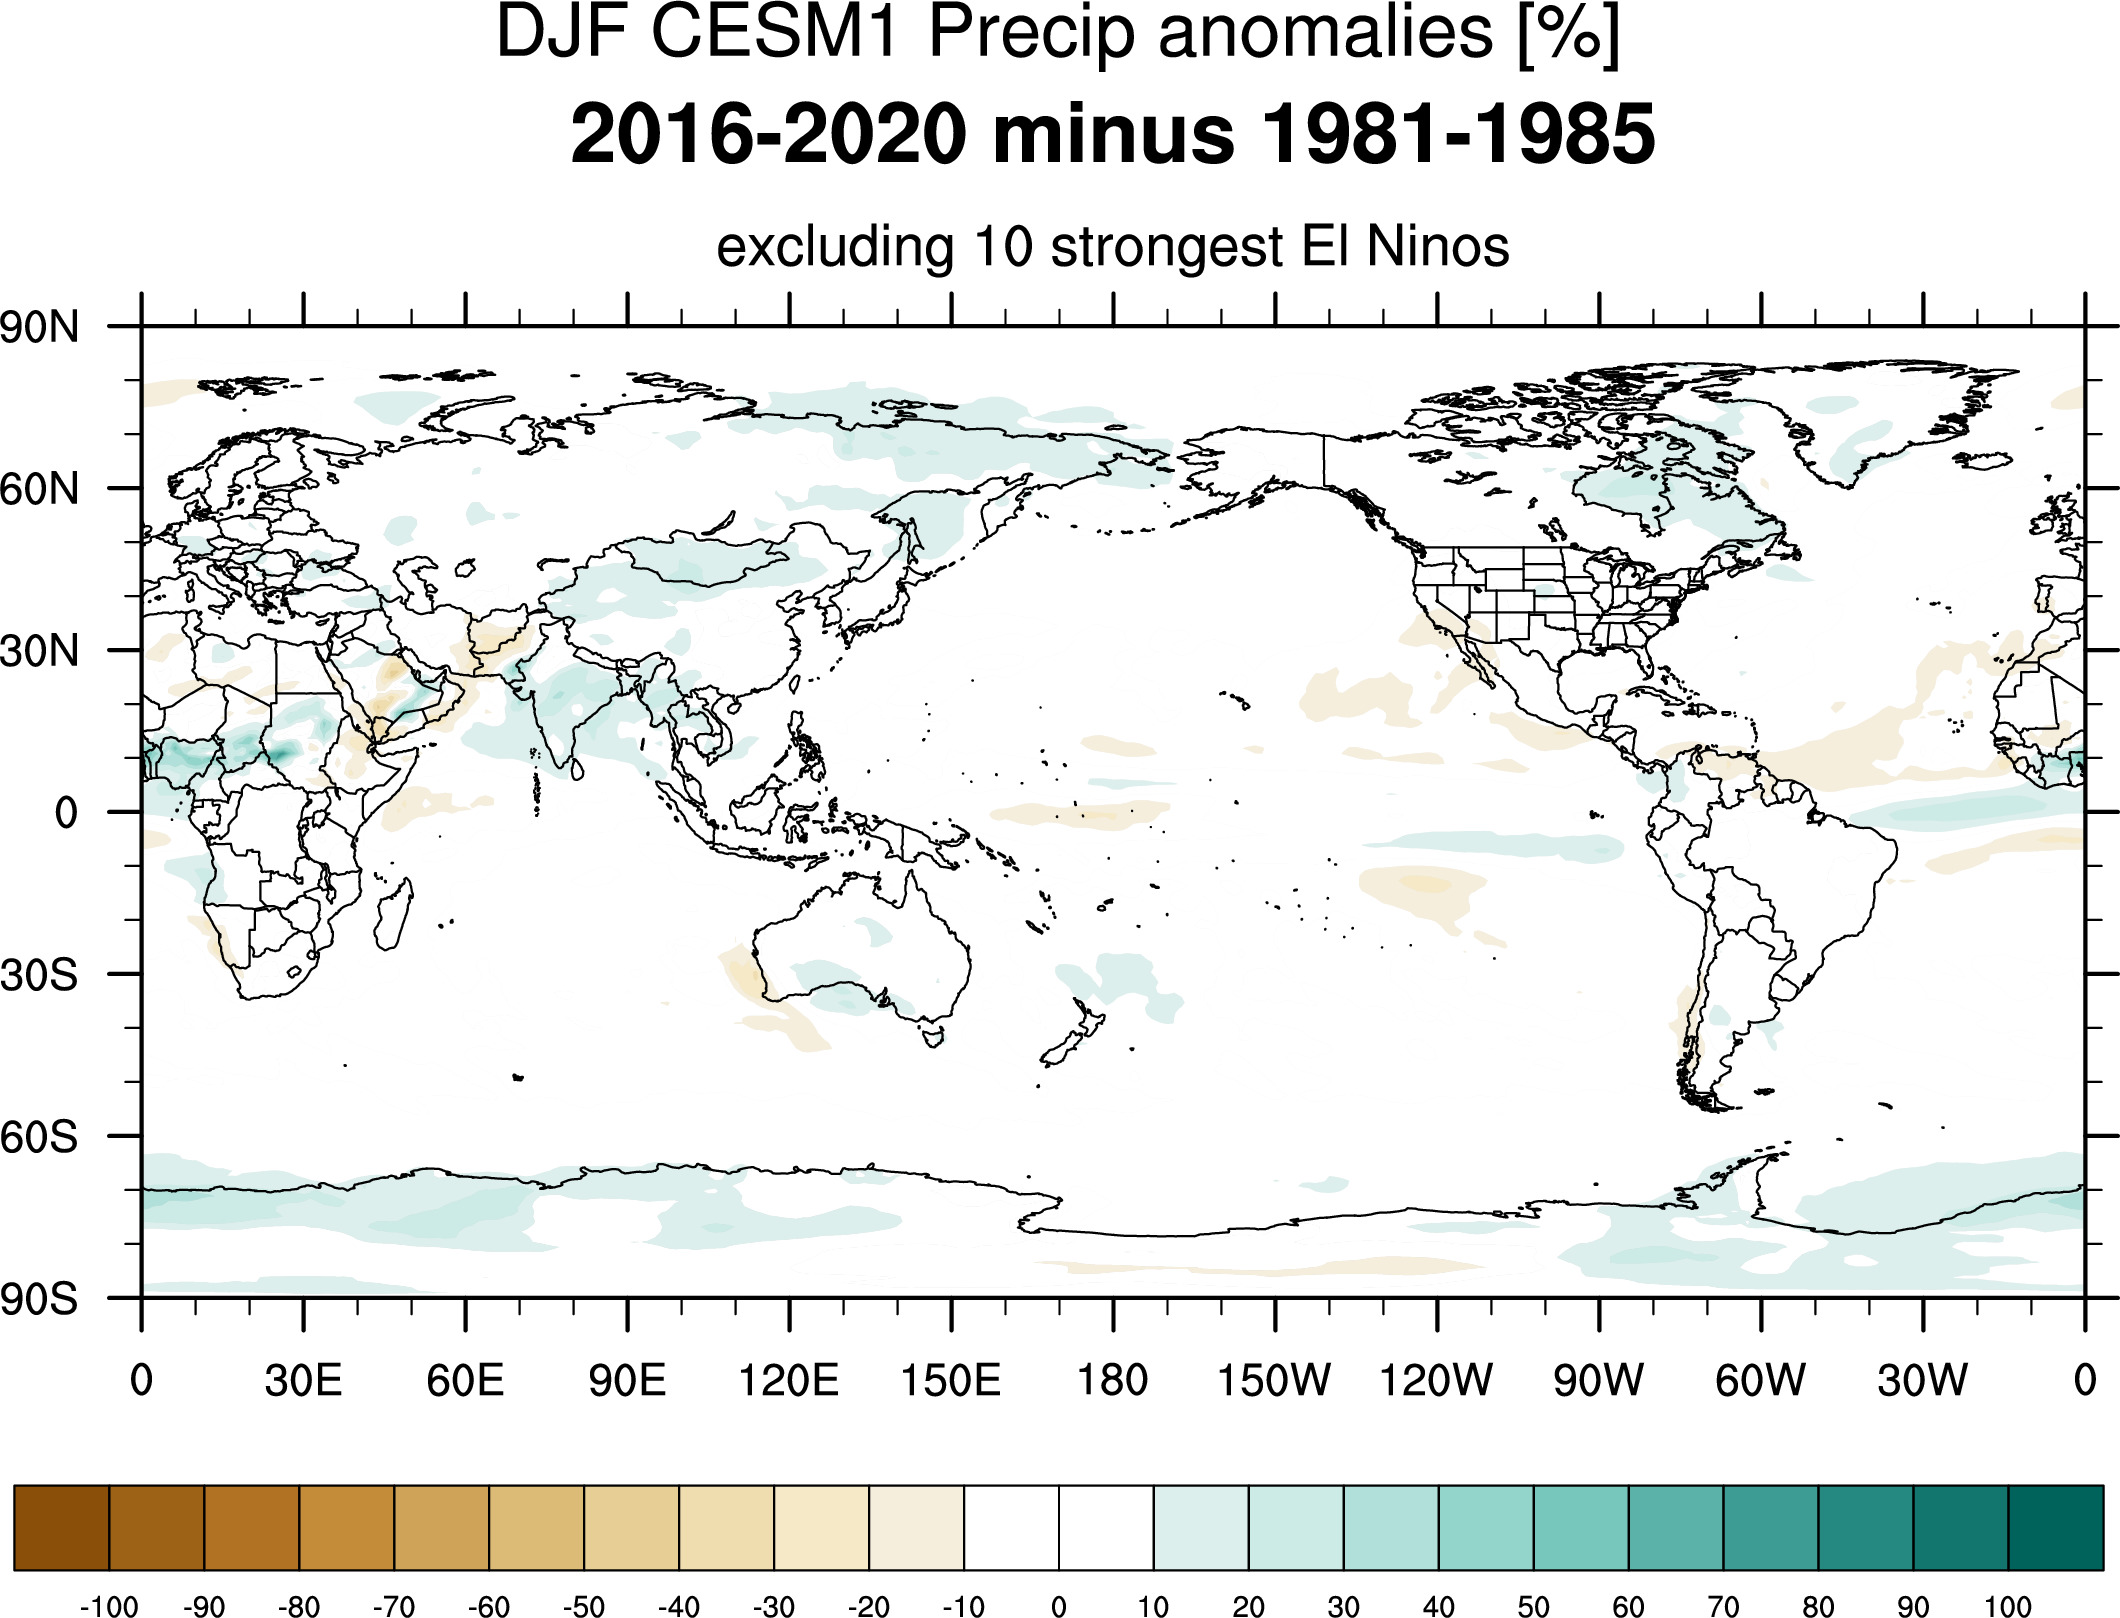
Precipitation anomaly maps


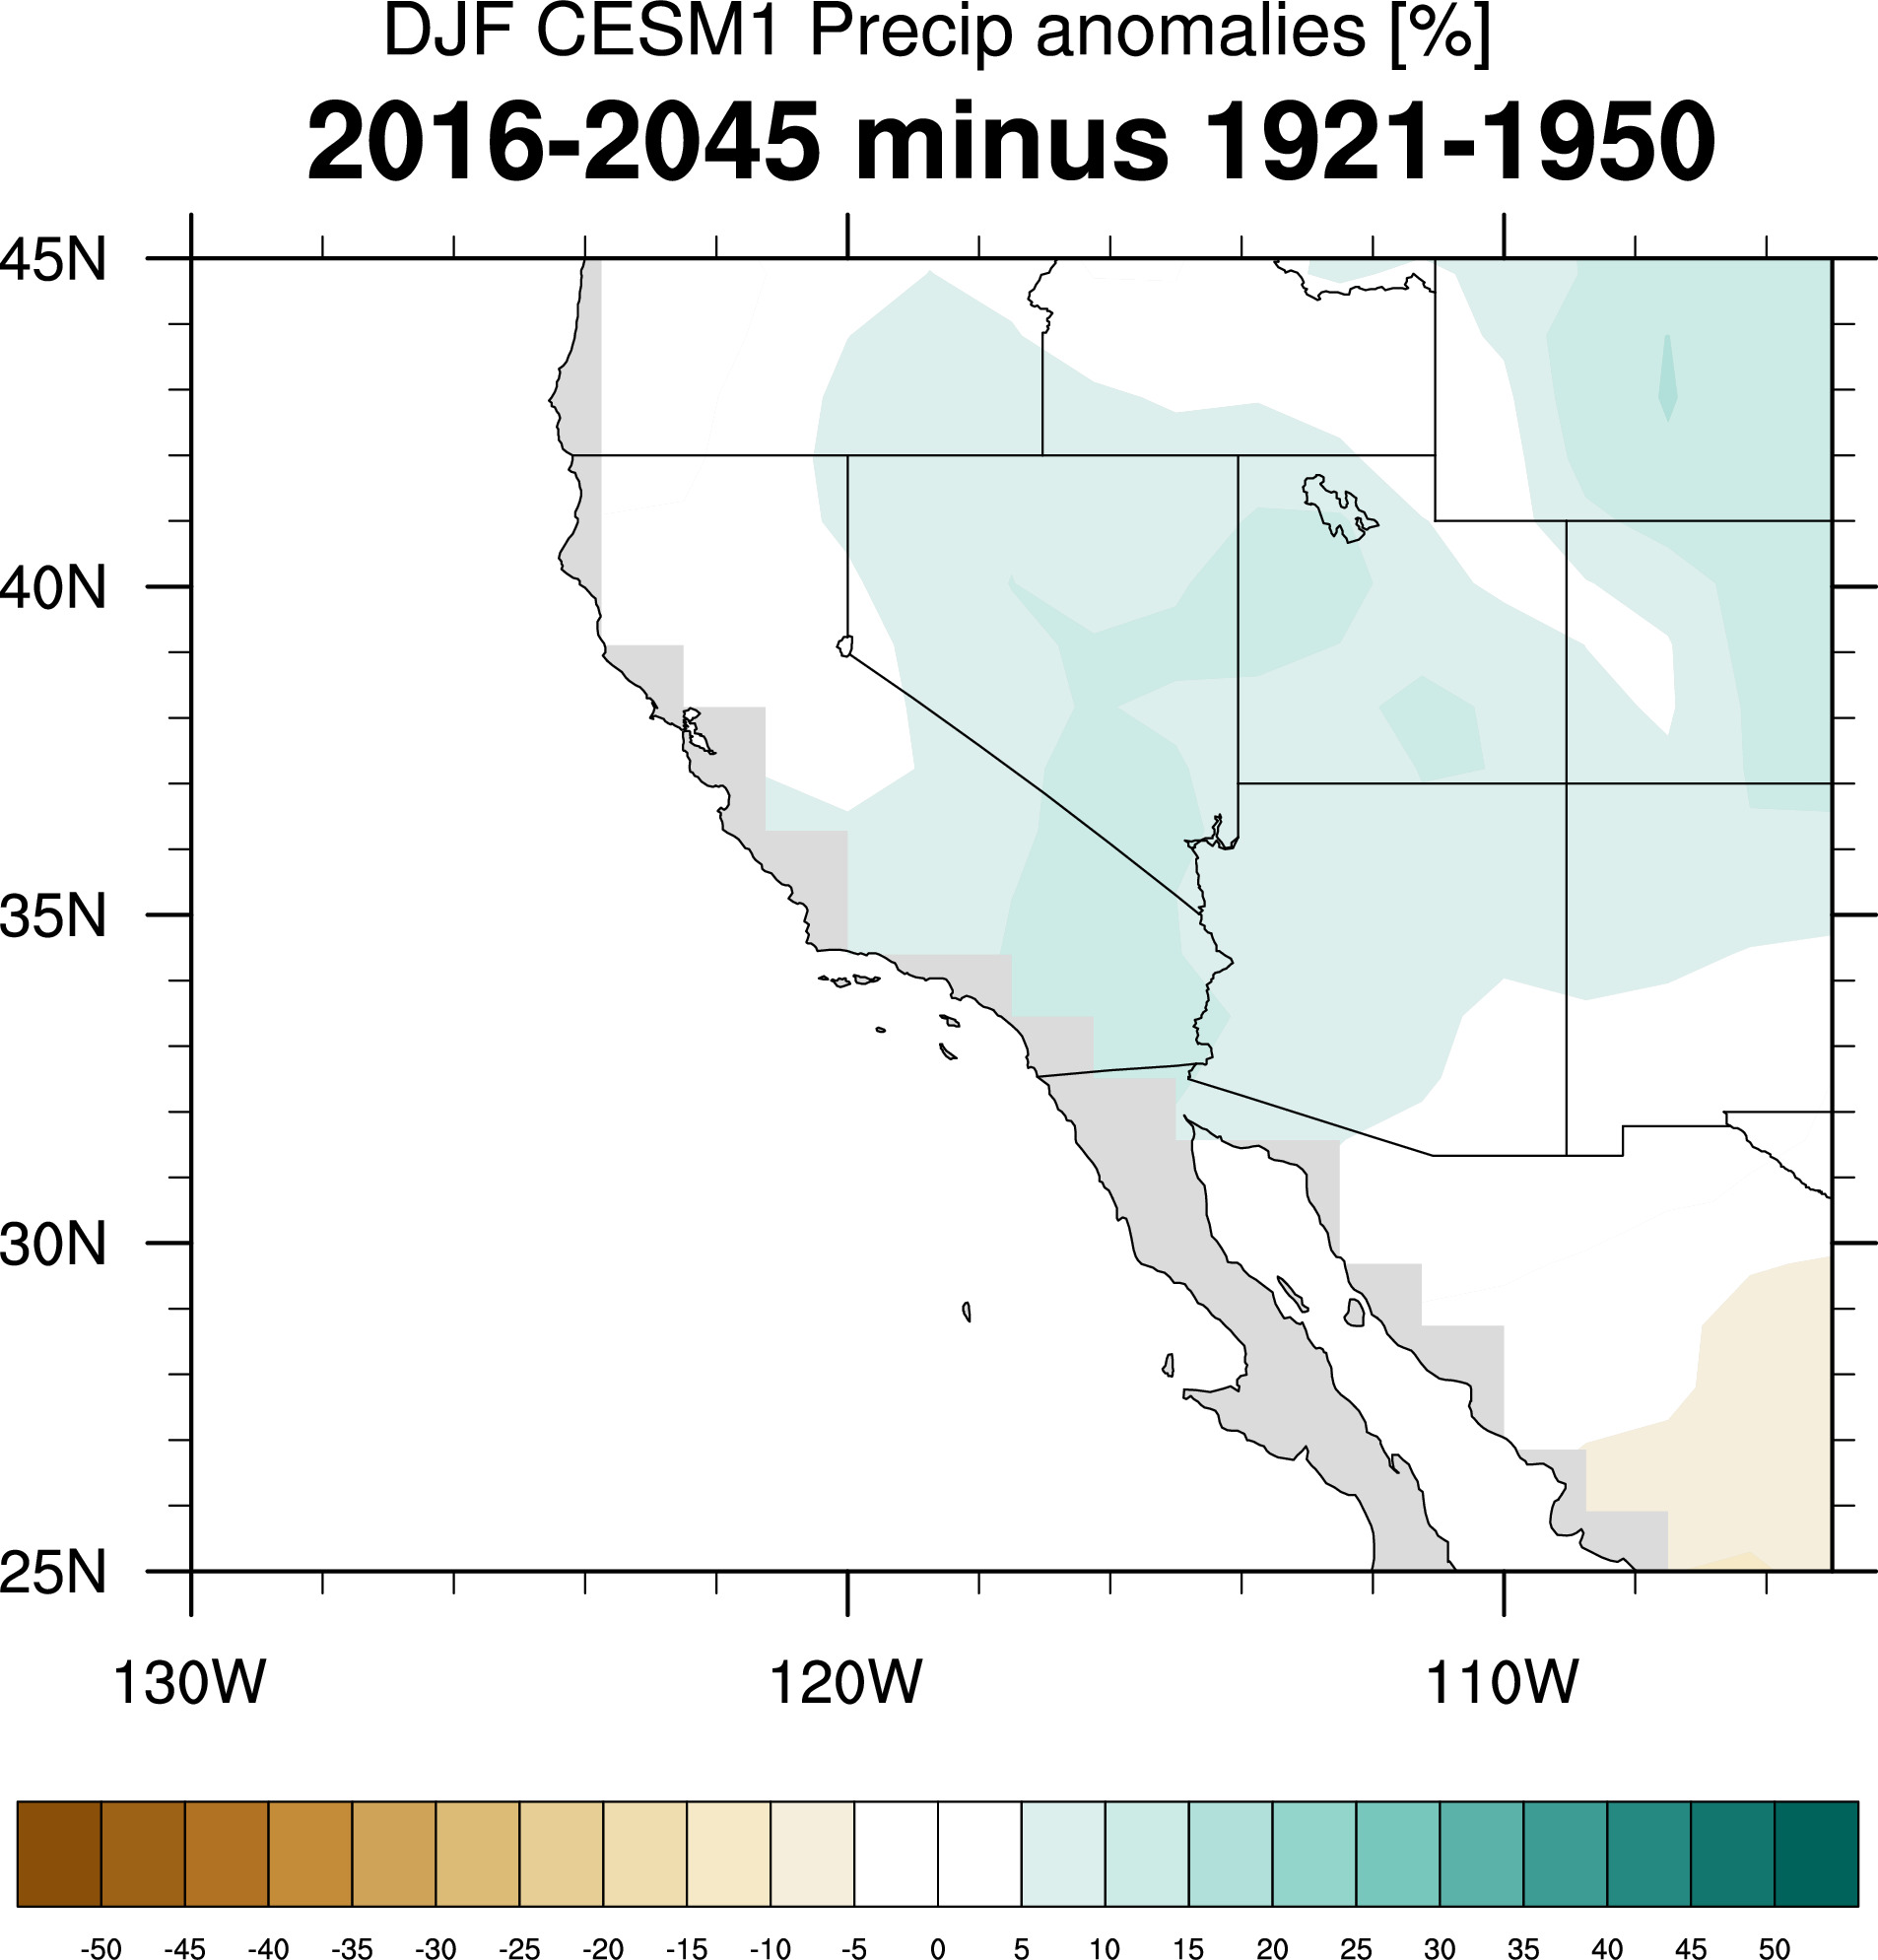
Differences


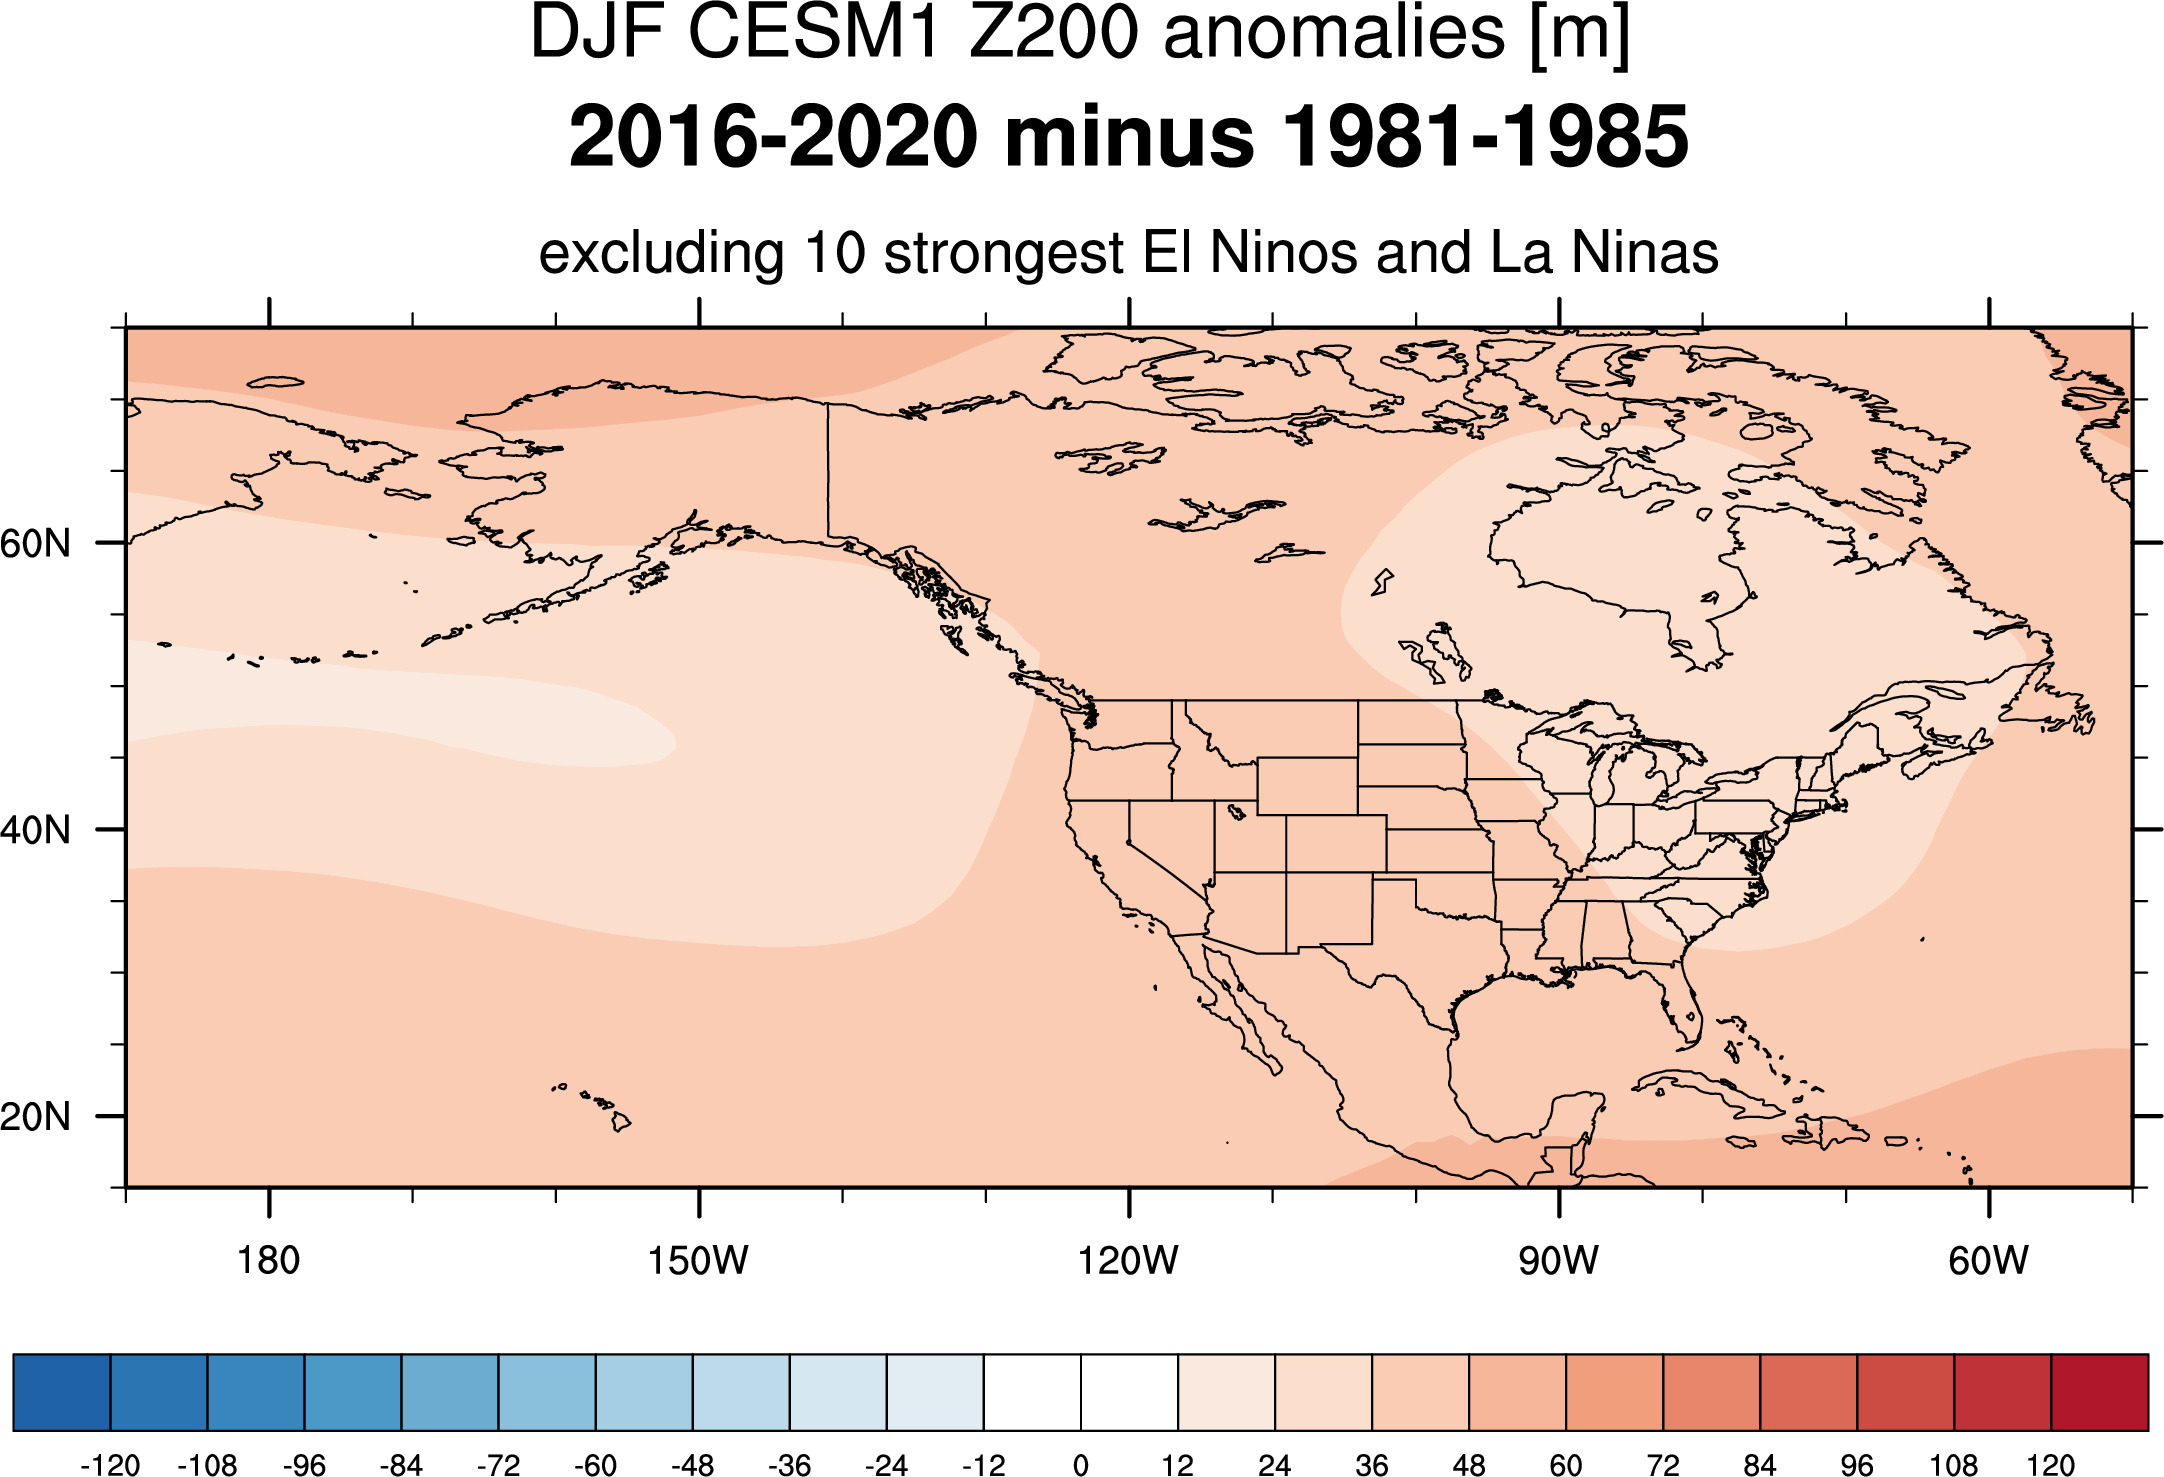
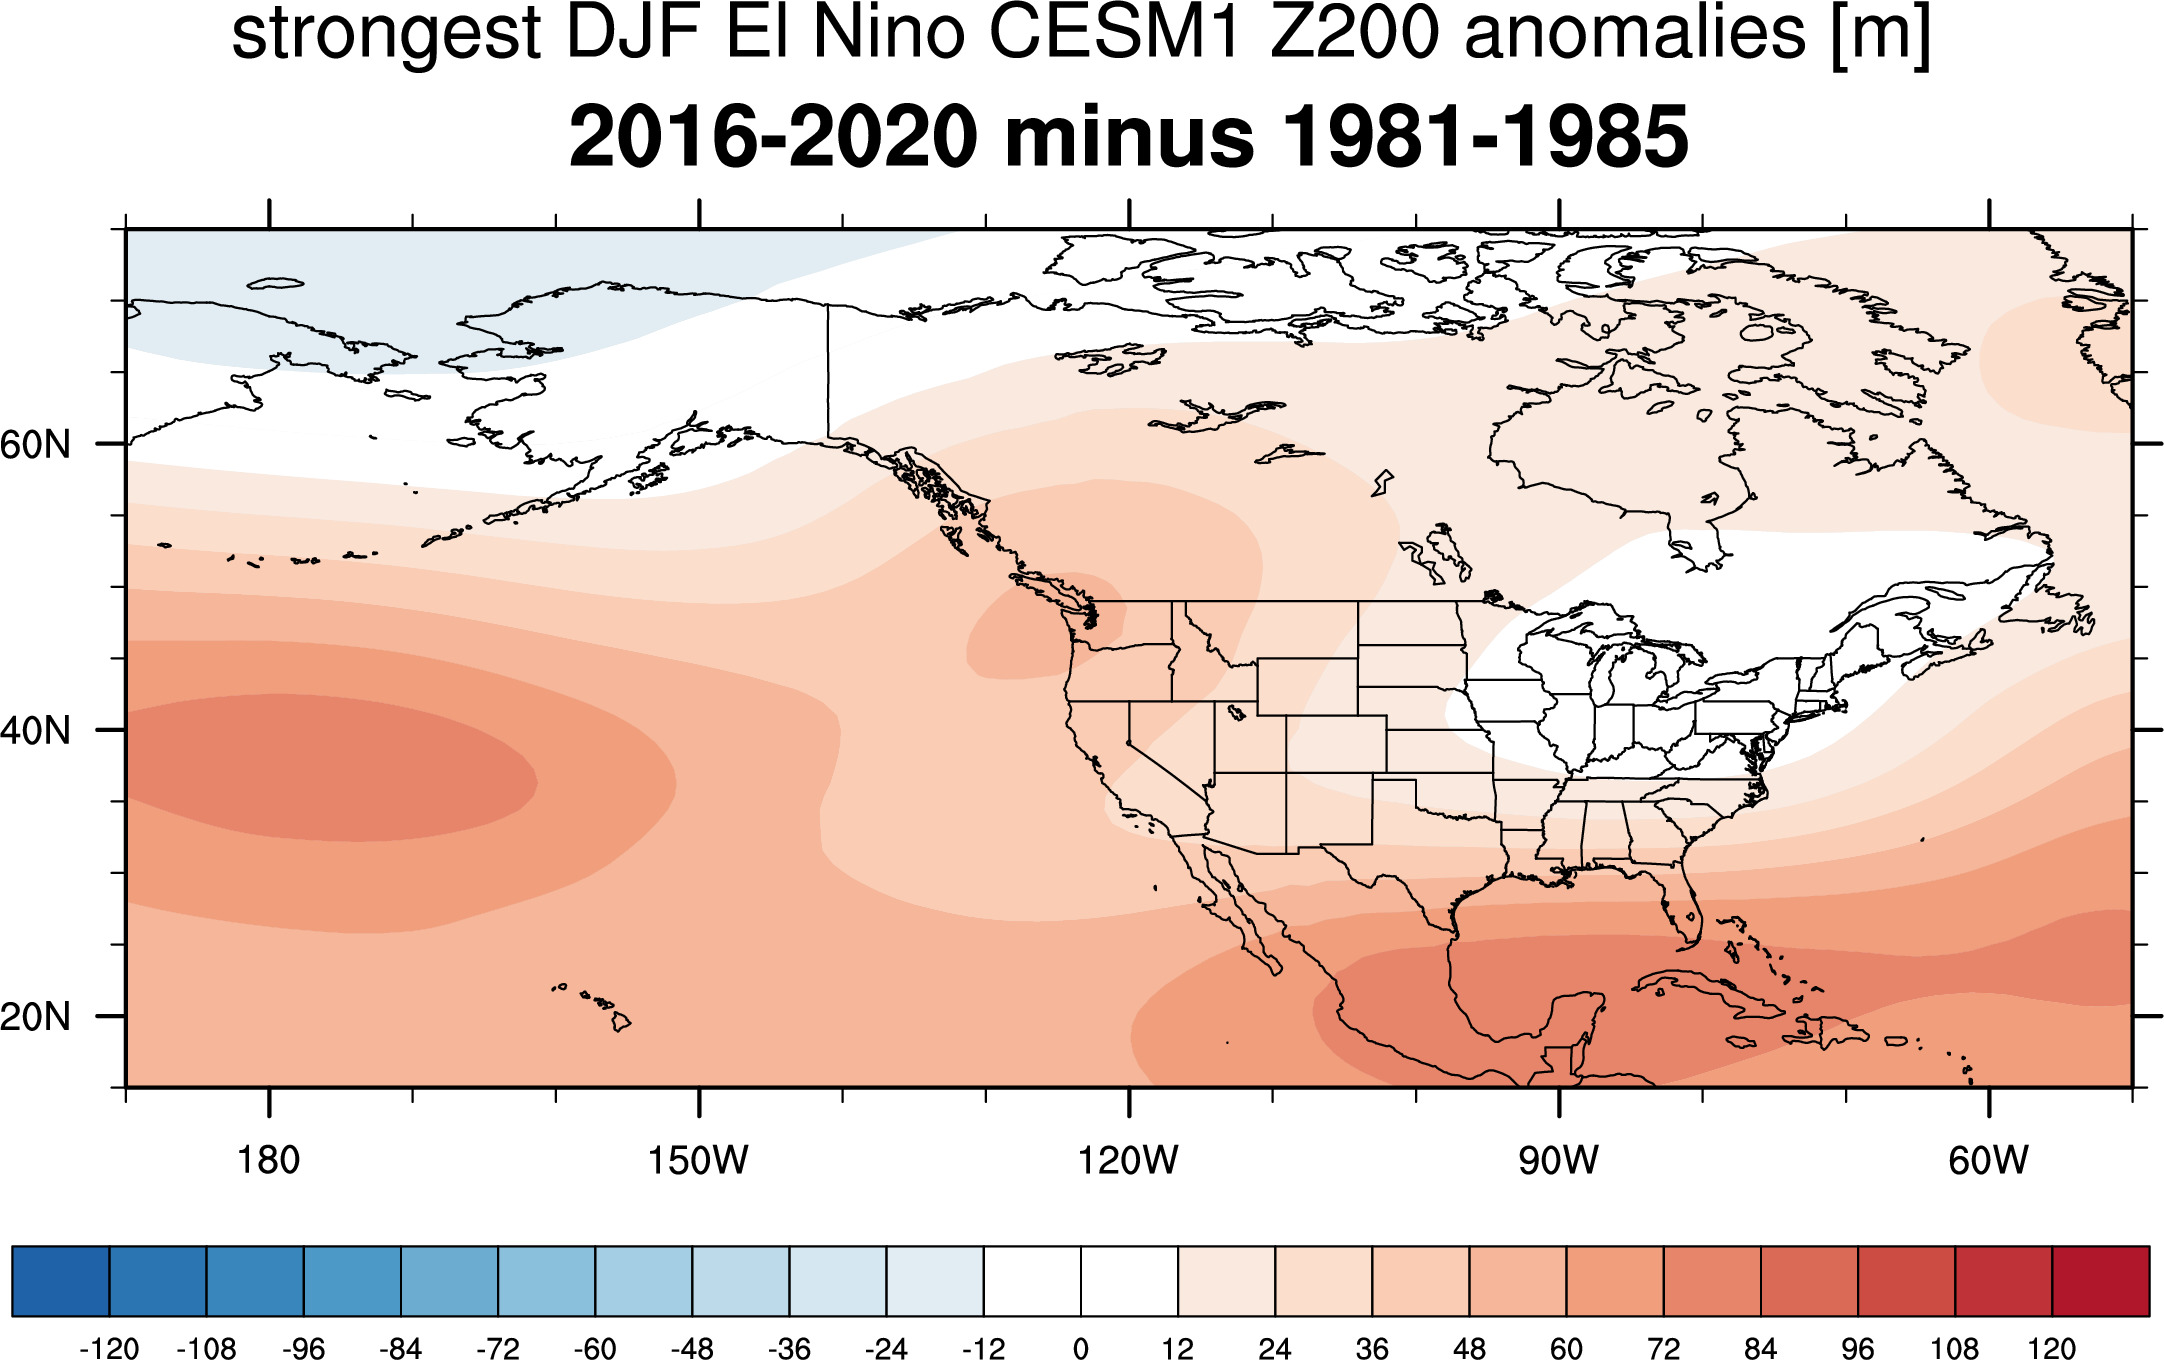
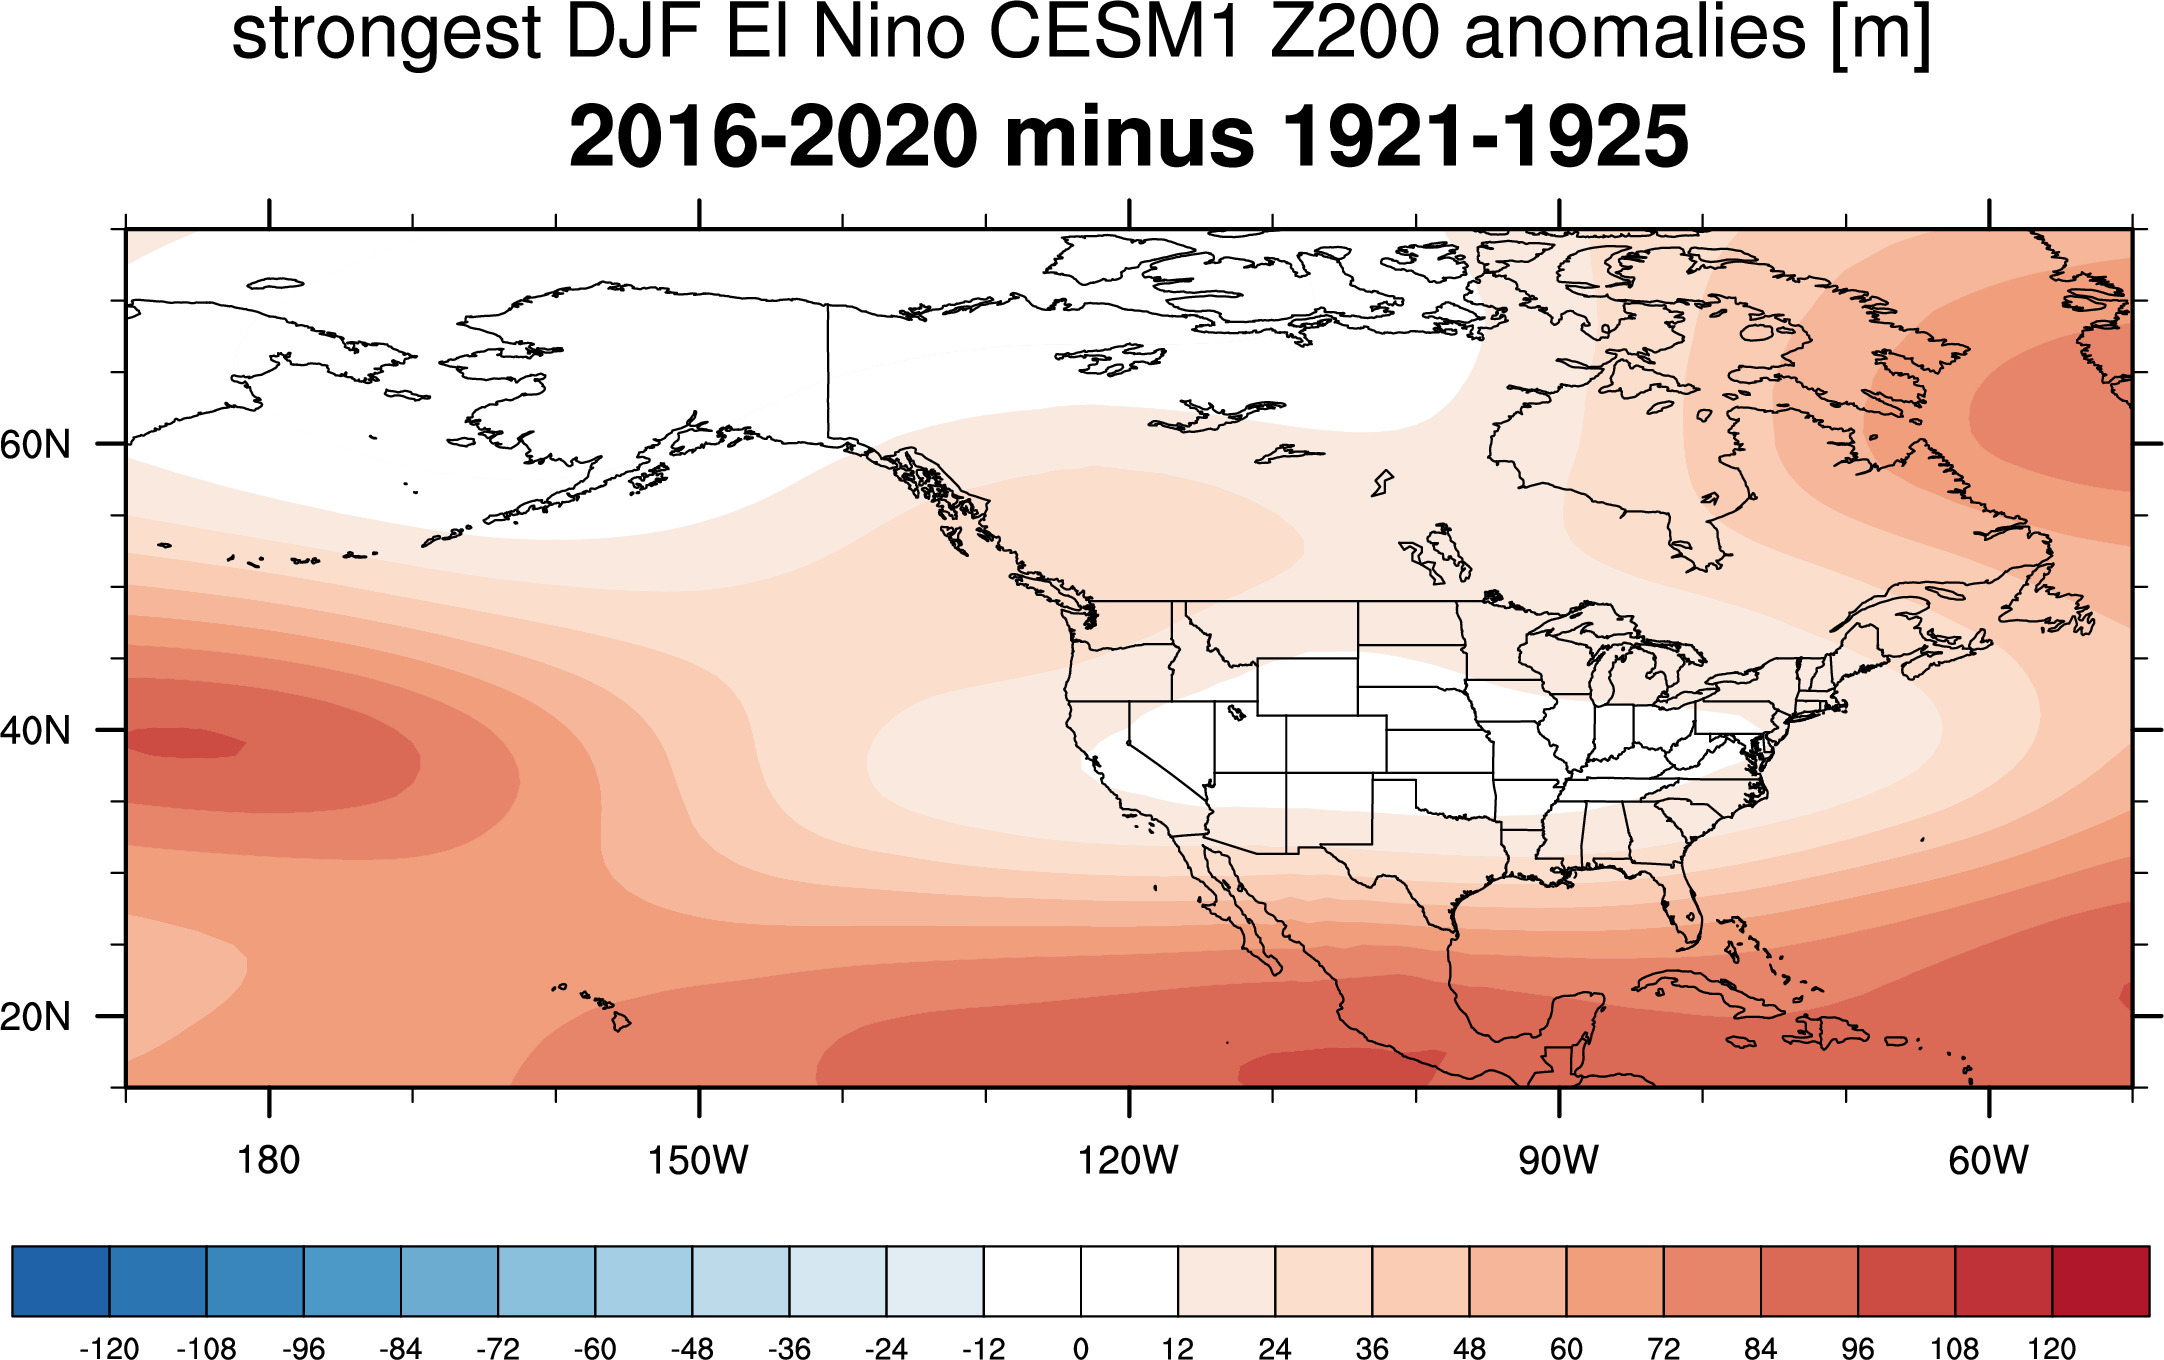
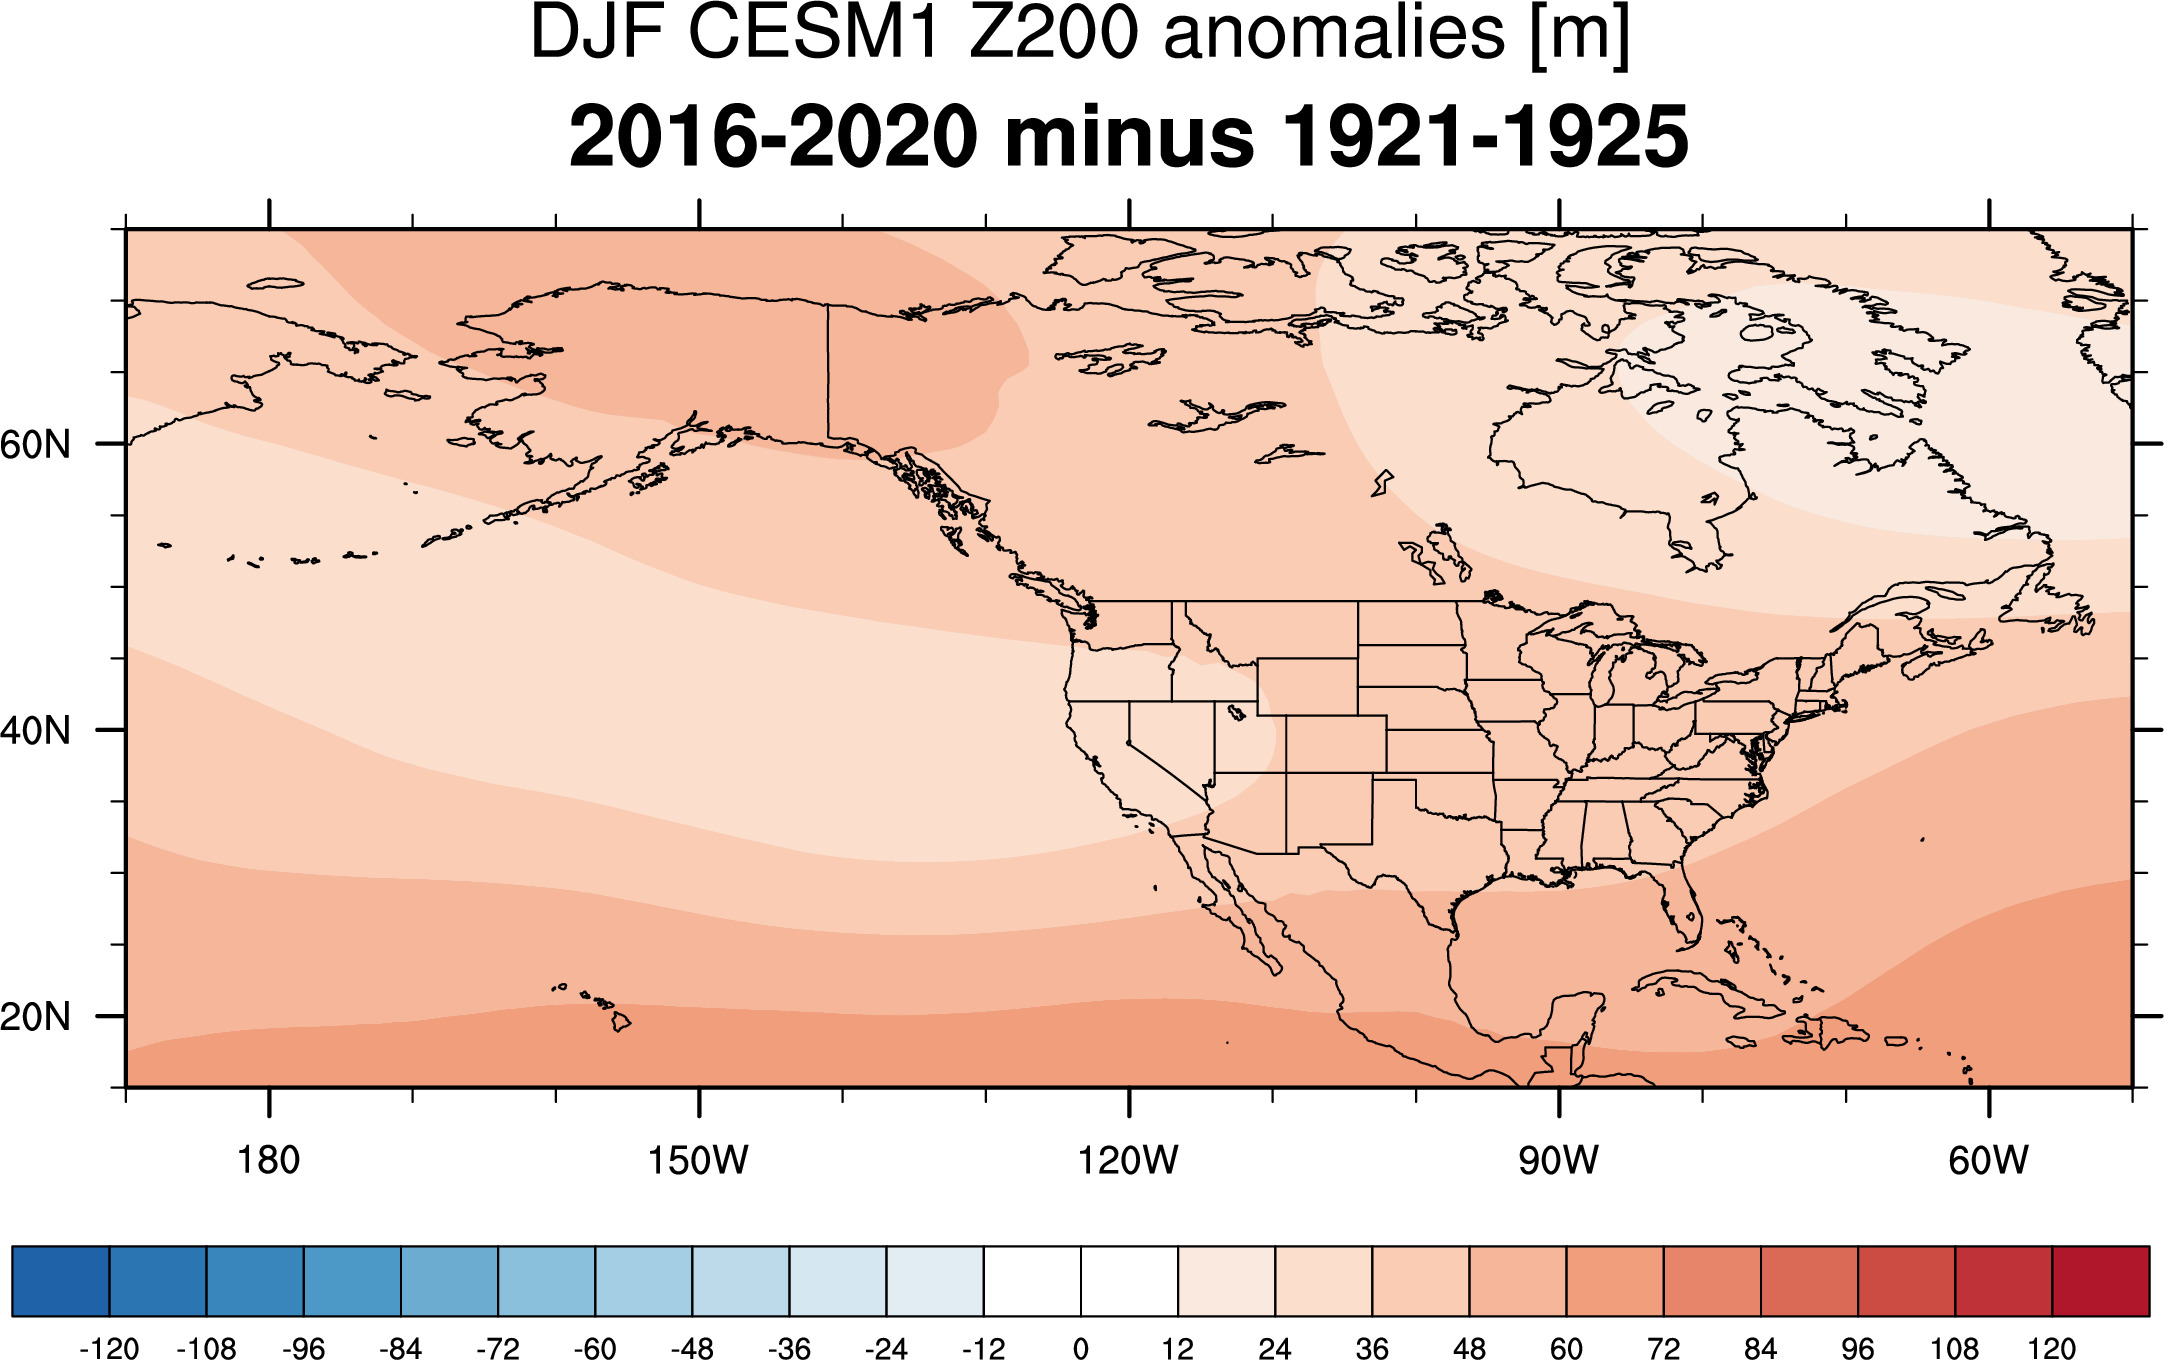
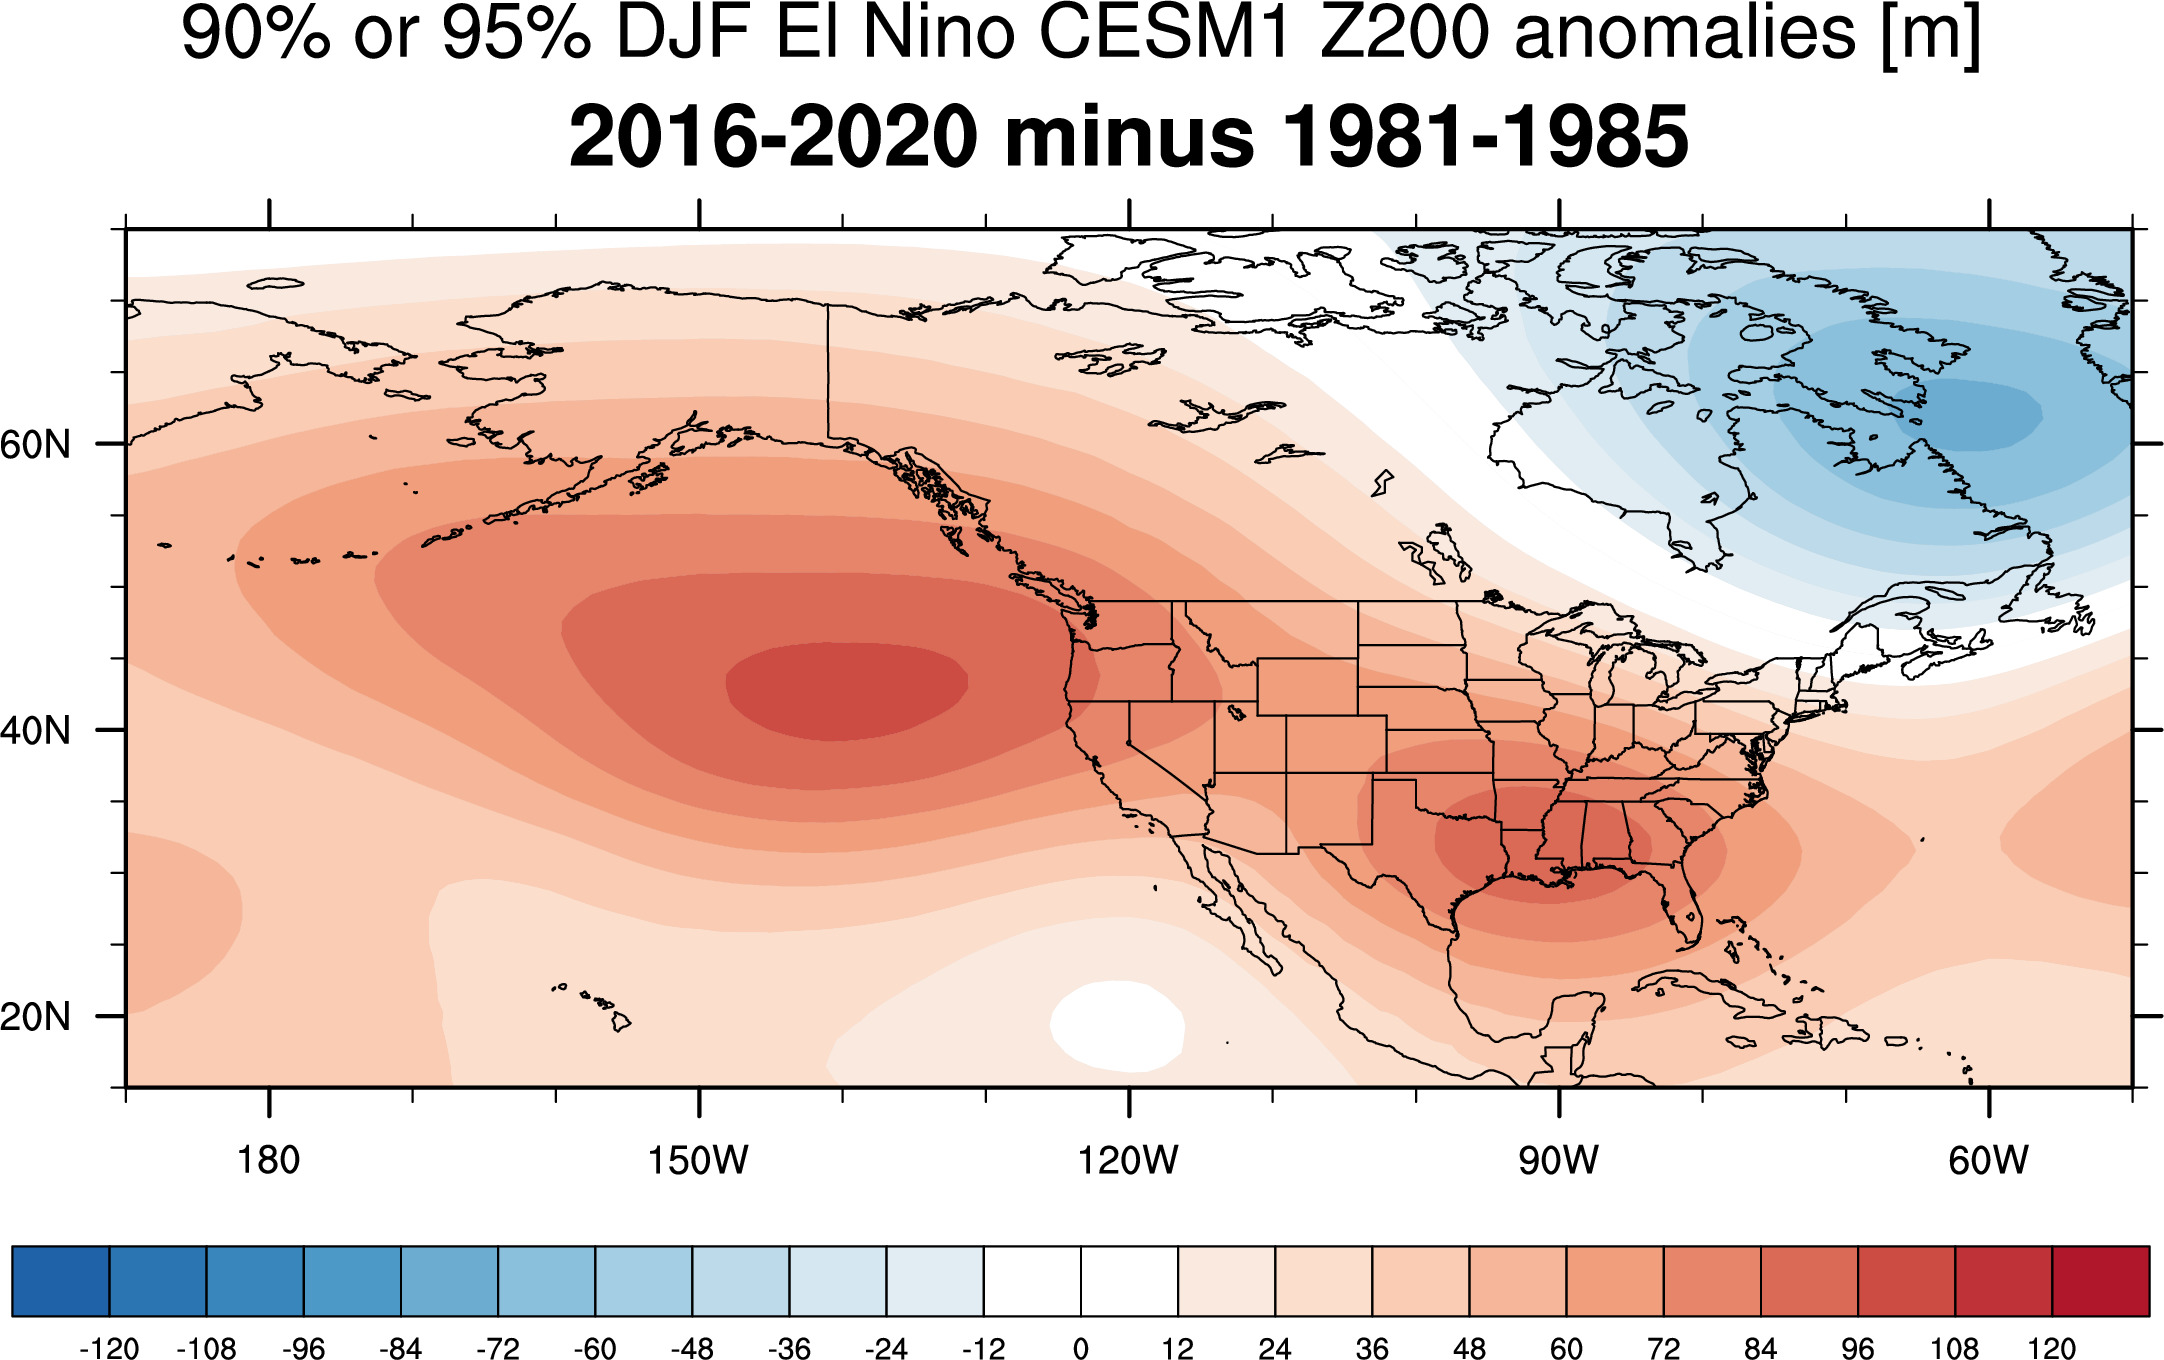
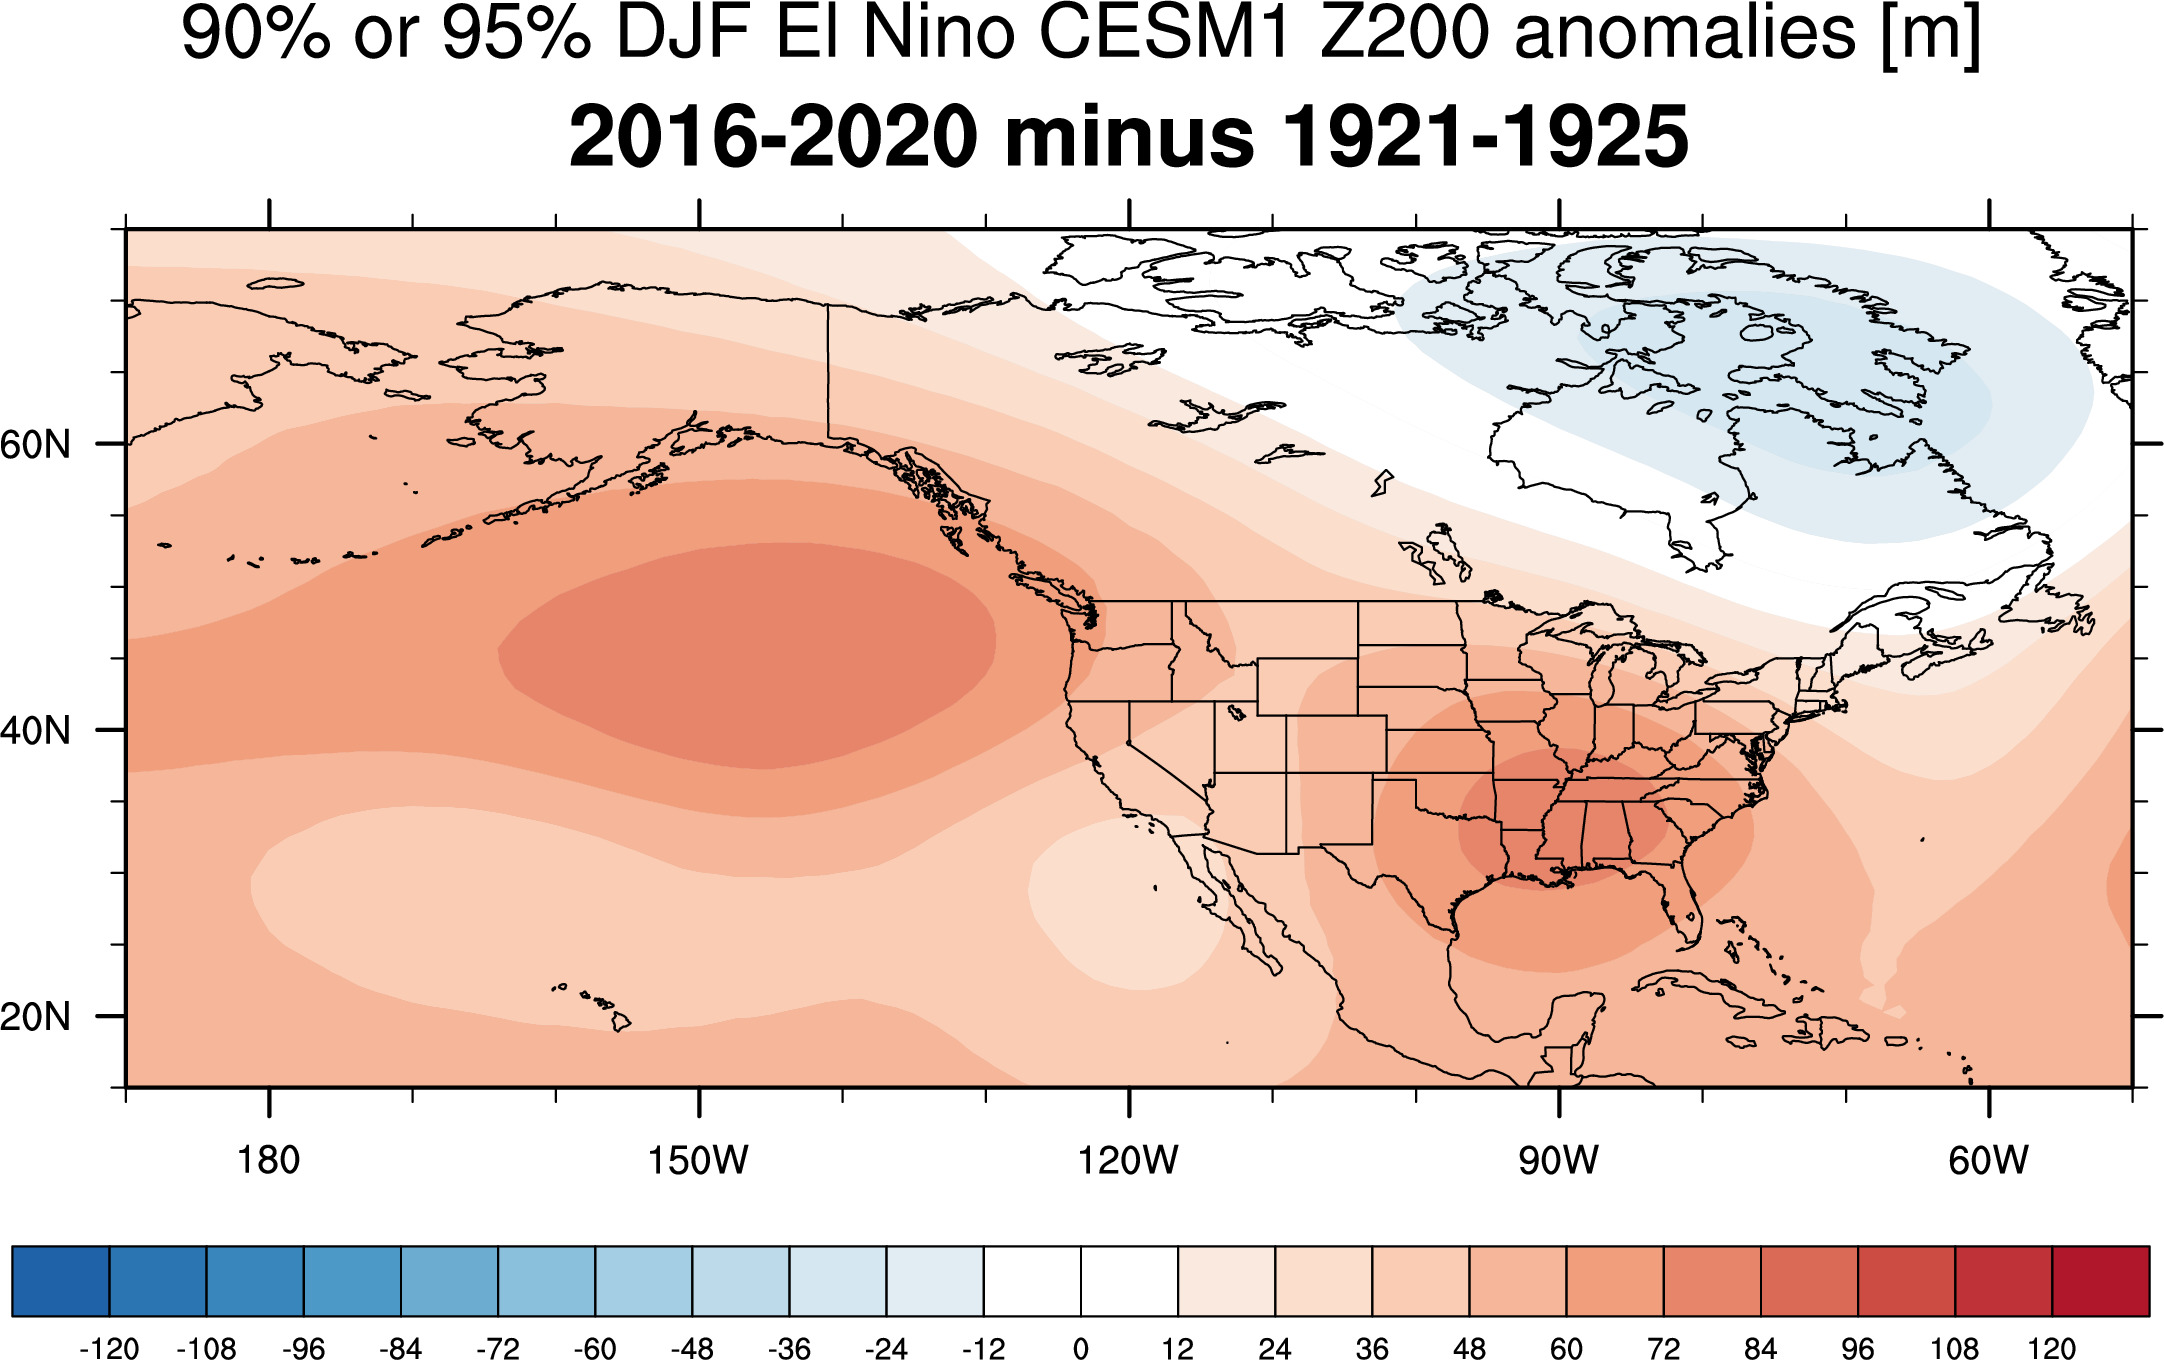
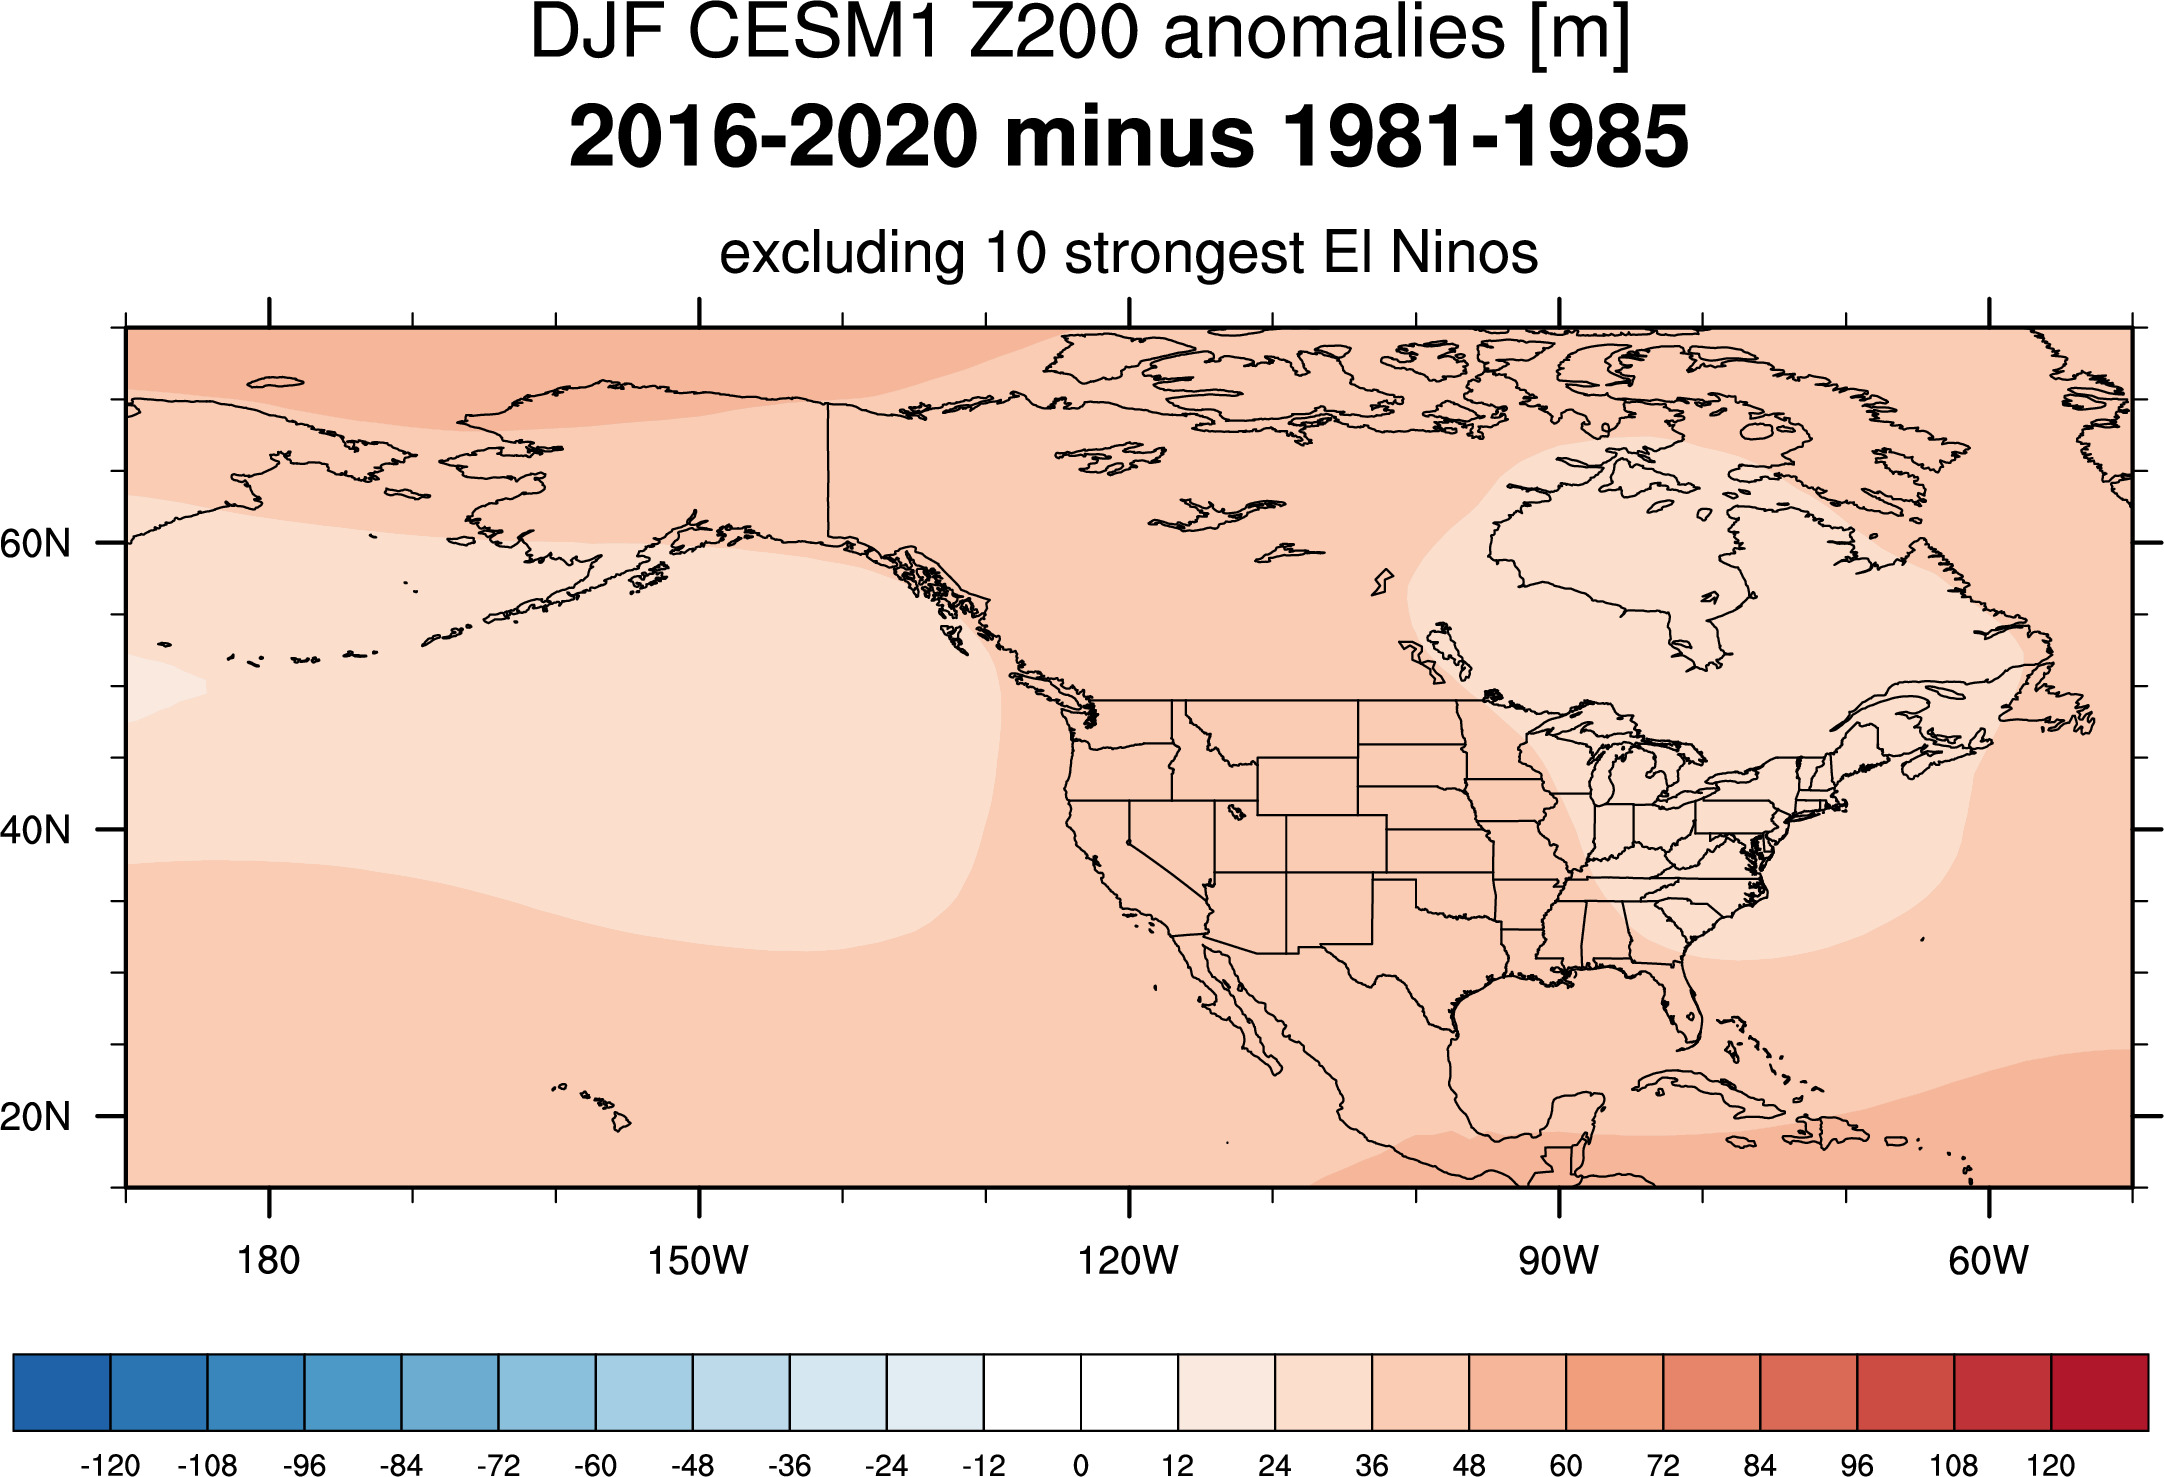
200mb Height anomaly maps


Differences
-------------------------------------------------------------------------------------------------------------
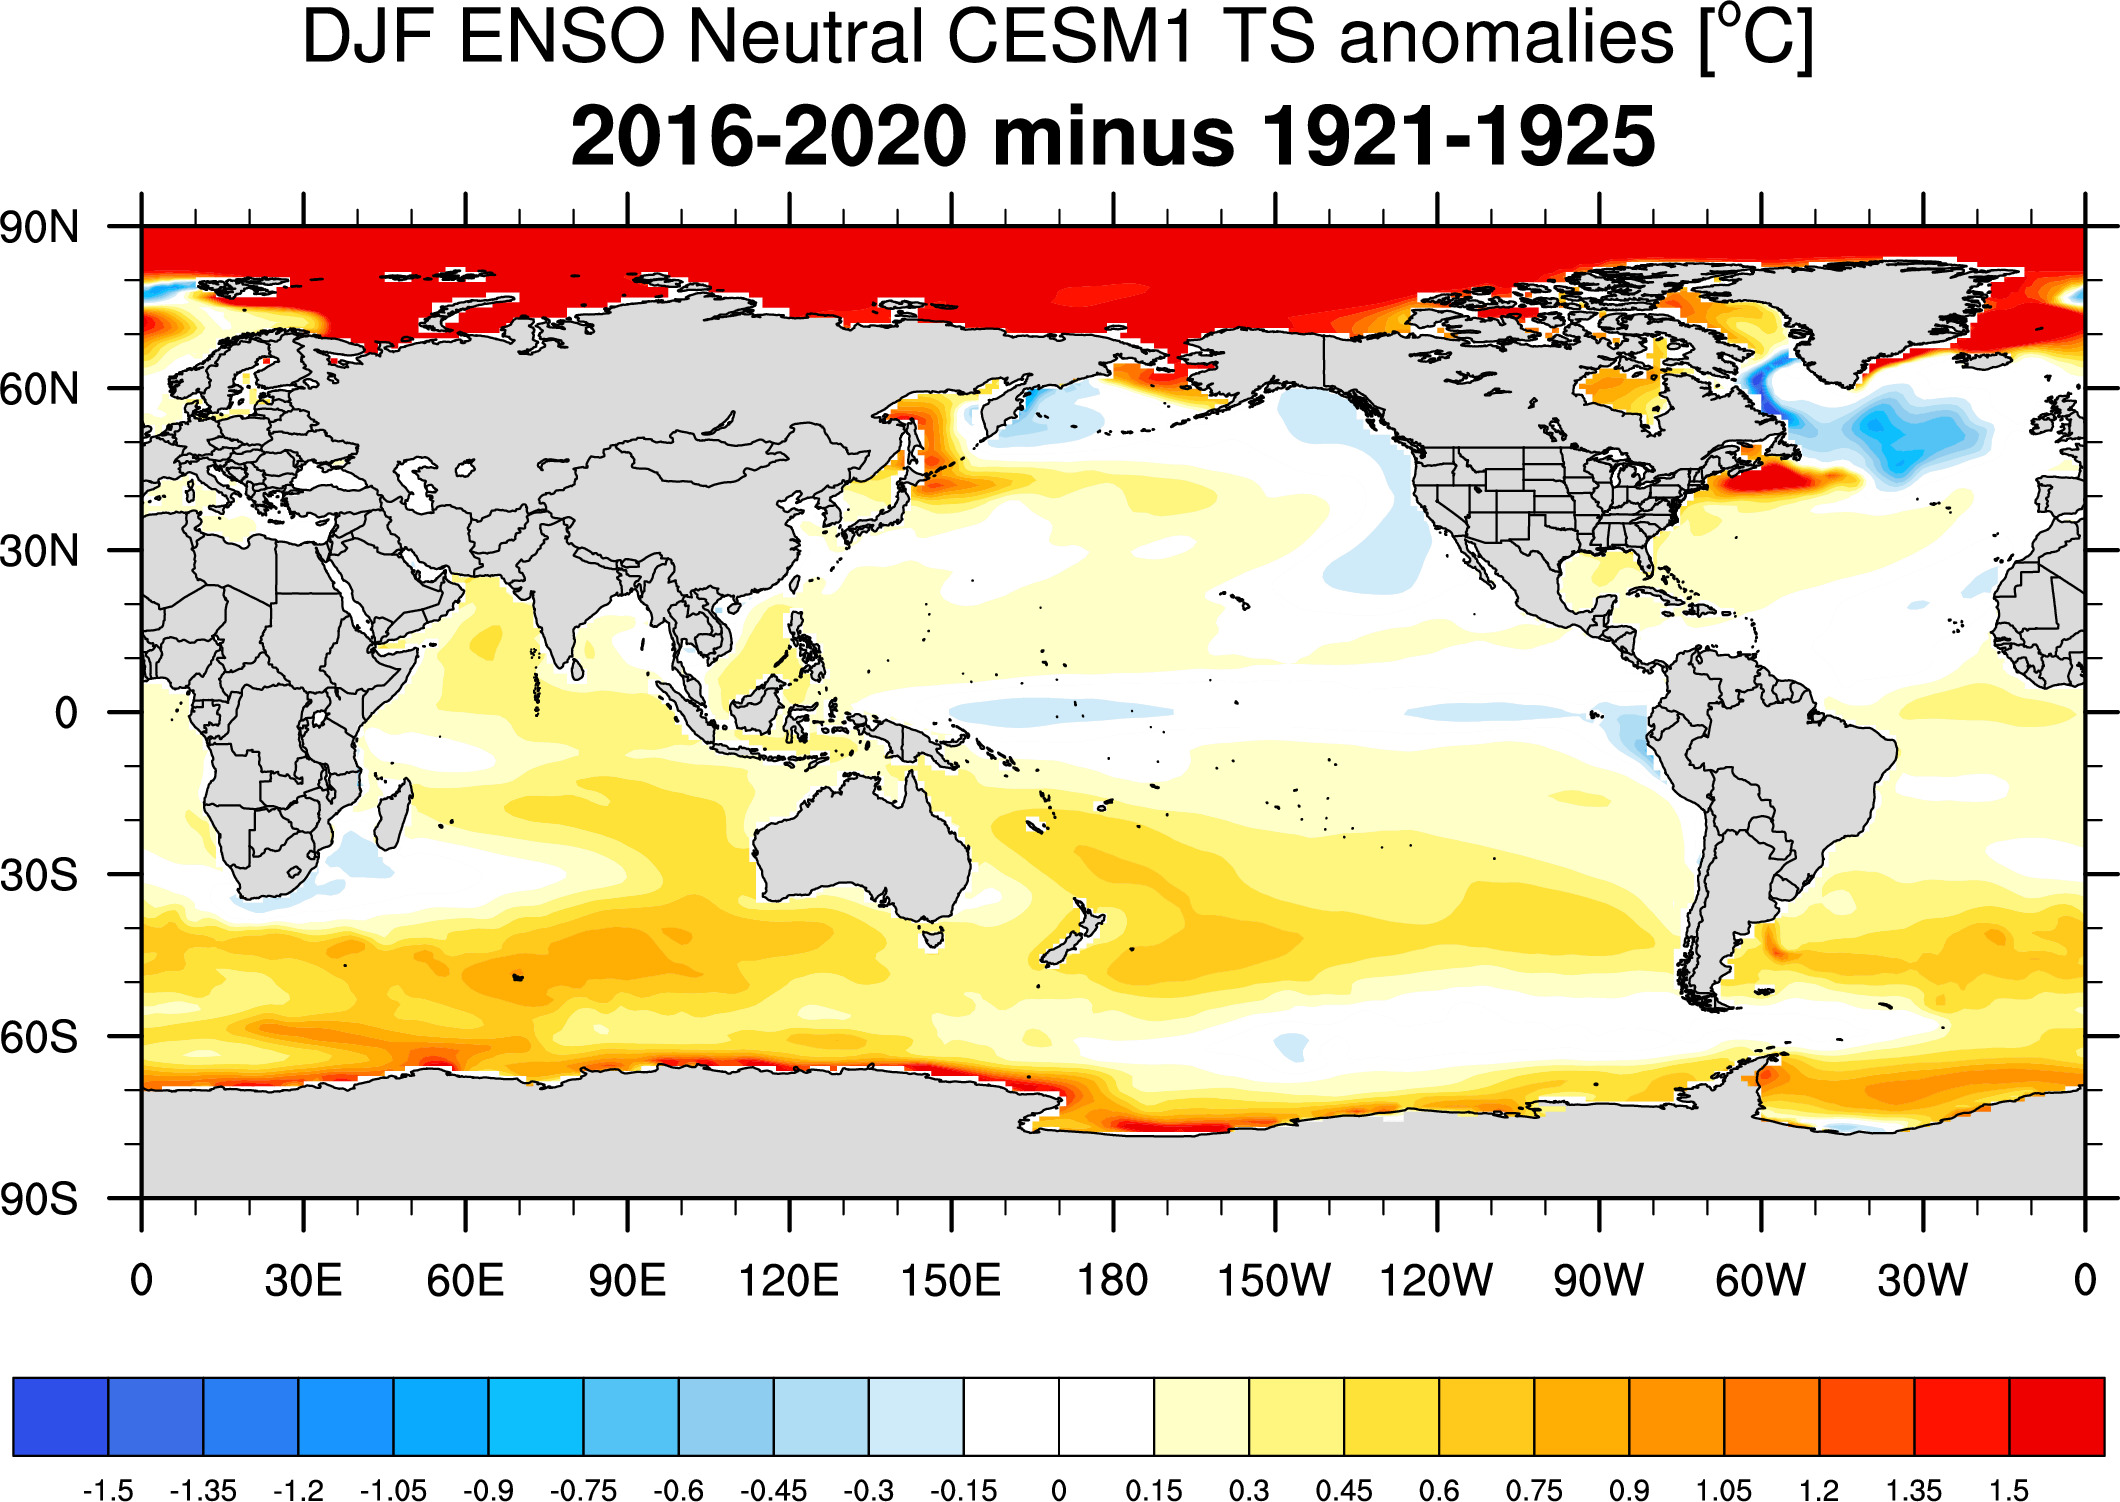
Different ENSO regimes
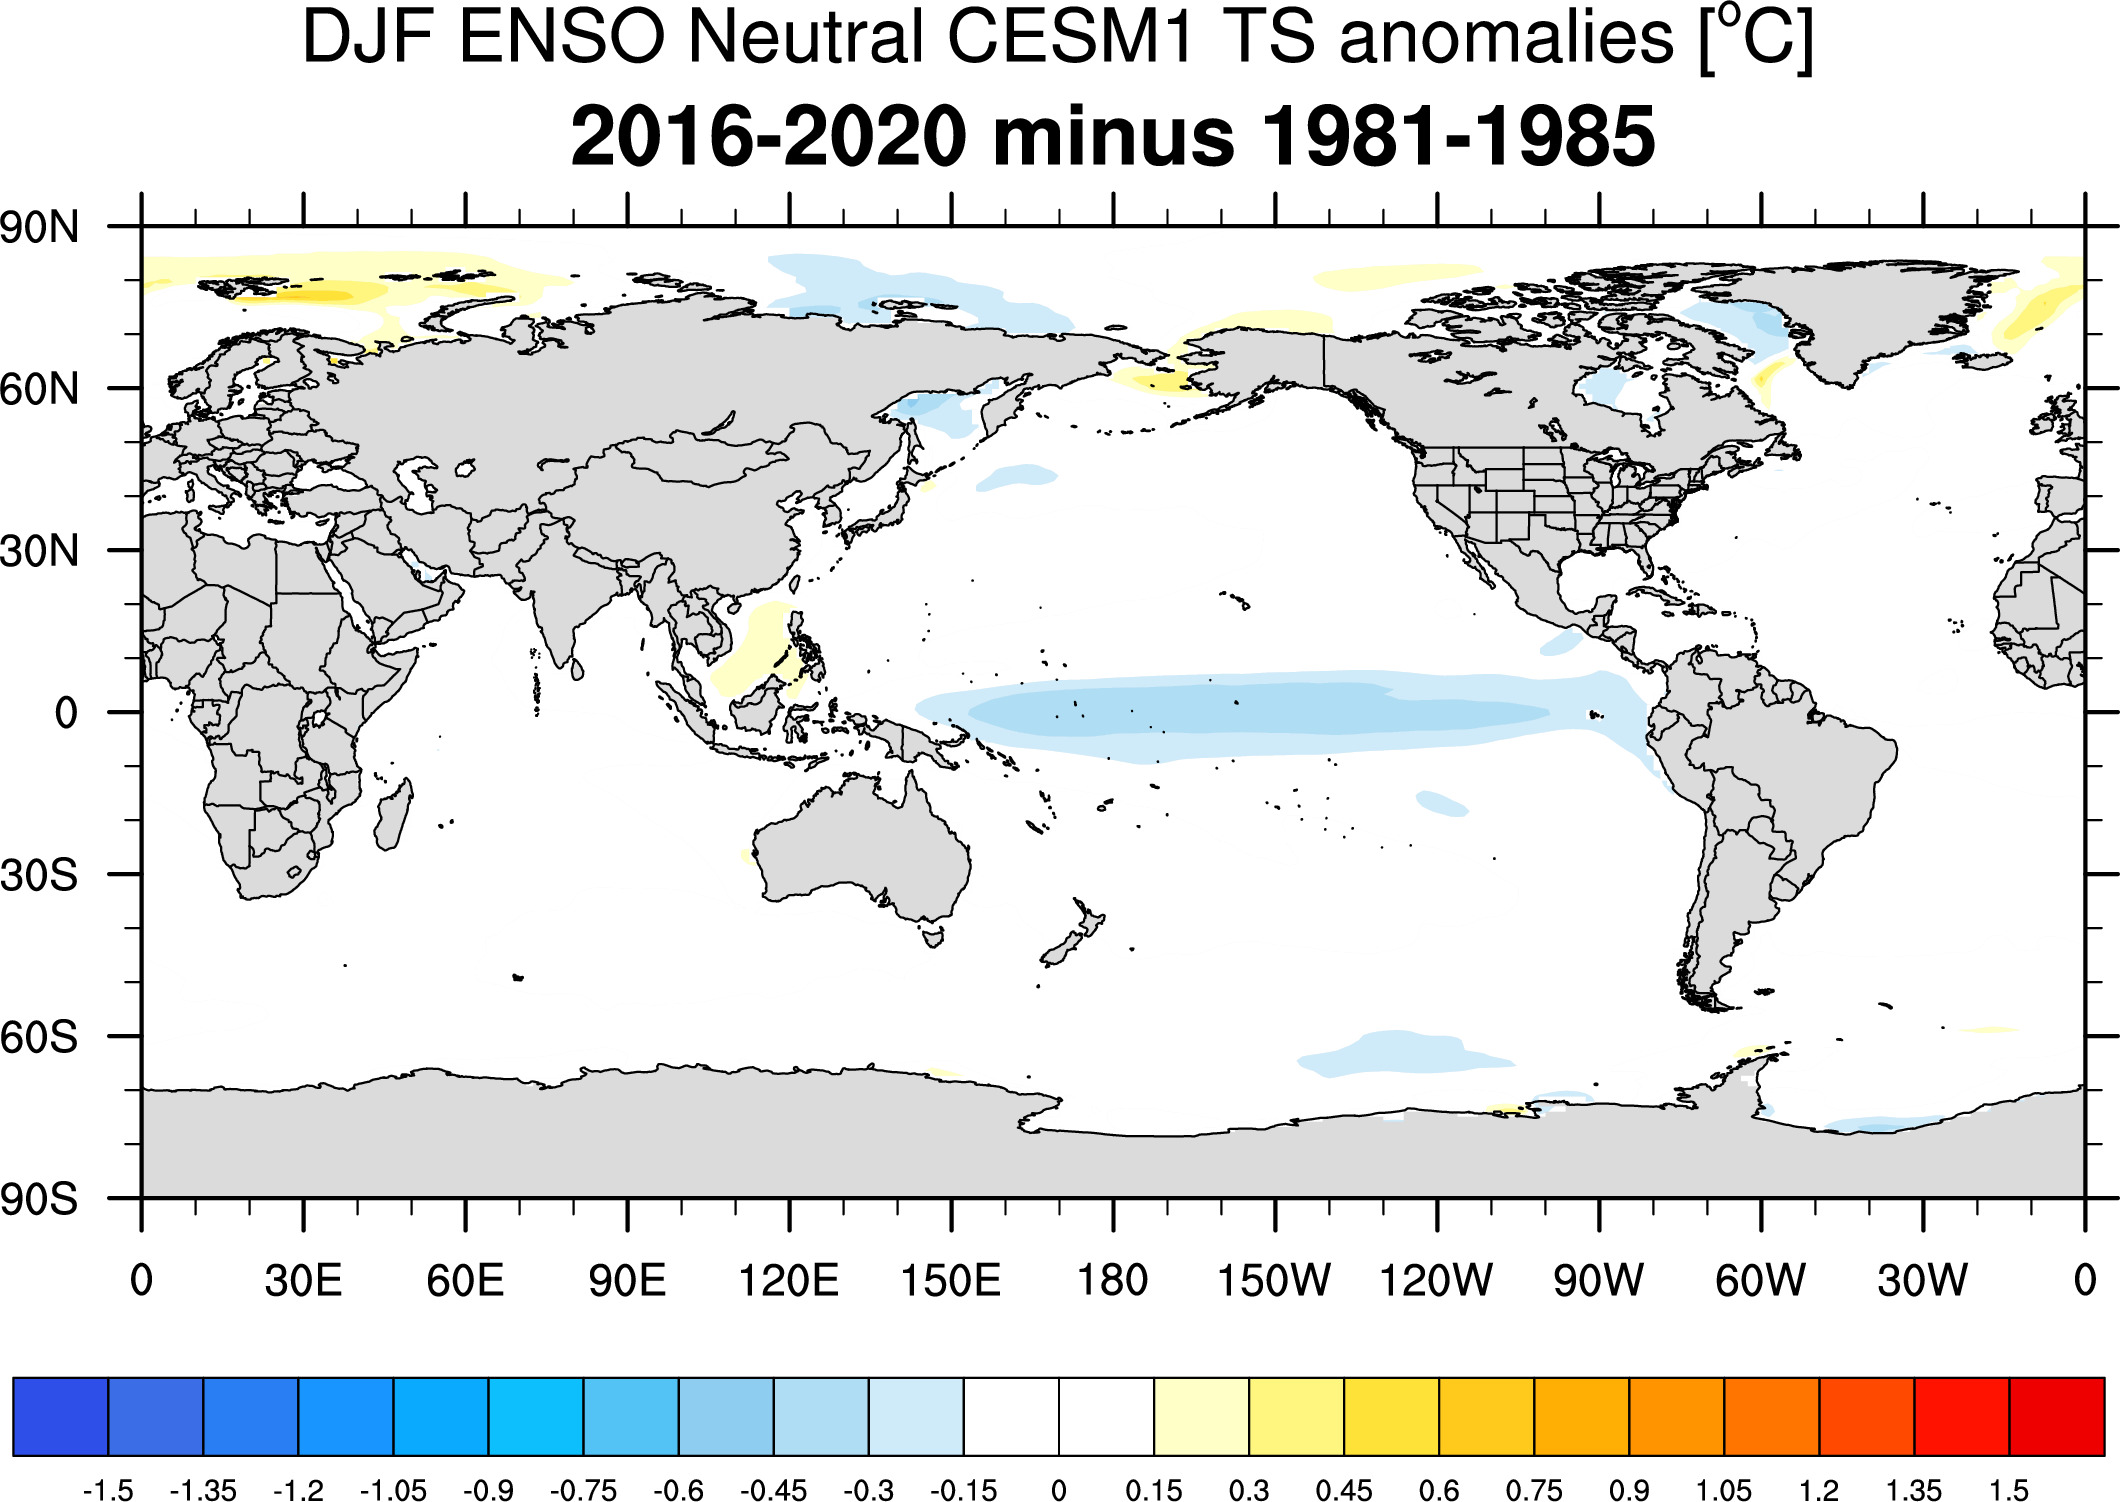
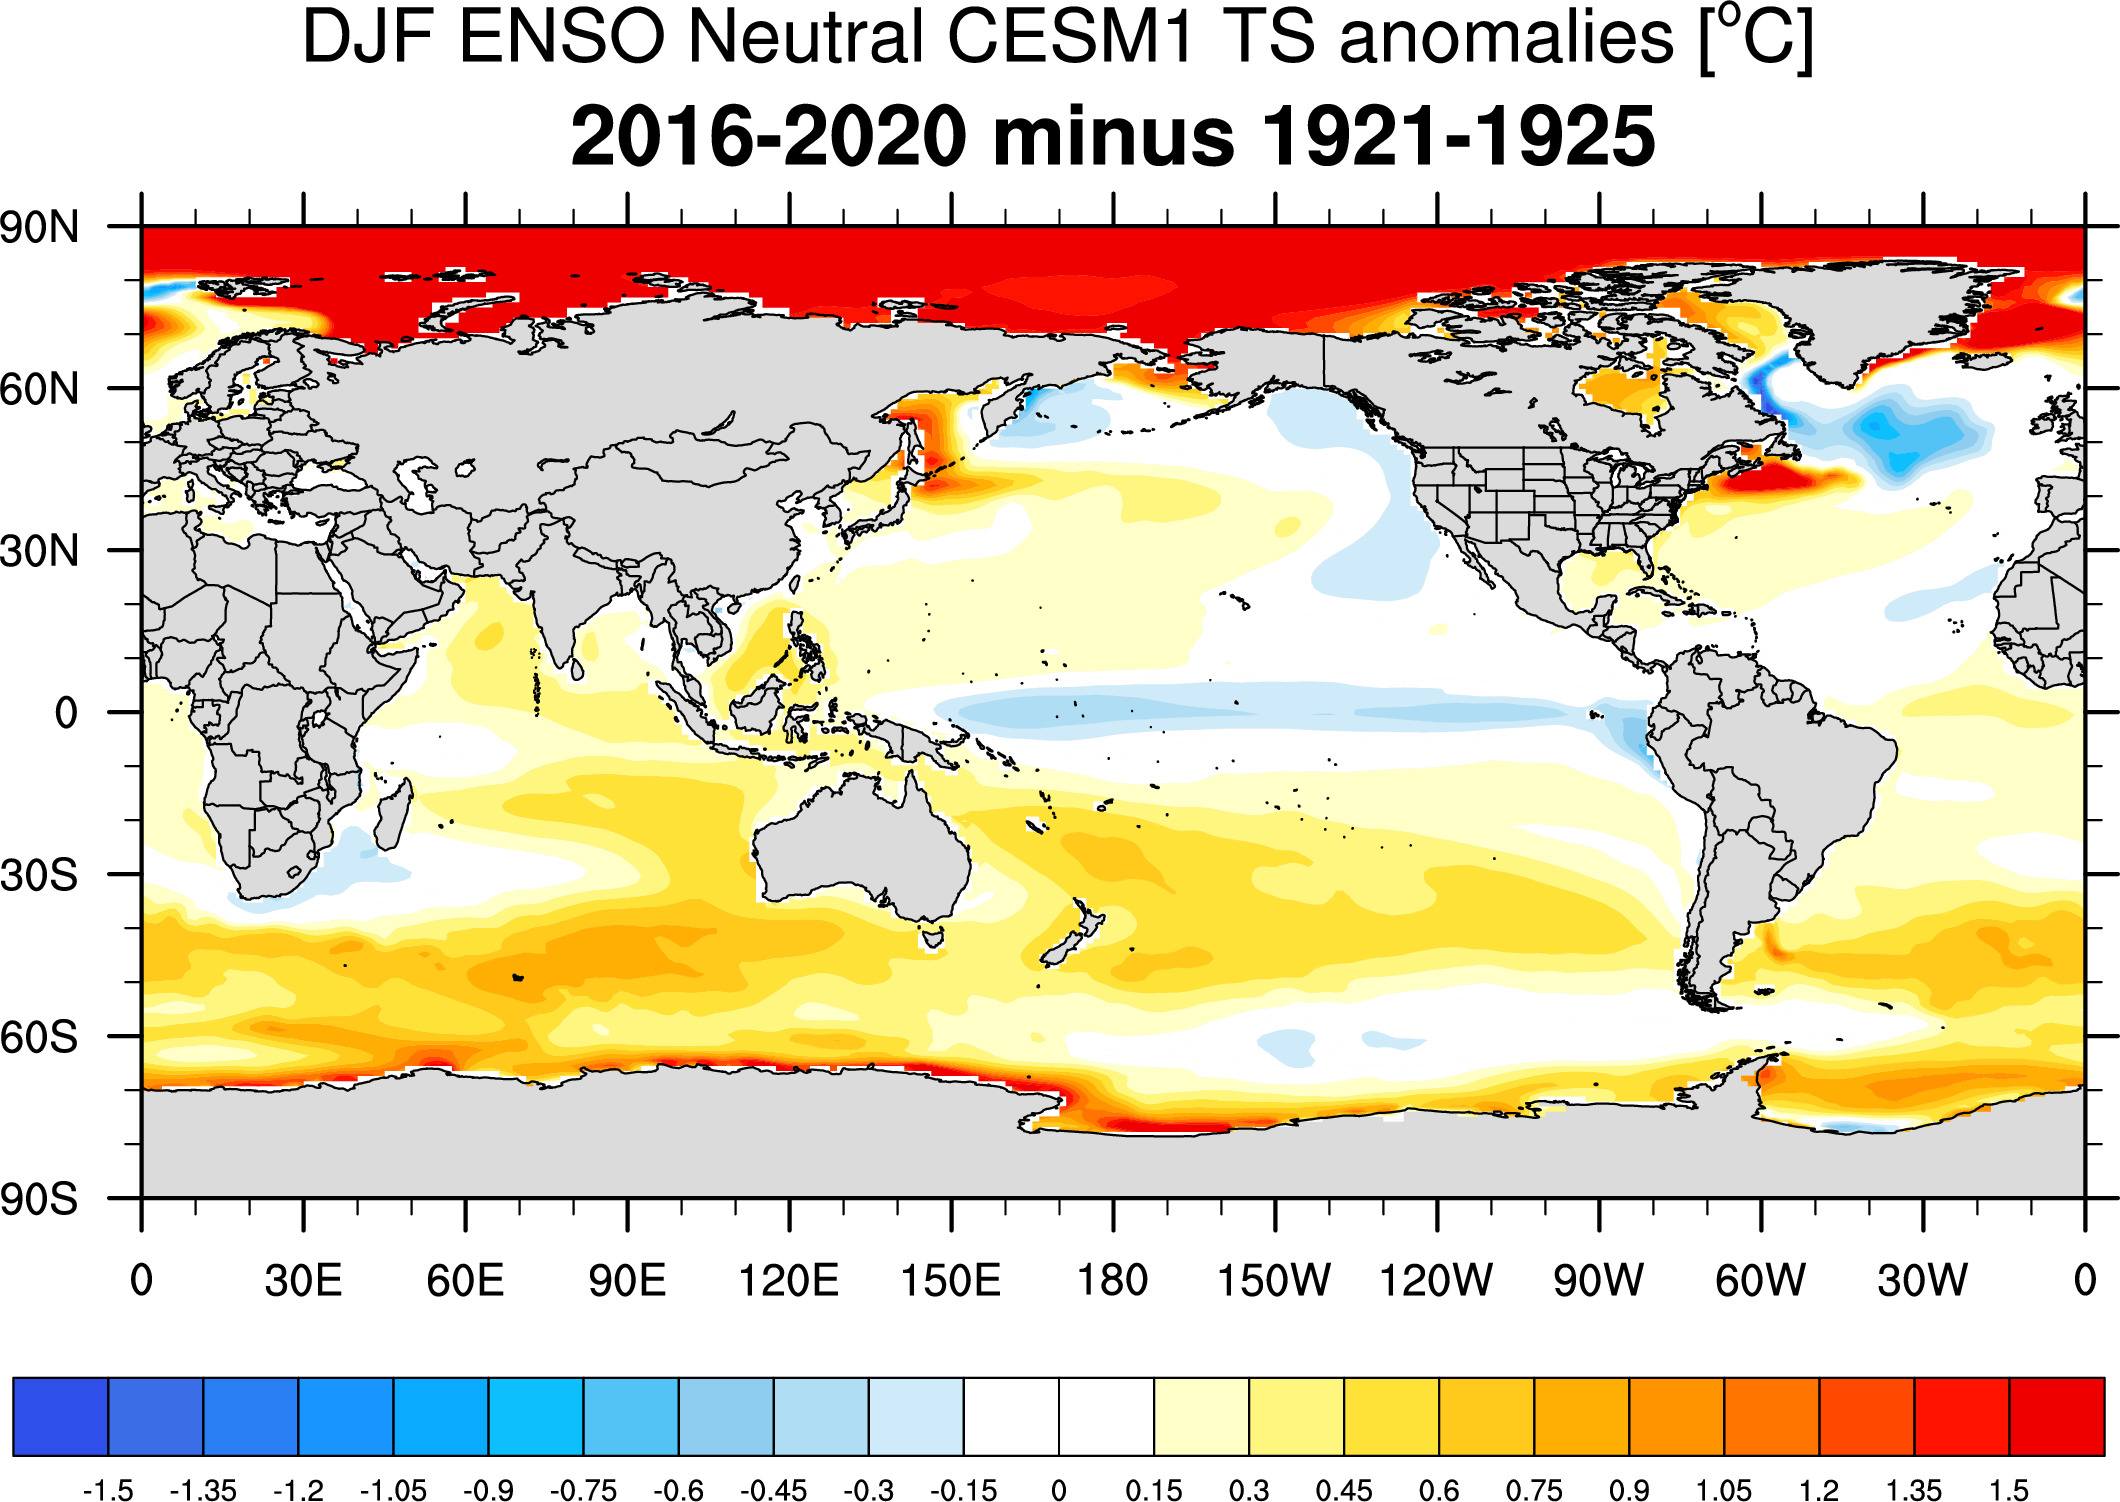
ENSO Neutral
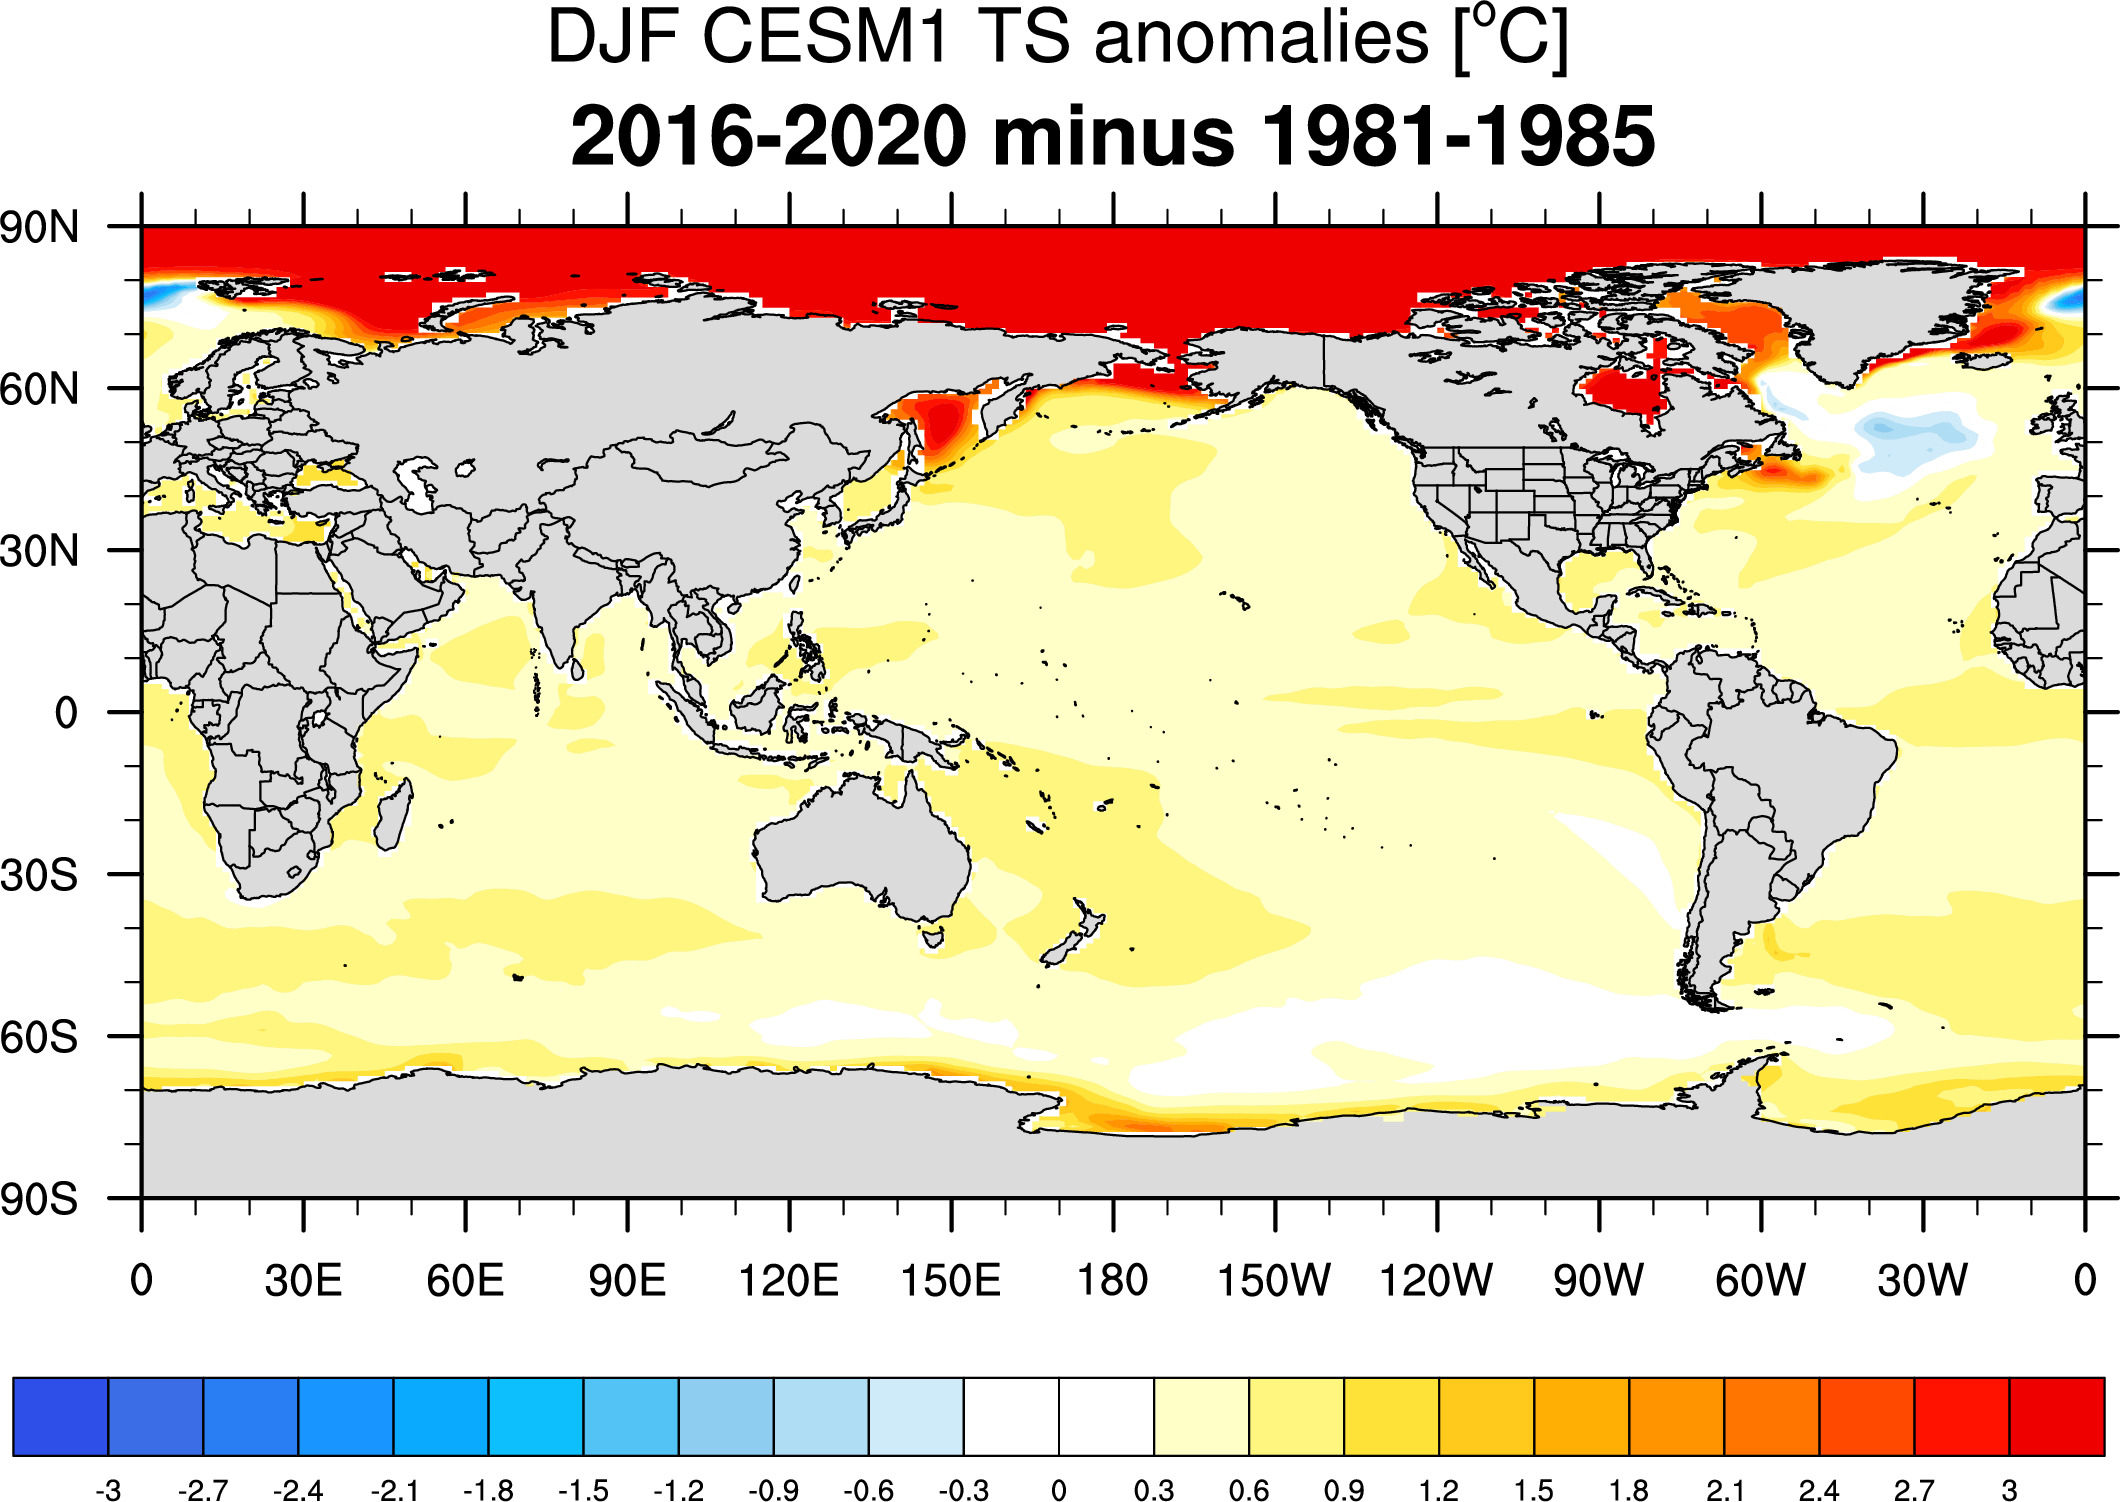
SST Anomaly Maps
Differences
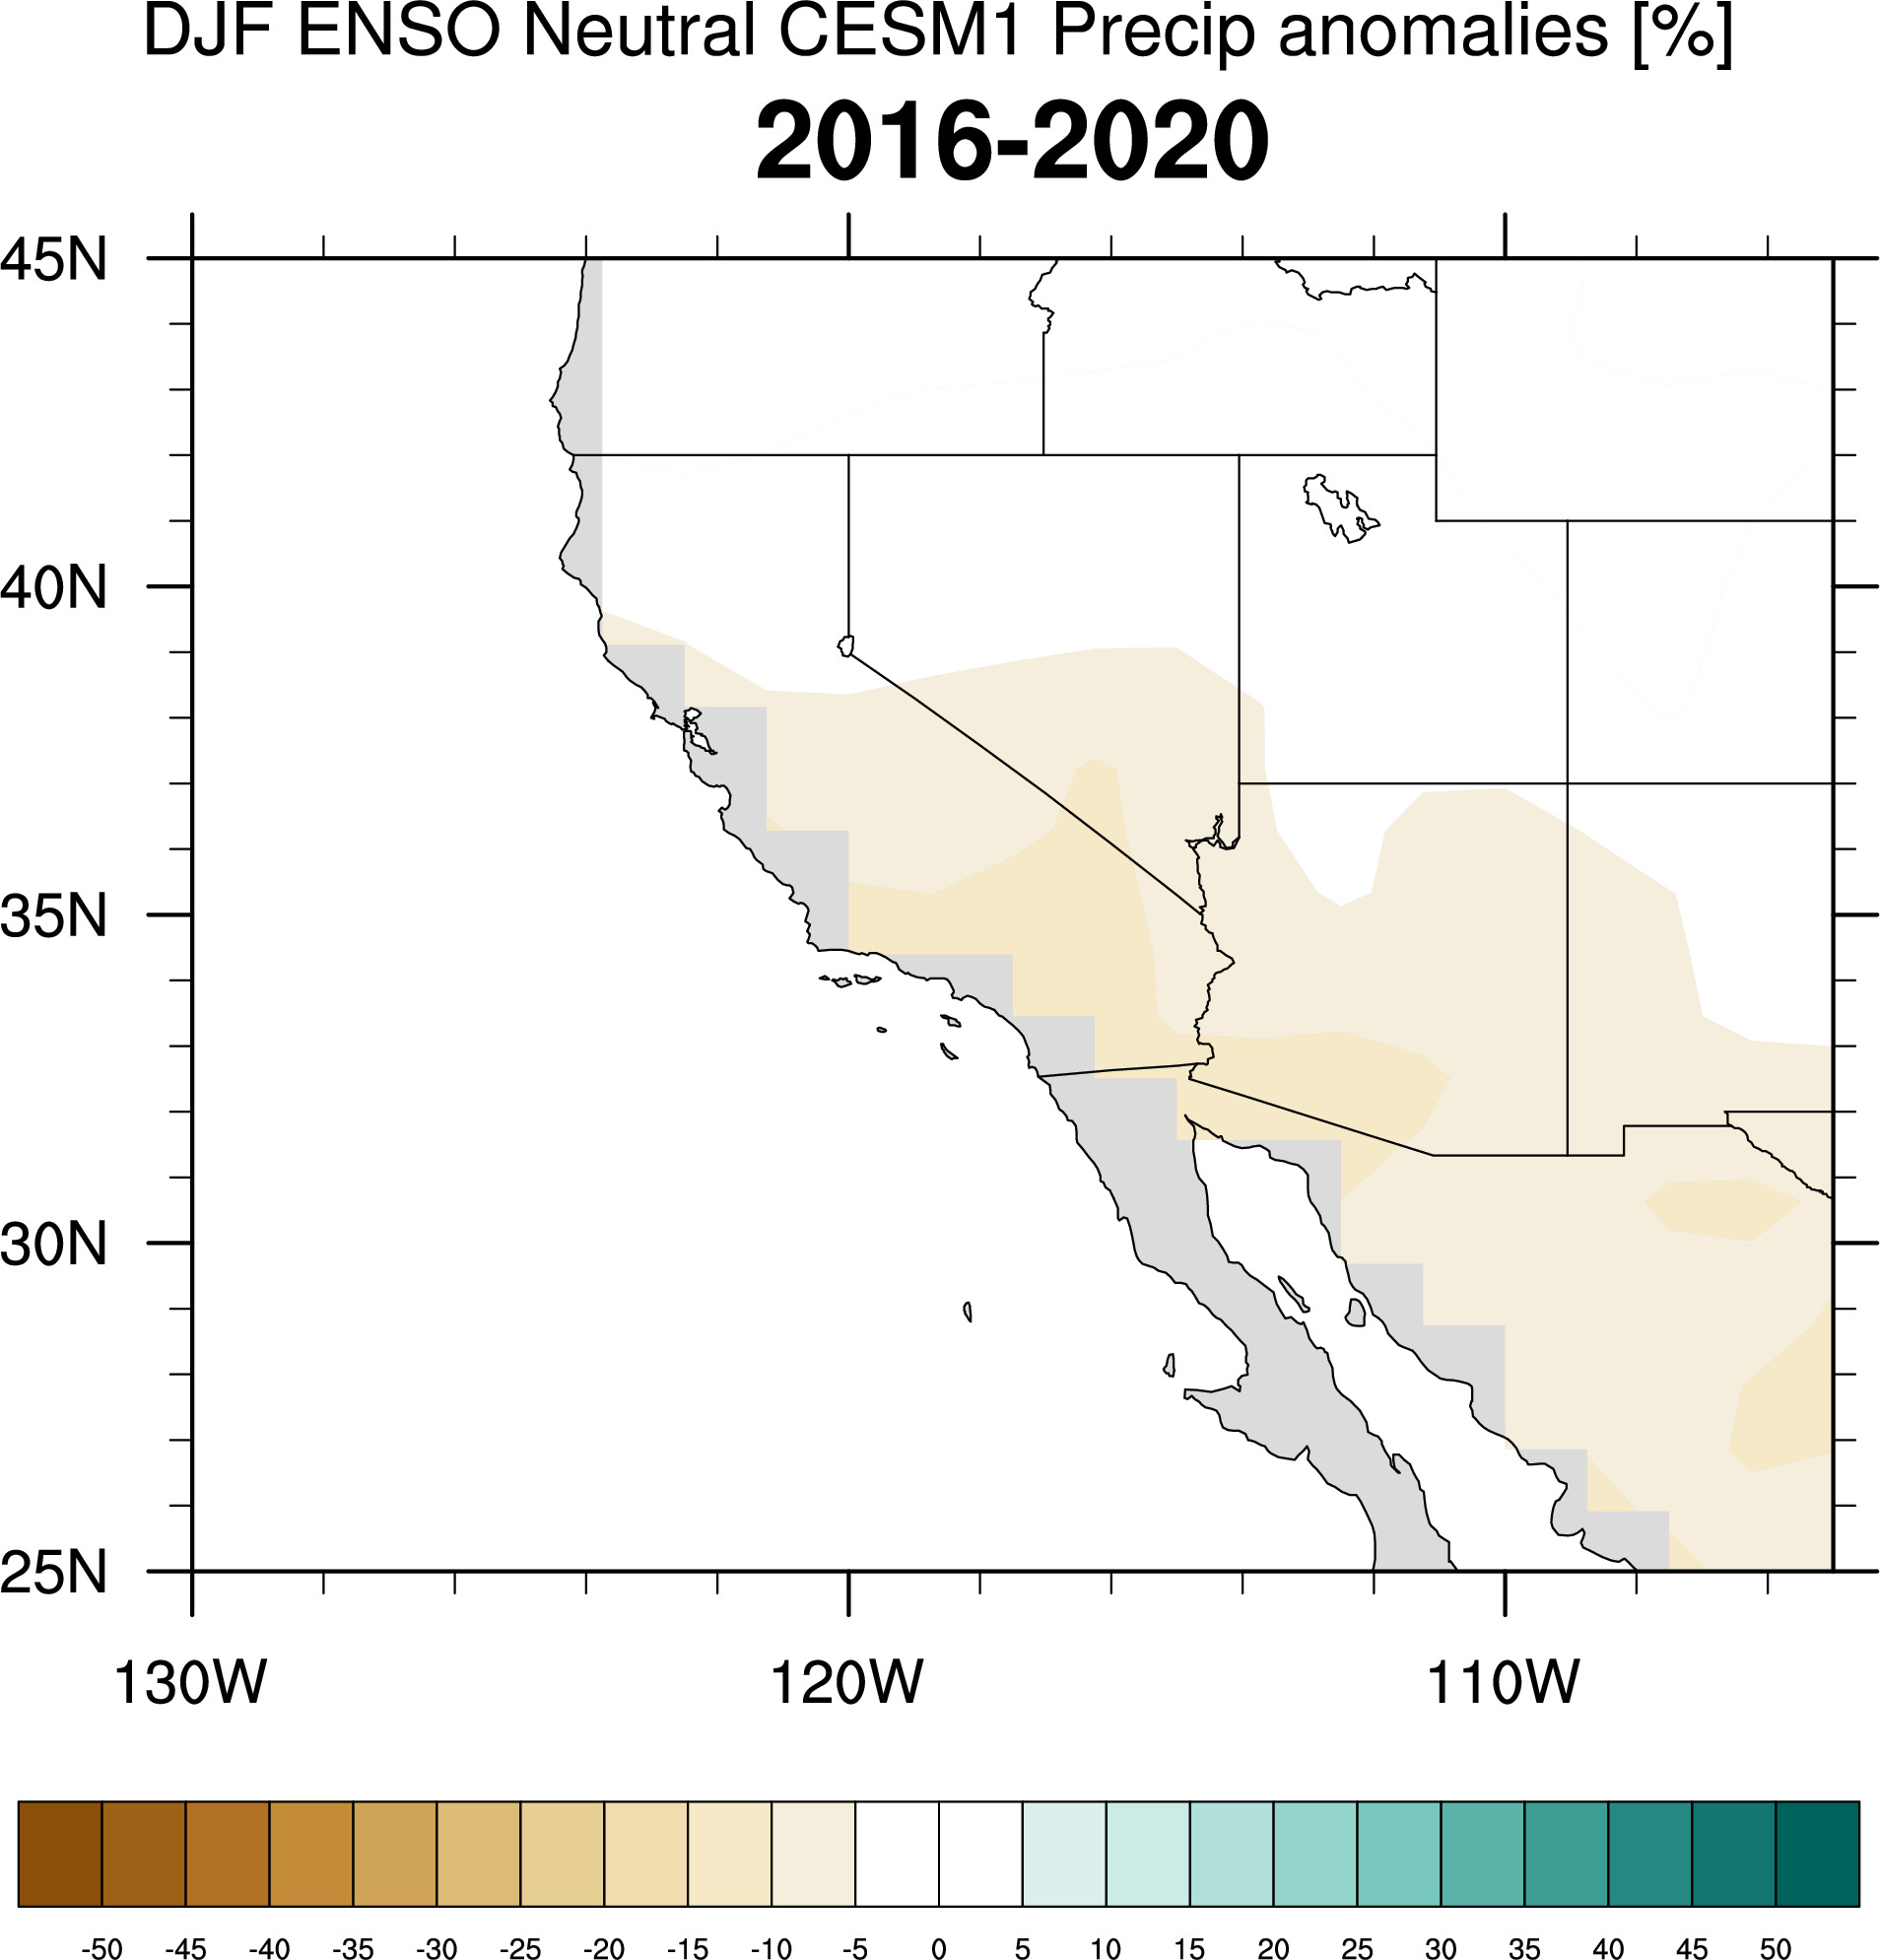
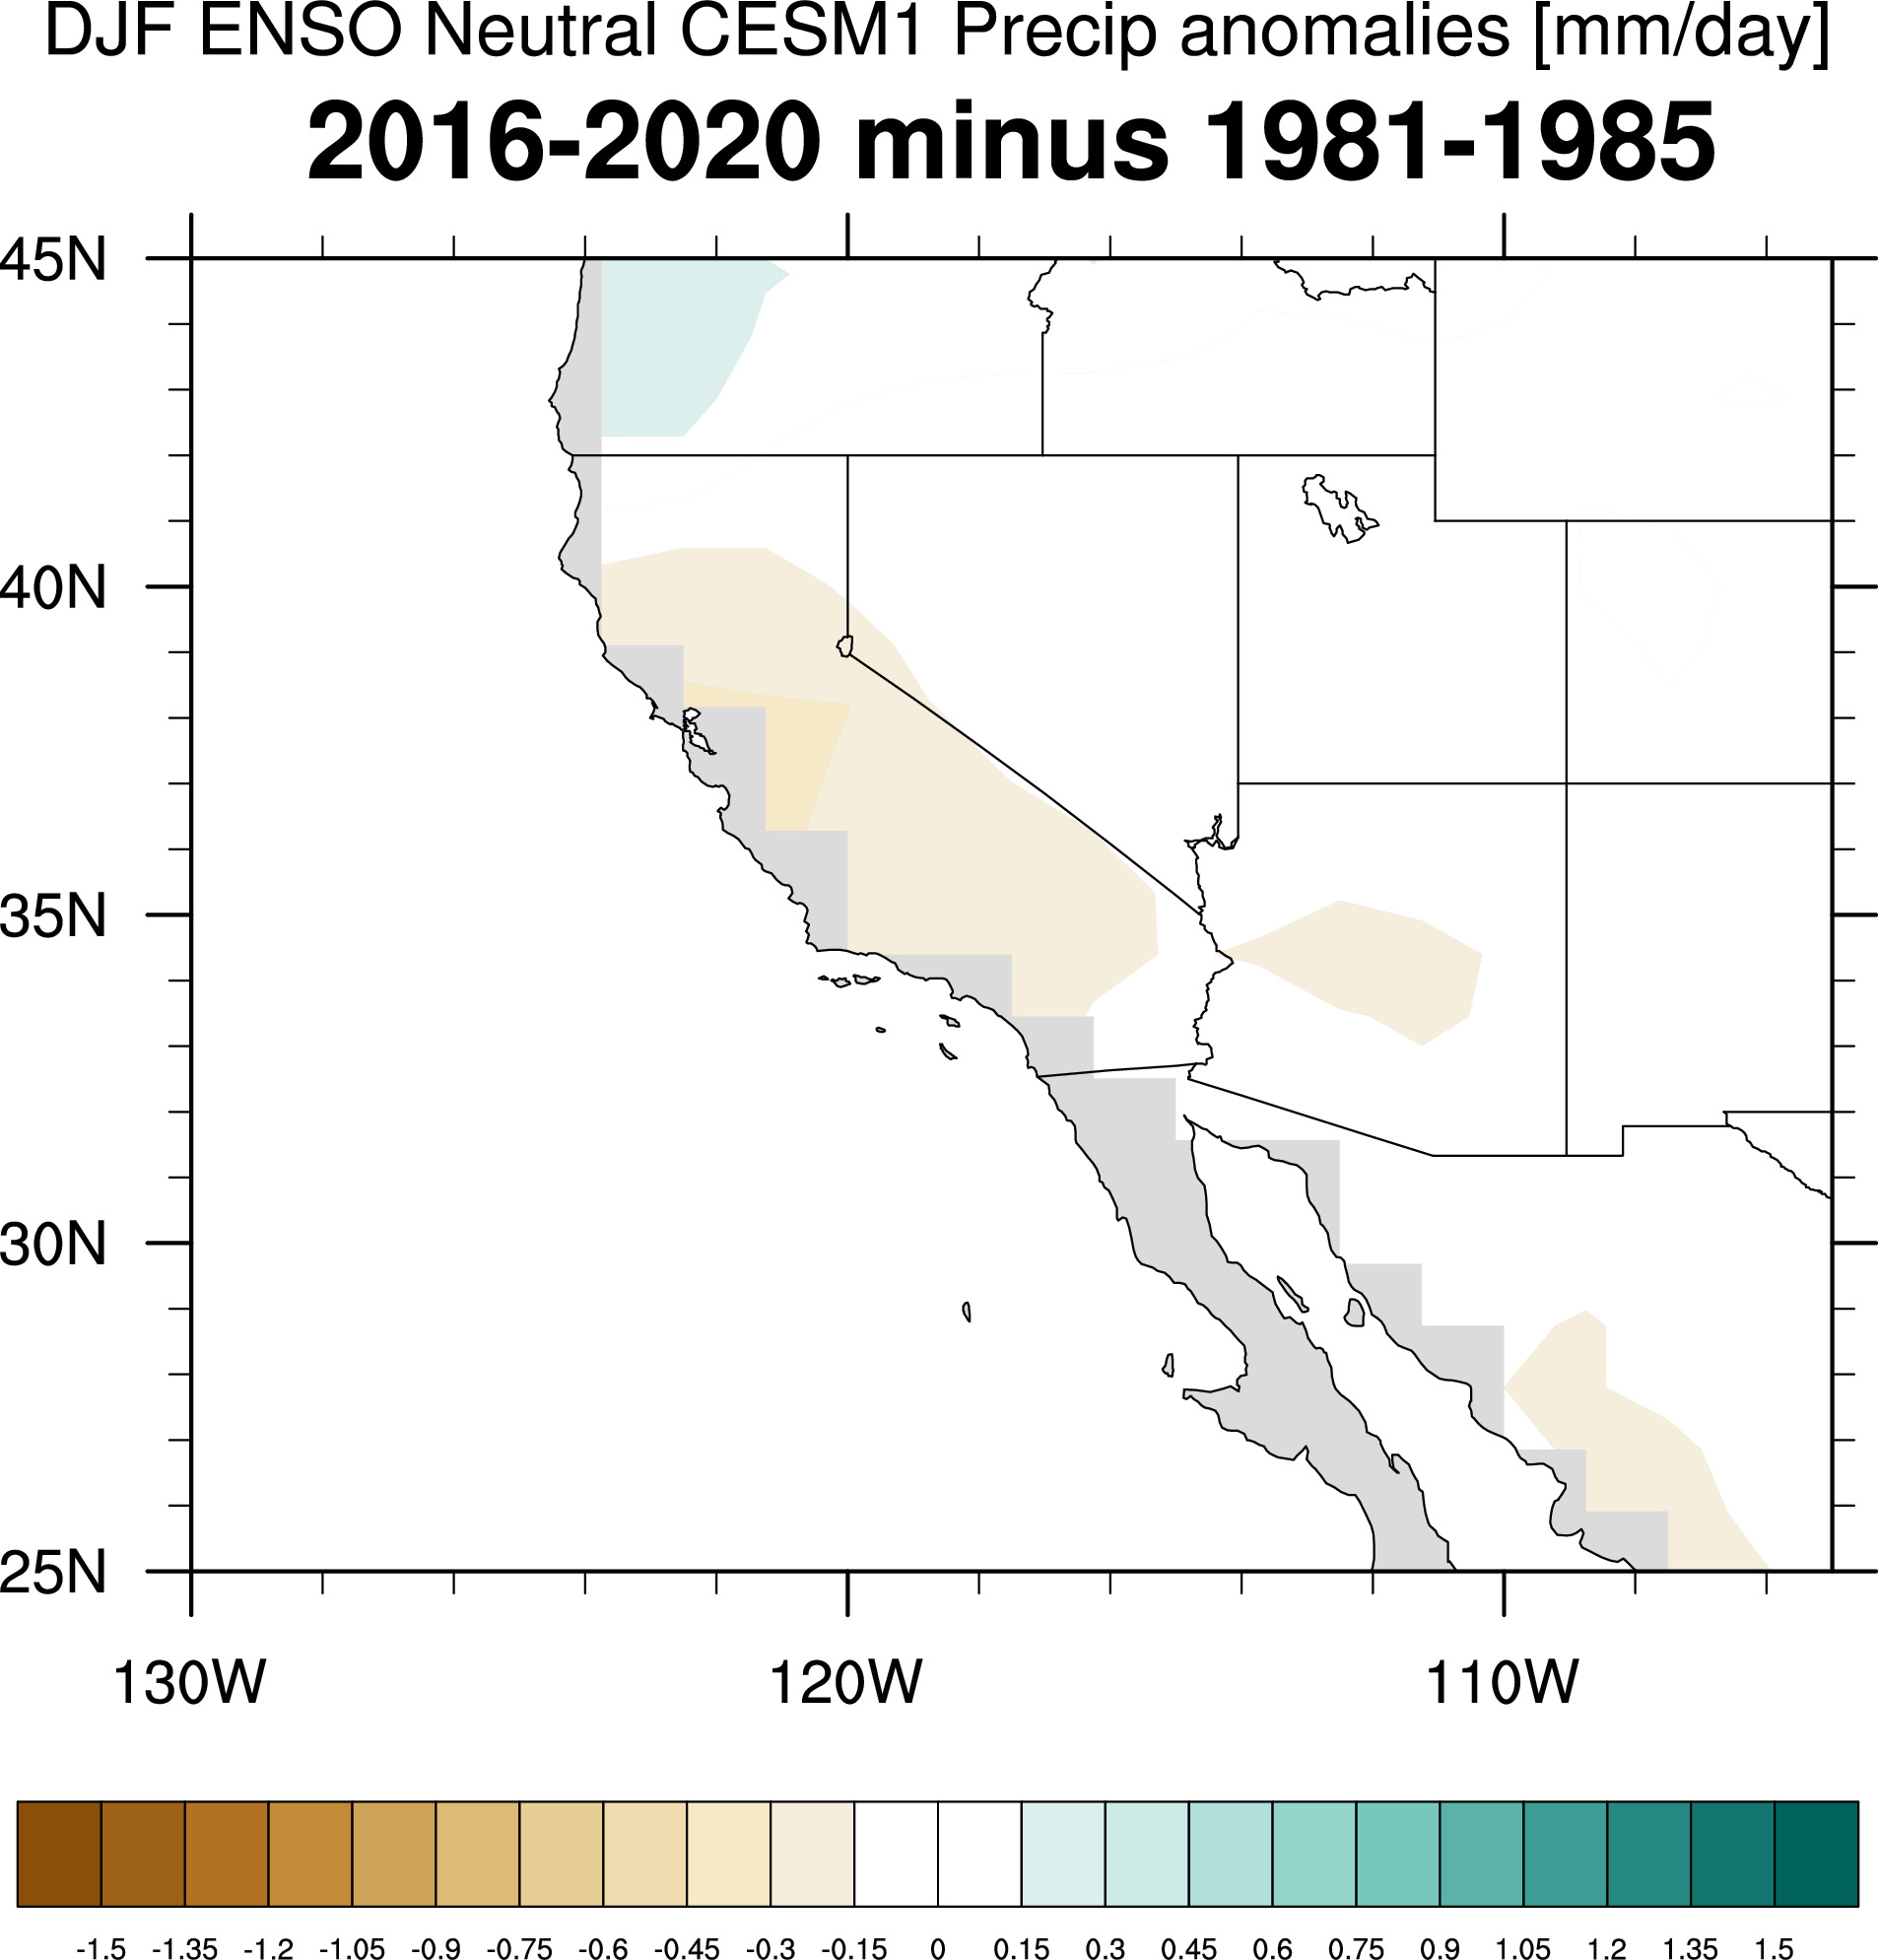
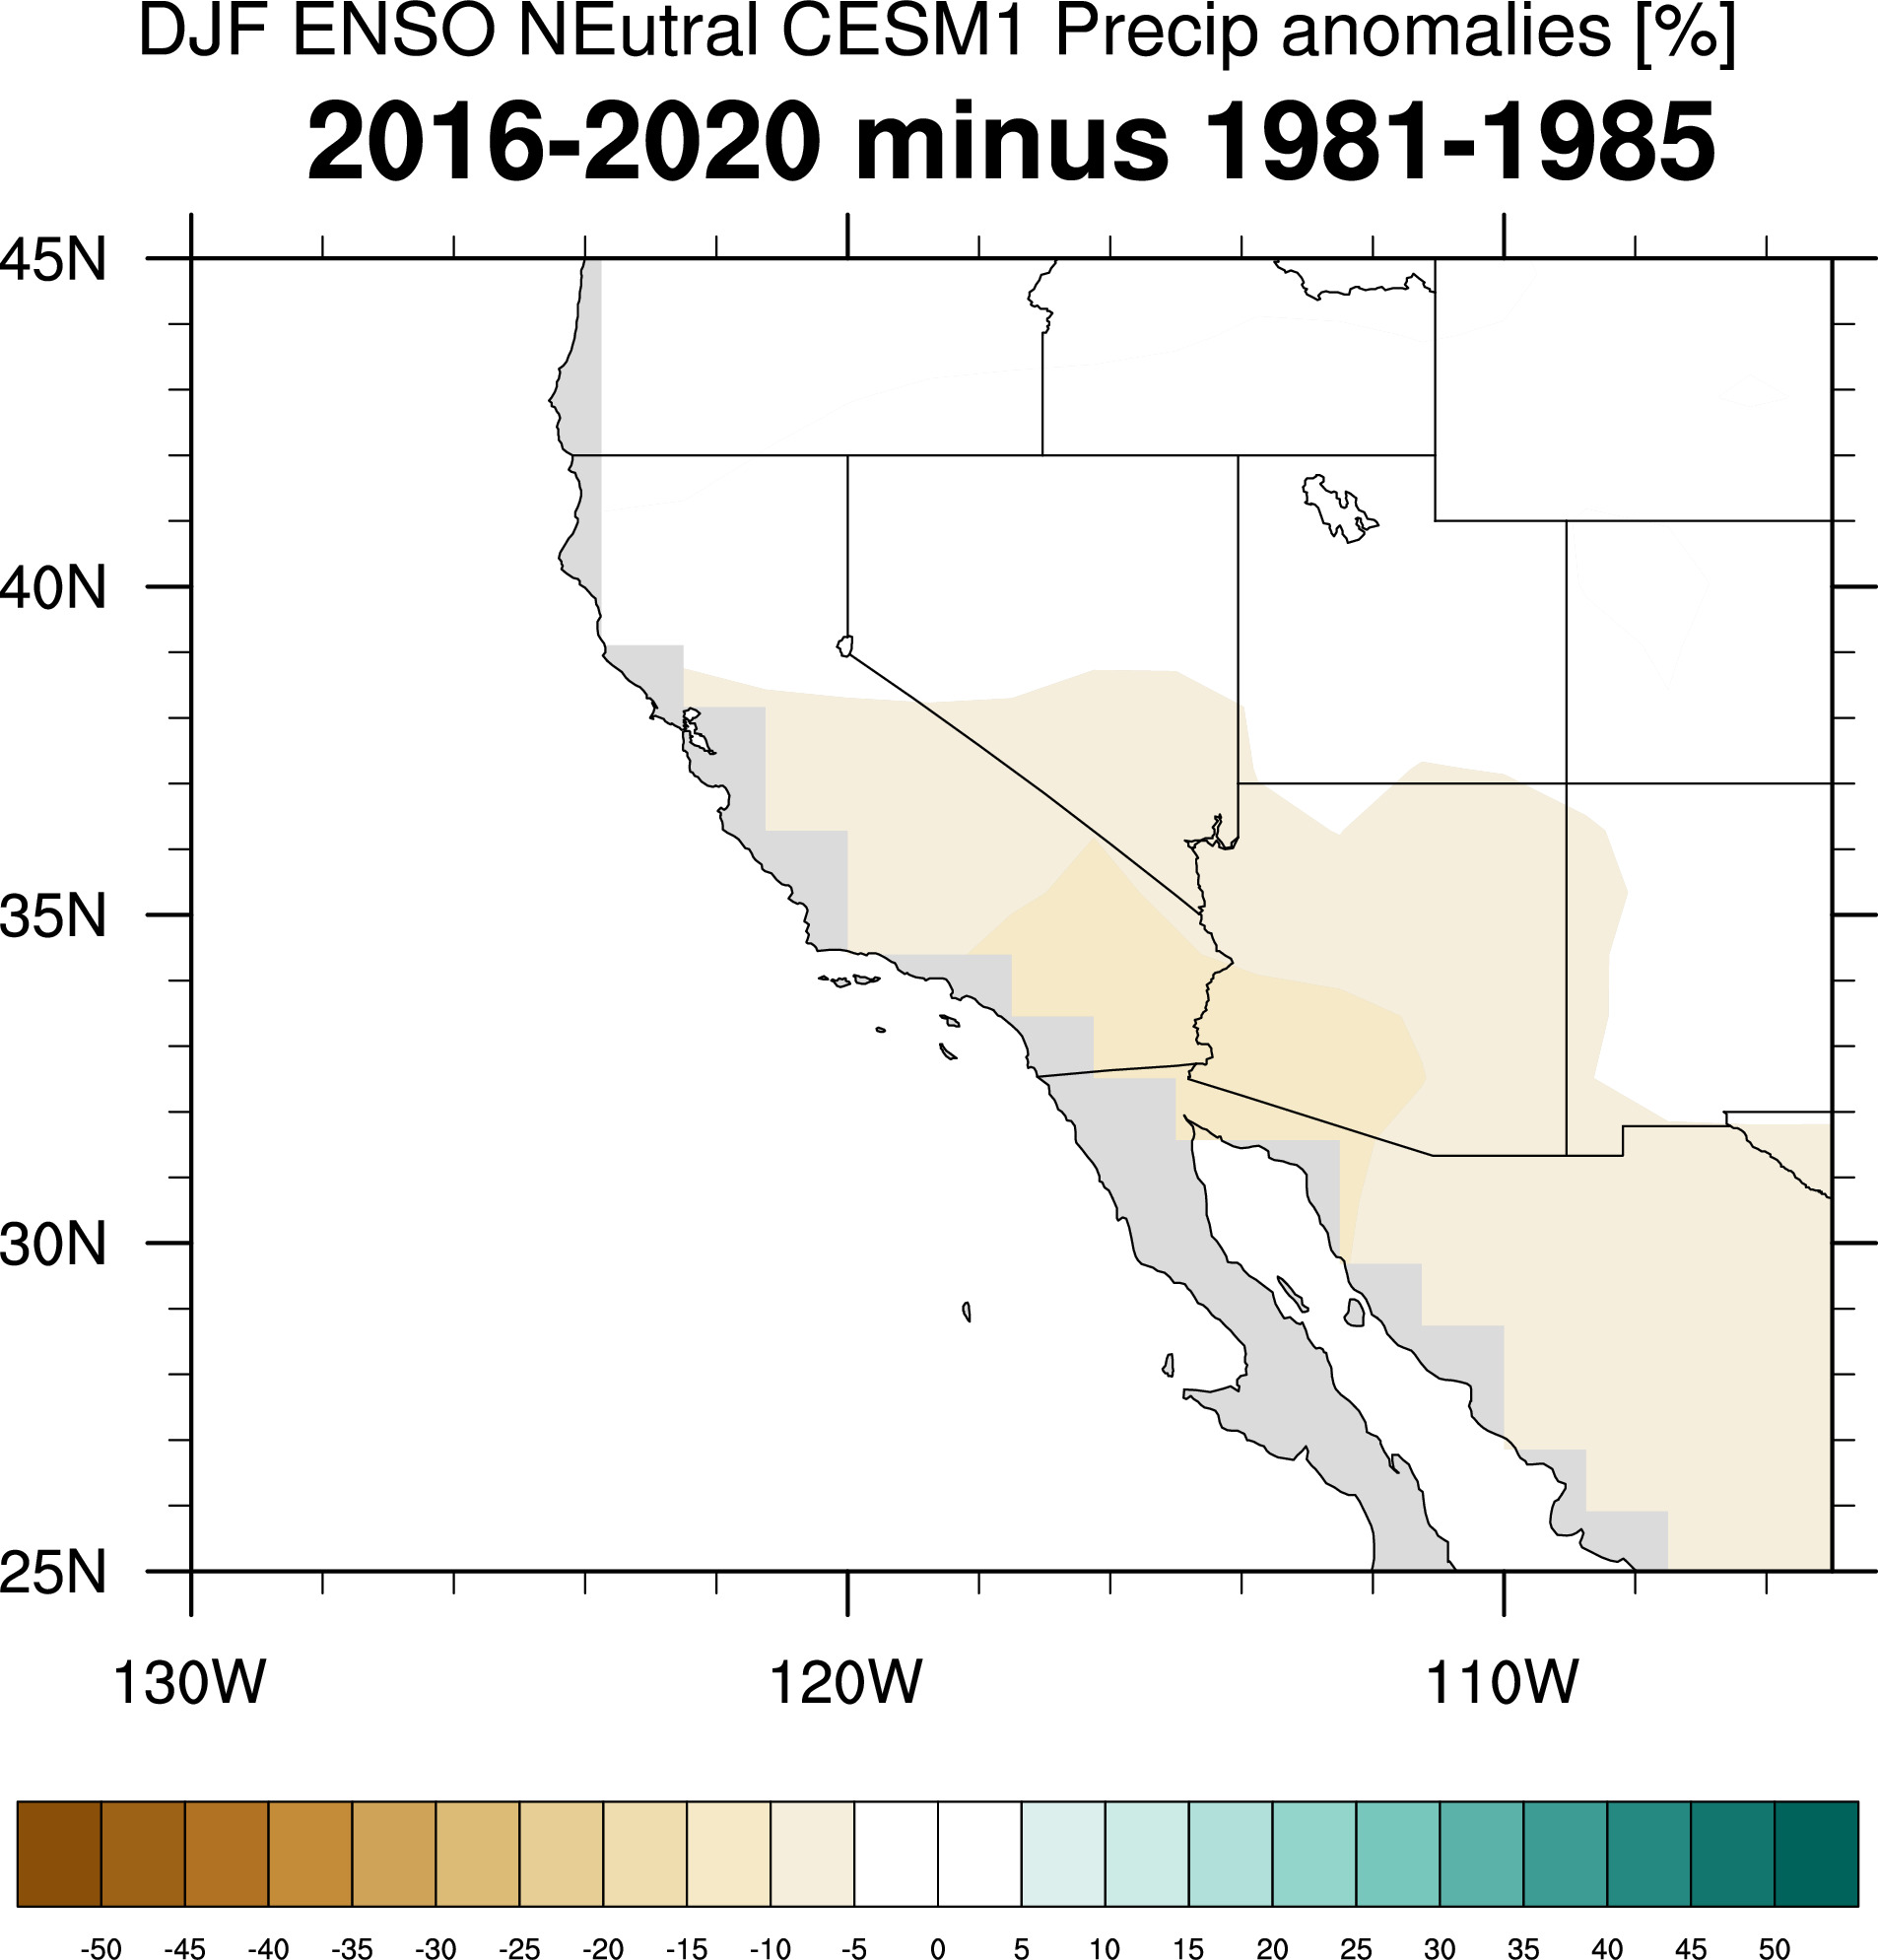
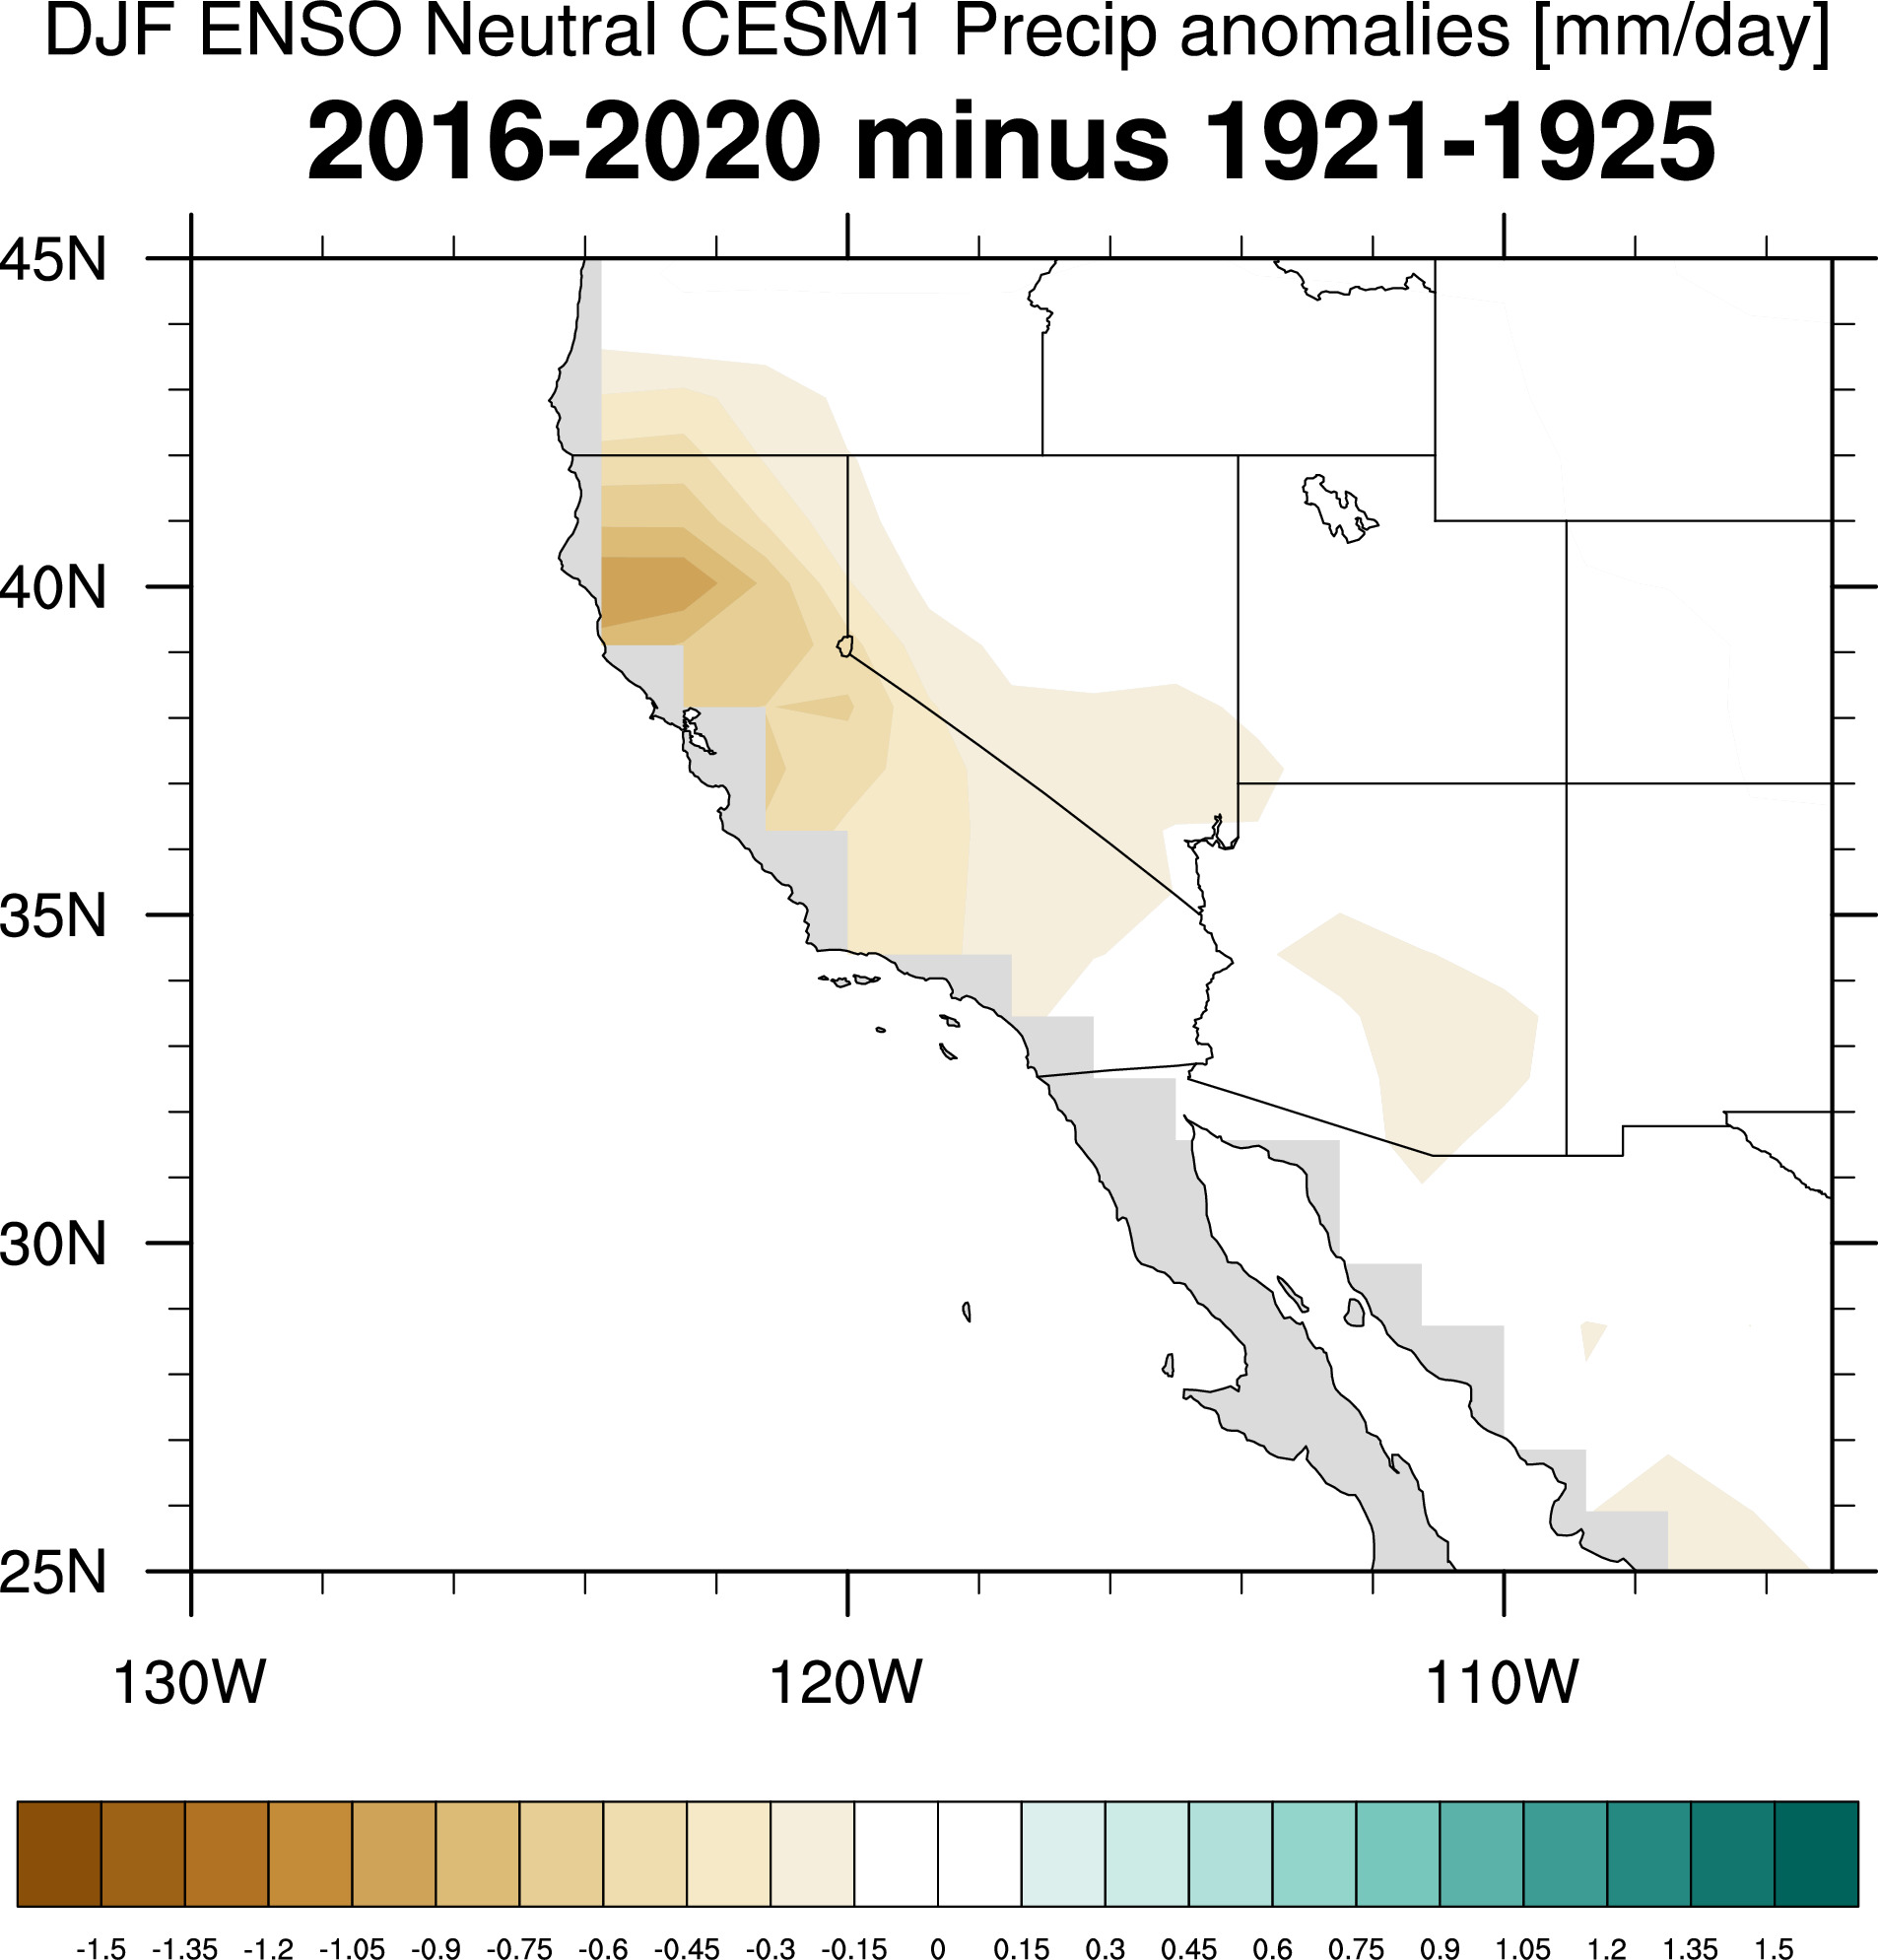
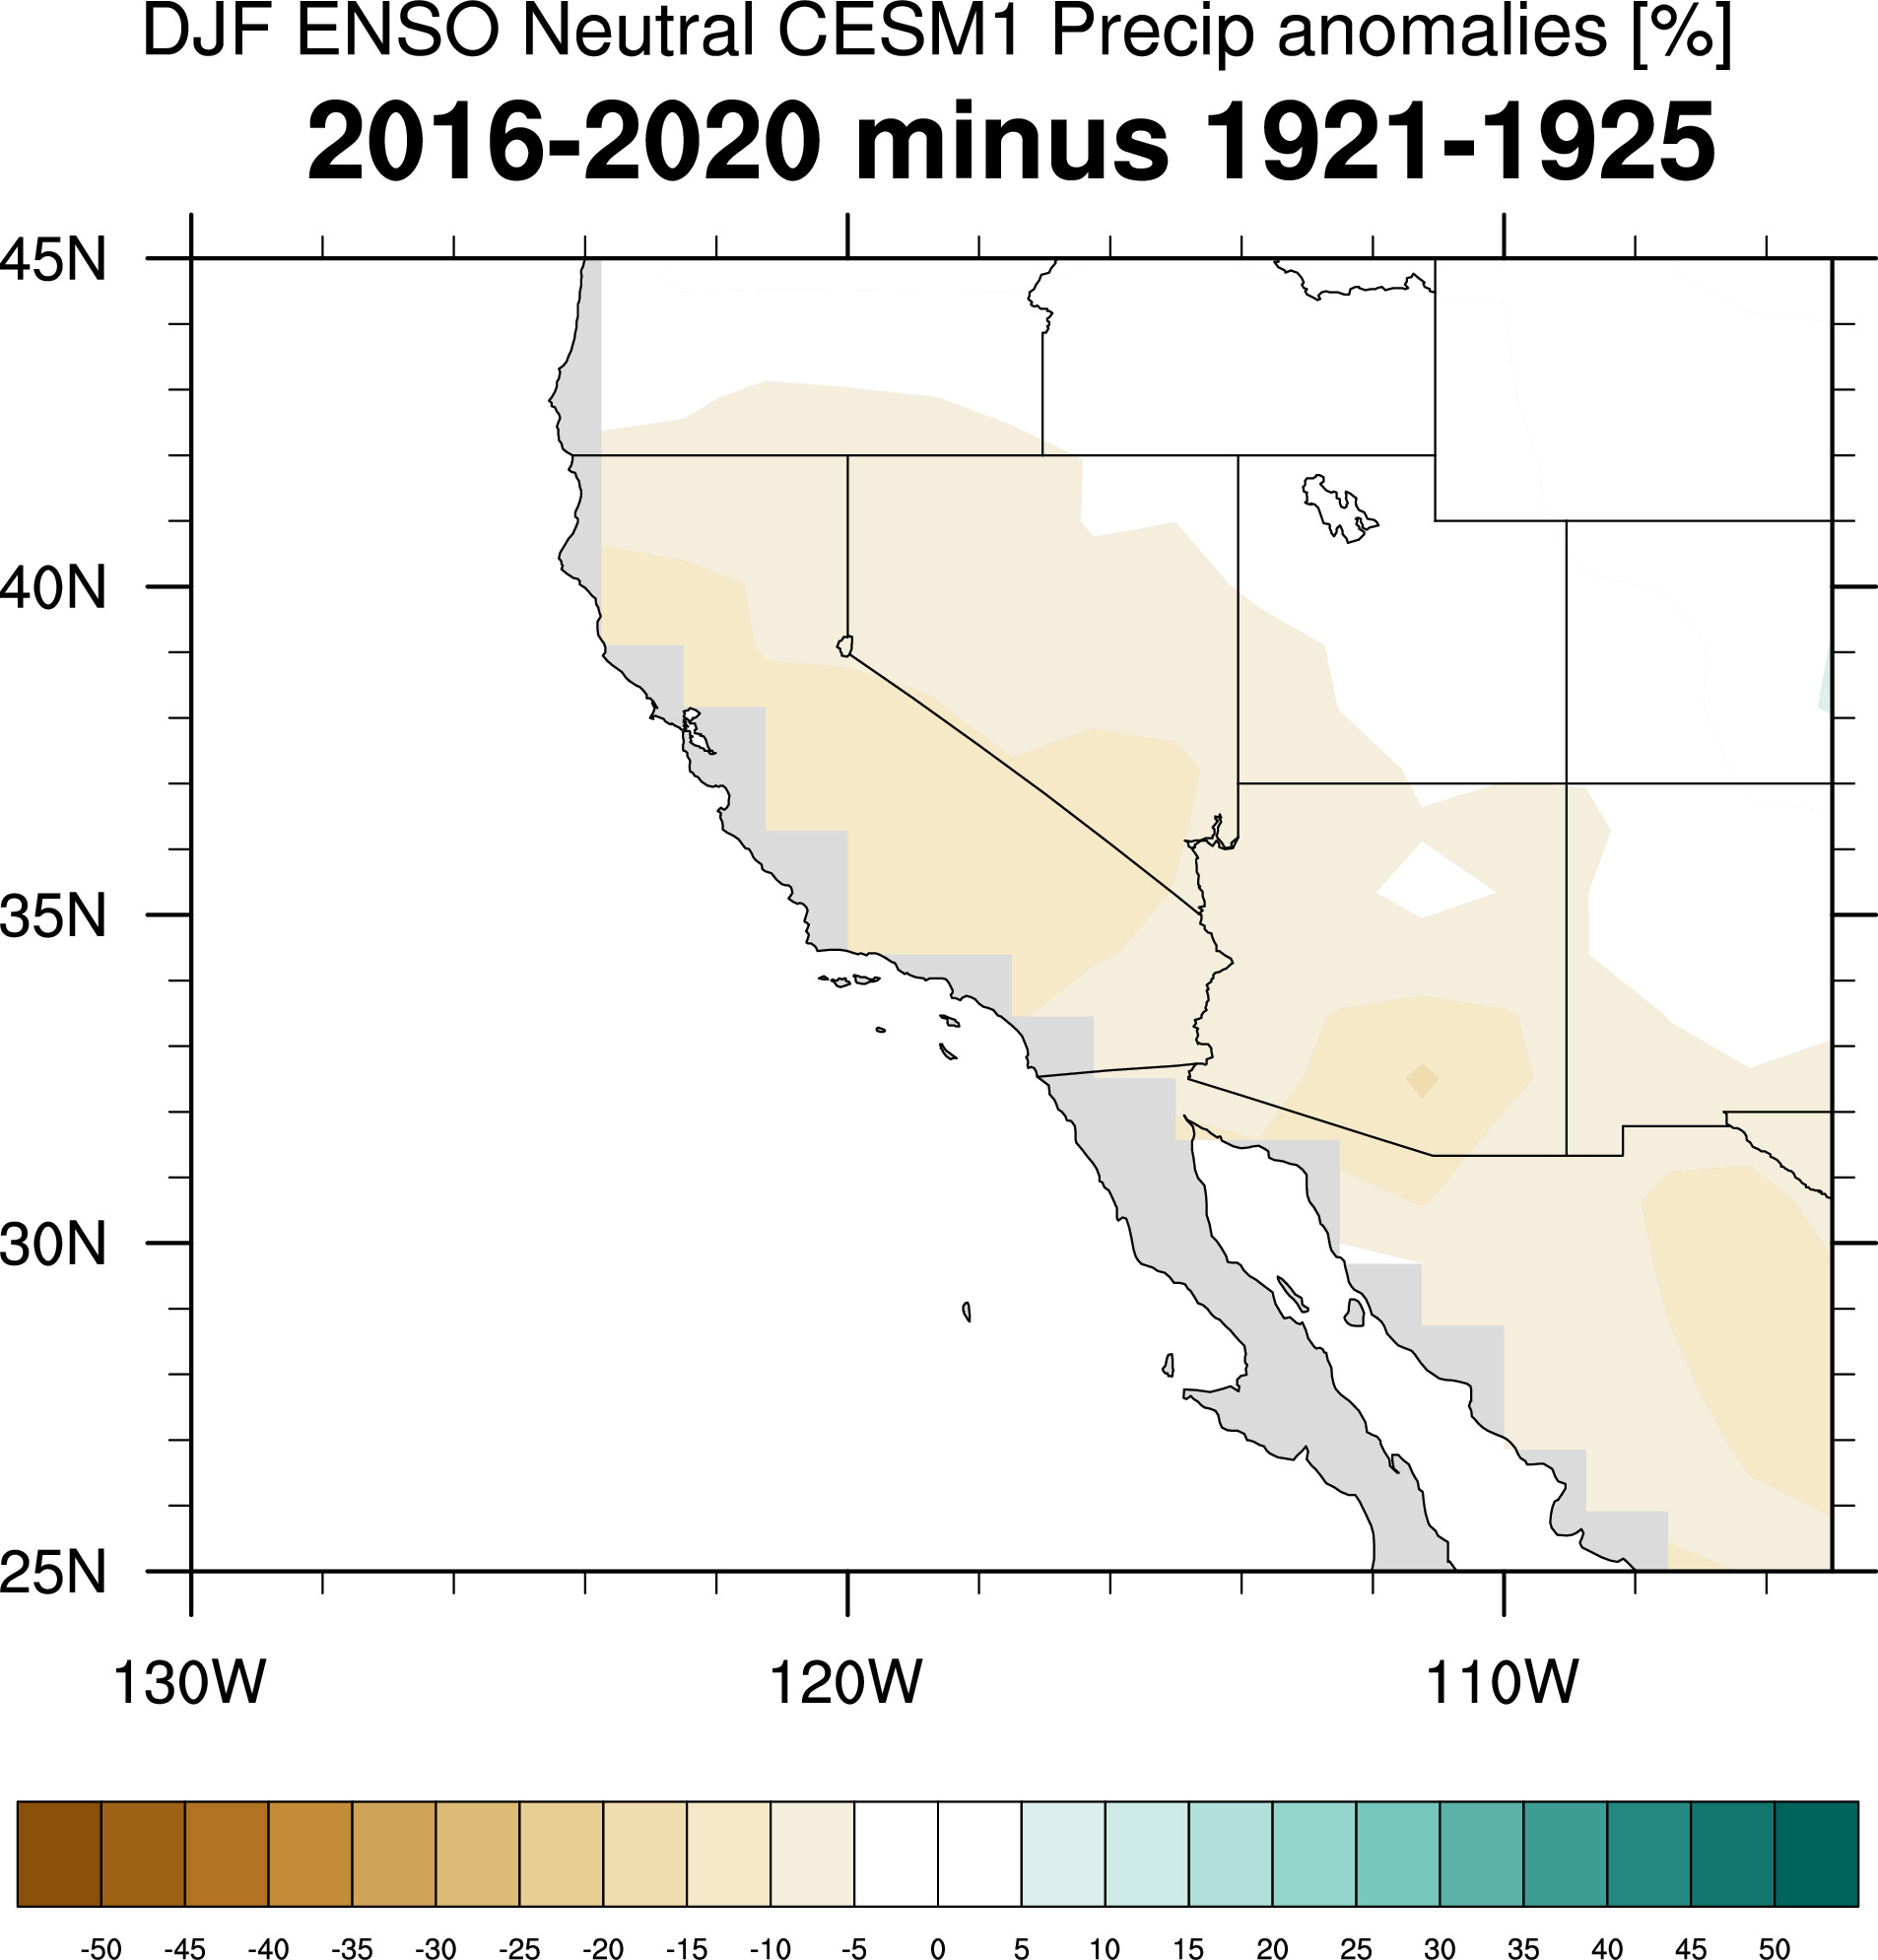
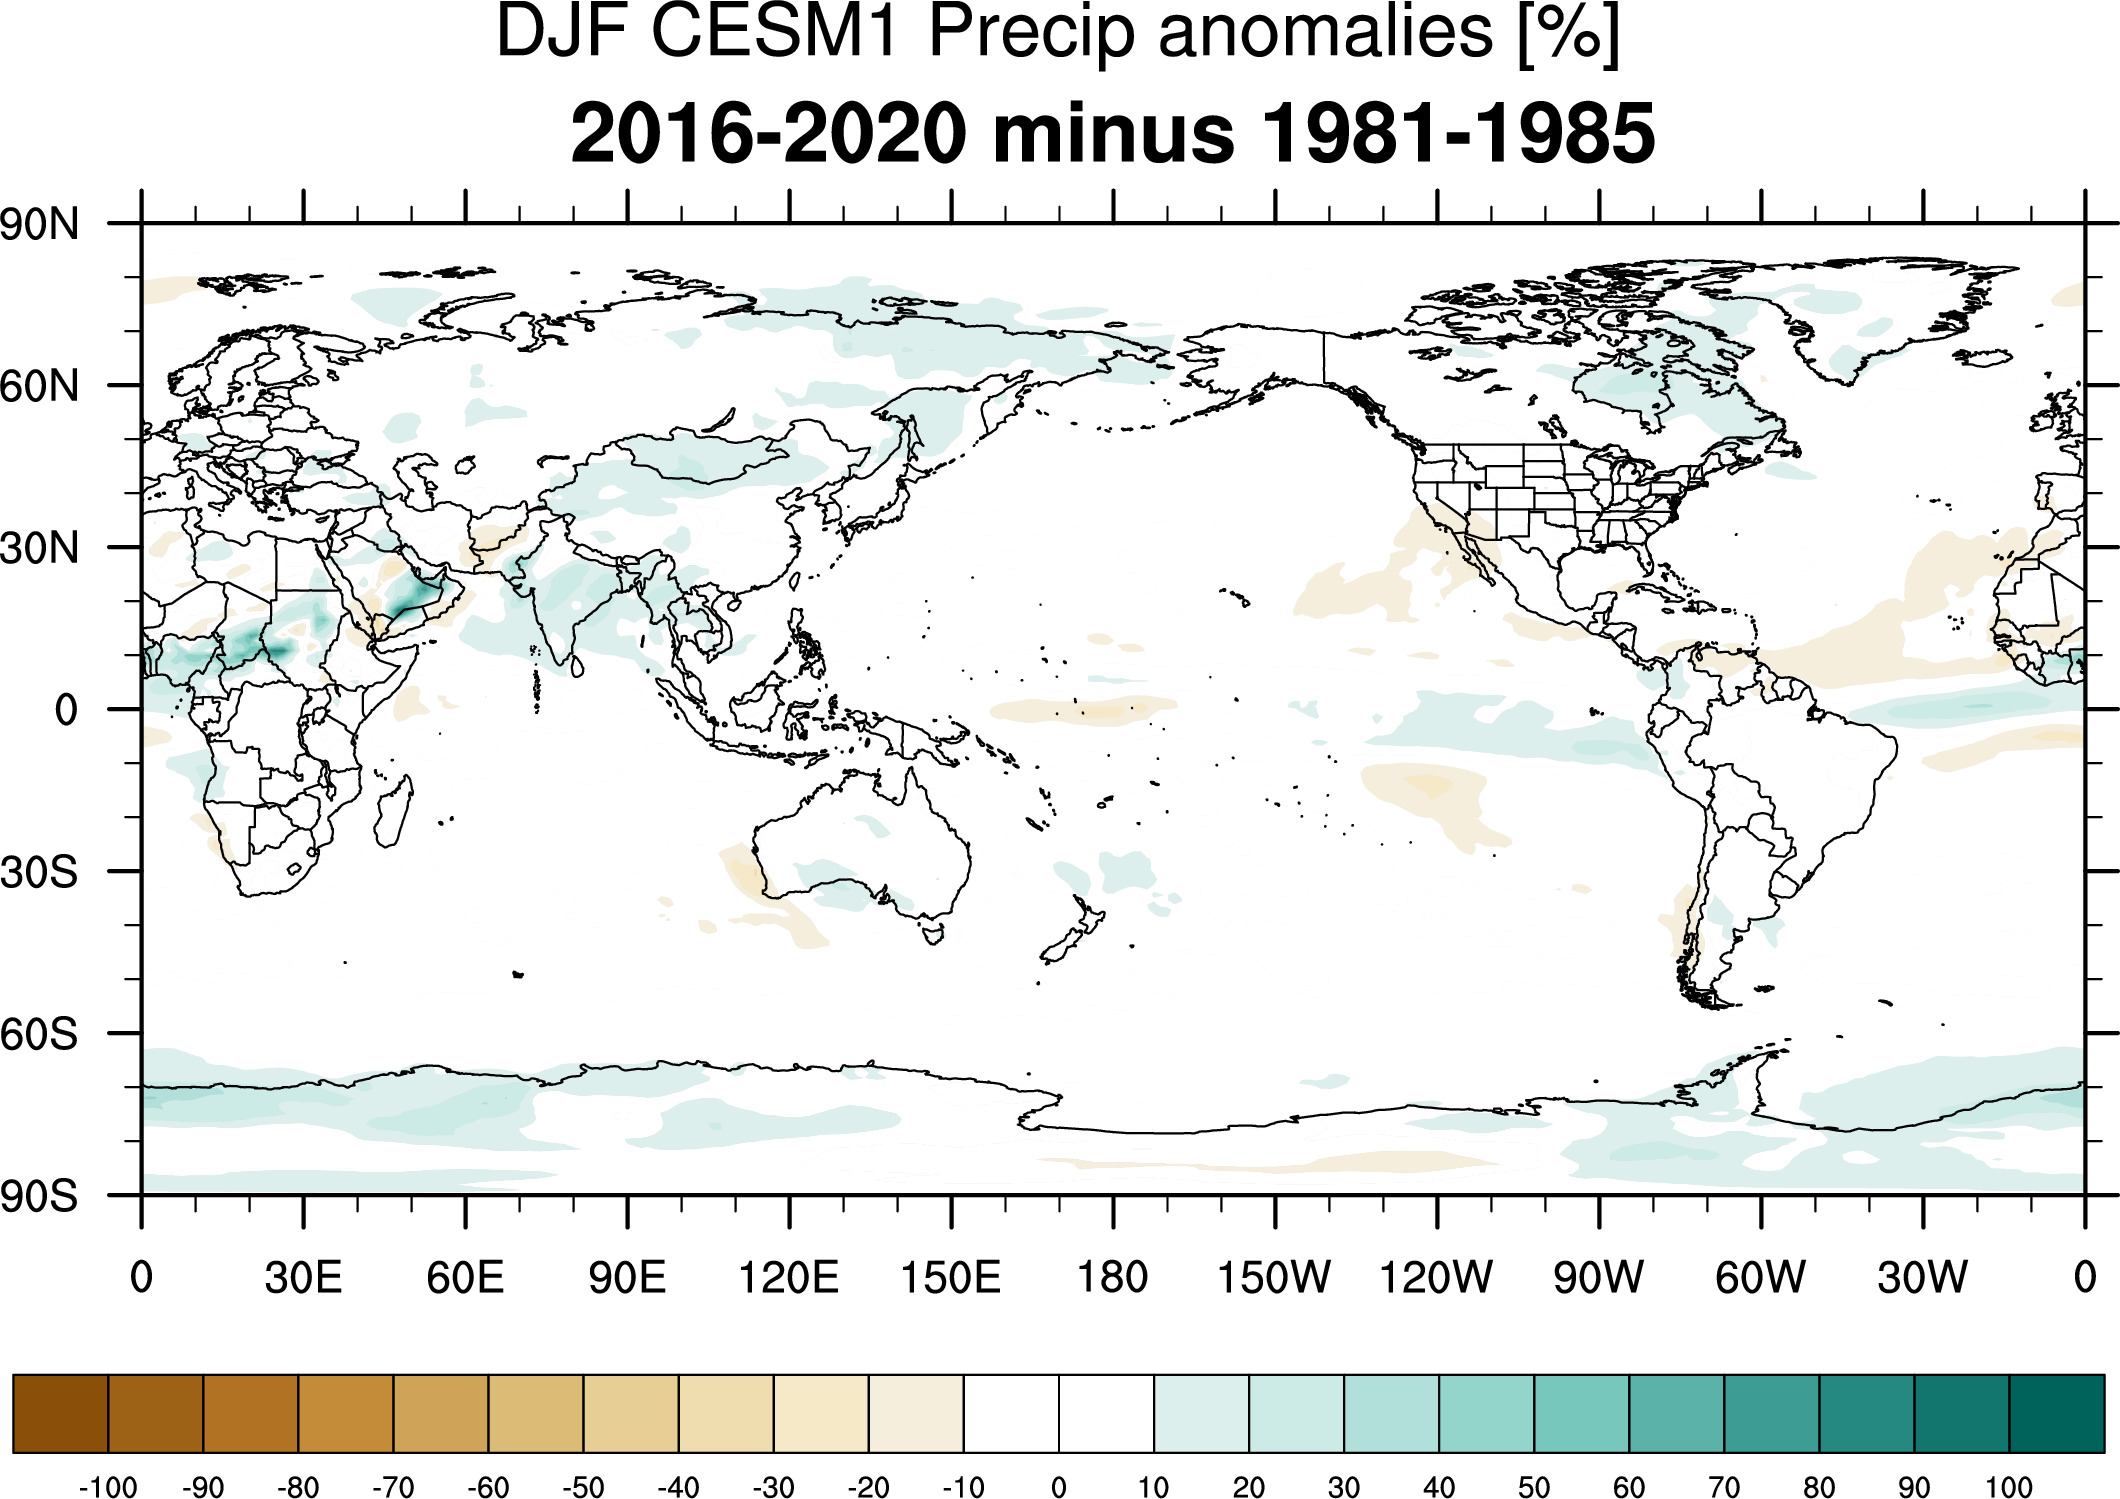
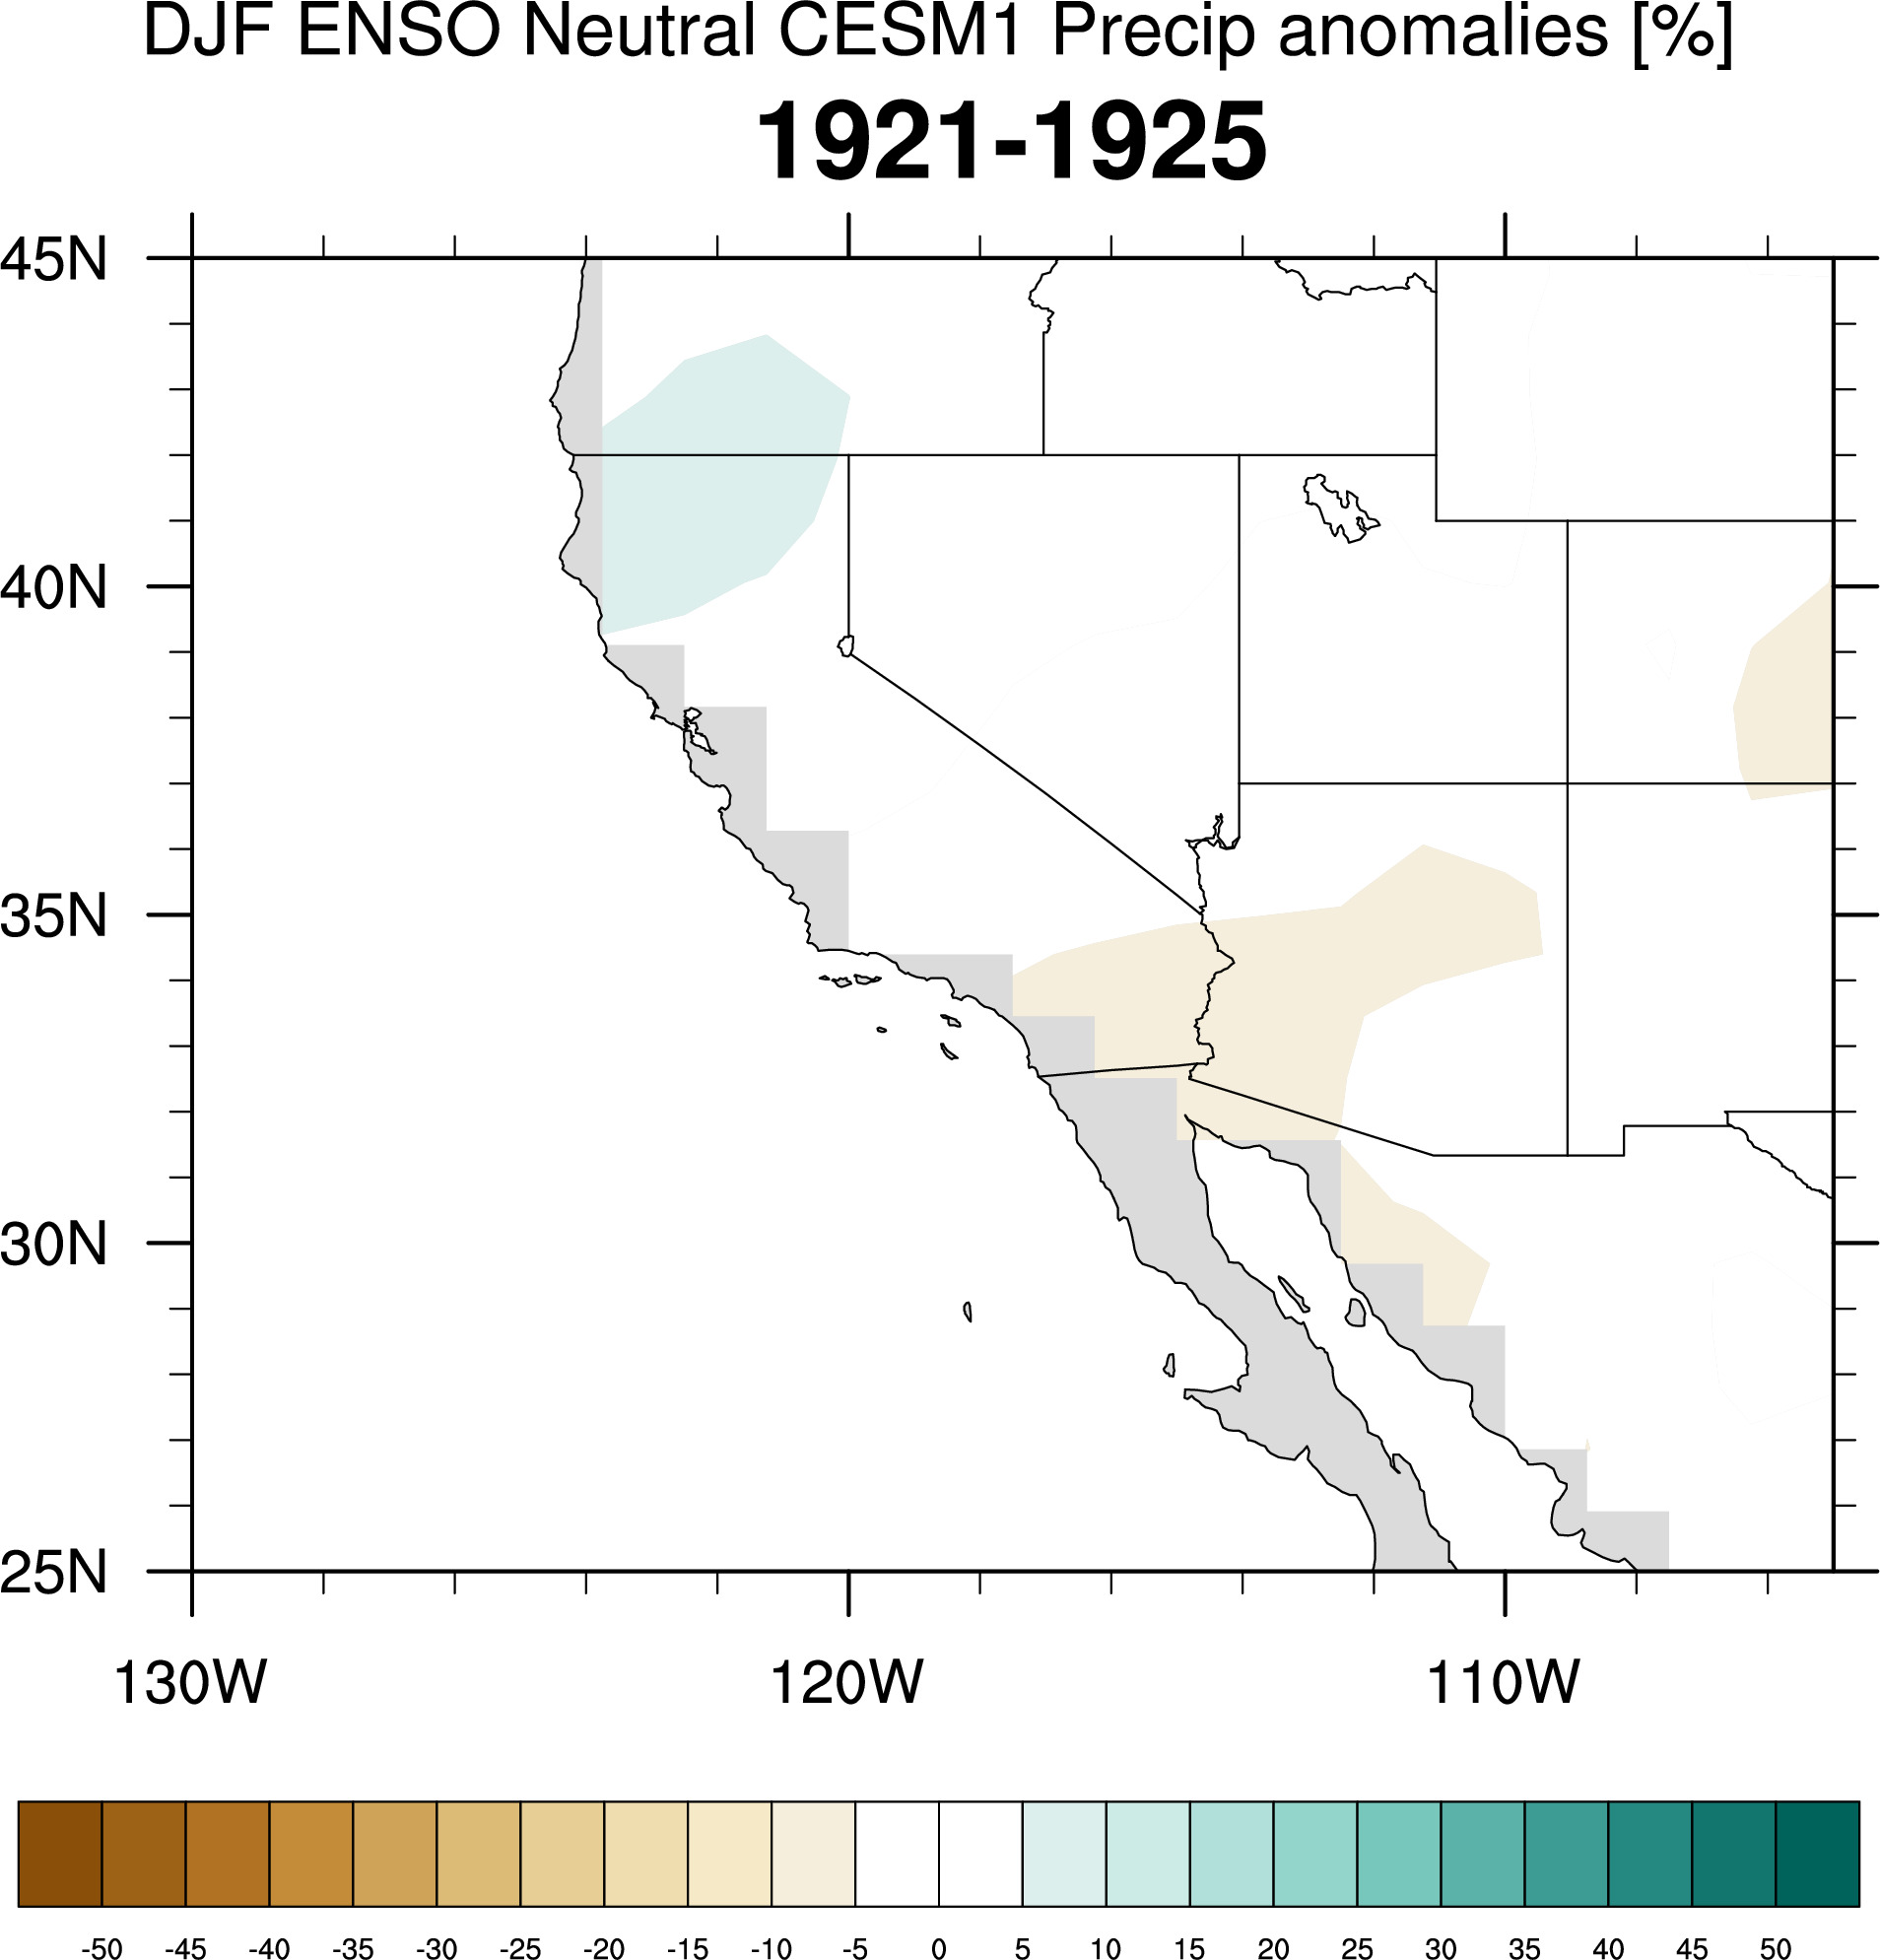
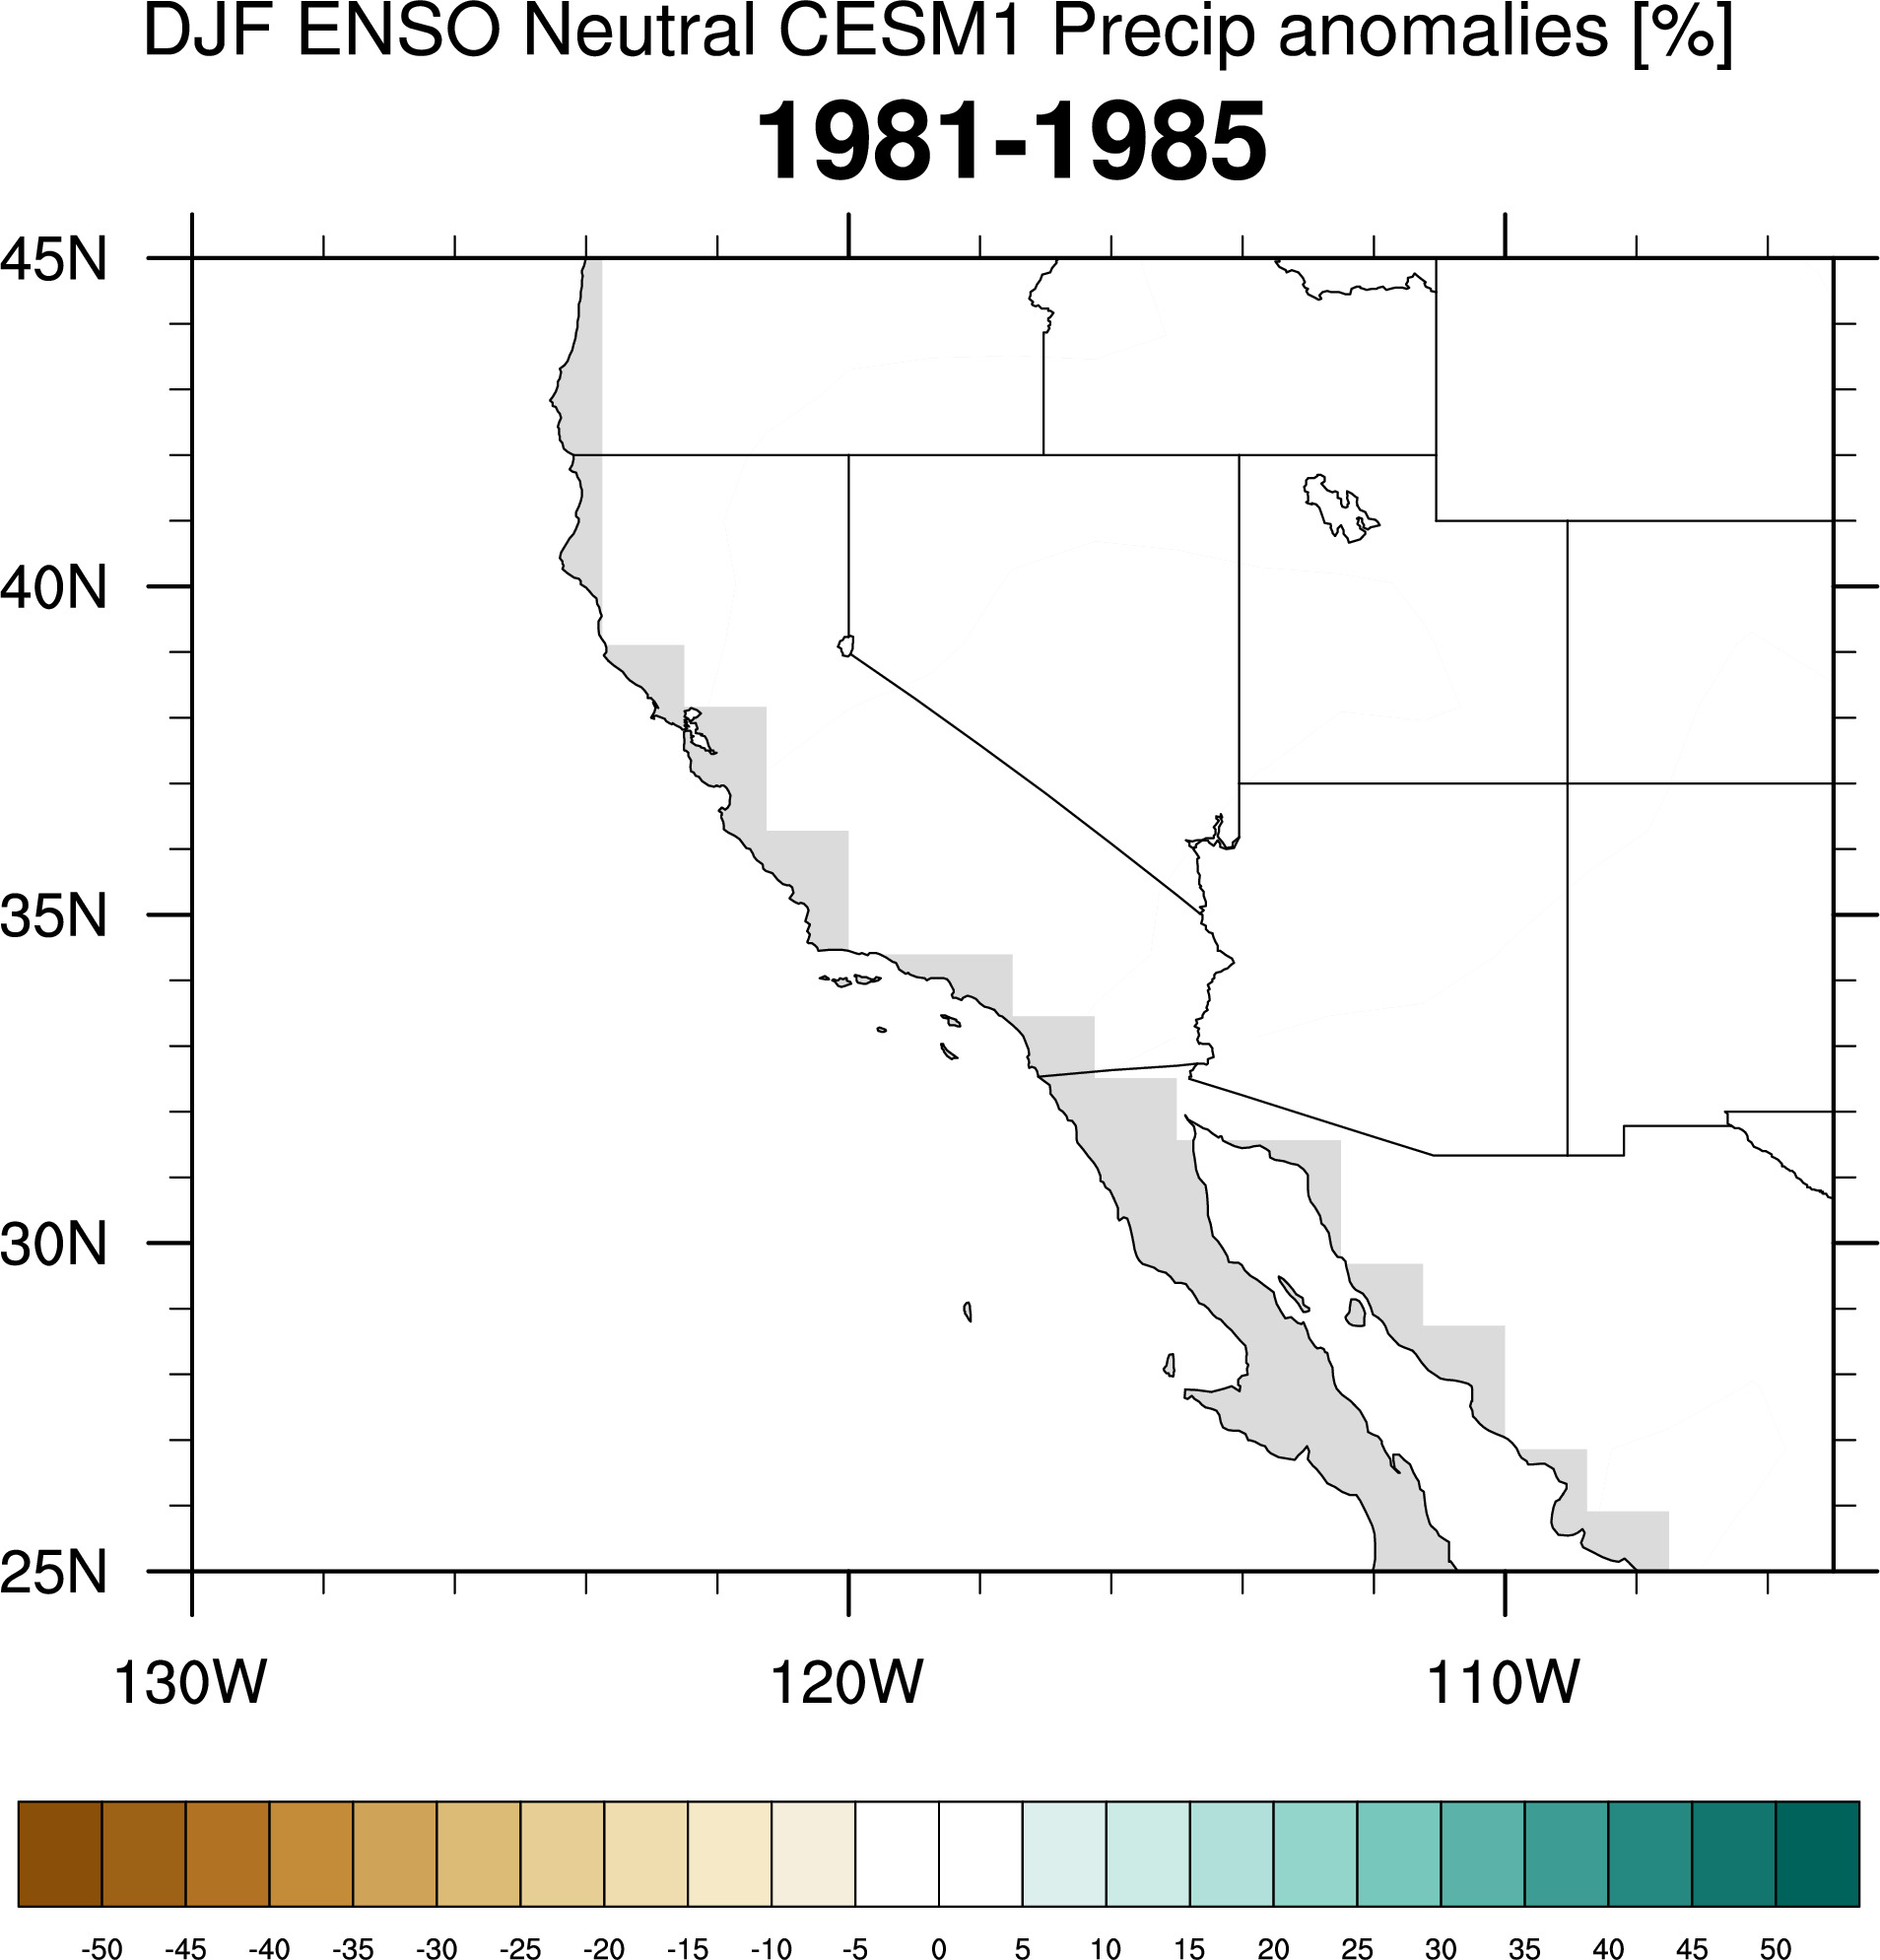
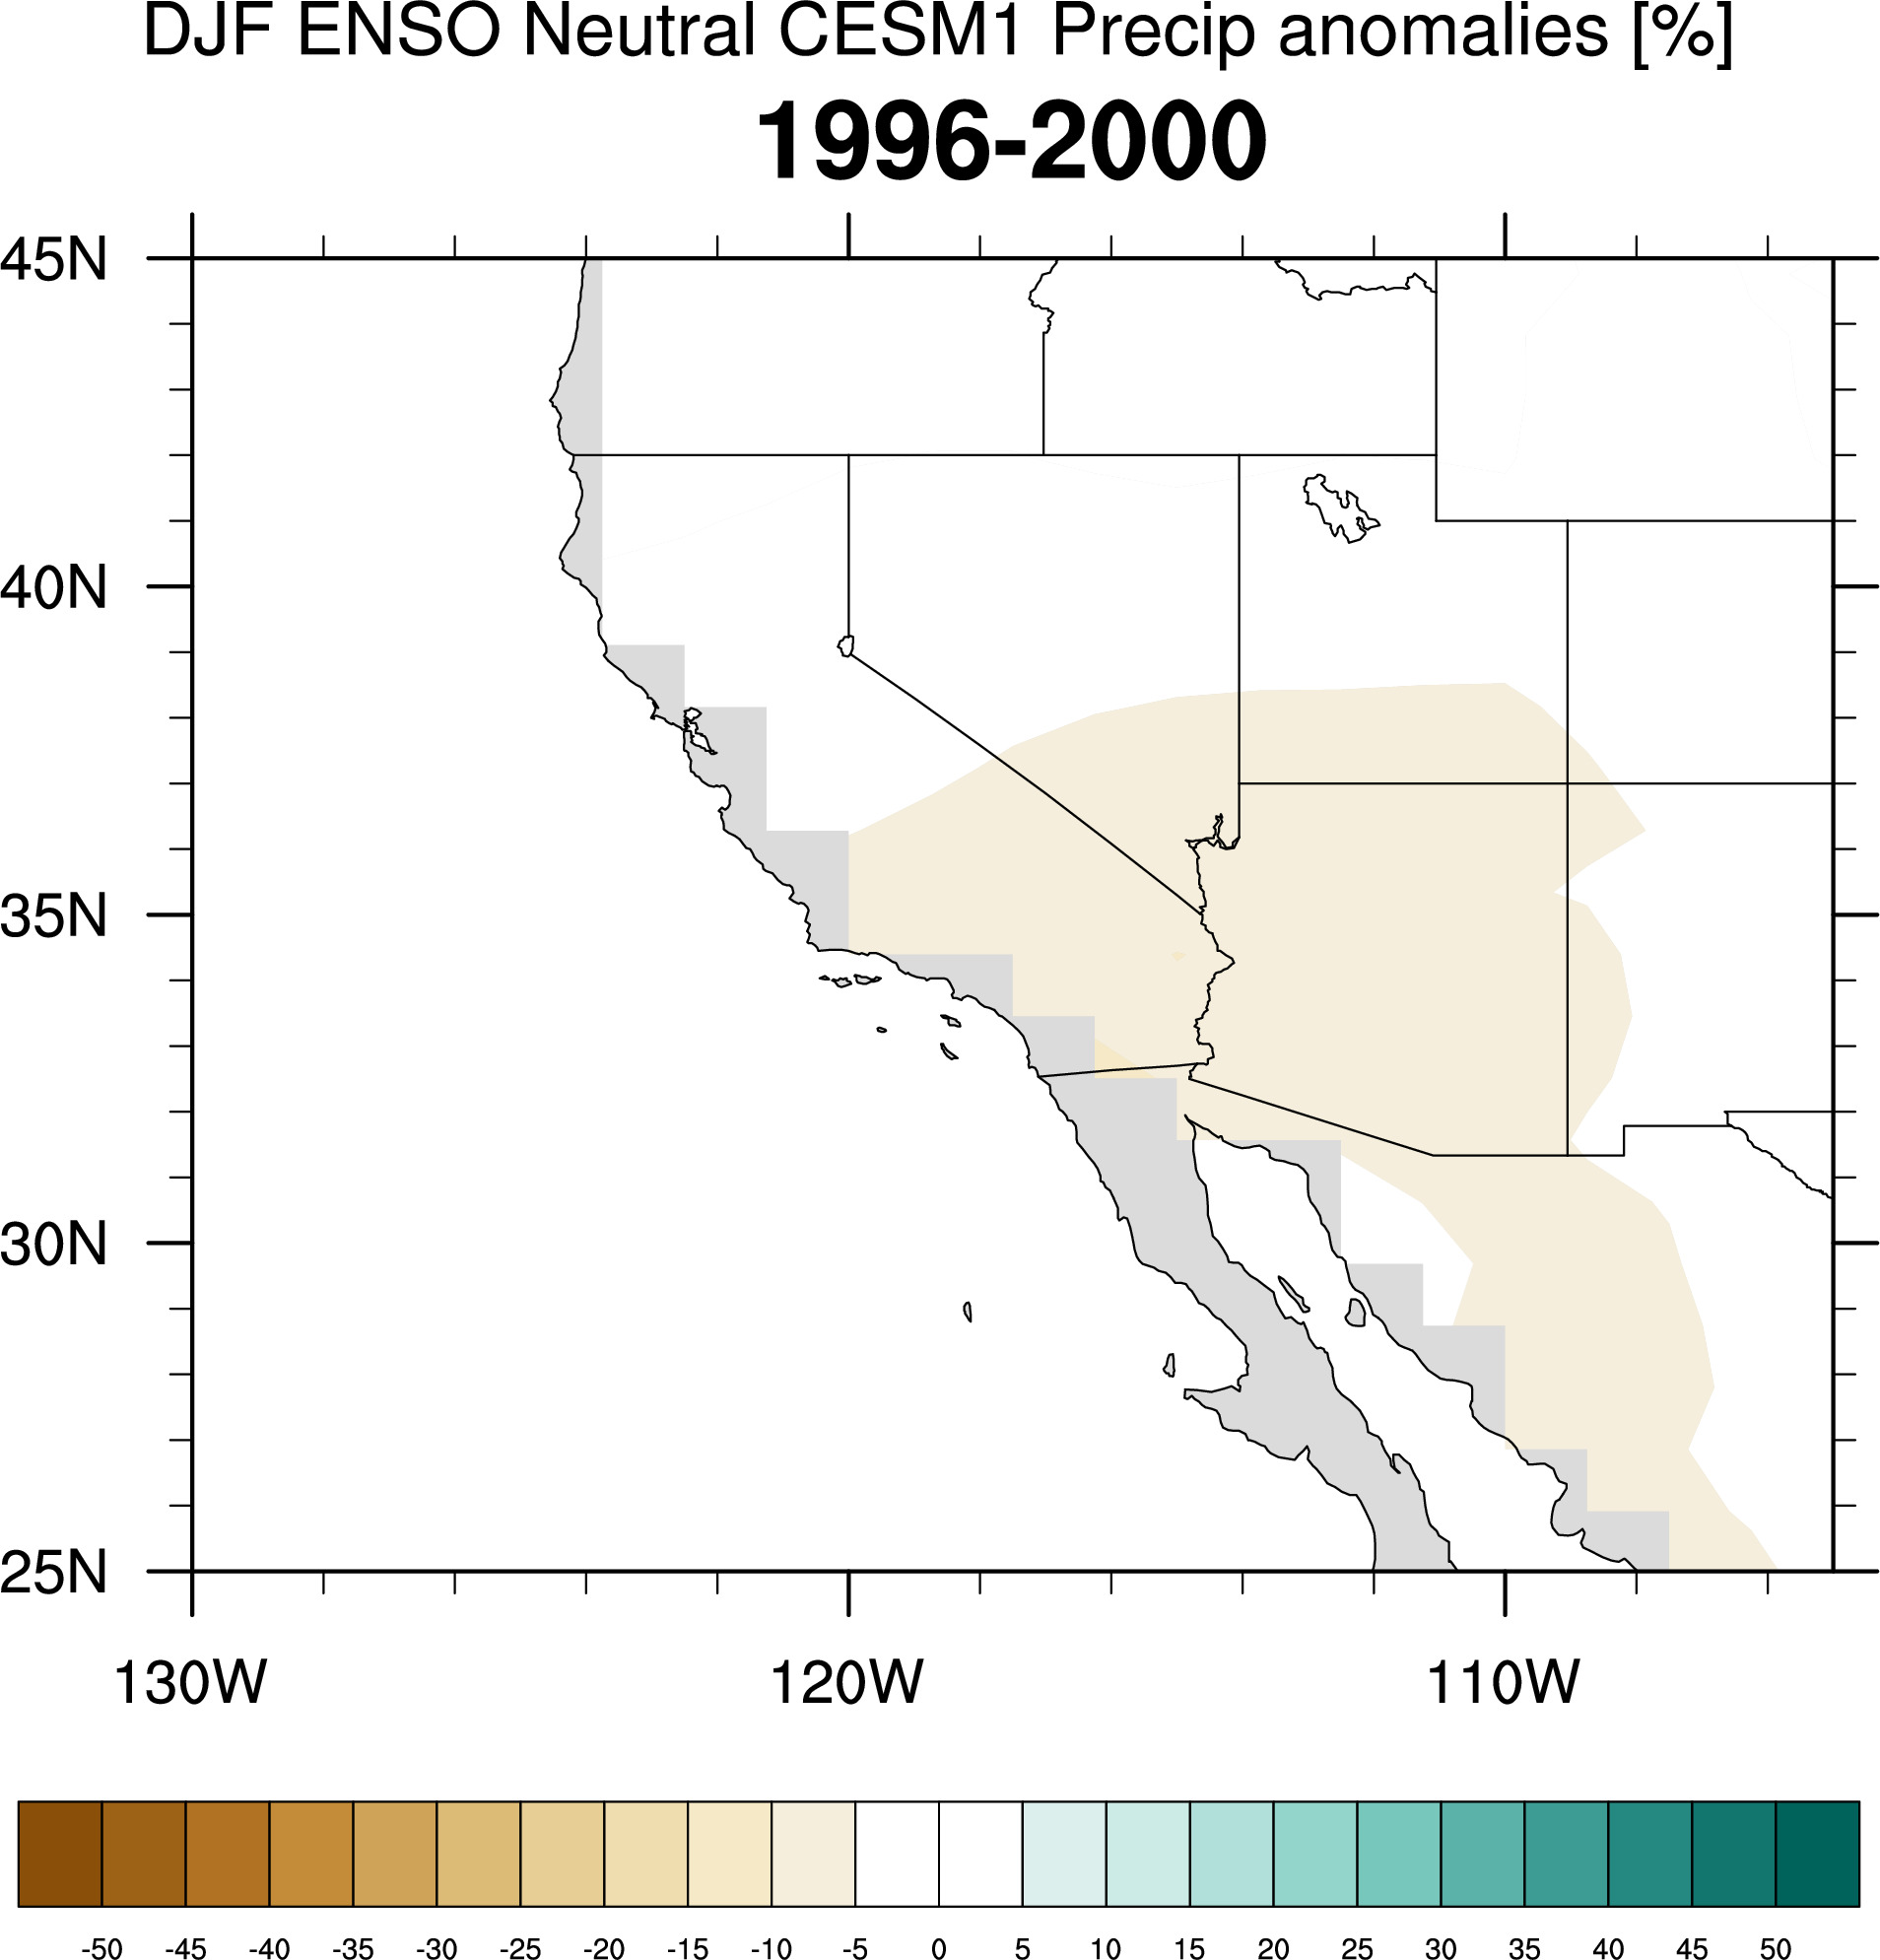
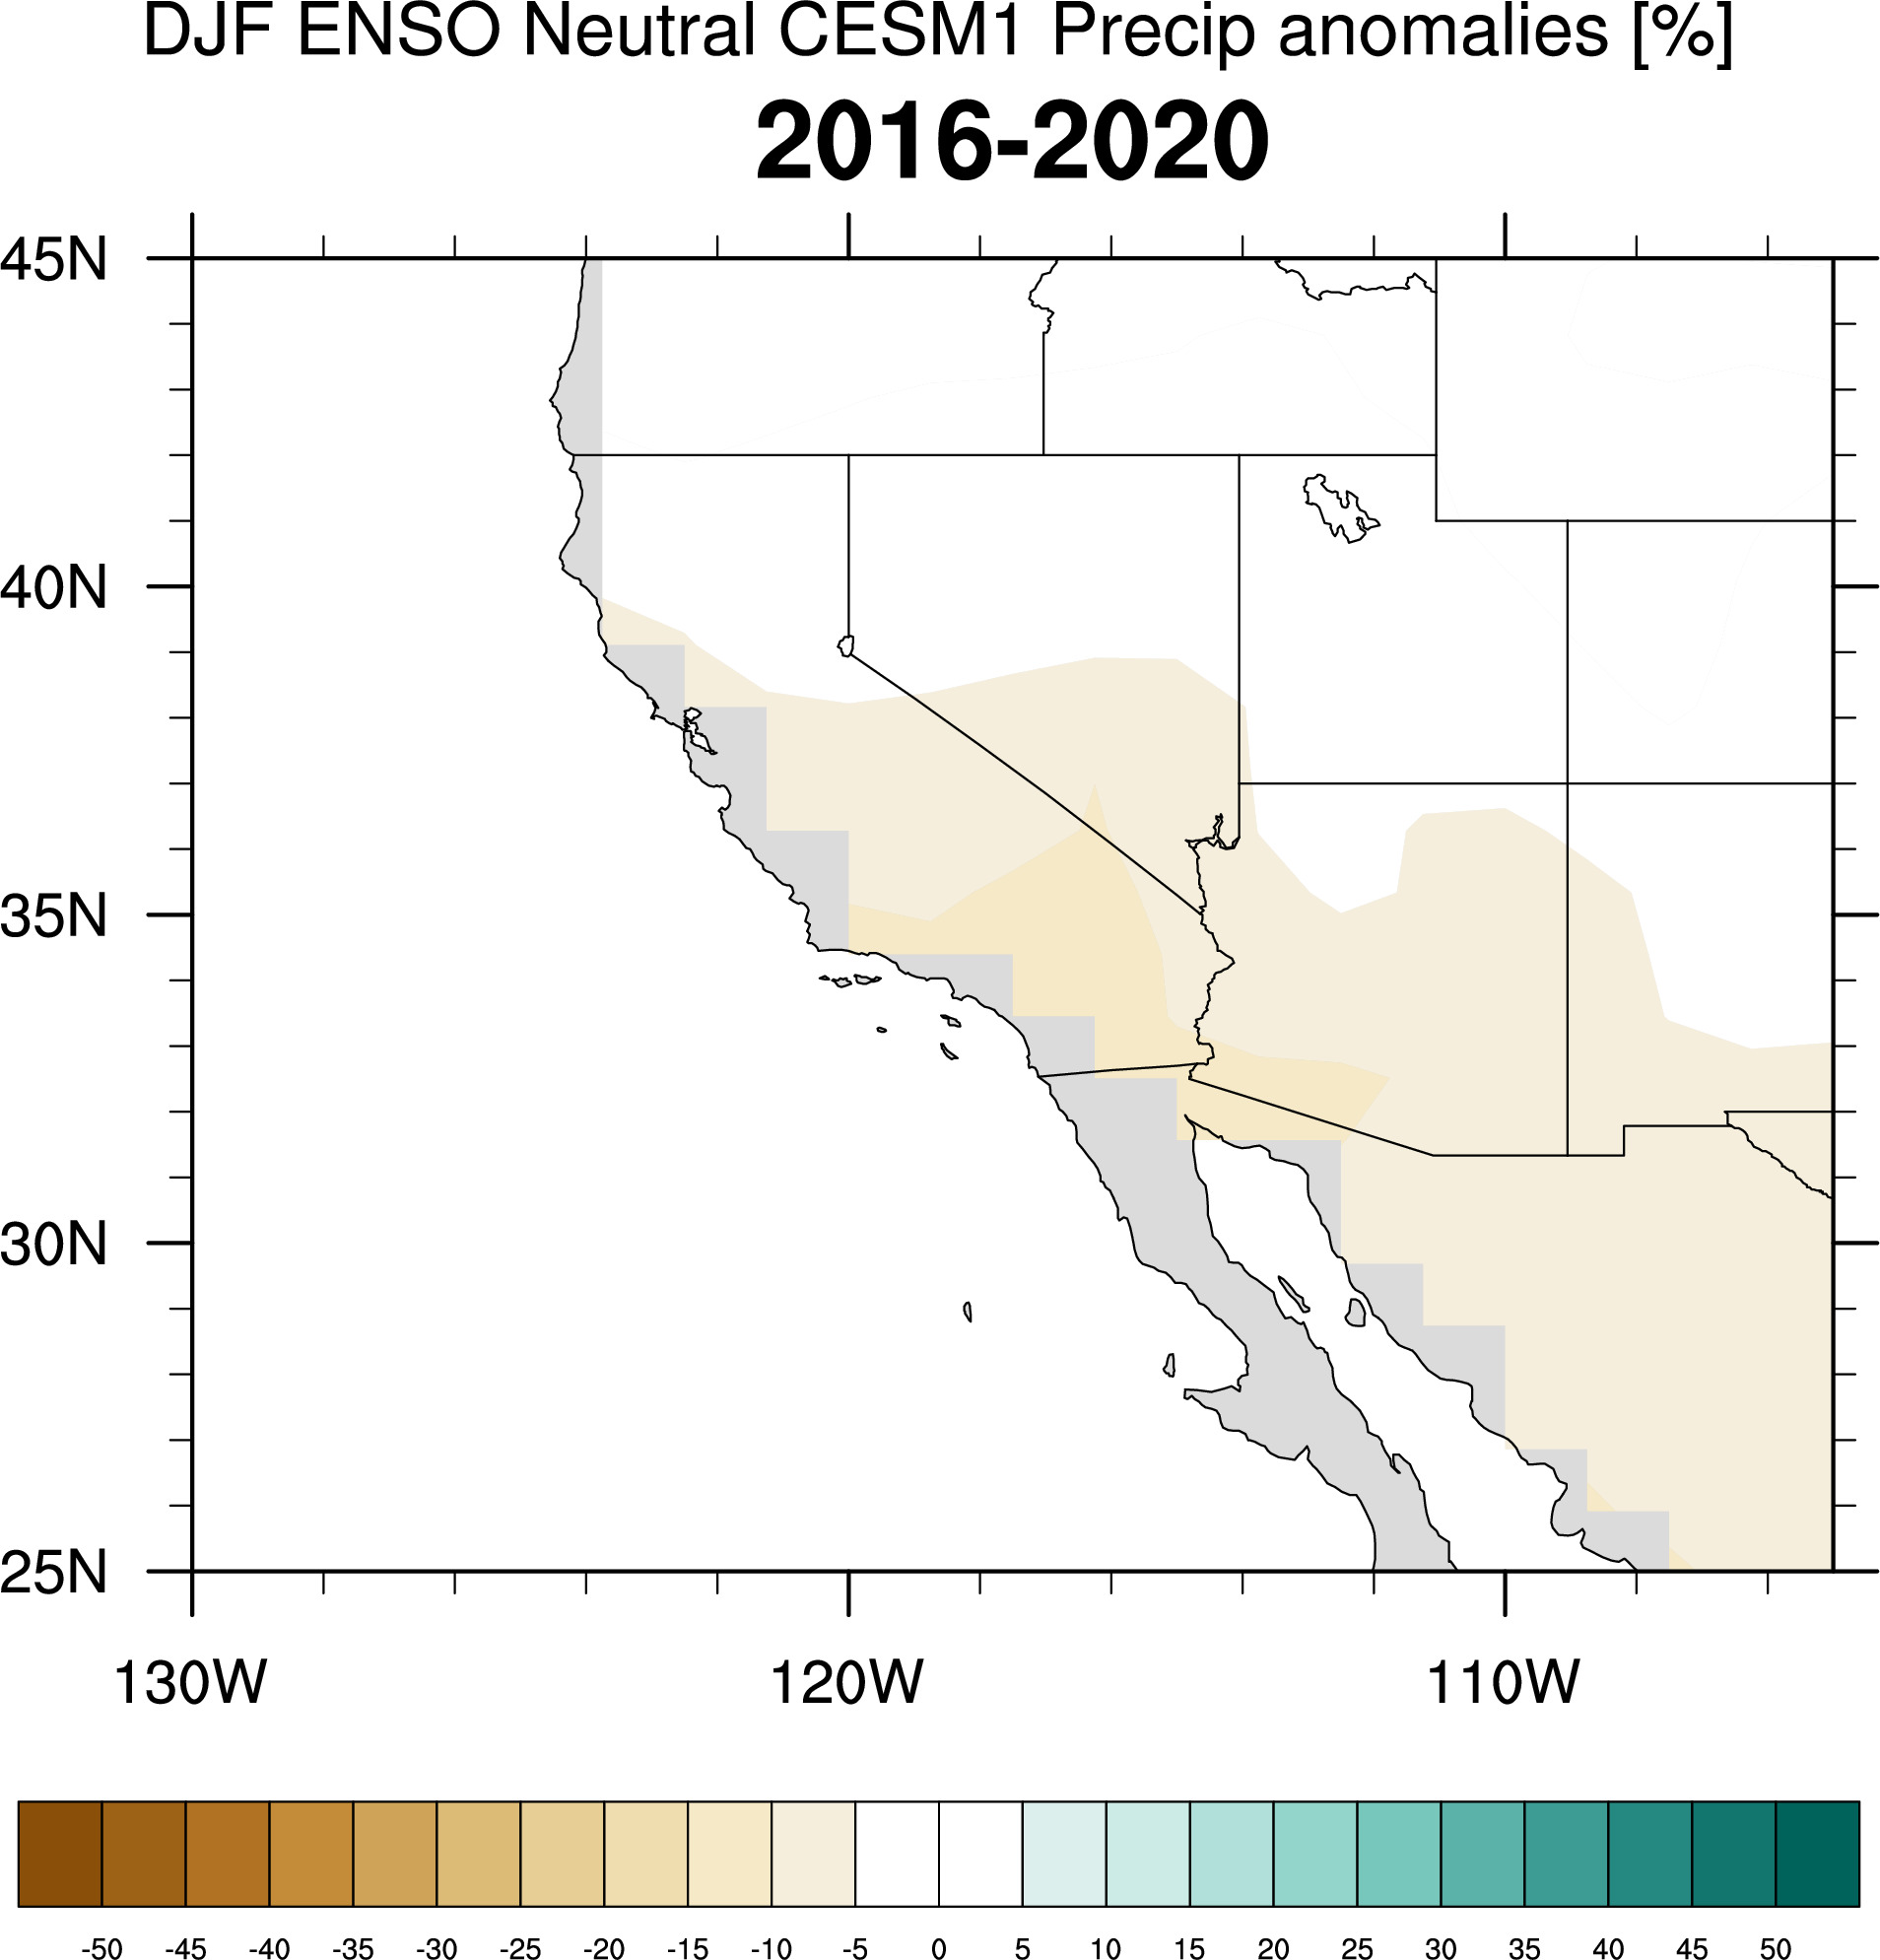
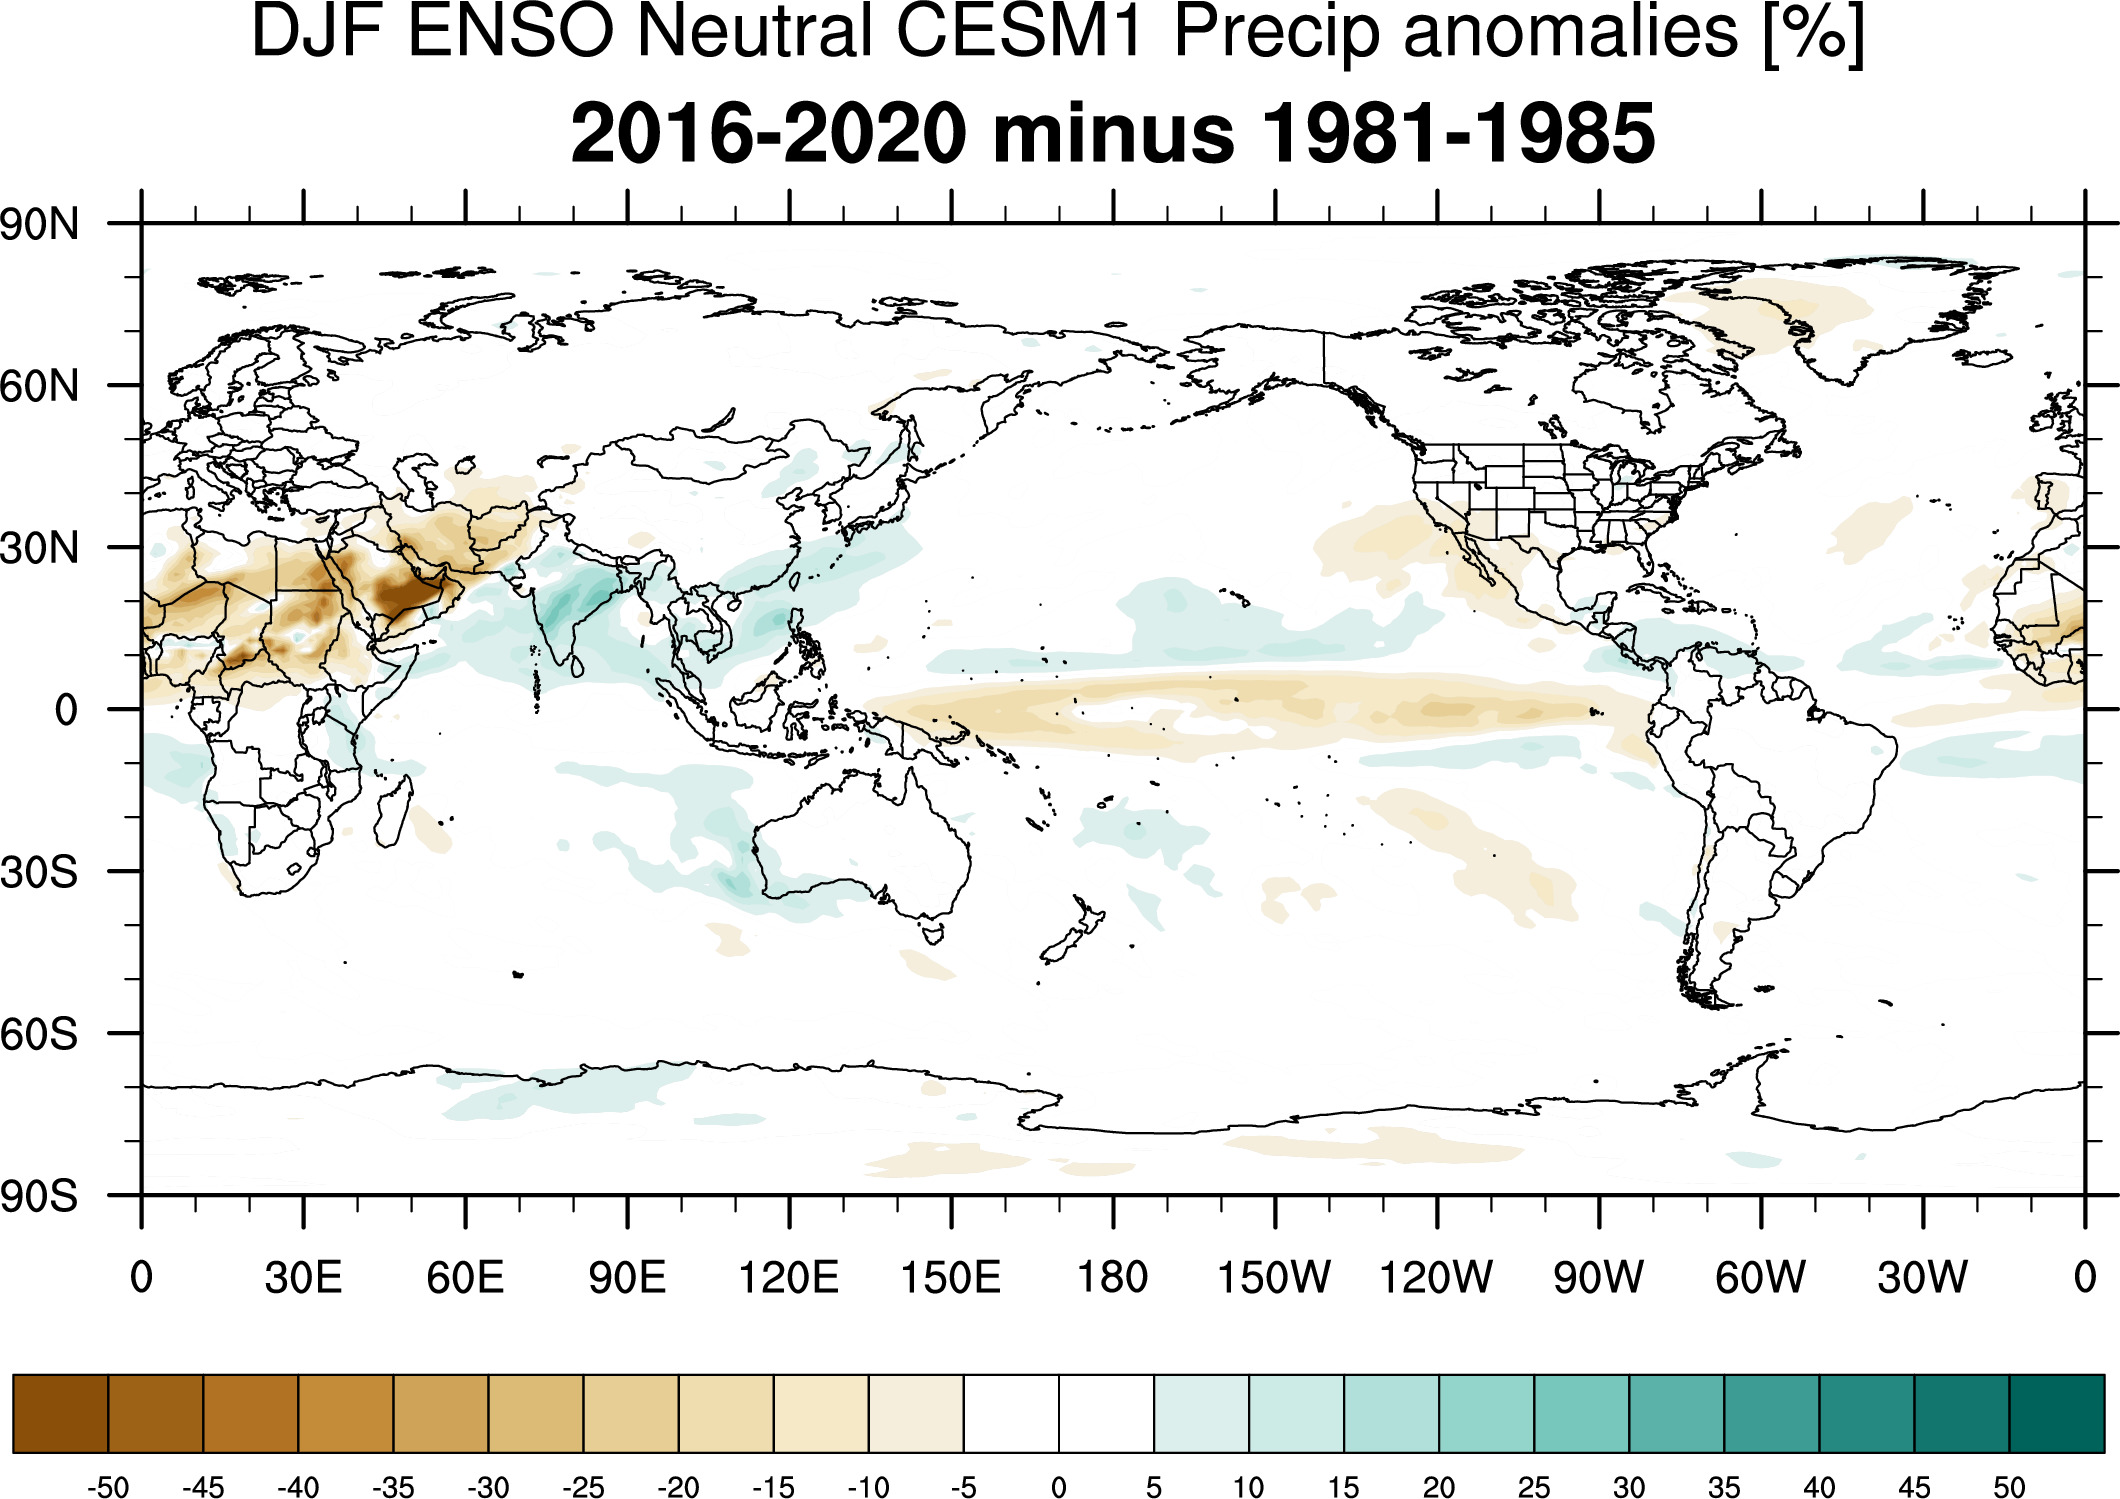
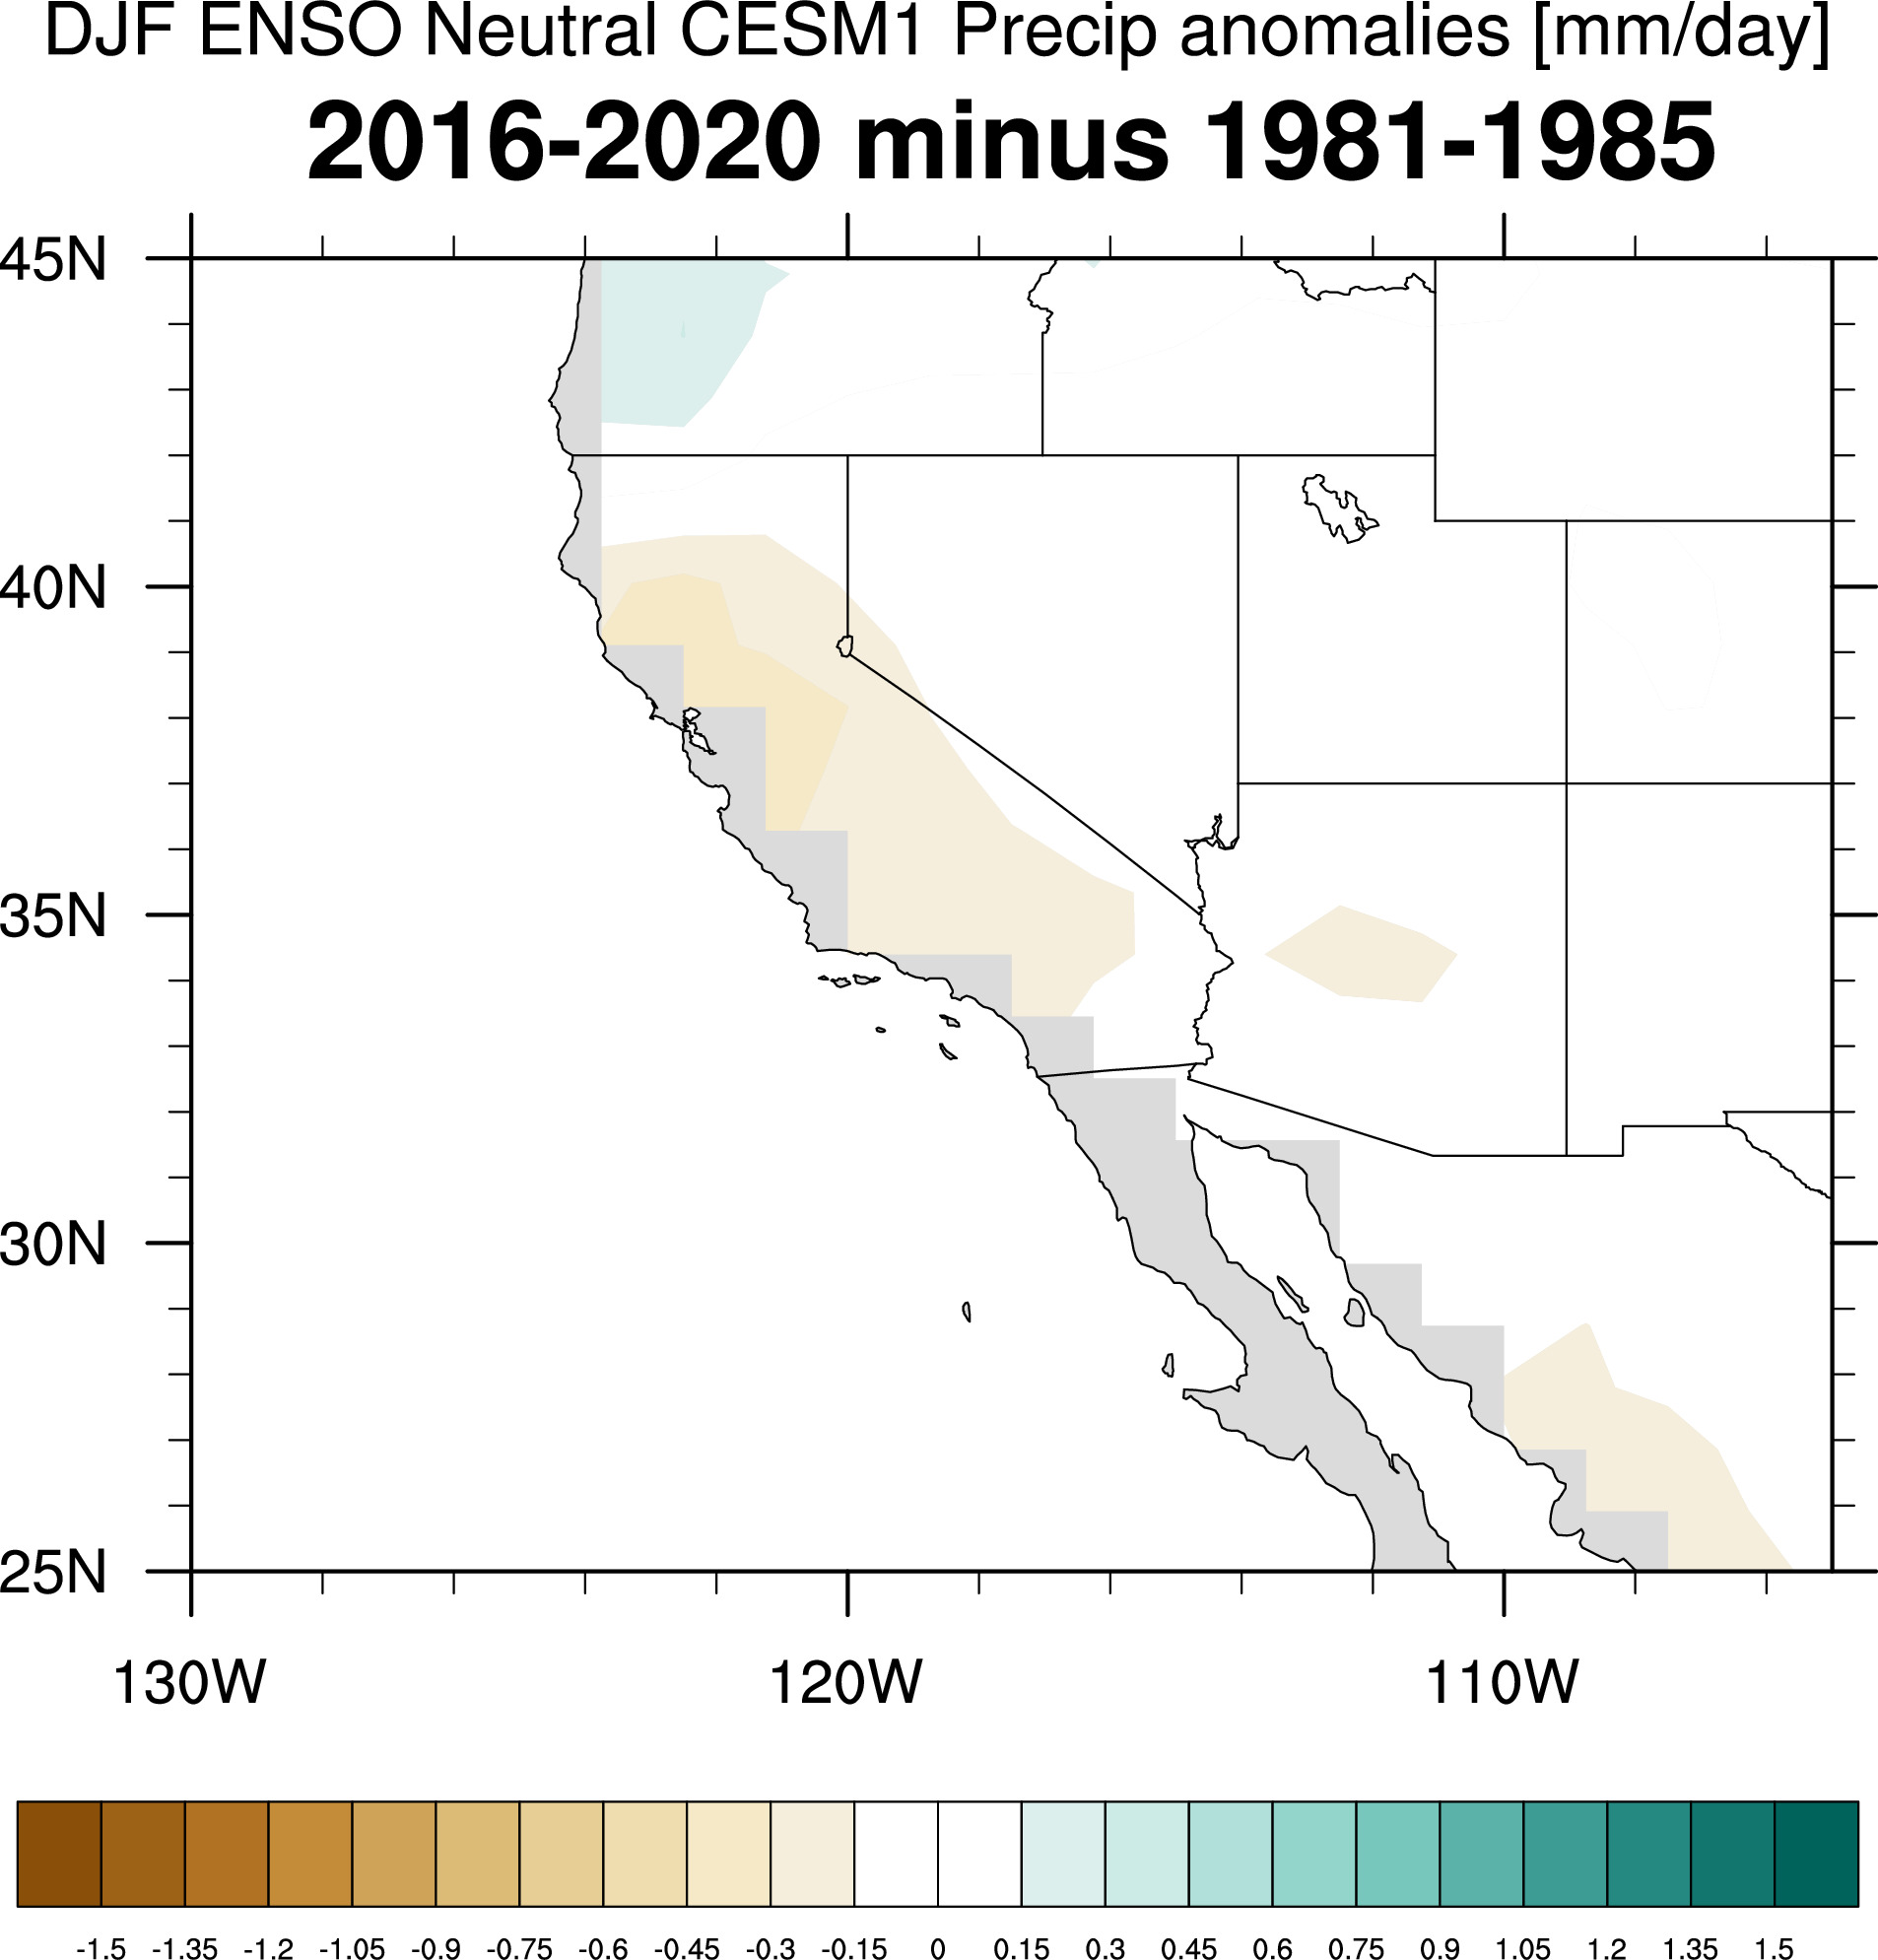
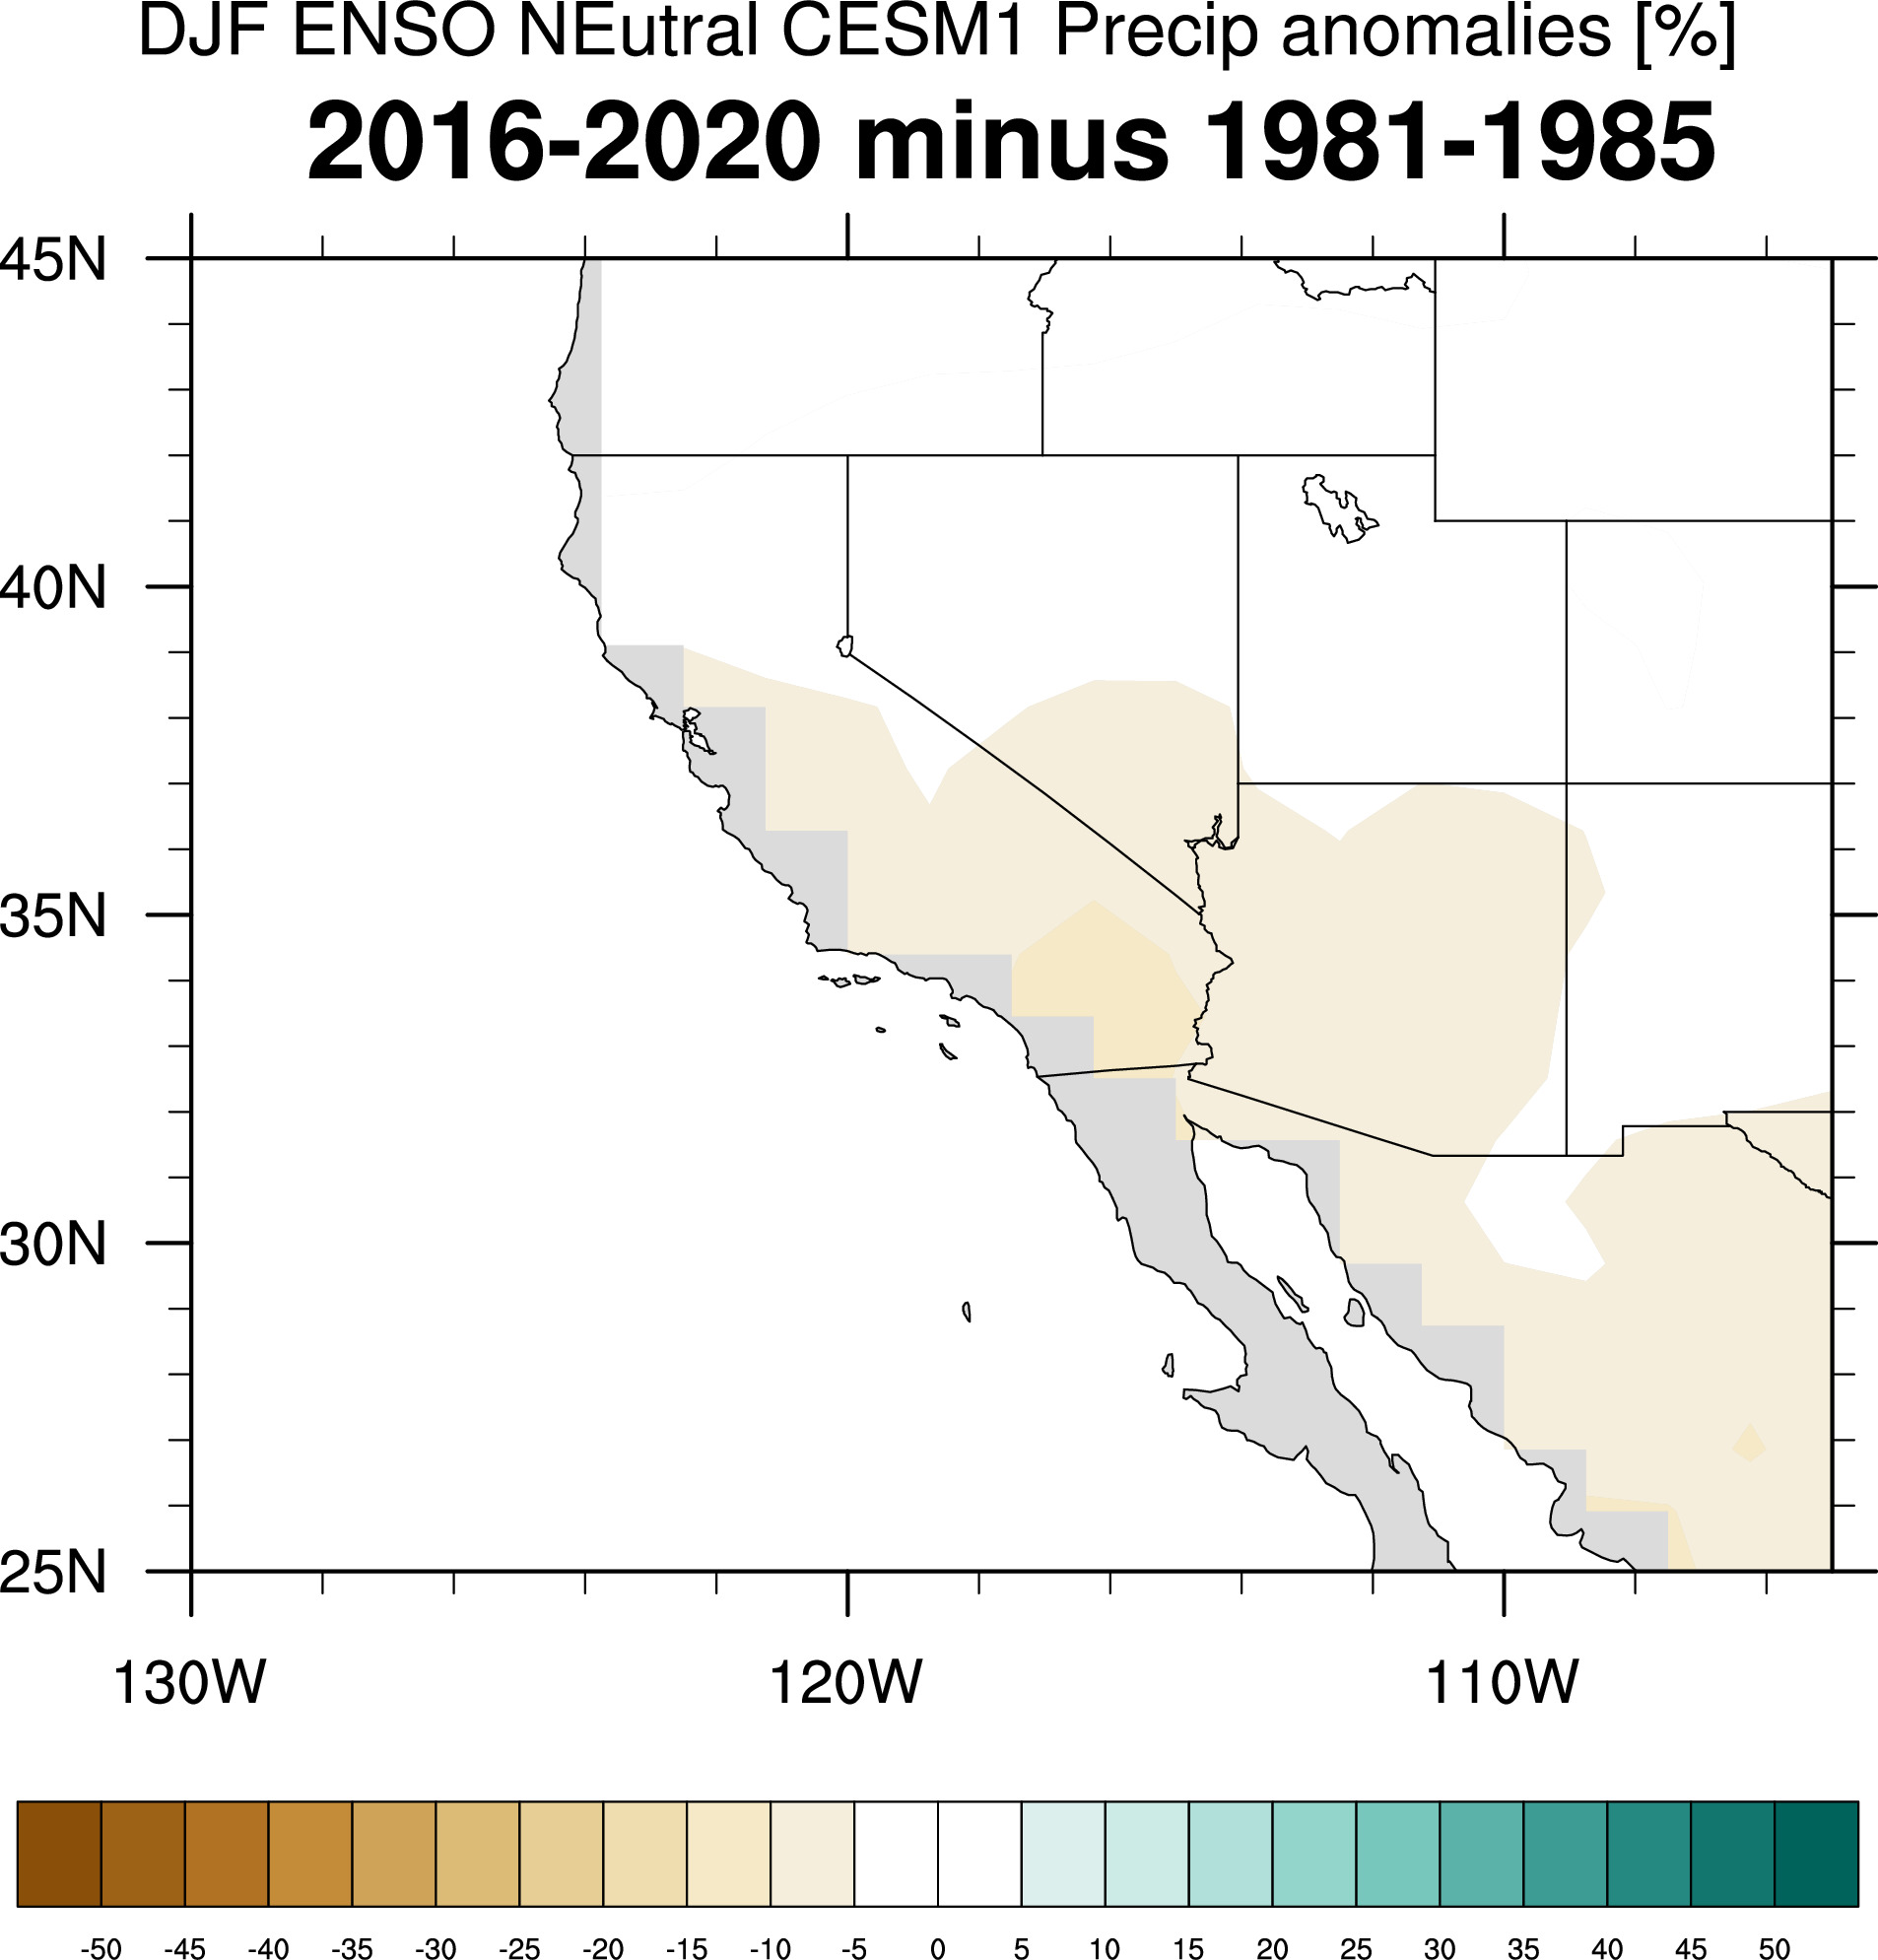
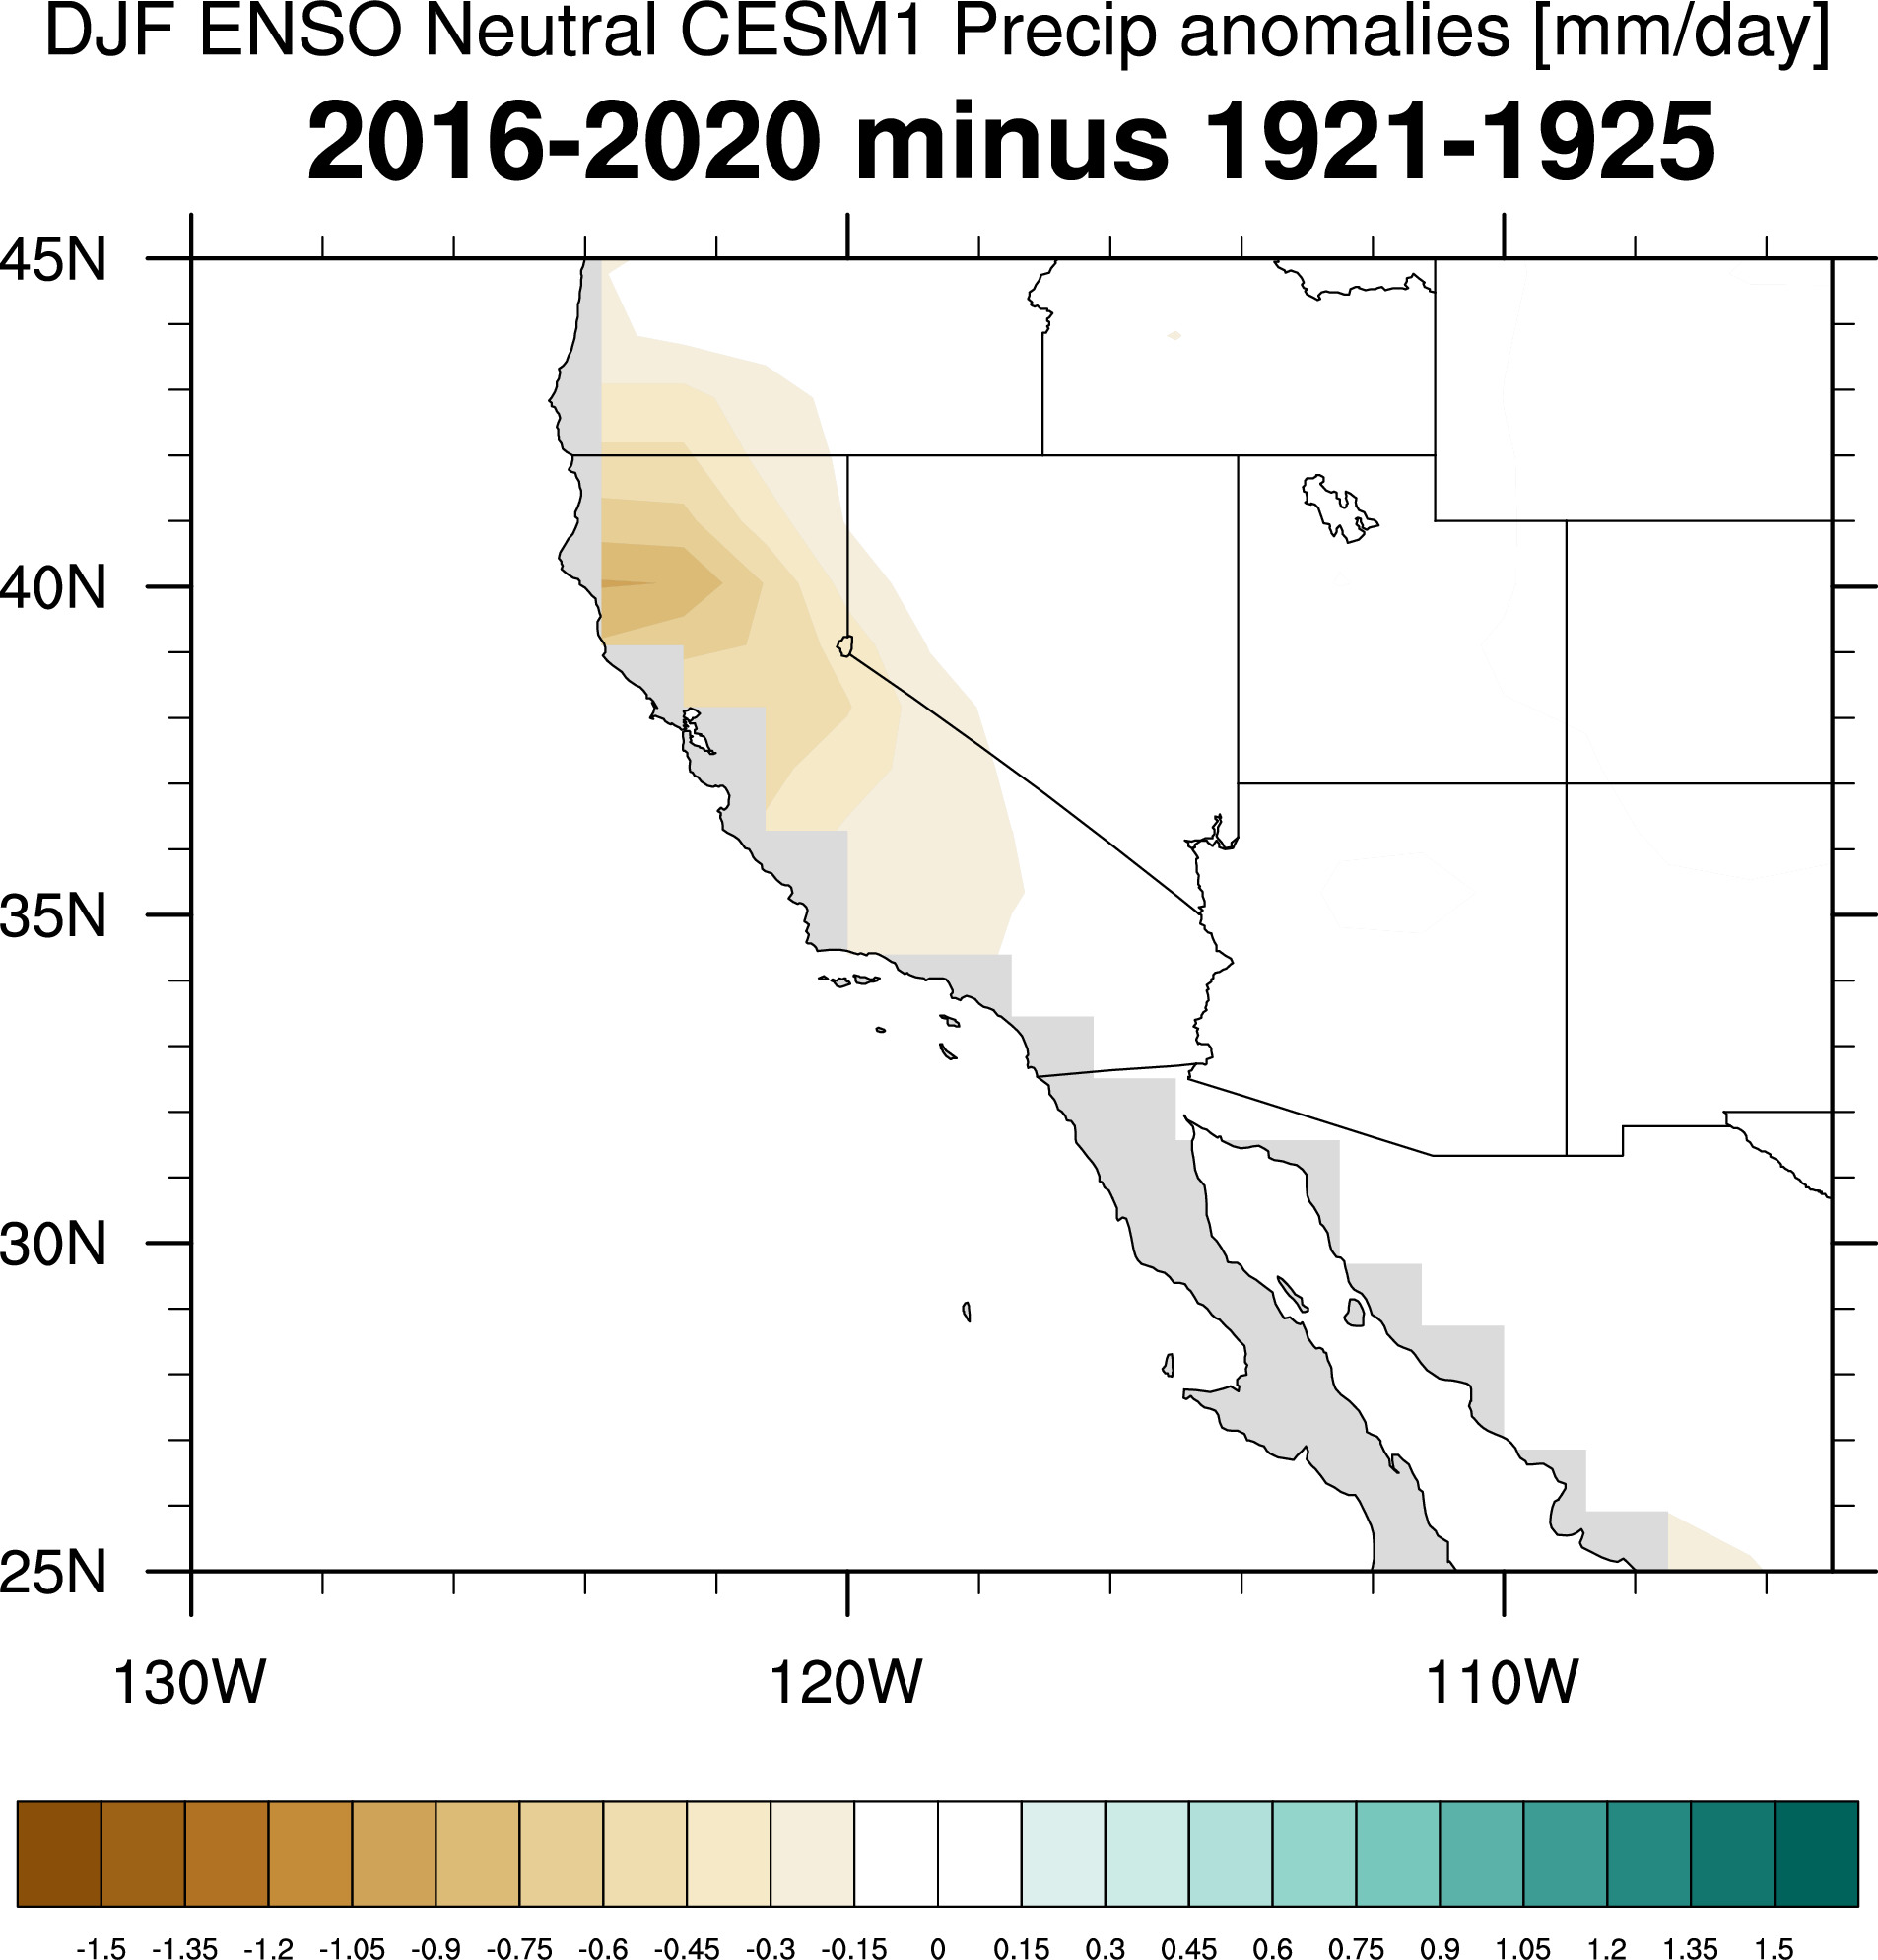
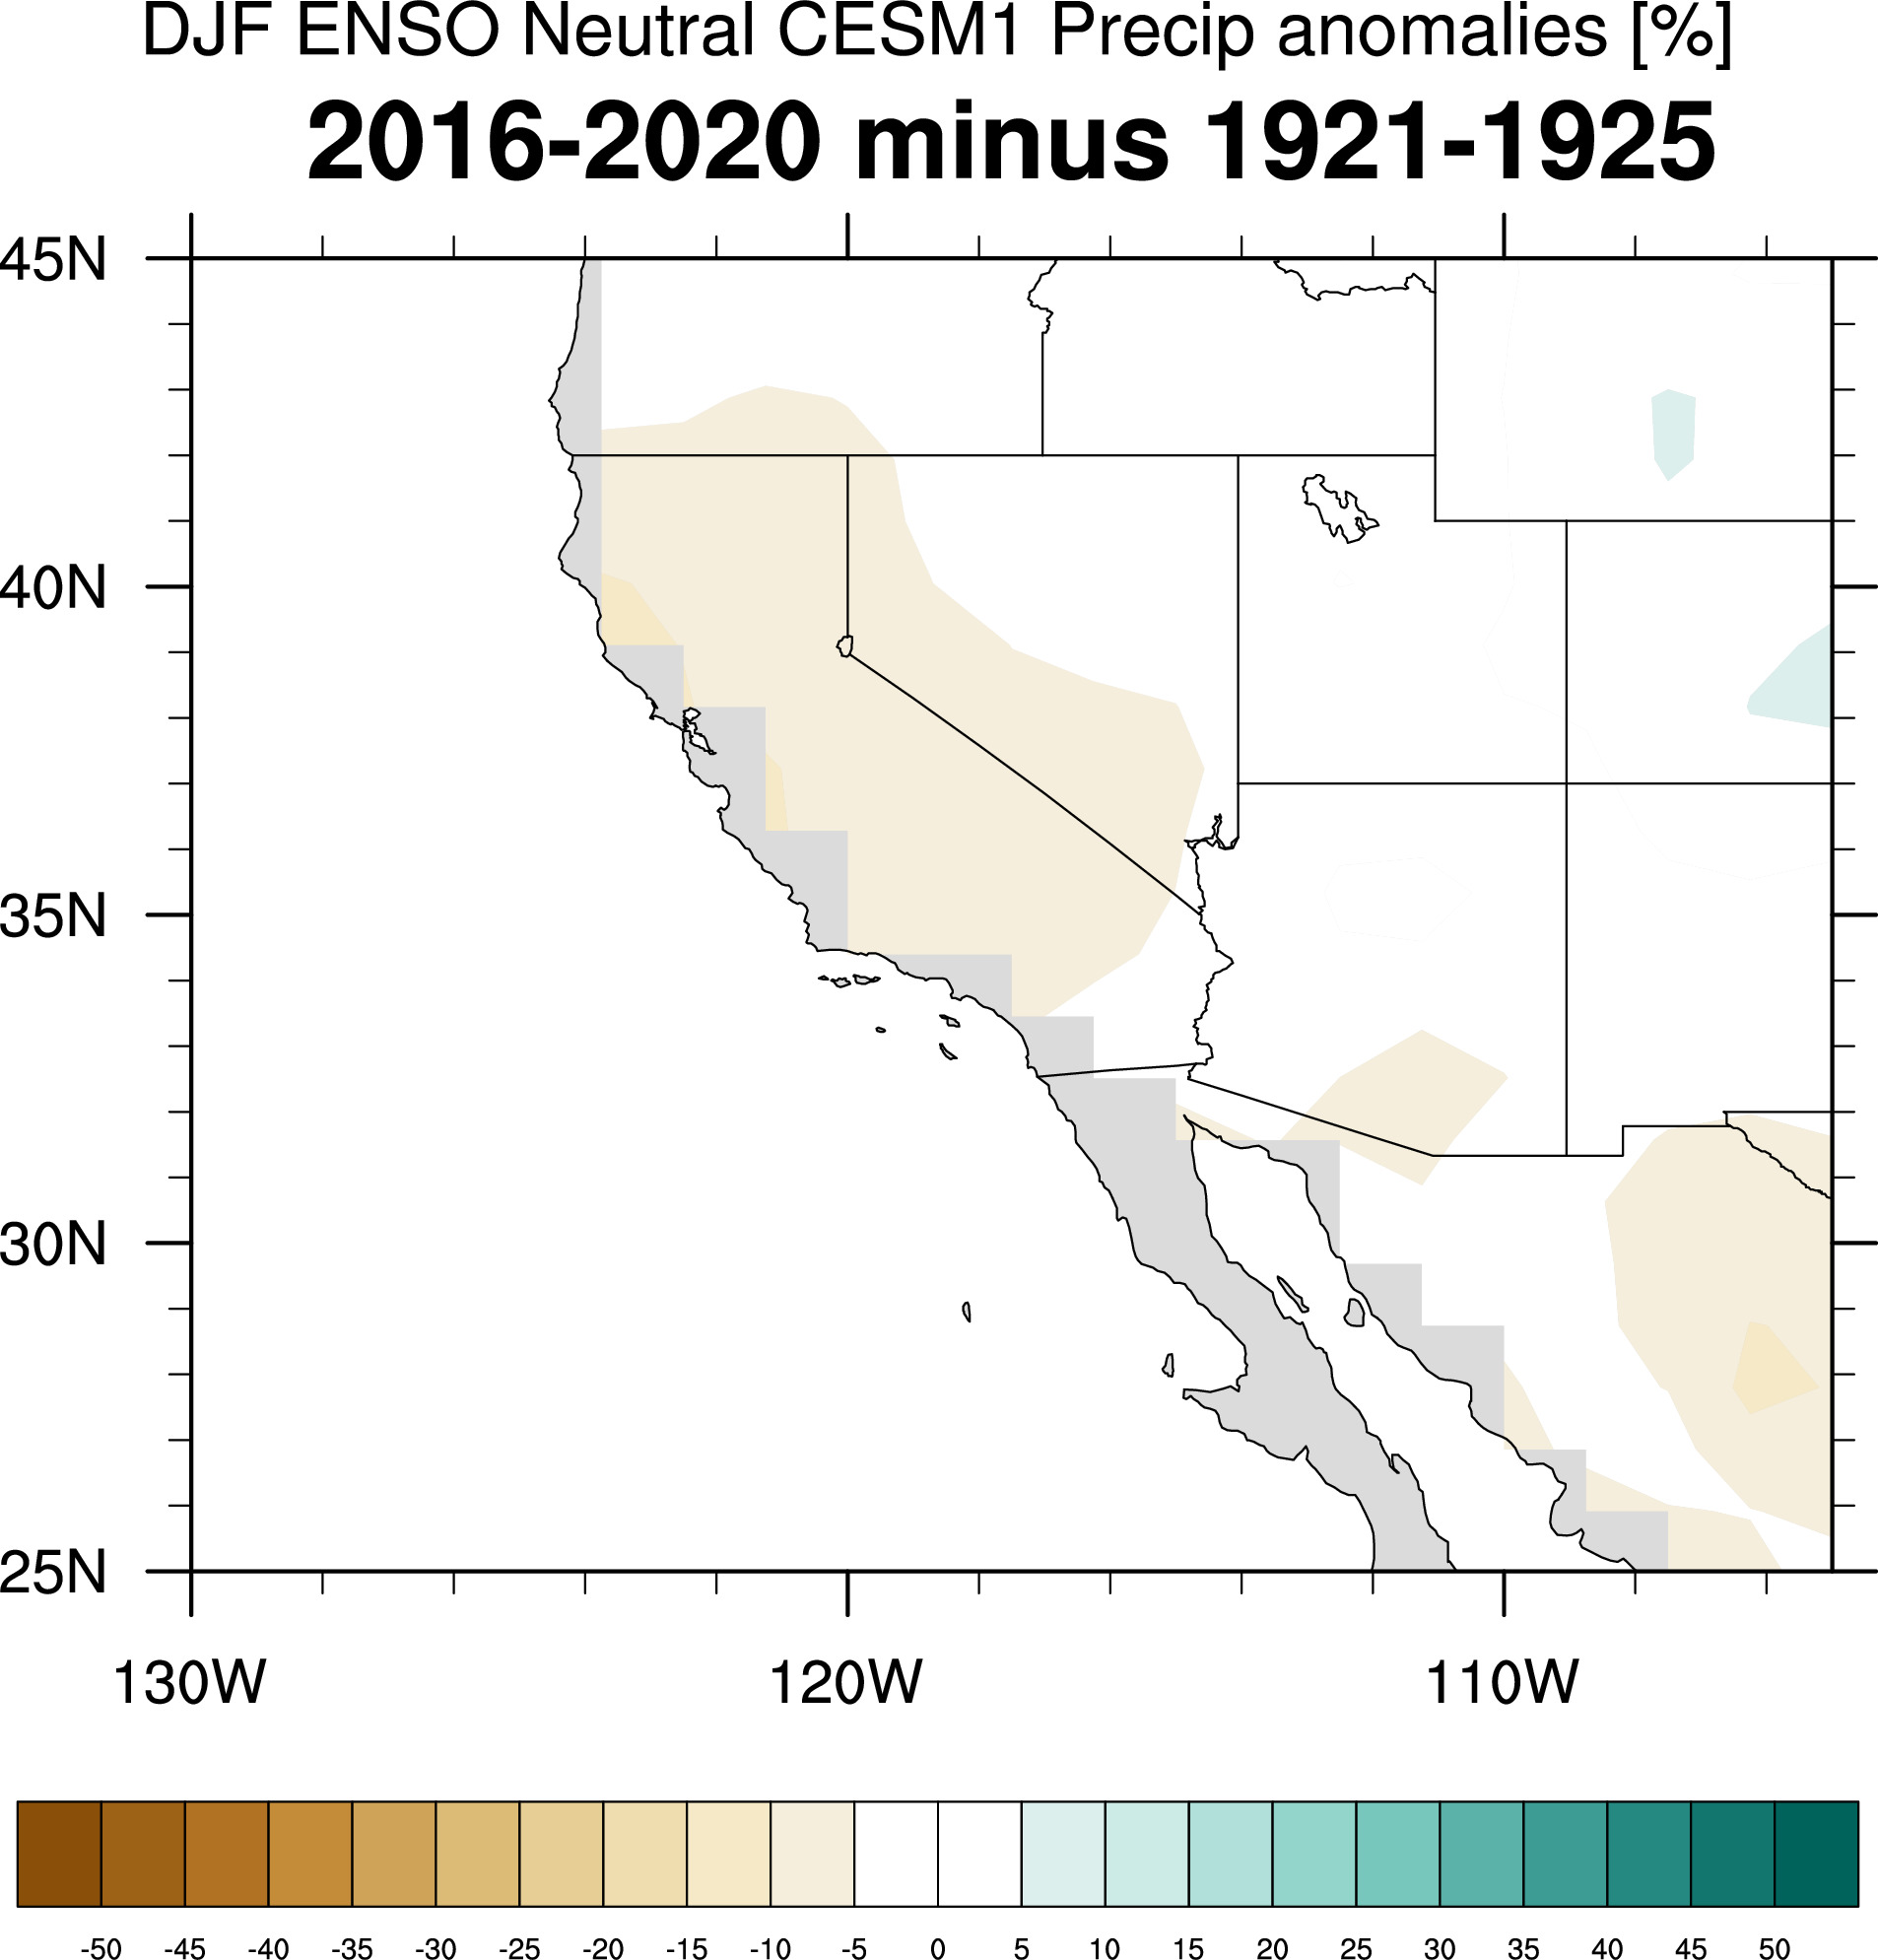
Precipitation Anomaly Maps

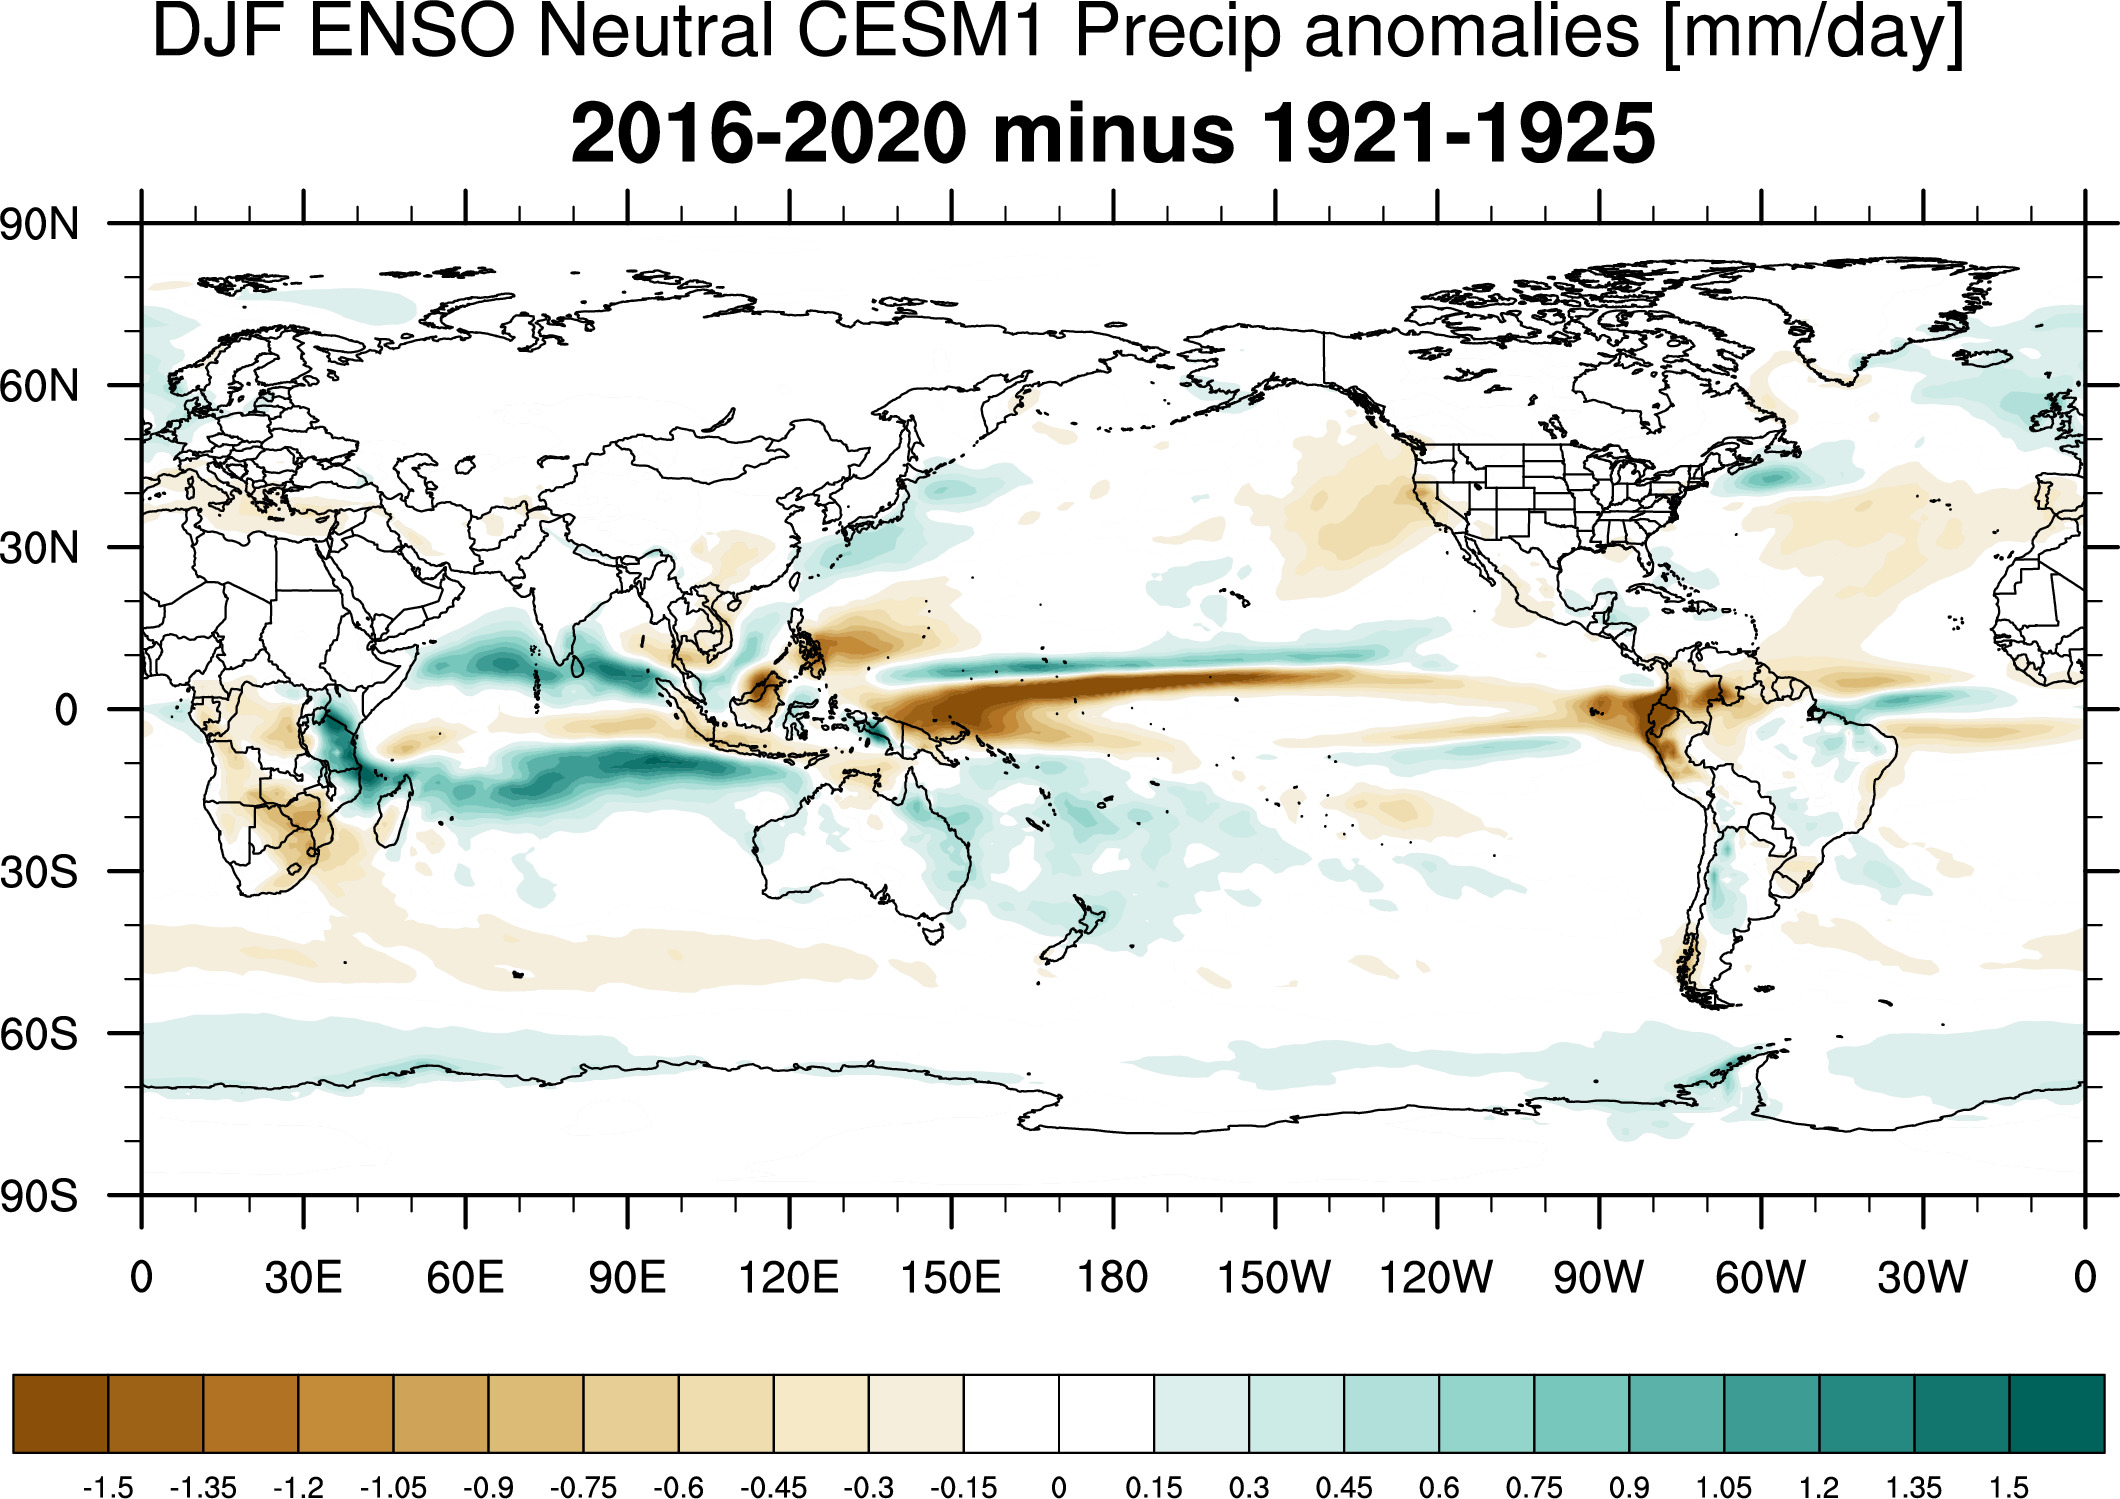
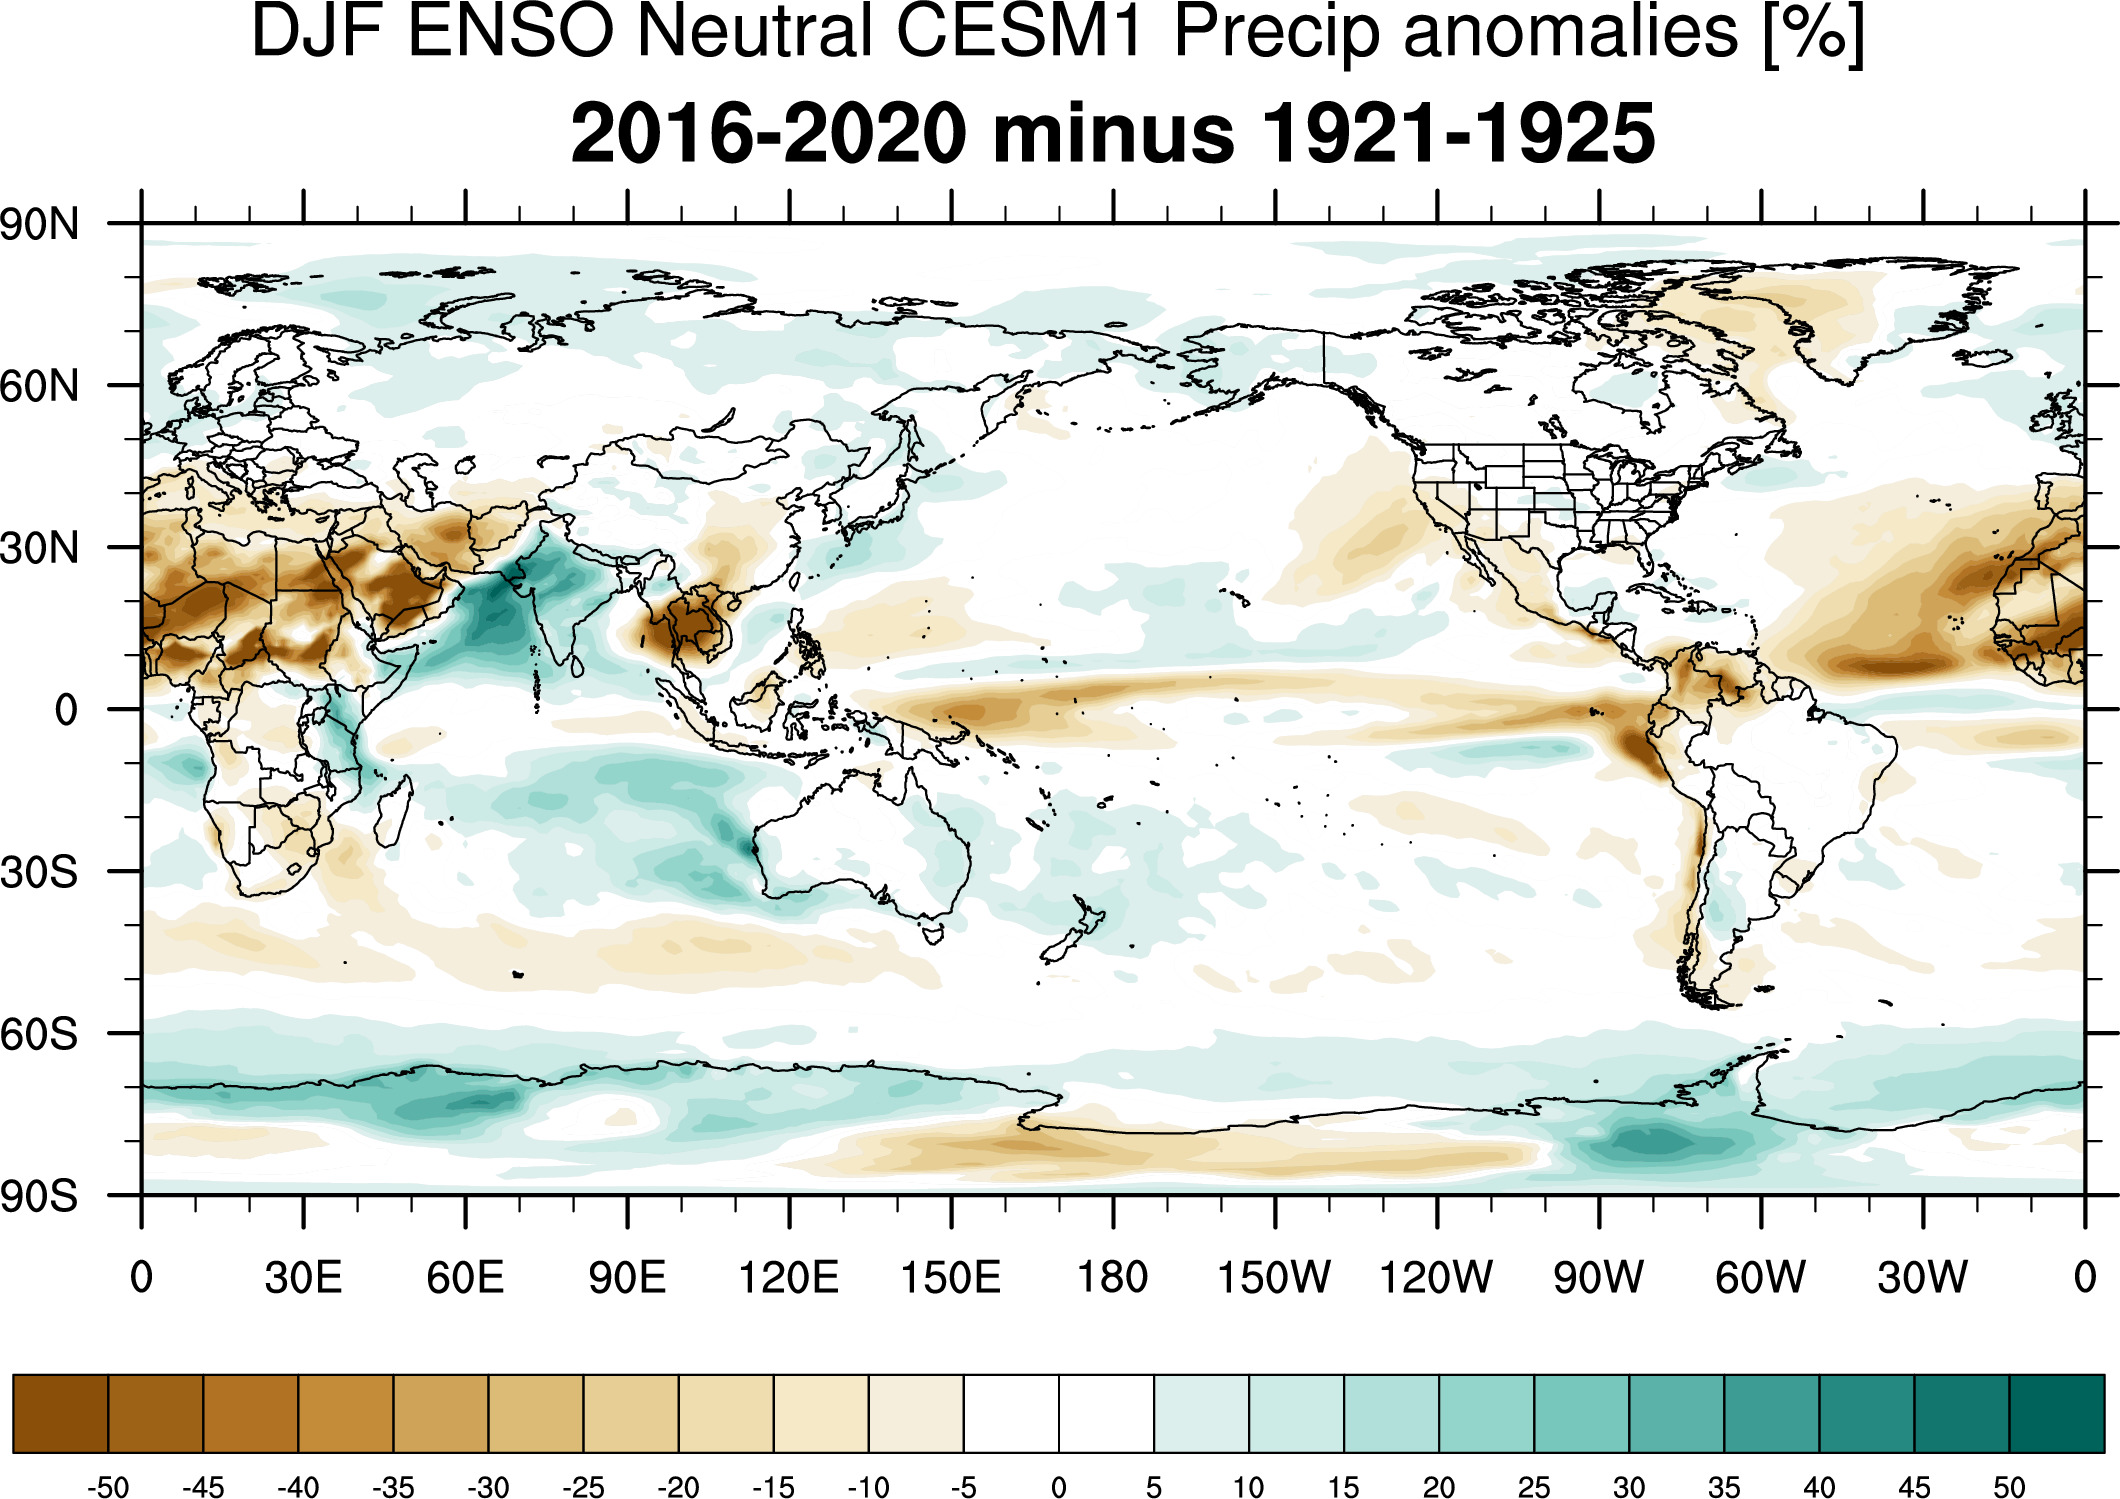
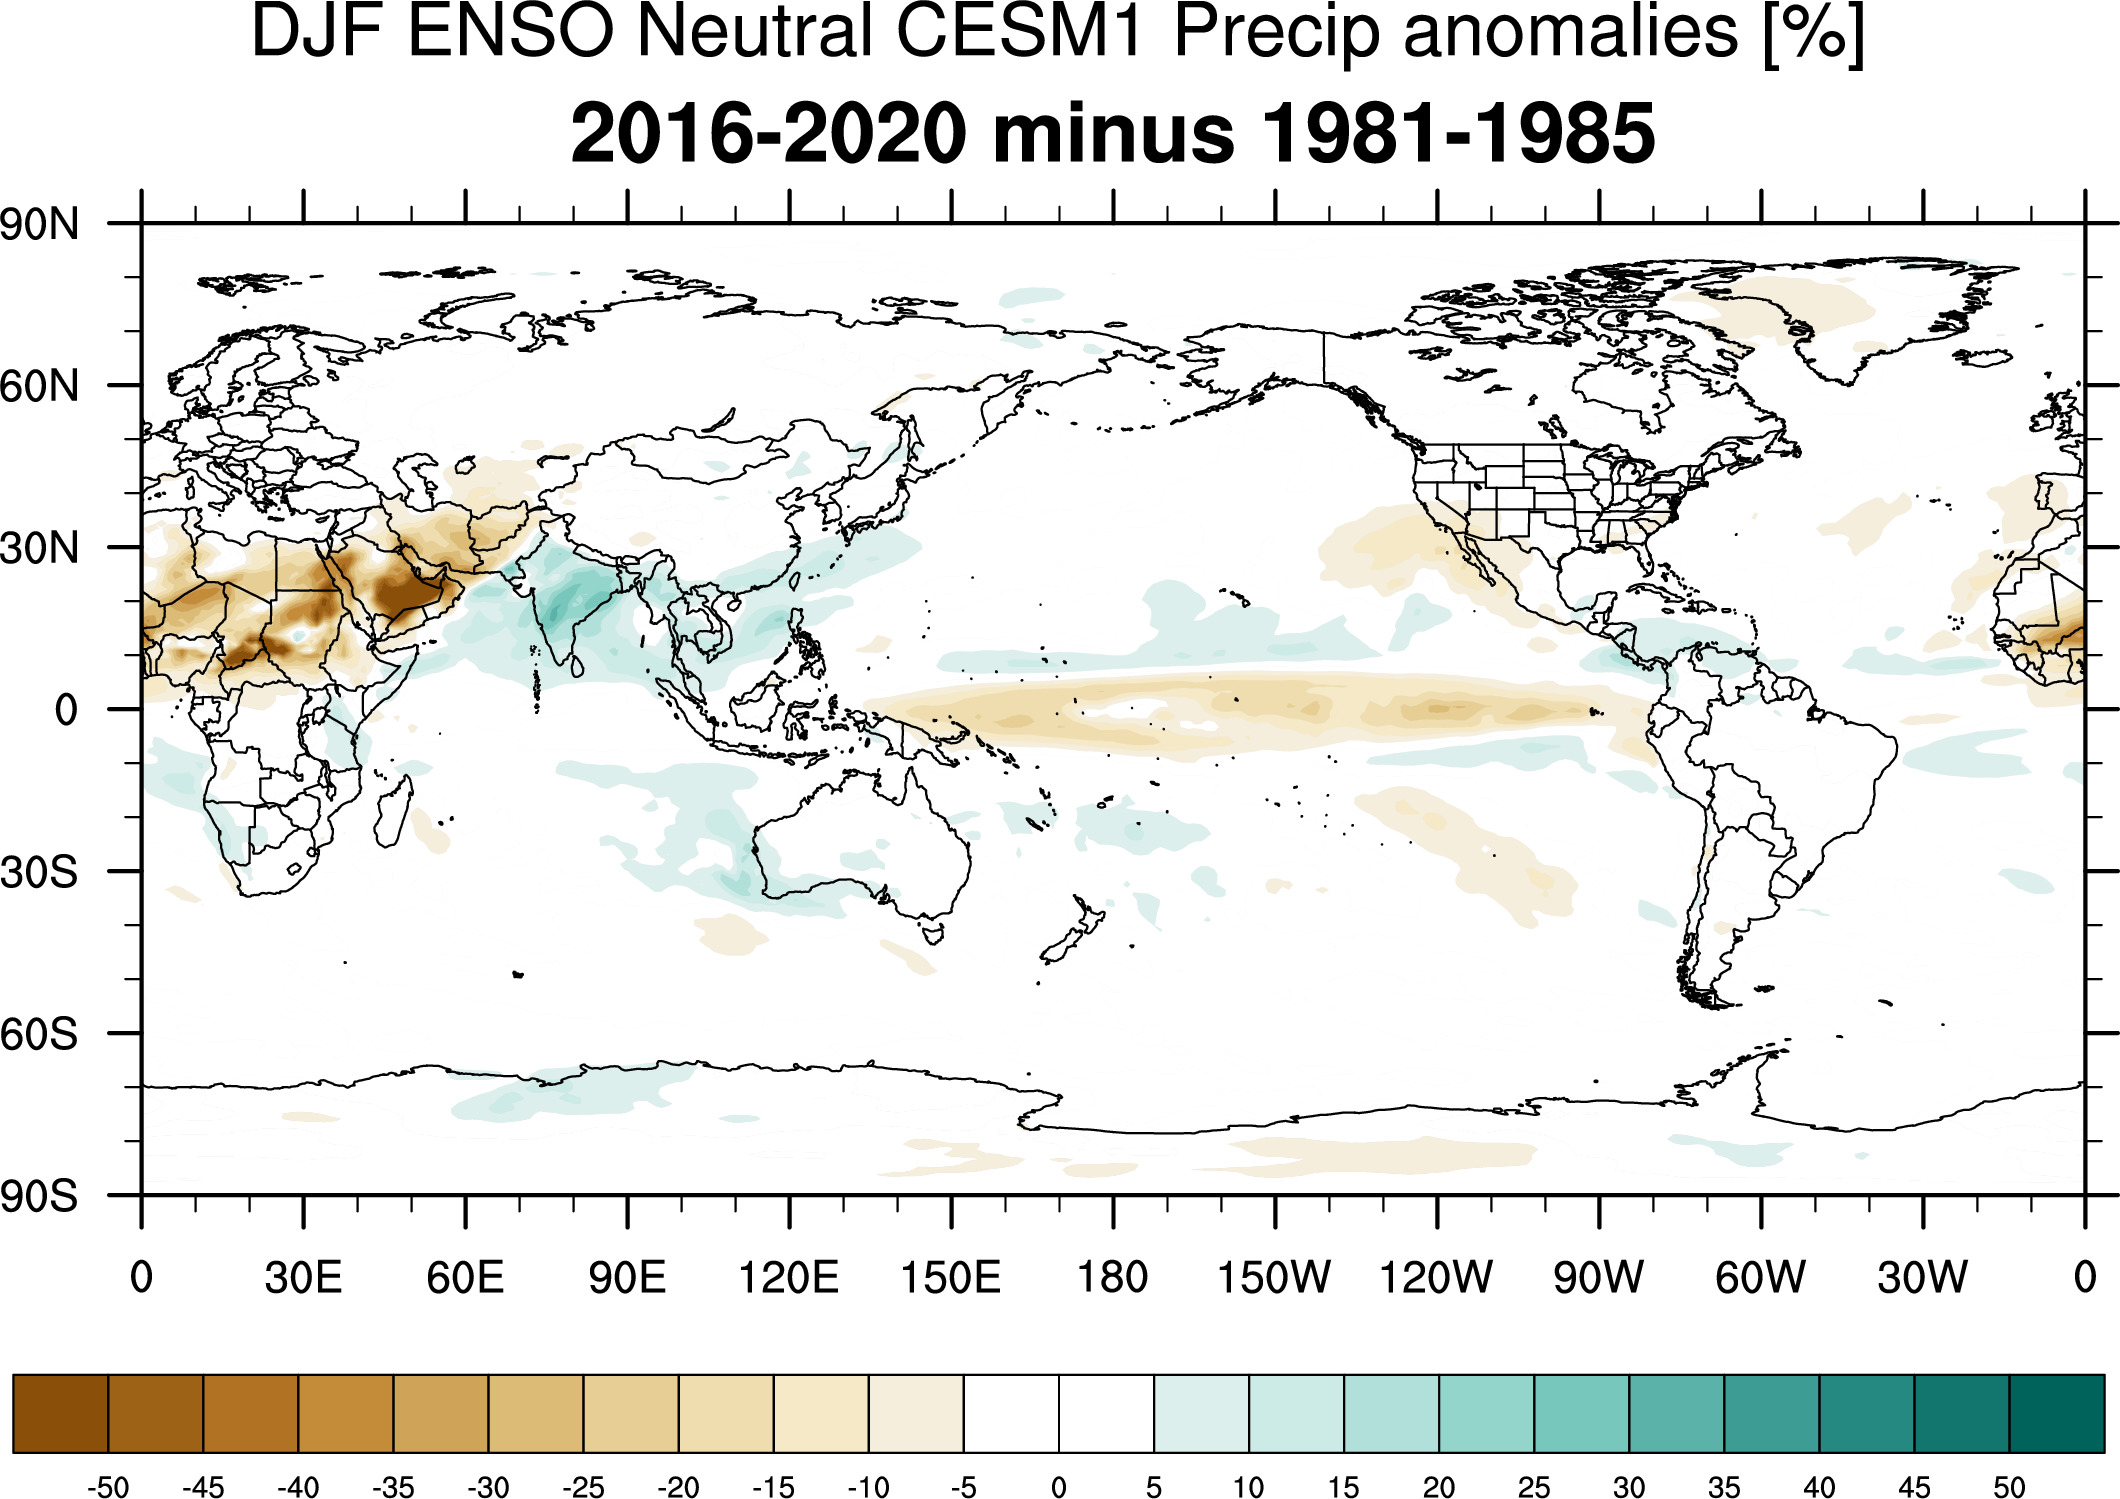
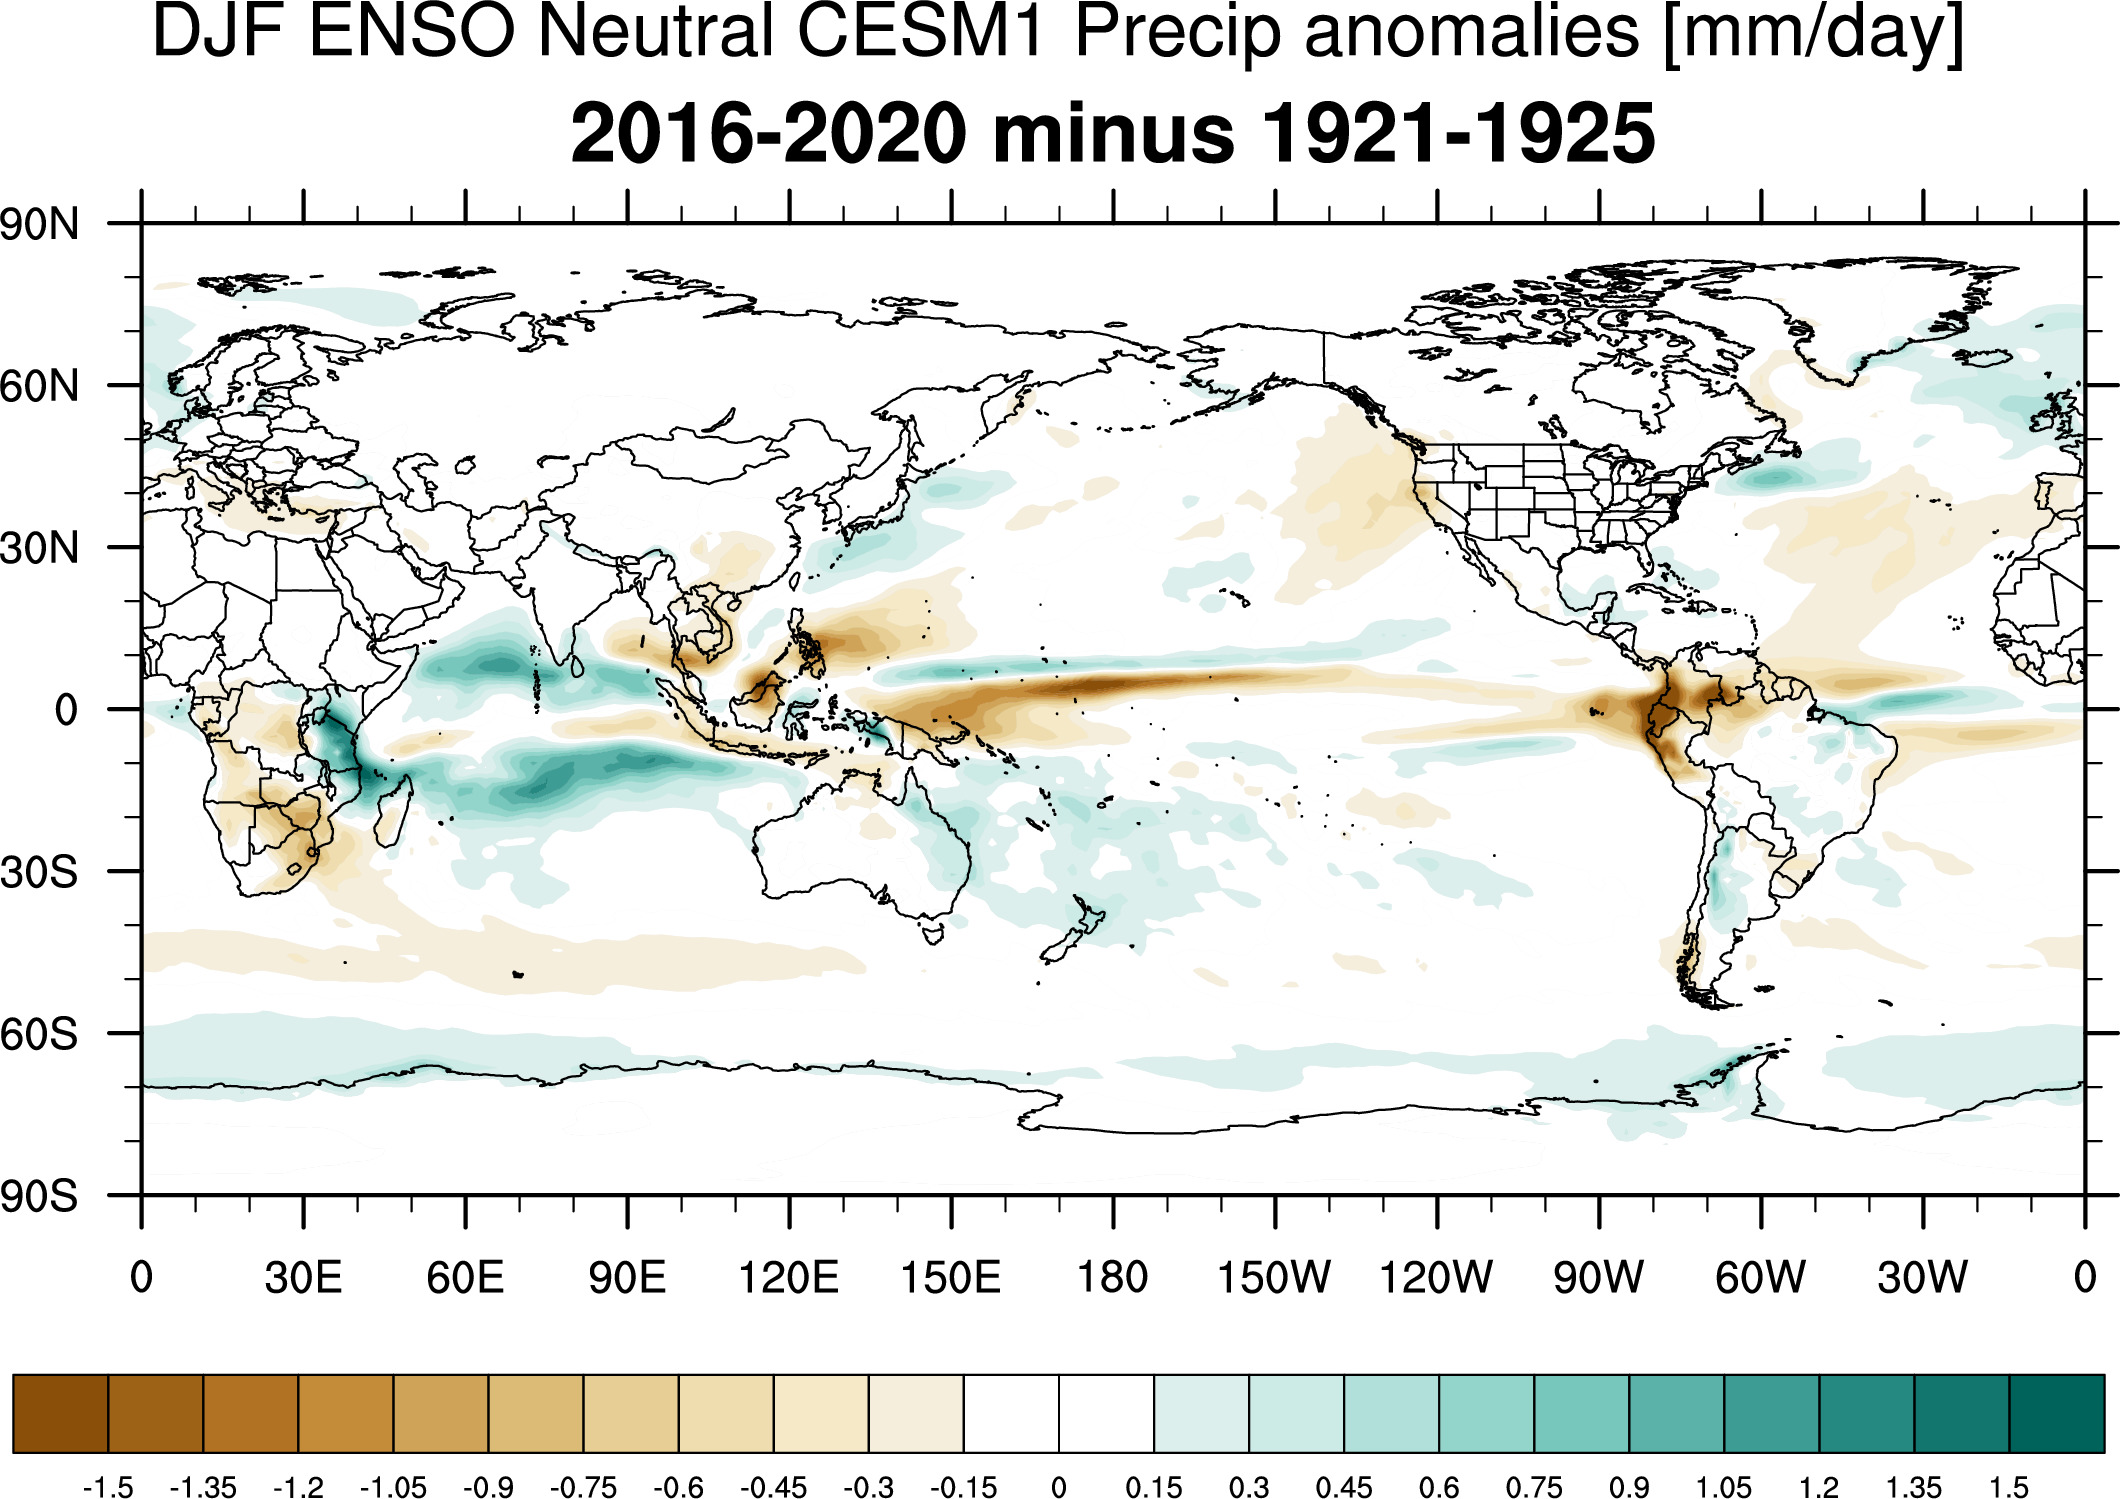
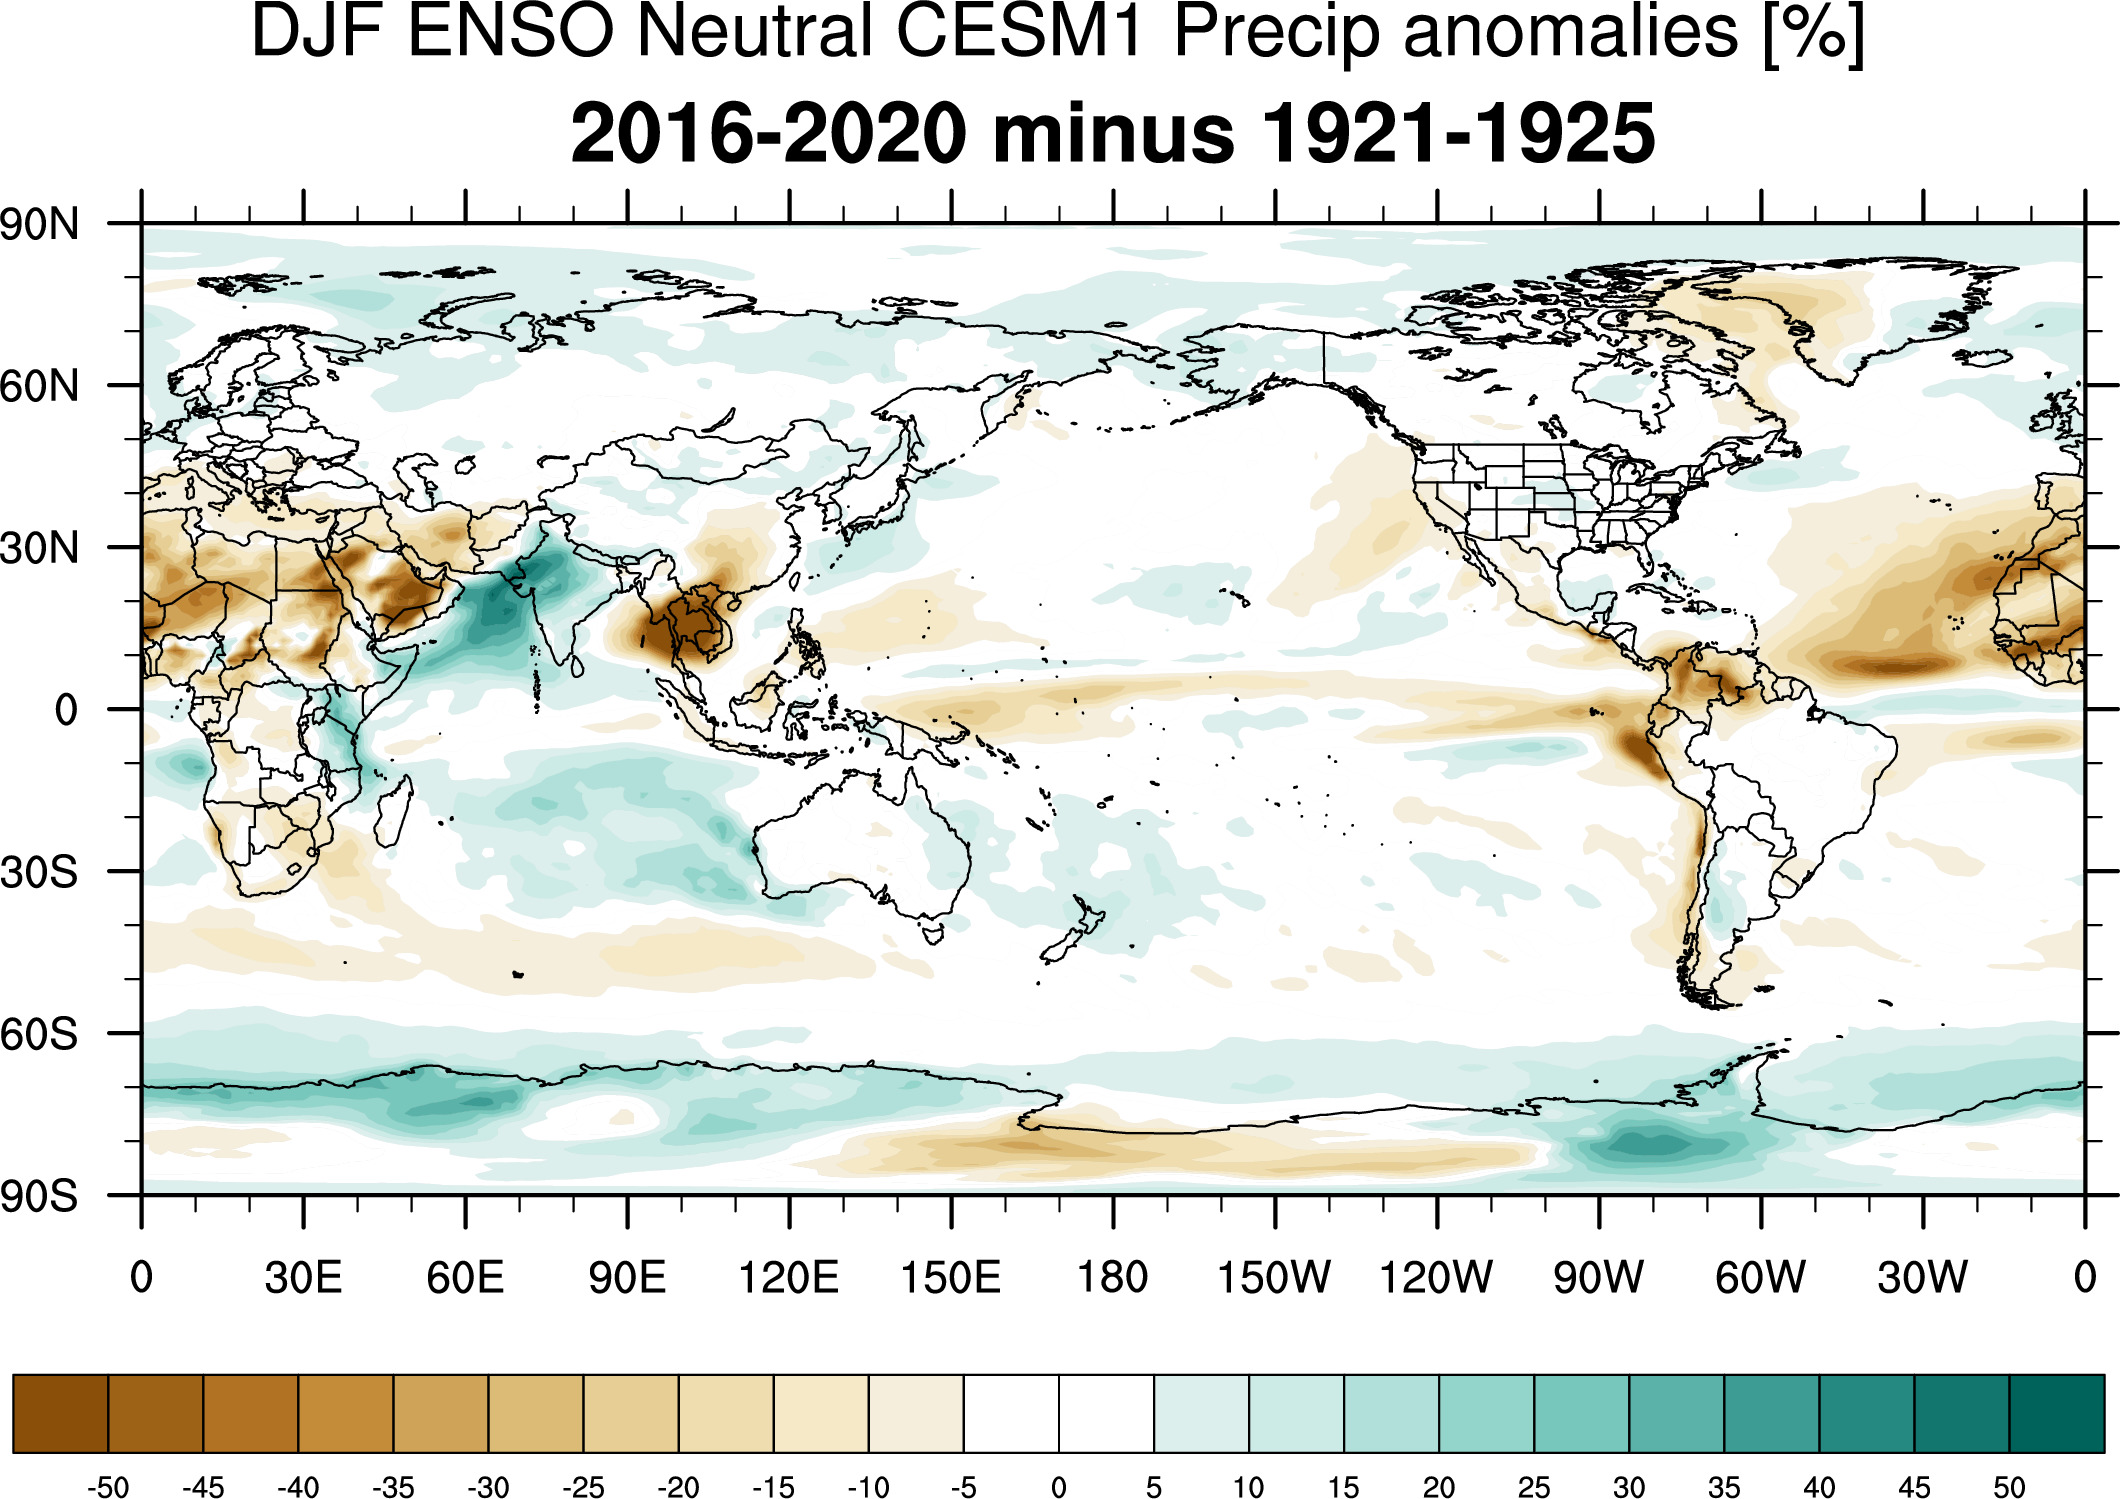
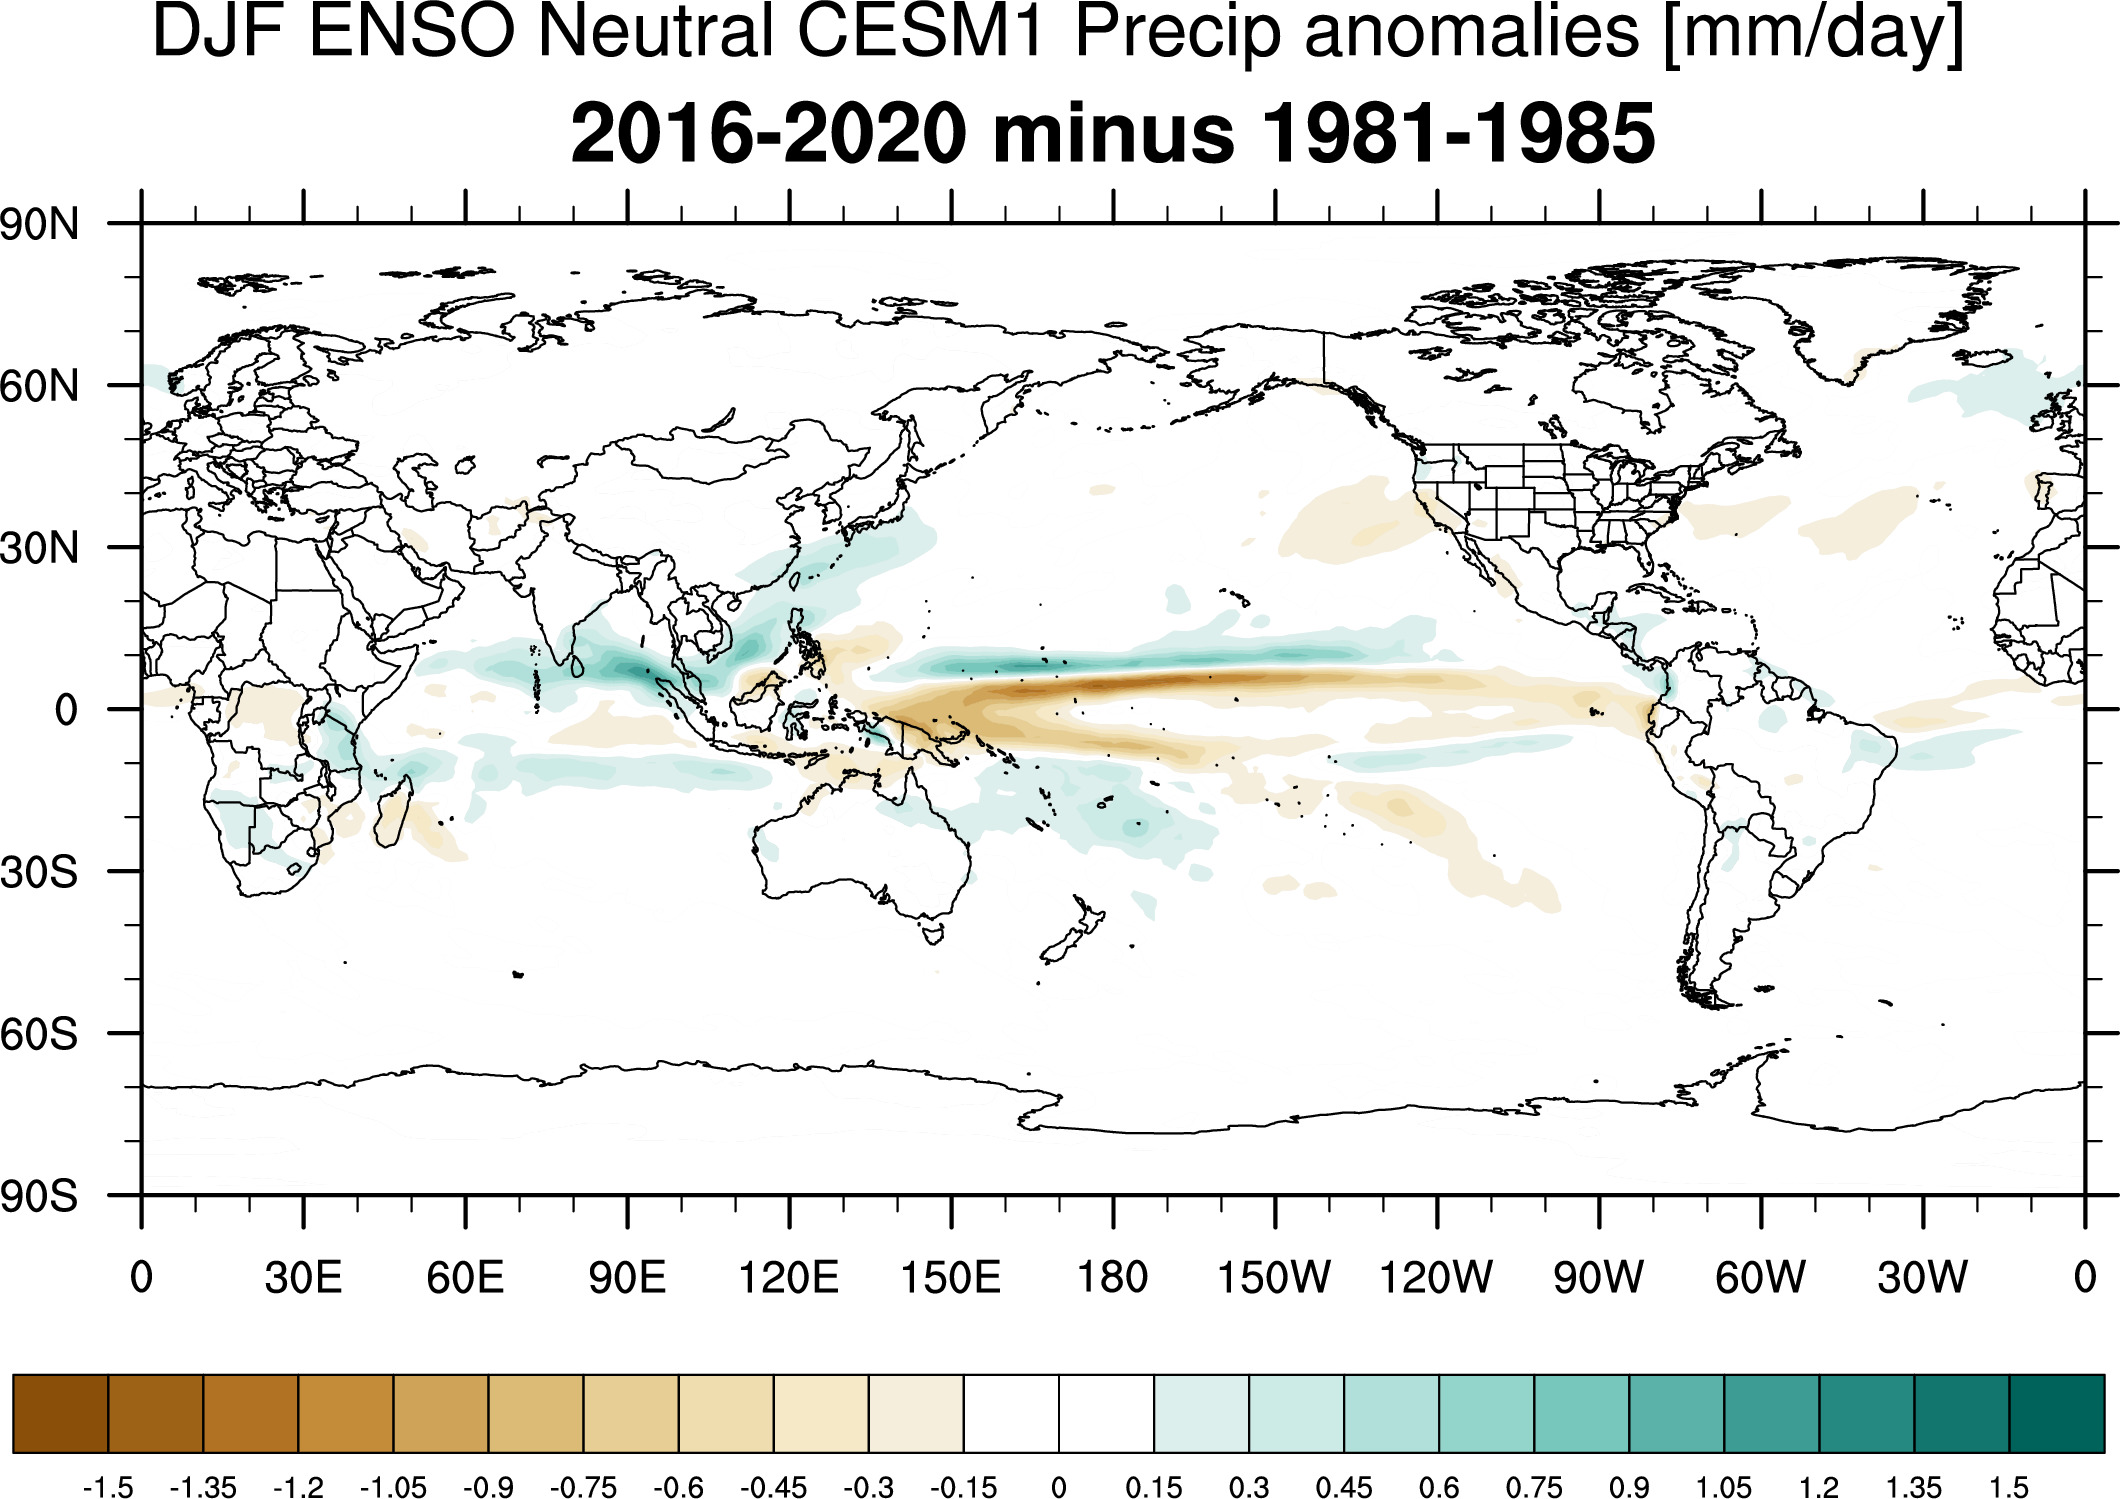
Differences

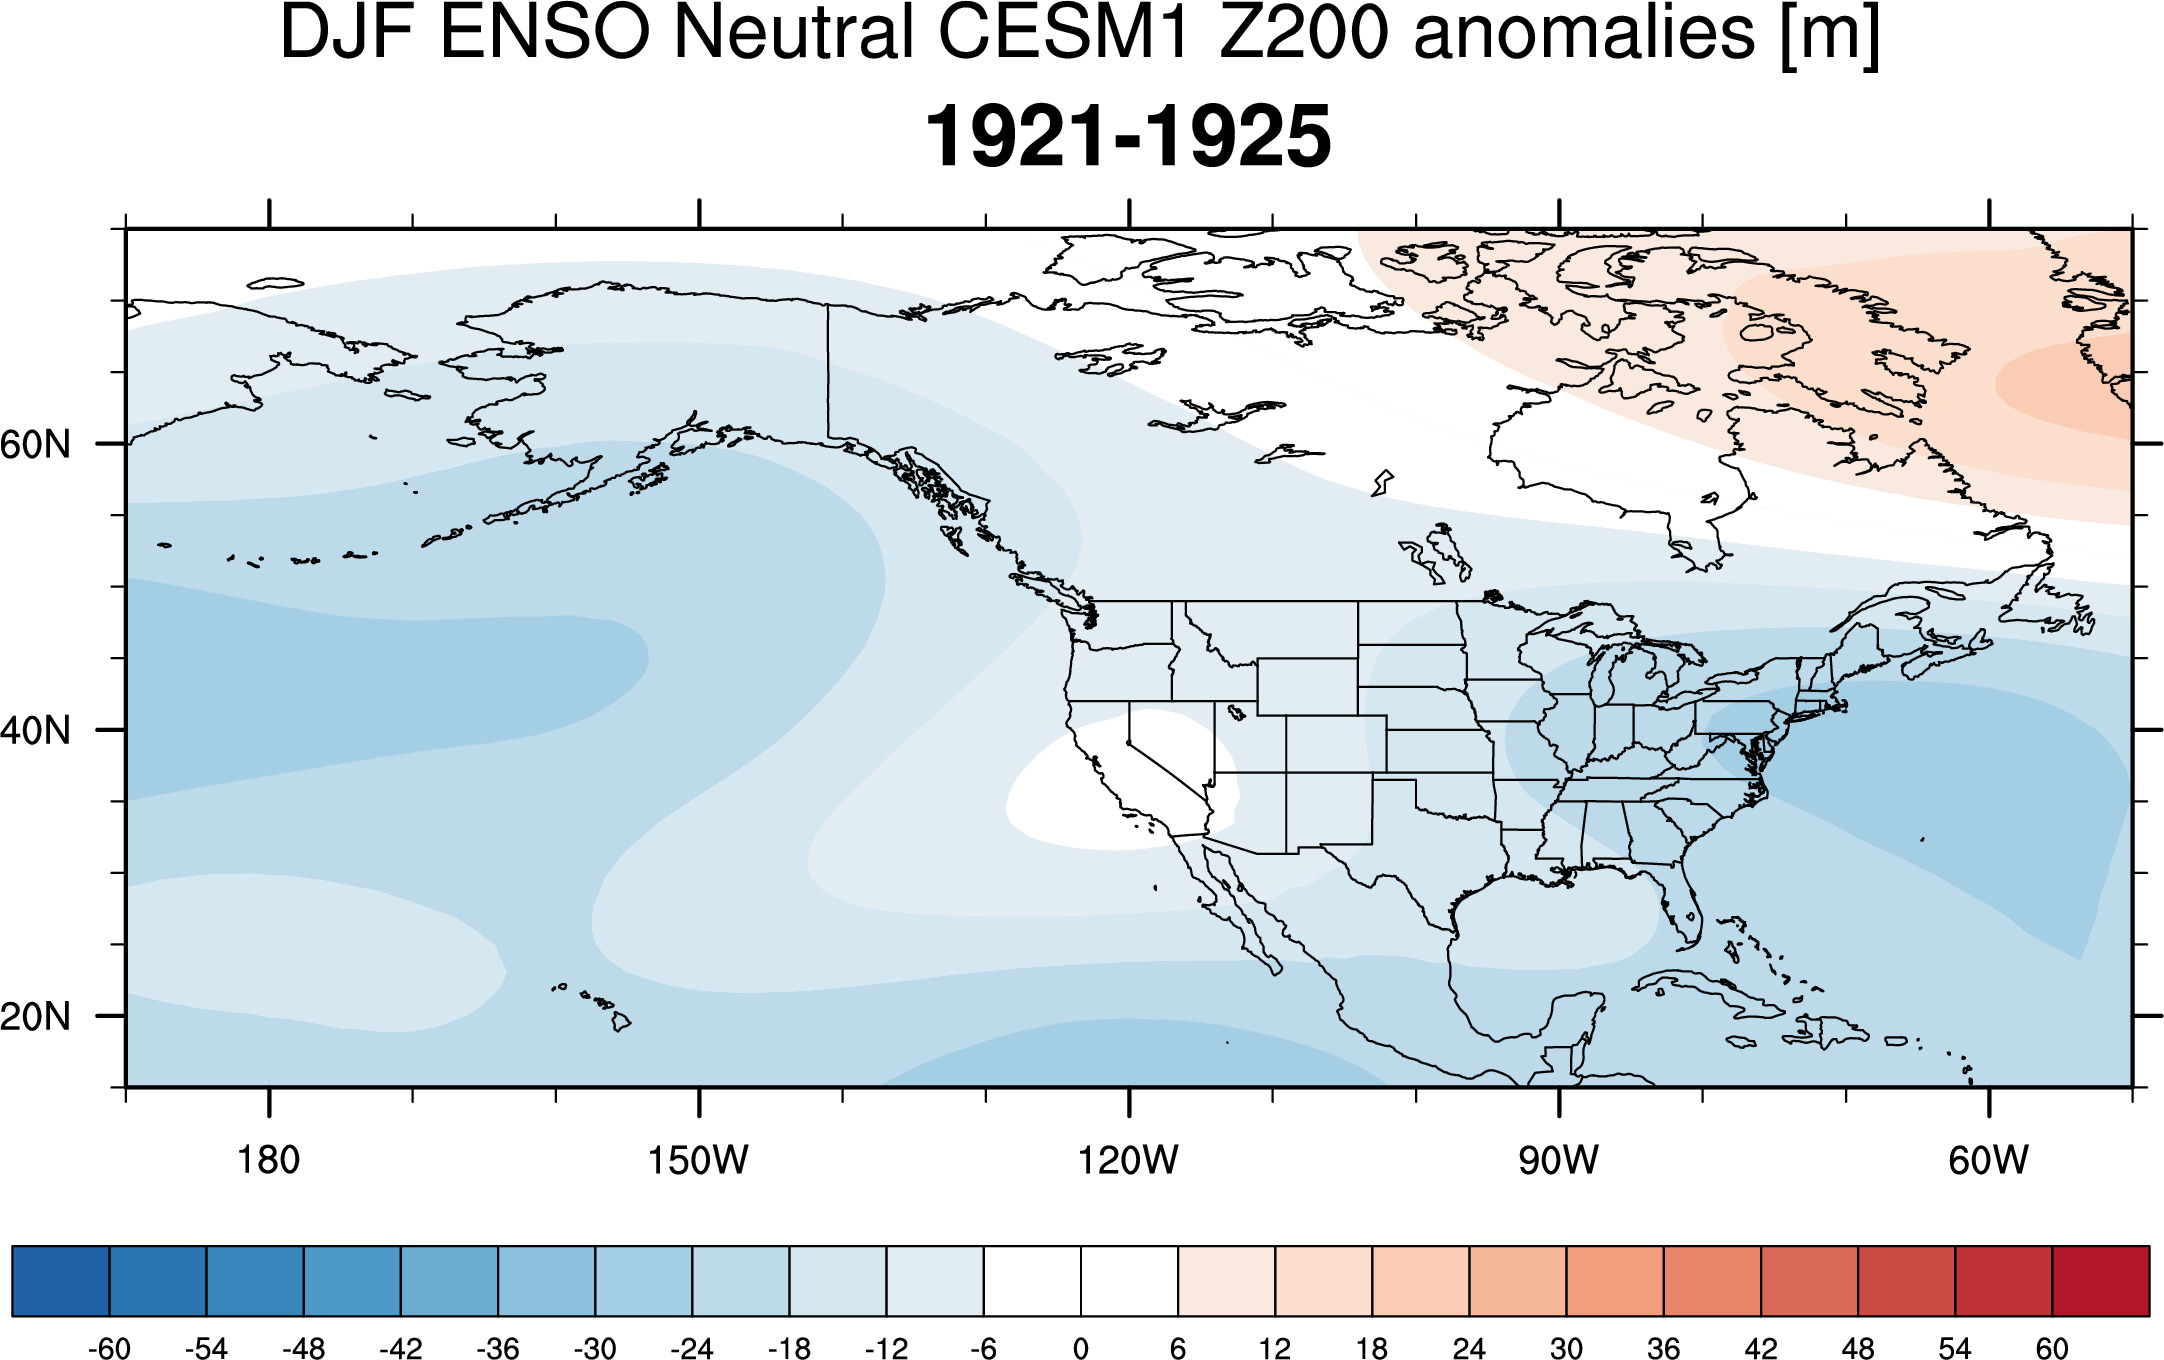
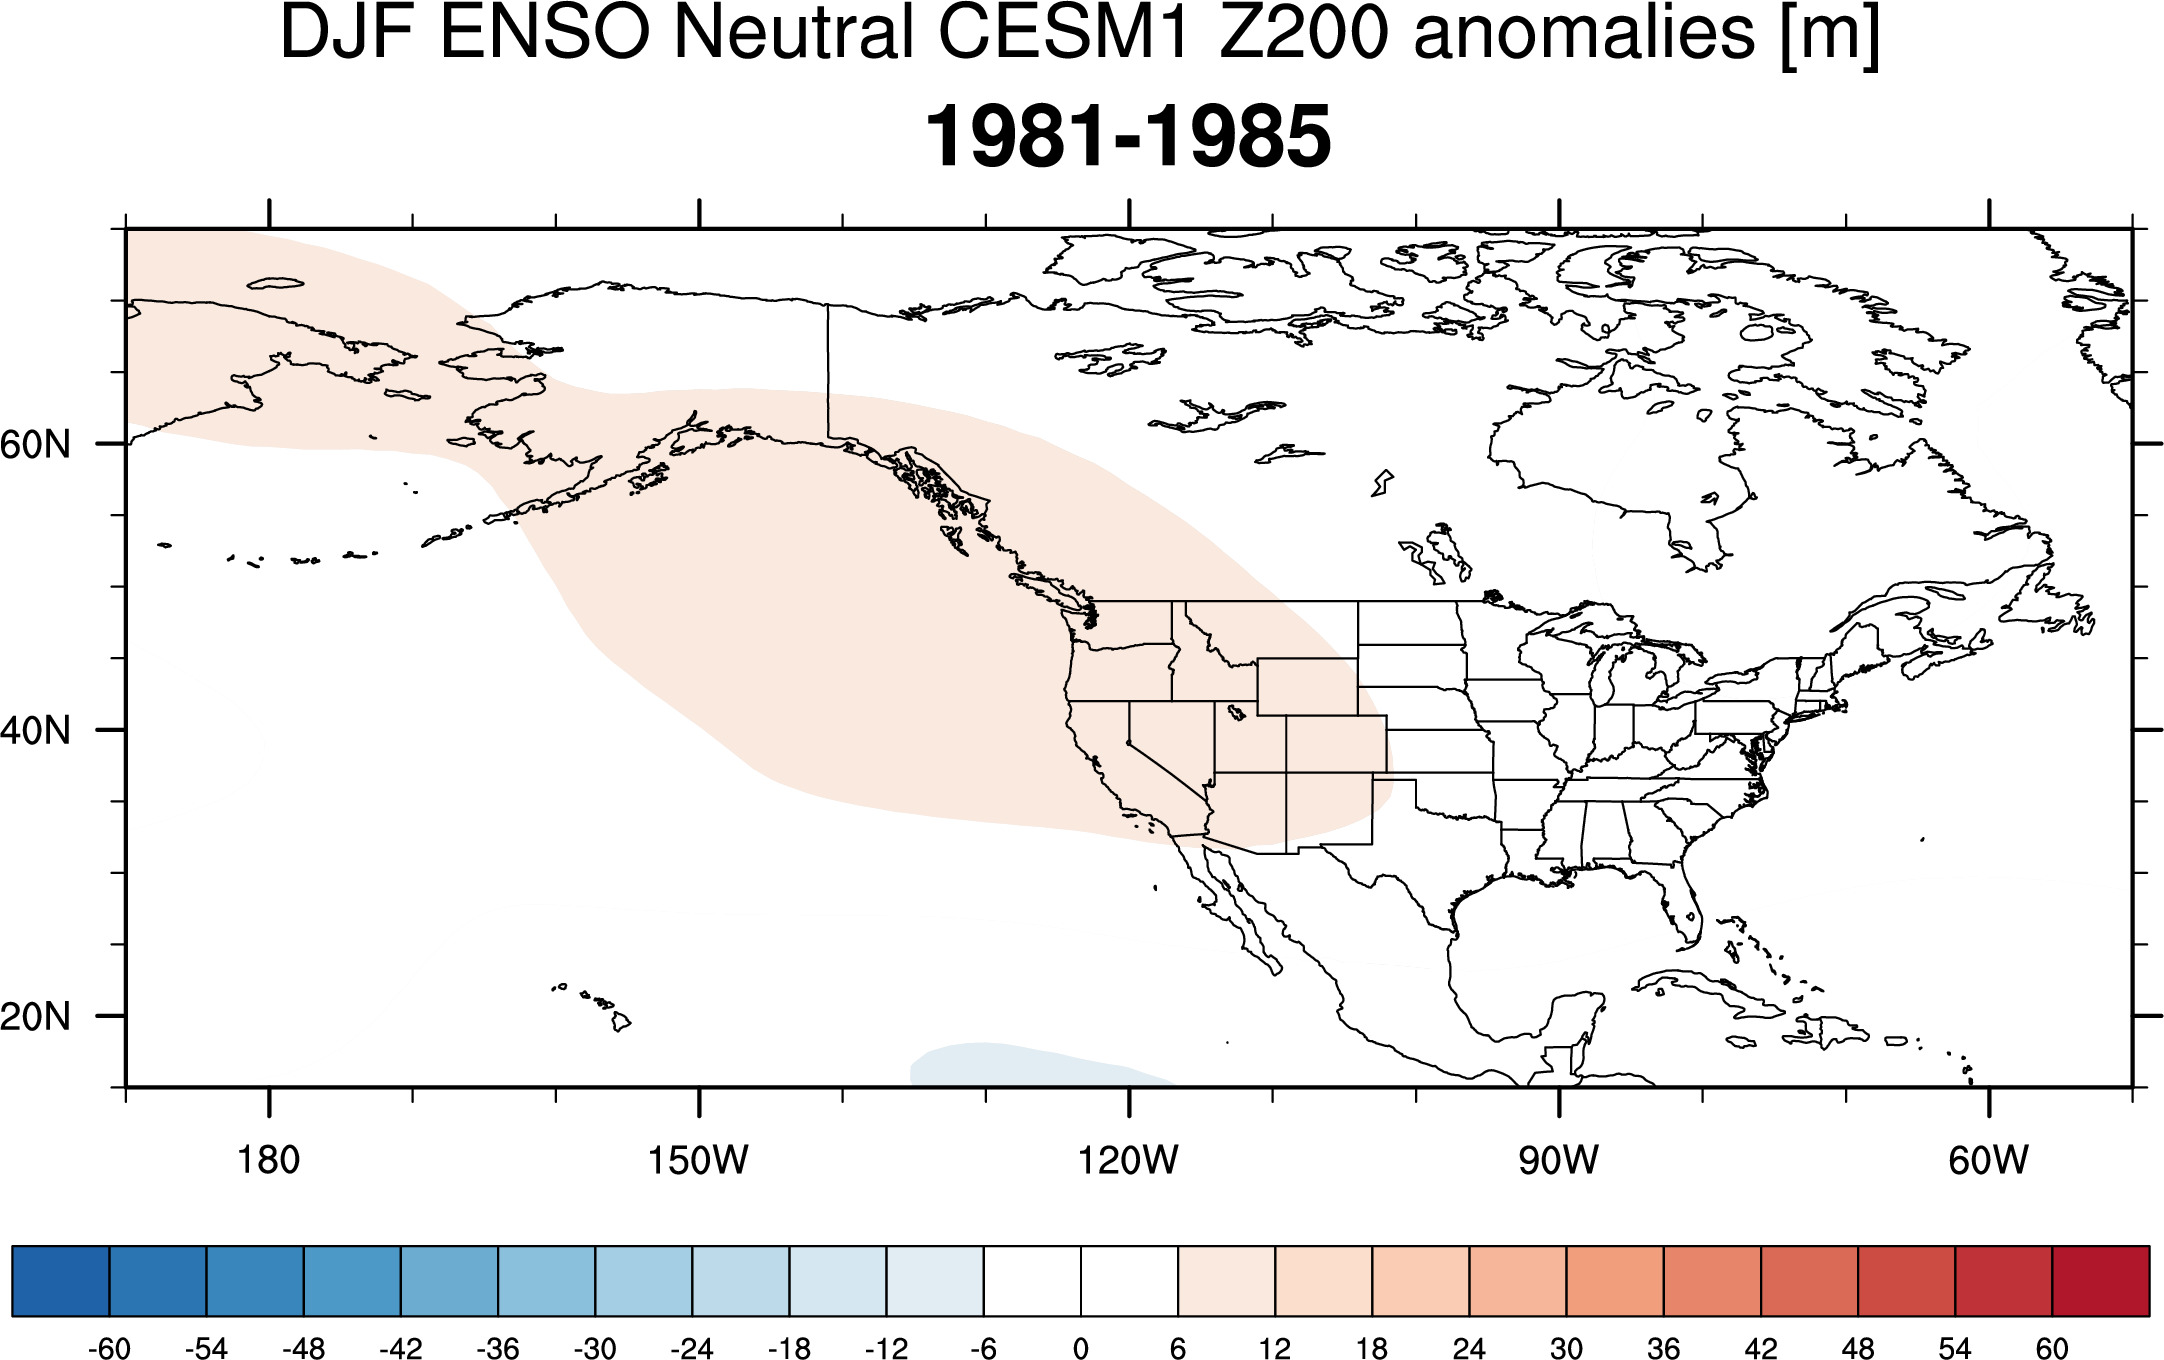
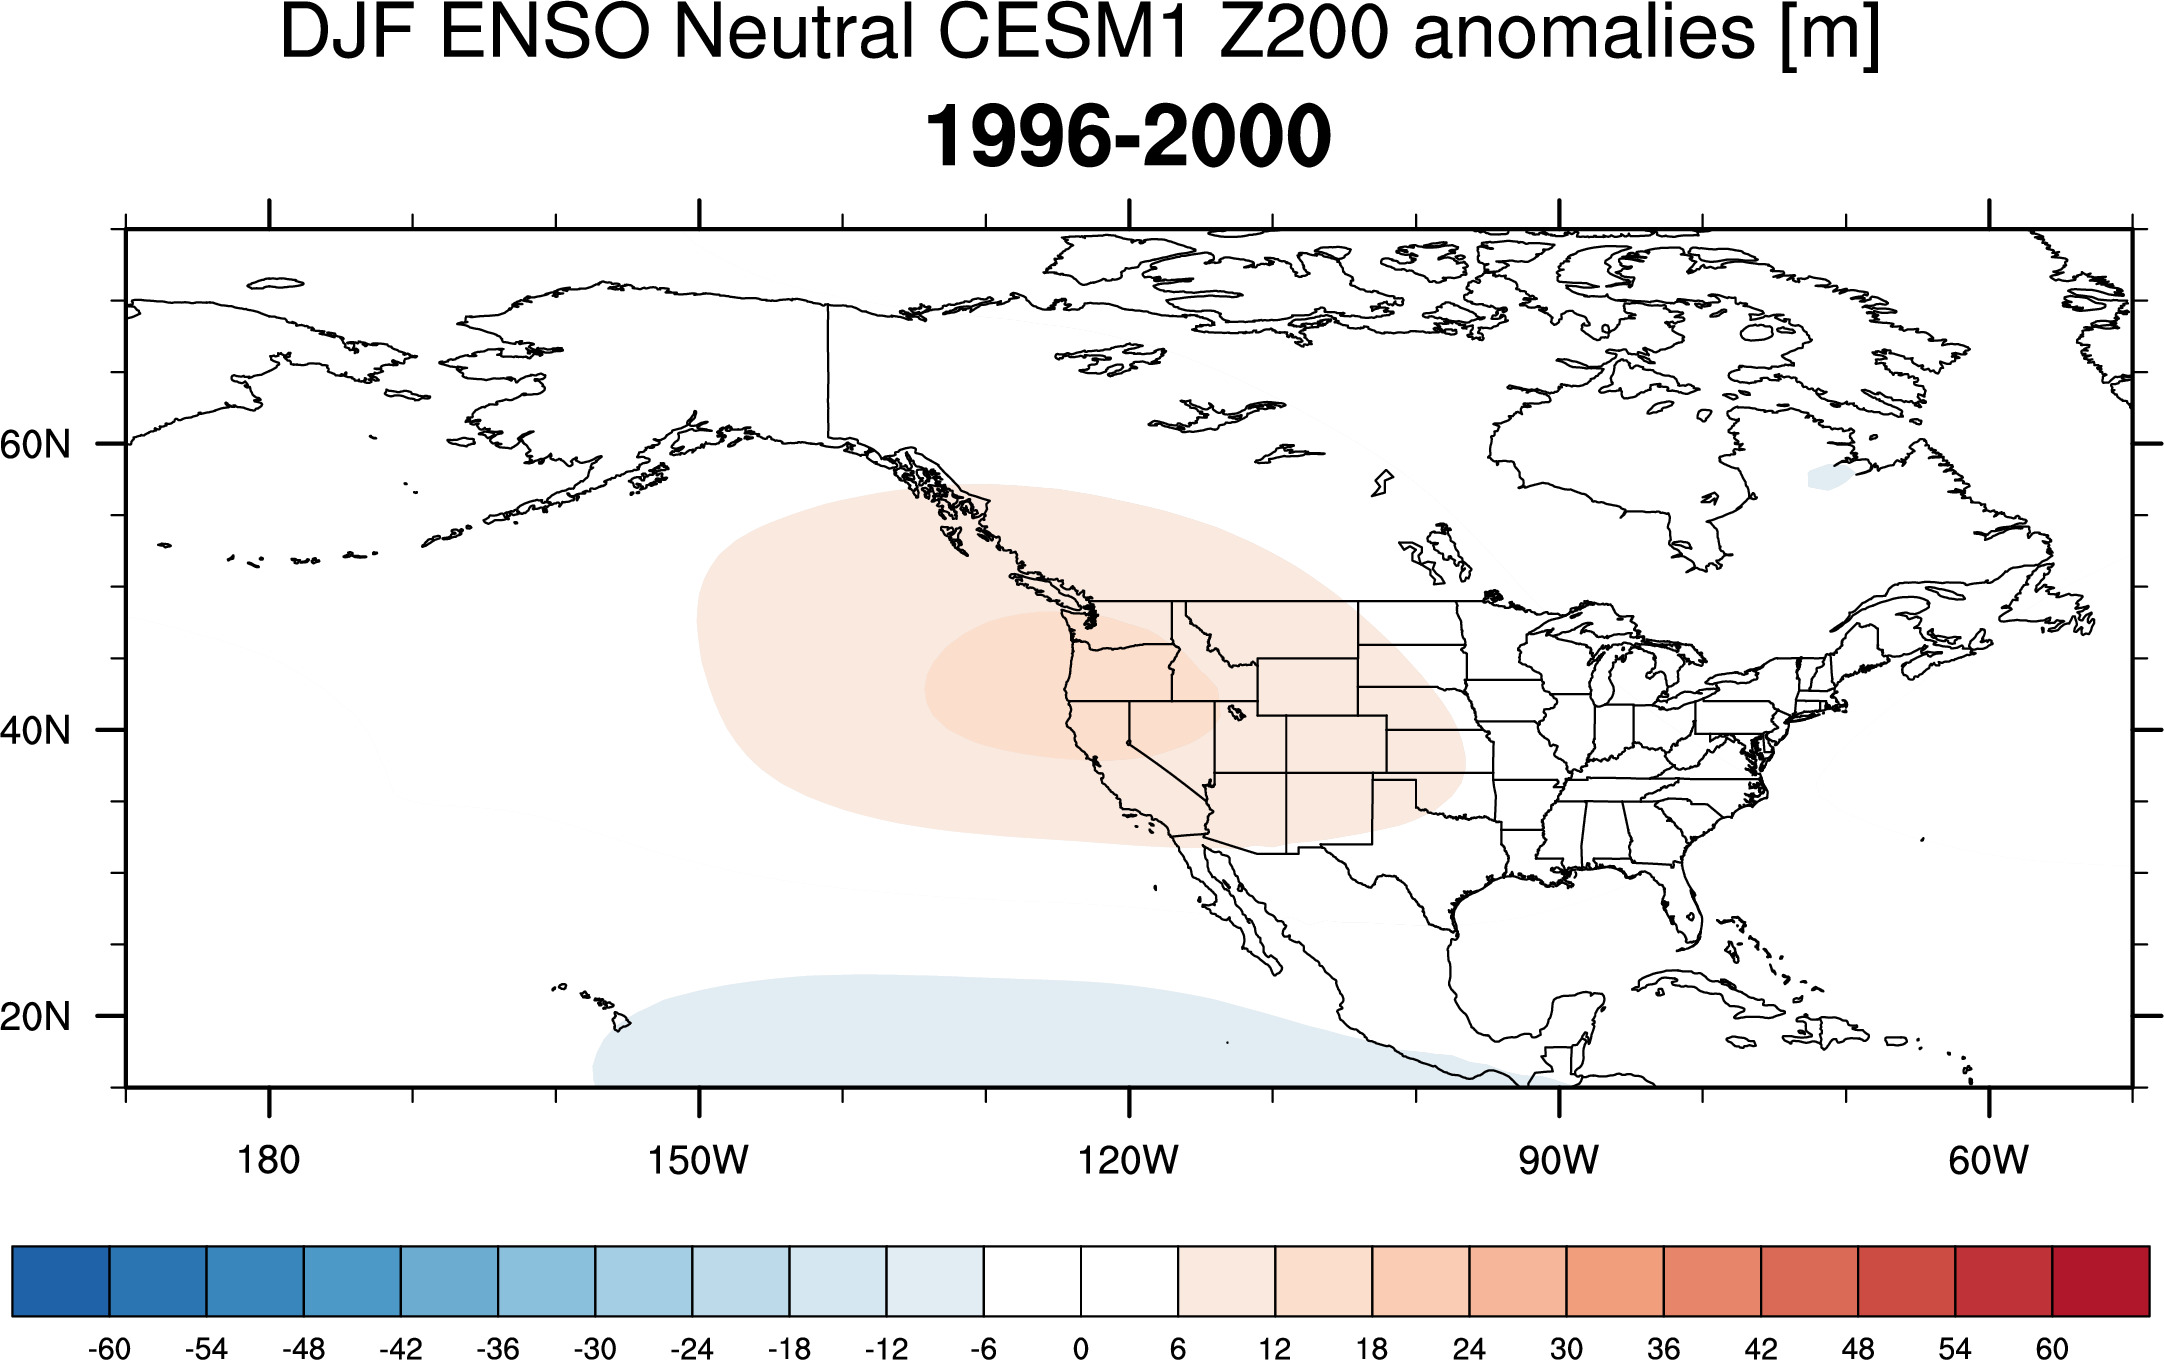
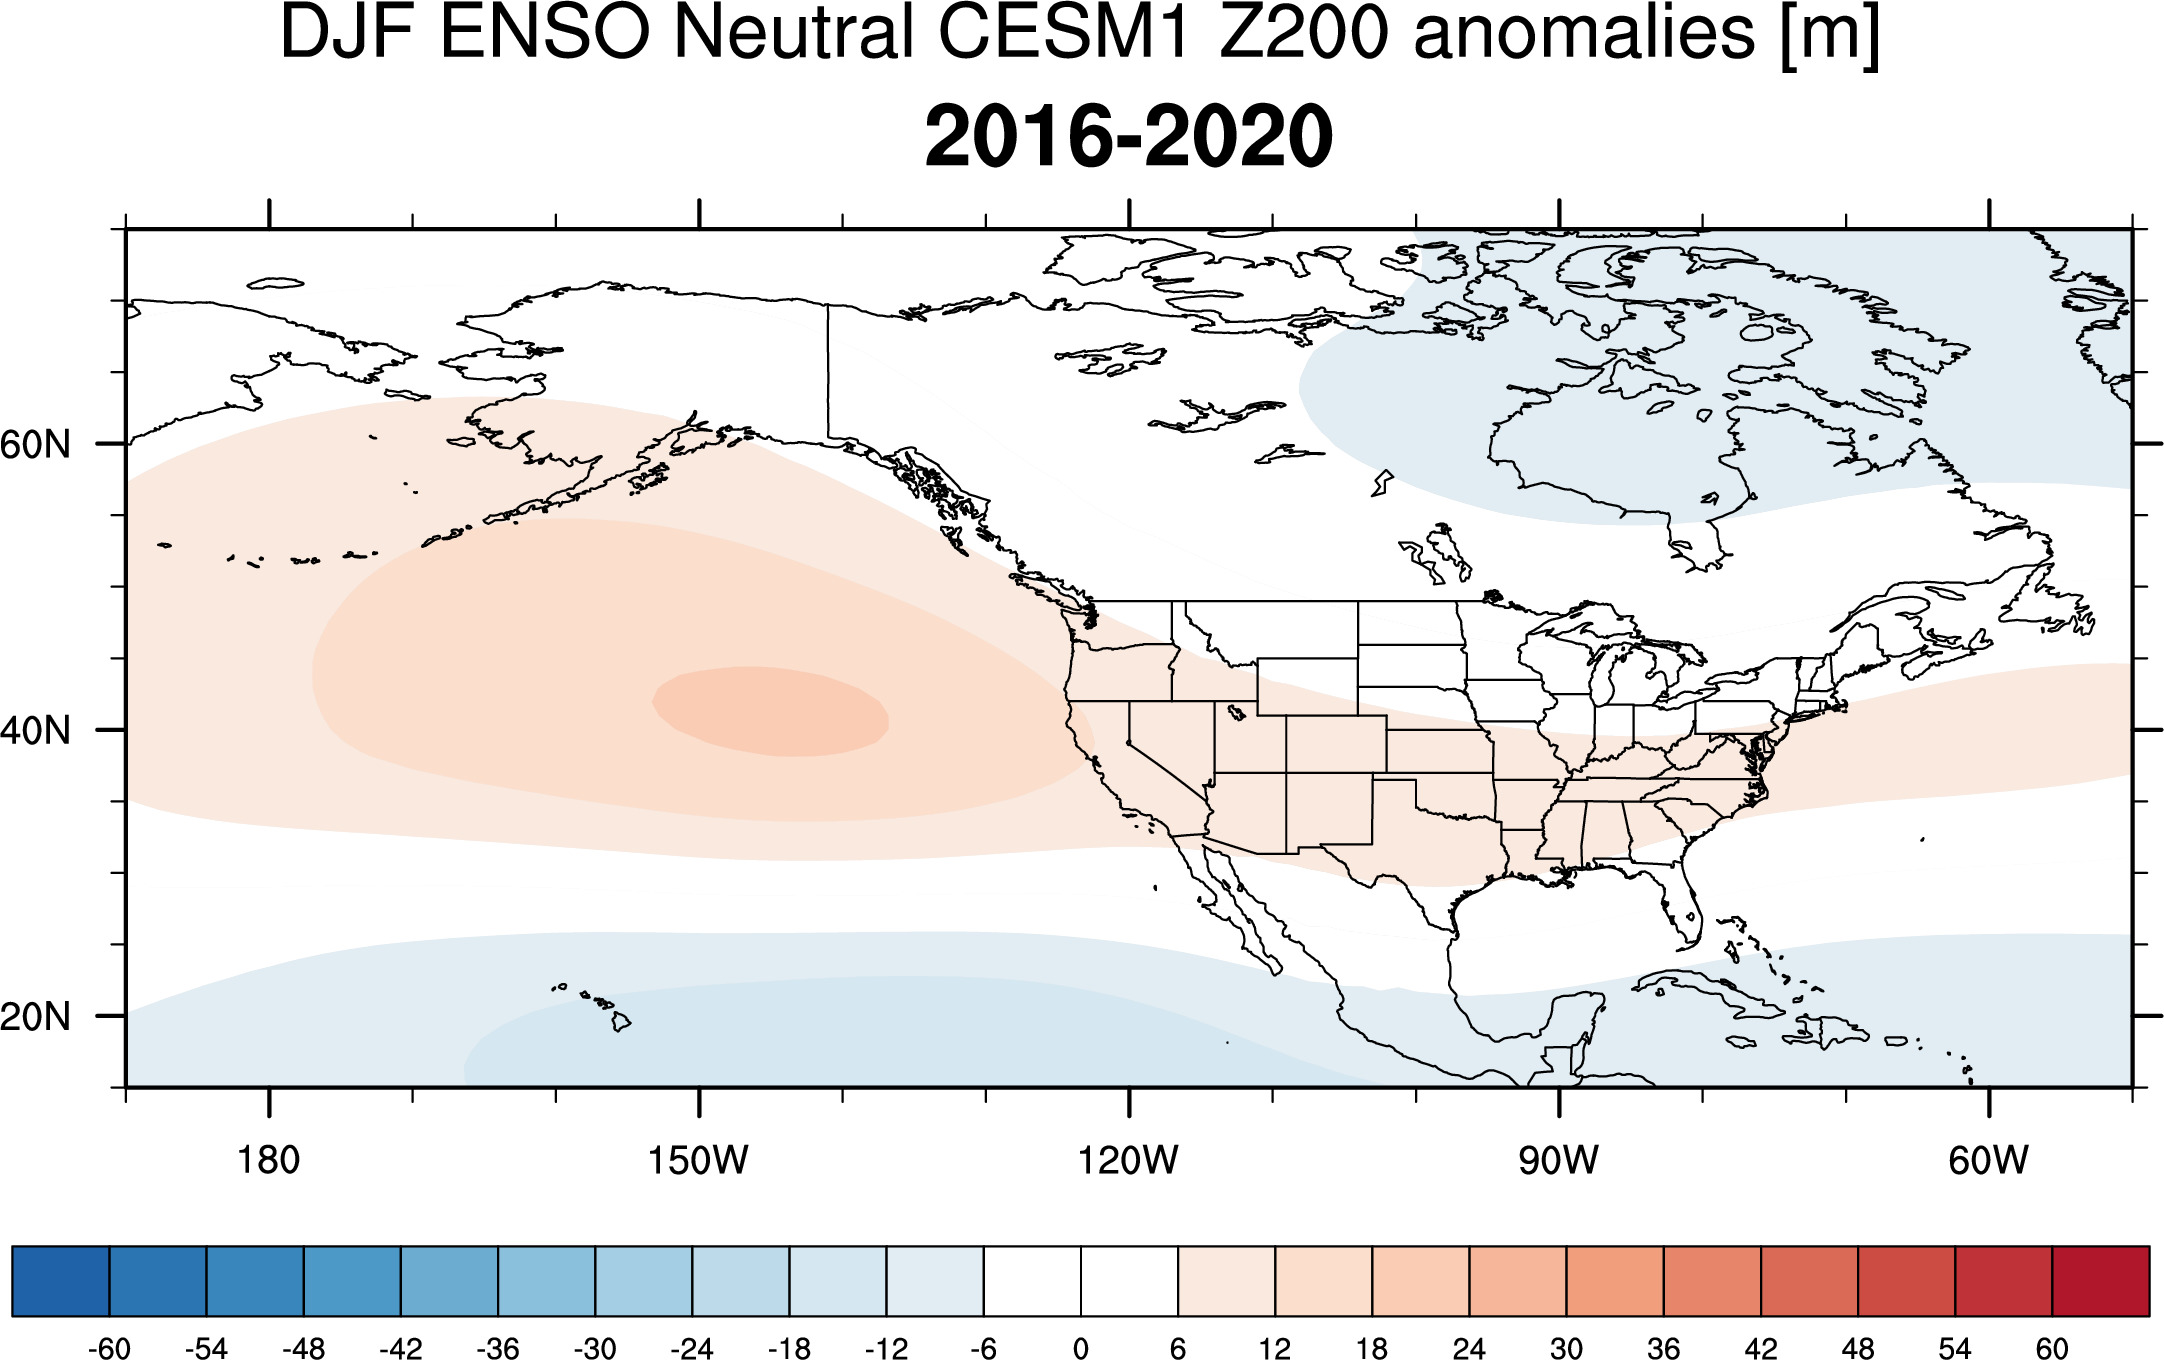
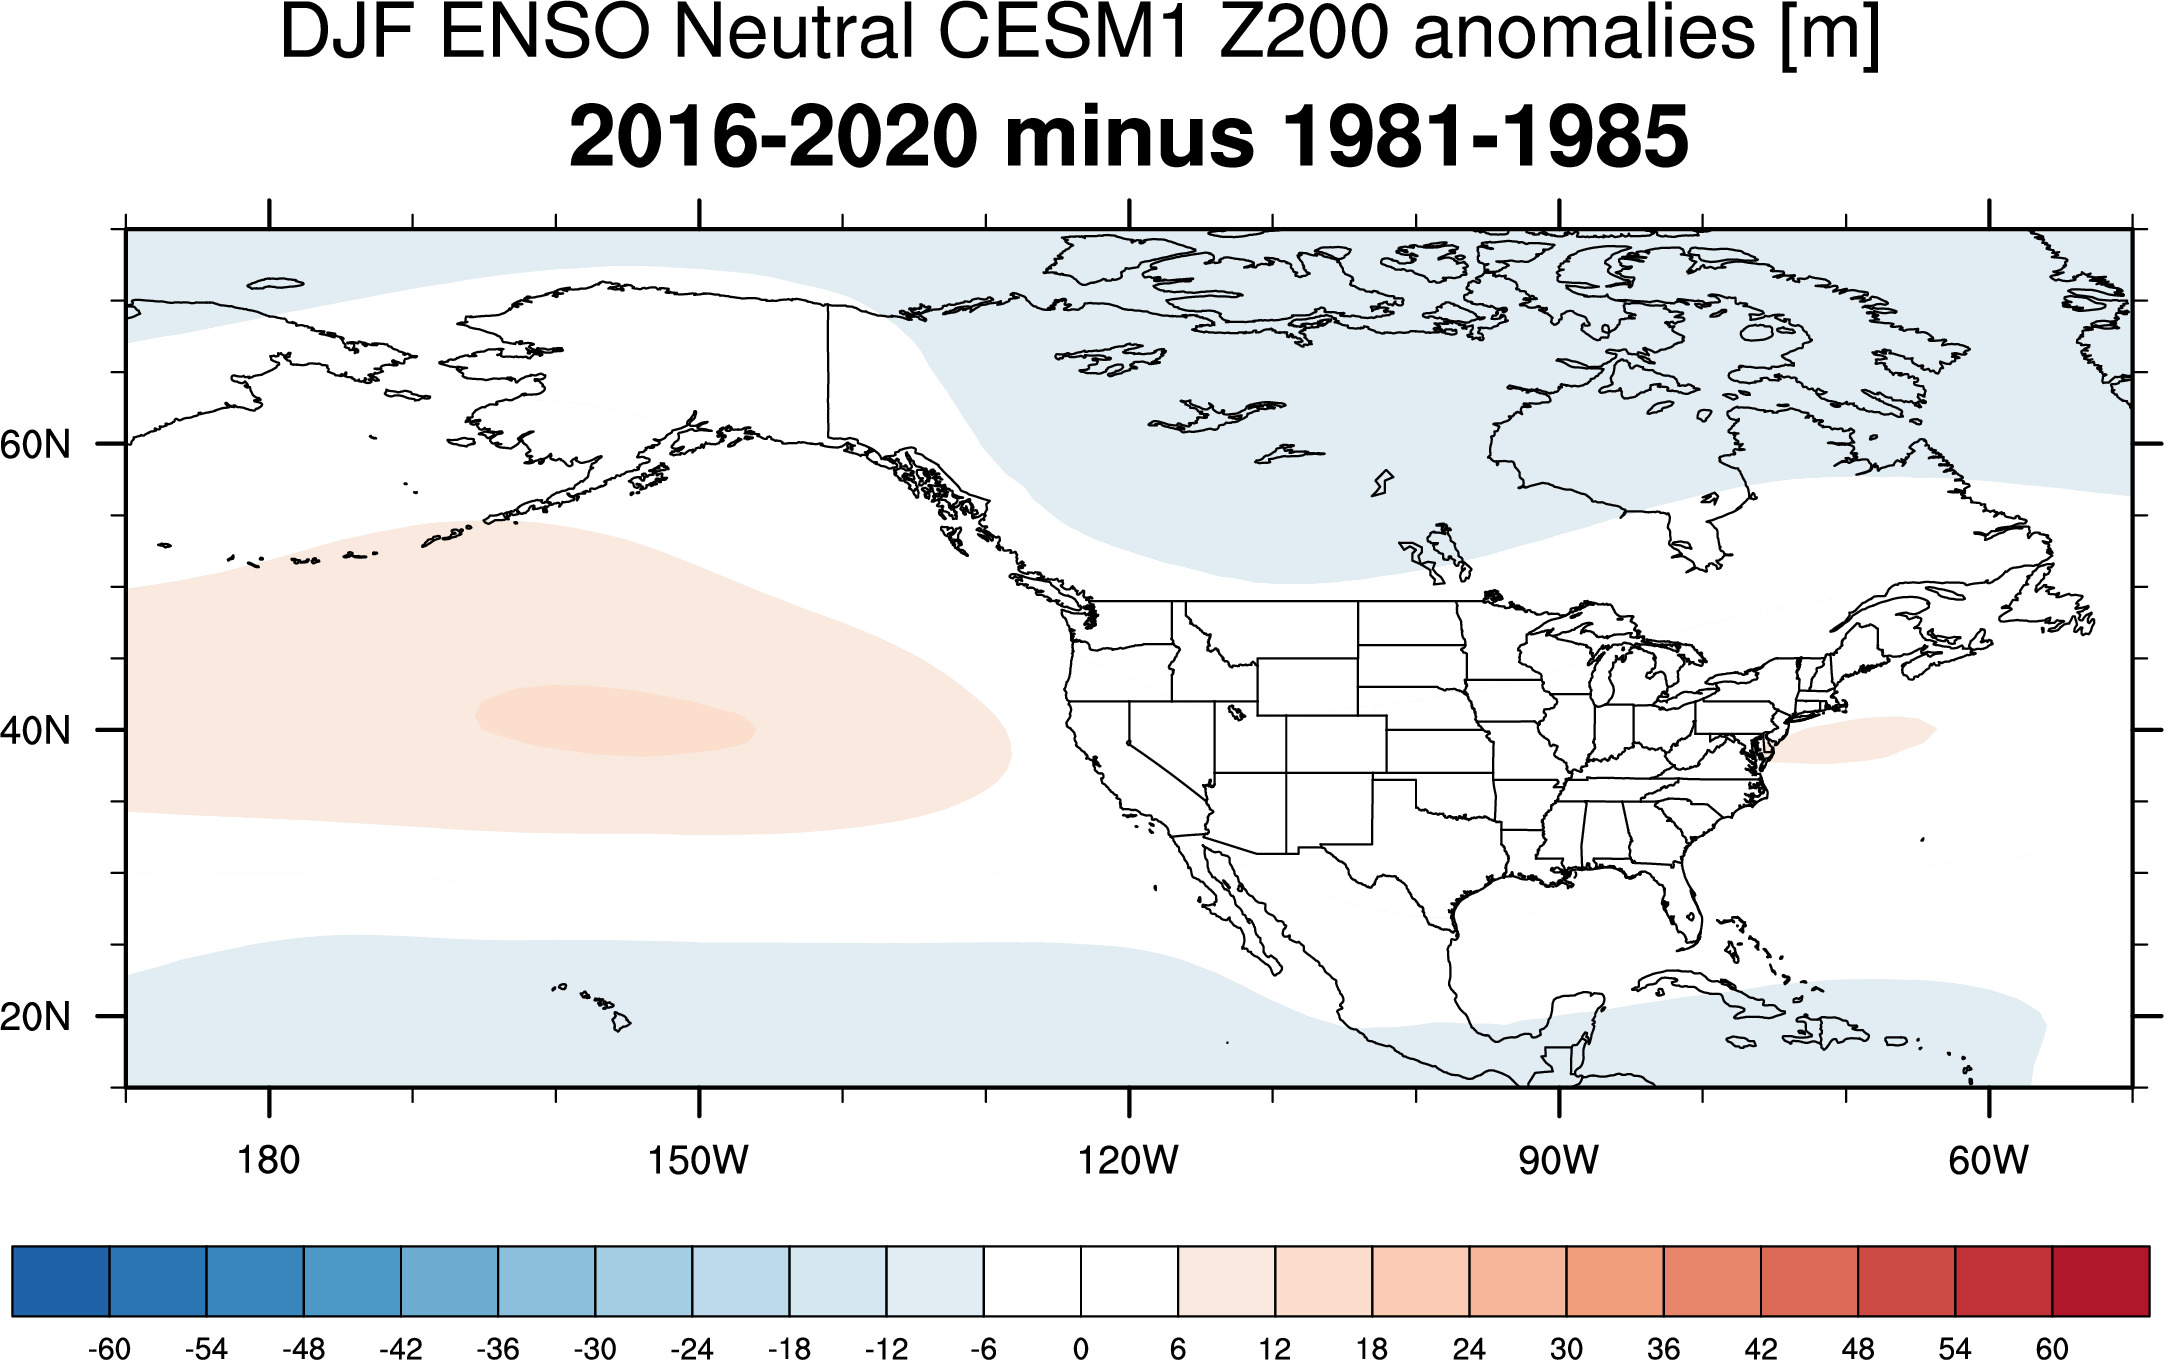
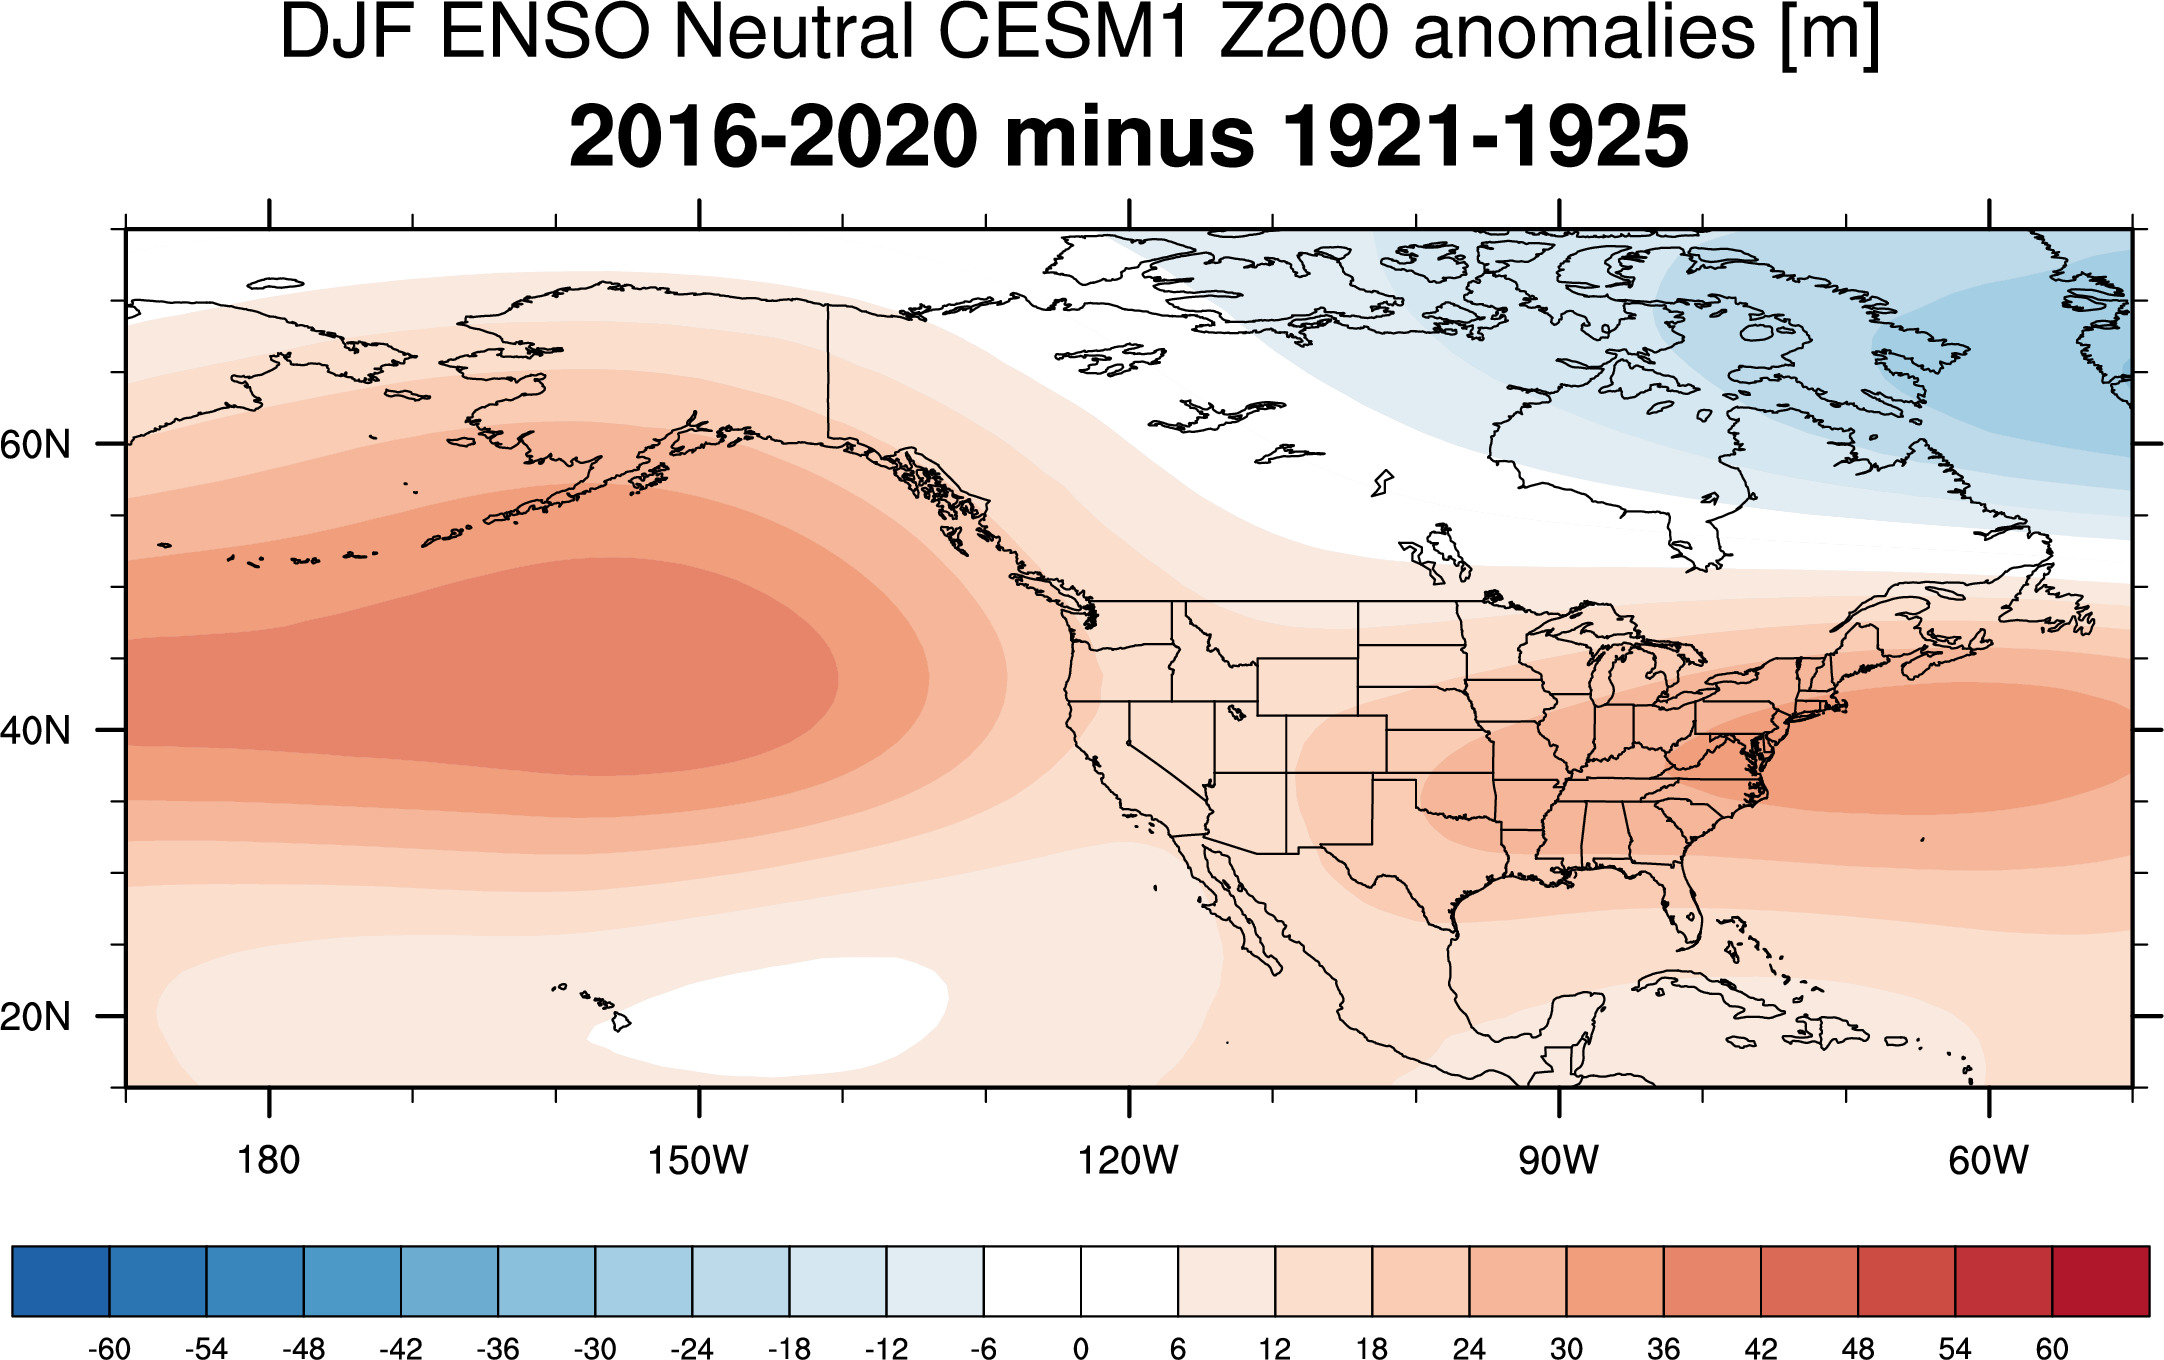
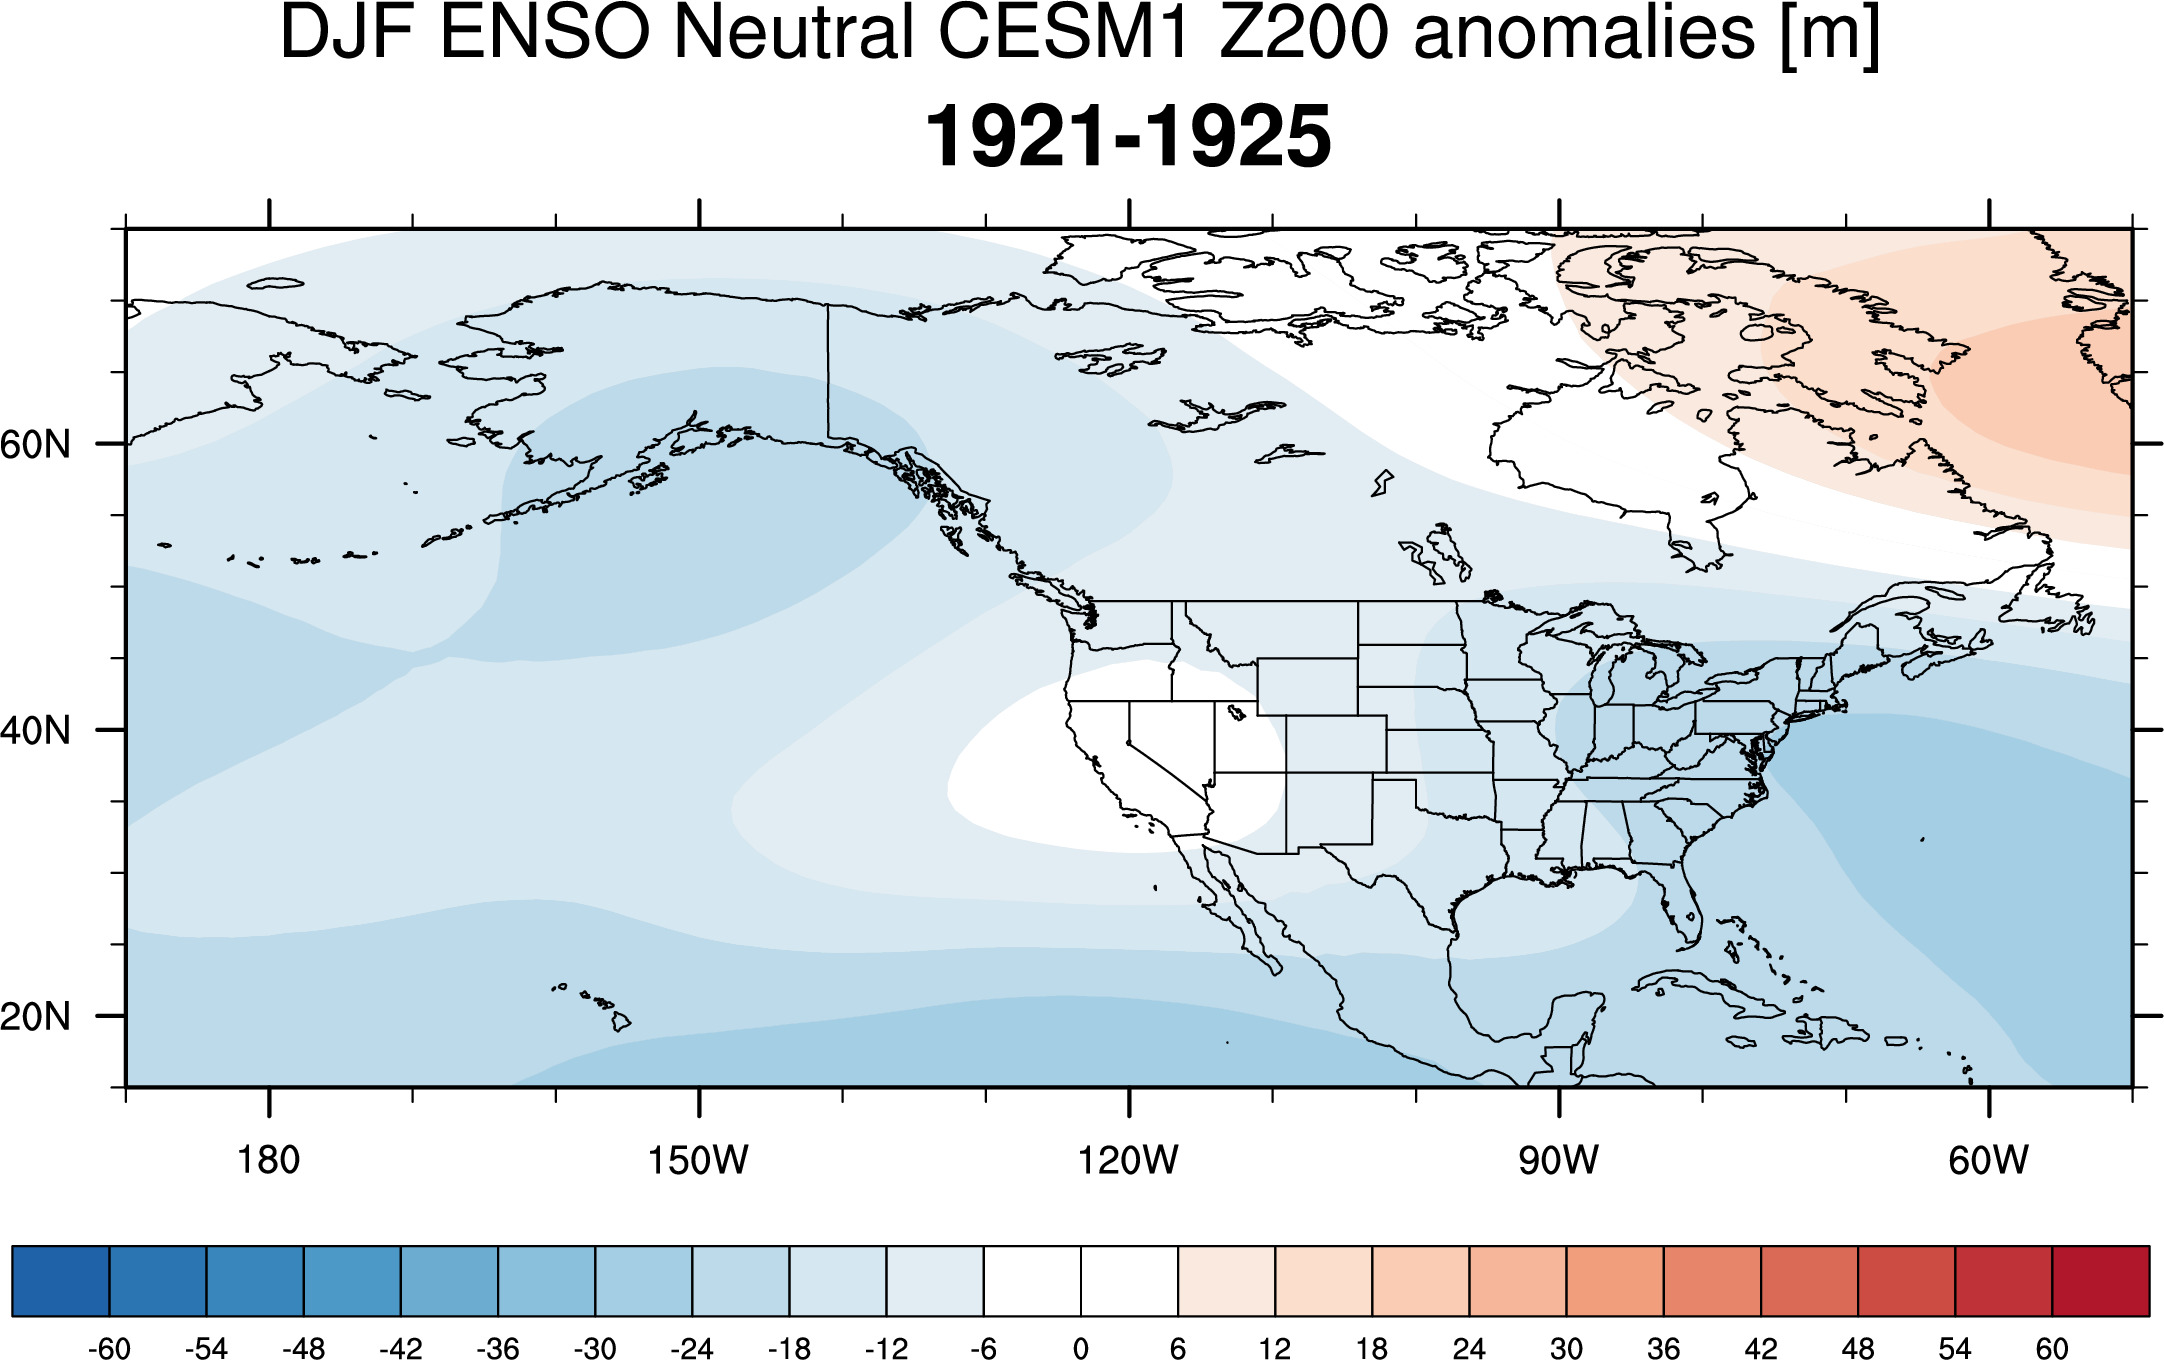
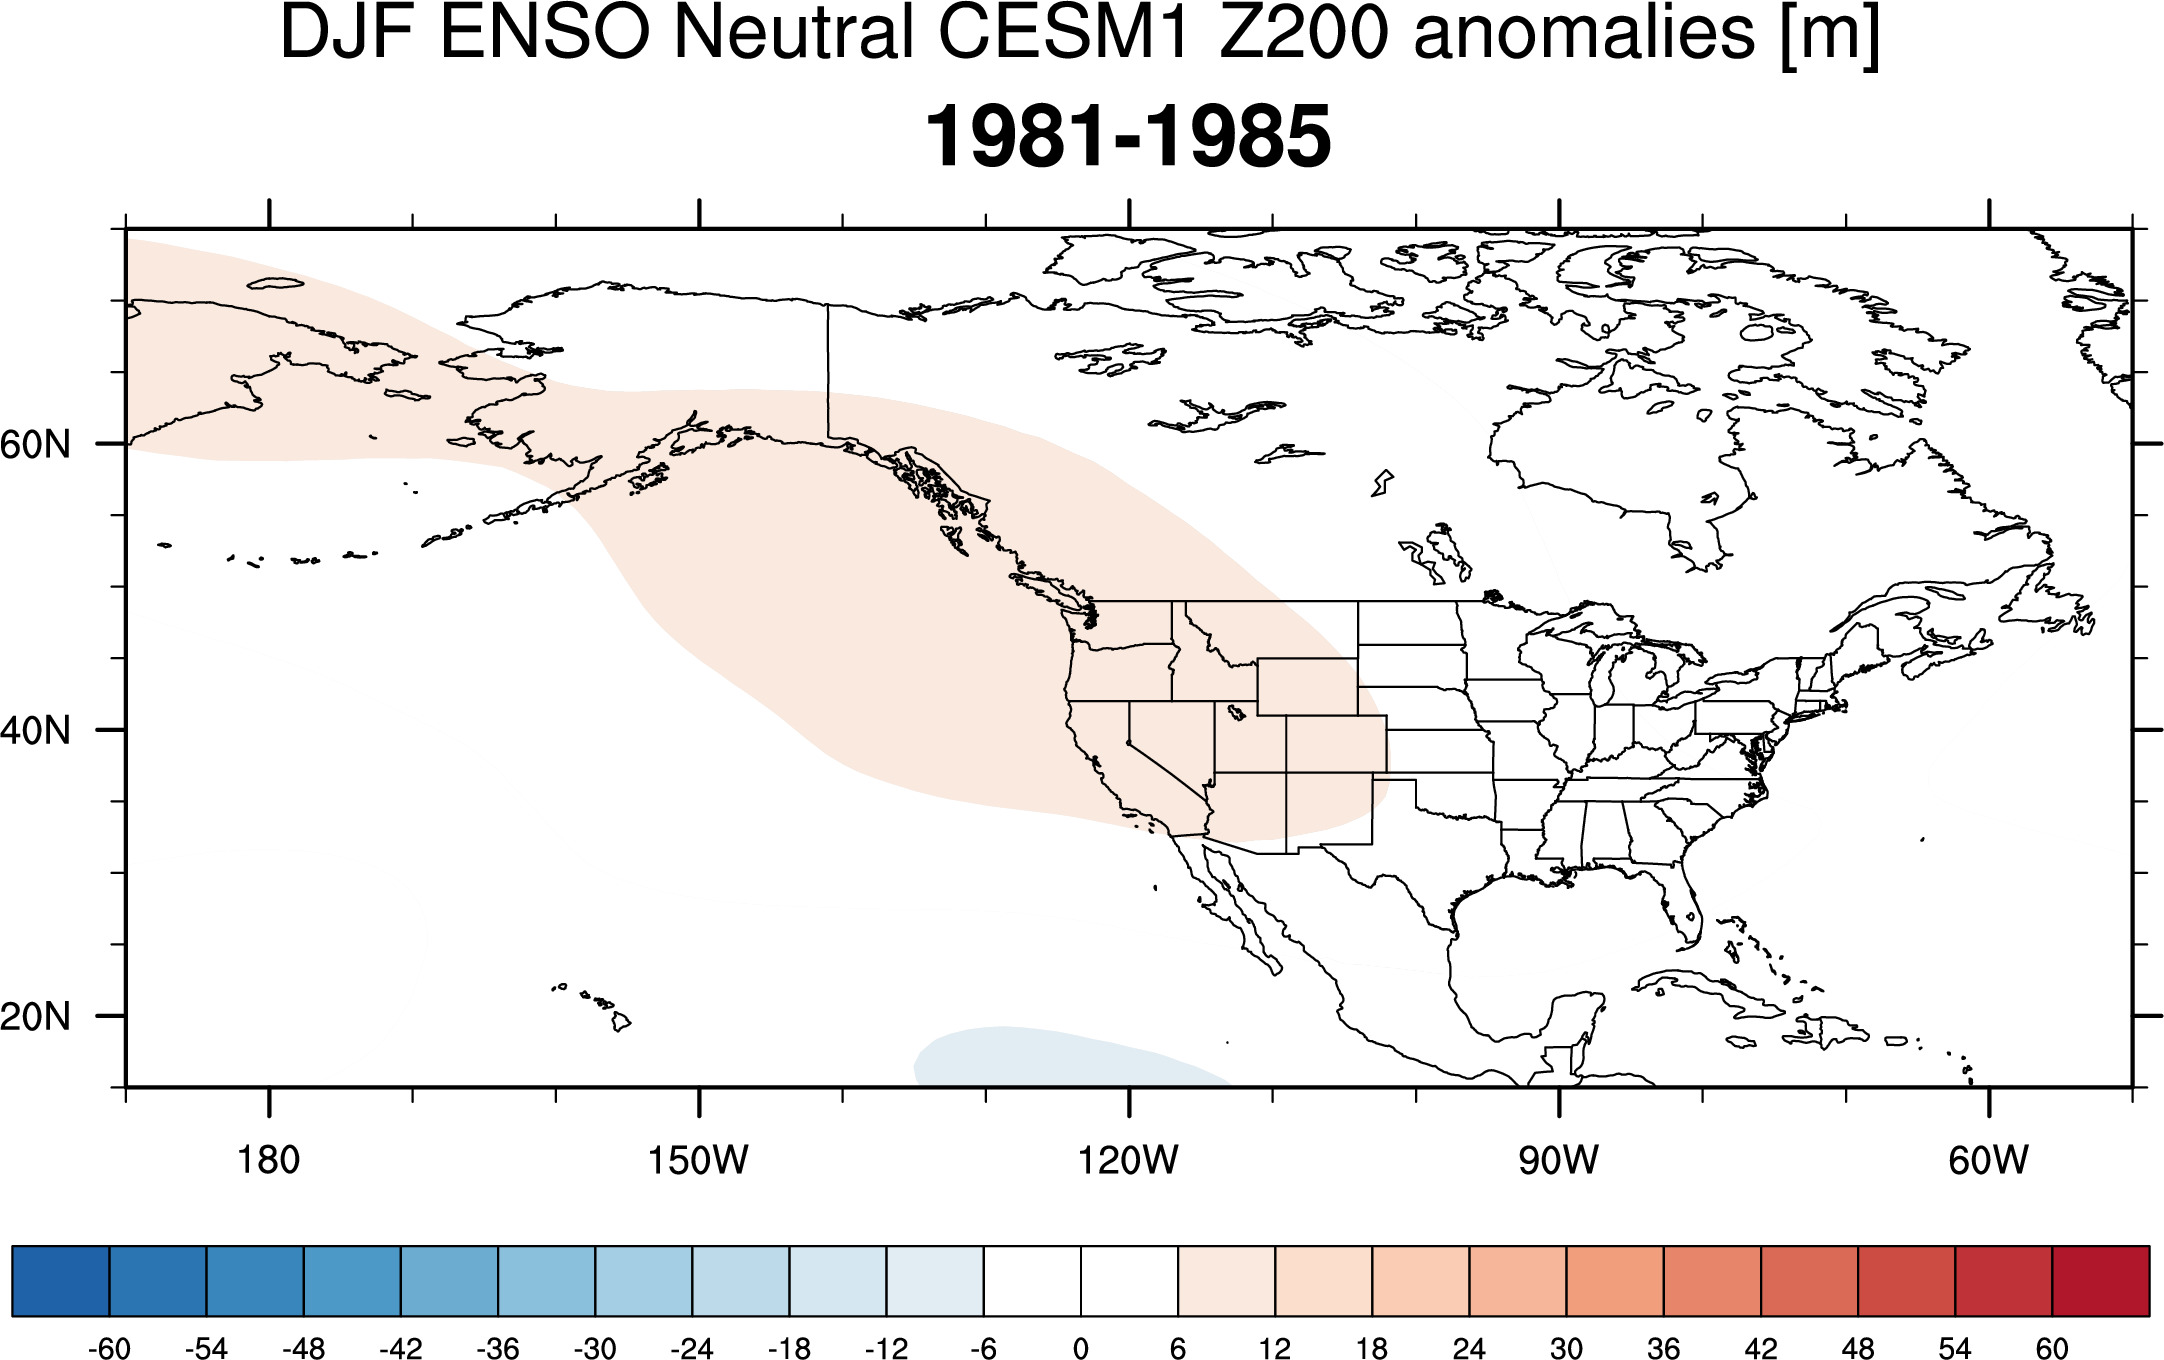
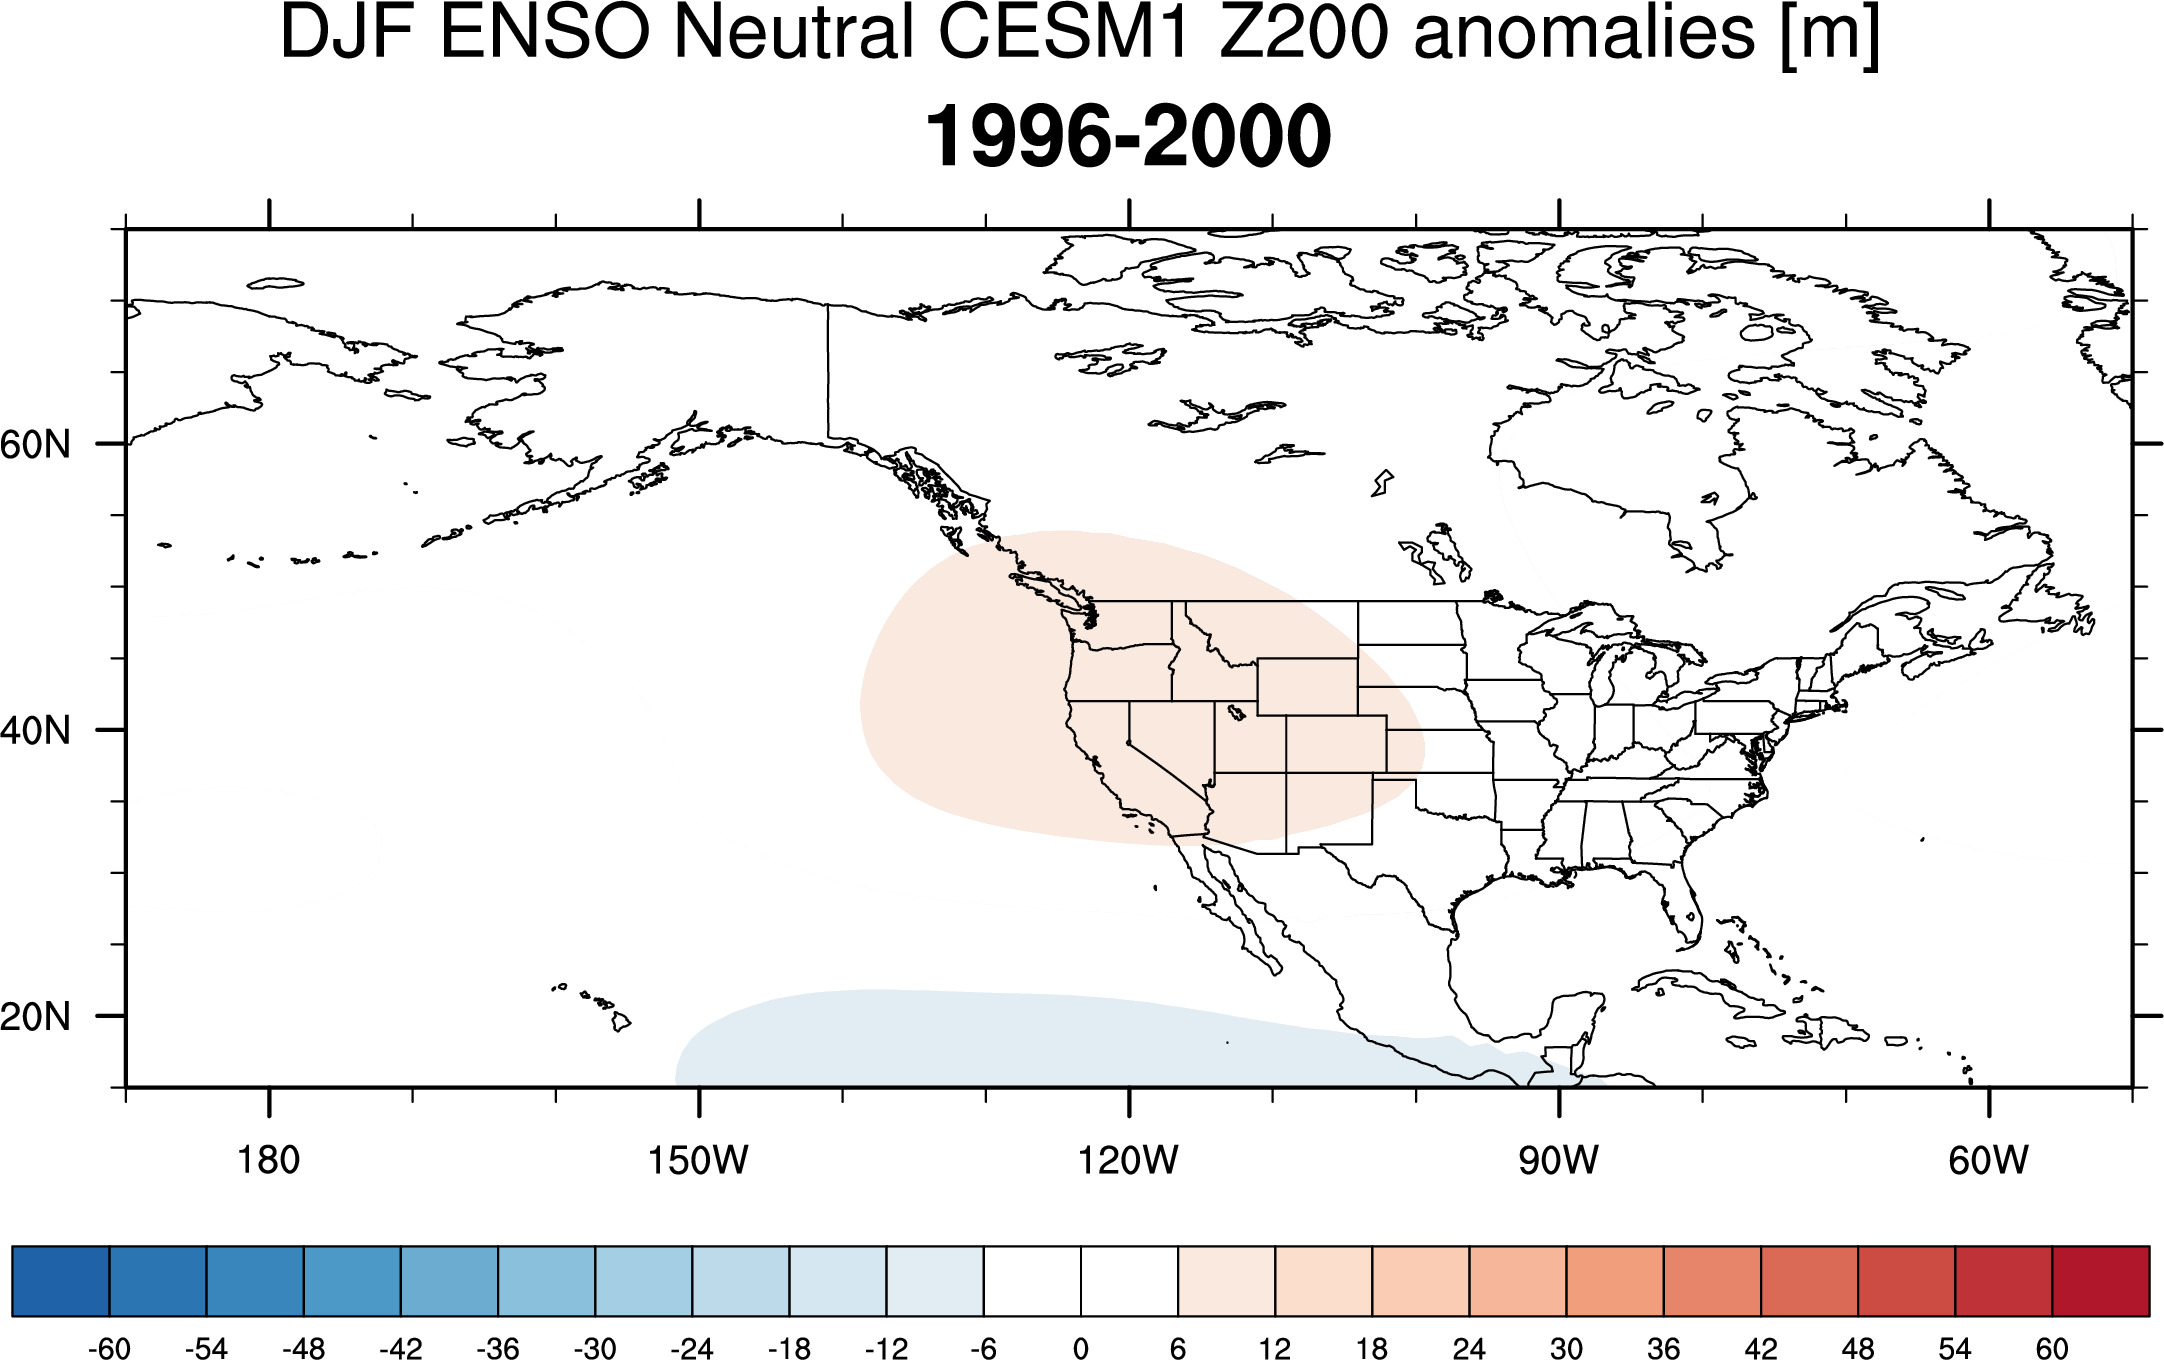
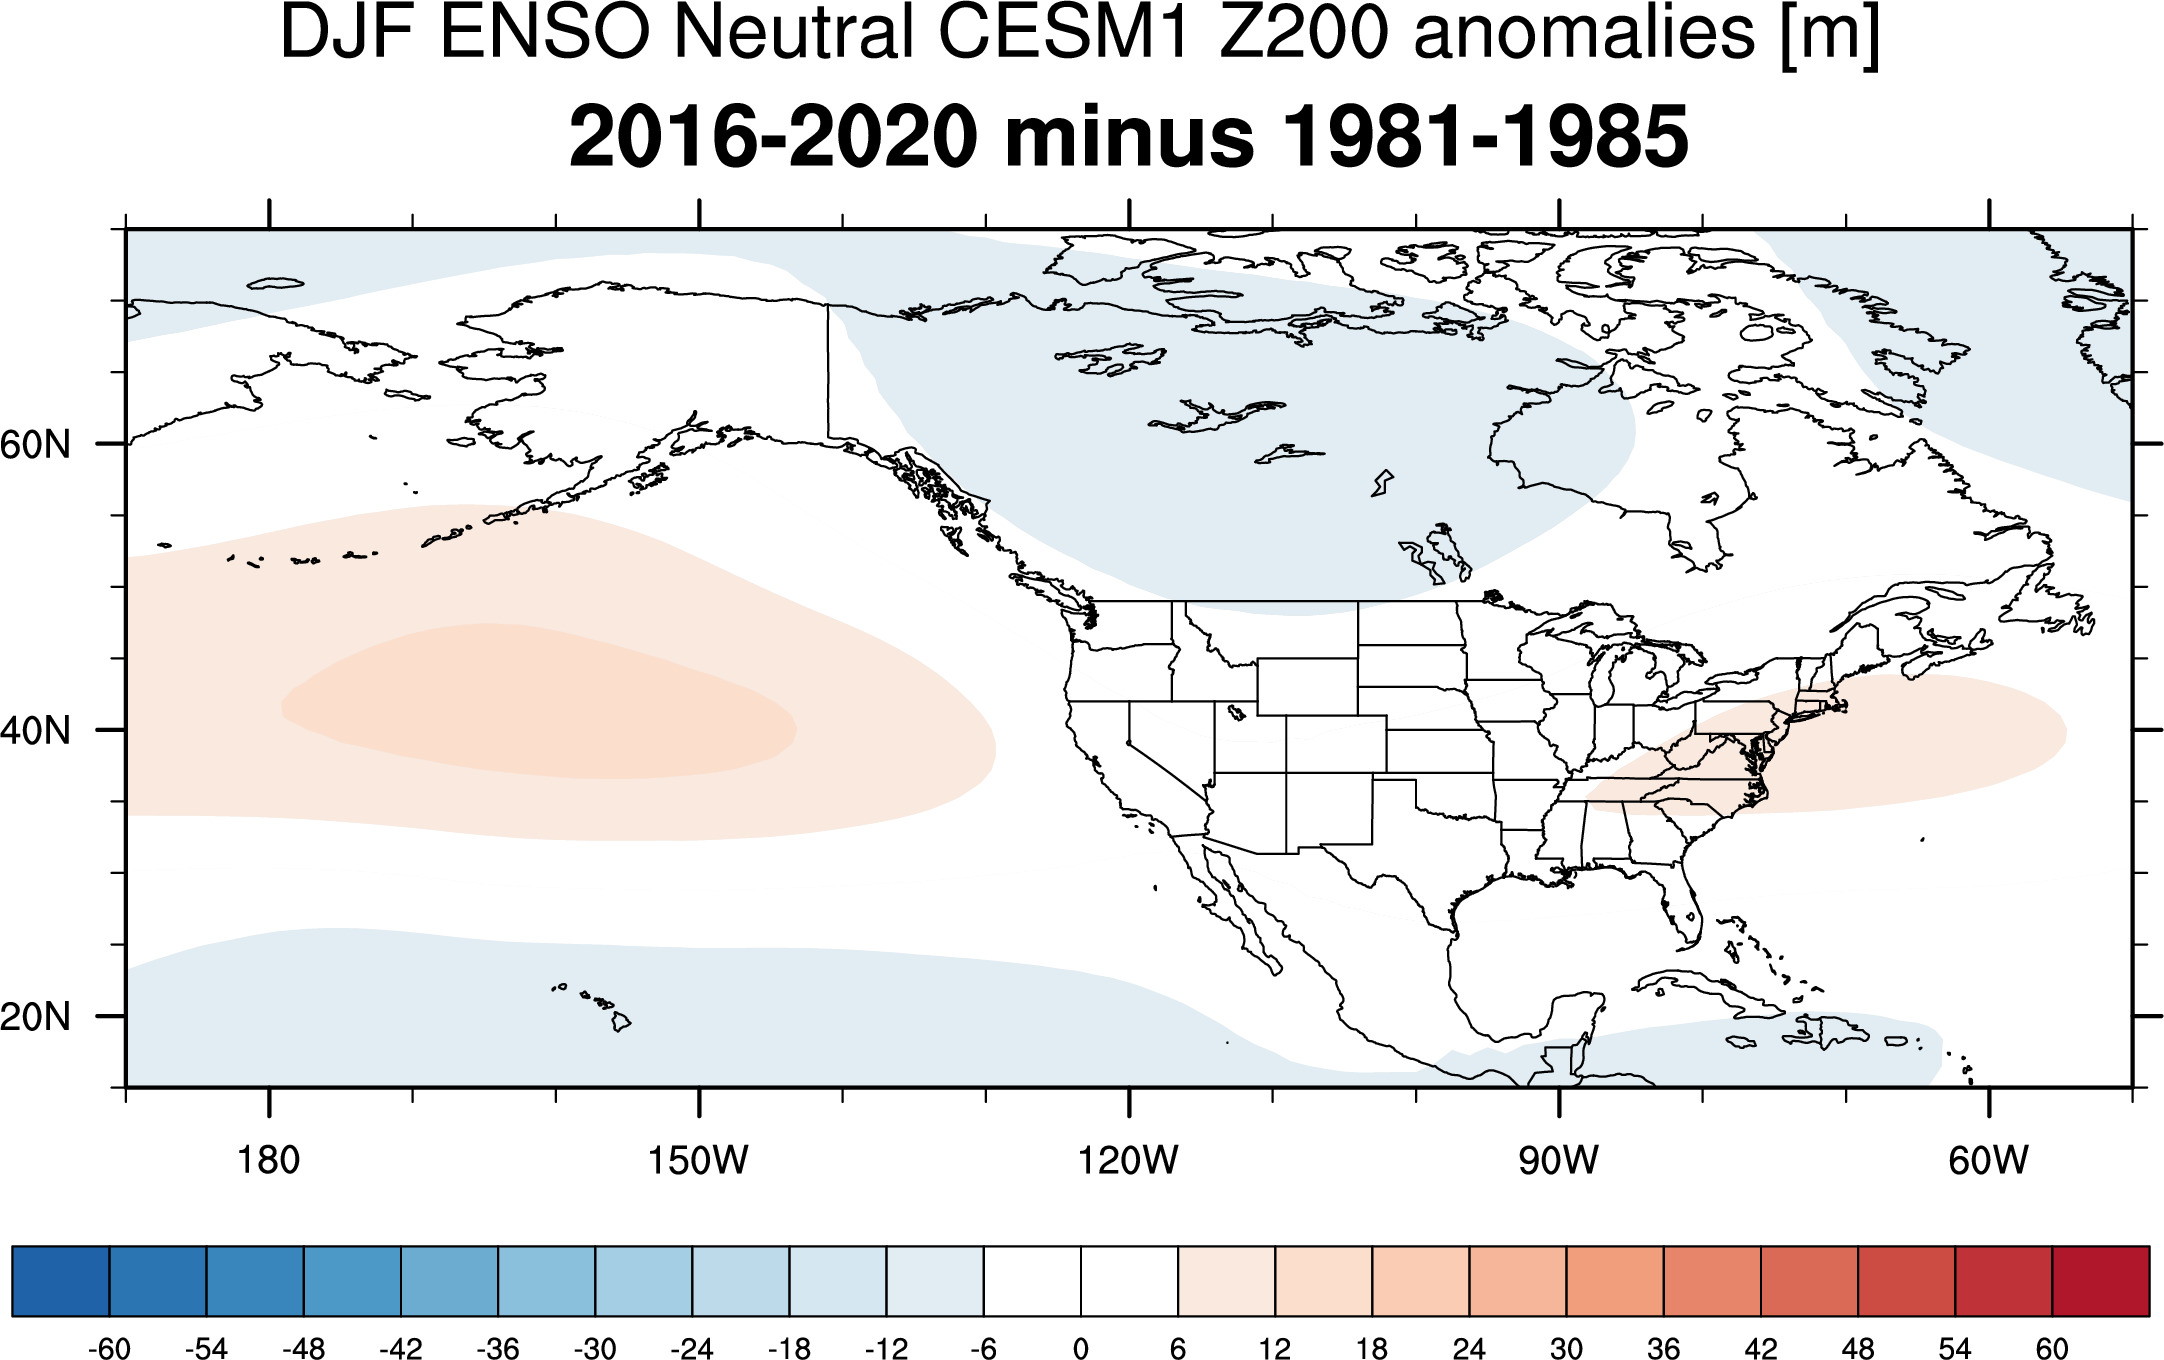
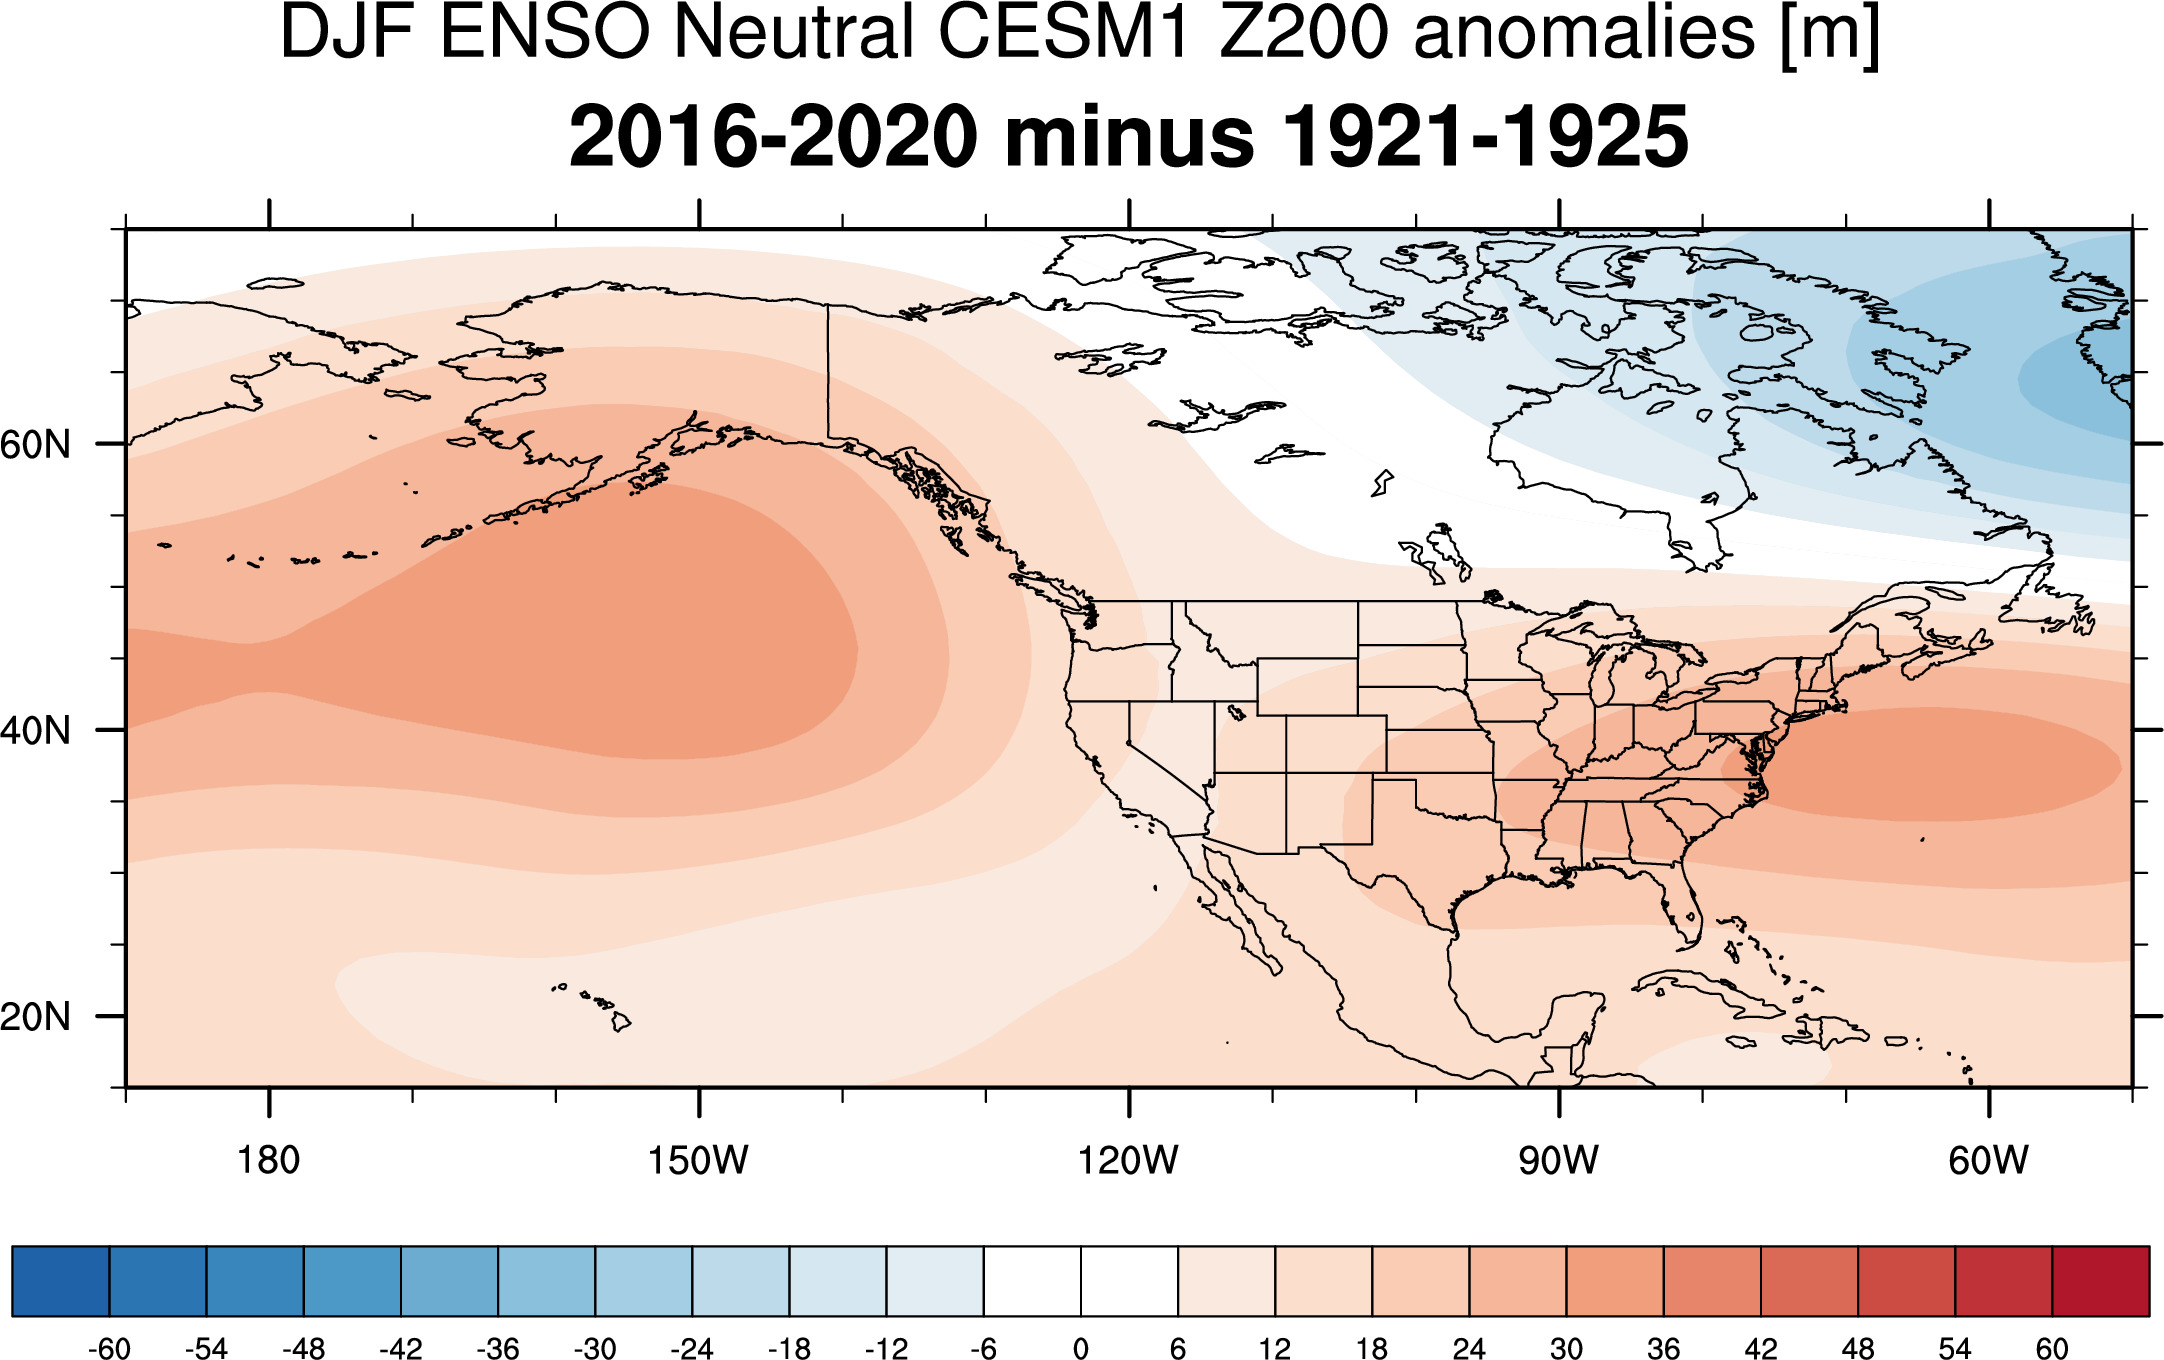
200mb Height Anomaly Maps
Differences
---------------------------
All years
2020-2016 compared to 1981-1985

2020-2016 compared to 1921-1925


---------------------------------
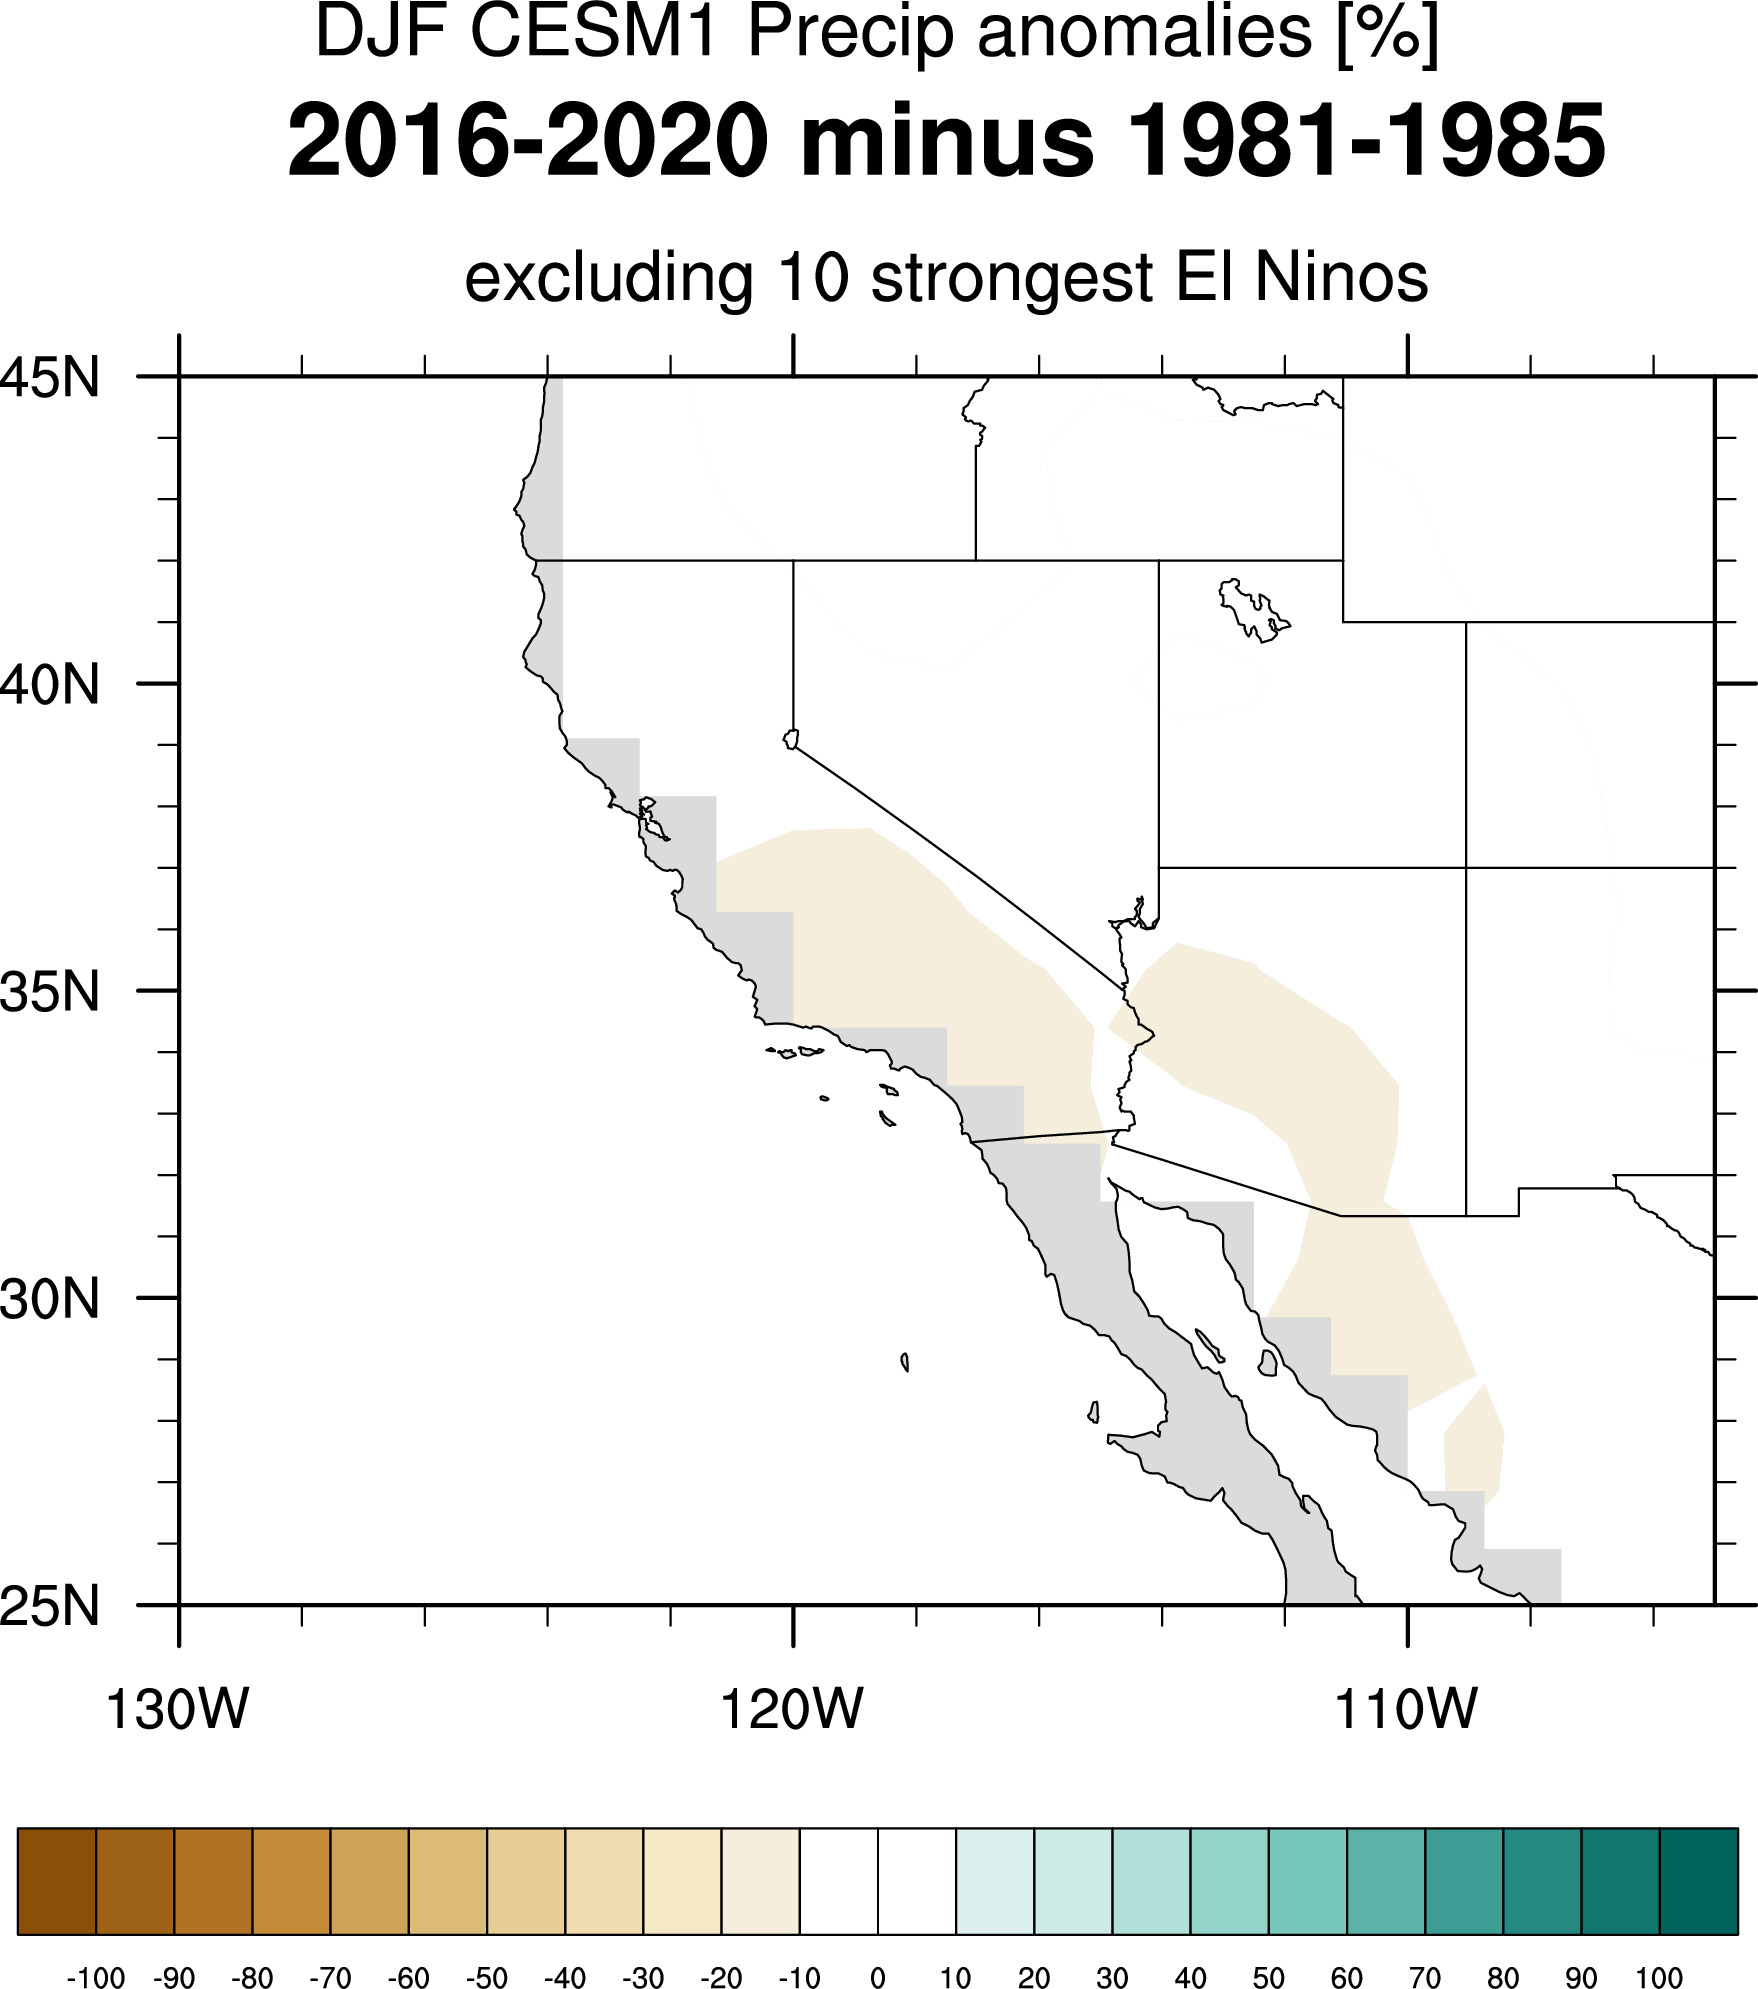
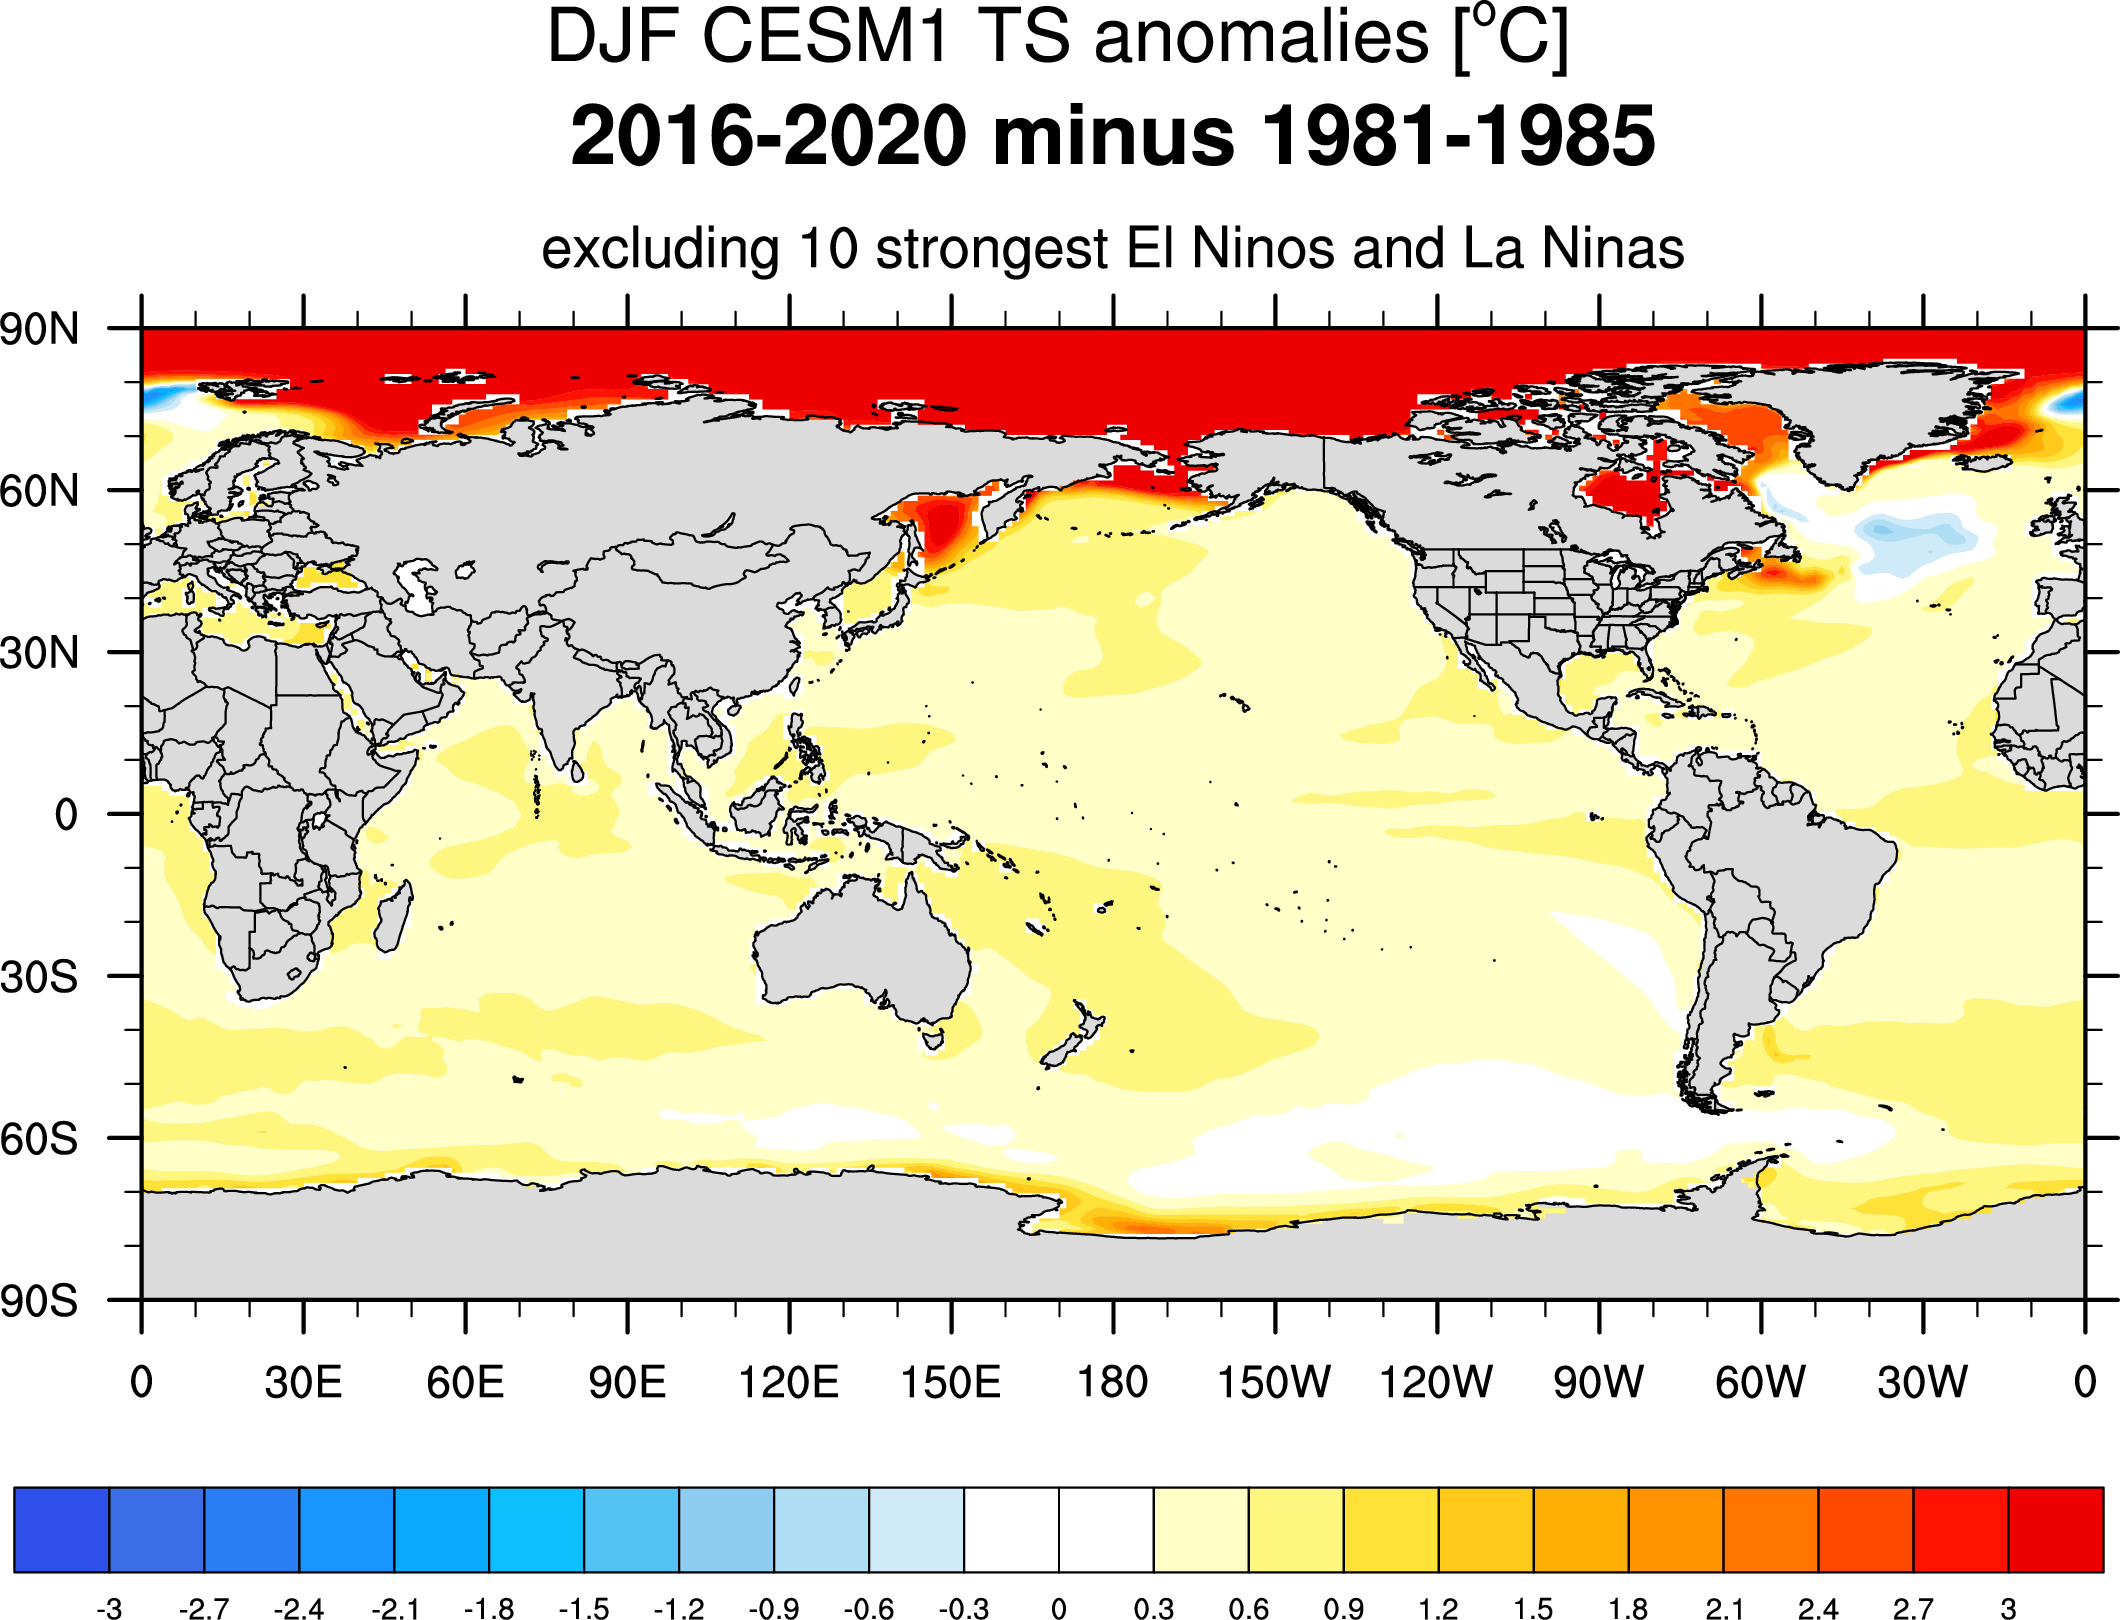
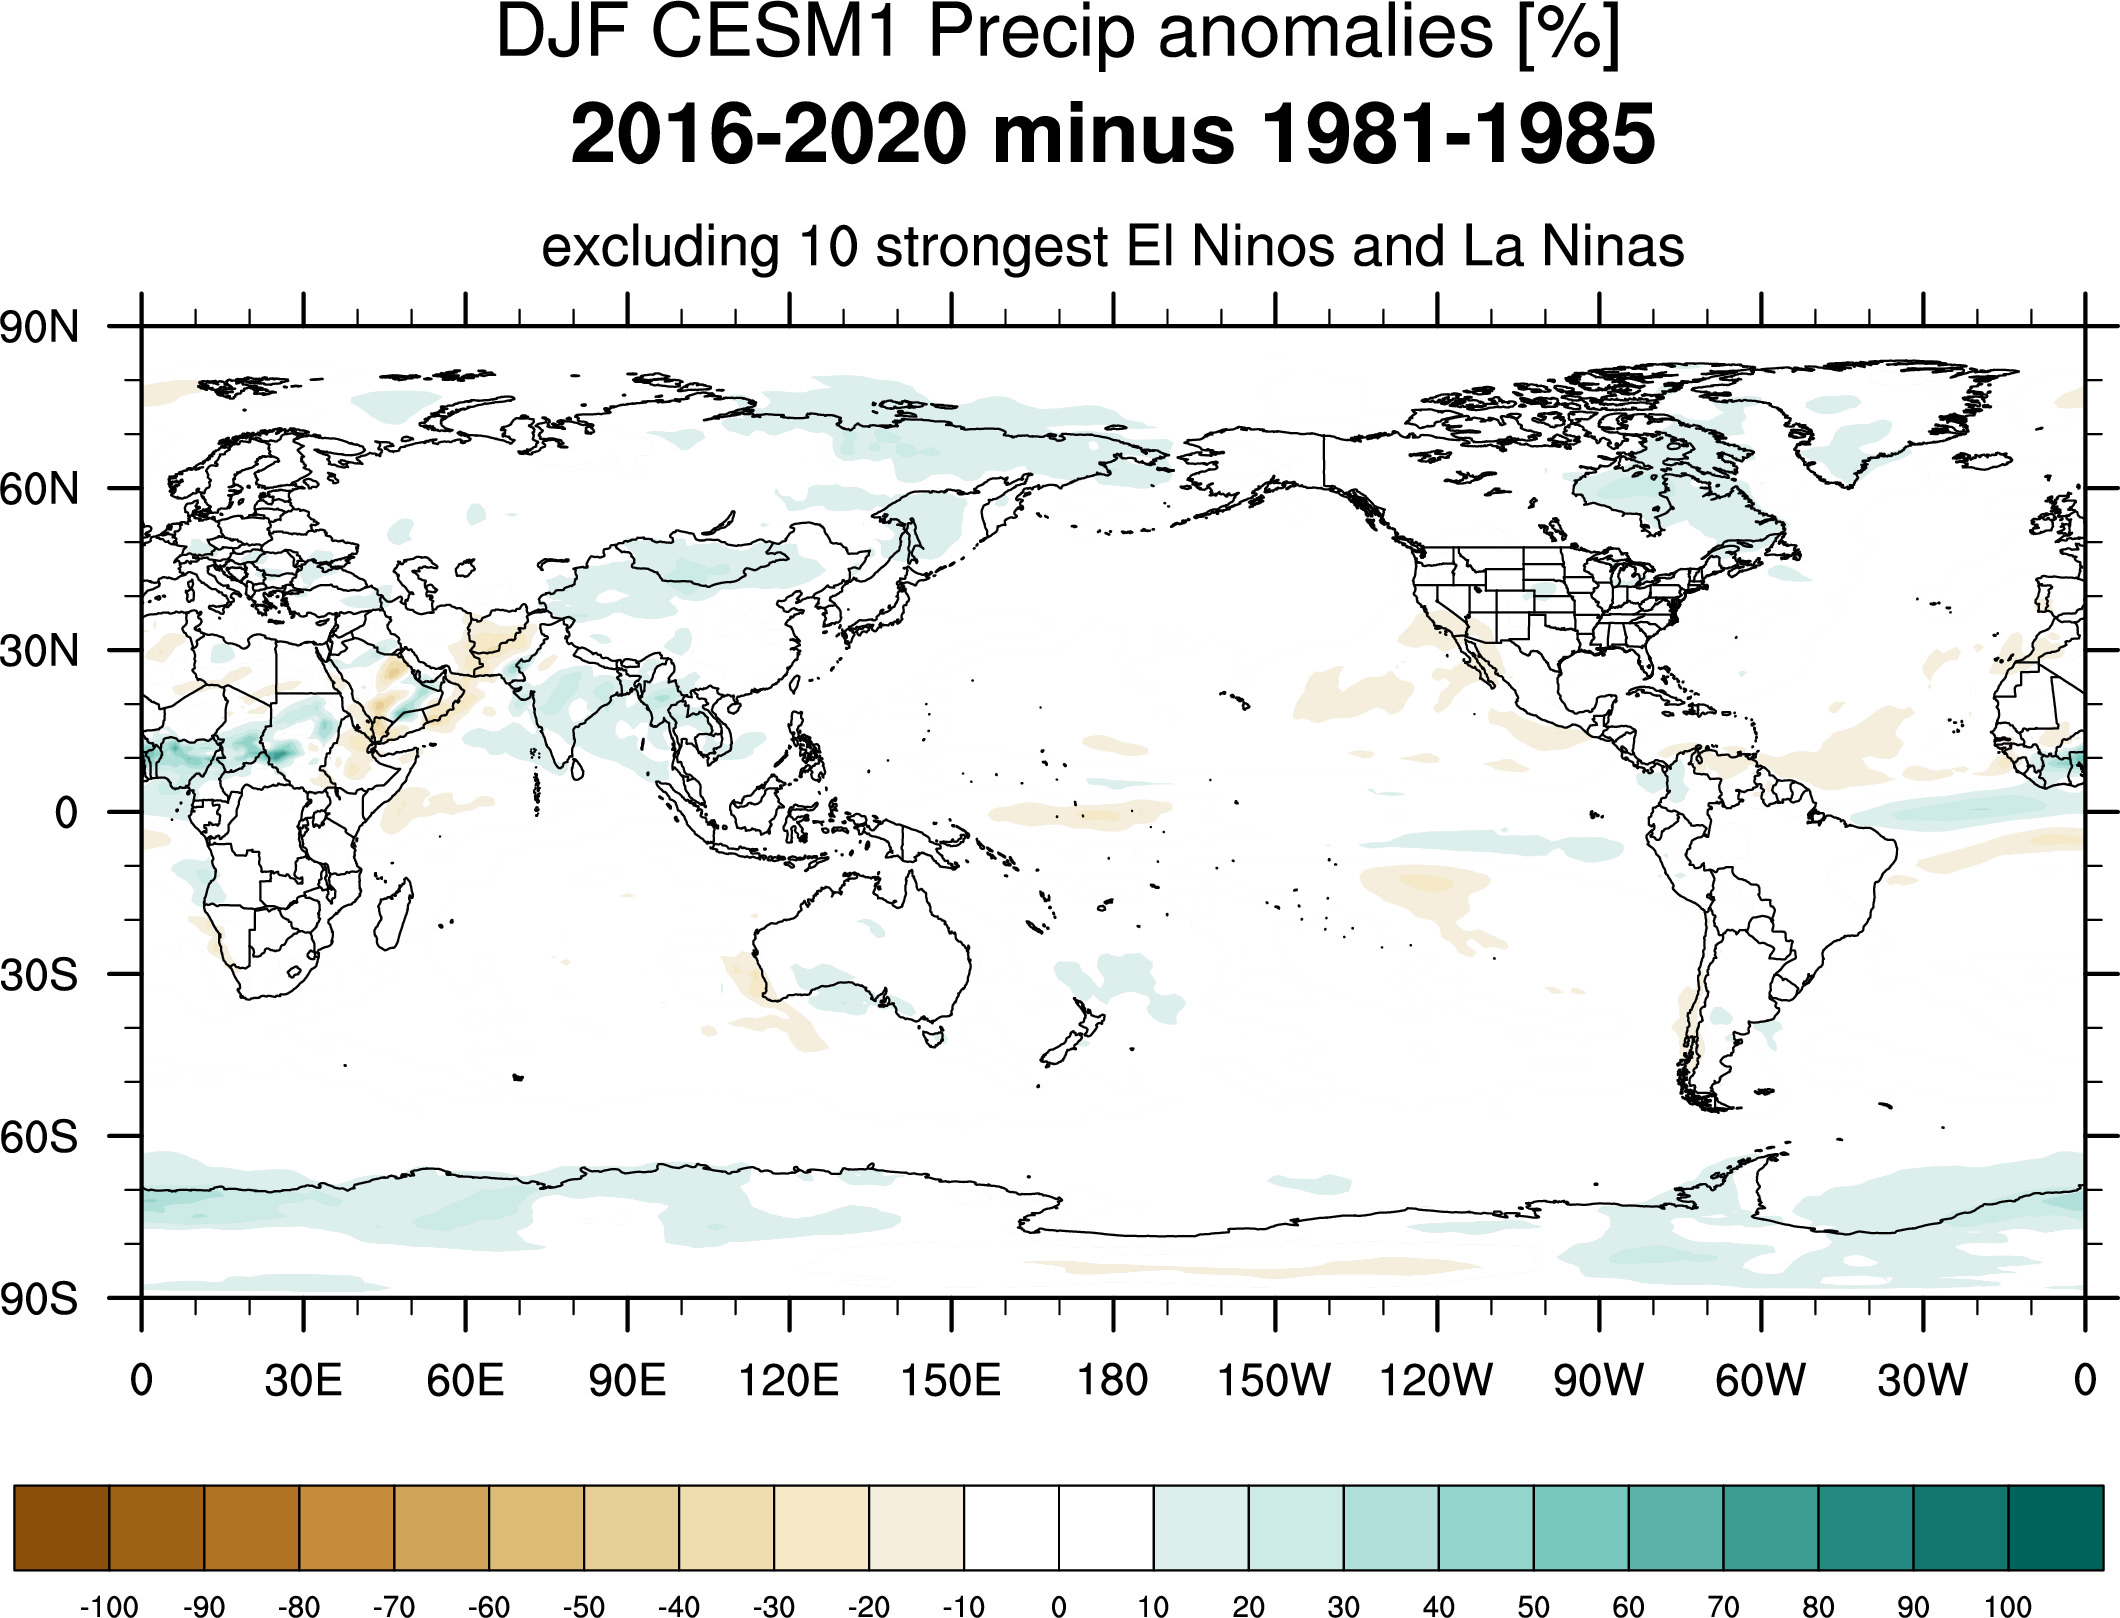
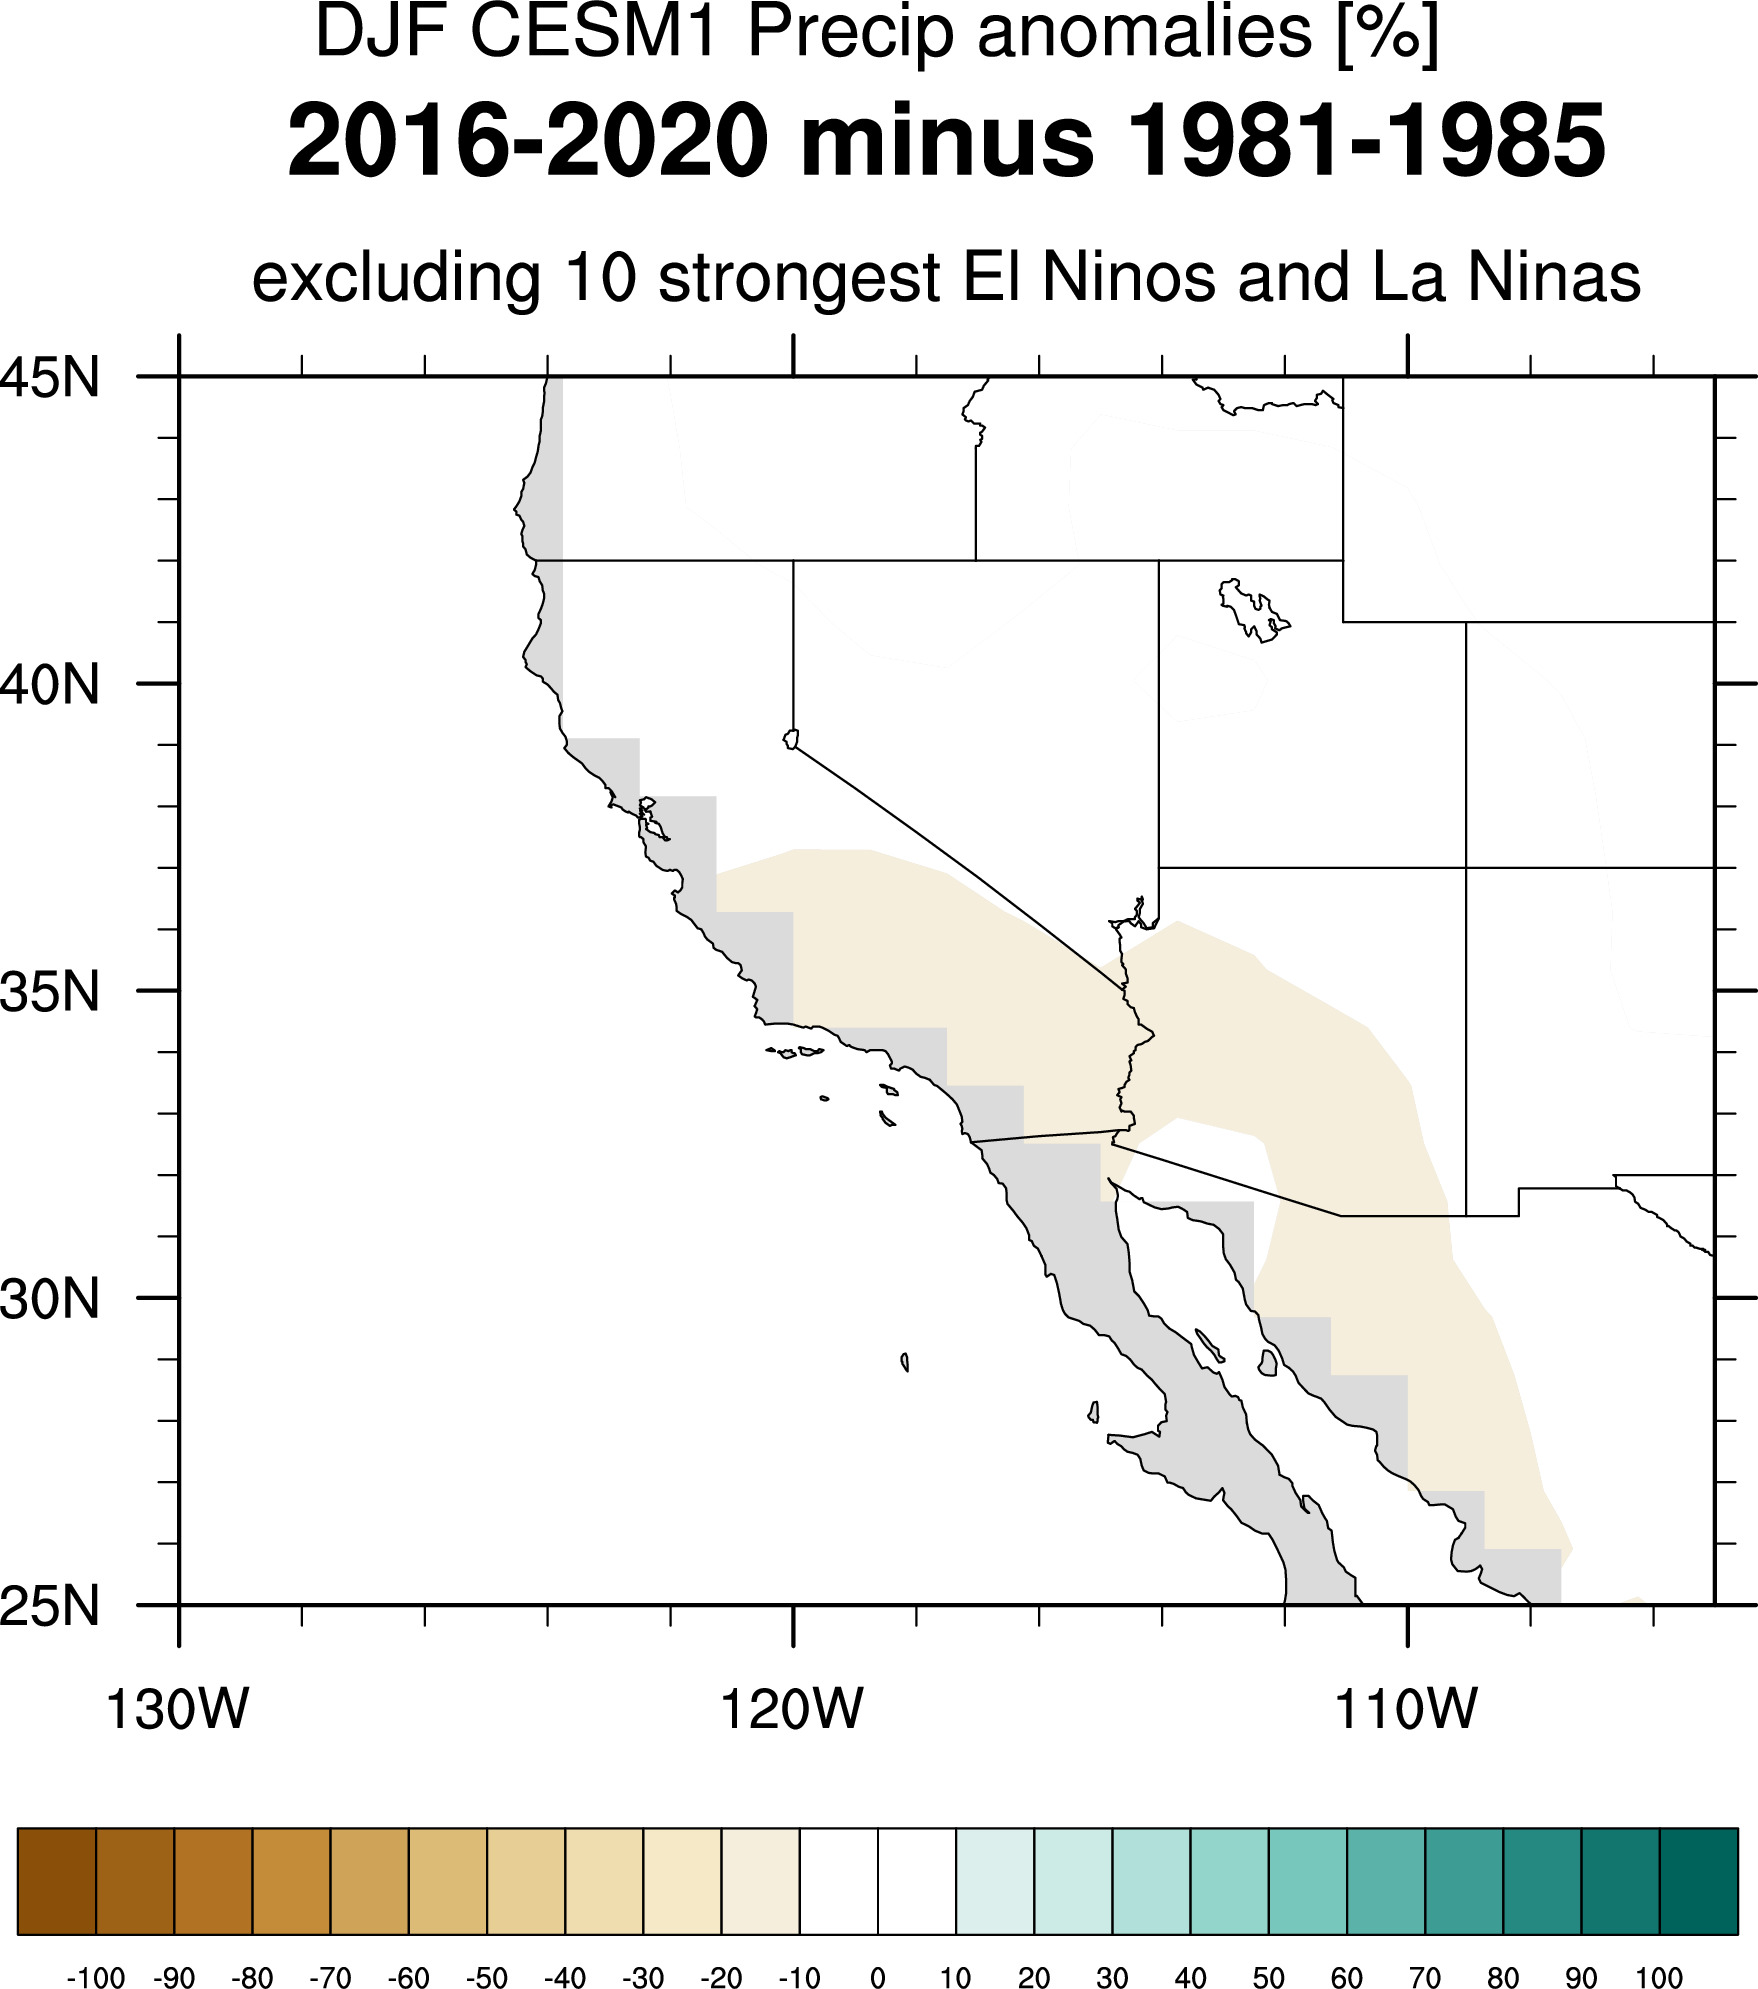
Without 10 strongest El Ninos 2020-2016 compared to 1981-1985


----------------------------------
Without 10 strongest El Ninos or 10 strongest La Ninas 2020-2016 compared to 1981-1985

______________________________________________________________________________________________________________________________________________________________
Look at different 5 year periods: 1921-1925, 1981-1985, 1996-2000, 2016-2020
DJF Nino3.4 Index for reference period 1981-2010.
non-El Nino regimes at bottom.
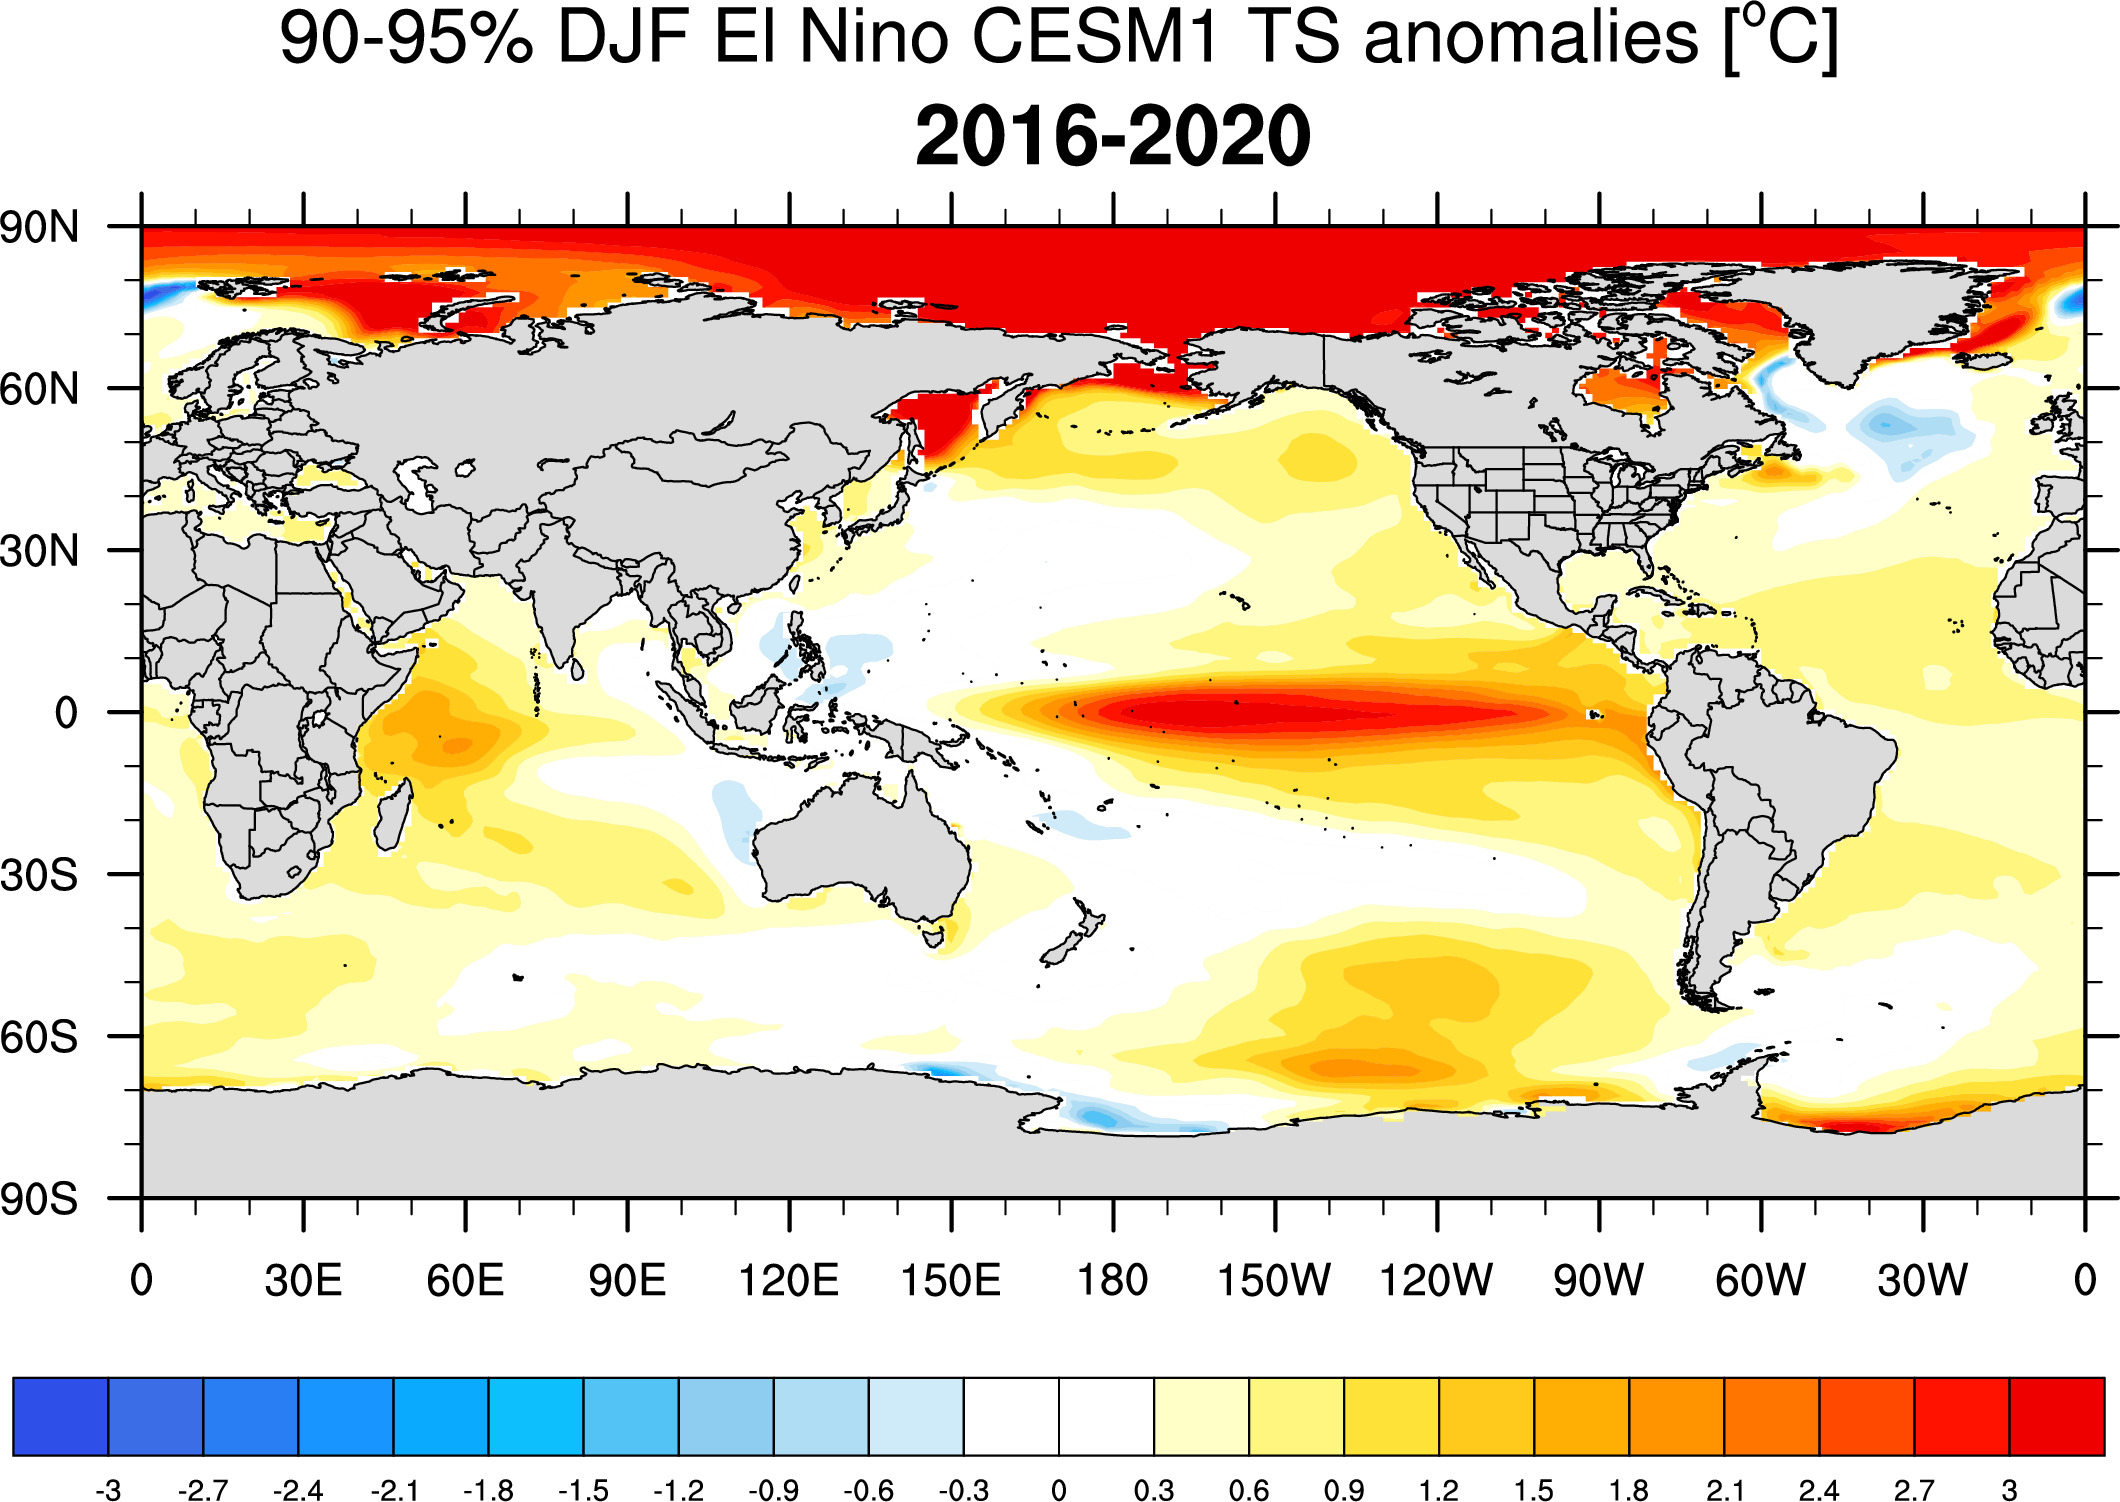
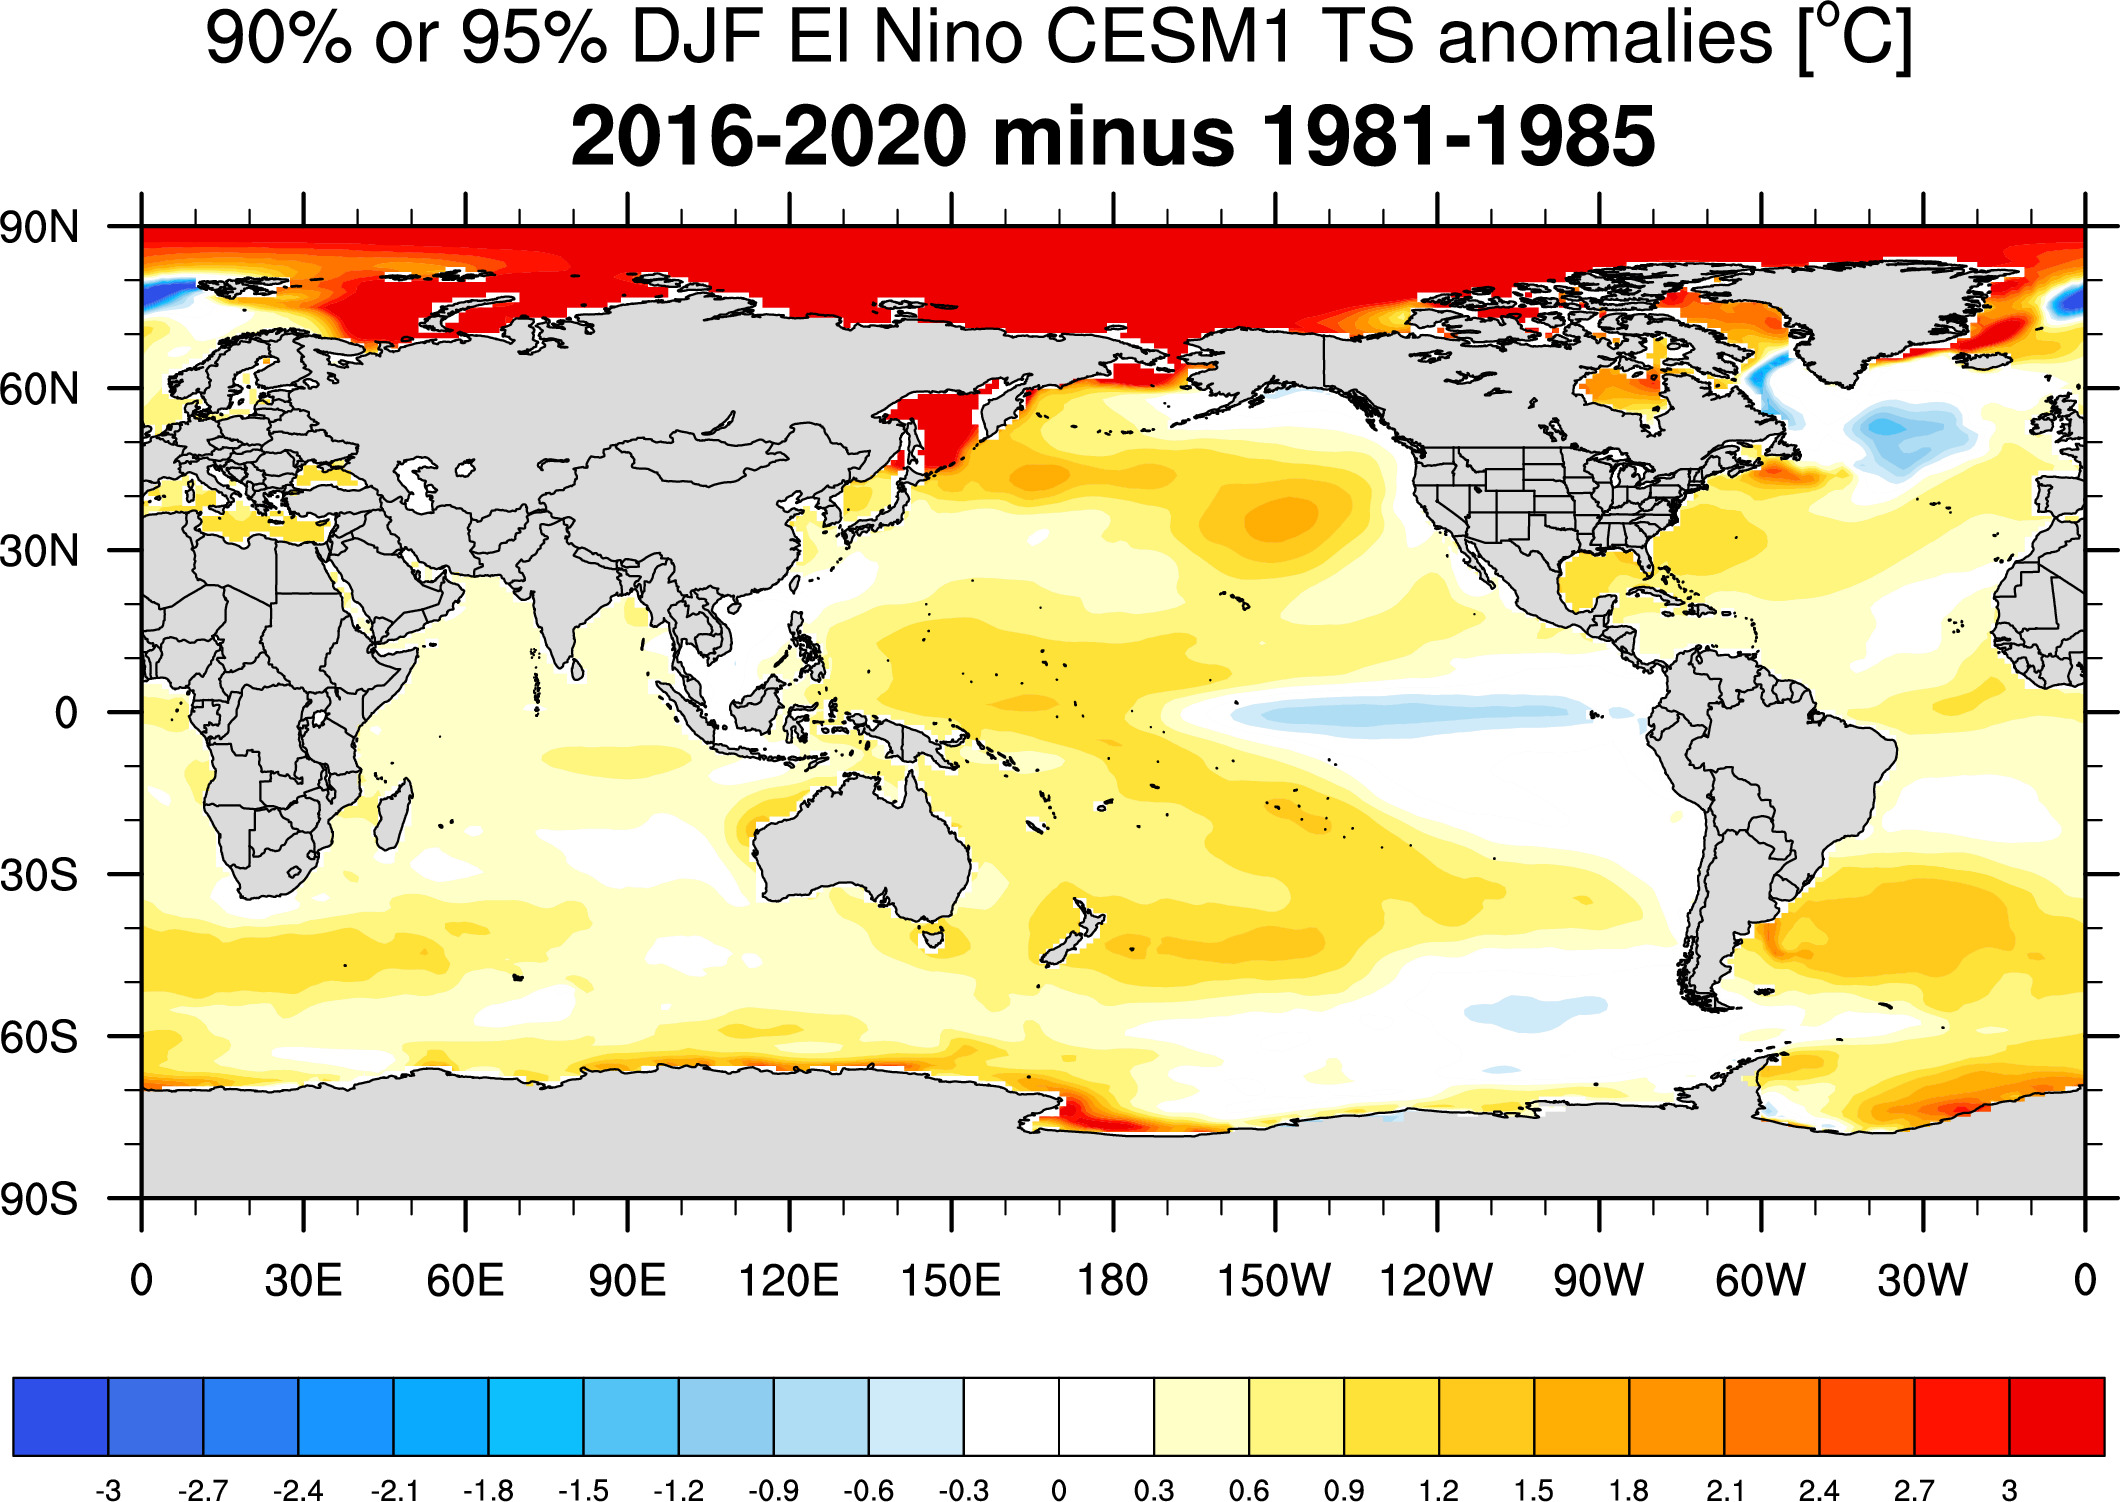
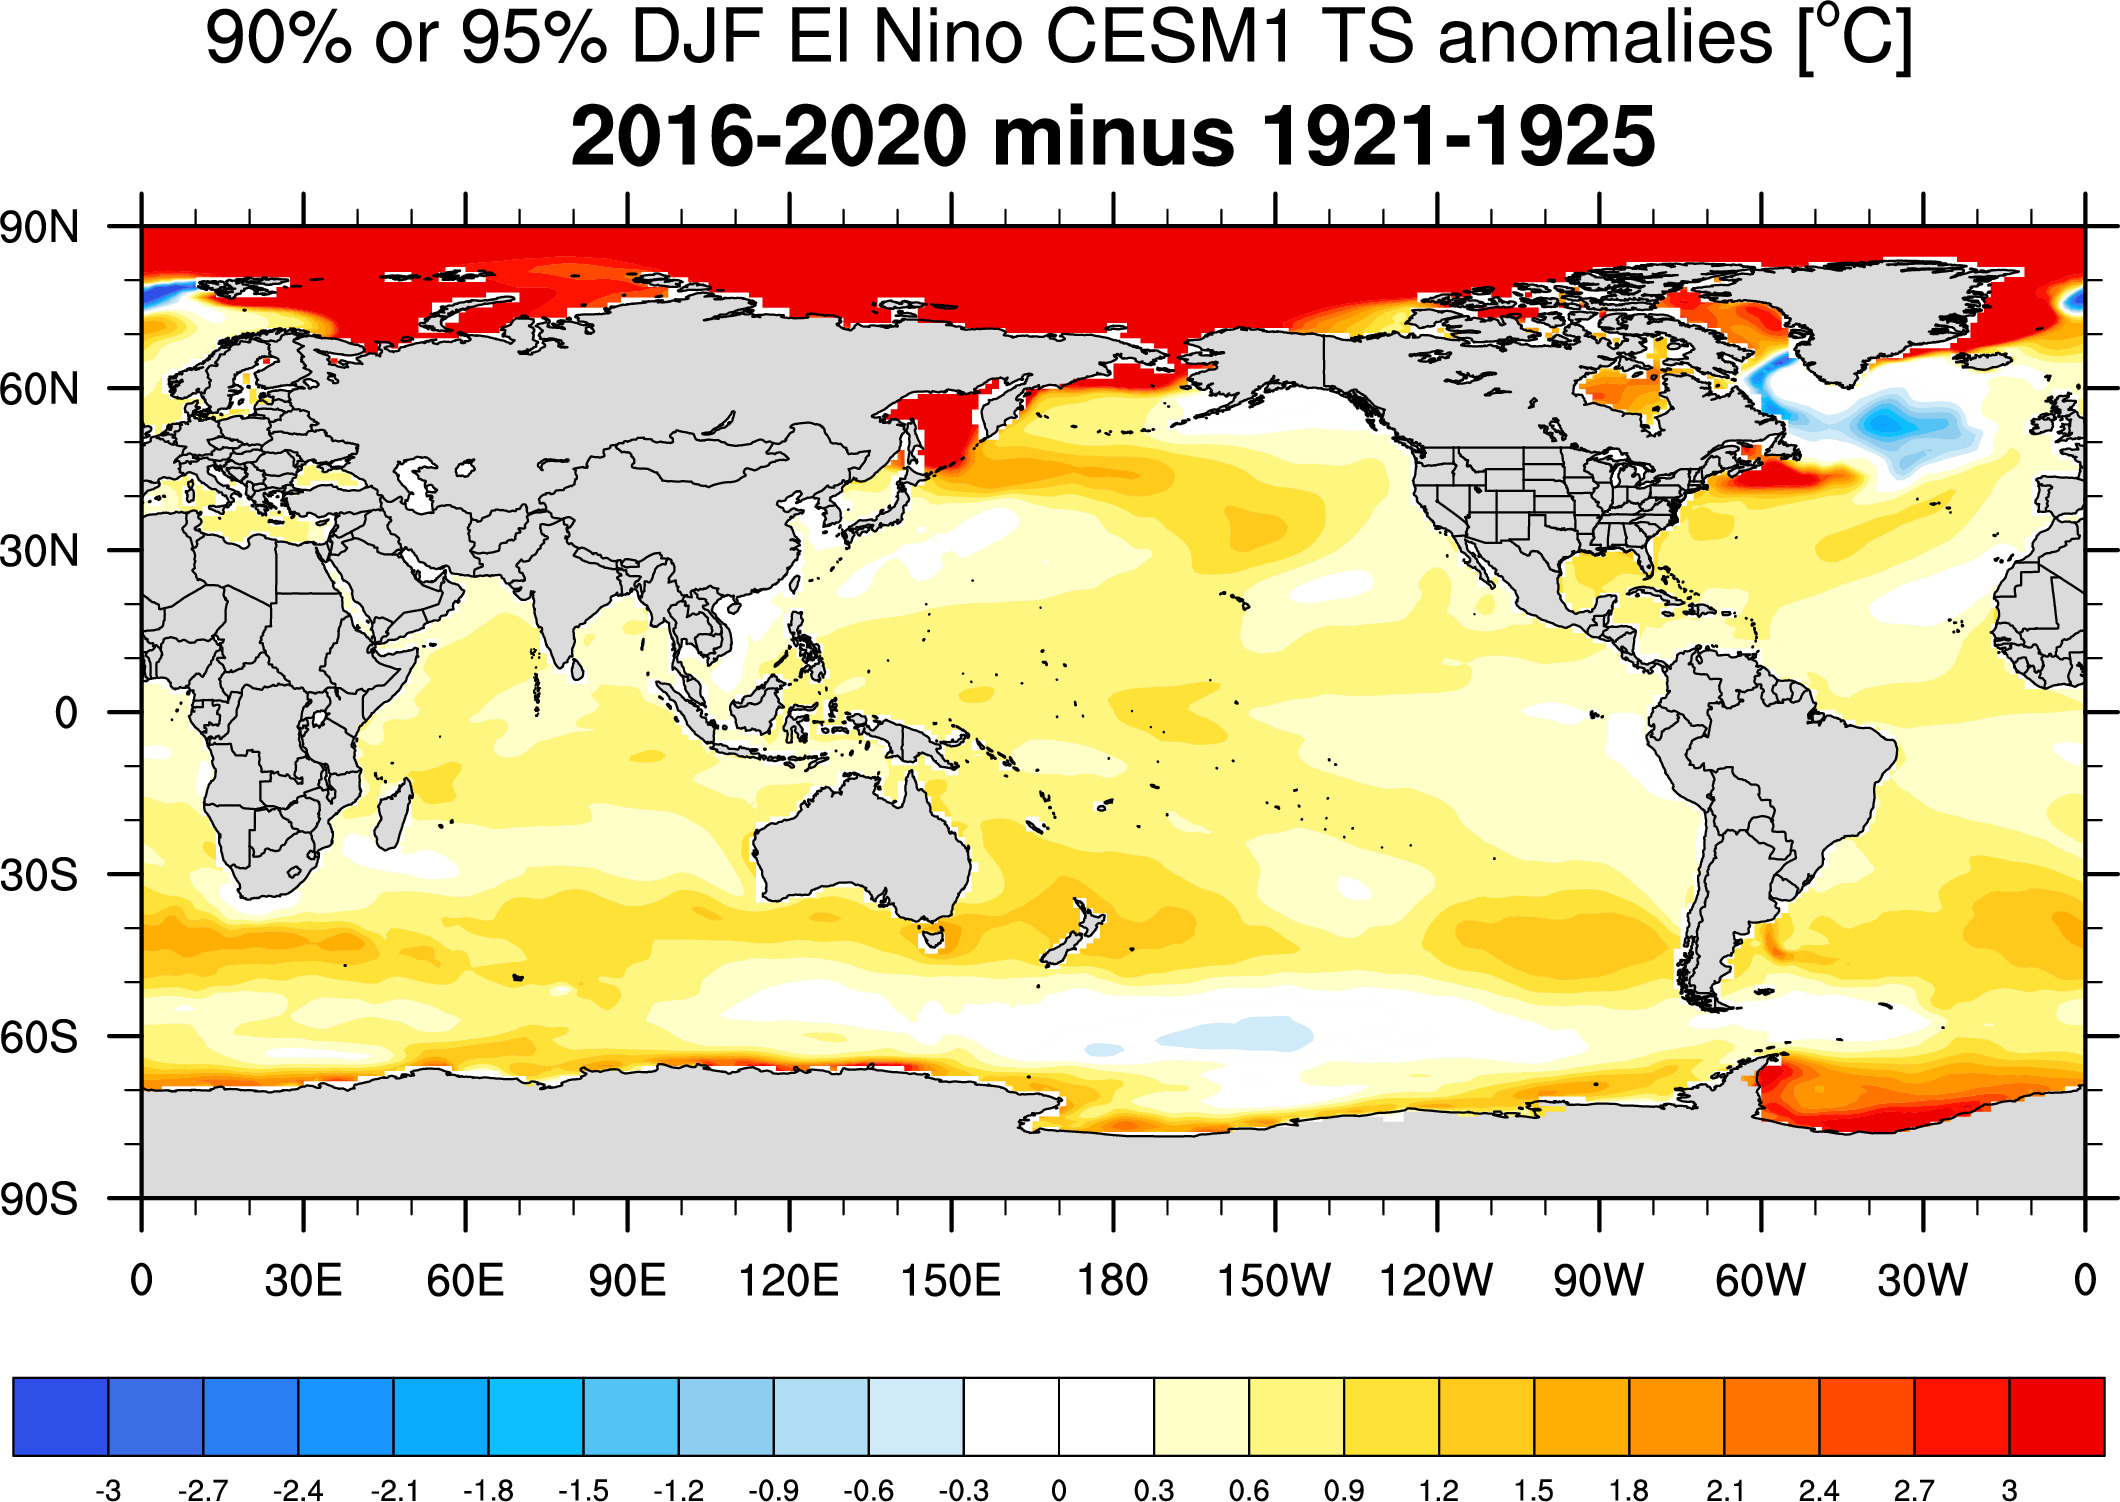
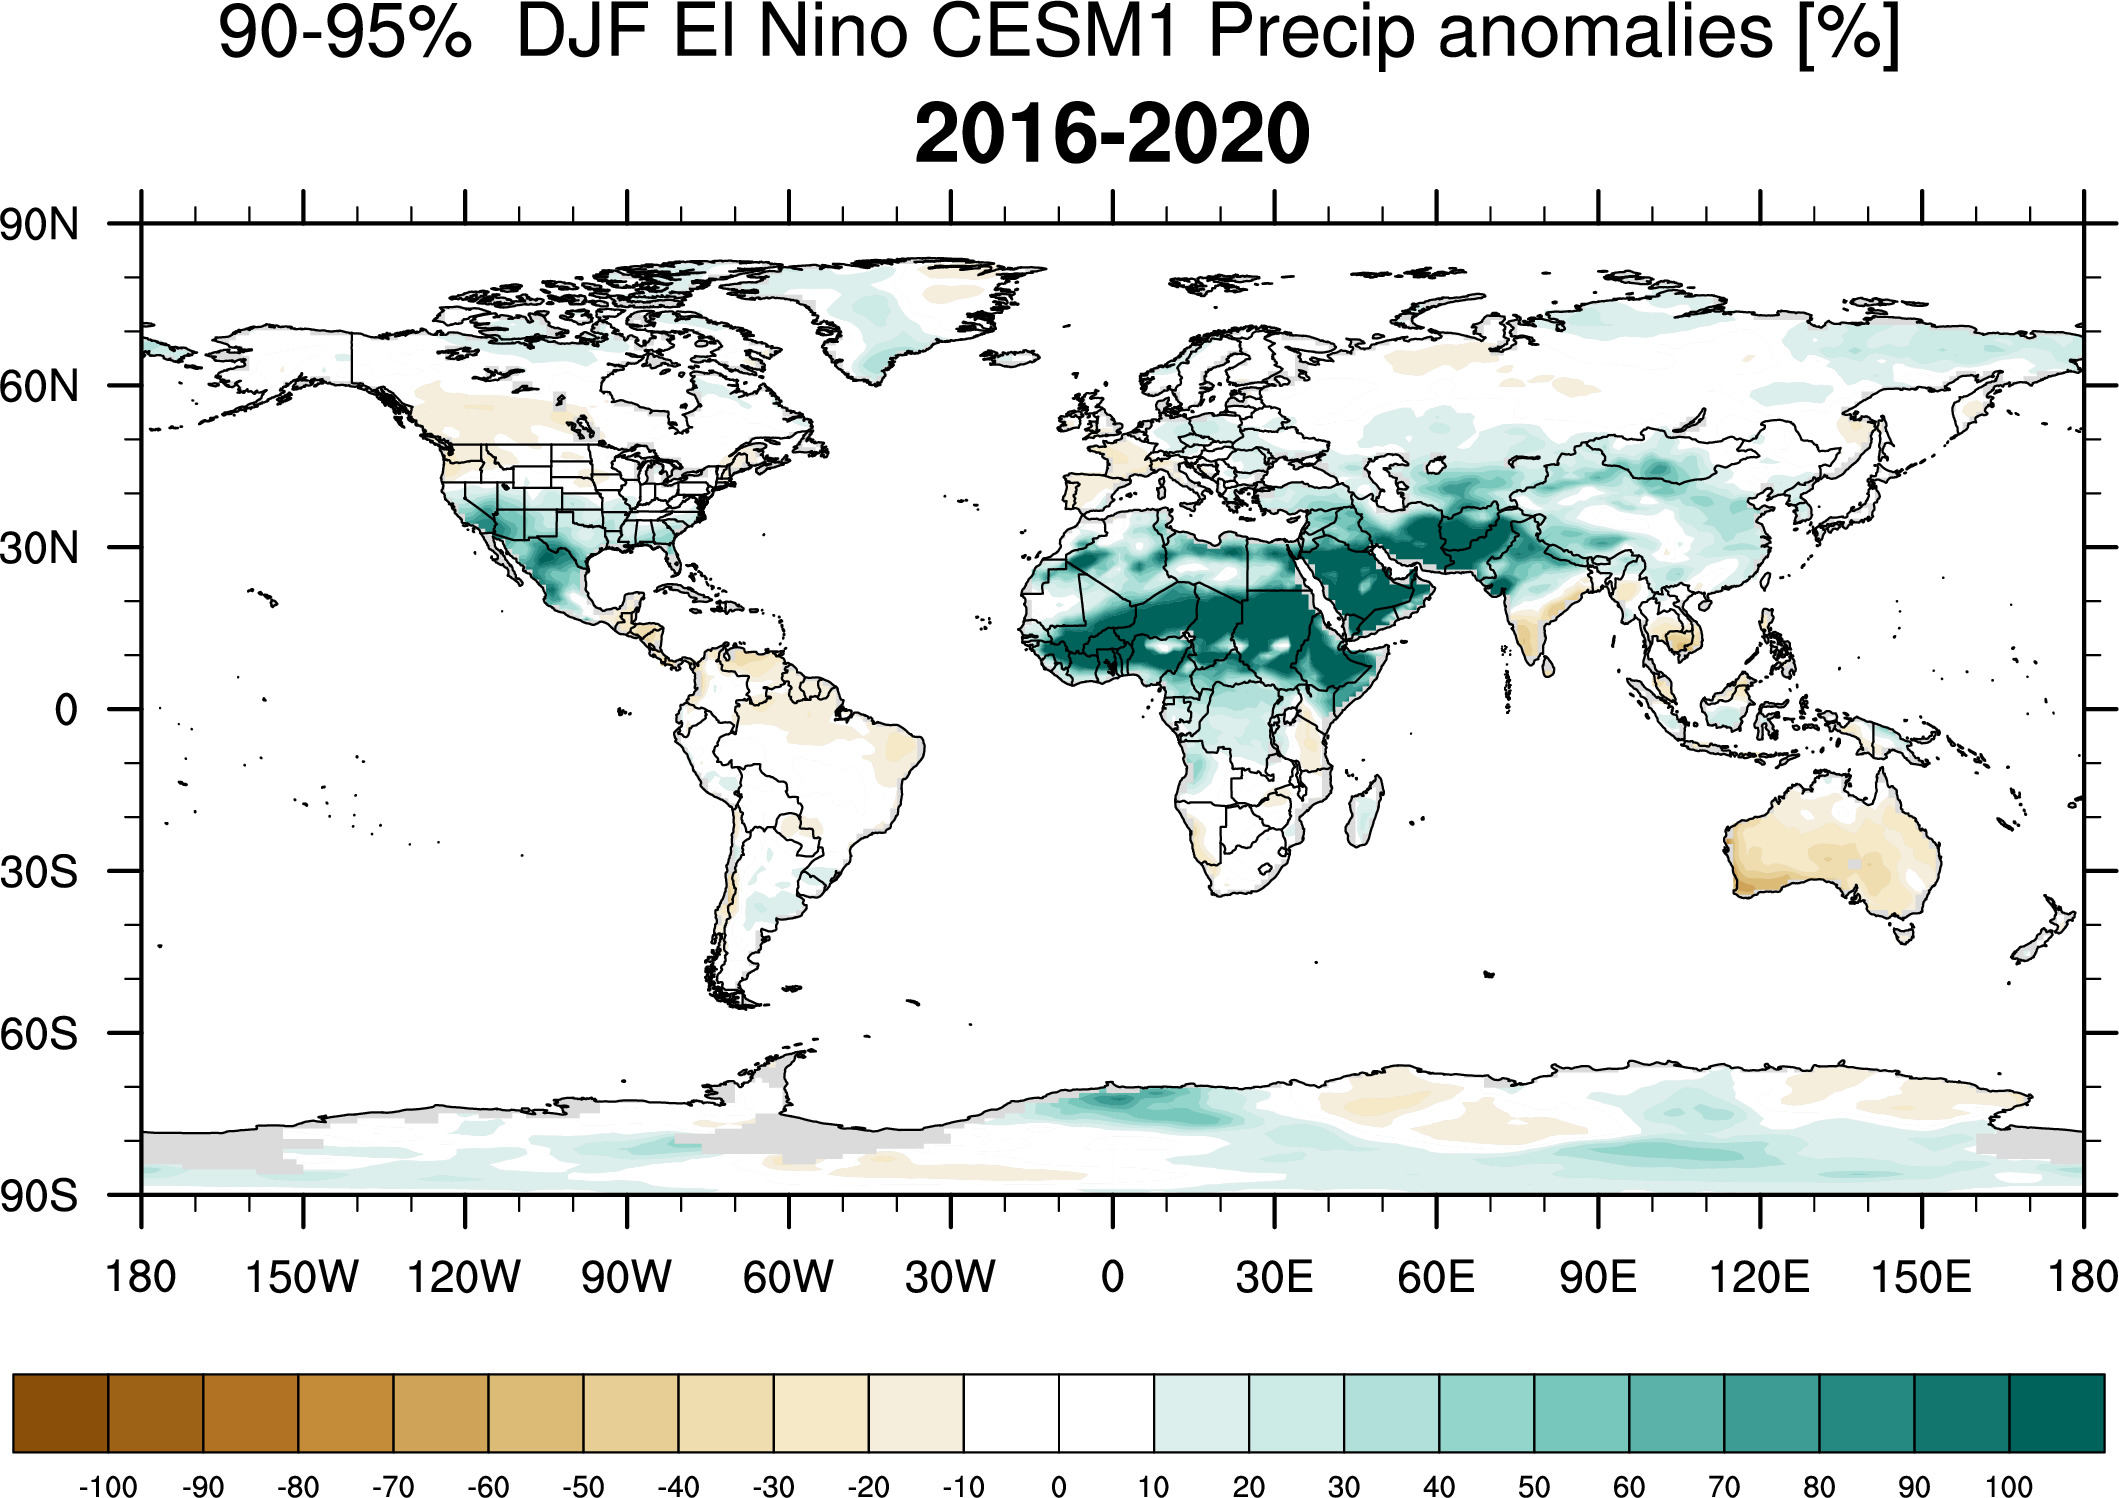
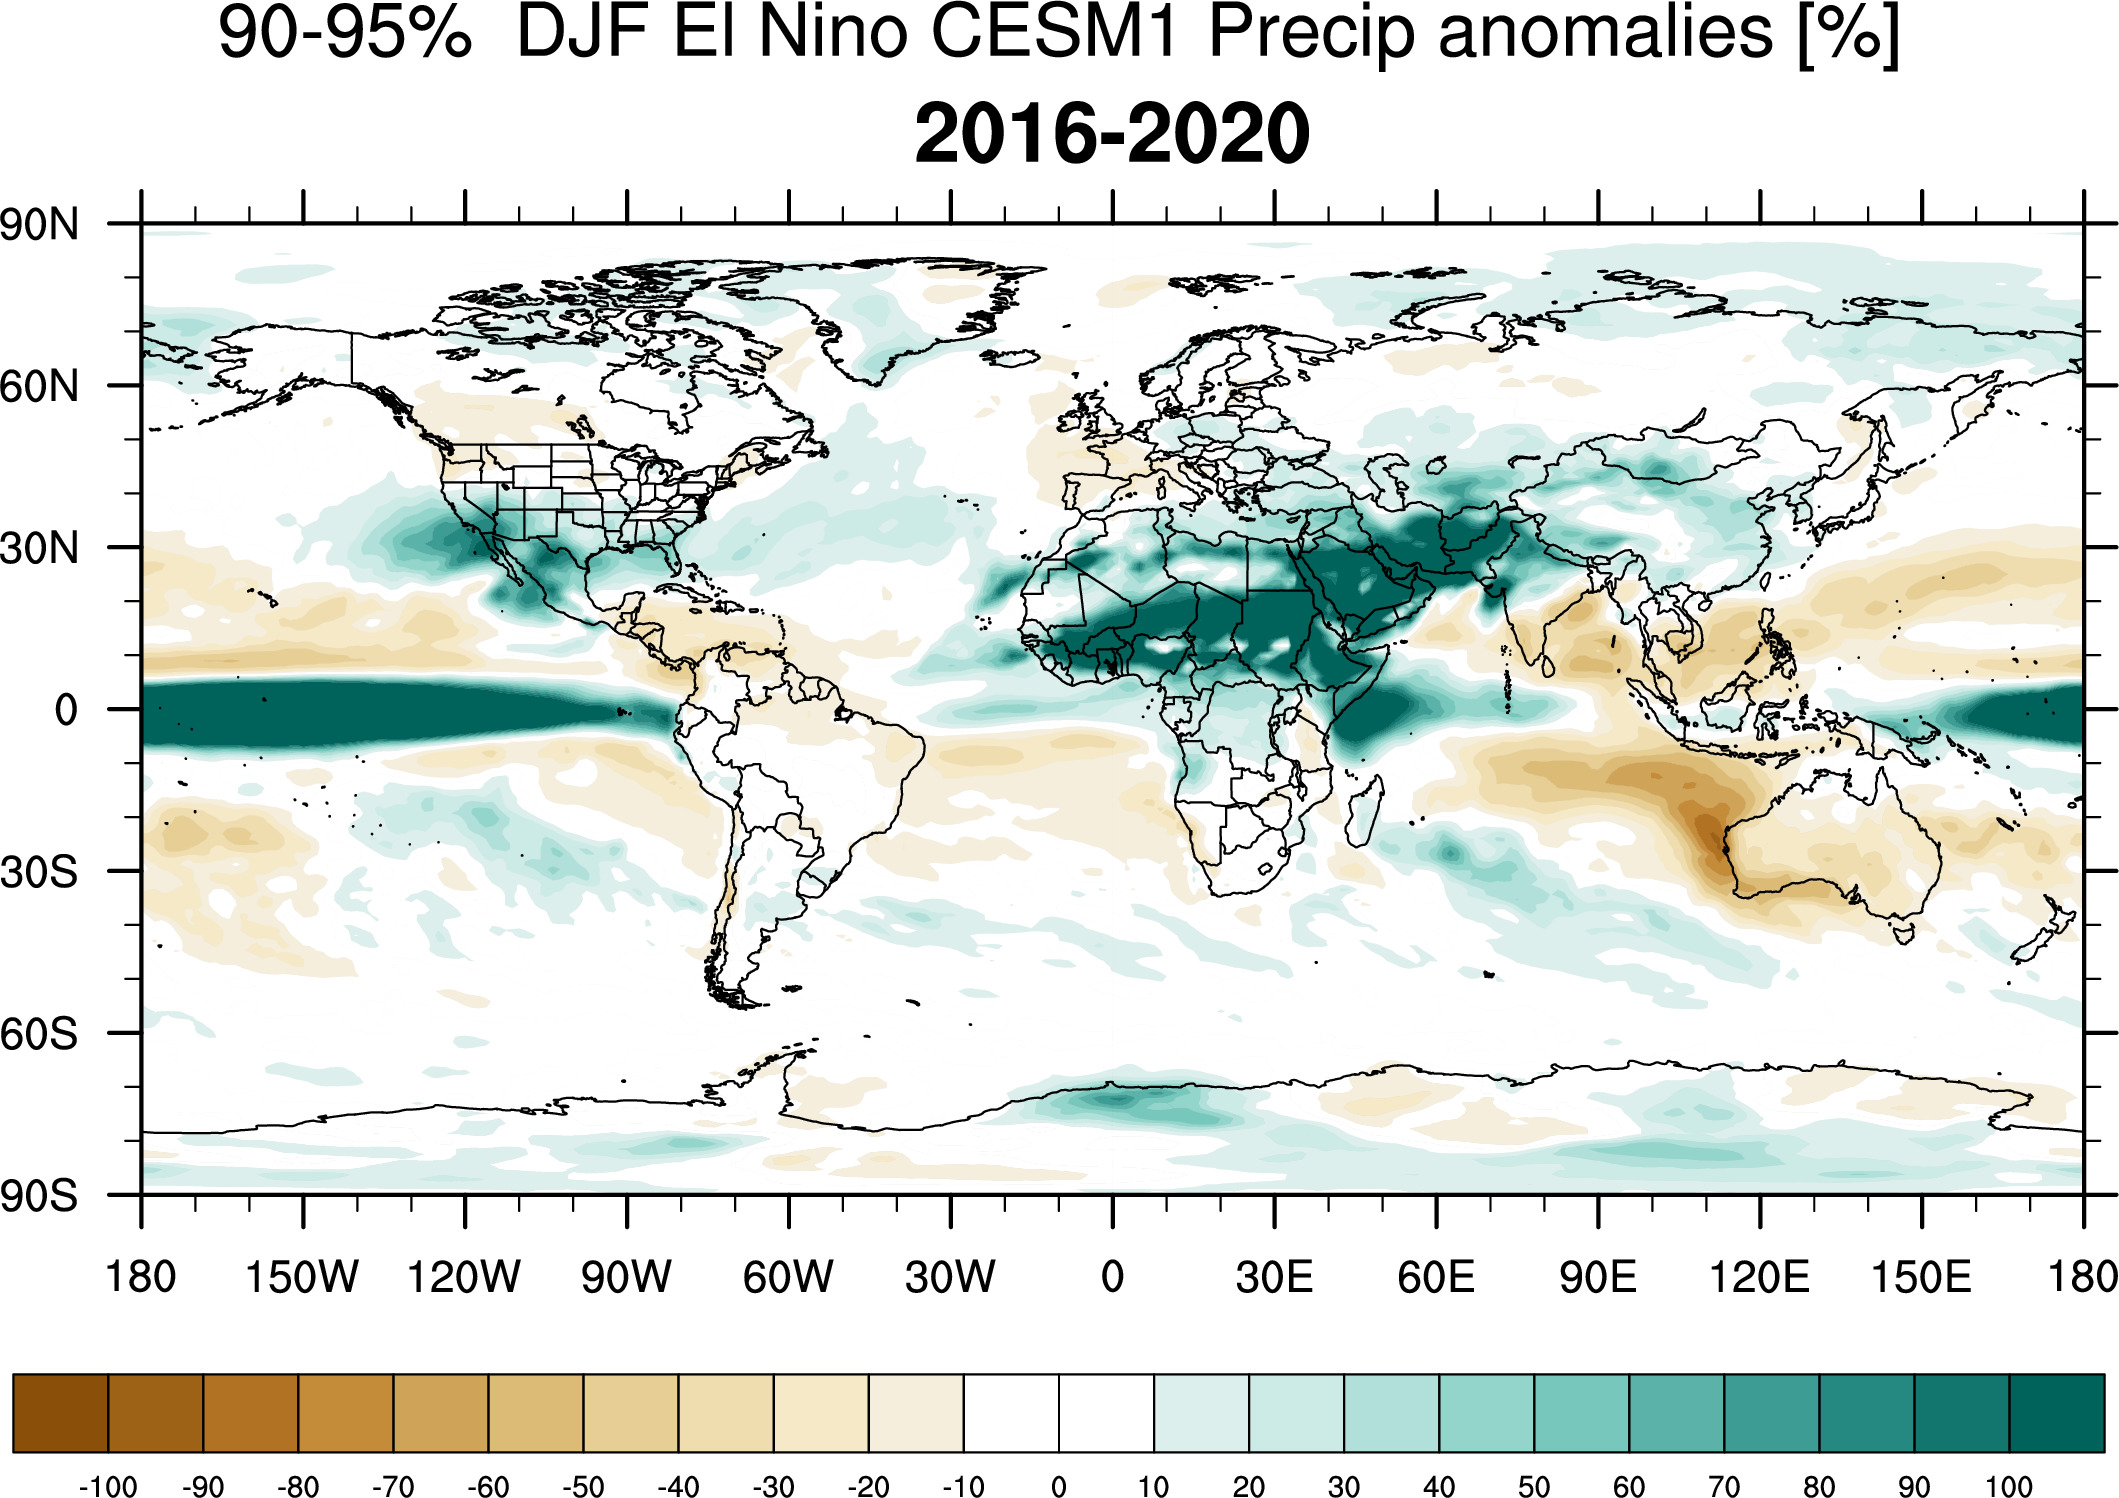
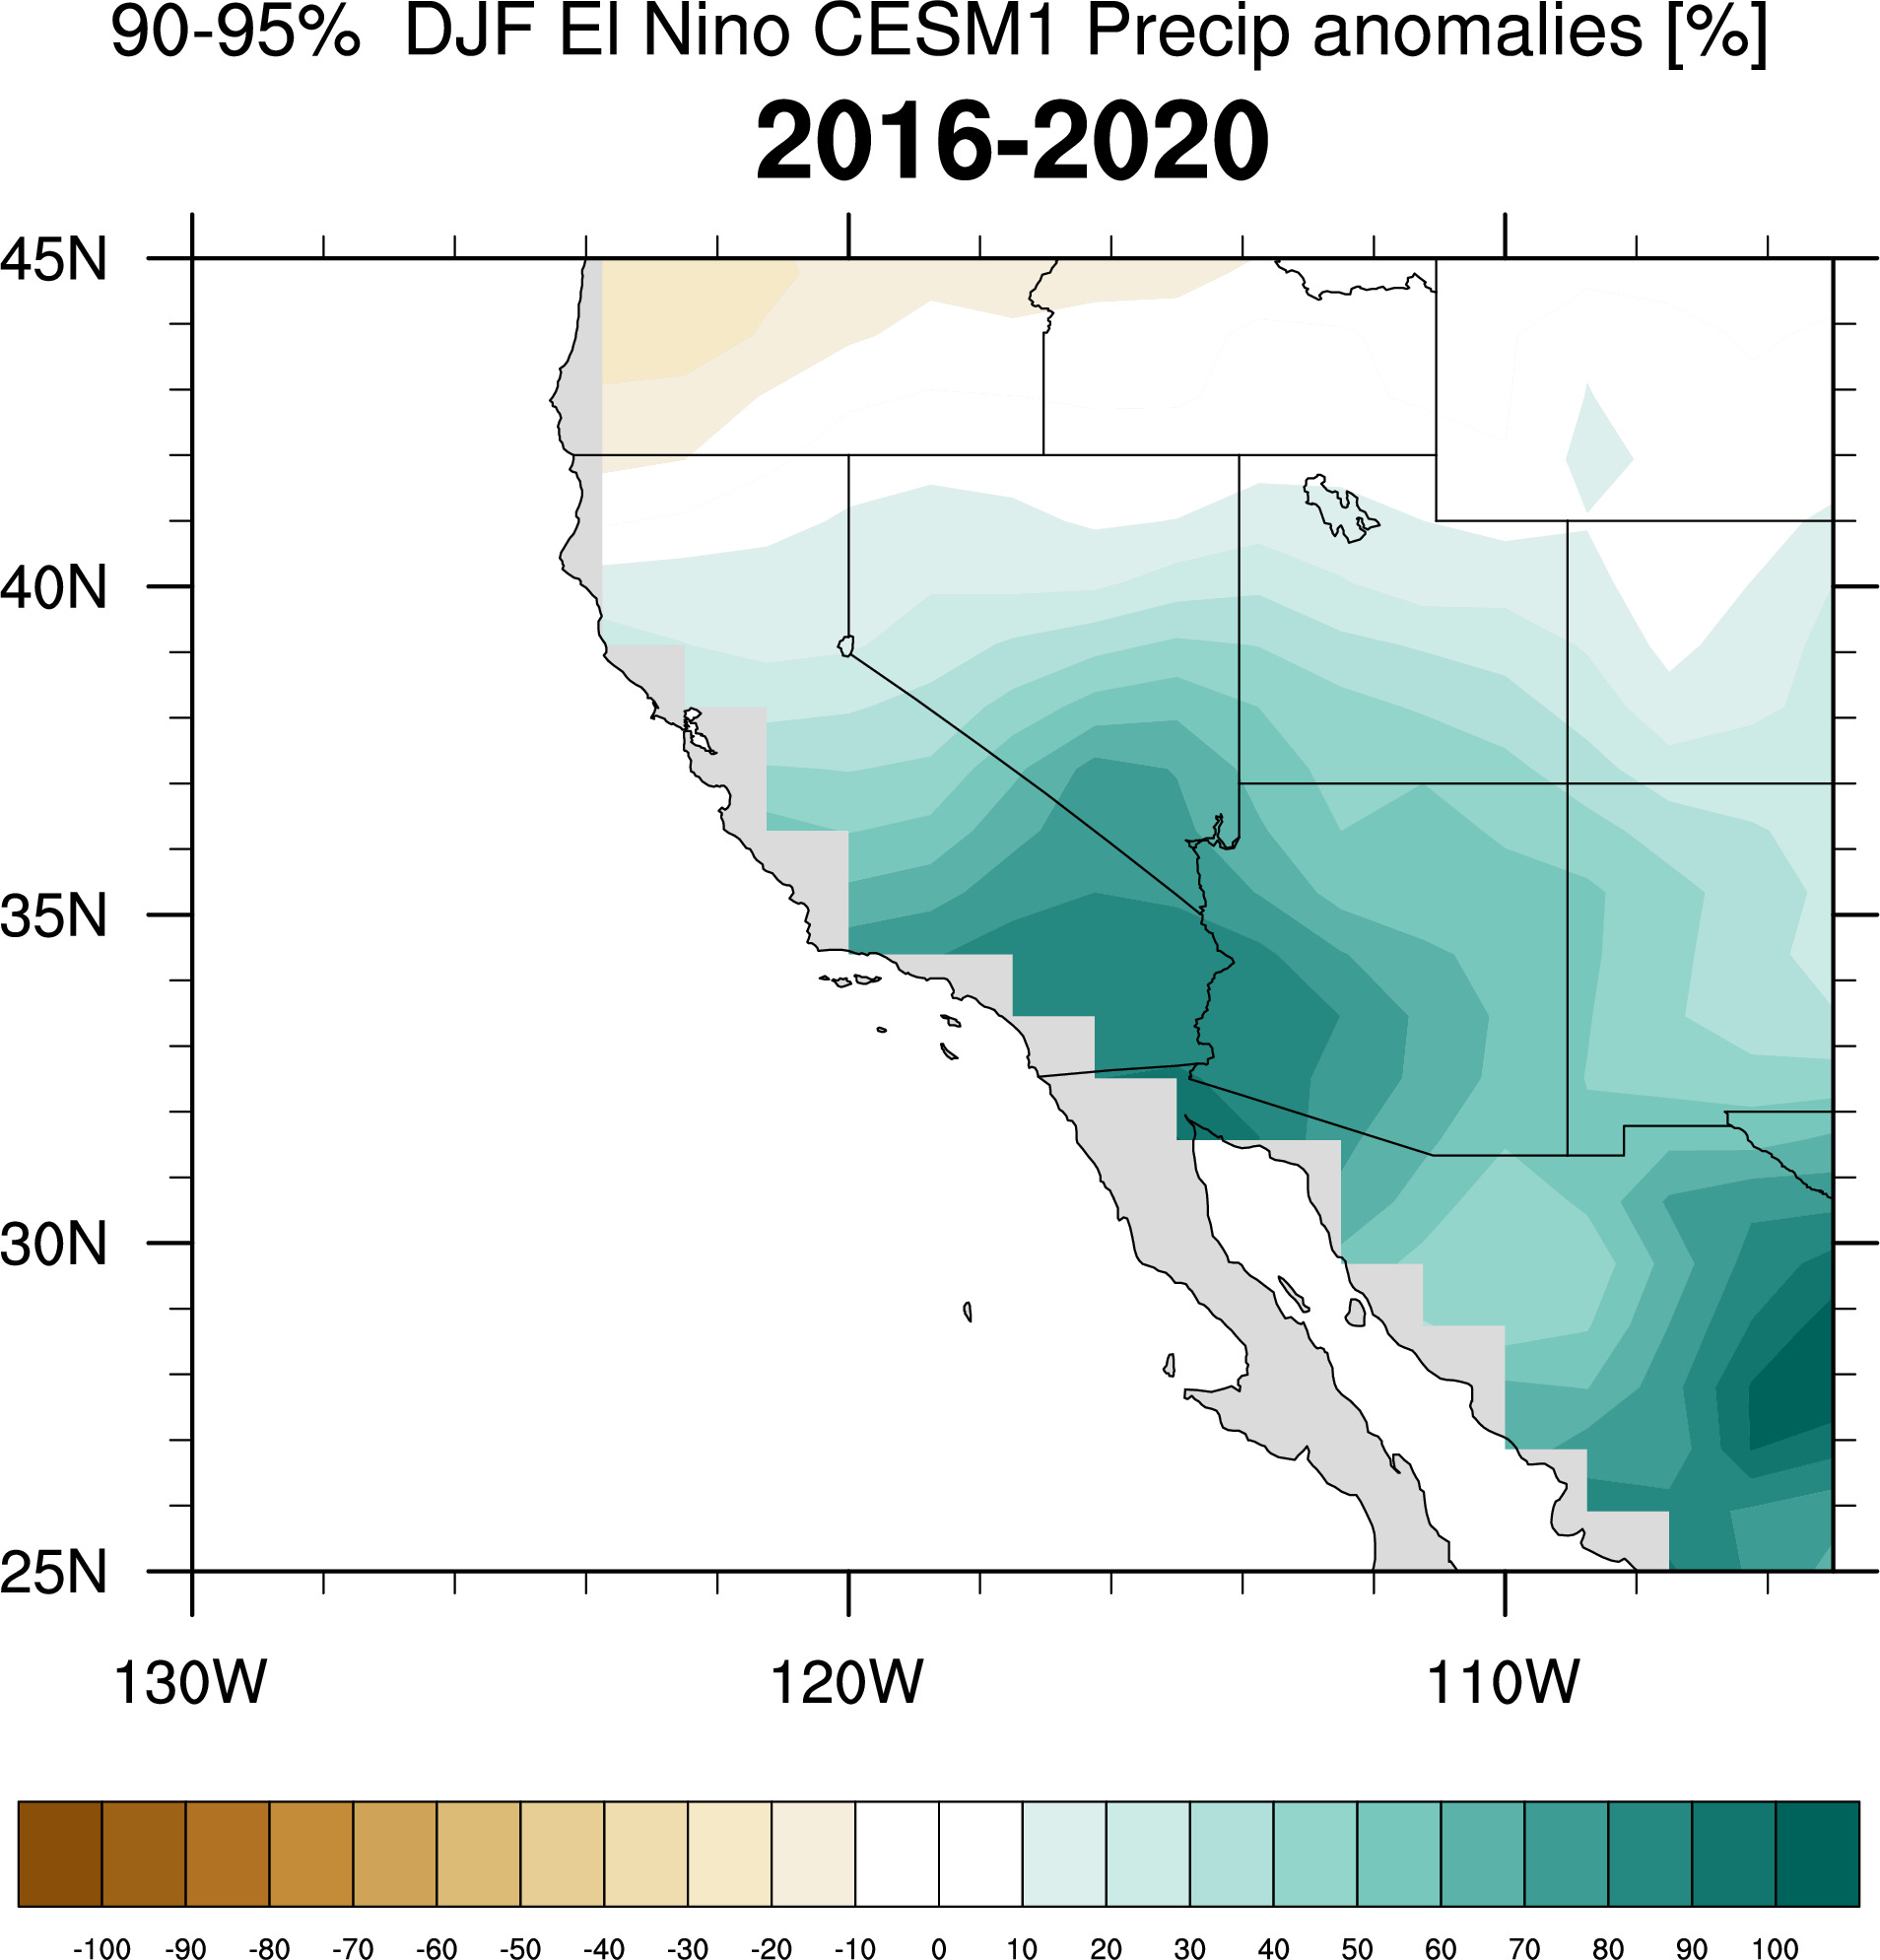
for 2016-2020 ~90%-95% DJF El Ninos
SST anomaly maps
Differences
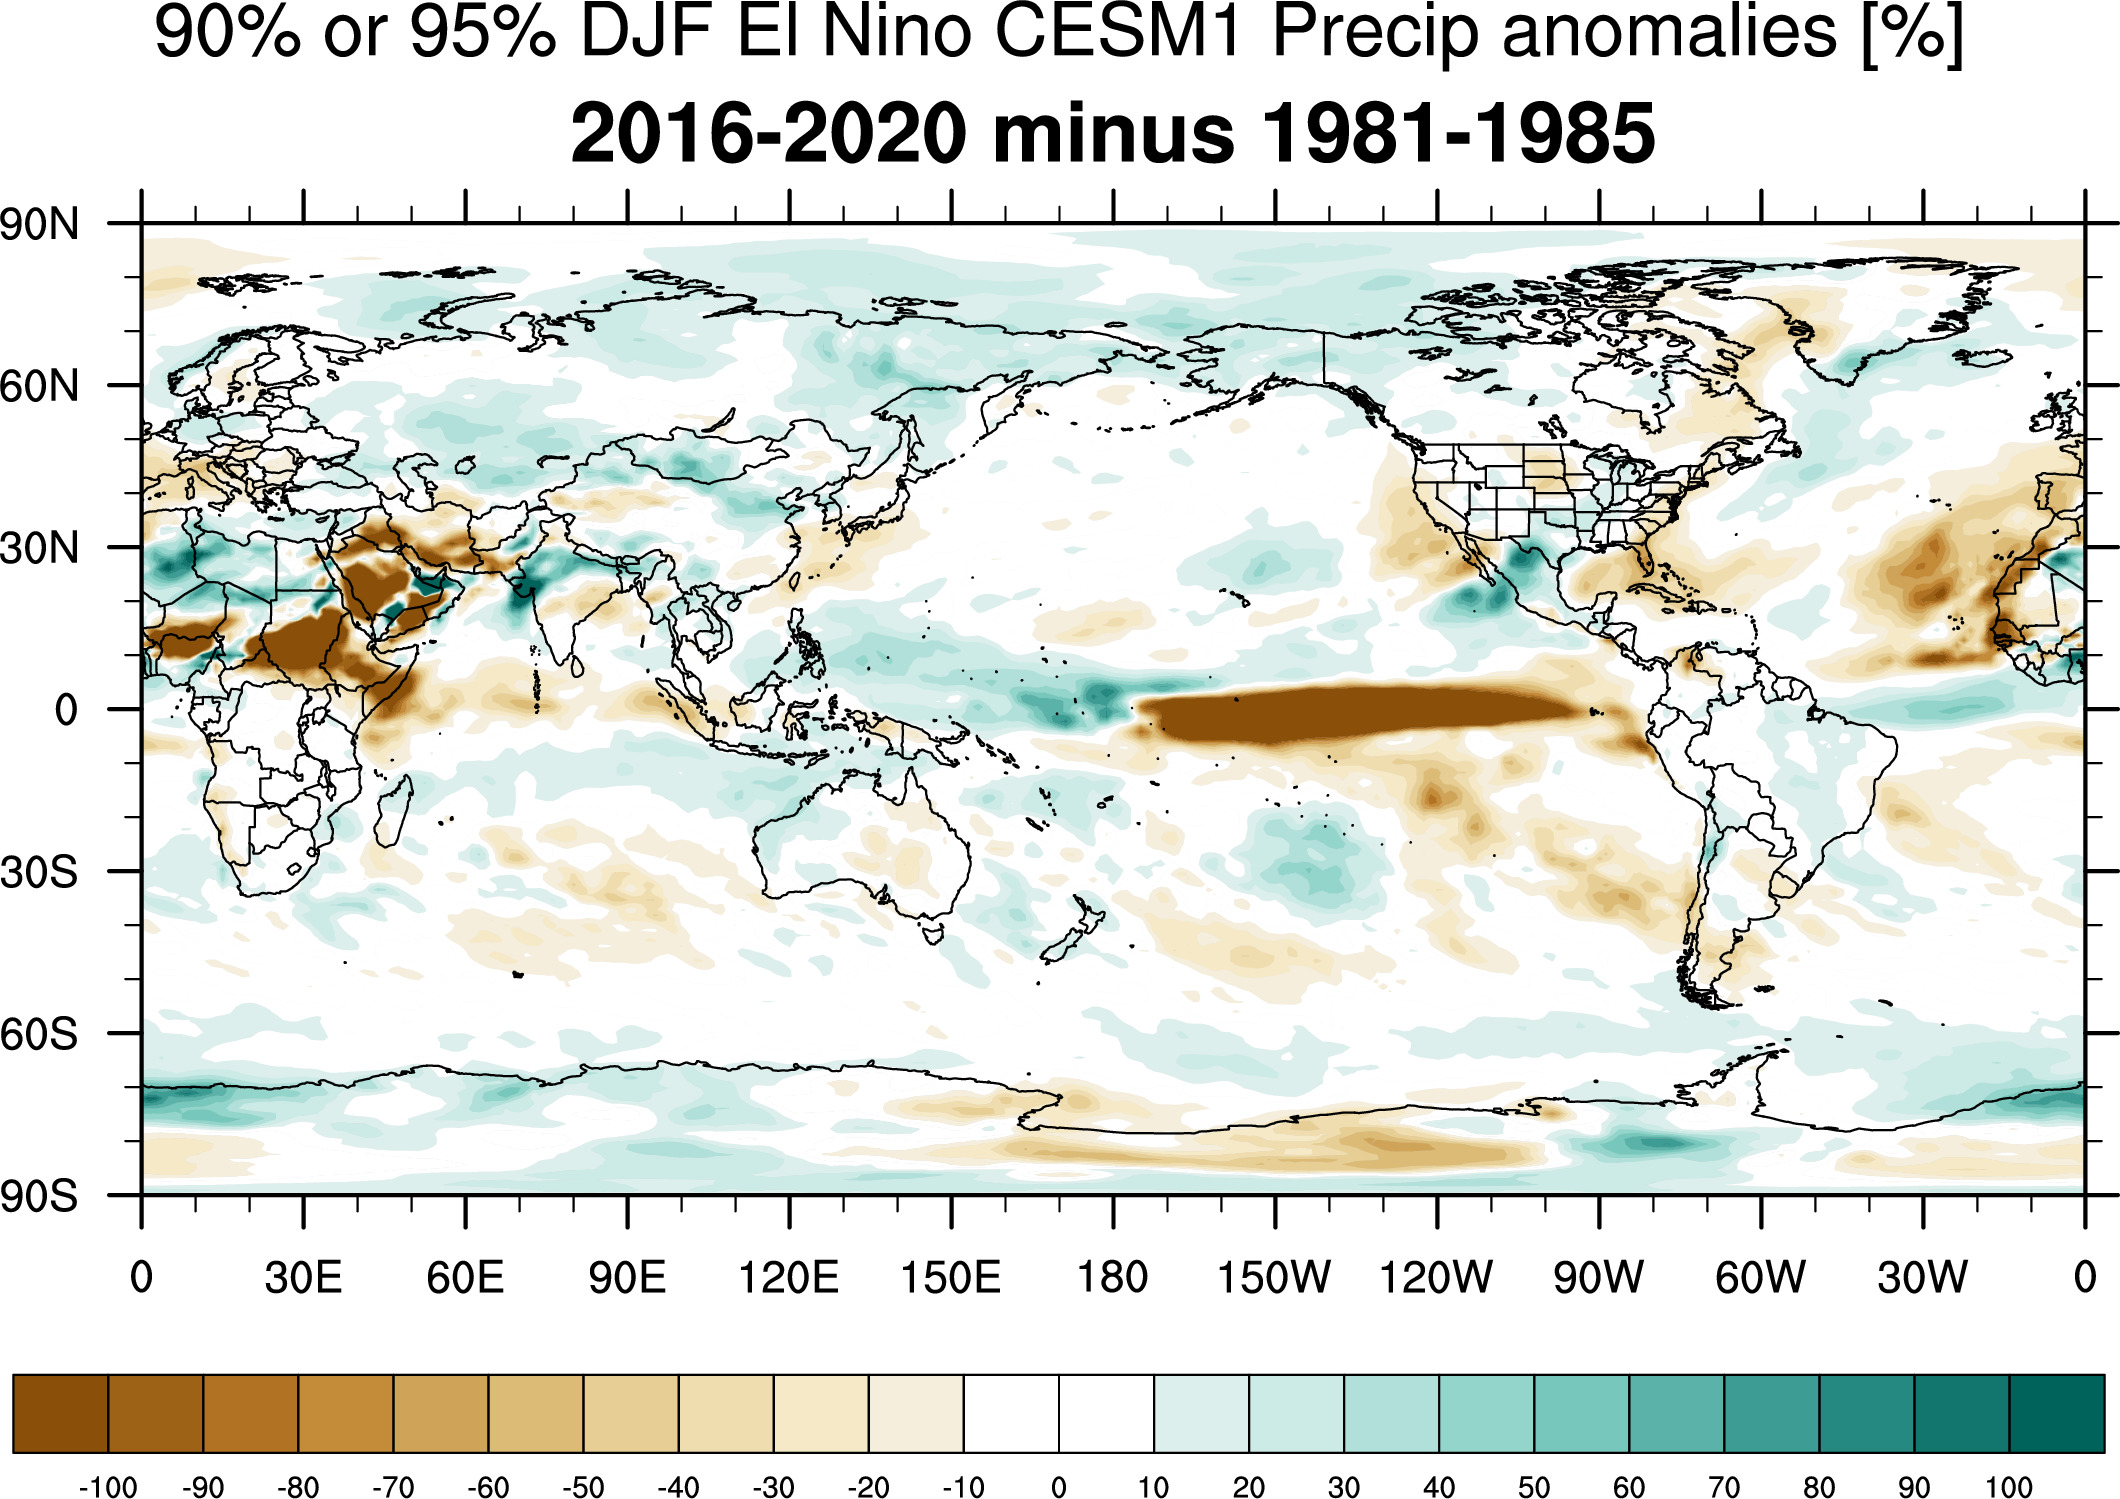
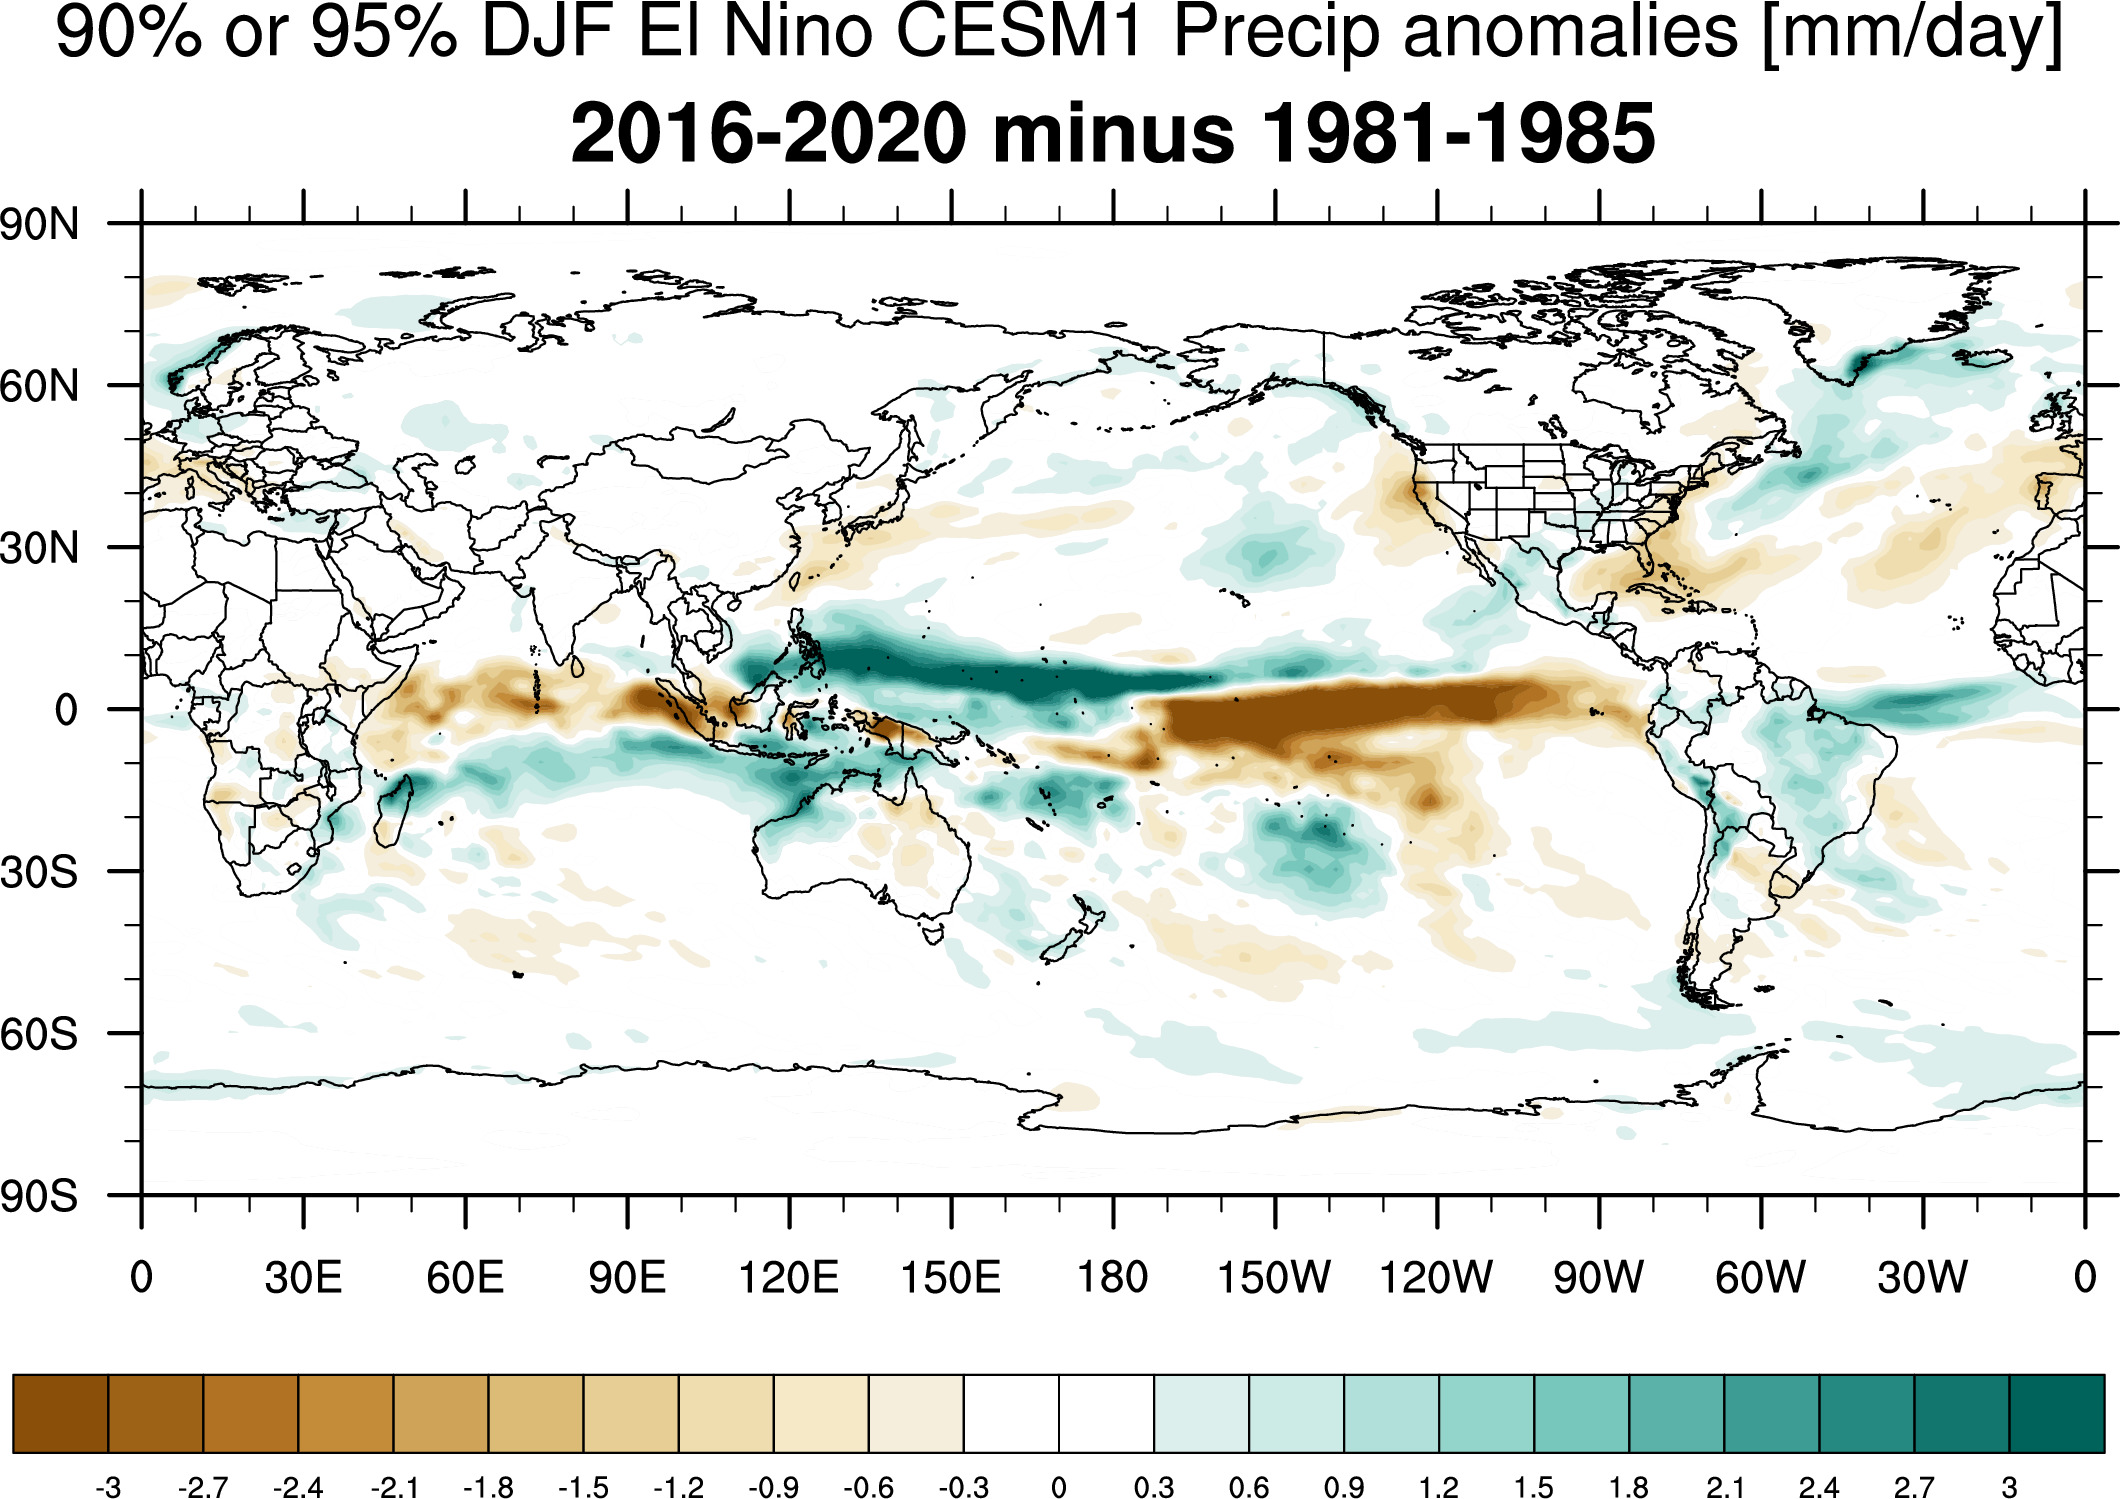
Precipitation anomaly maps
Differences
200mb Height anomaly maps
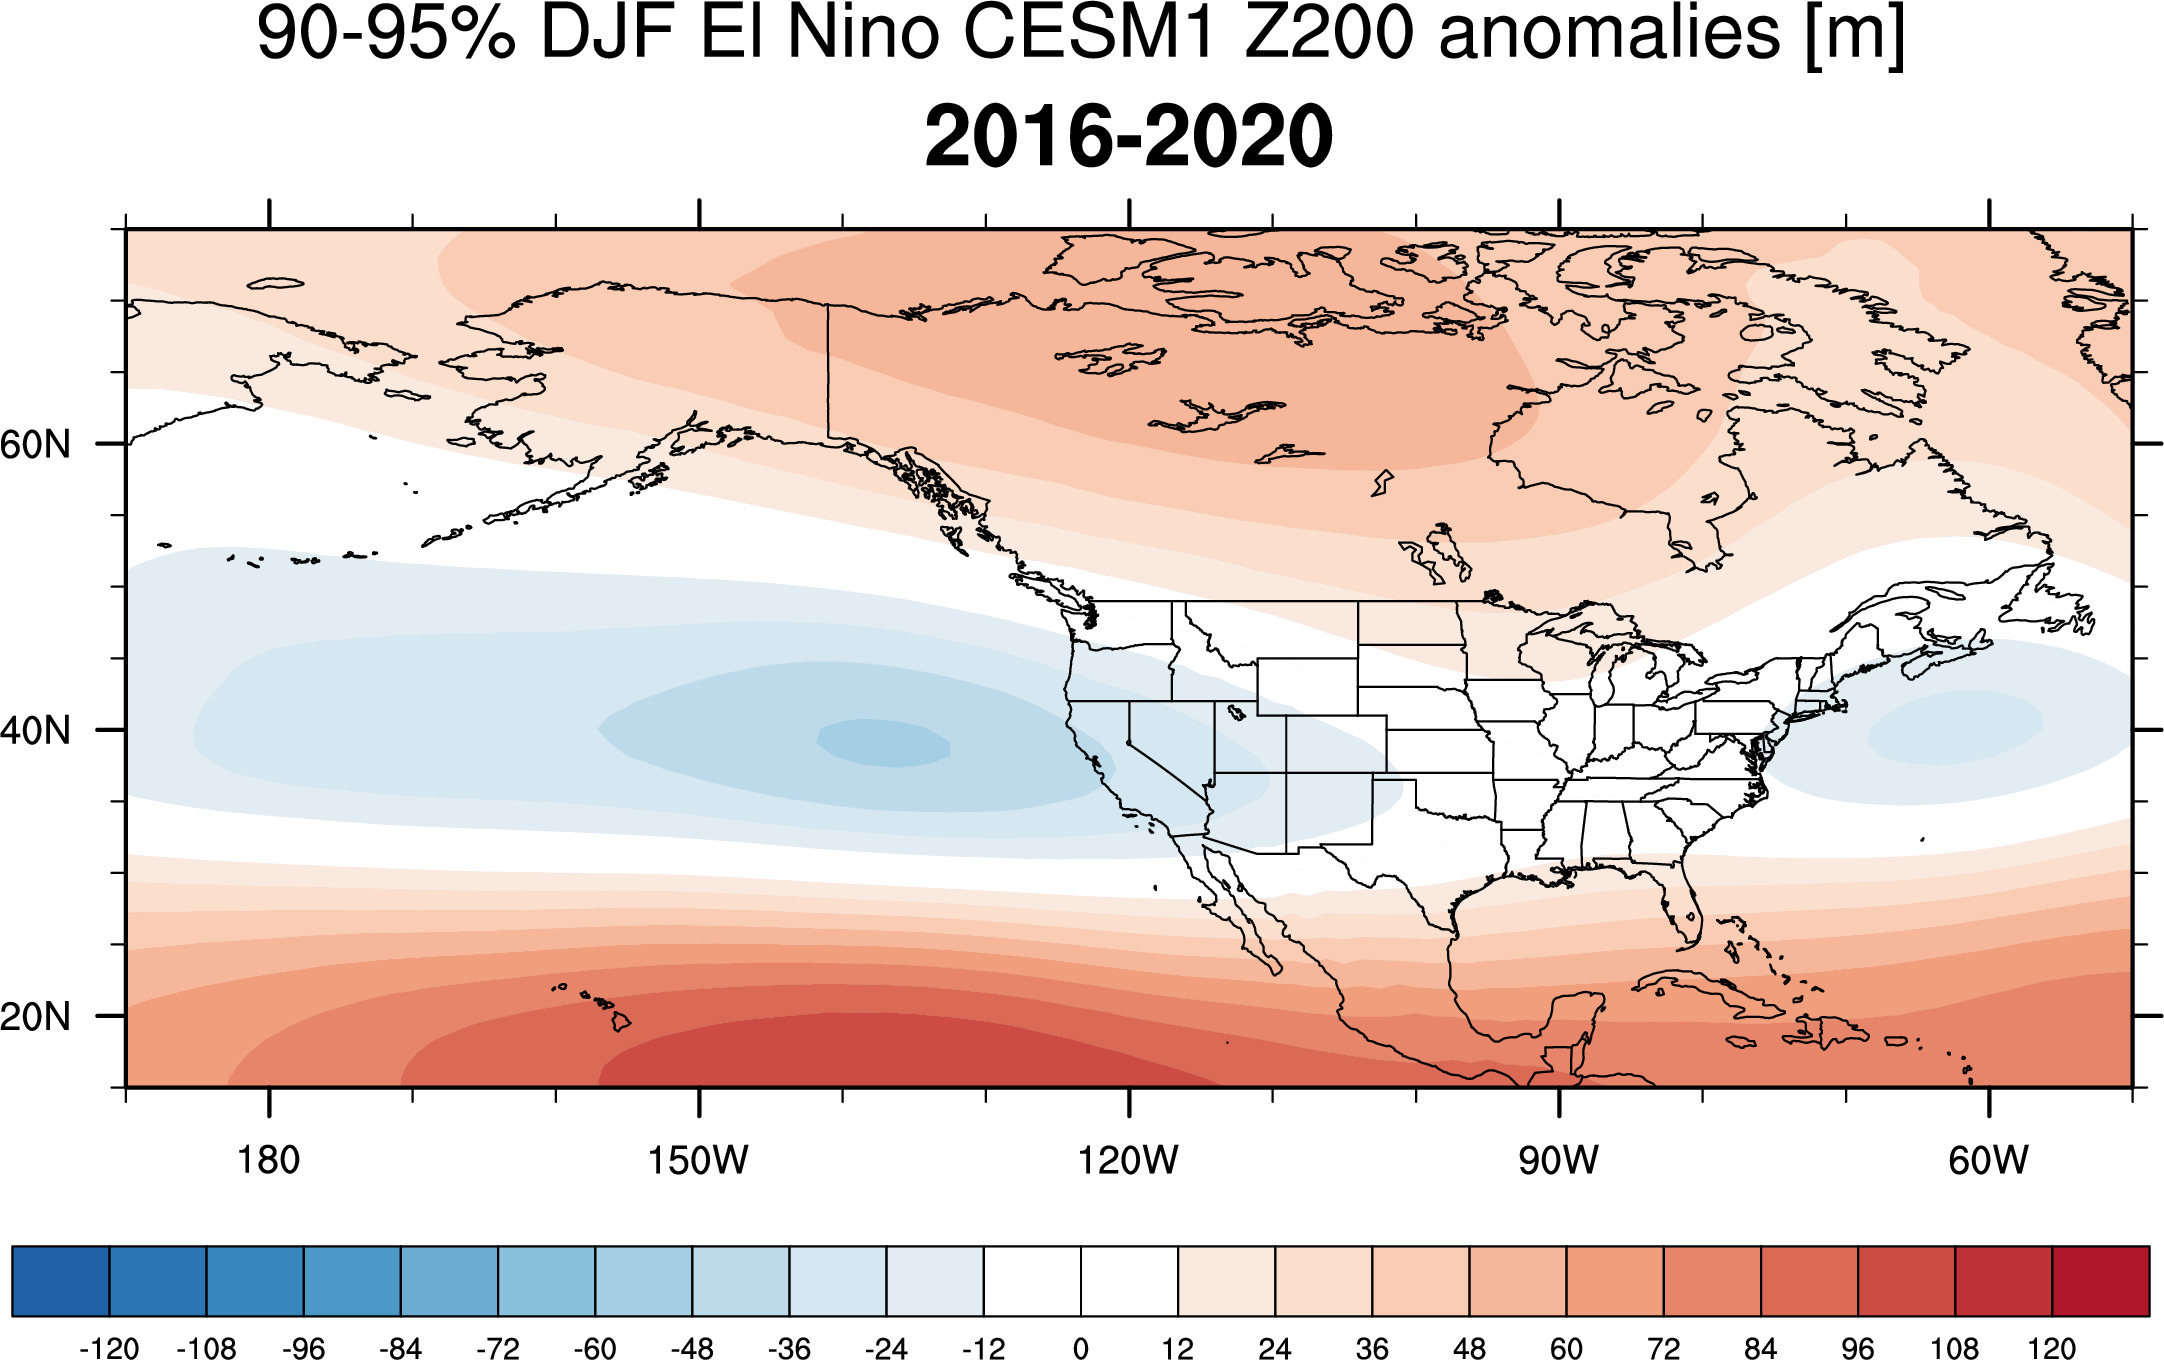
Differences
----------------------------------------------------------
strongest 10 (~95% +) DJF El Ninos for all periods
SST anomaly maps


Differences

Precipitation anomaly maps


Differences


200mb Height anomaly maps


Differences


-------------------------------------------------------------------------------------------------------------
Different ENSO regimes
ENSO Neutral
SST Anomaly Maps
Differences

Precipitation Anomaly Maps
Differences
200mb Height Anomaly Maps

Differences
---------------------------
All years
2020-2016 compared to 1981-1985


2020-2016 compared to 1921-1925


---------------------------------
Without 10 strongest El Ninos 2020-2016 compared to 1981-1985


----------------------------------
Without 10 strongest El Ninos or 10 strongest La Ninas 2020-2016 compared to 1981-1985