Lesley L. Smith – Model Diagnostics
All plots preliminary.
Model Evaluation, Analysis, Diagnostics
Seasonal to Subseasonal Experiments
NOAA Unified Forecast System (UFS) High Resolution Experiments
Right-click to see bigger images.
UFS_HR1 data
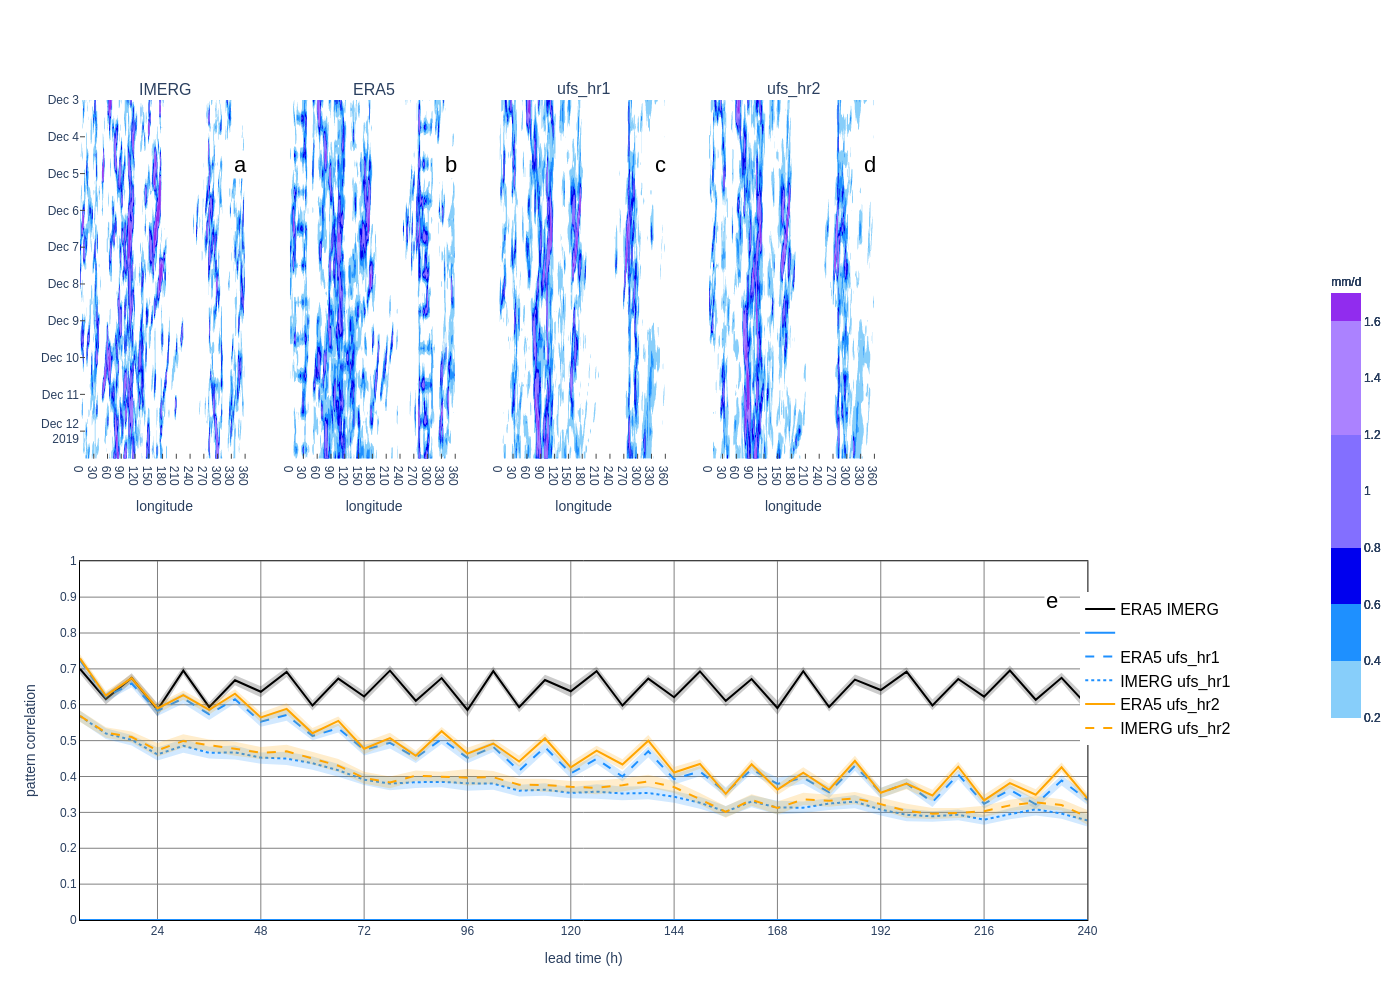
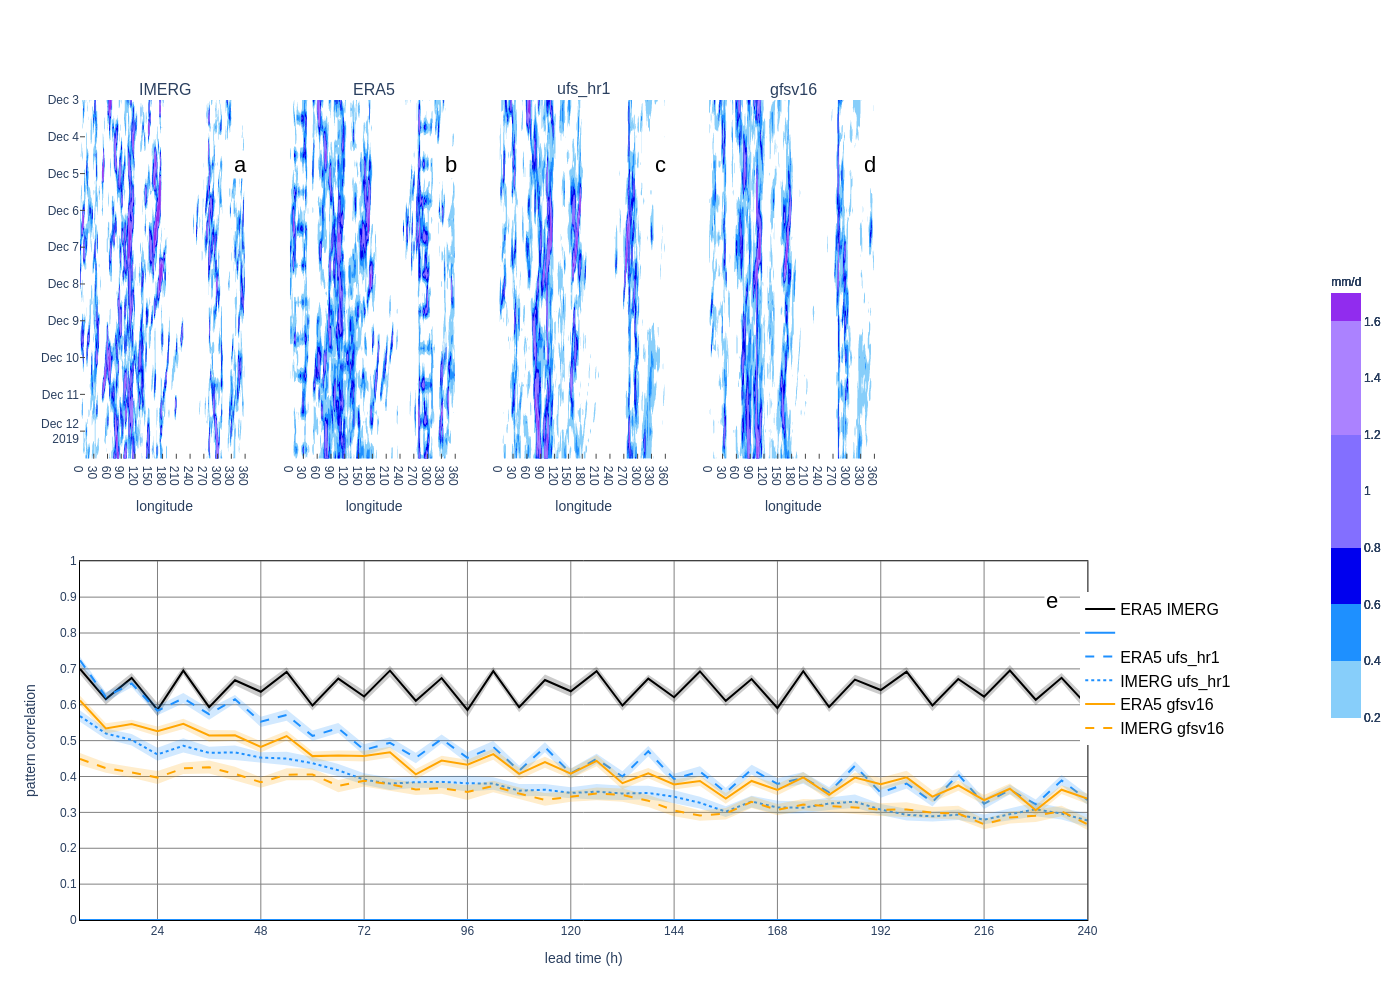
Hovmoeller and pattern correlation on precipitation data
Sample cases Winter 2019 and Summer 2020 UFS_HR1 data compared to ERA5 and IMERG data for different lead times:
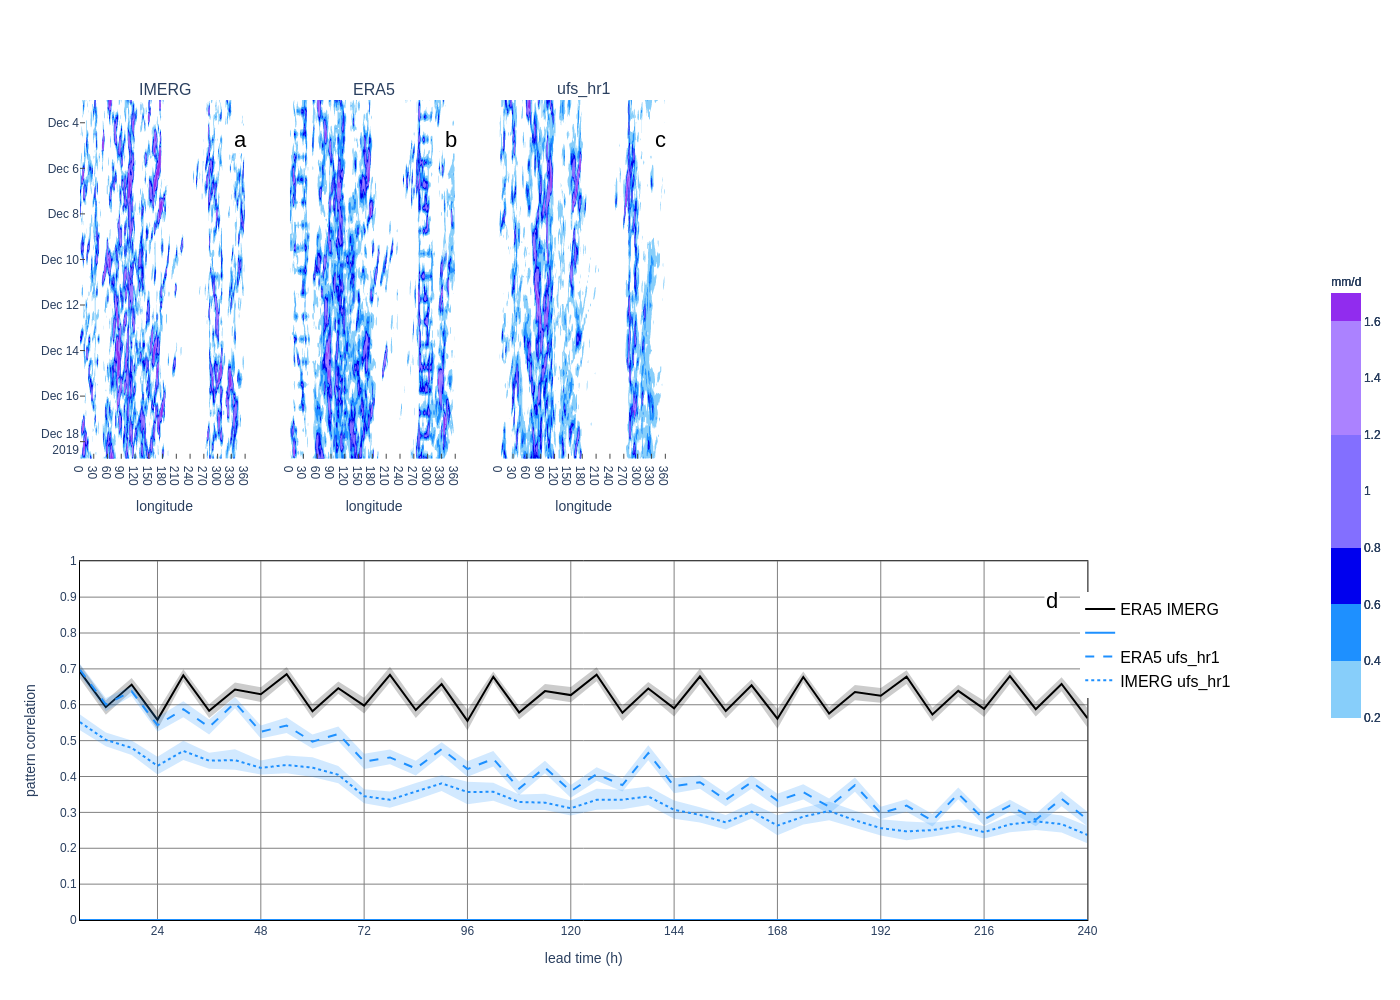
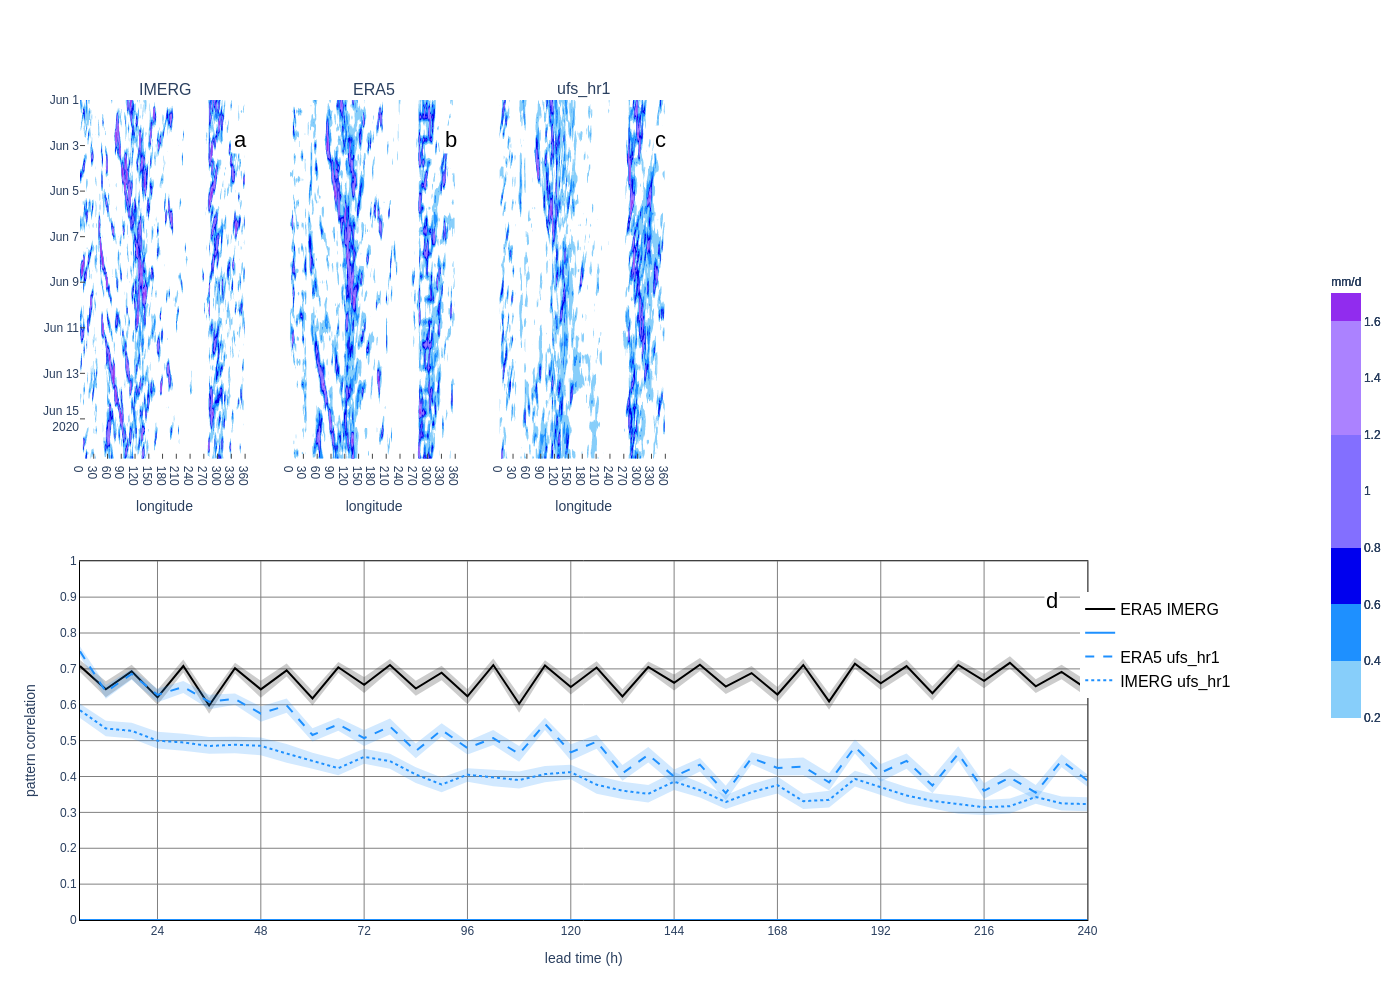
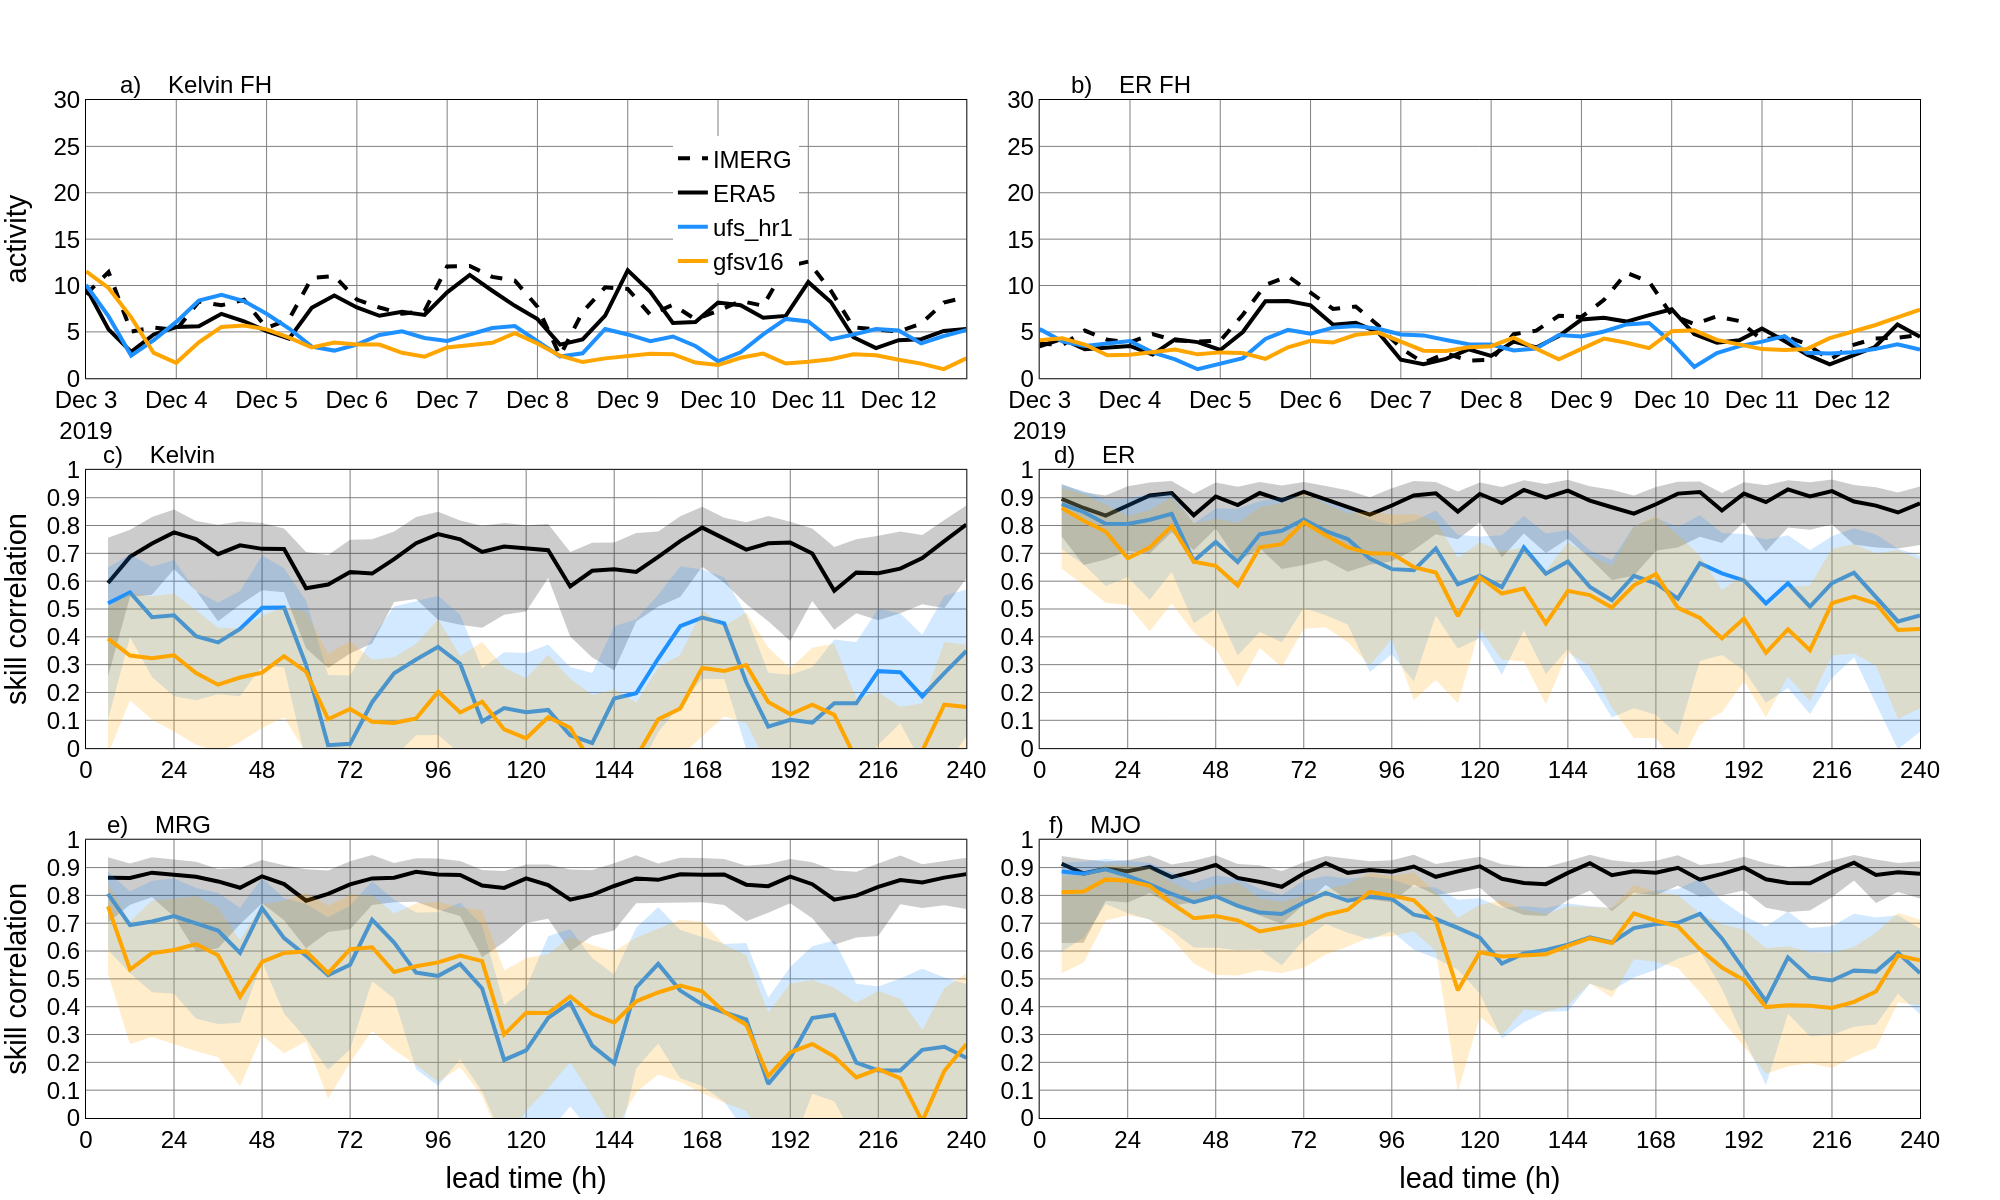
All the UFS_HR1 data analyzed together with gfsv16 data:
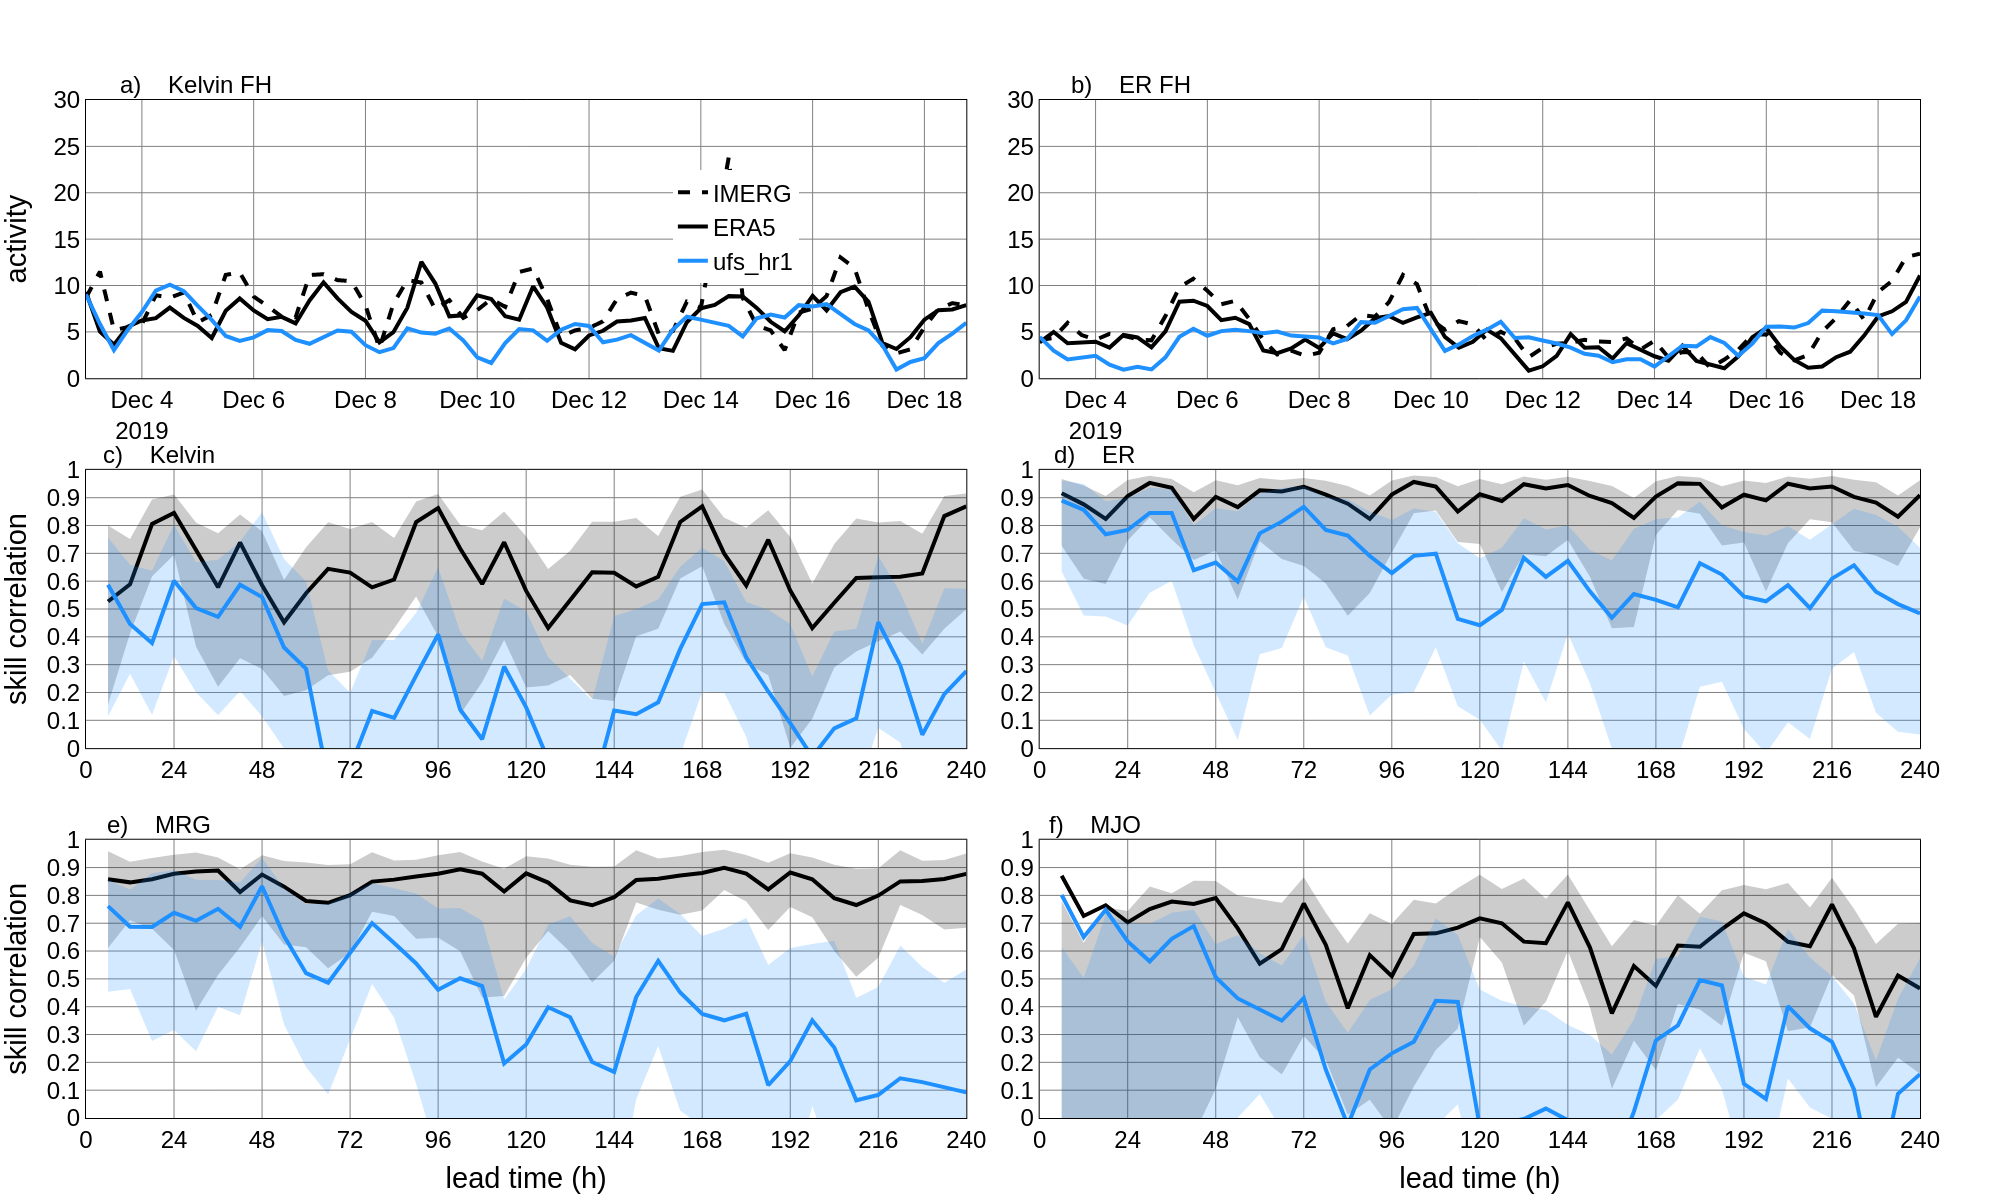
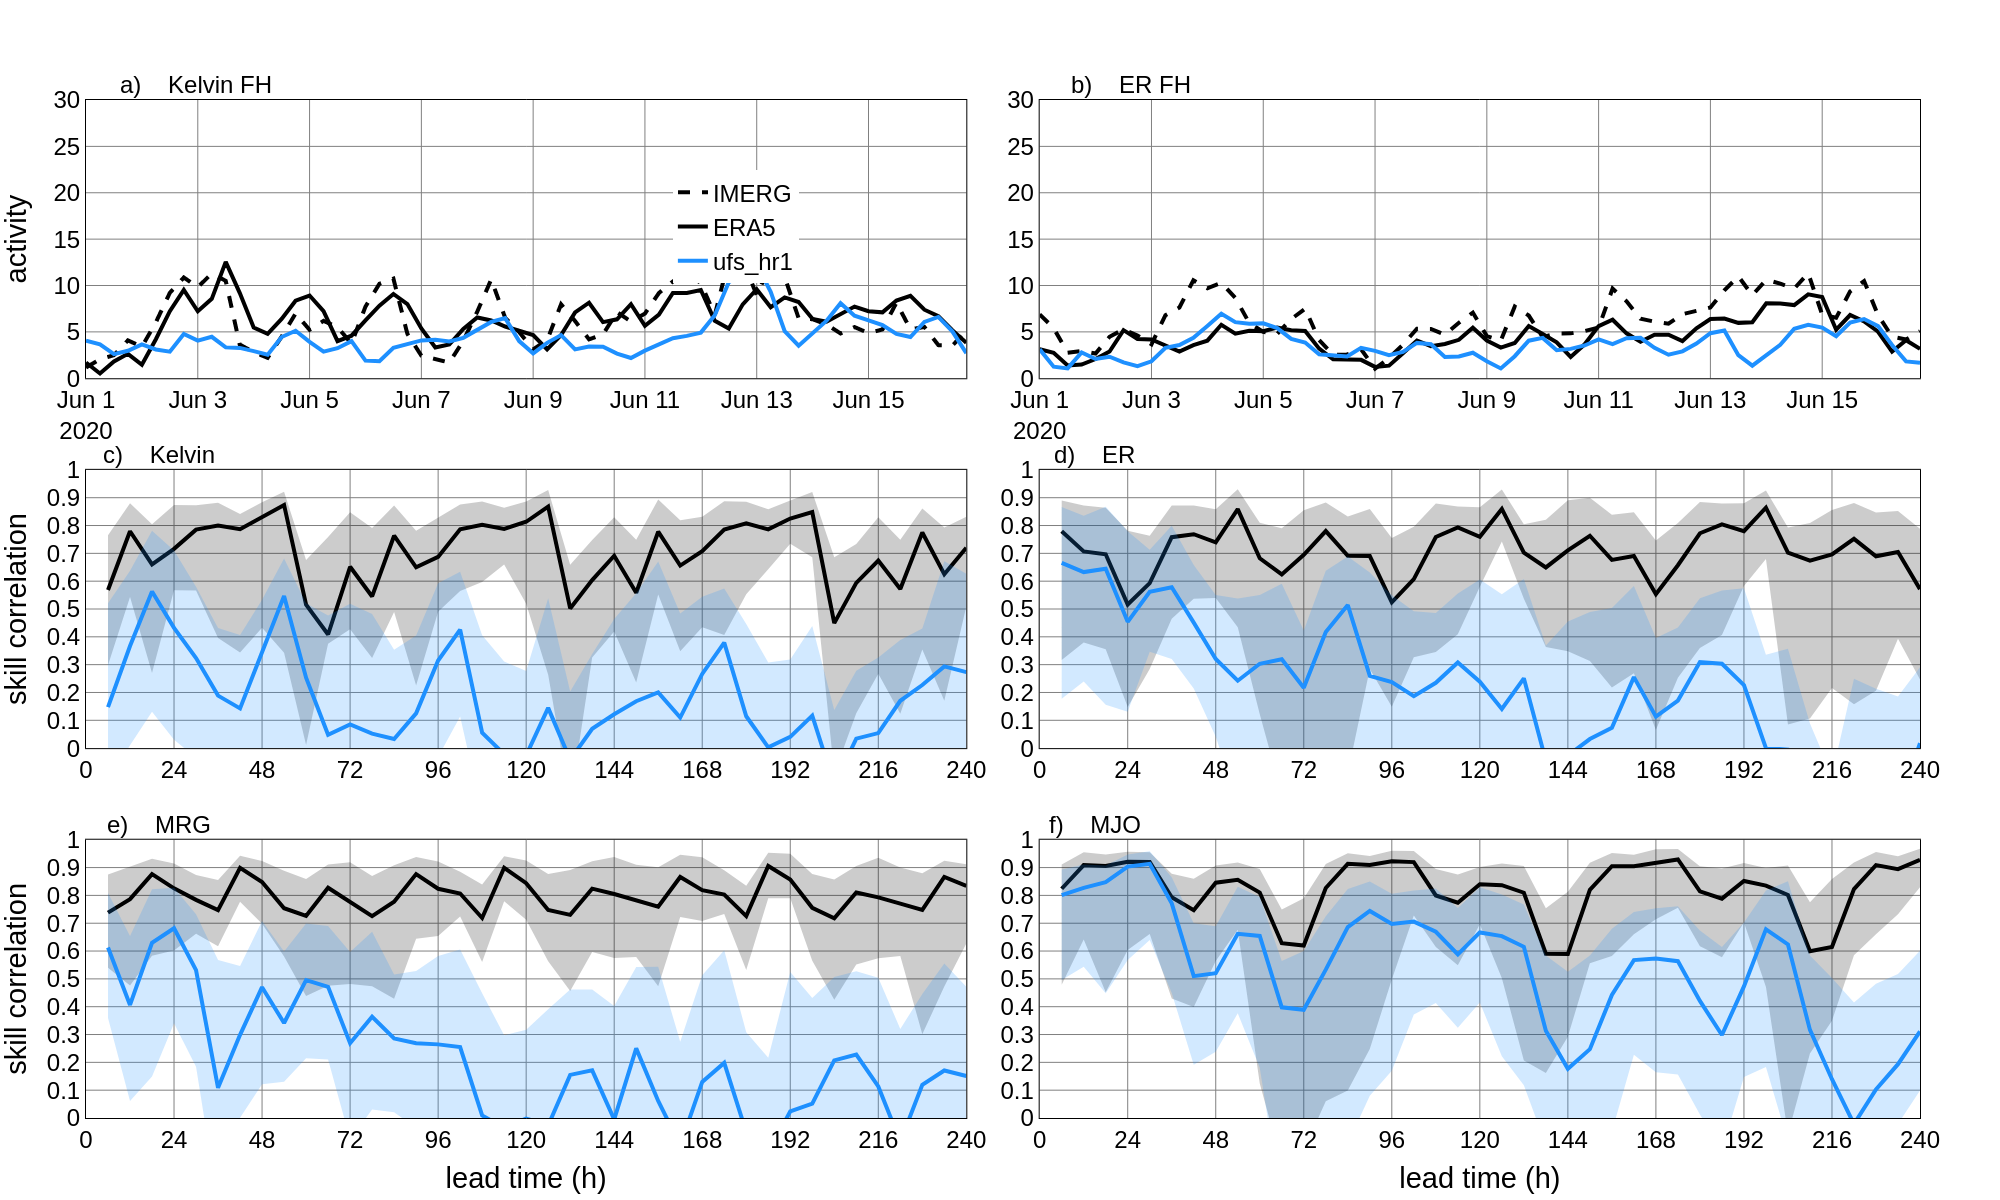
Convectively Coupled Equatorial Wave Skill Scores on precipitation data
Sample cases Winter 2019 and Summer 2020 UFS_HR1 data compared to ERA5 and IMERG data for different lead times:
All the UFS_HR1 data analyzed together with gfsv16 data:
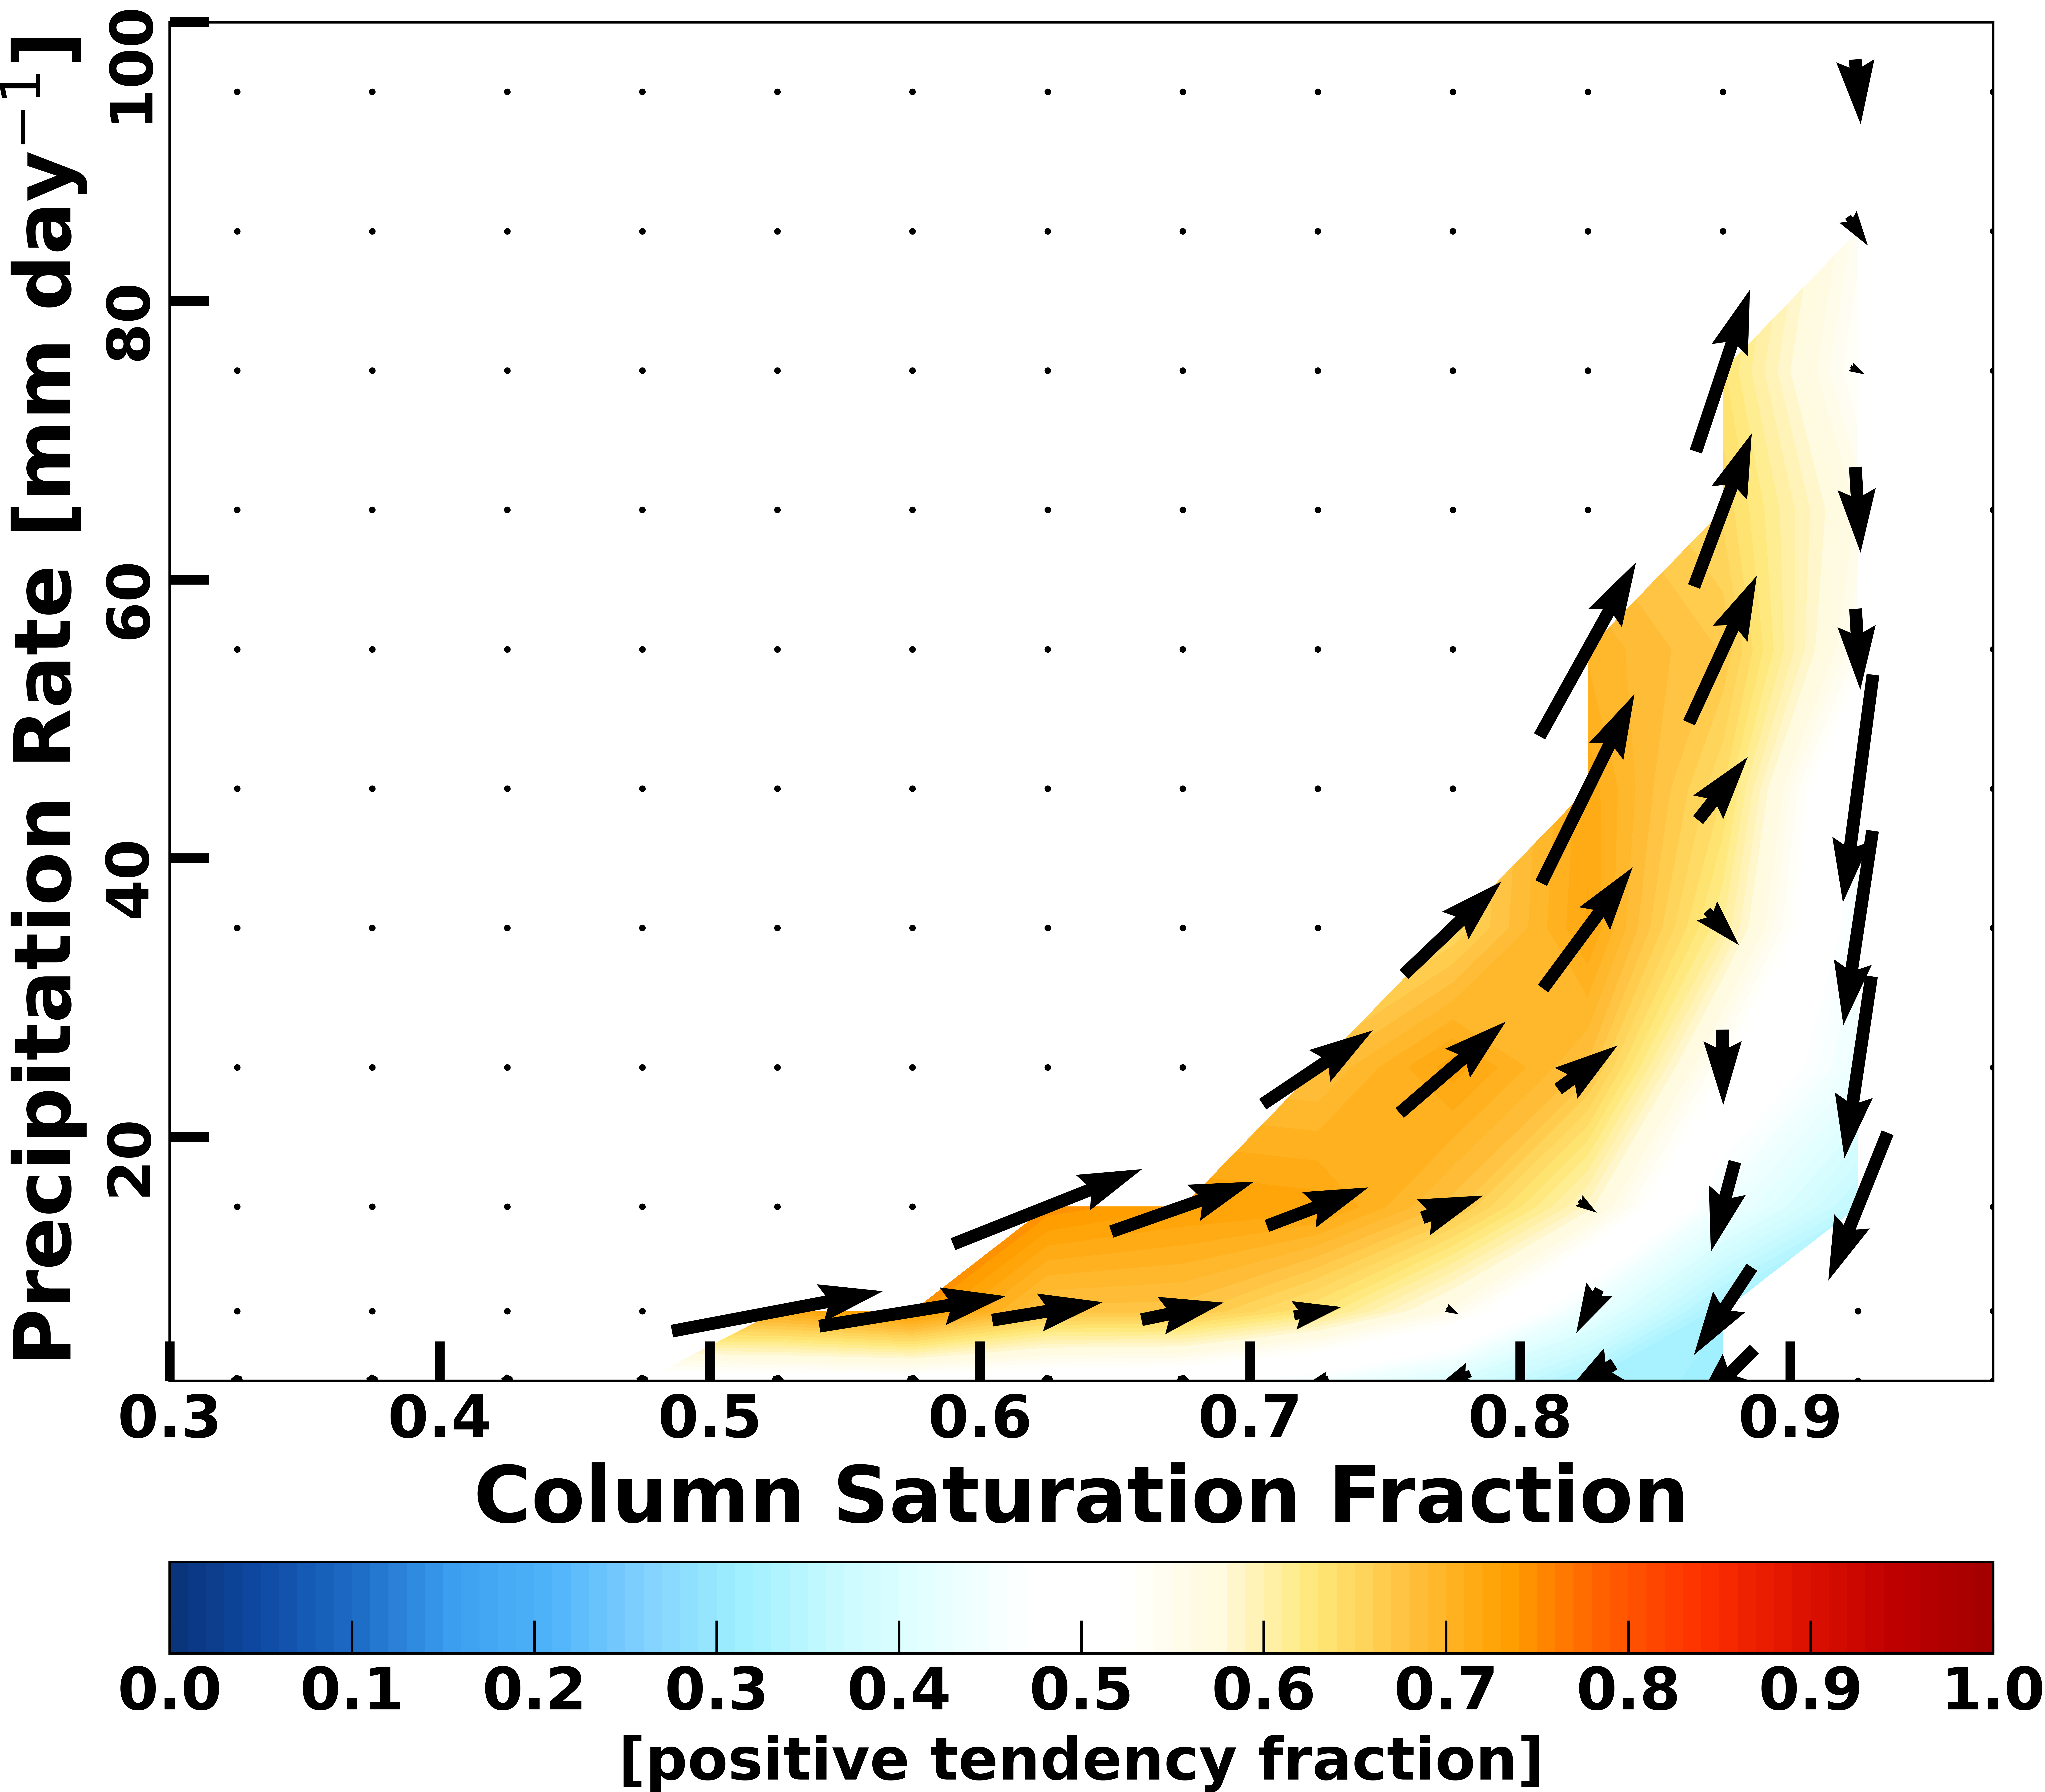
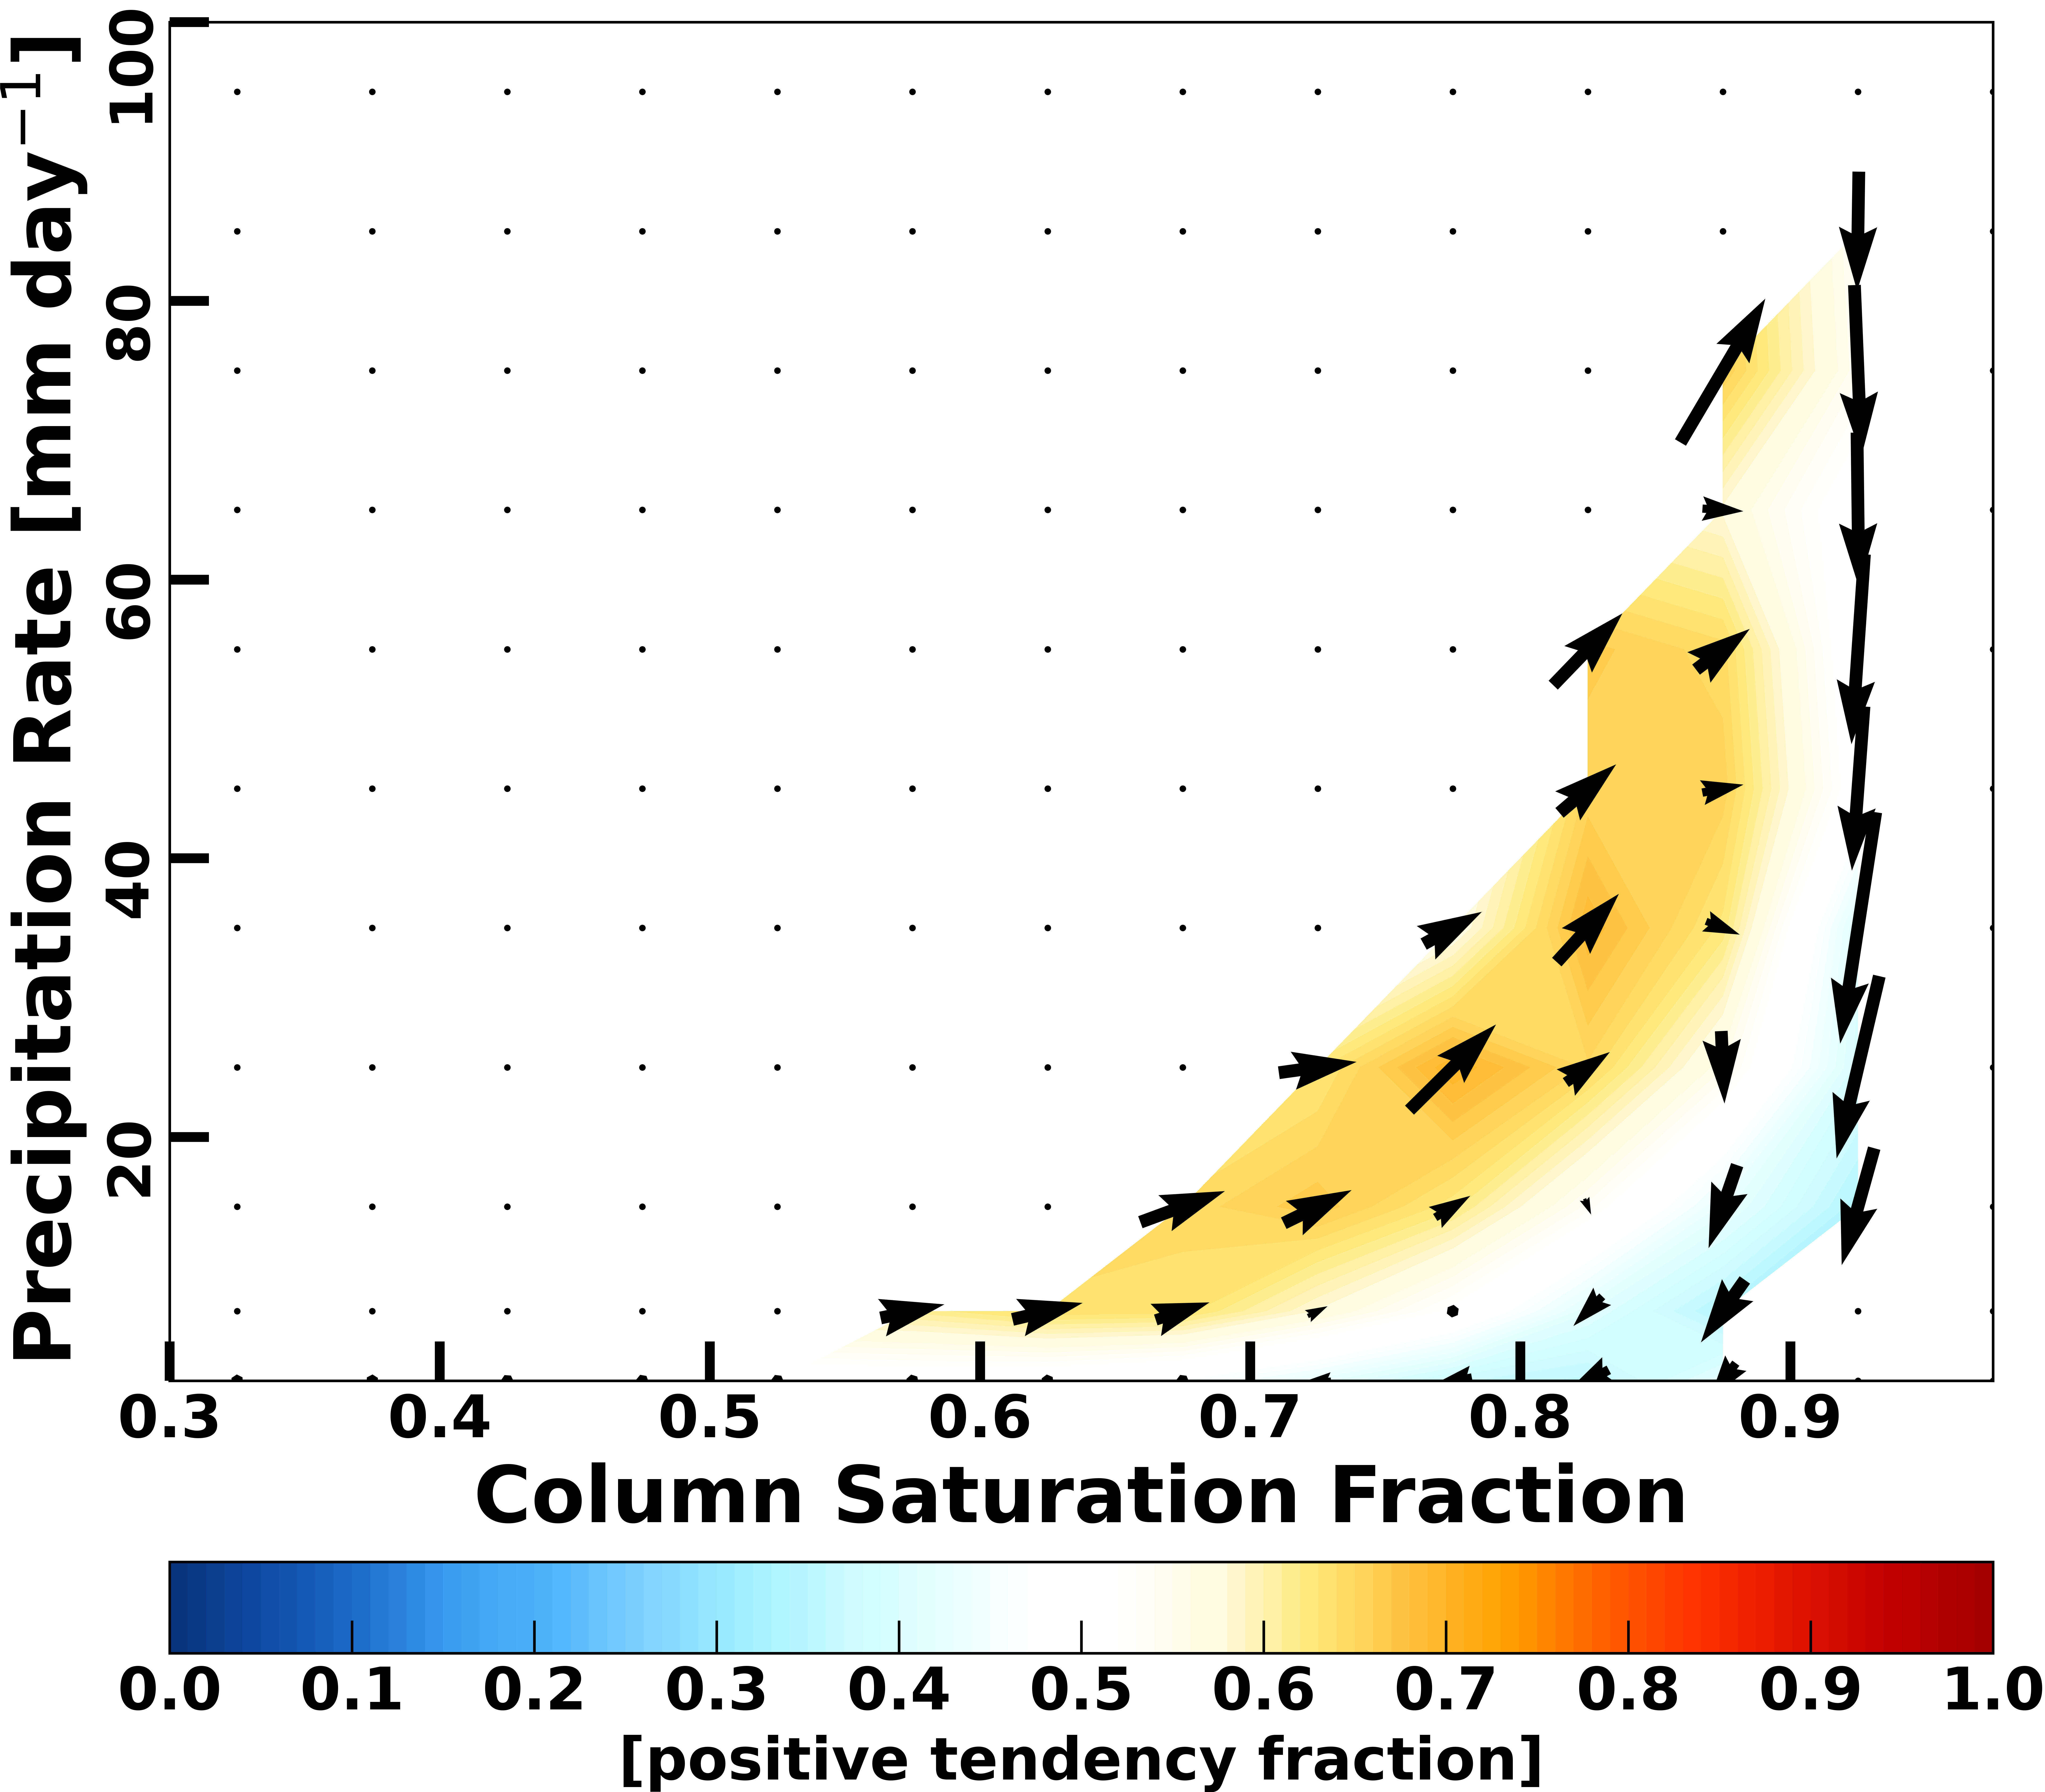
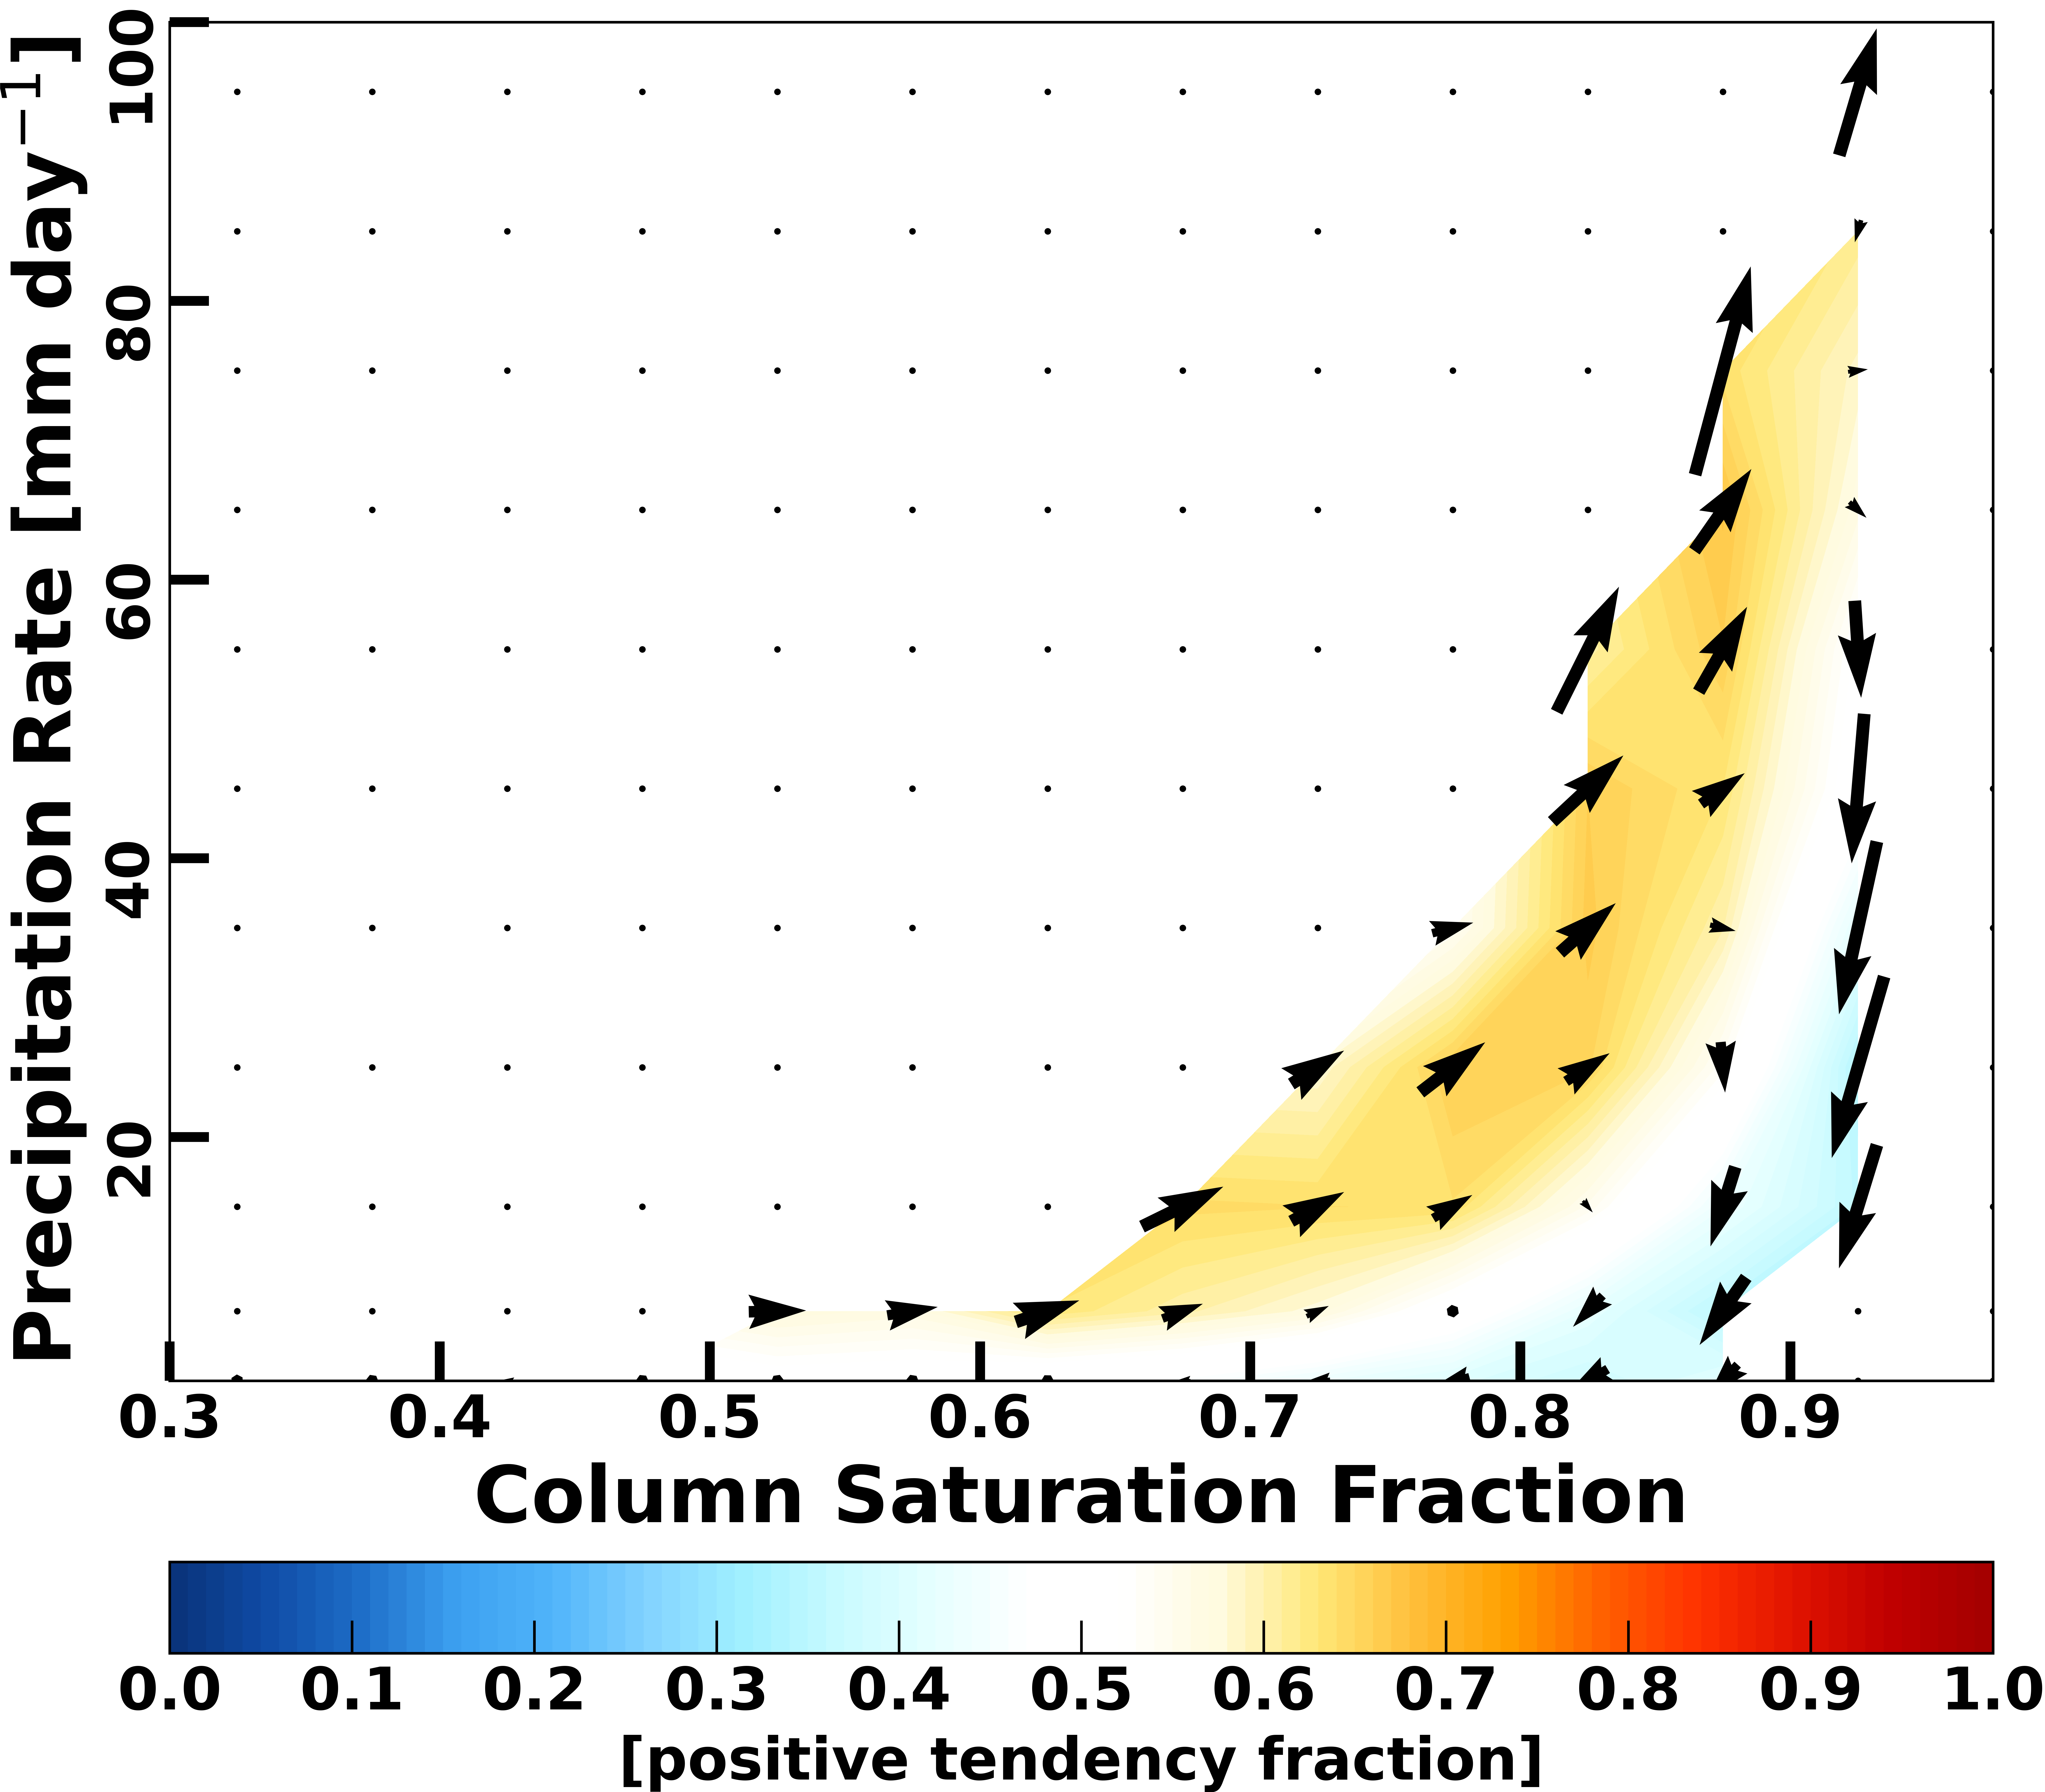
Precipitation and Column Saturation Fraction Coevolution from precipitation, temperature and specific humidity data
Sample cases Winter (December 3, 2019), left, and Summer (June 1, 2020), right, UFS_HR1 data for lead time 12 hours
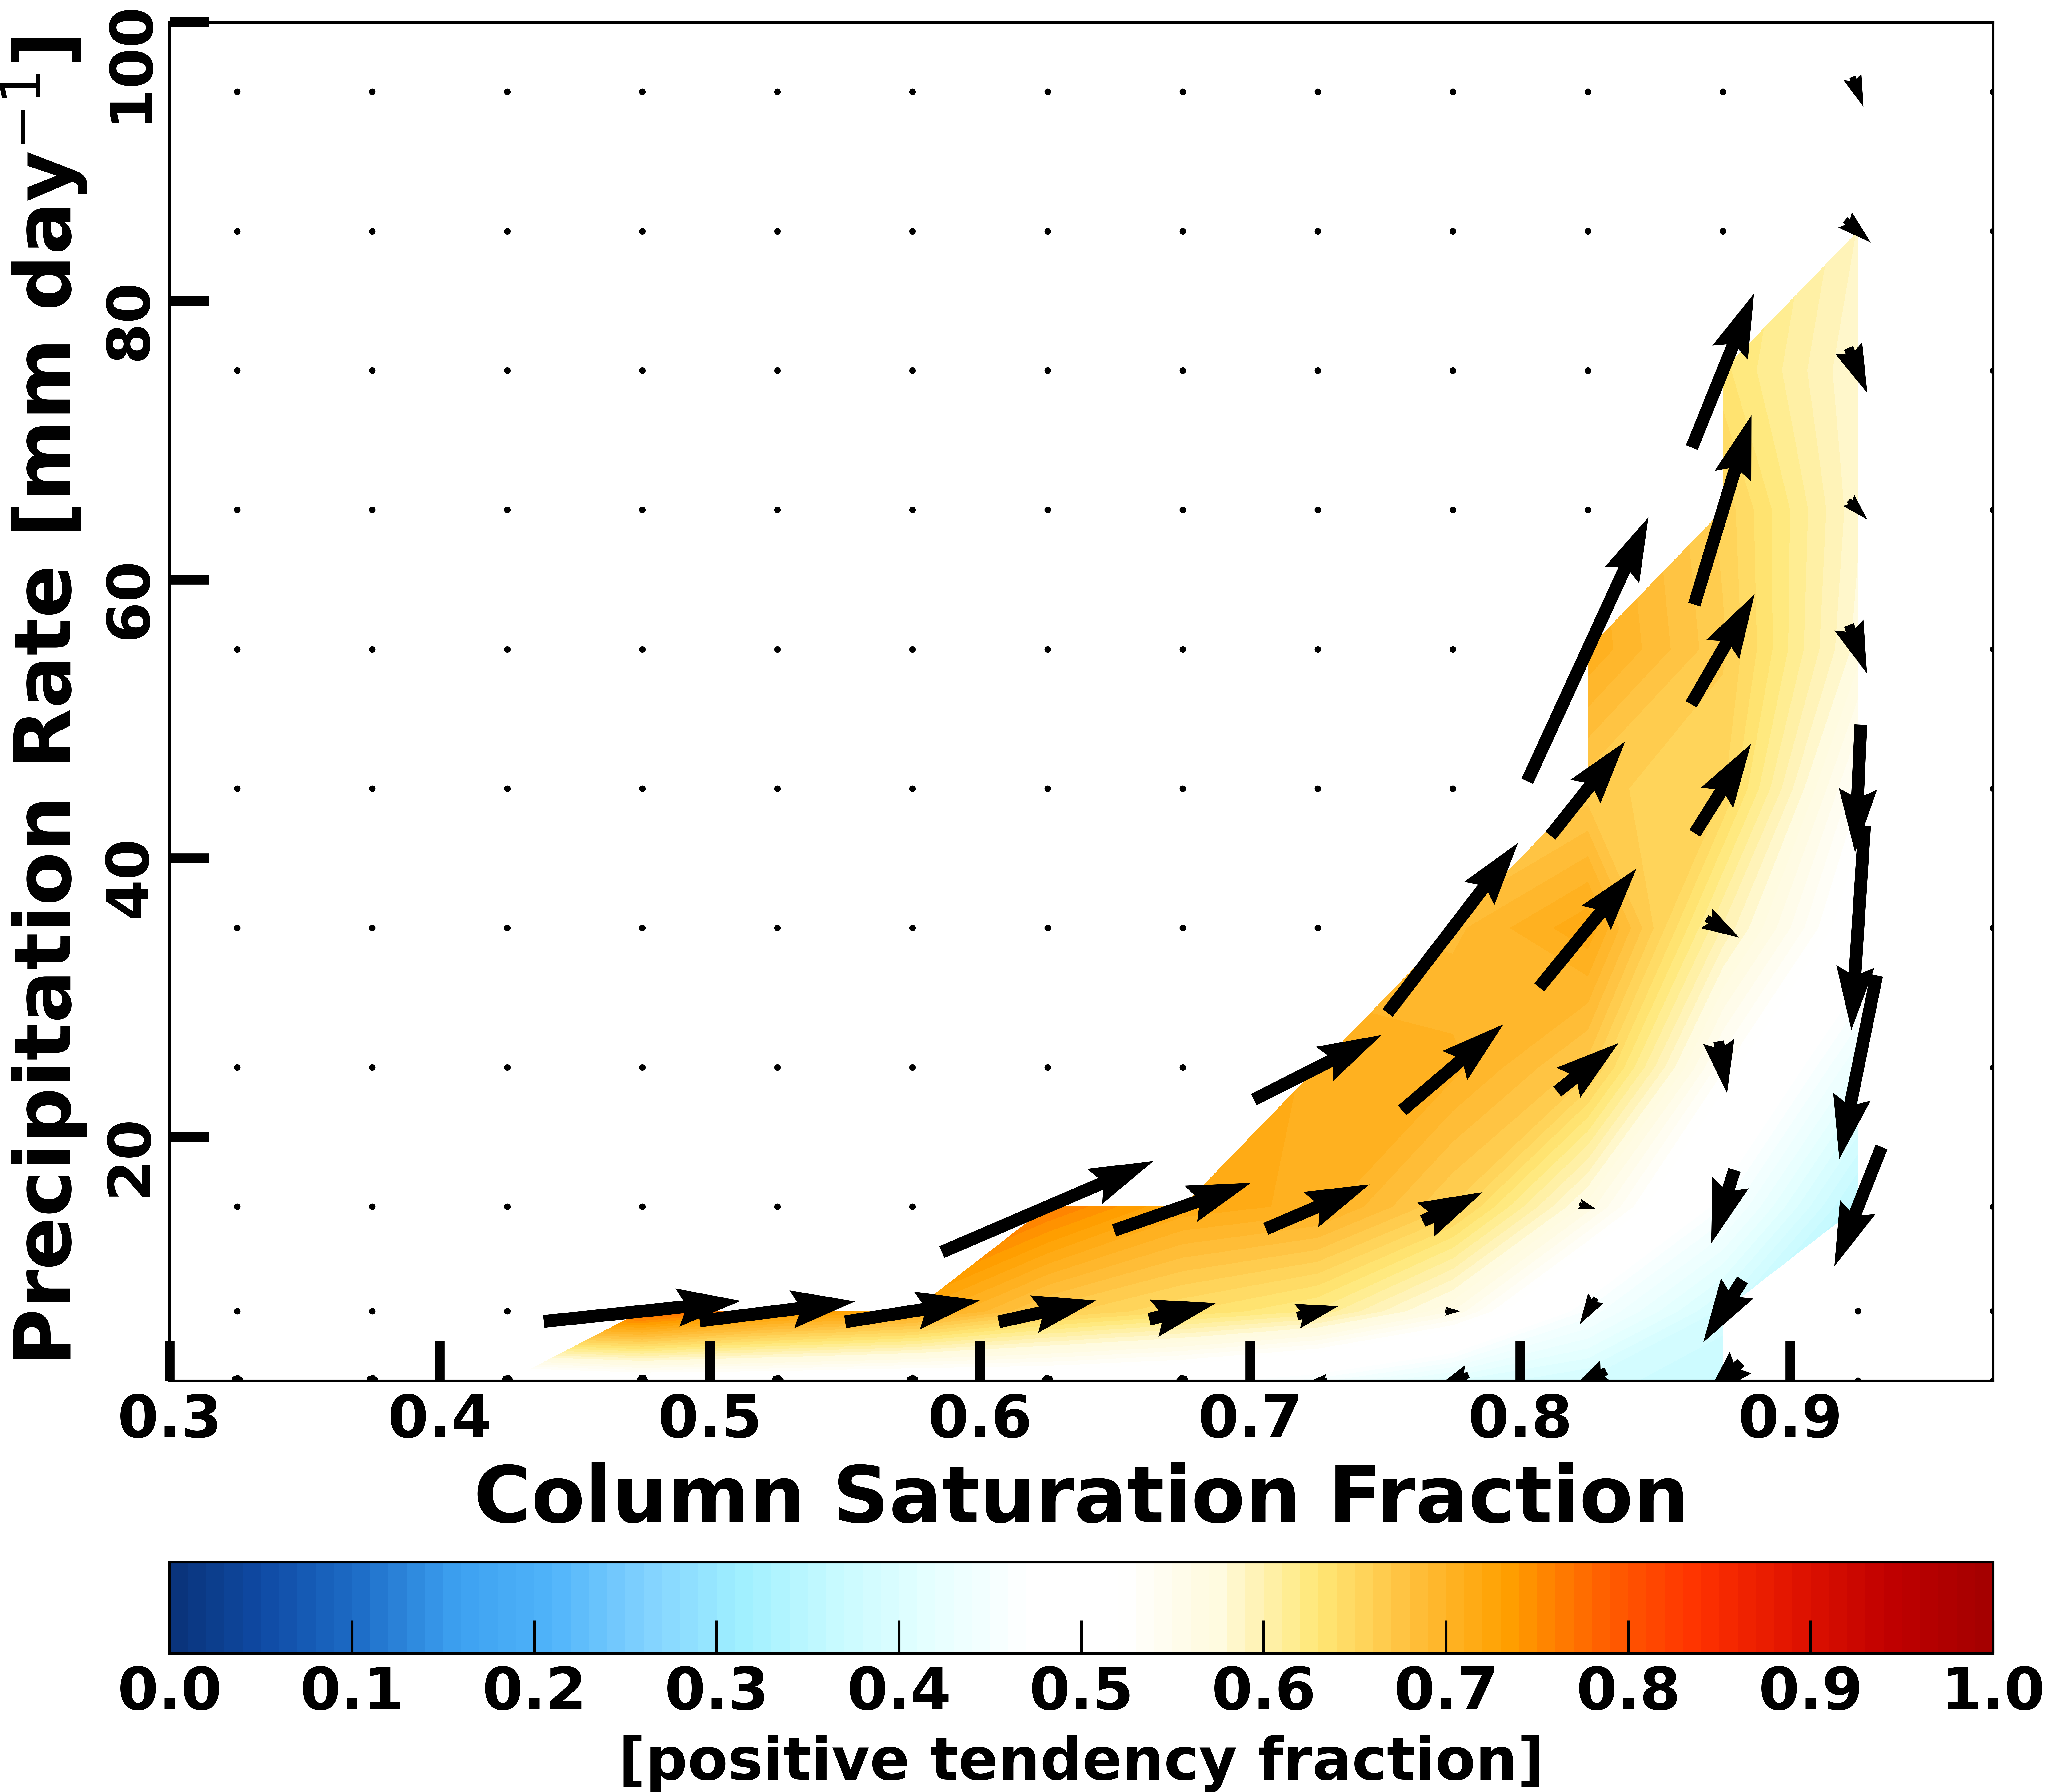
Sample cases Winter (December 3, 2019), left, and Summer (June 1, 2020), right, UFS_HR1 data for lead time 24 hours
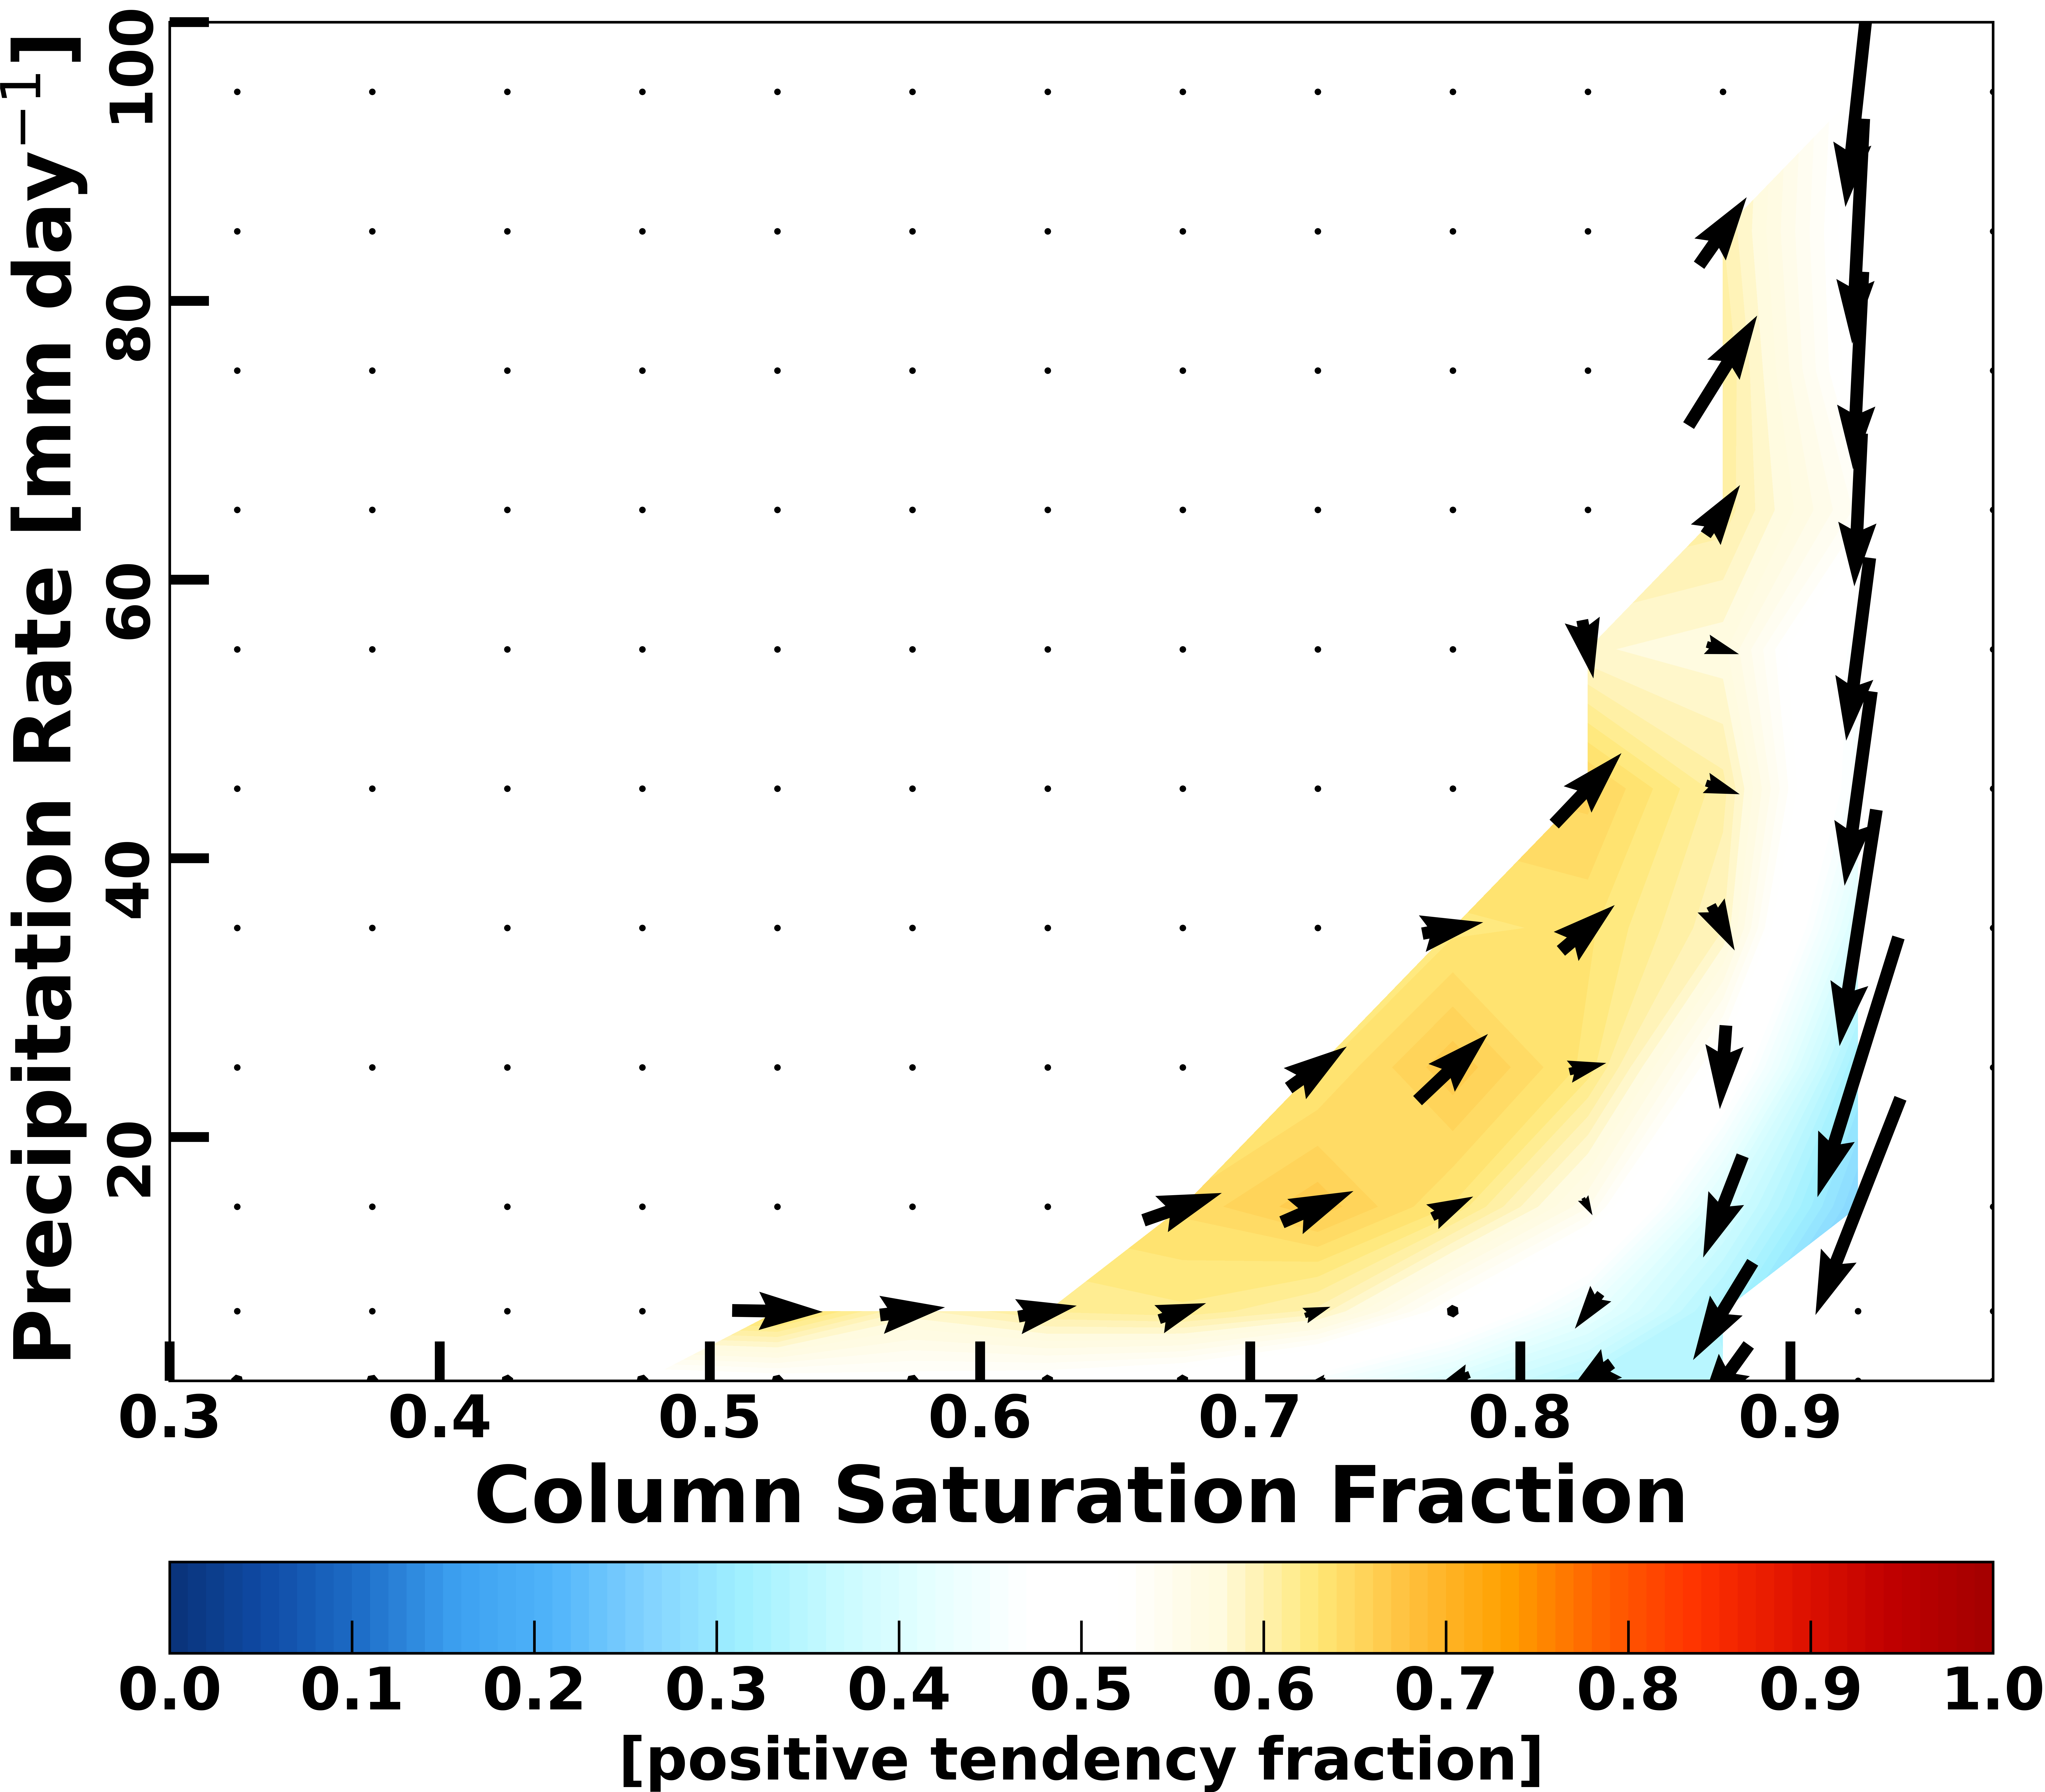
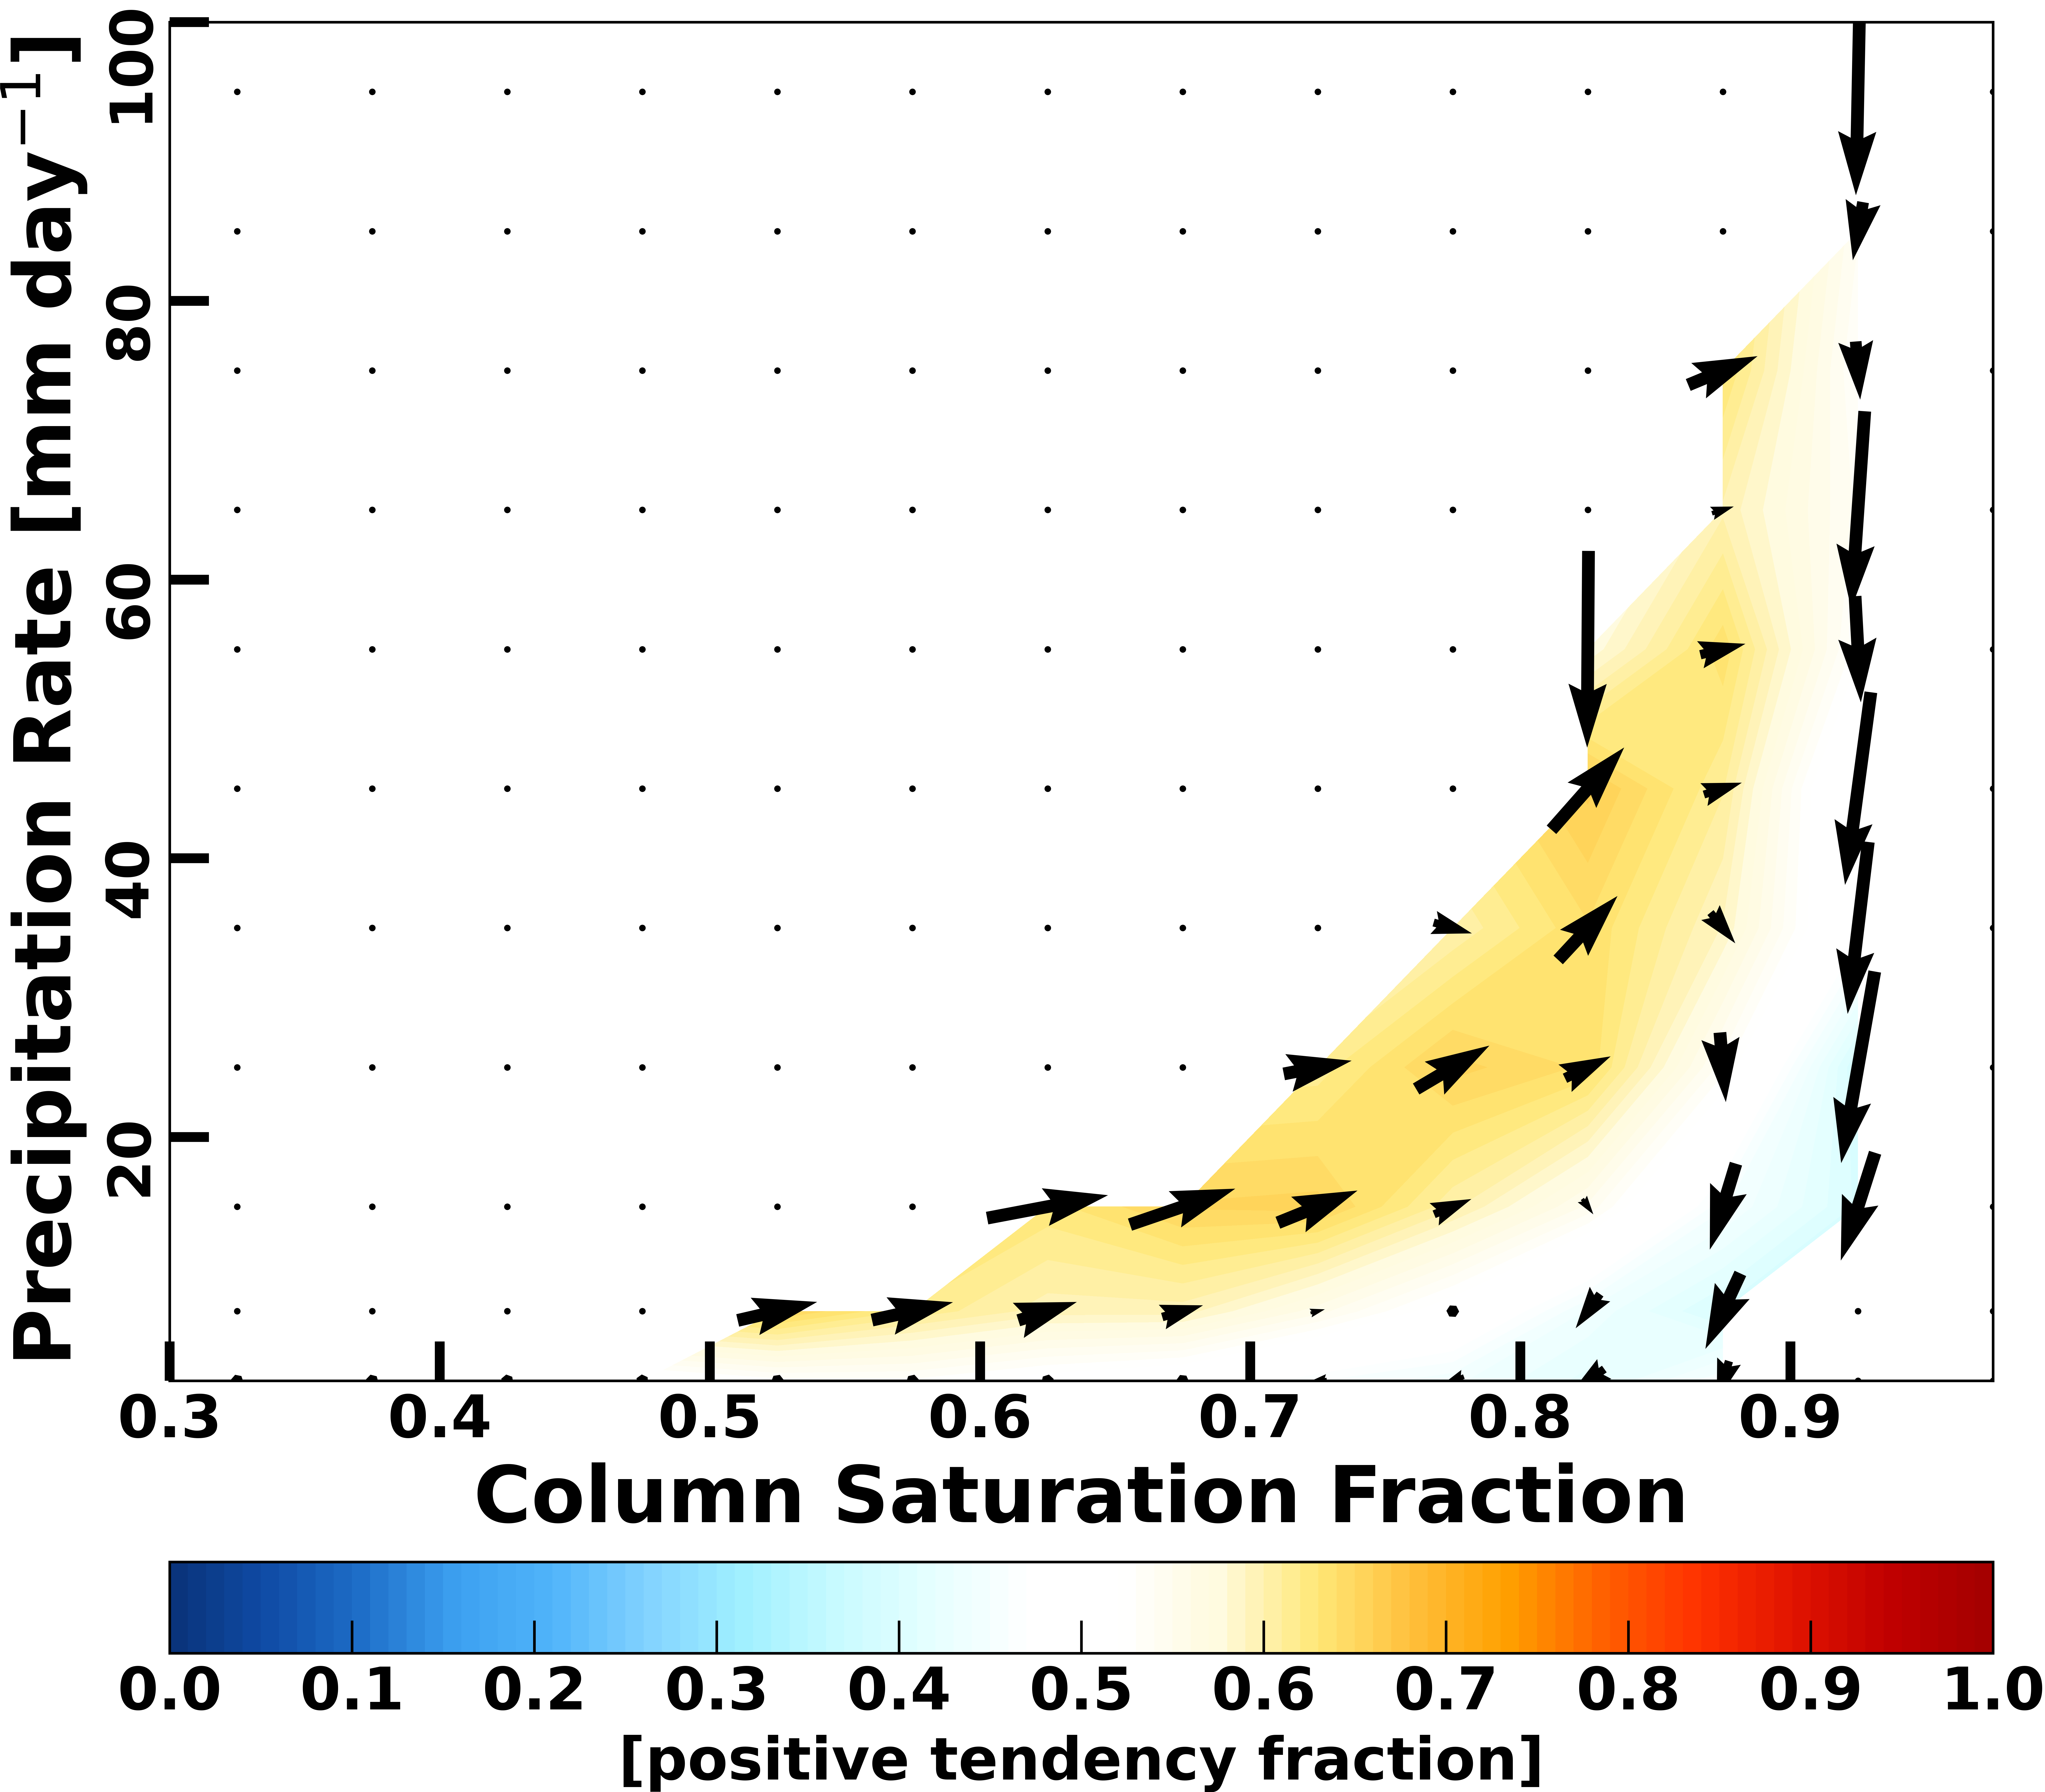
Sample cases Winter (December 3, 2019), left, and Summer (June 1, 2020), right, UFS_HR1 data for lead time 48 hours
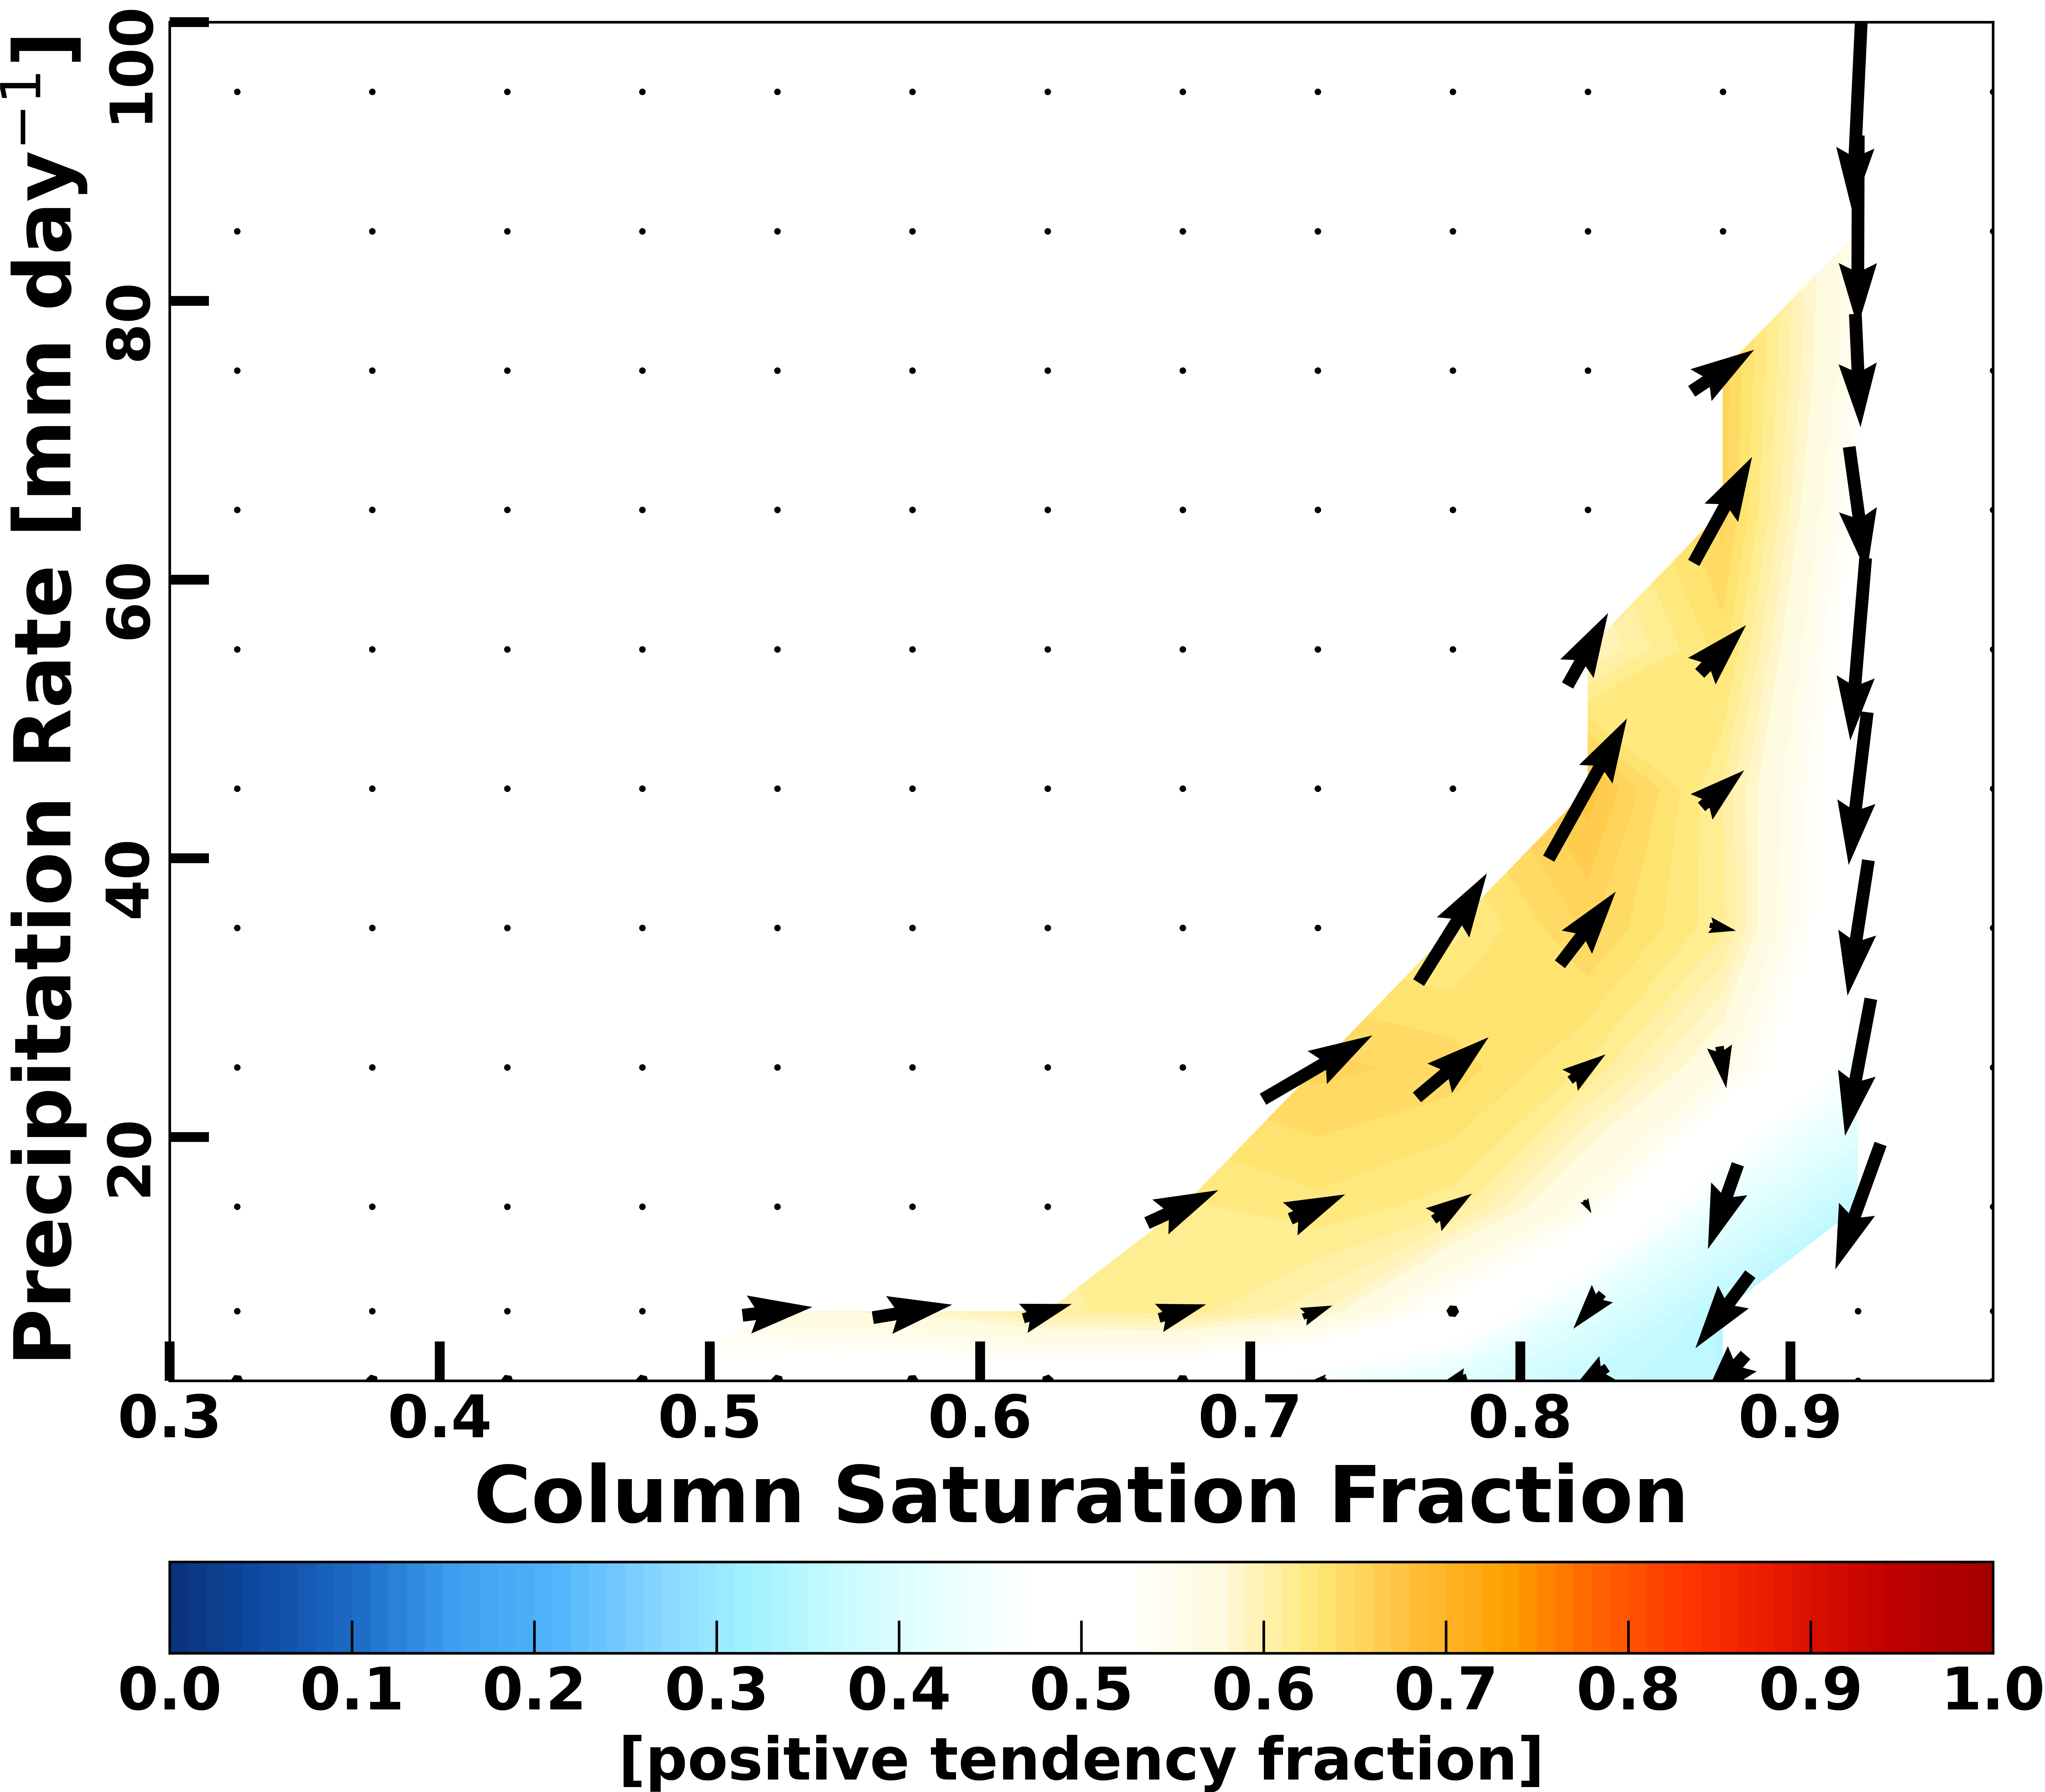
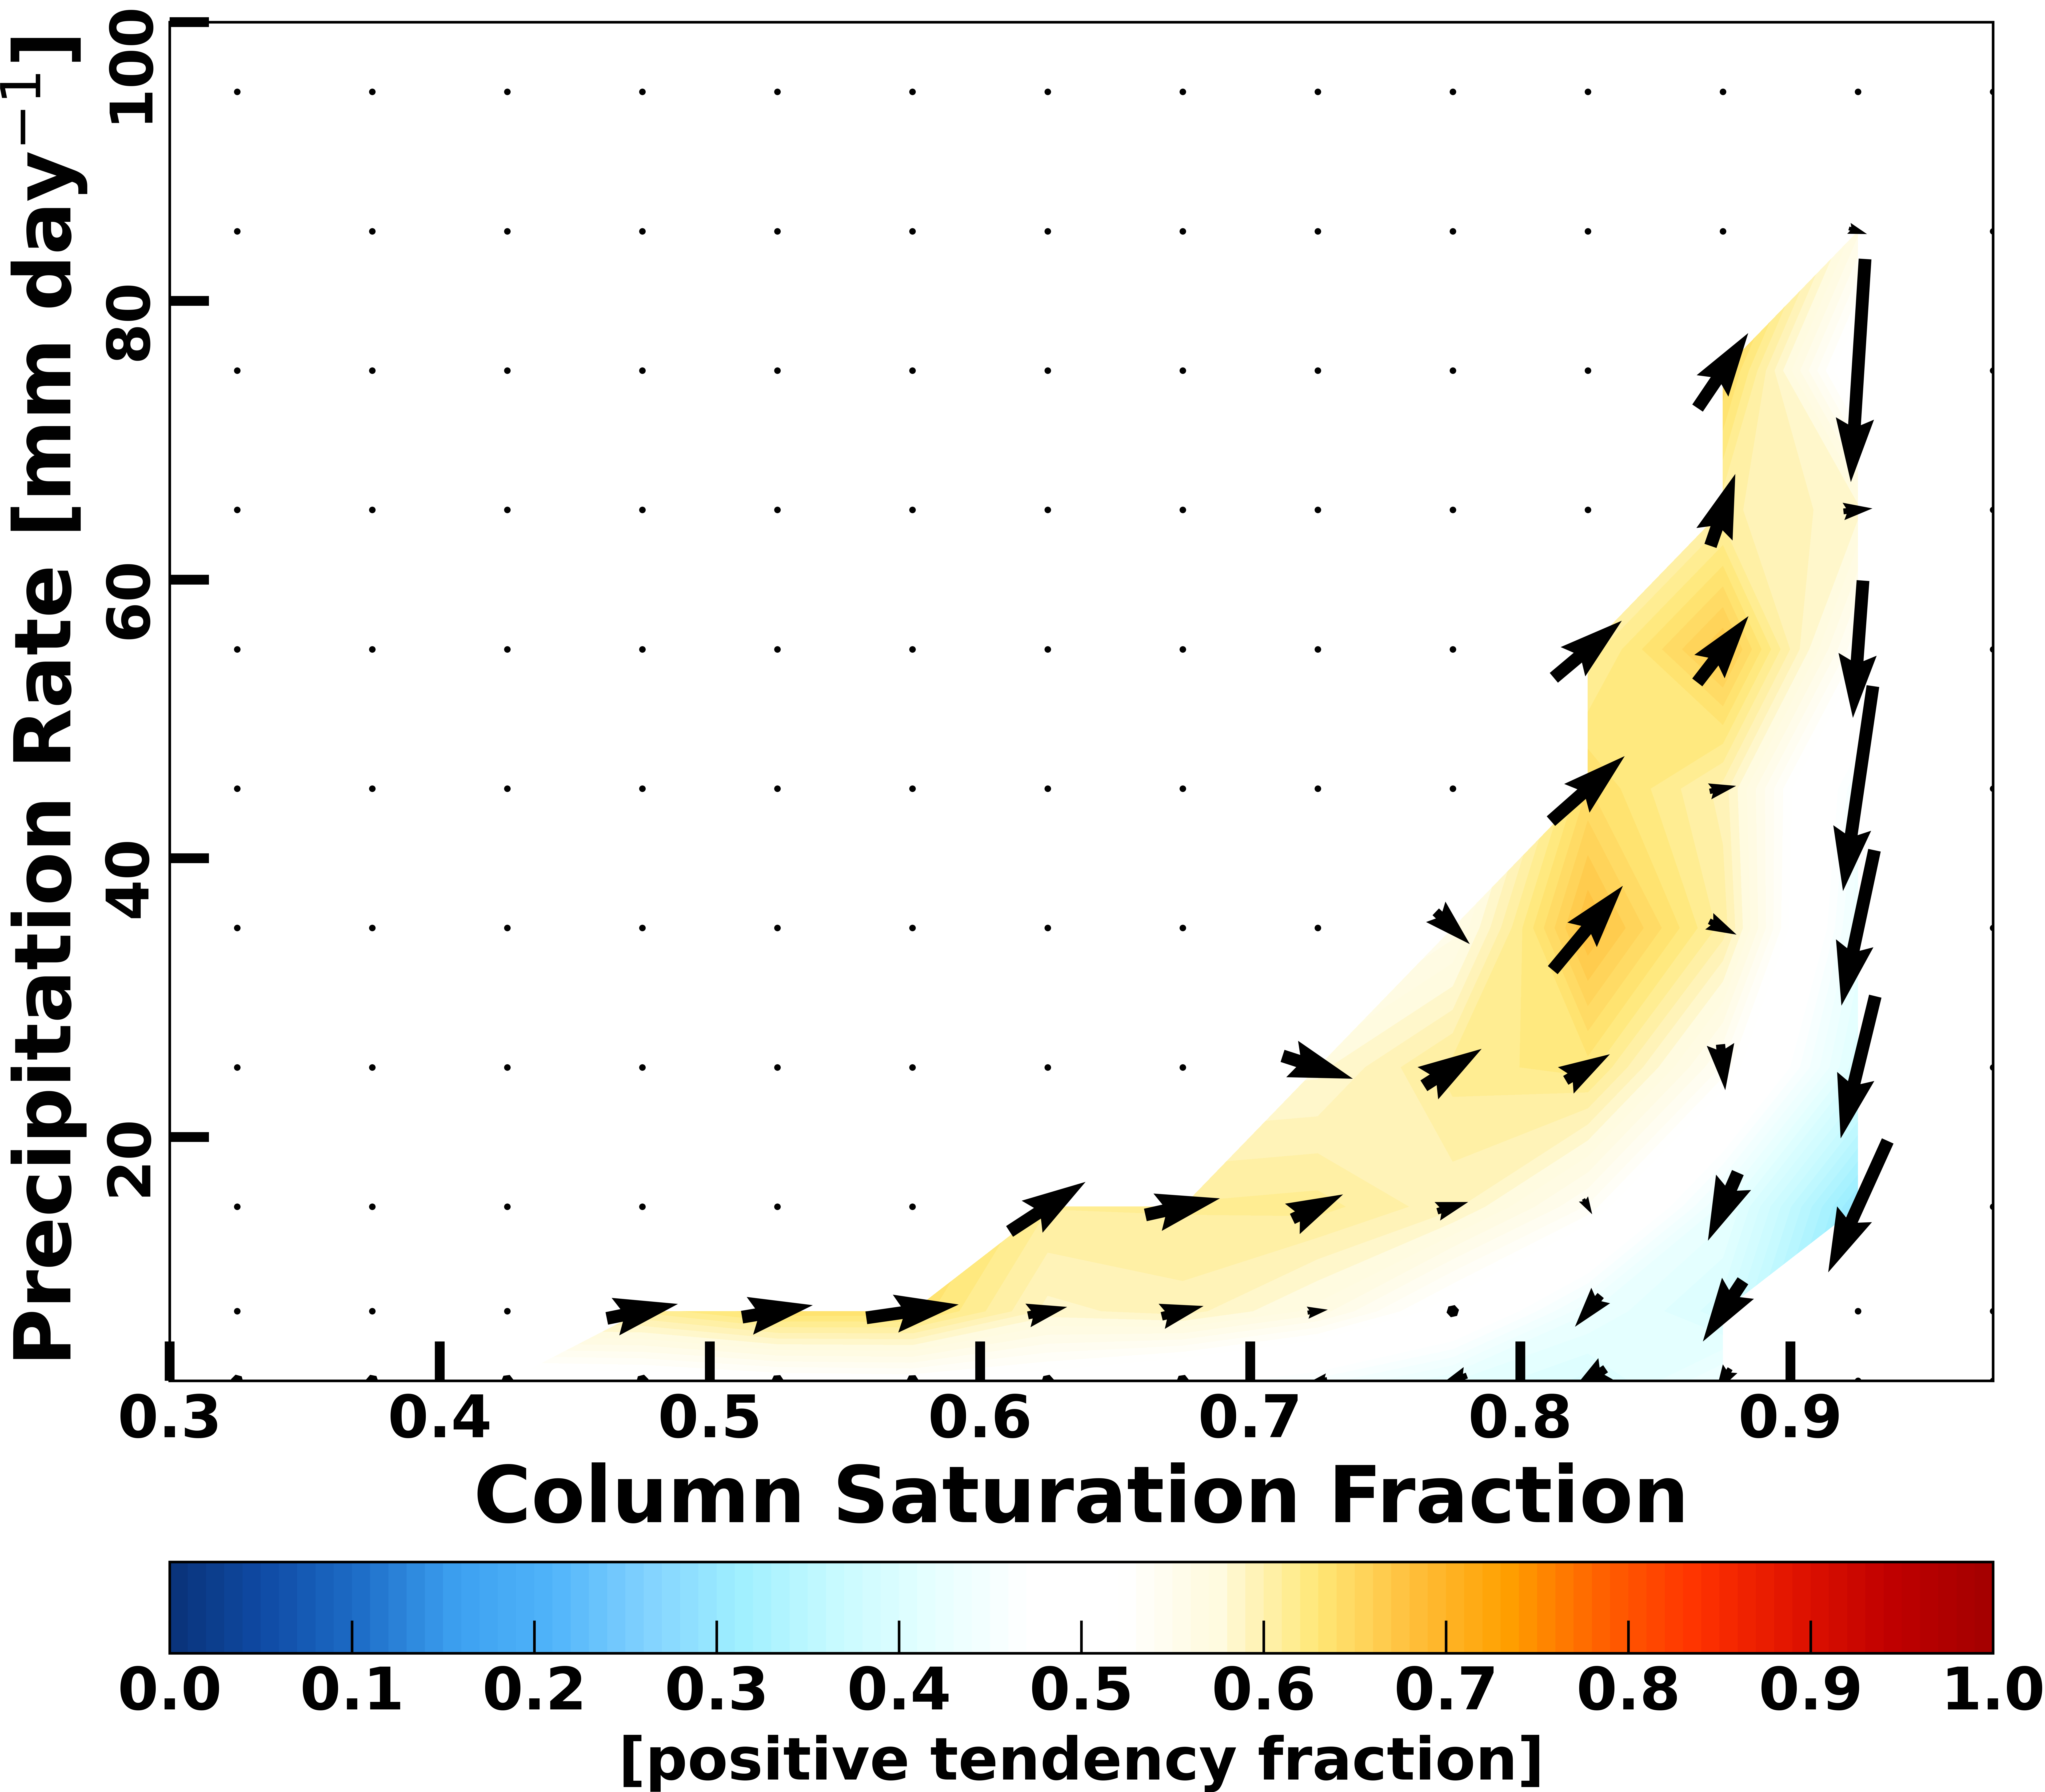
Sample cases Winter (December 3, 2019), left, and Summer (June 1, 2020), right, UFS_HR1 data for lead time 120 hours
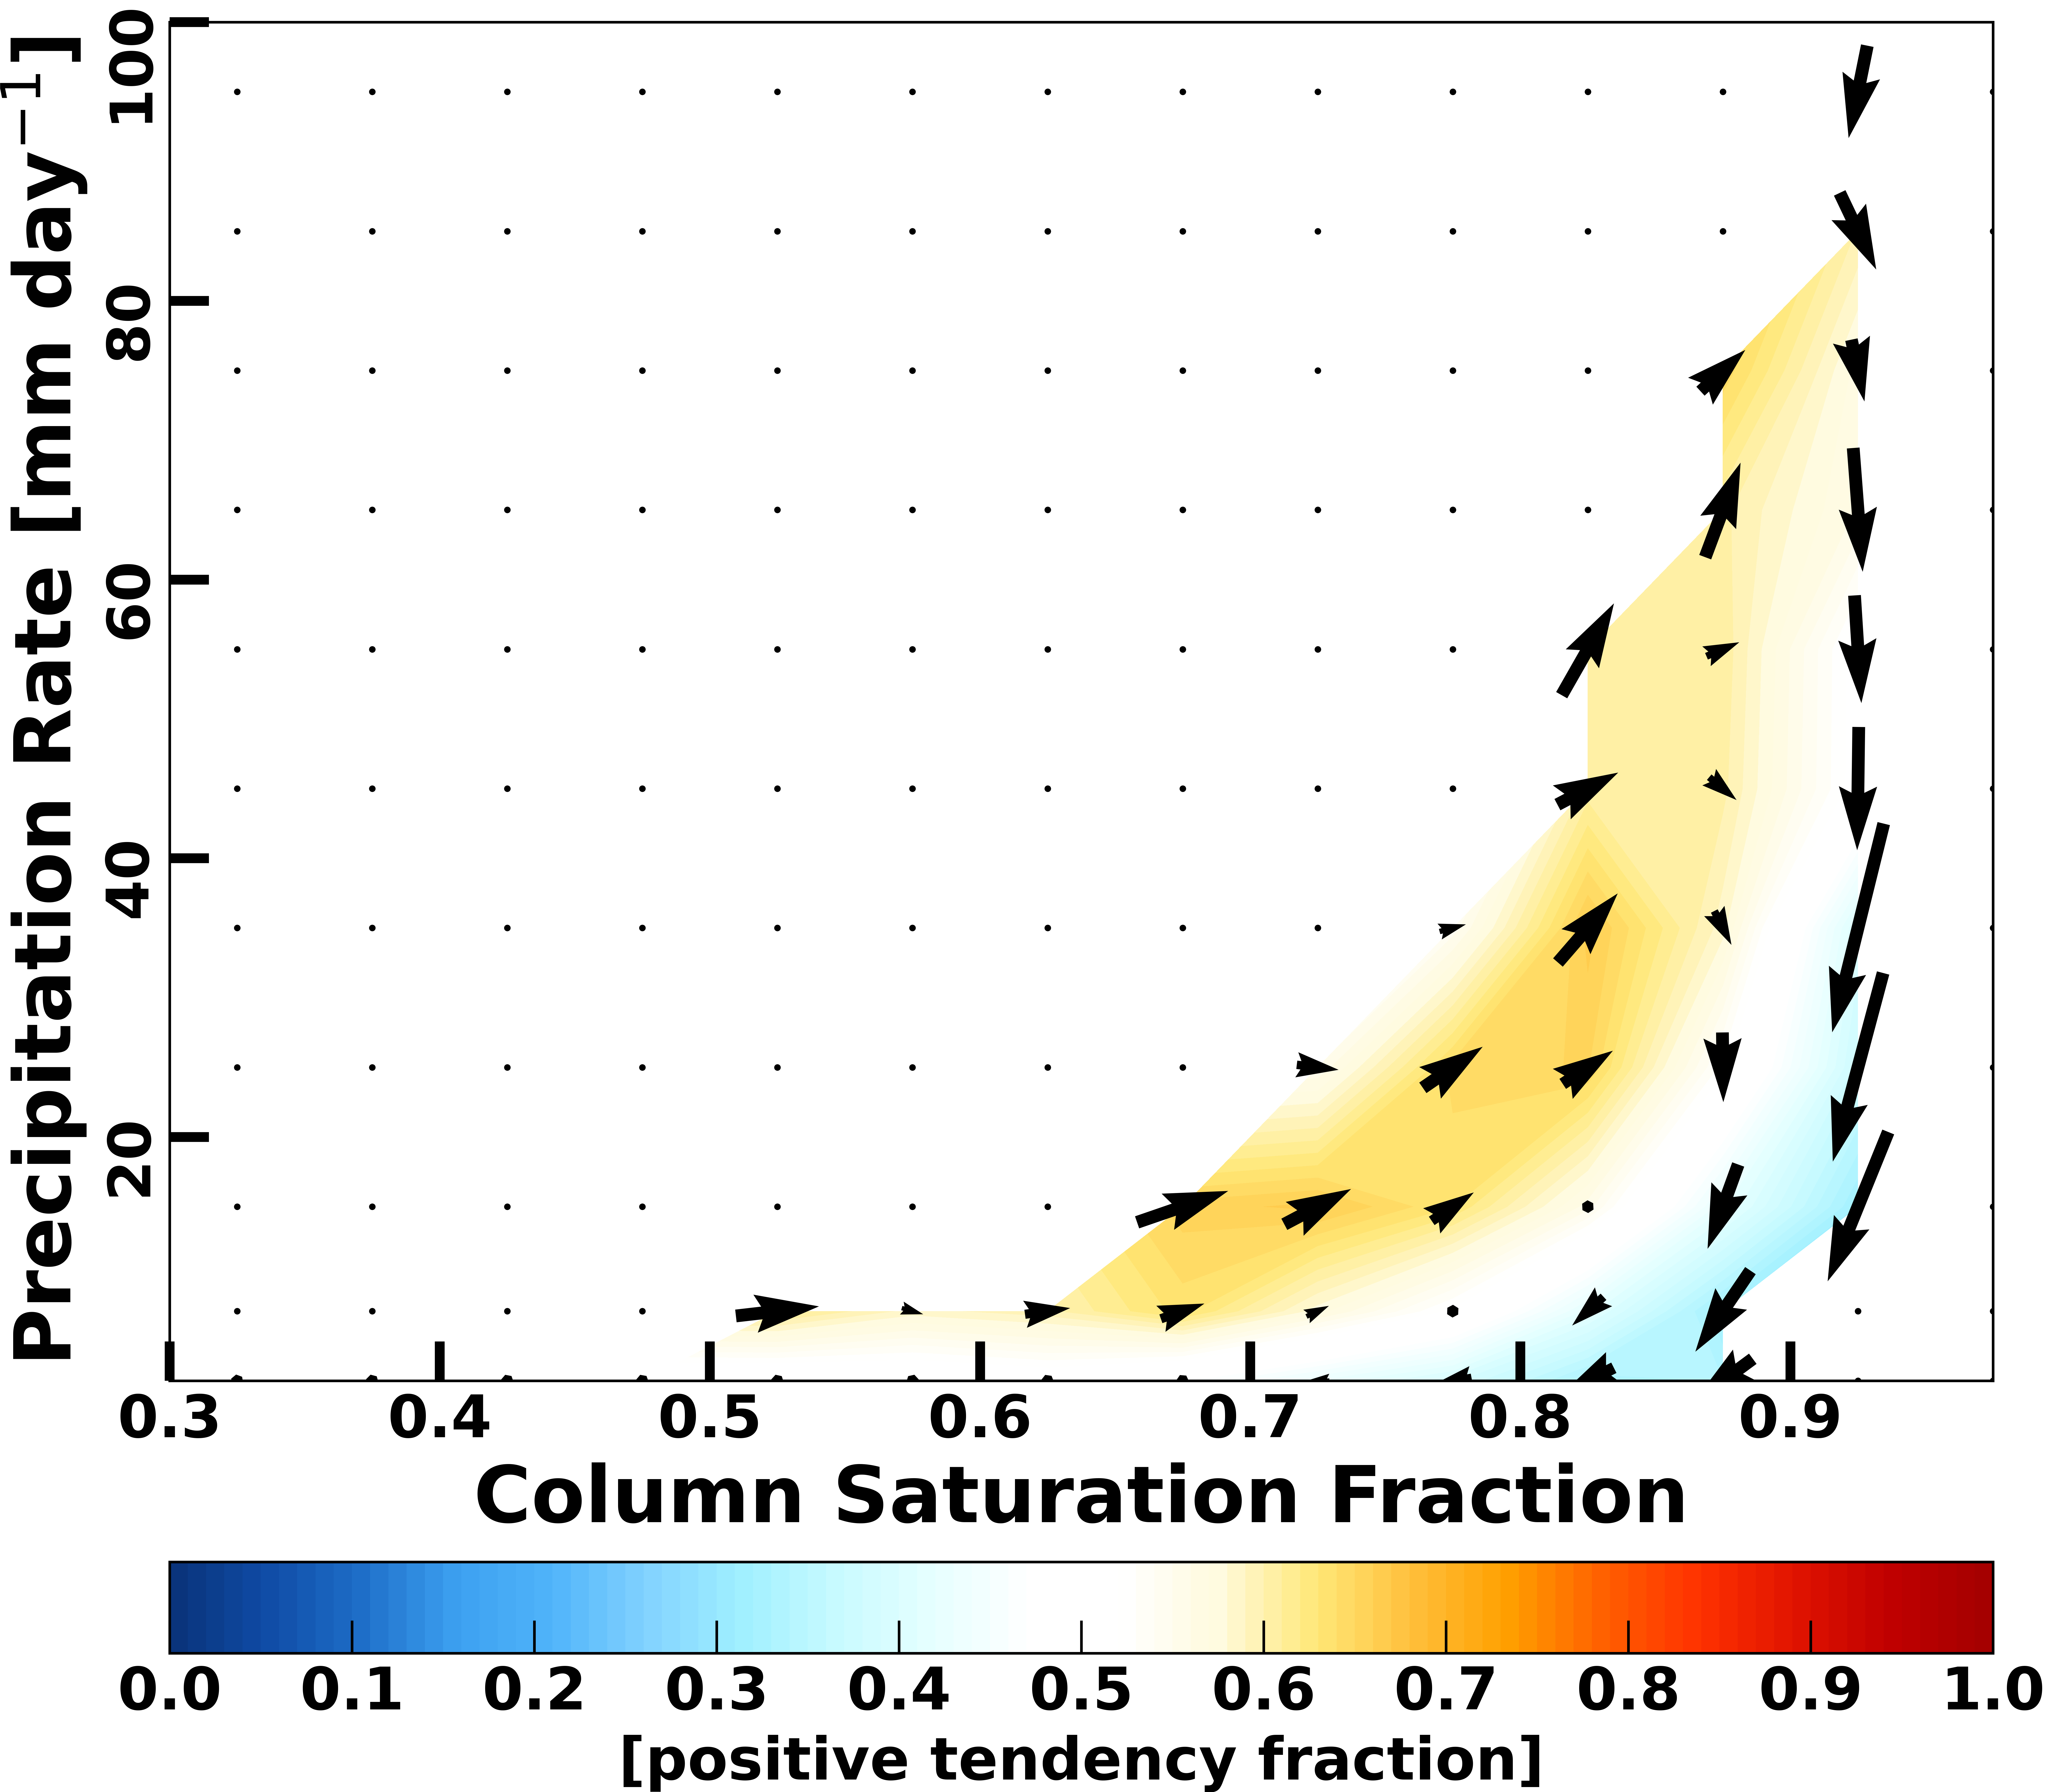
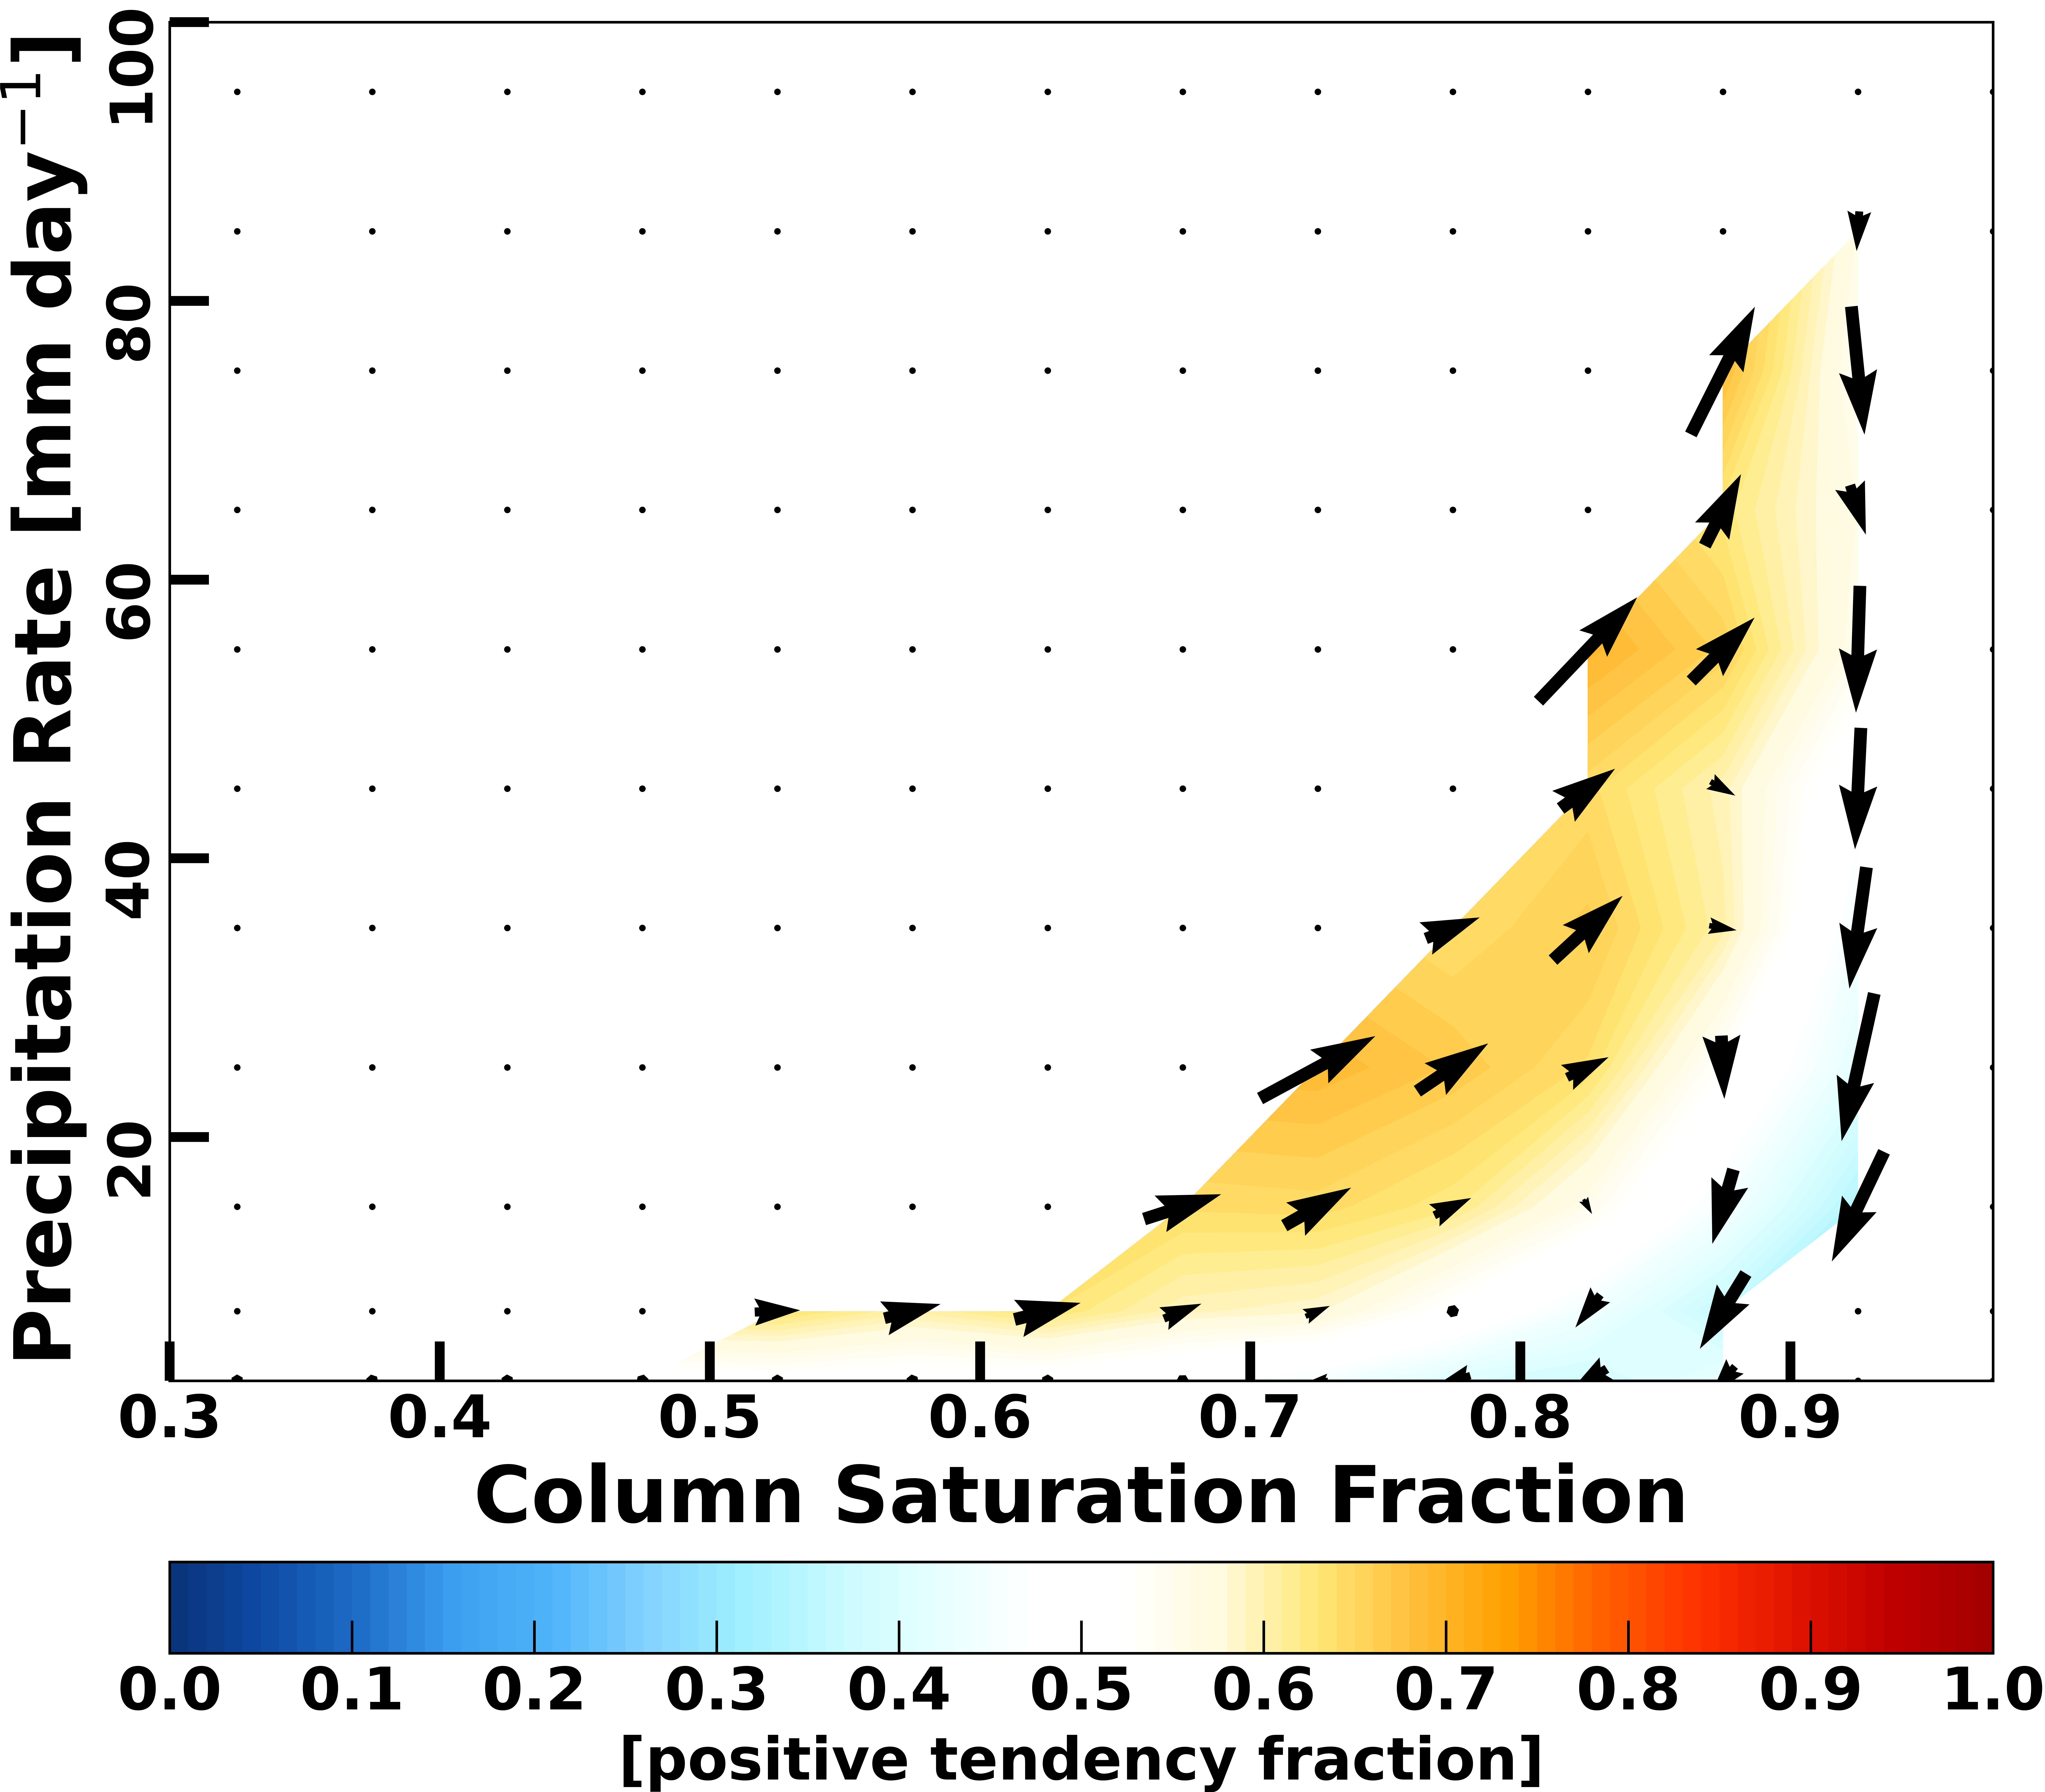
Sample cases Winter (December 3, 2019), left, and Summer (June 1, 2020), right, UFS_HR1 data for lead time 240 hours
UFS_HR2 data
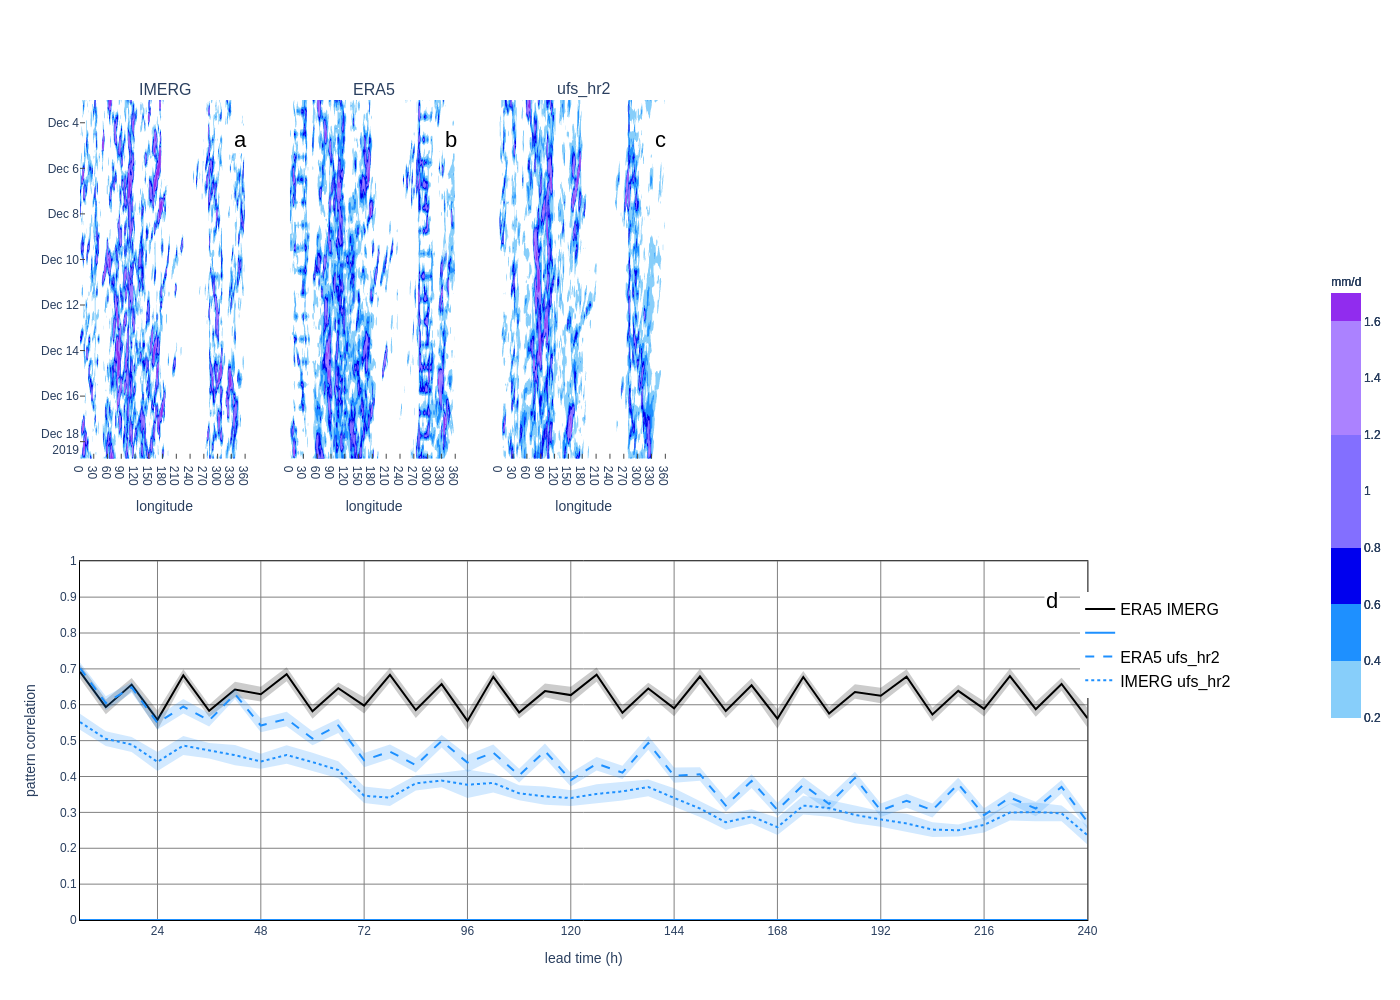
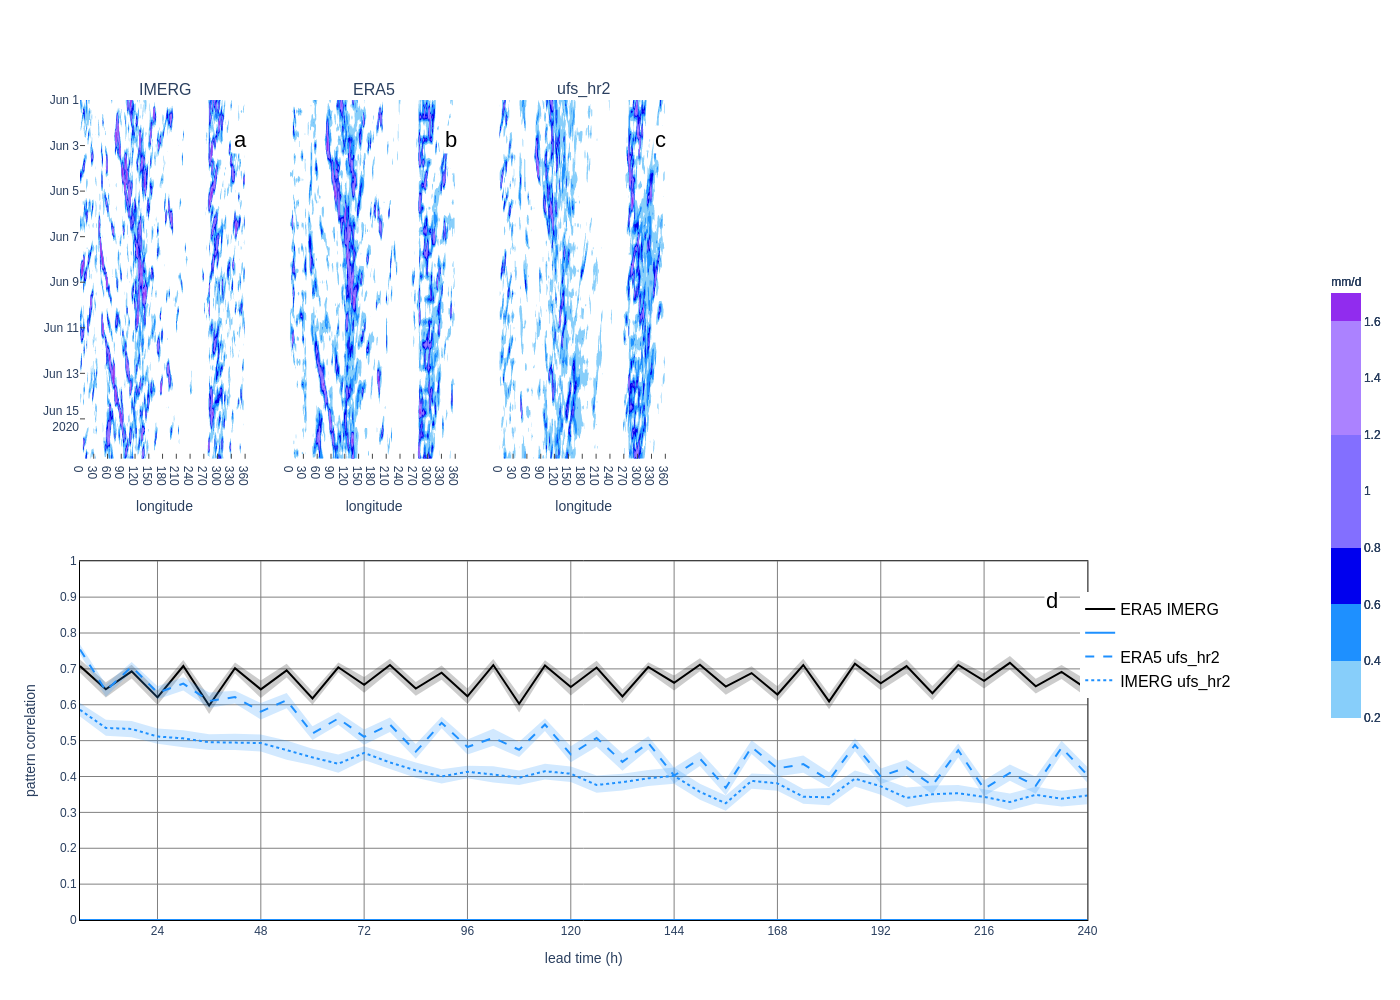
Hovmoeller and pattern correlation on precipitation data
Sample cases Winter 2019 and Summer 2020 UFS_HR2 data compared to ERA5 and IMERG data for different lead times:
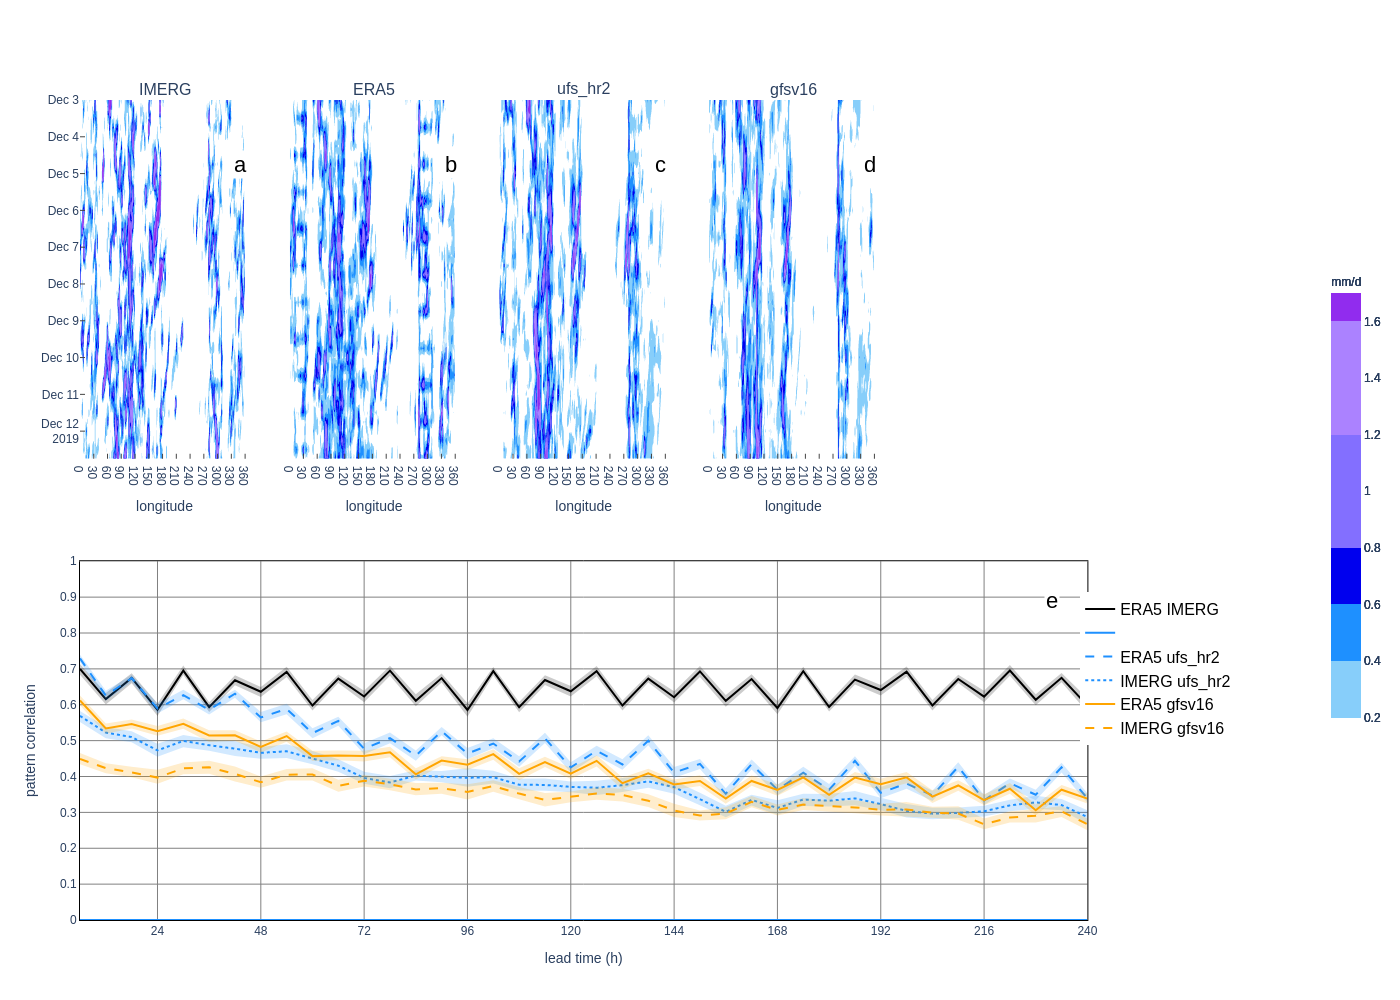
All the UFS_HR1 data analyzed together with gfsv16 data:
Convectively Coupled Equatorial Wave Skill Scores on precipitation data
Sample cases Winter 2019 and Summer 2020 UFS_HR1 data compared to ERA5 and IMERG data for different lead times:
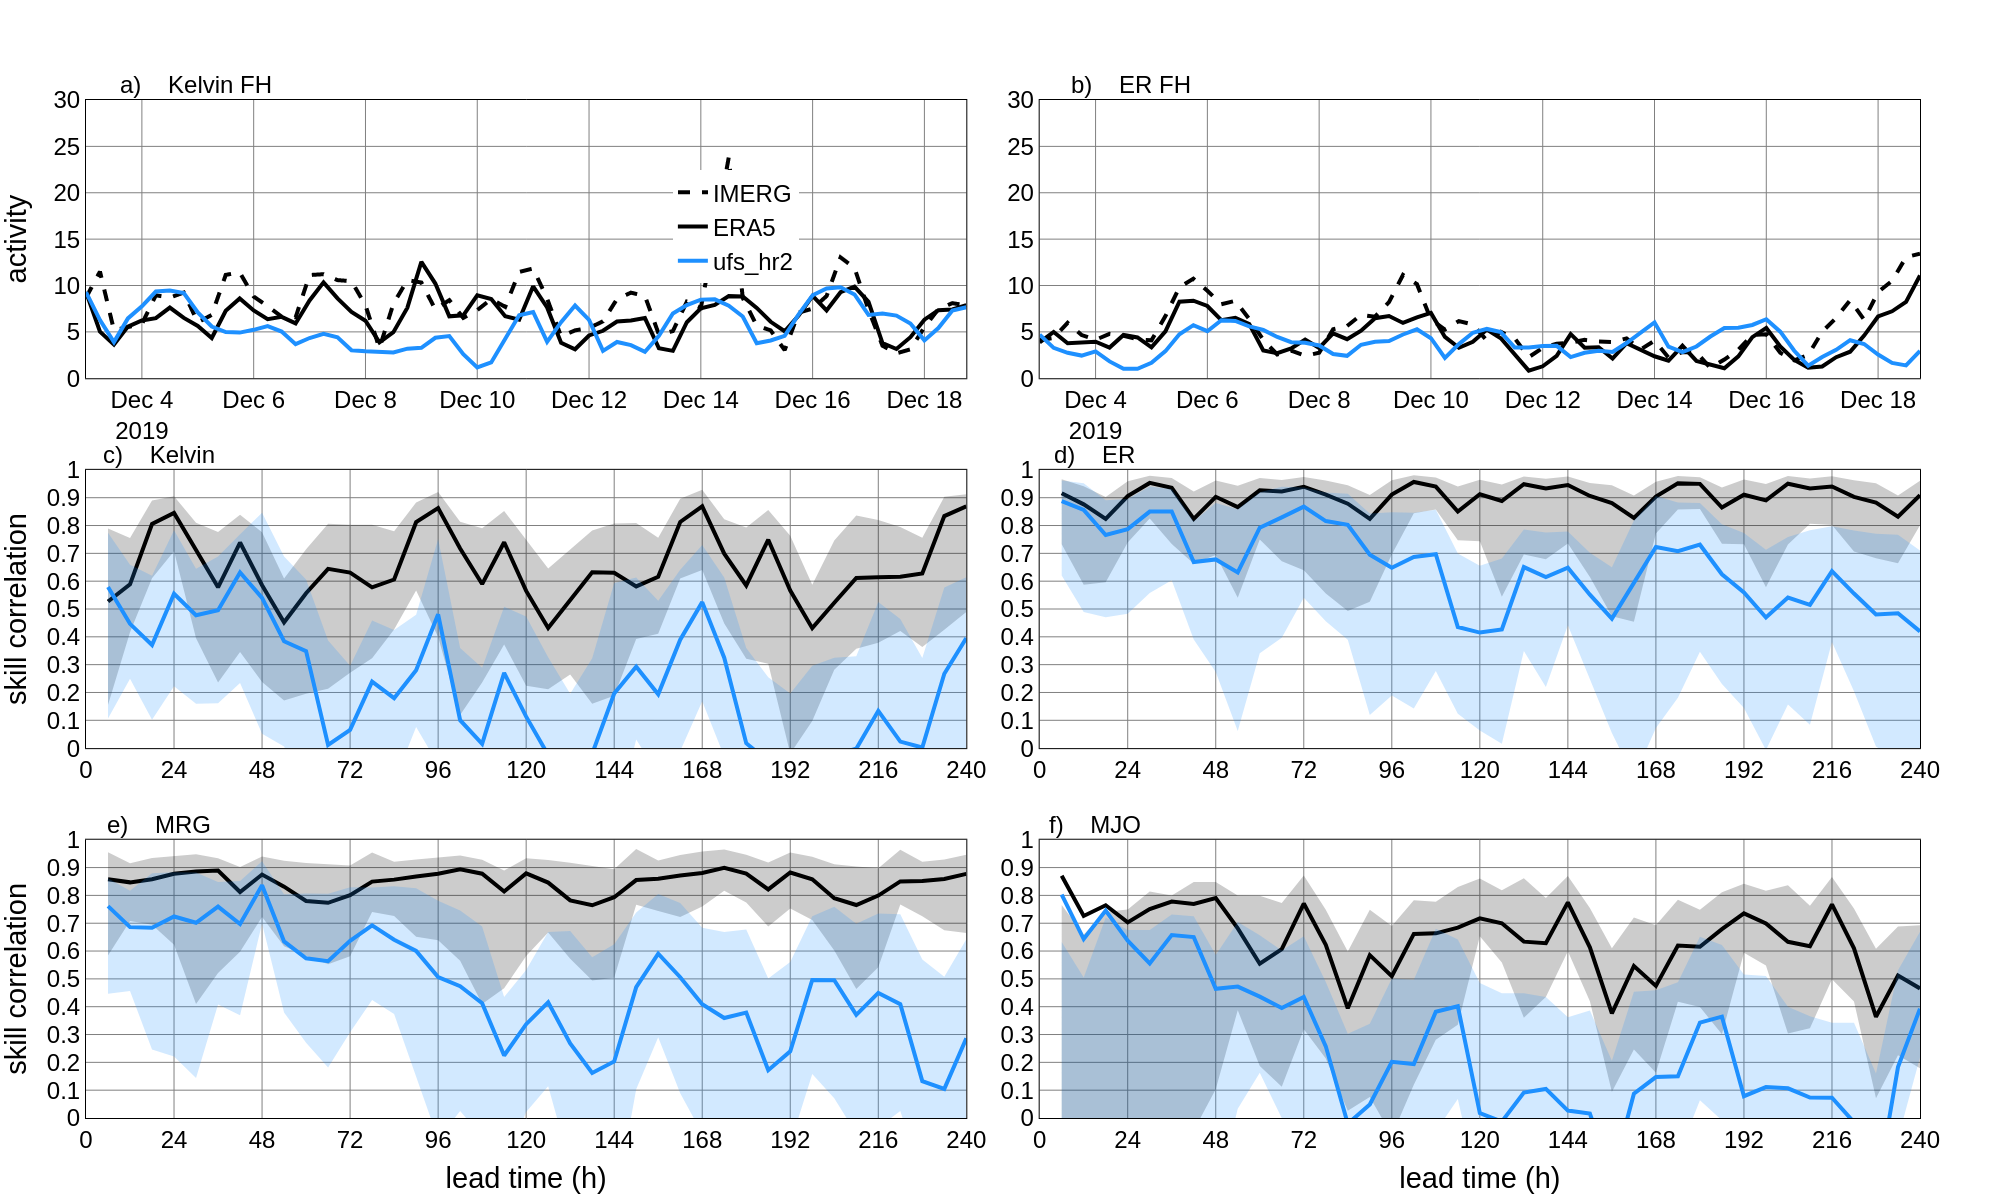
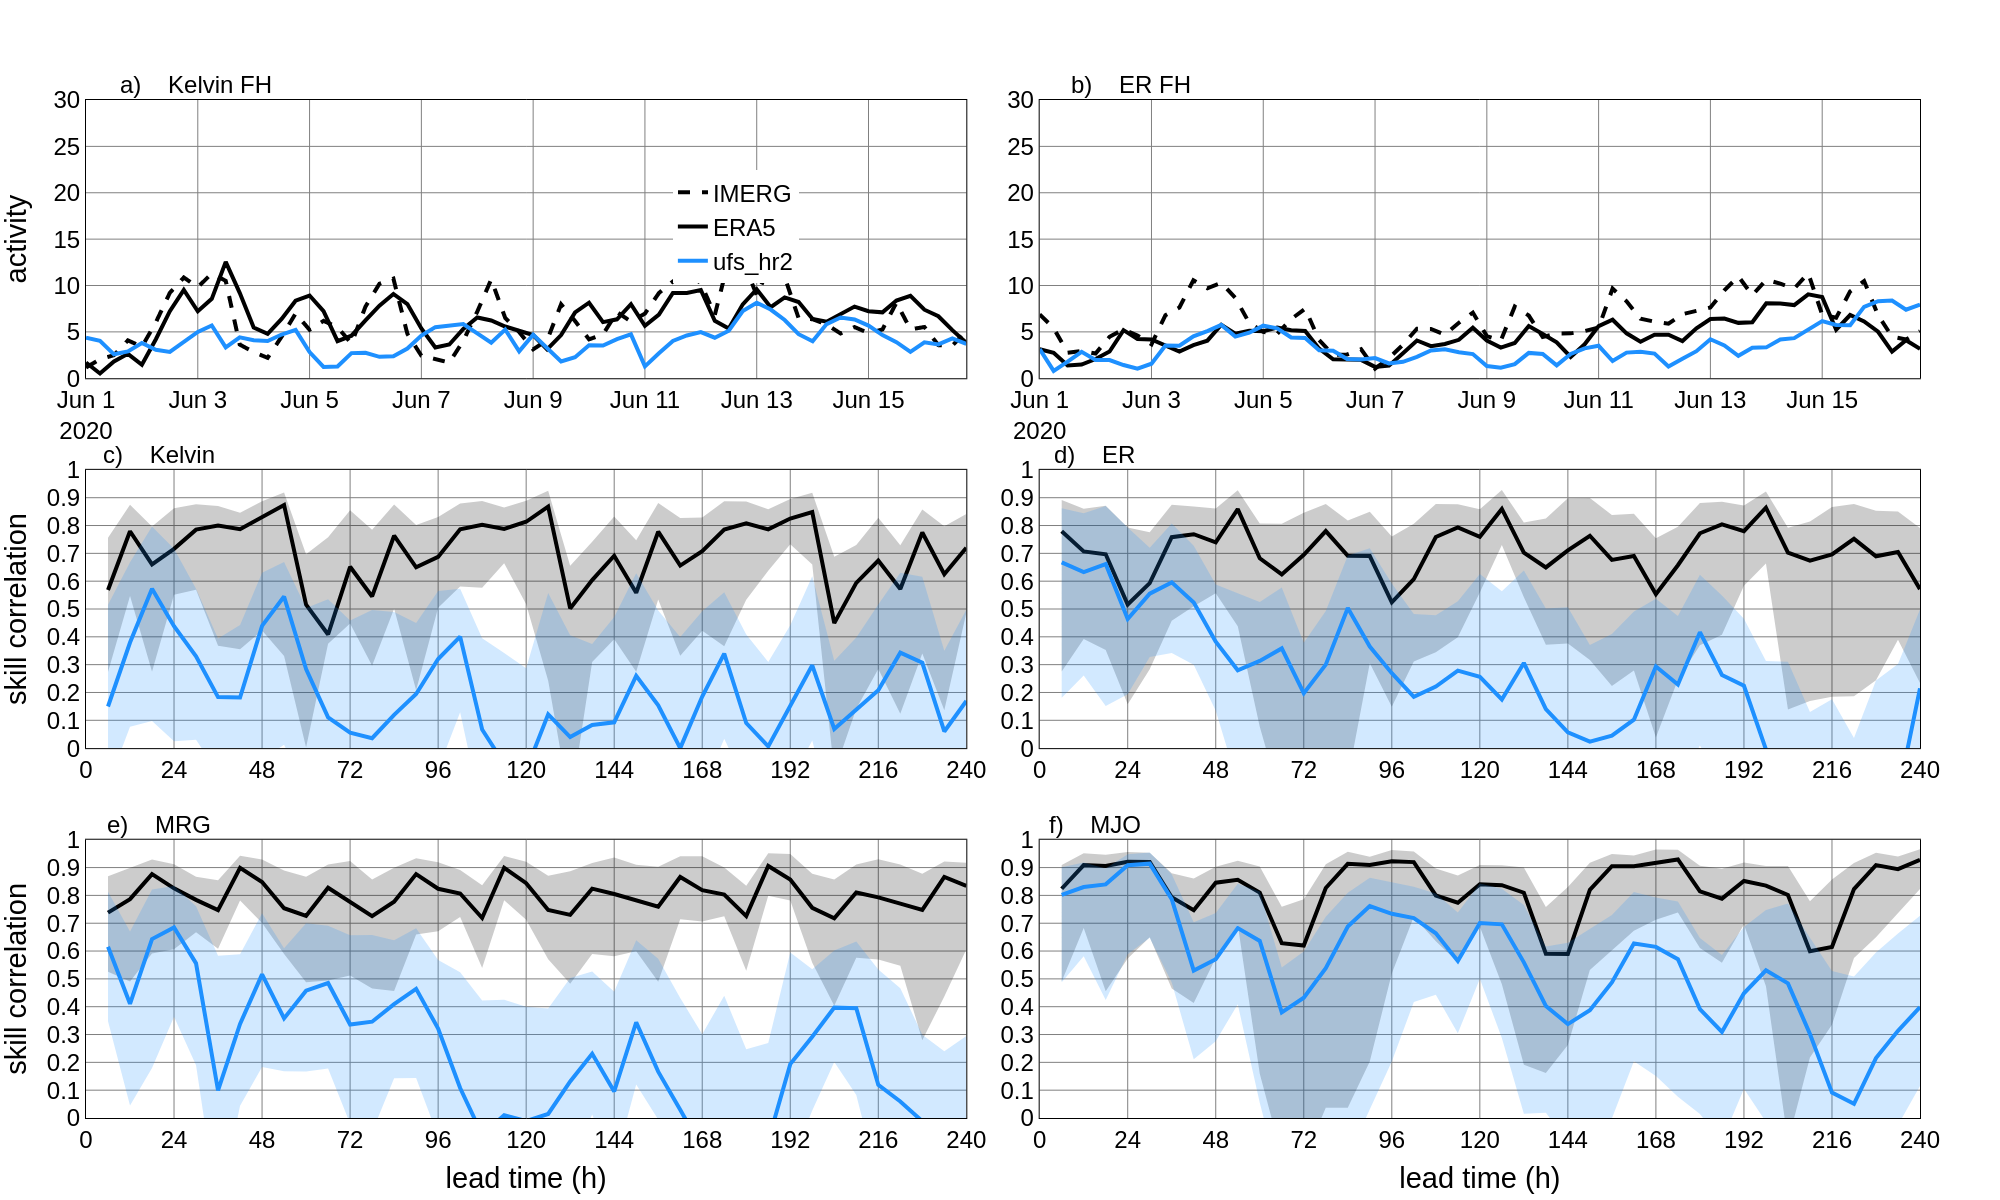
All the UFS_HR1 data analyzed together with gfsv16 data:
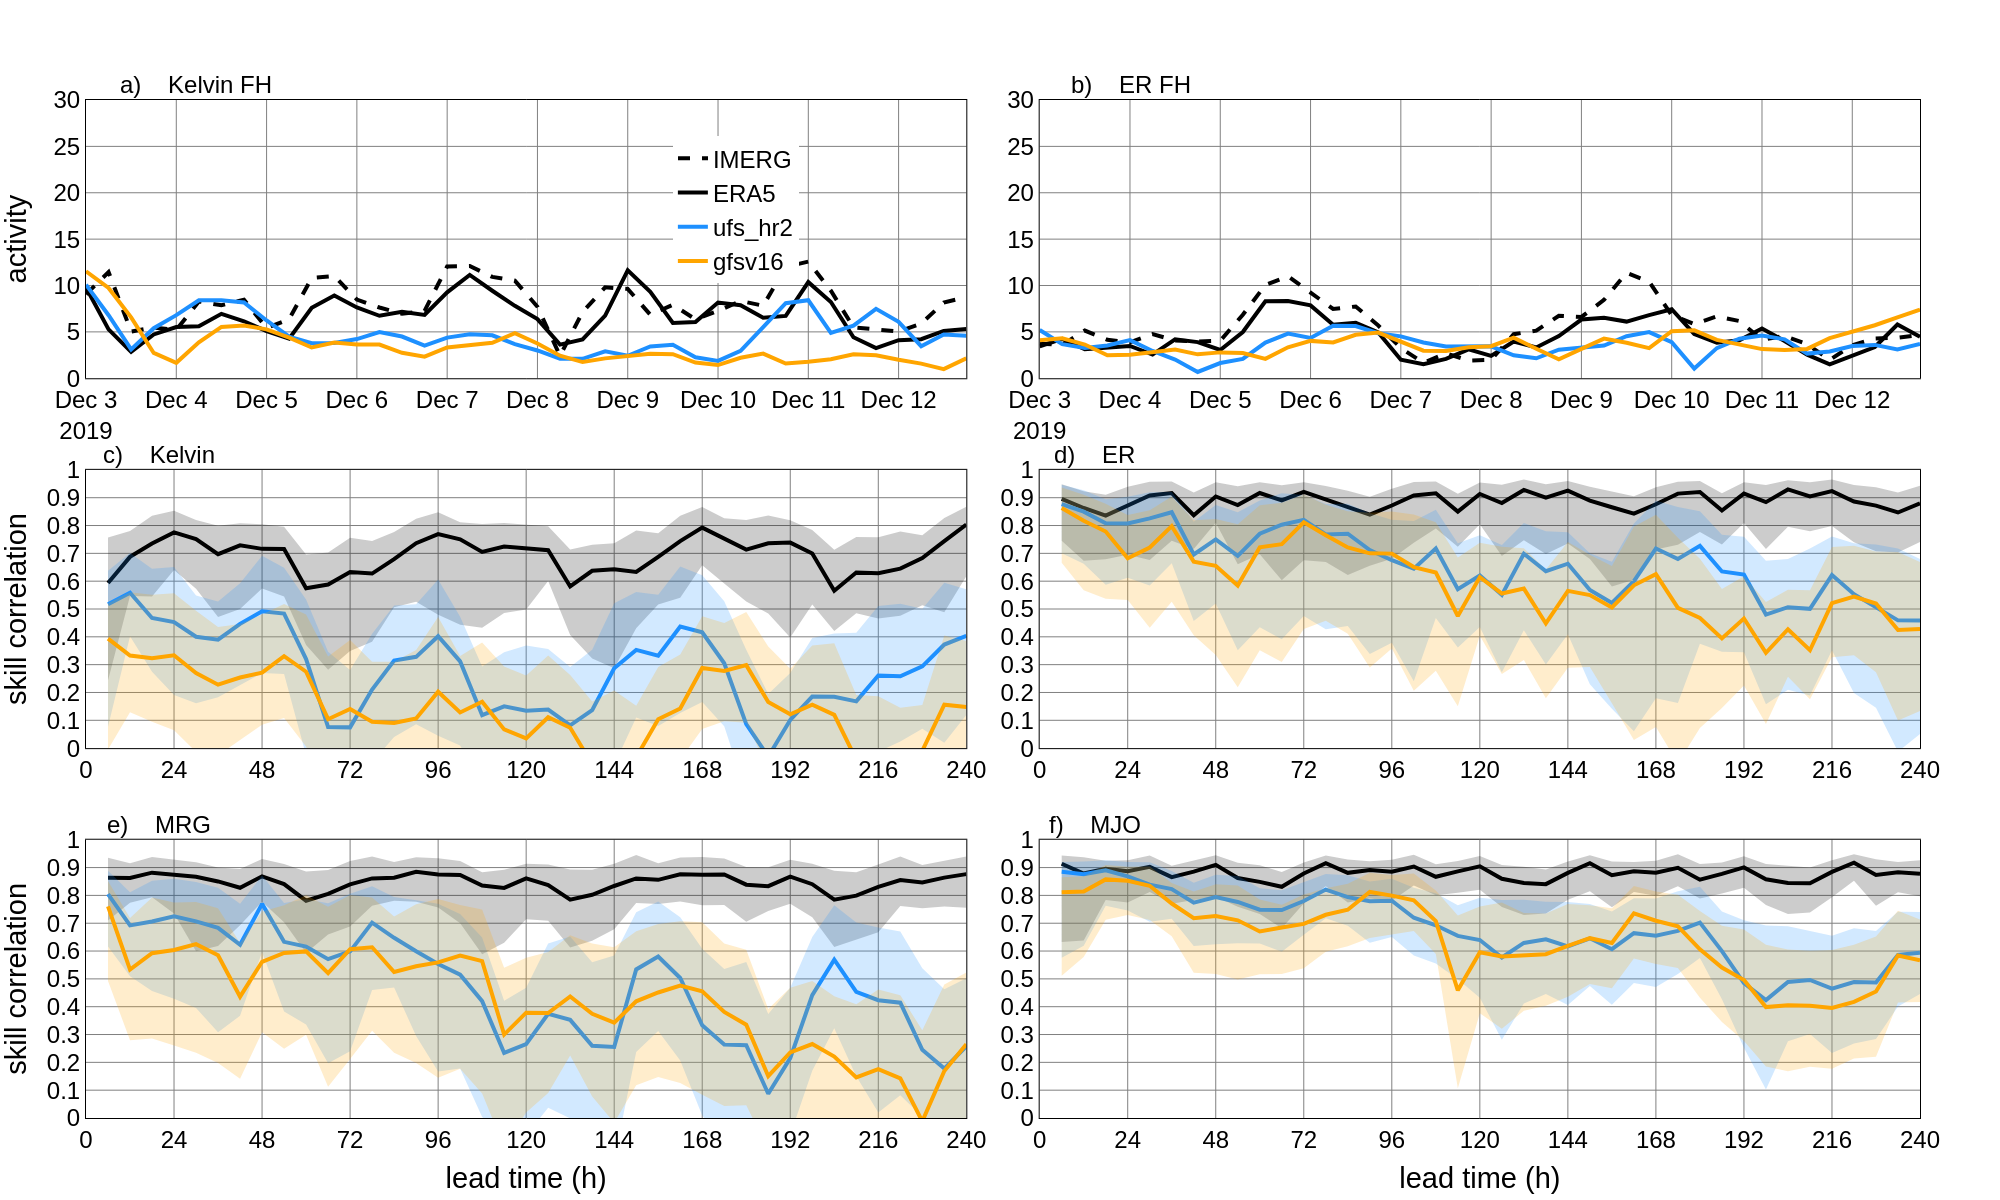
UFS_HR1 data and UFS_HR2 together
Hovmoeller and pattern correlation on precipitation data
