Lesley L. Smith – Re. ExtraTropical Cyclones
All plots preliminary.
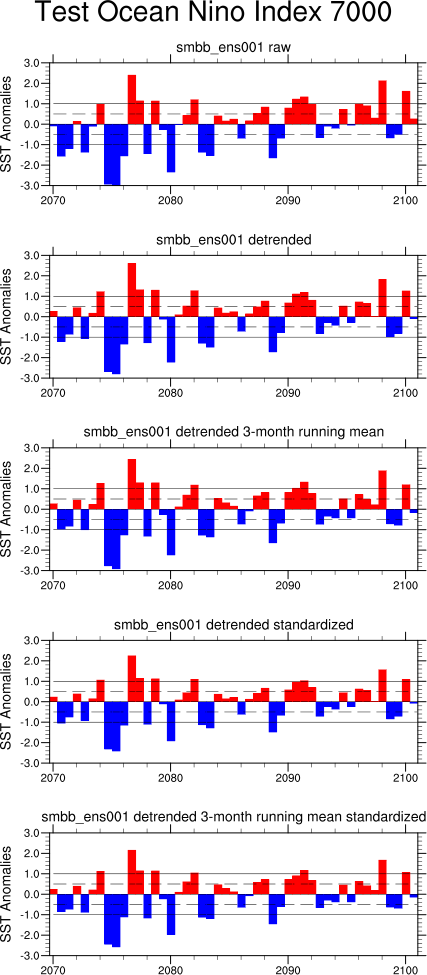
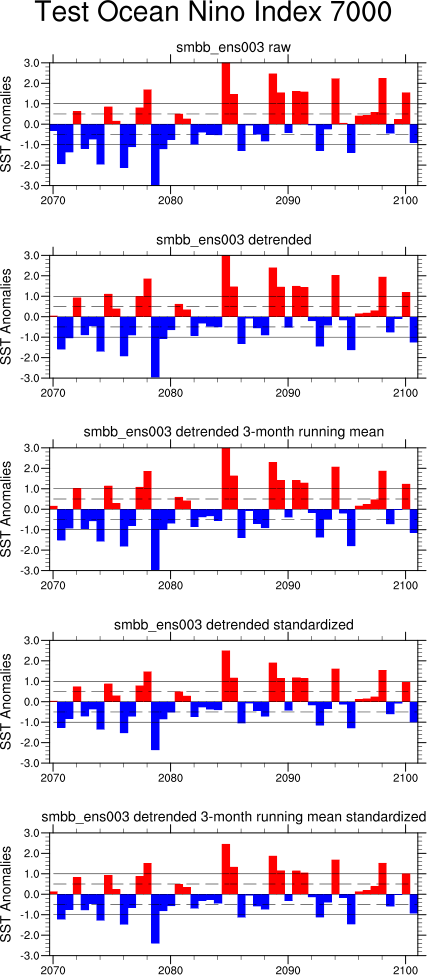
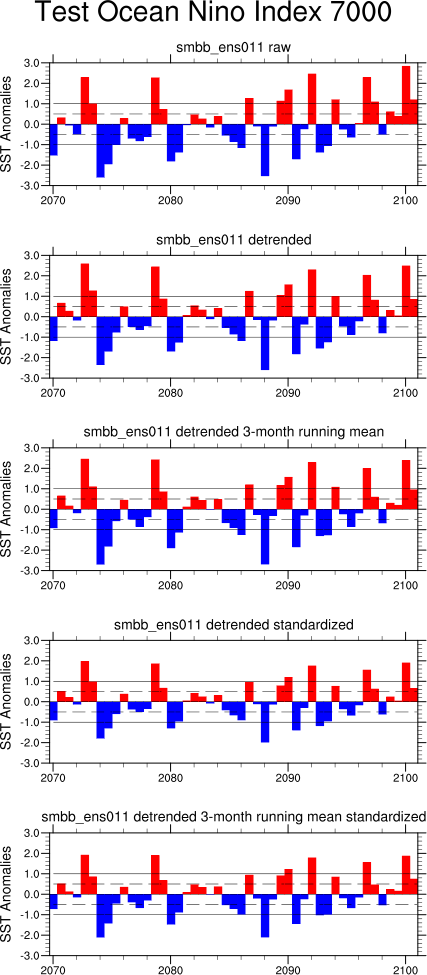
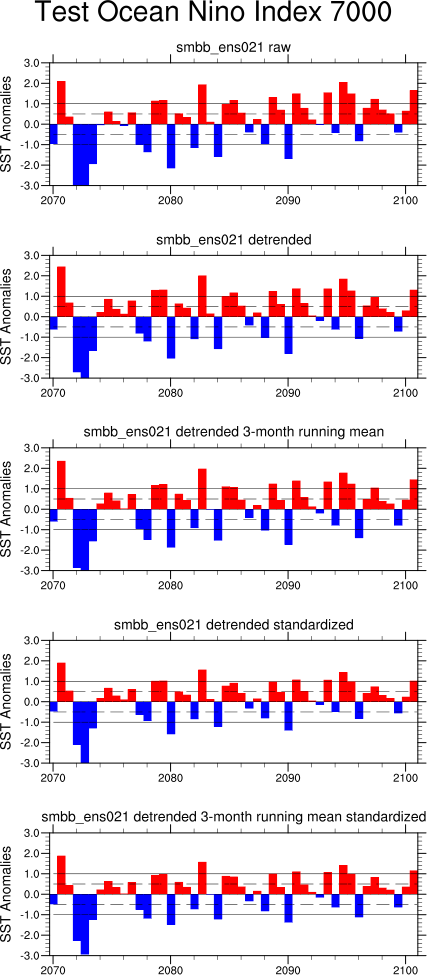
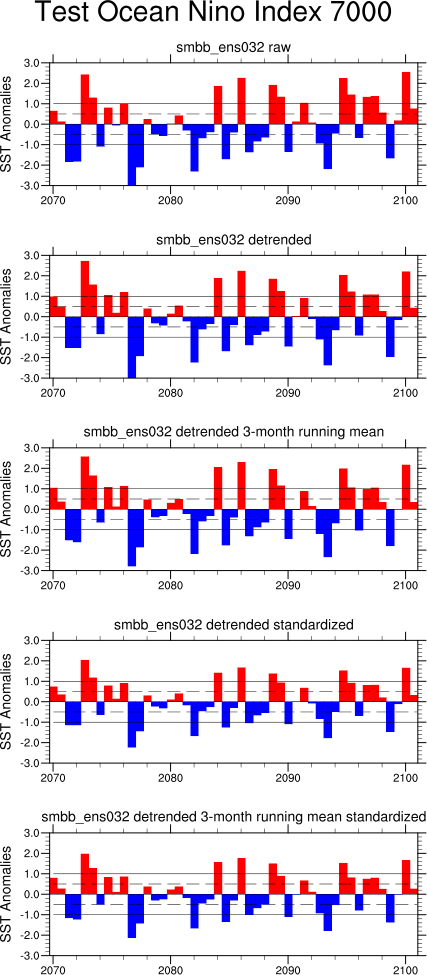
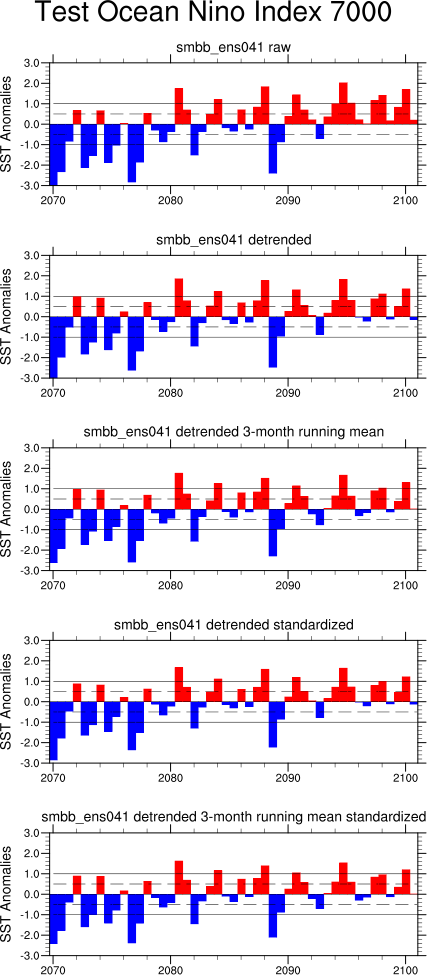
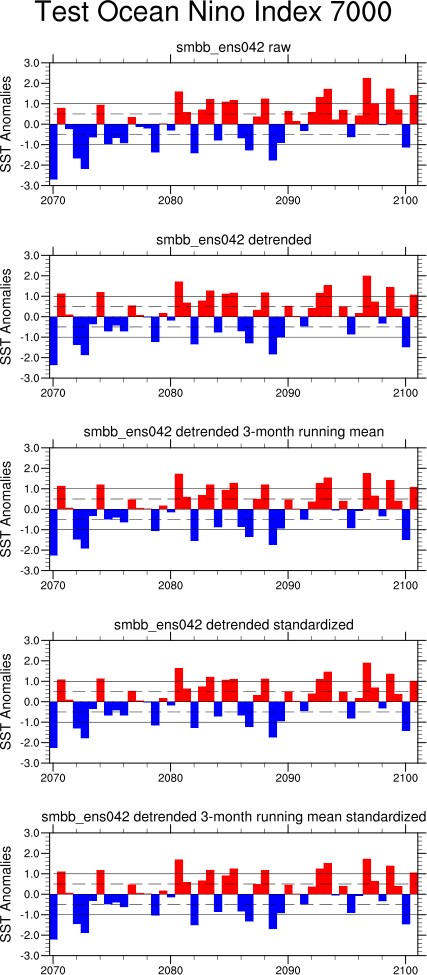
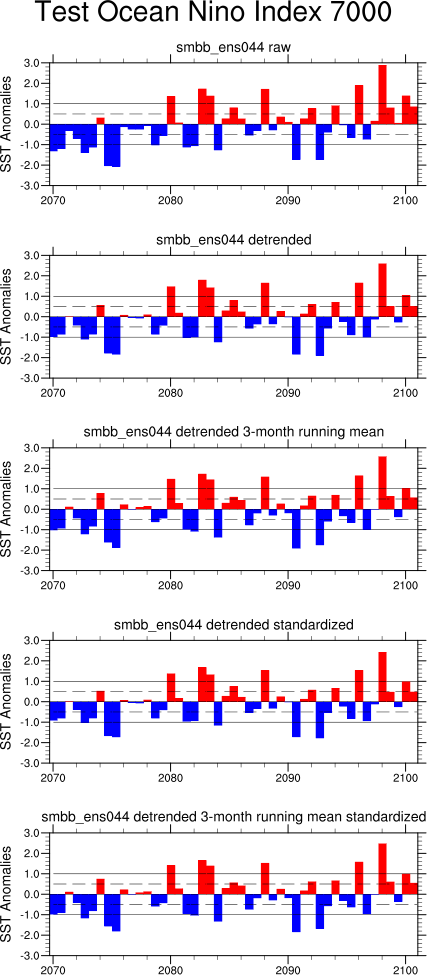
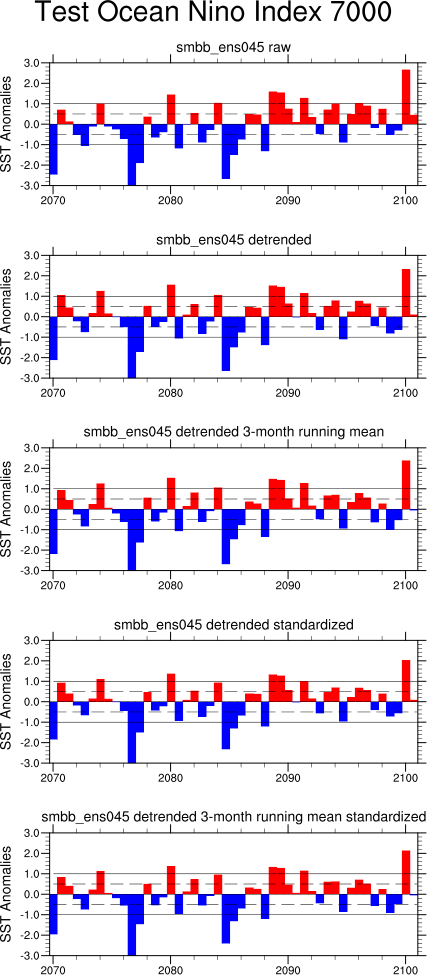
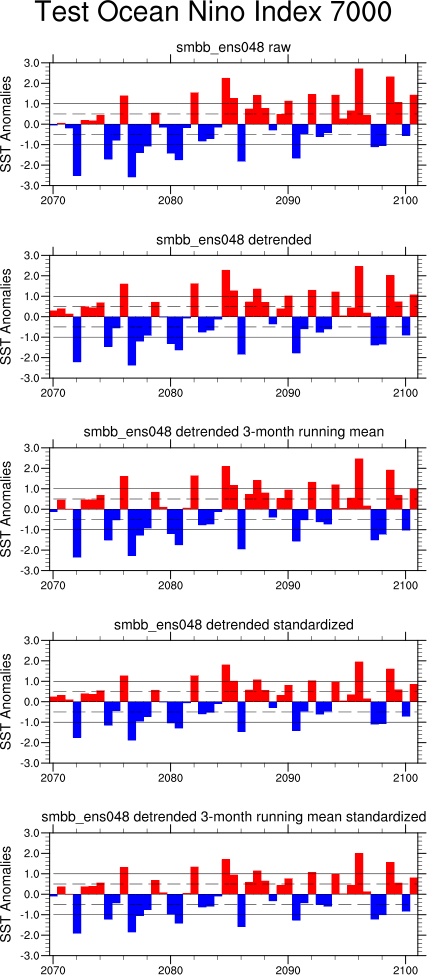
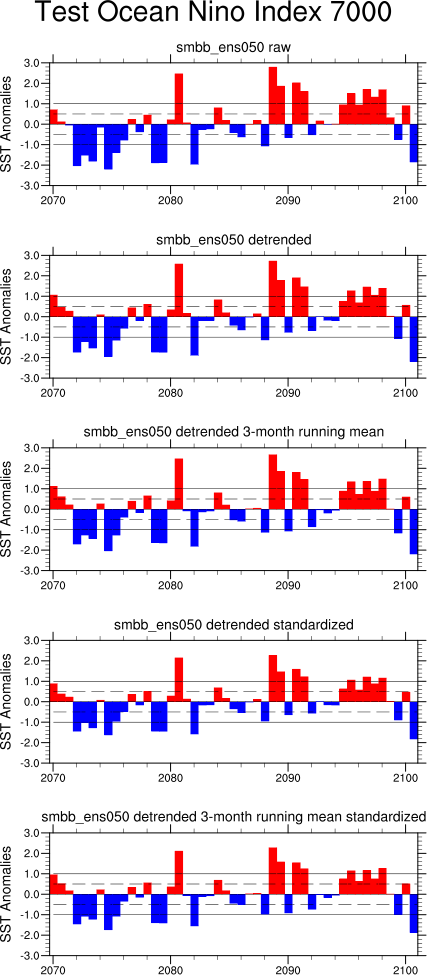
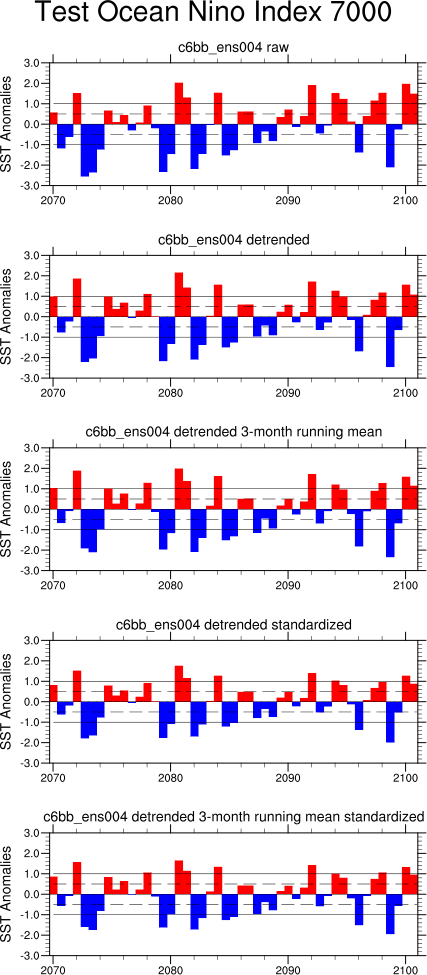
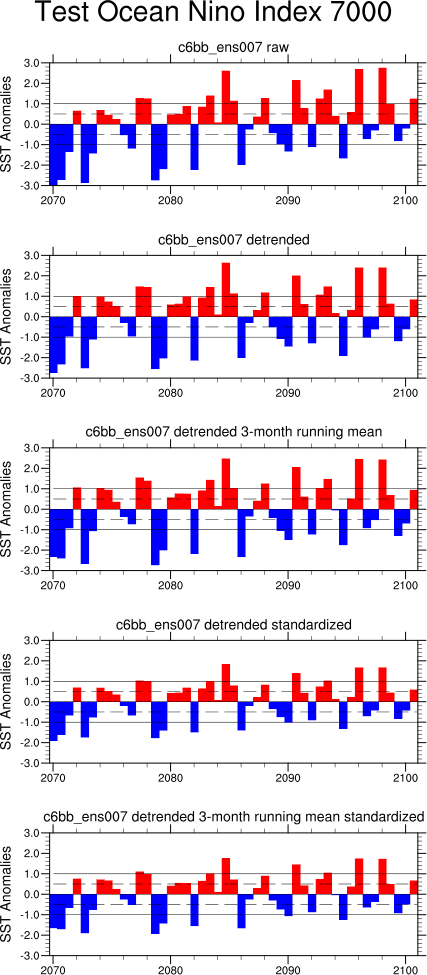
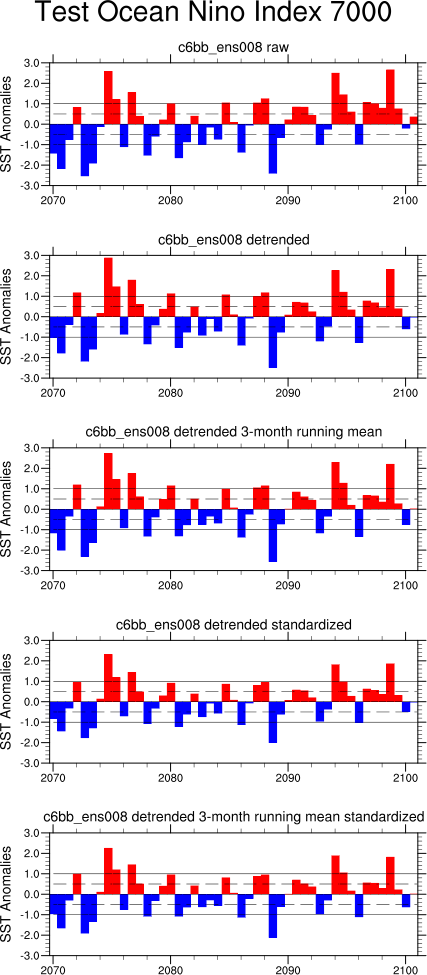
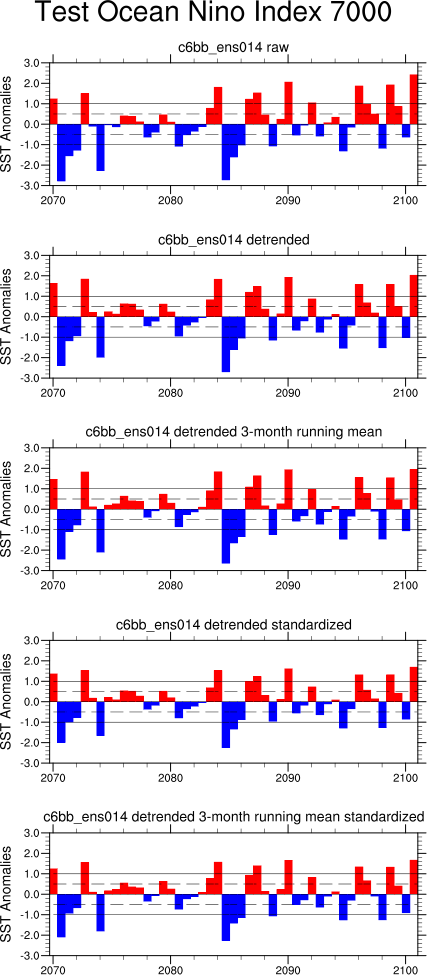
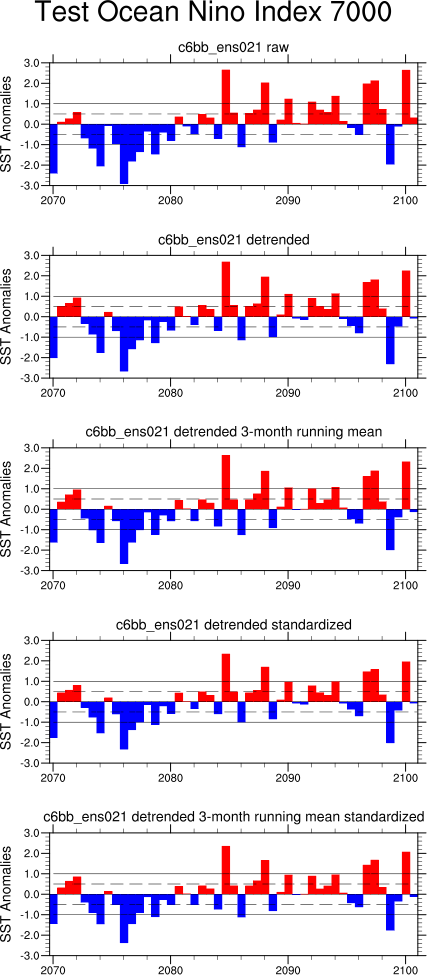
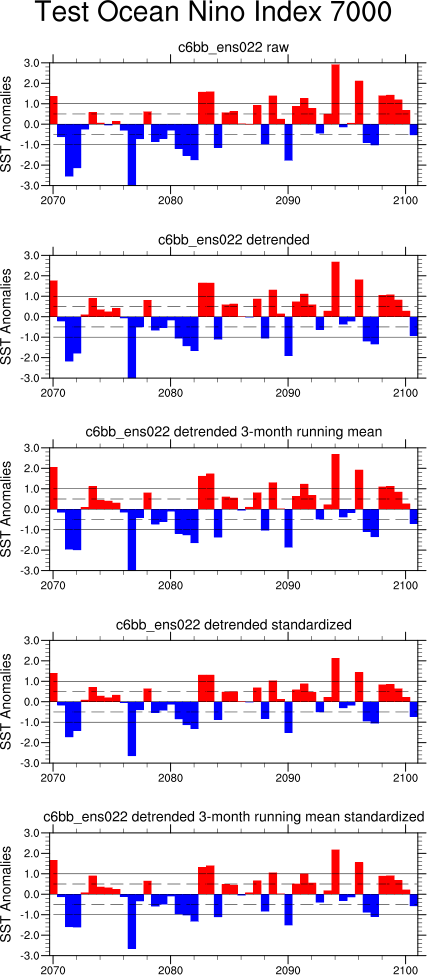
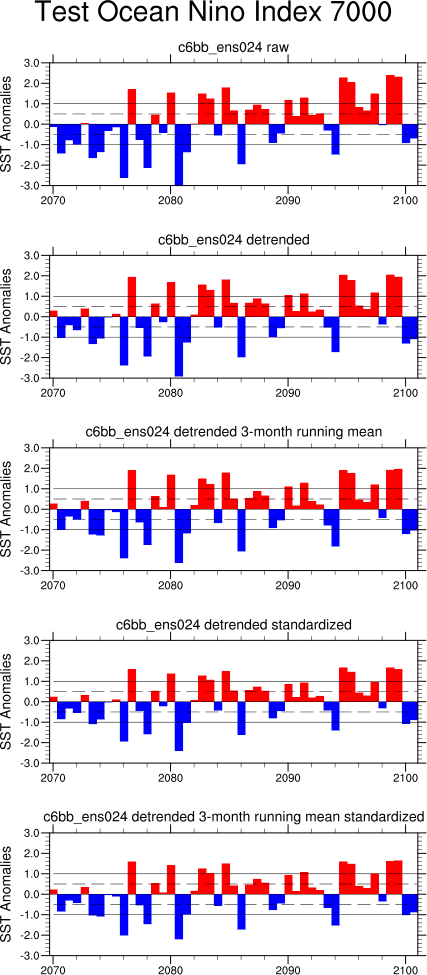
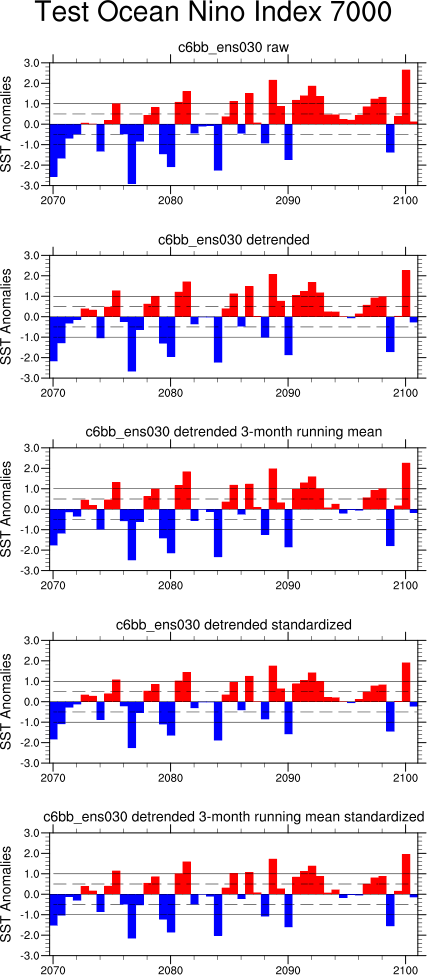
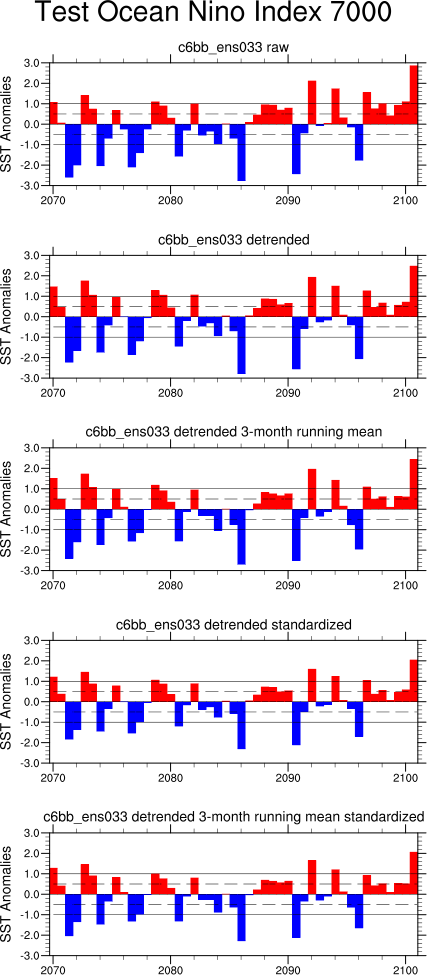
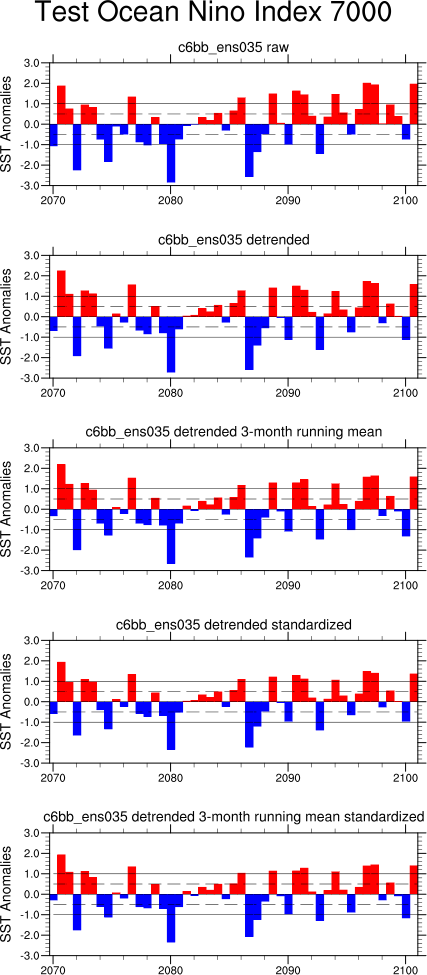
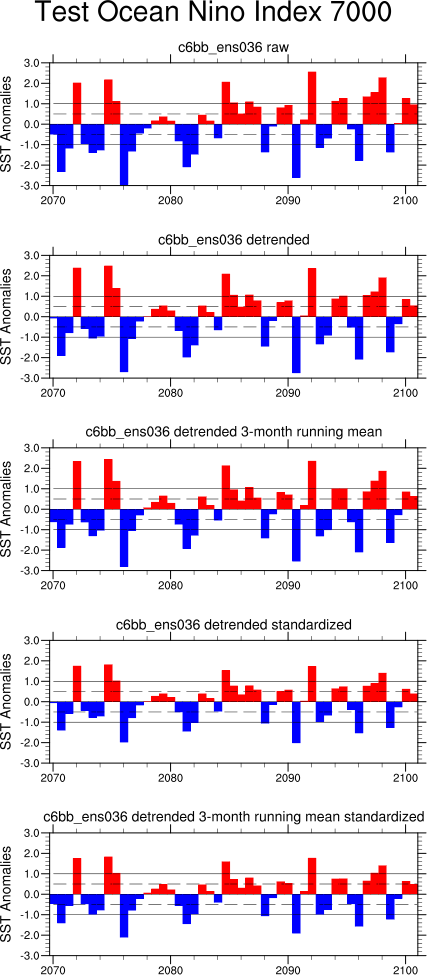
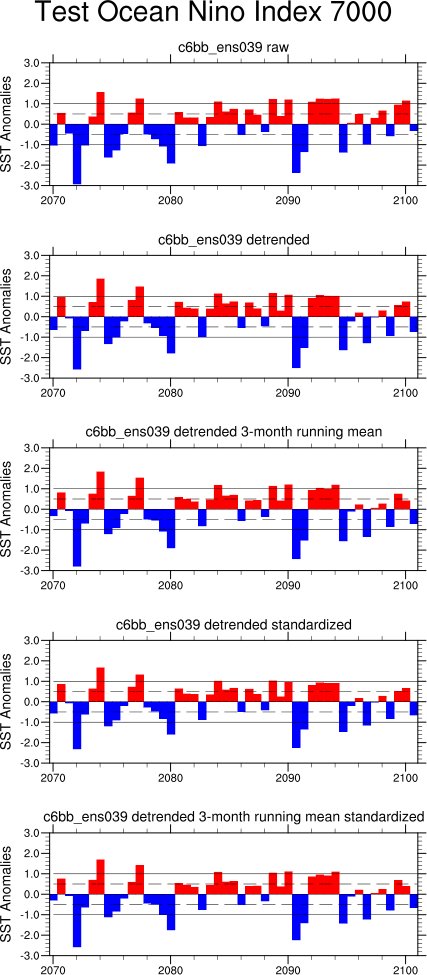
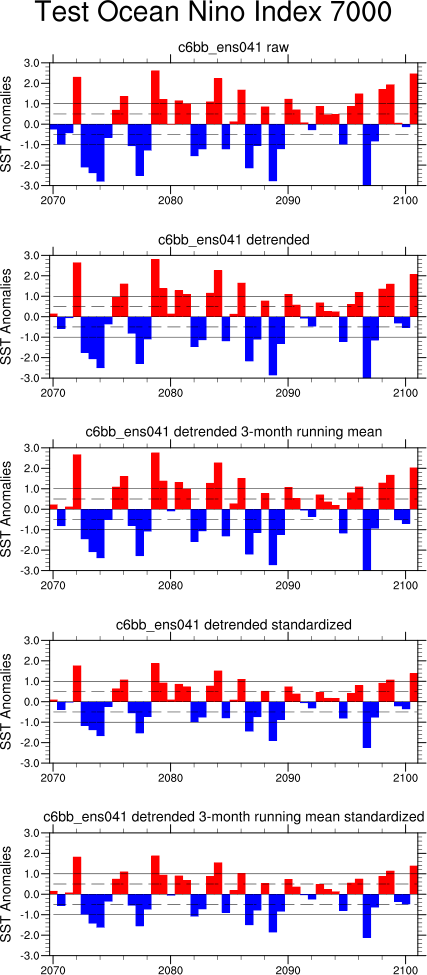
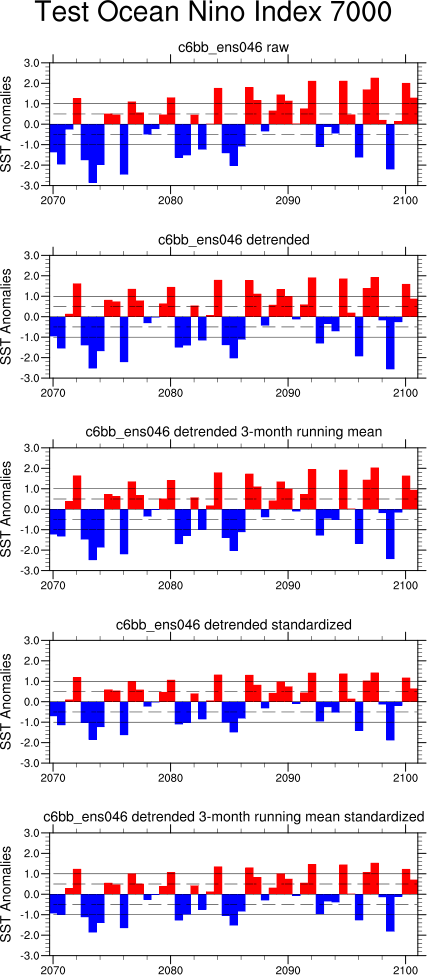
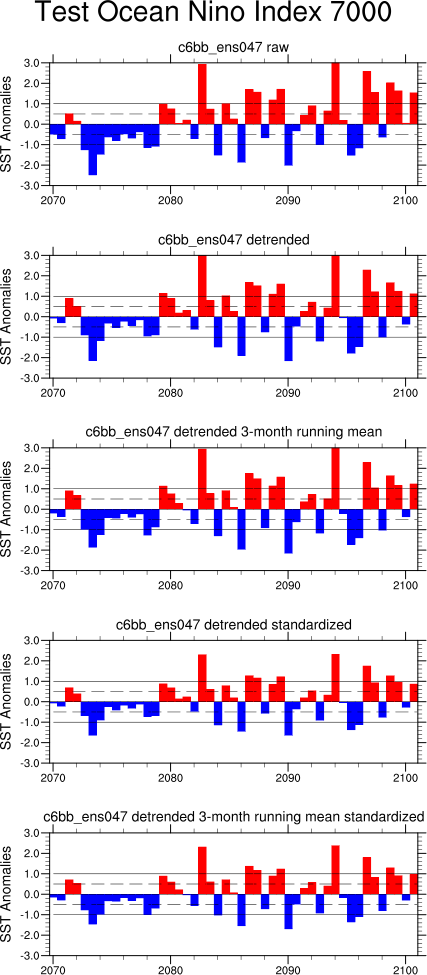
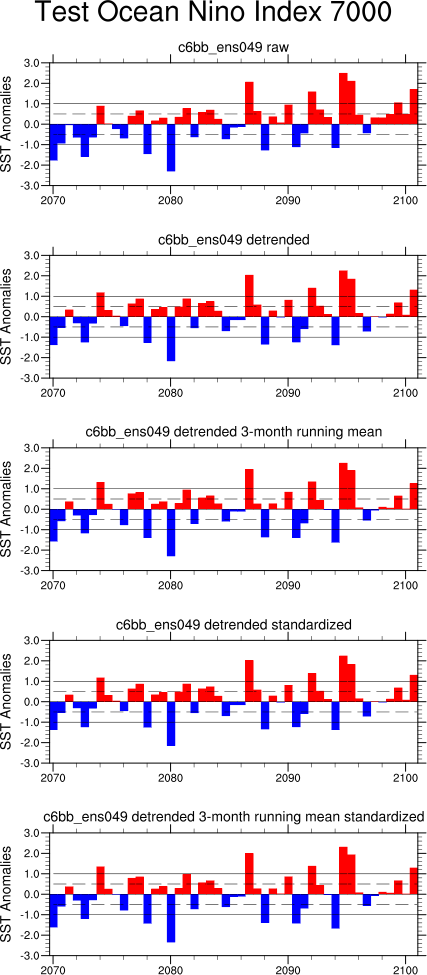
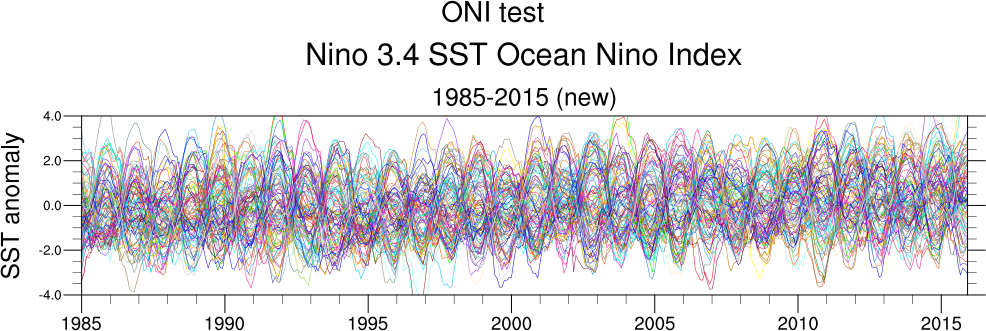
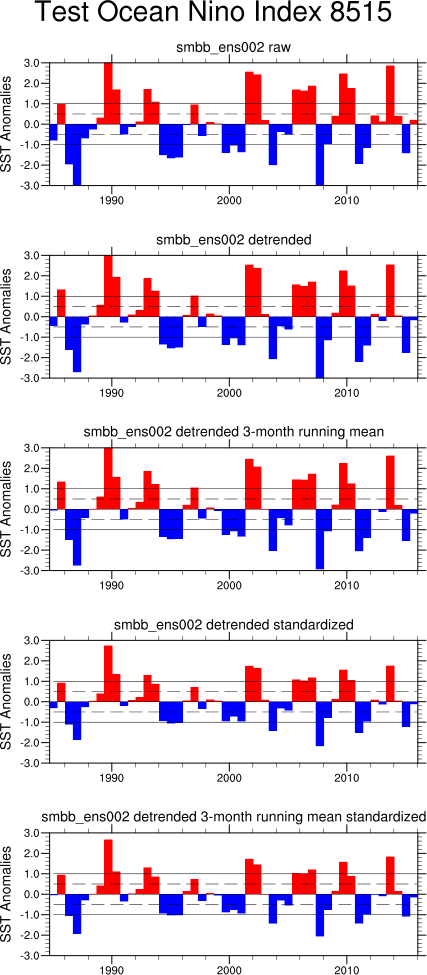
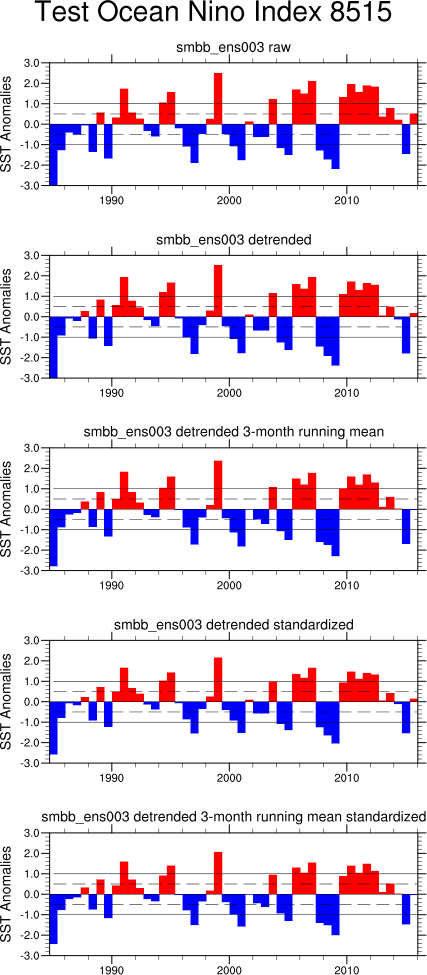
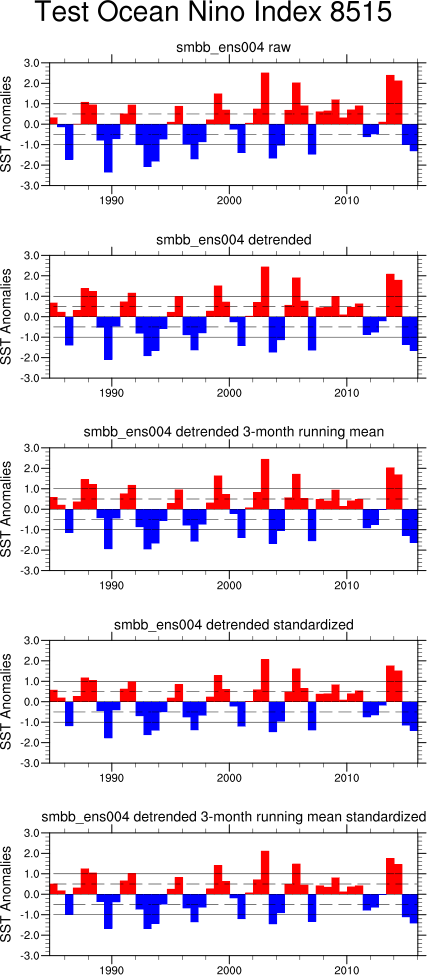
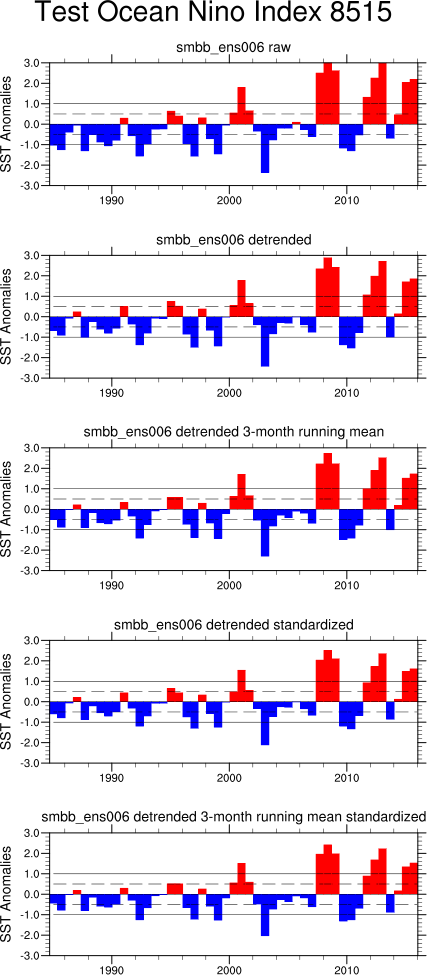
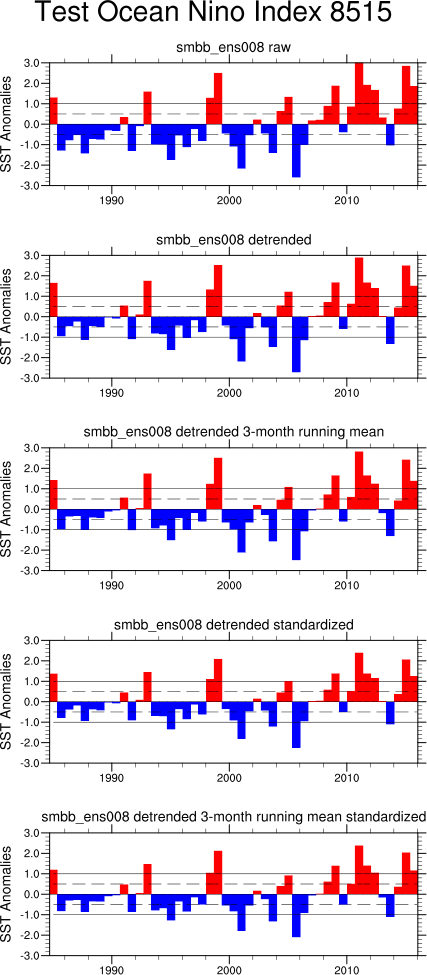
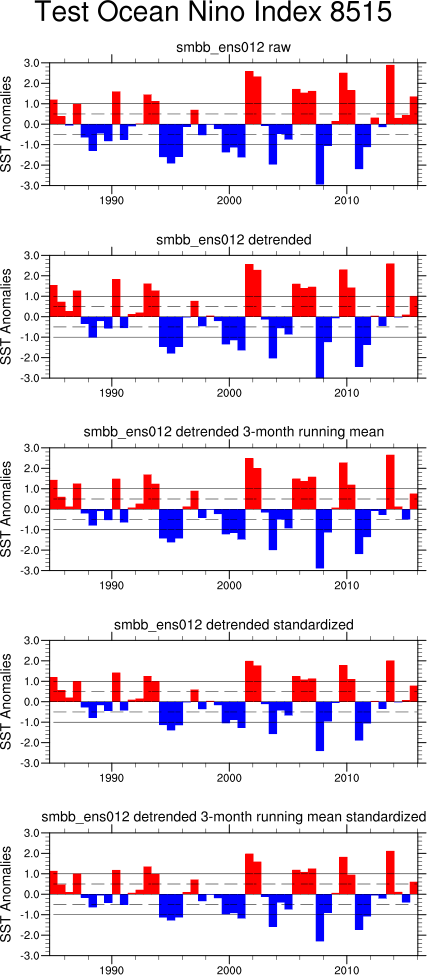
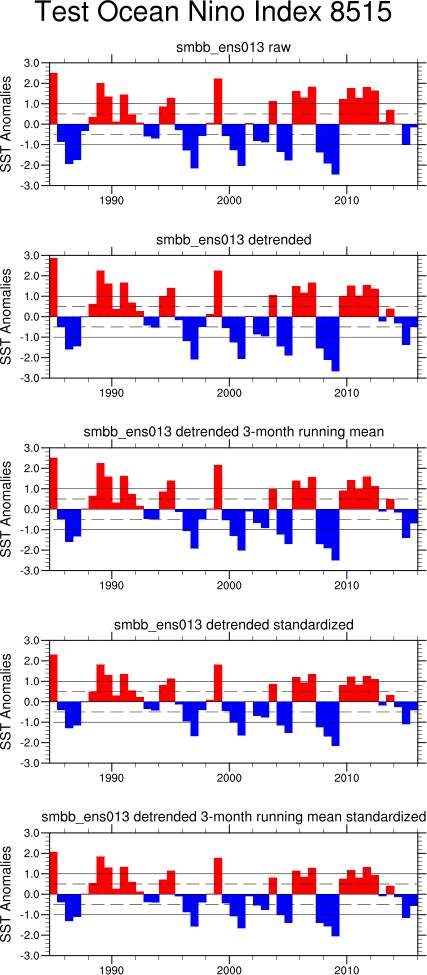
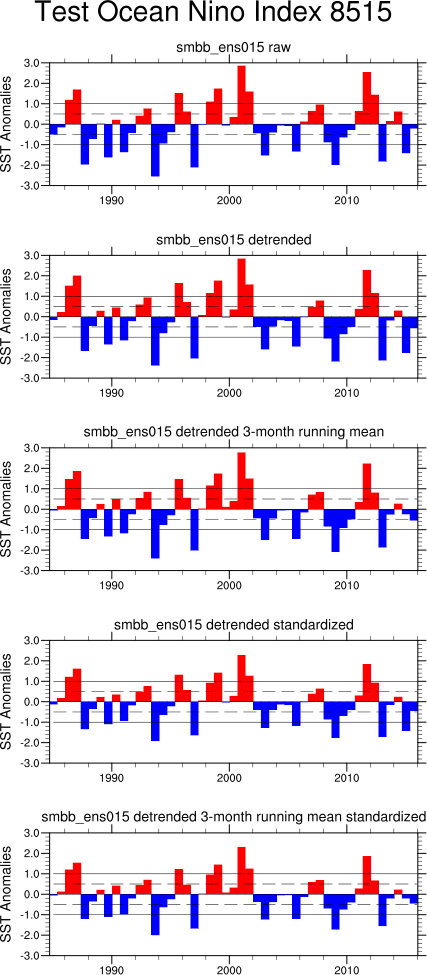
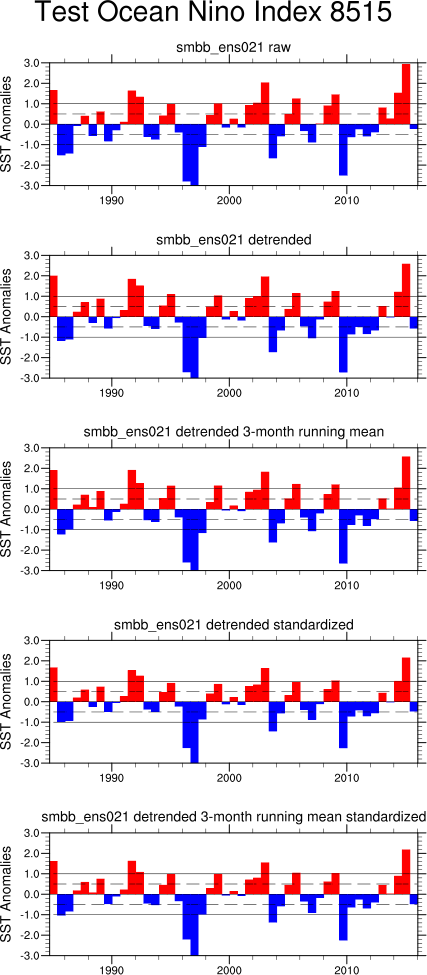
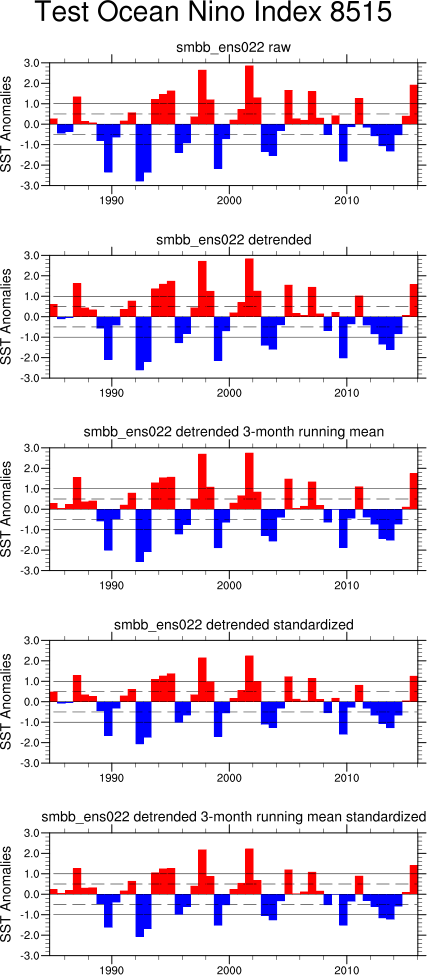
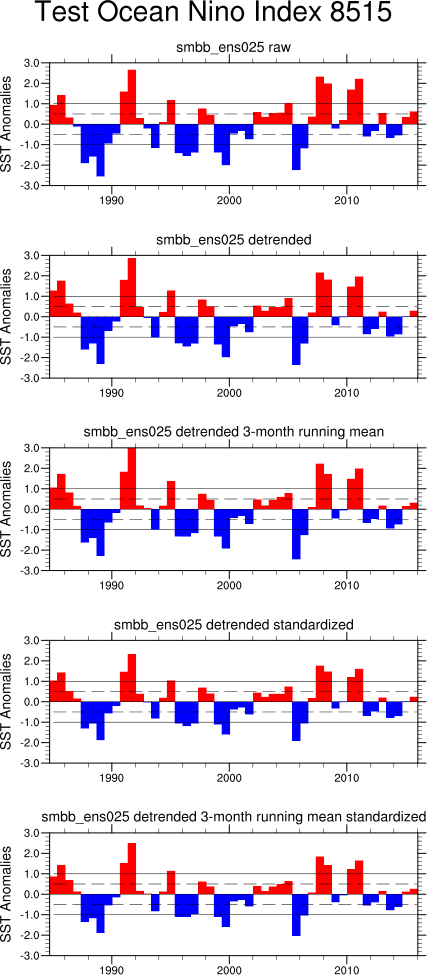
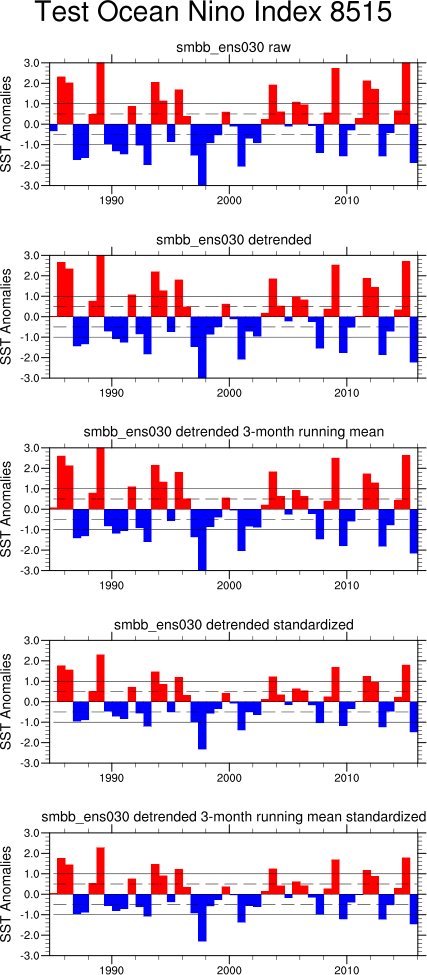
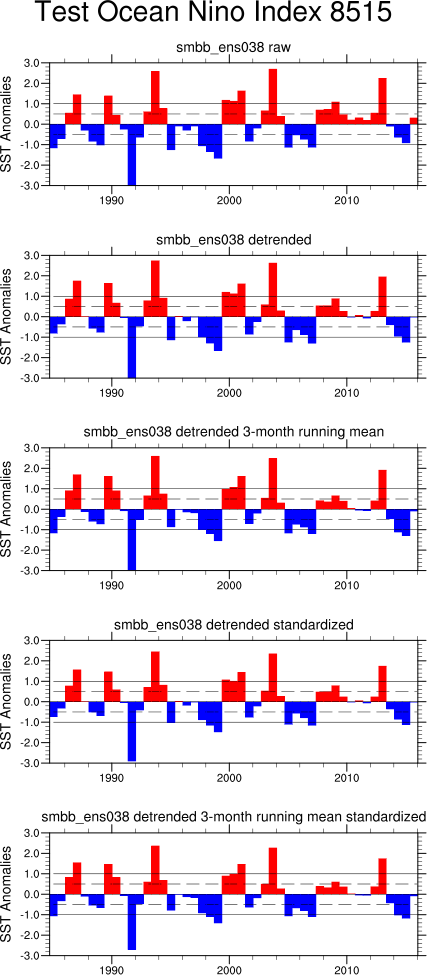
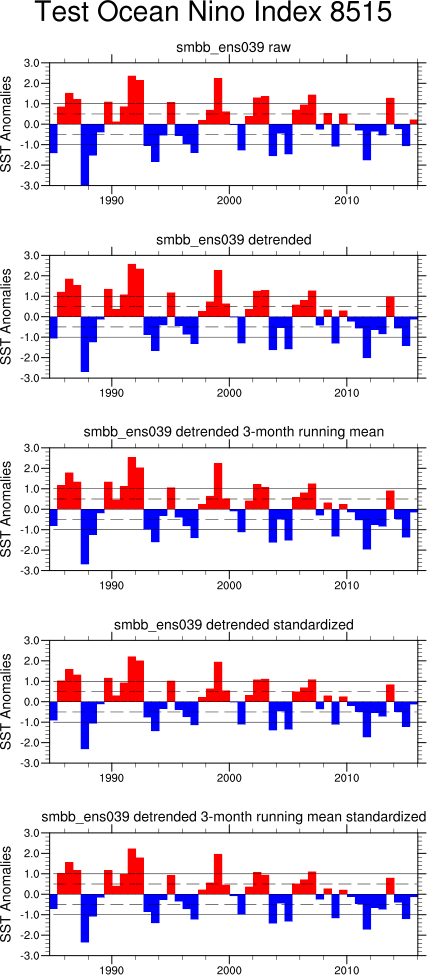
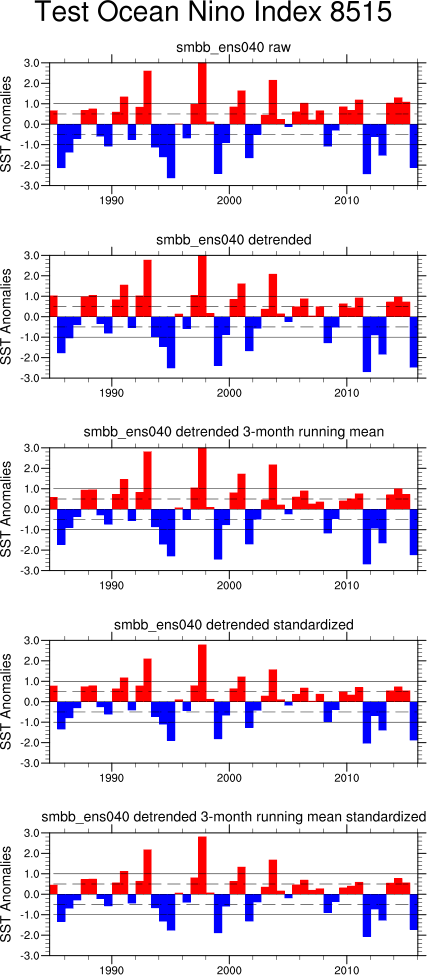
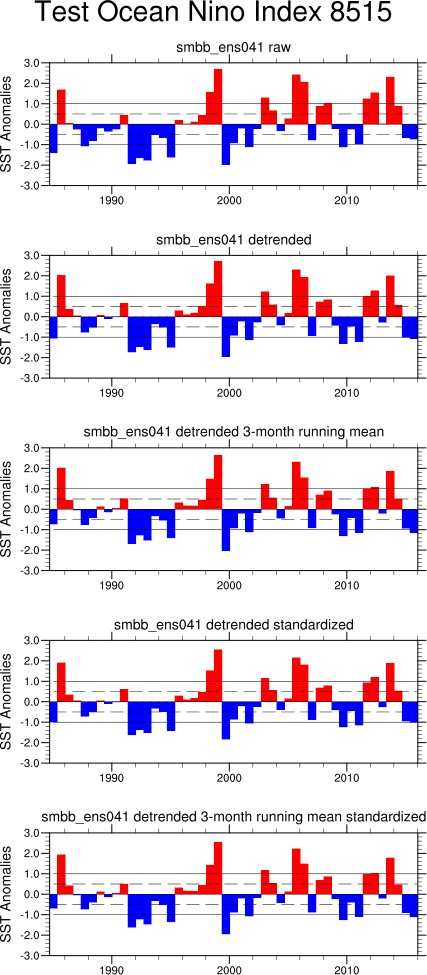
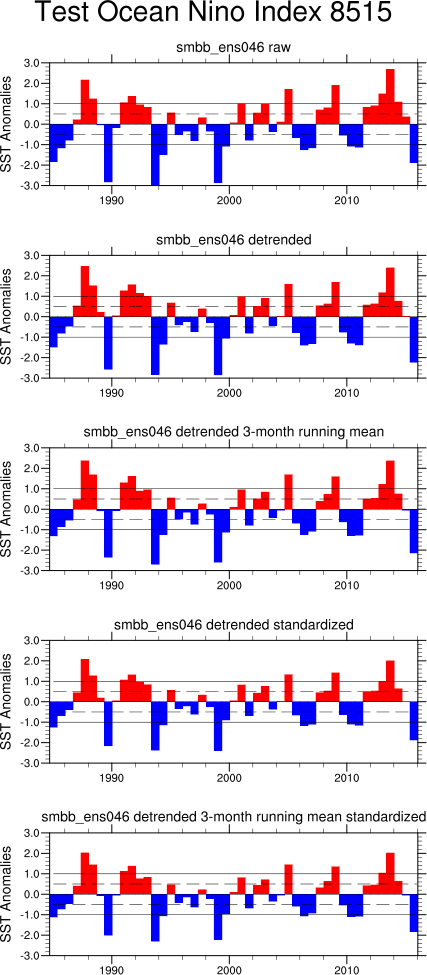
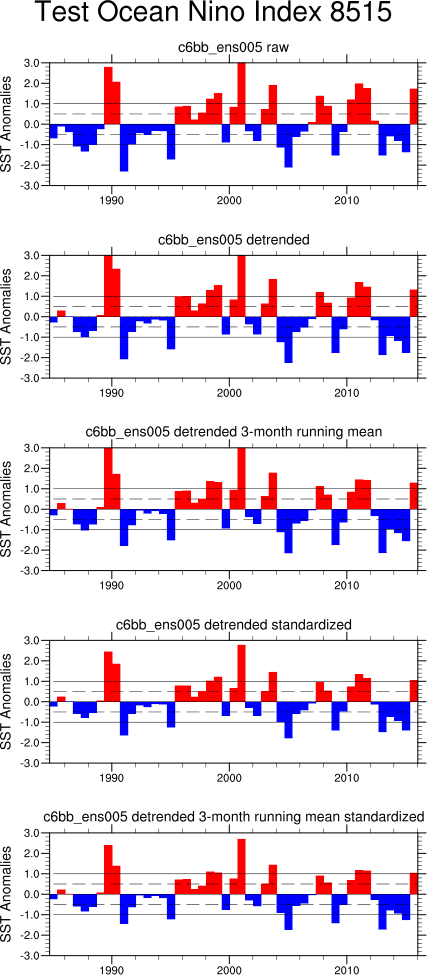
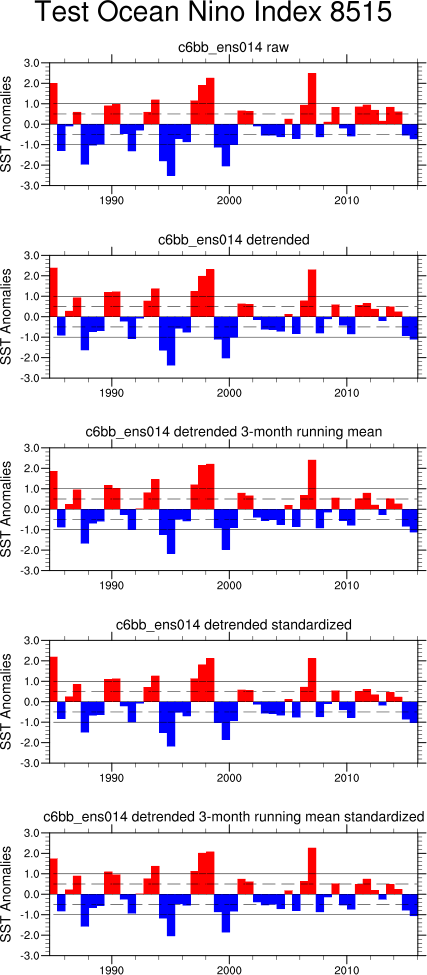
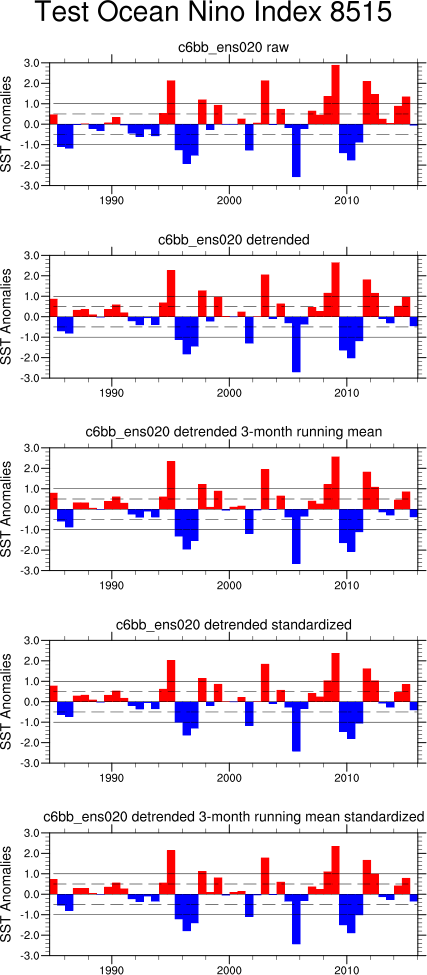
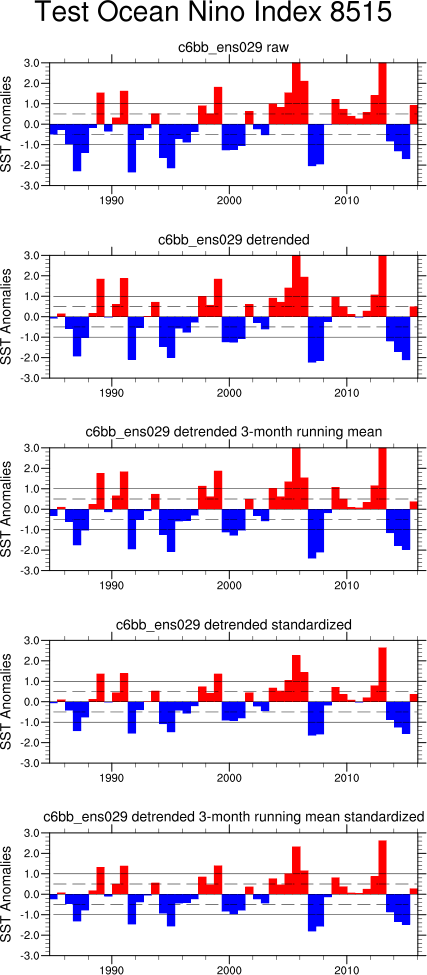
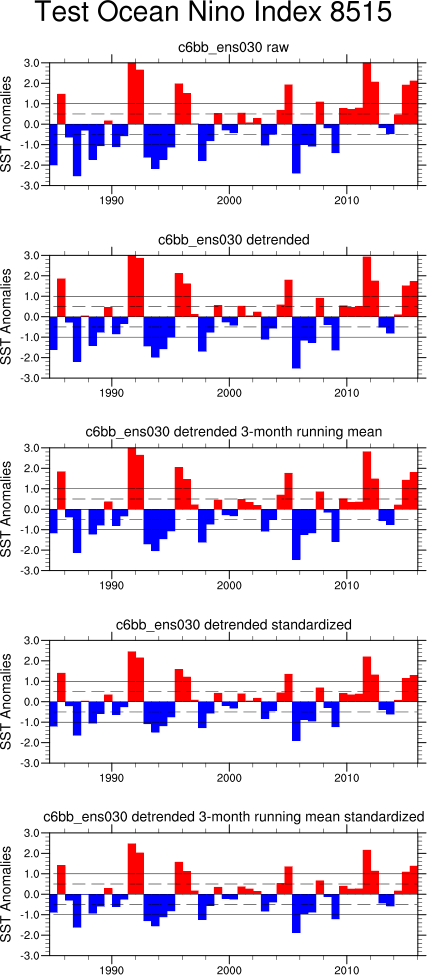
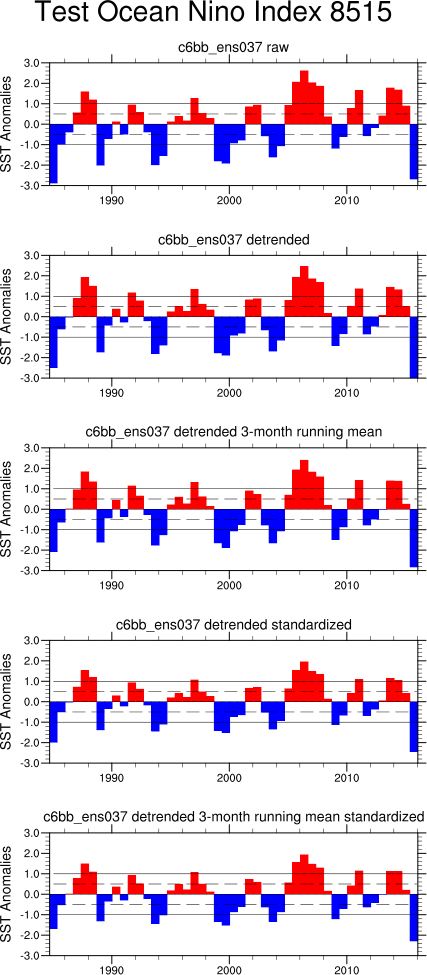
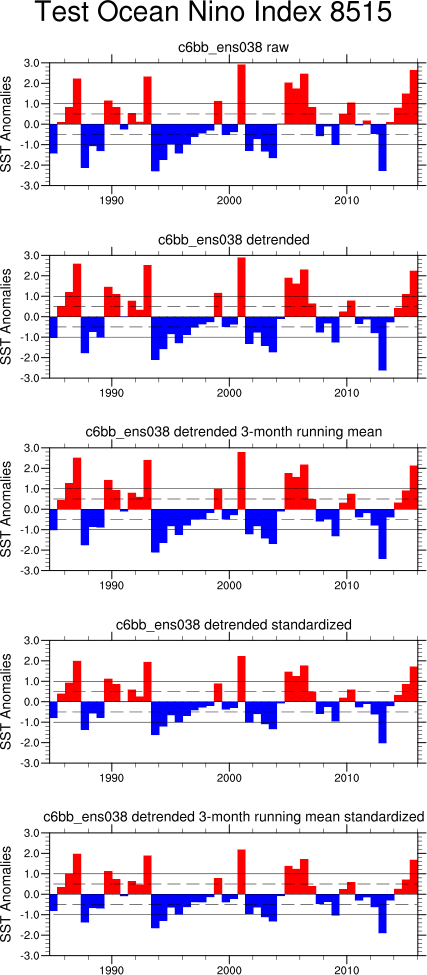
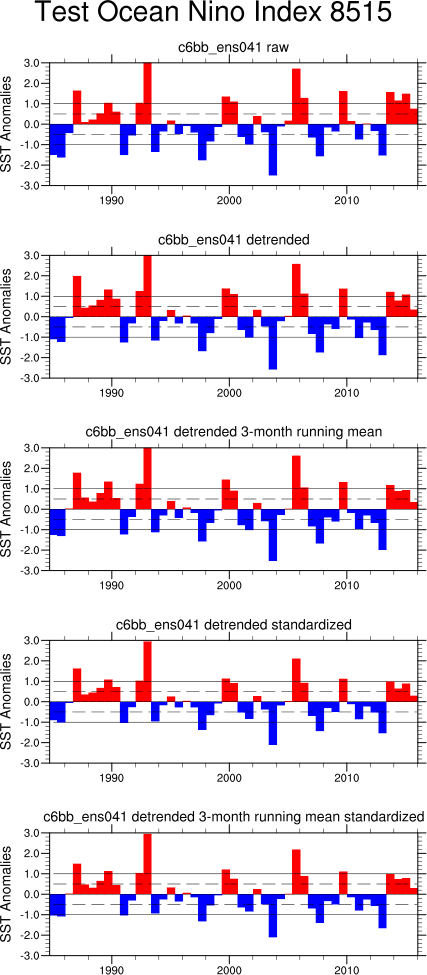
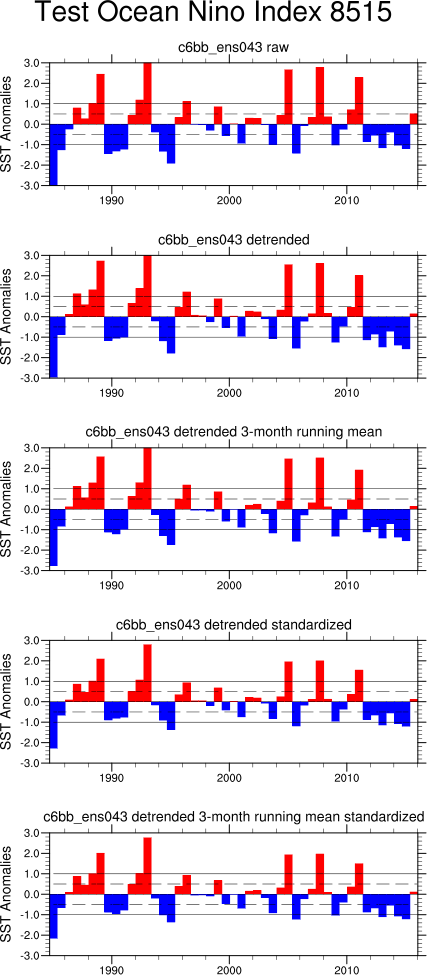
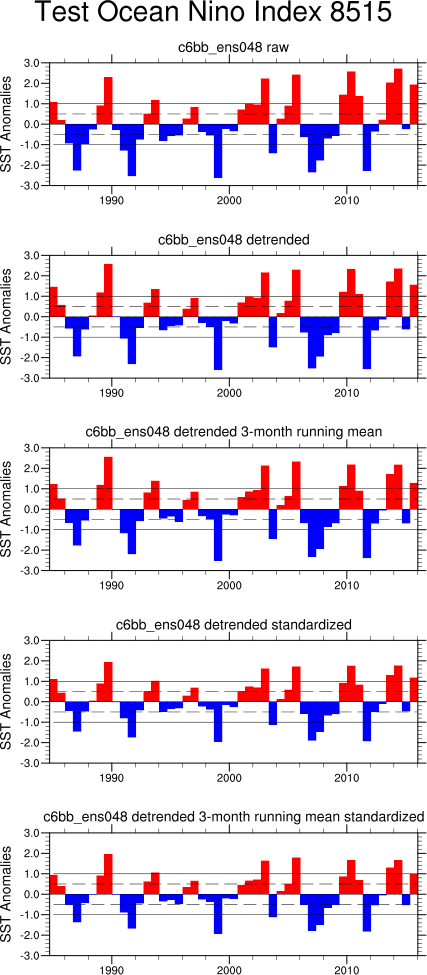
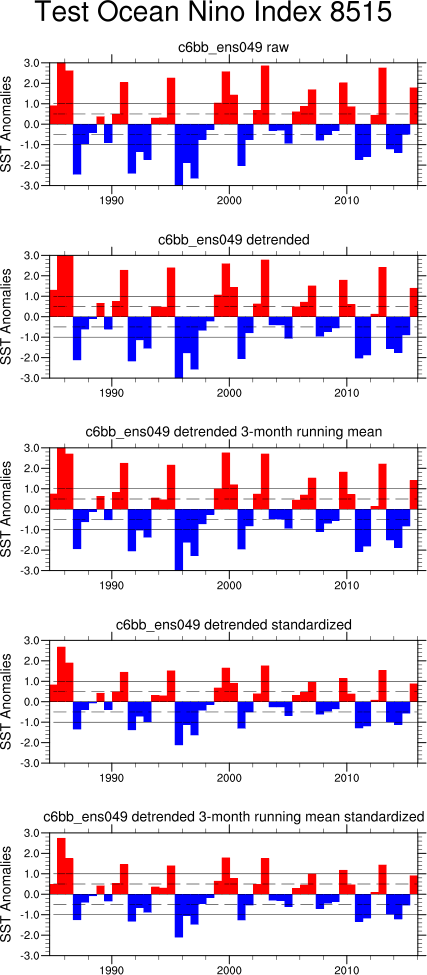
Testing Ocean Nino Index Calculations

The Climate Prediction Center has a very nice Ocean Nino Index webpage: here.
Calculations done using CESM2 LENS data
All runs:
Monthly surface temperature anomalies area-averaged over Nino 3.4 region

Detrended monthly surface temperature, then anomalies area-averaged over Nino 3.4 region


Detrended monthly surface temperature, then anomalies area-averaged over Nino 3.4 region, then 3-month running mean


Detrended monthly surface temperature, then anomalies area-averaged over Nino 3.4 region, then standardized by standard deviation


Detrended monthly surface temperature, then anomalies area-averaged over Nino 3.4 region, then 3-month running mean, then standardized by standard deviation


Sample run ONI results for all months:


All run ONI results for all months:
1985-2015:


2070-2100 for all months: