Change in the Frequency of U.S. Multi-Day Temperature Extremes
Jump to region map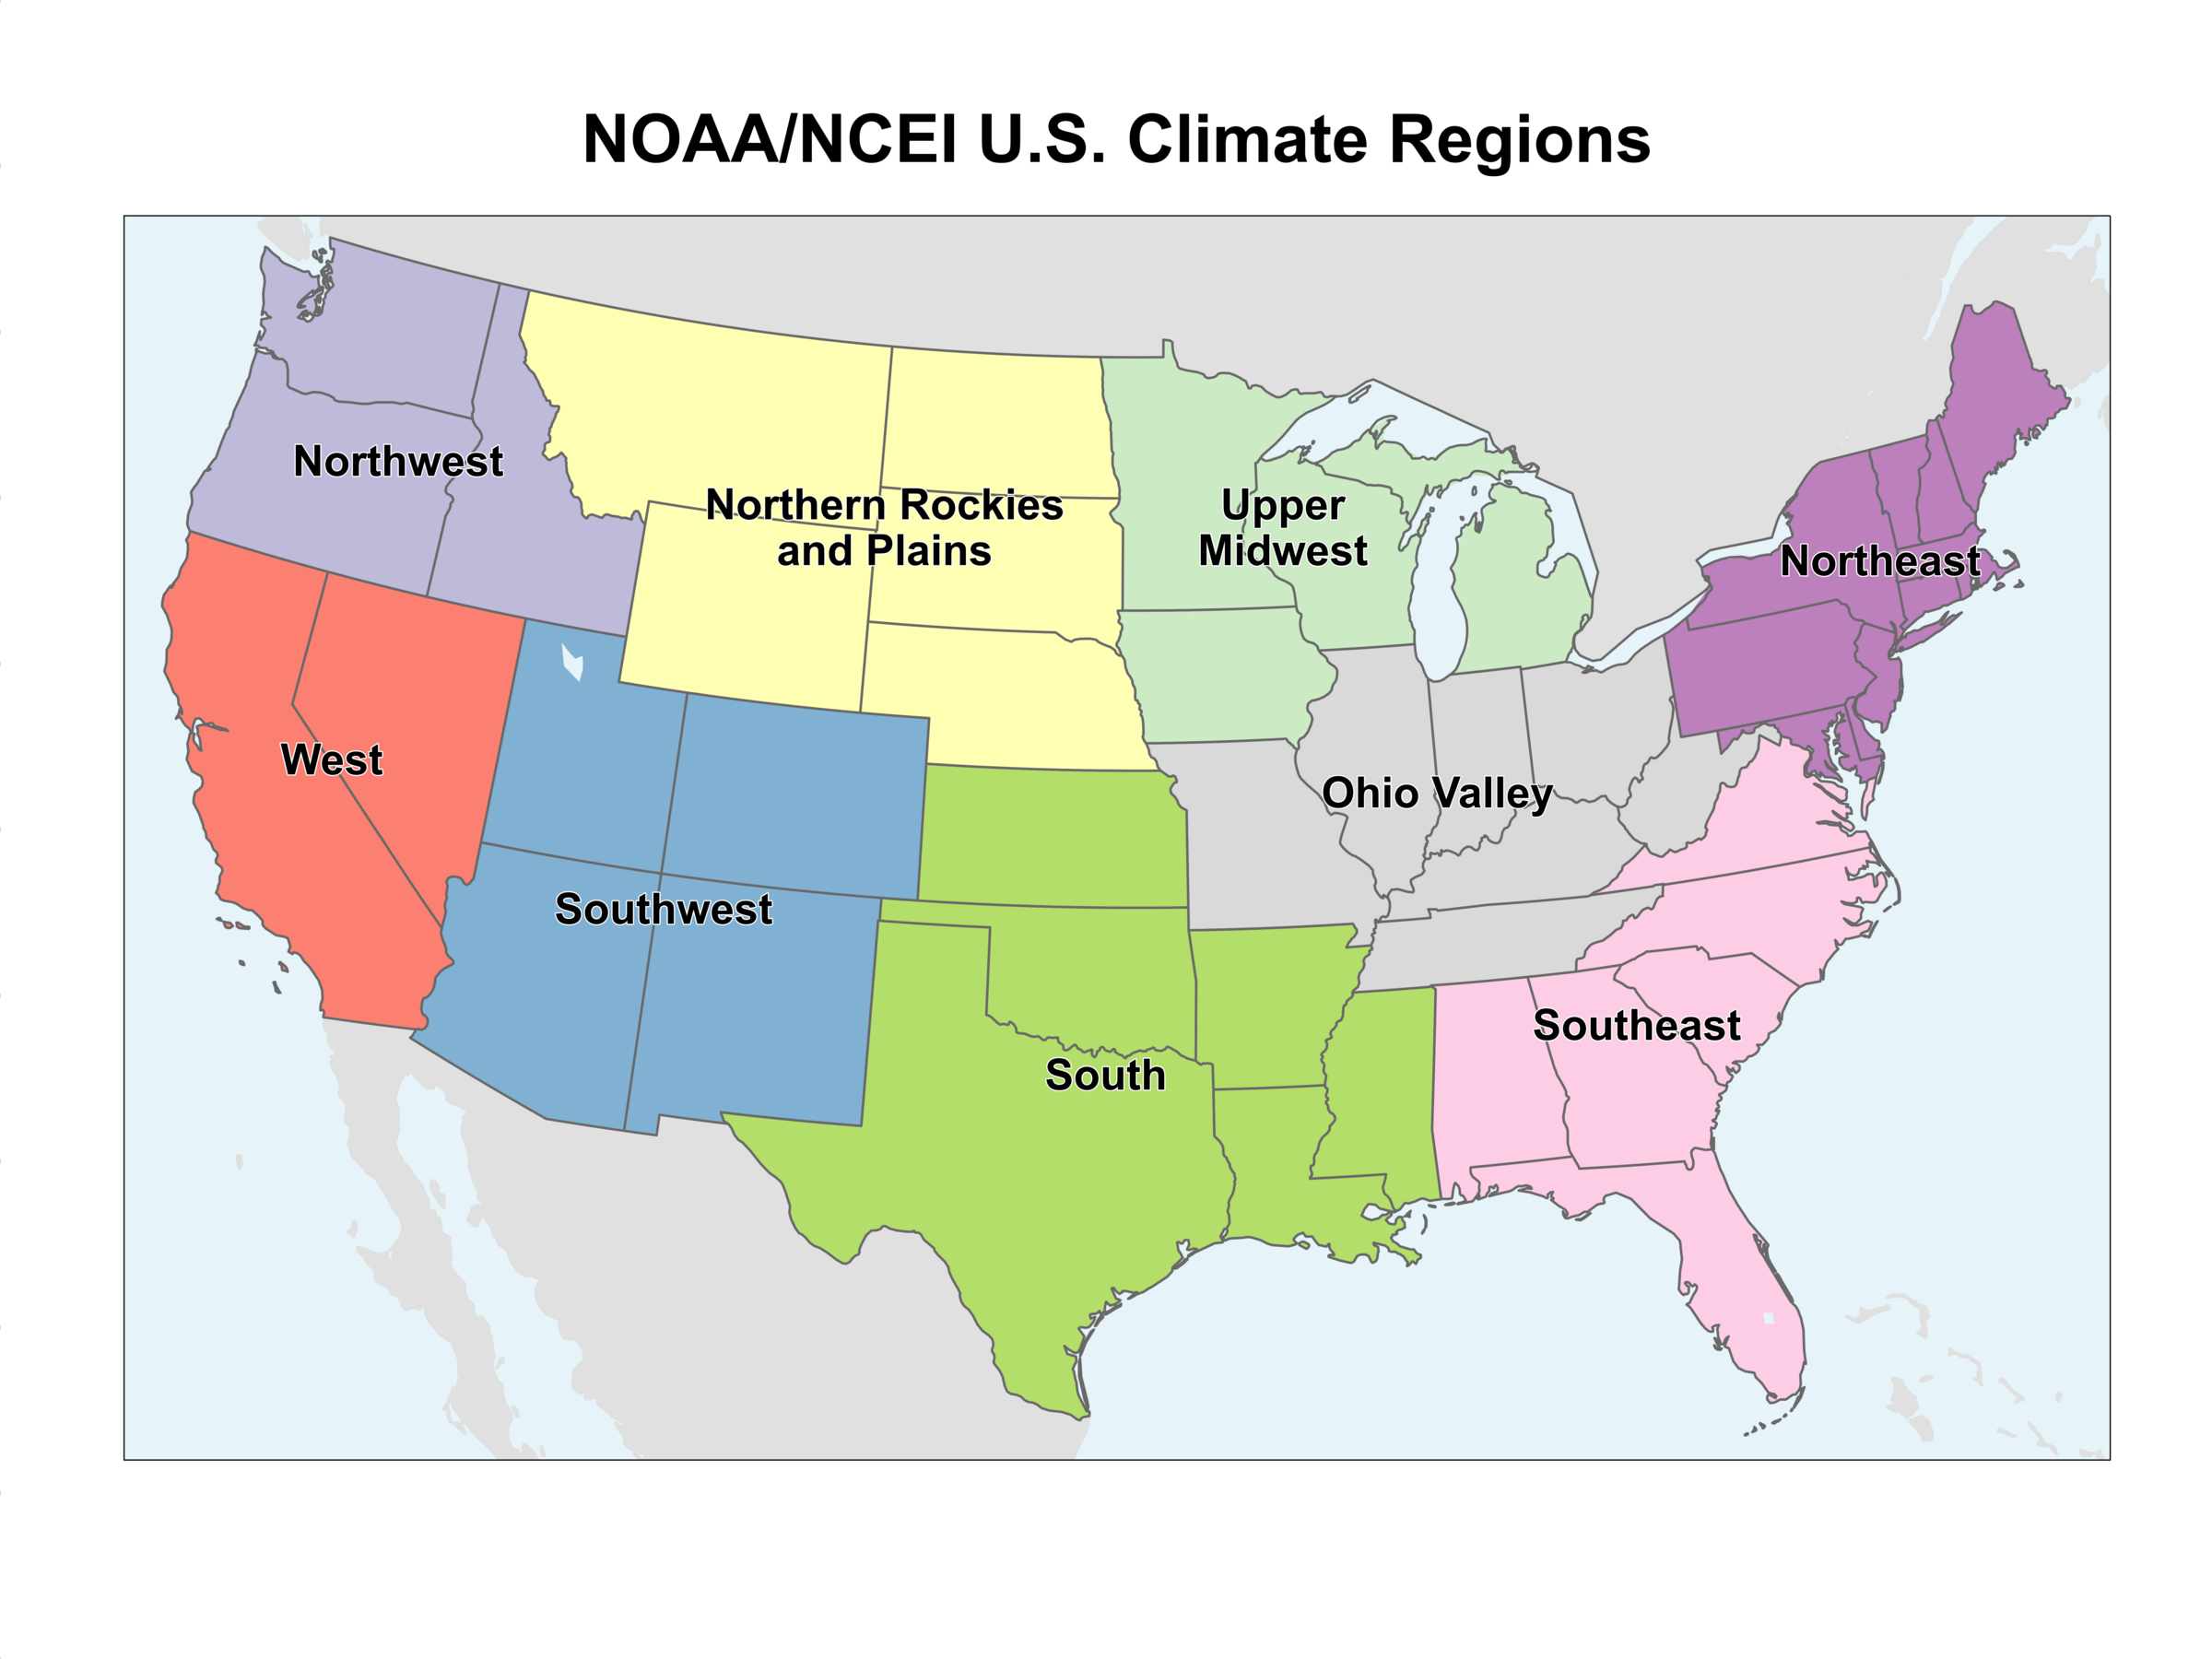
Graphs show the frequency of daily maximum, minimum, and average temperature exceeding a threshold value for consecutive days. The average frequency for a recent historical period (2001-2020) is compared to a an earlier reference time period (1981-2000), for observational (NCEI NClimGrid-Daily [2]) and the GFDL SPEAR climate model ensemble of 30 members [3]. A third set is included where a recent simulation, using the NCAR CAM5 atmosphere/land model is compared to a "counterfactual" reference simulation where long-term trends in ocean temperatures, sea ice, and greenhouse gases has been removed [3]. These are denoted PSL-CAM5 [4] with an ensemble size of 40 runs.
Shading indicates the frequency of temperature exceeding the 90th, 95th, and 99th percentiles (percentiles are determined from all days) for N consecutive days or longer during the reference period. Lines indicate the frequency of exceeding the thresholds in the recent period, where the thresholds are determined from the reference period. The reference-period percentile values are noted in the legend as well as the change from the reference period to the recent period.
Regional results are available for the nine United States climate regions as defined by the NOAA National Centers for Environmental Information [1], and for Continental US states and the District of Columbia. Temperatures were averaged over all grid points that fall in each region. For states that are smaller than two model gridcells in extent a buffer zone has been added in order to sample an adequate number of model gridcells. Analysis for specific heat events will be added when analysis is complete.
Data Sources
Map
| Click for larger view |
|
|
Any comments, suggestions or questions on this page are welcome and should be sent to psl.data@noaa.gov
This is a Research and Development Application