Recreating the Great California Flood of 1862 — A Case Study
Background
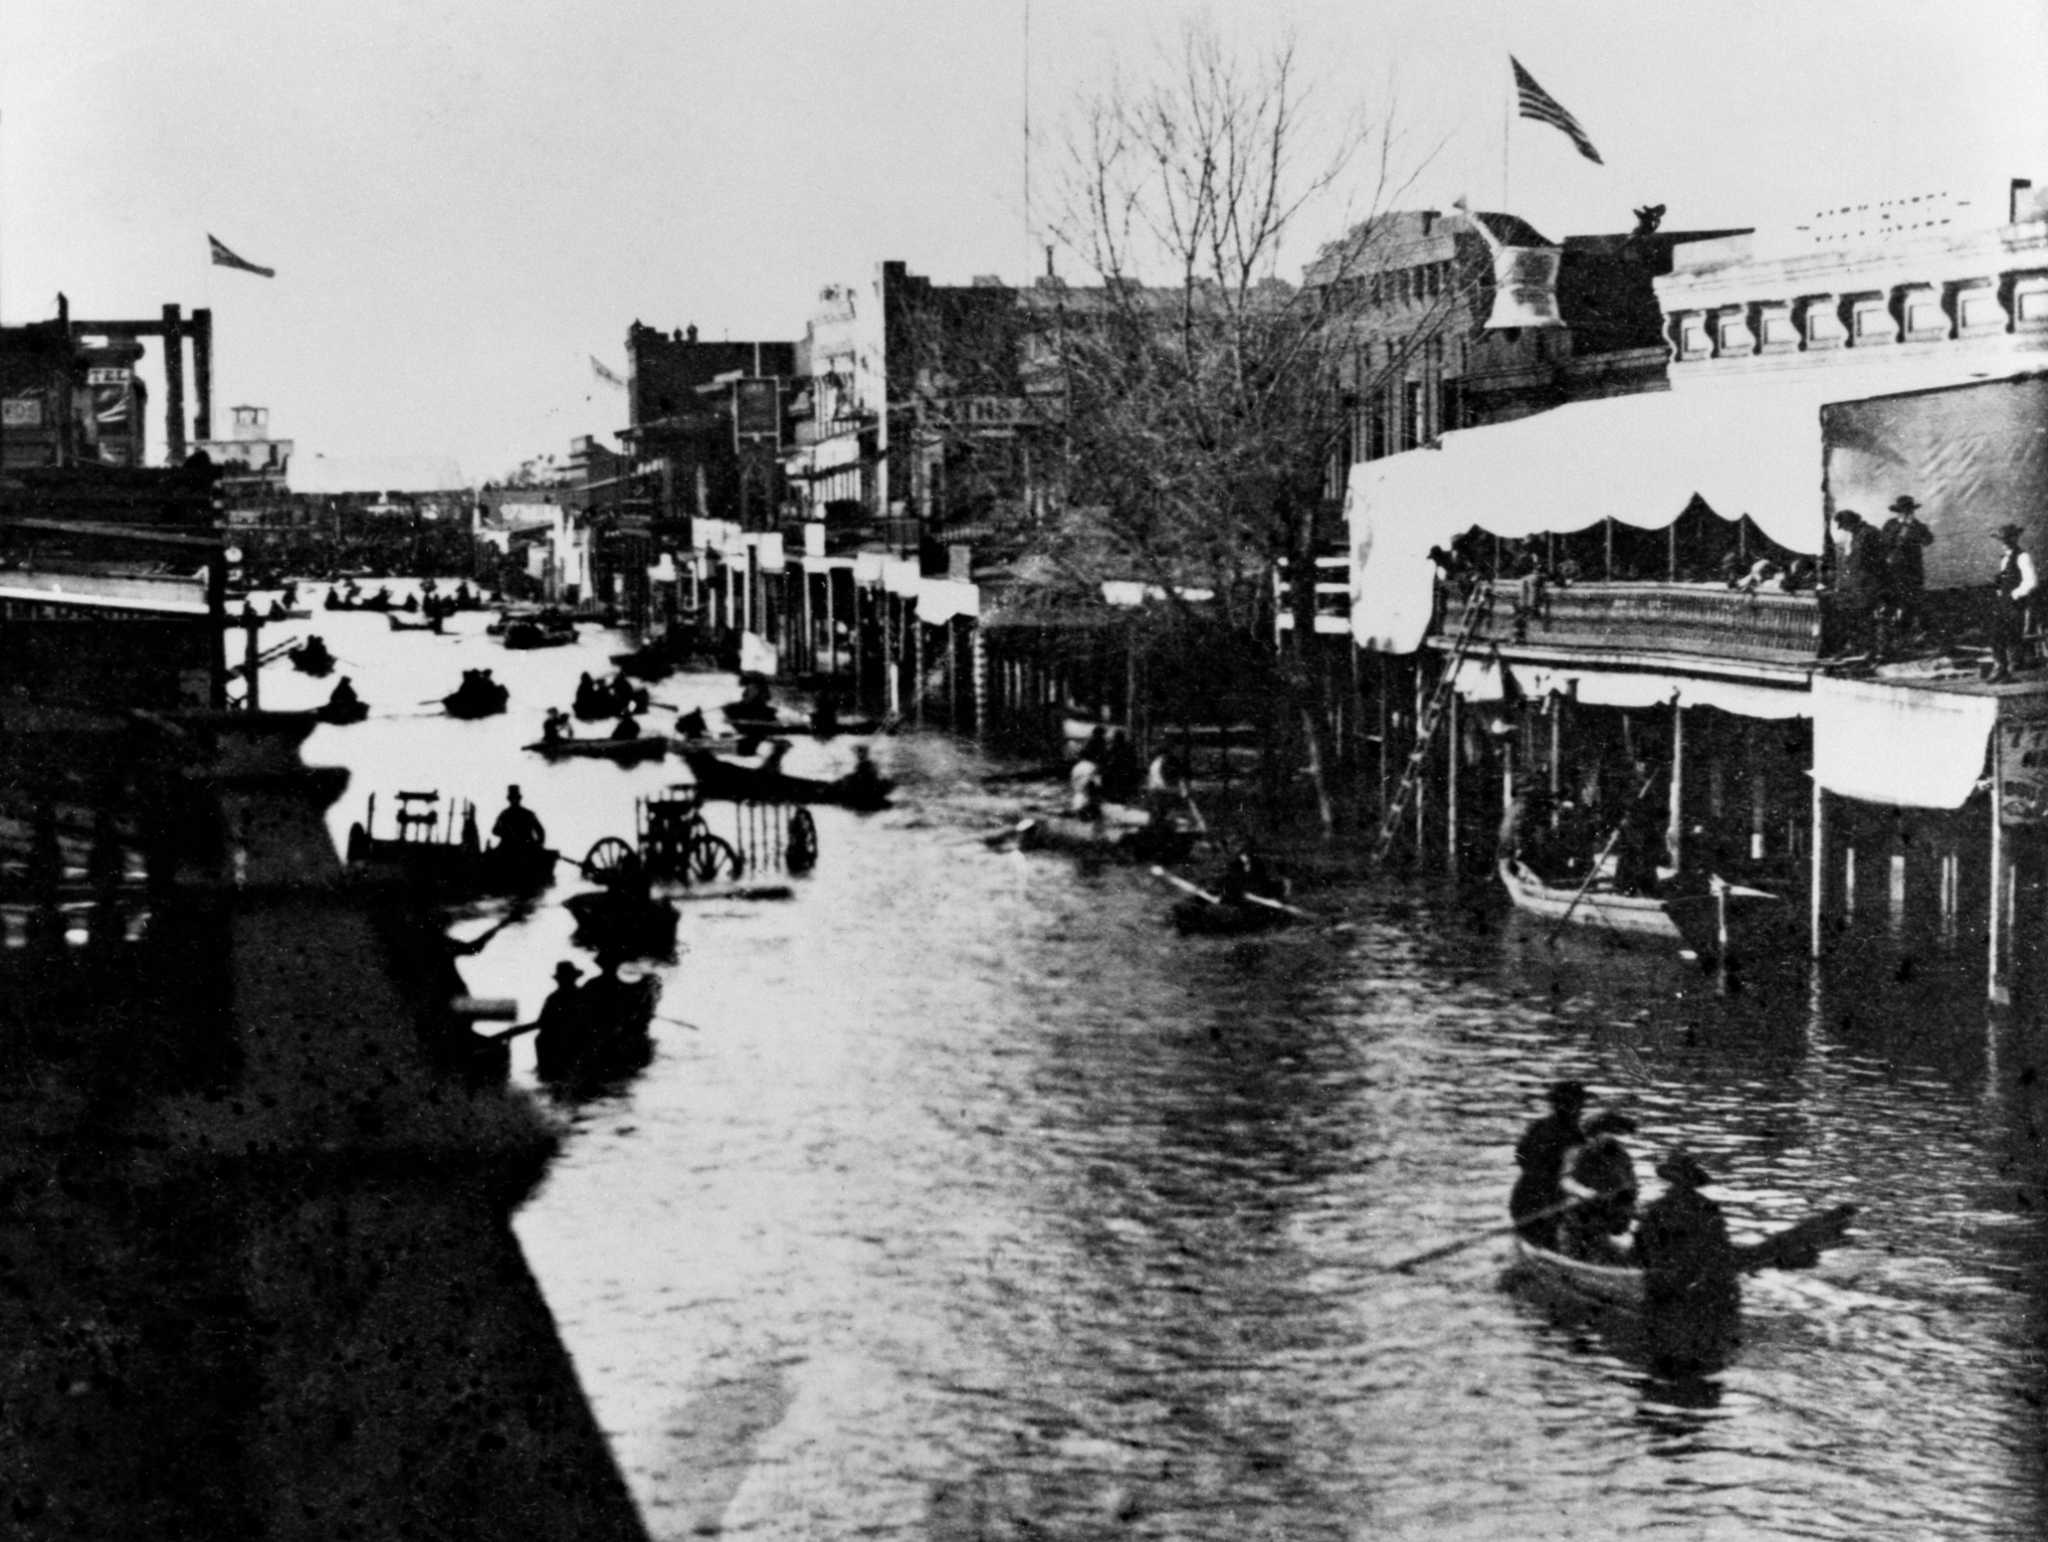
9 December 1861 – 20 January 1862 — The Great Flood of 1862 dropped a record-setting amount of rain along the U.S. West Coast from December 1861 through January 1862. While the flooding affected Washington and Oregon, California was hit especially hard. San Francisco and Sacramento, CA recorded 34 and 37 inches of rain respectively over the course of two months. The flooding was exacerbated by warm rainfall in the mountains, causing significant snow melt to flow into communities. Sacramento's streets and sidewalks were under water, and farms within the Central Valley were completely flooded. This prompted Sacramento to improve their levee system and begin a significant effort to raise the city above flood level. Ultimately, the floods were estimated to have cost at least 4,000 lives and $50-100 million (approximately $3 billion today). Recently, scientists have hypothesized that these floods were not due to an El Niño event, but rather the result of several atmospheric rivers repeatedly aiming at California.(References: Wikipedia and "California Washed Away: The Great Flood of 1862")
Reconstruction of Conditions
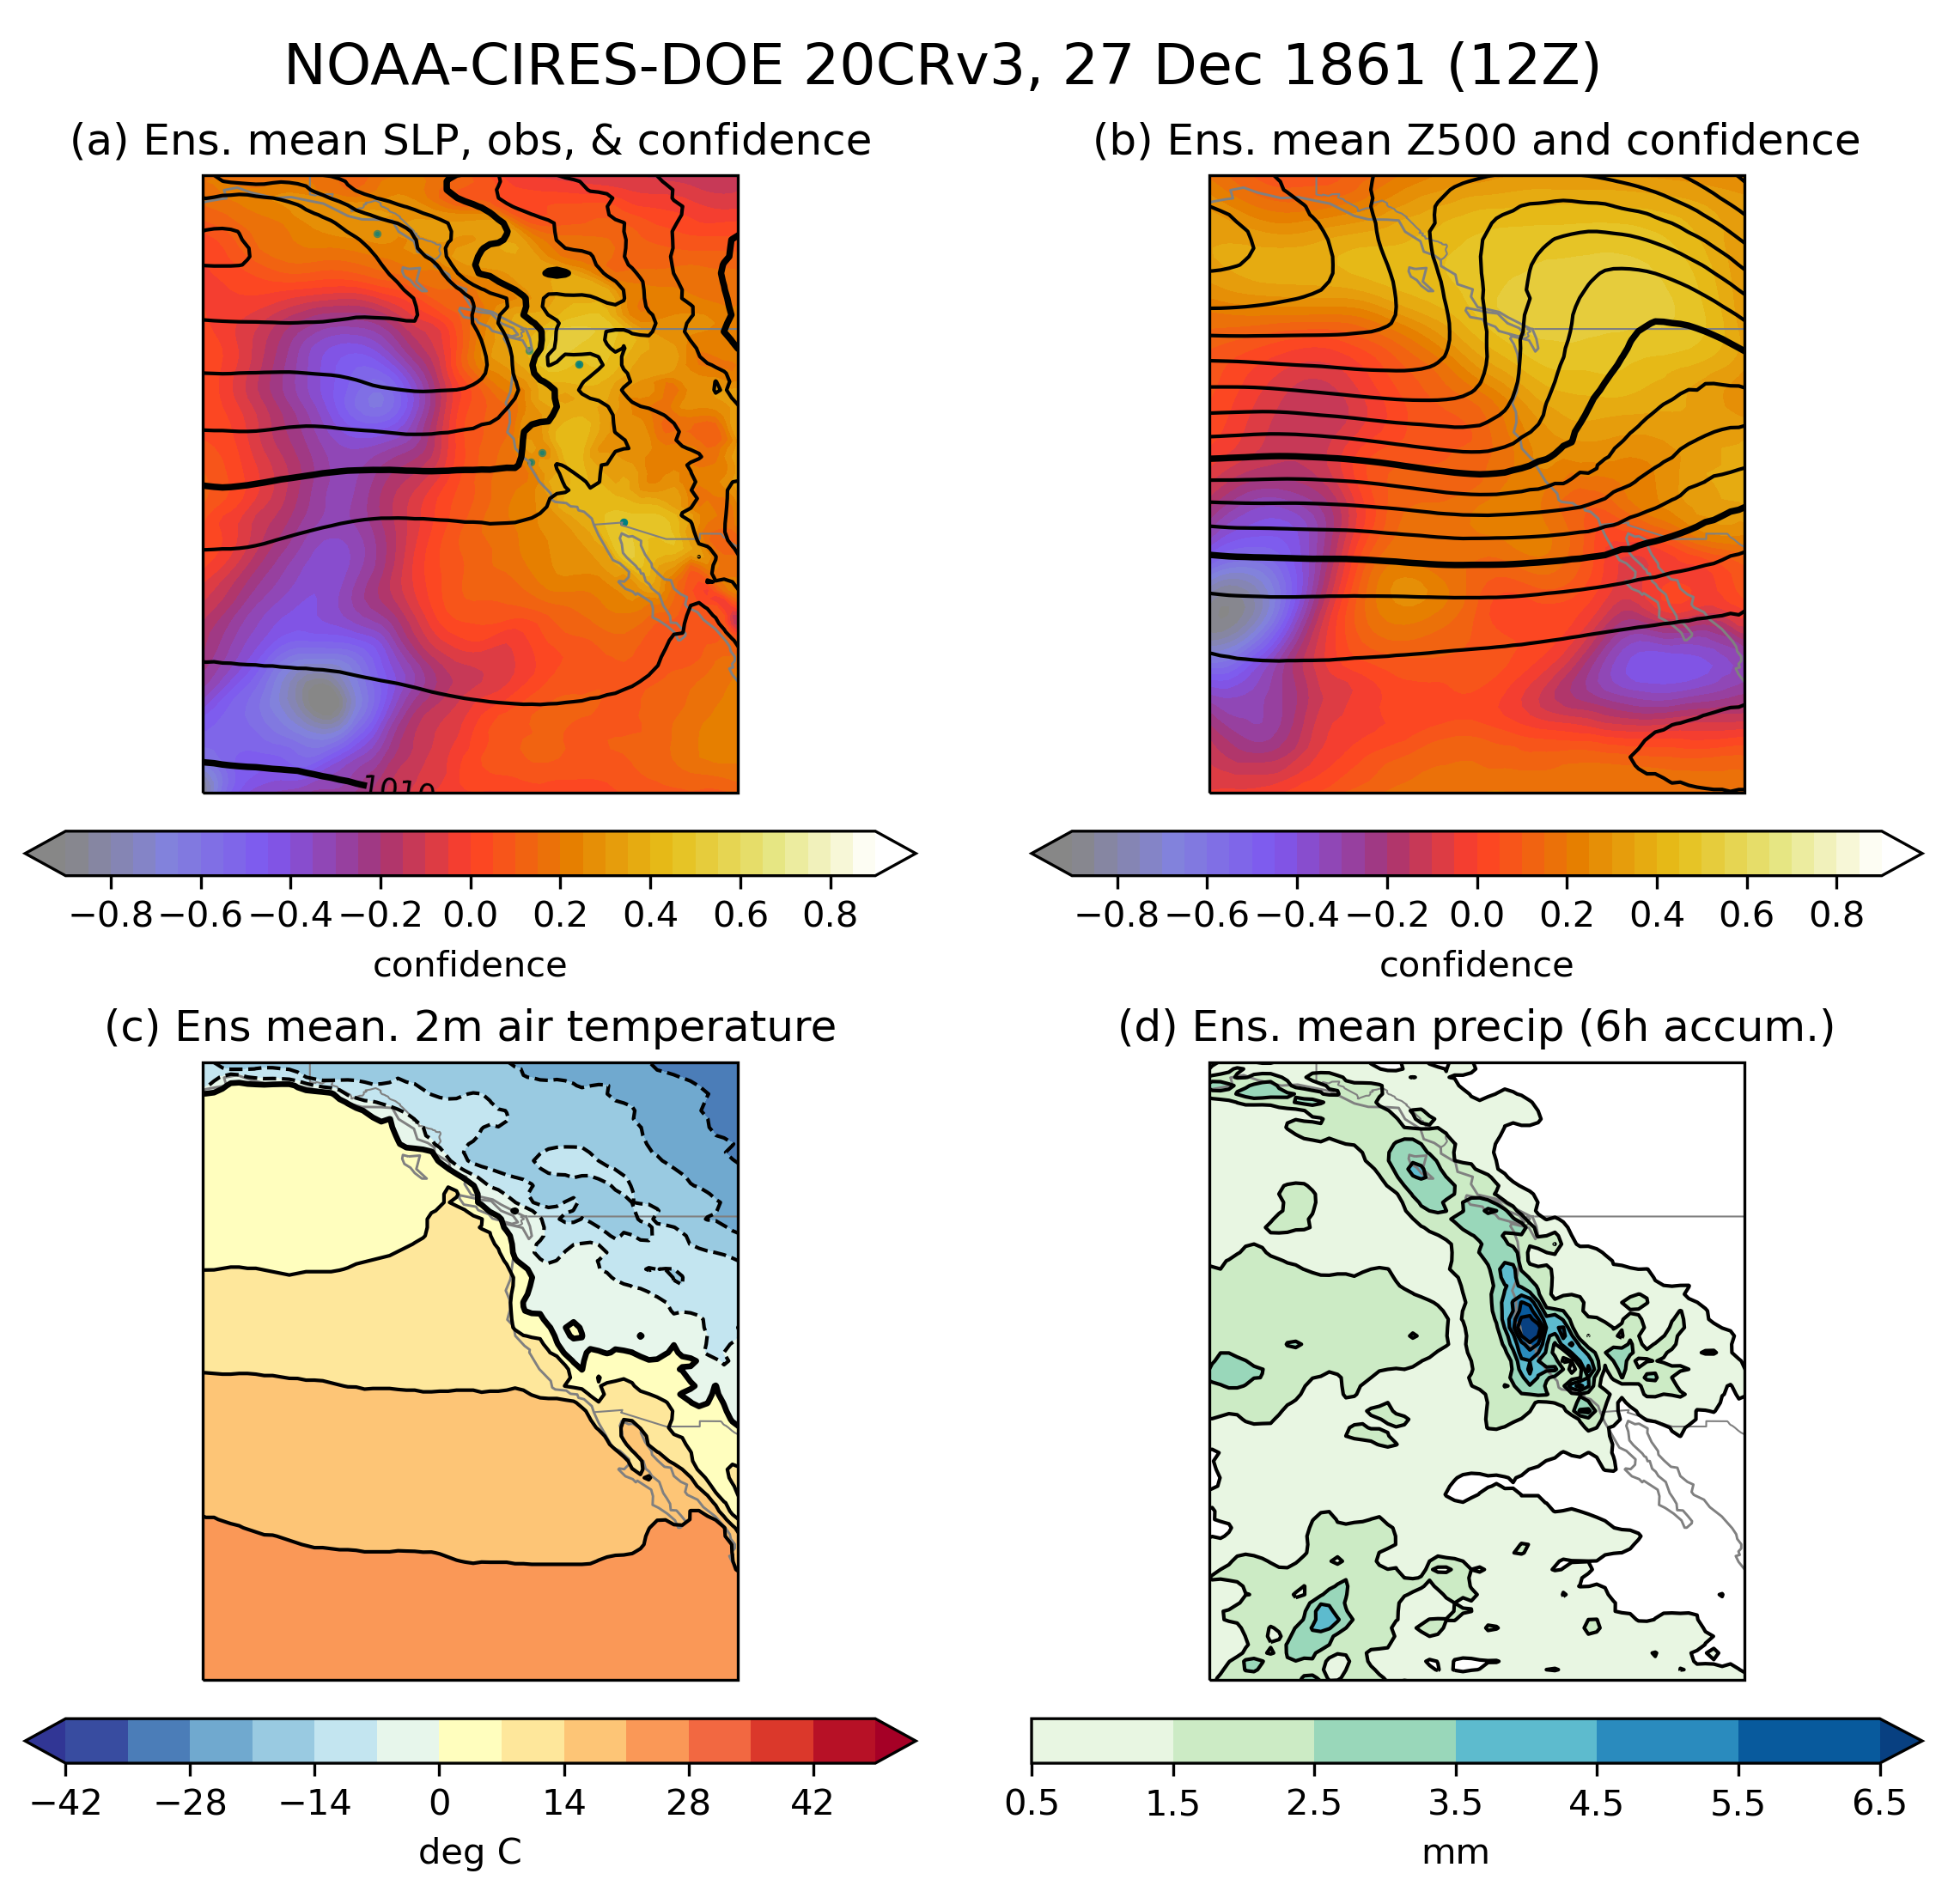
This four-panel plot shows weather conditions during the Great Flood of 1862, as reconstructed by the NOAA-CIRES-DOE 20th Century Reanalysis Version 3. Panel (a) includes the best estimate of sea level pressure (contours), observation locations (filled circles), and sea level pressure confidence (shading); Panel (b) includes the best estimate for geopotential heights at 500 hPa (a variable commonly used by forecasters to understand large-scale weather patterns) and its confidence field; Panel (c) shows the best estimate for 2m air temperatures; and Panel (d) shows the best estimate for precipitation accumulated over 6 hours prior to 12Z (4am PST) on 27 December 1861. “Confidence” measures uncertainty in the best estimate: smaller values refer to less confidence (more uncertainty) and higher values refer to more confidence (less uncertainty). (See doi:10.1002/qj.3598 for more details.)
Click plot to enlarge
PSL Animations from 20CRV3 Dataset 9 Dec 1861 to 21 Jan 1862
Precipitable Water Accumulated PrecipitationRelated Links
- The weather of 1861 and 1862 in 20CR version 3 (Credit: Philip Brohan, UK Met Office)