Burned areas from fires in the US by Region
Monthly time-series of area burned by fires in the US for 1984-2022.

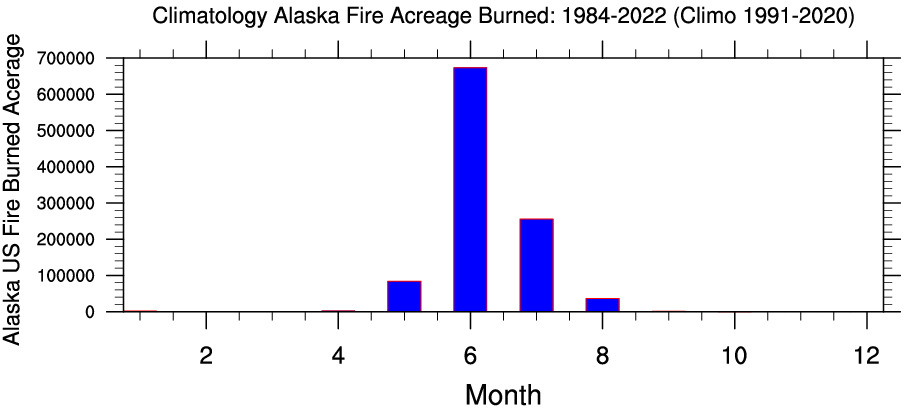
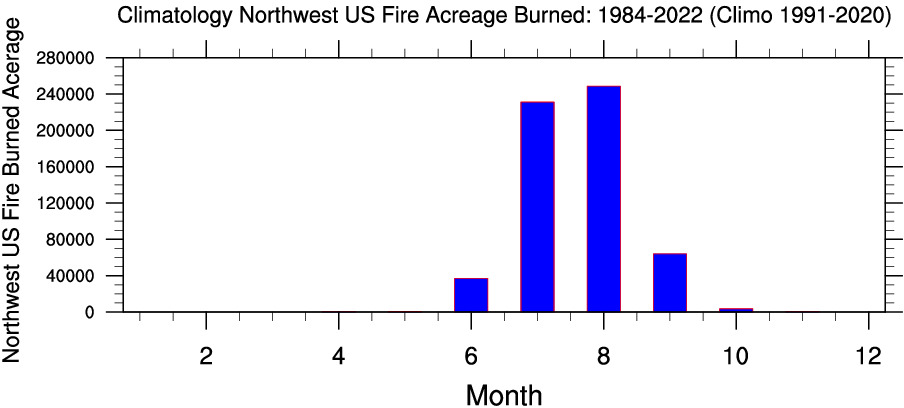
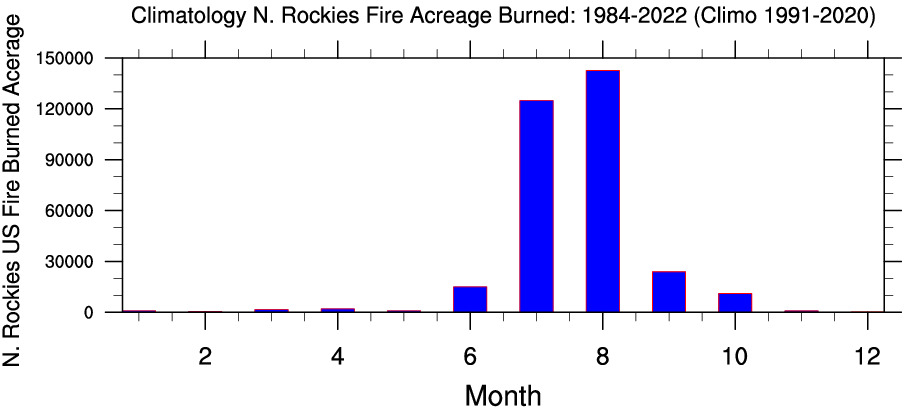
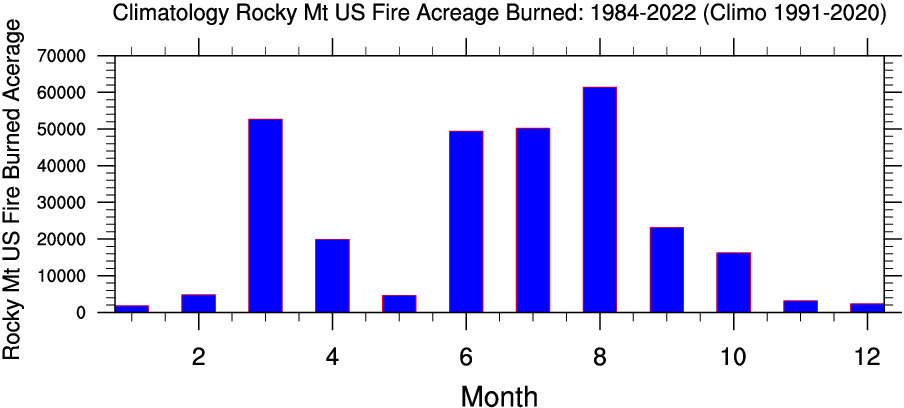
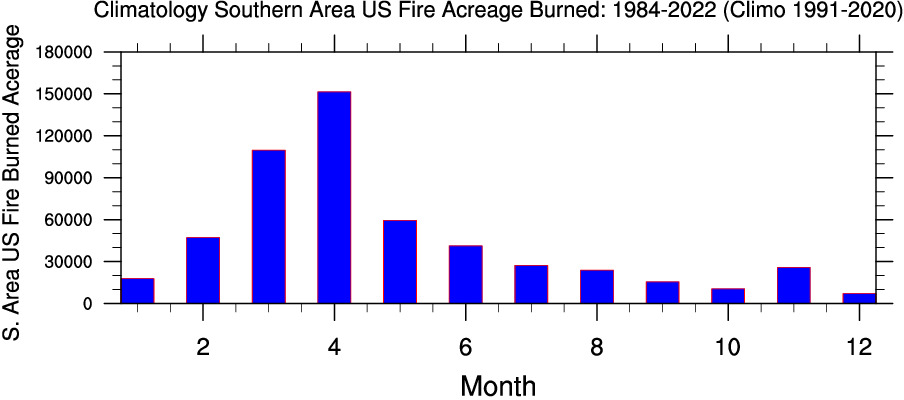
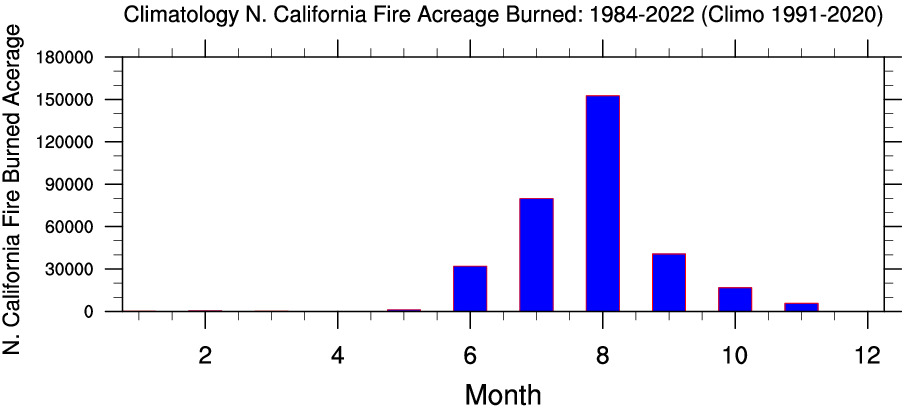
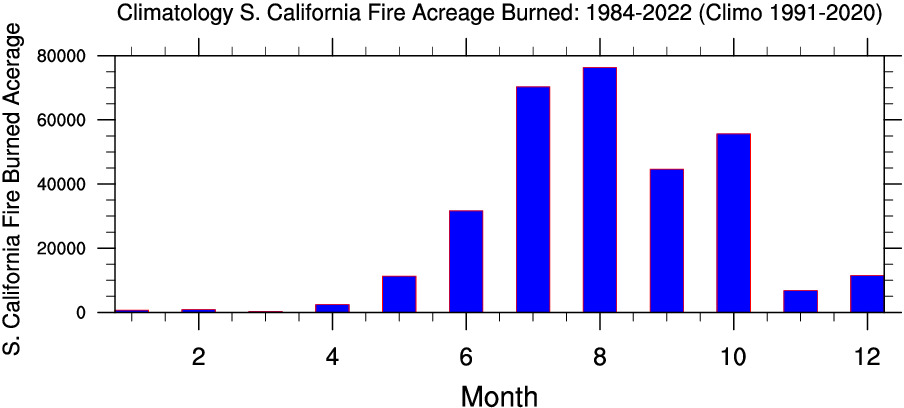
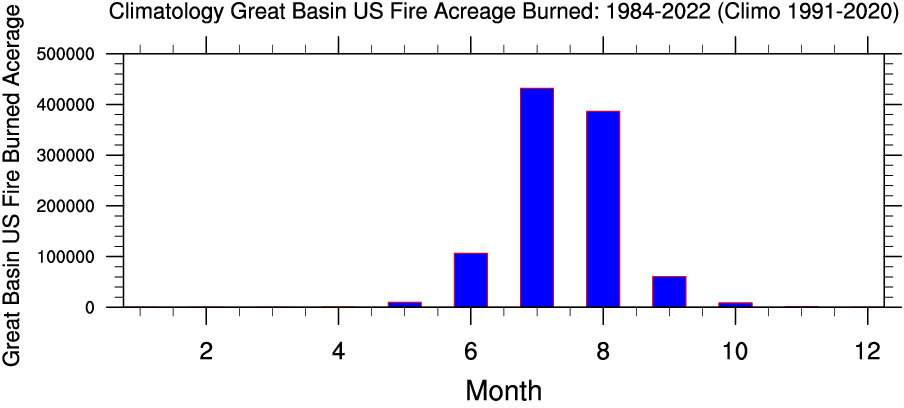
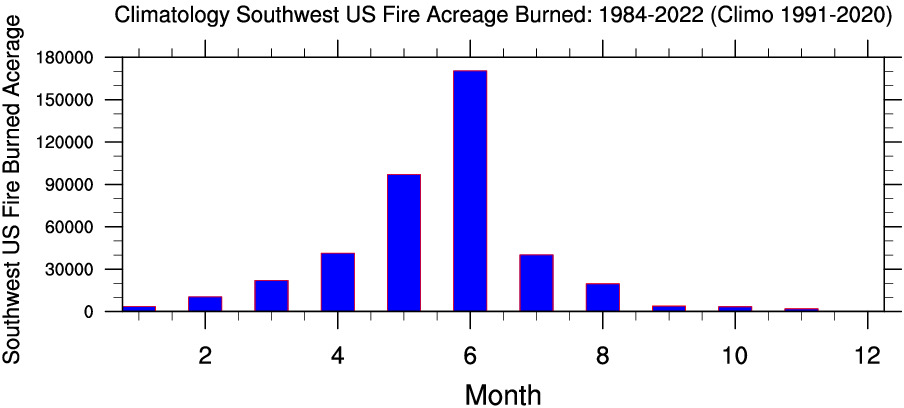
Annual cycles
Alaska
Northwest
Eastern Area

Northern Rockies
Rocky Mountains
Southern Area
Northern California
Southern California
Great Basin
Southwest
Description
- The timeseries are area averaged monthly burned areas for 10 divisions in the US. They are derived from the Monitoring Trends in Burn Severity (MTBS) dataset.
- Values are from 1984 to 2022. Units are total acreage.
- Publication: A Project for Monitoring Trends in Burn Severity: Eidenshink, J., Schwind, B., Brewer, K. et al. A Project for Monitoring Trends in Burn Severity. fire ecol 3, 3–21 (2007). https://doi.org/10.4996/fireecology.0301003
- Citation: Monitoring Trends in Burn Severity Direct Download: Burned Areas Boundaries Dataset. (April 28, 2025 - last revised). MTBS Project (USDA Forest Service/U.S. Geological Survey). Available online: https://www.mtbs.gov/direct-download [October 19, 2024].