Physical Sciences Laboratory
Toggle navigation
About
About Us
Organization At-A-Glance
Research Divisions
Science Reviews
DEIA
Visiting NOAA Boulder
People
Contact Us
Staff List
Employee Spotlight
Research
Research
Overview
Research Divisions
Publications
Assessments
Selected Topics
20th Century Reanalysis
Atmospheric River Portal
El Niño and La Niña
Renewable Energy
Interpreting Climate Conditions
Marine Heatwaves
In the Field
AQPI
ATOMIC
ENRR
MOSAiC
SPLASH
Observations
Arctic Climate
Shipboard
Technology
Data
All
Gridded Climate
Profiler Network Data & Image Library
Research Cruises
Arctic
Satellite
Boulder Climate & Weather
Plotting & Analysis Tools
Help
Products
All
Experimental
Map Room
Plotting & Analysis Tools
Subseasonal Tropical Forecasts
Climate Change Web Portal
20th Century Reanalysis
FACTS
WRIT
News | Events
News
Events
Seminars
Learn
Research Handouts
Education Resources
Funtastic Science Talks
Home
NOAA Climate Change Web Portal
ROMS-CCS Timeseries
NOAA's Climate Change Web Portal
Dynamical Downscaling
ROMS-CCS:
Maps
ROMS-CCS:
Time Series
Select Data to Plot
Variable
Field:
Field: Slide 1
Field: Slide 2
Field: Slide 3
Field: Slide 4
Field: Slide 5
Field: Slide 6
--Select Variable--
Sea Surface Temperature
Sea Surface Salinity
Surface Eddy Kinetic Energy
Isothermal Layer Depth (0.5 degree change from sst)
Buoyancy Frequency (upper 200 m)
Vertical Velocity at 50m
Surface U-Momentum stress
Surface V-Momentum Stress
Surface Momentum Stress Magnitude
Sea Surface Chlorophyll
Integrated 0-50m Chlorophyll
Nitrate at 150m
Dissolved Oxygen at 150m
Bottom Dissolved Oxygen
Hypoxic boundary = Depth of the 1.43ml/l (63.86 mmol/m3)
Model:
--Select Models--
Average Of All Models
GFDL-ESM2M
HadGEM2-ES
IPSL-CM5A-MR
Time Period
Climatology Period:
Season:
Entire Year (ANN)
January-February-March (JFM)
February-March-April (FMA)
March-April-May (MAM)
April-May-June (AMJ)
May-June-July (MJJ)
June-July-August (JJA)
July-August-September (JAS)
August-September-October (ASO)
September-October-November (SON)
October-November-December (OND)
November-December-January (NDJ)
December-January-February (DJF)
Time Average
20 years
10 years
5 years
1 year
Plot Area
CCS Regions:
LME: CCS LME restricted to ROMS domain at 30.5N
N075: North 0-75km from coast
C075: Central 0-75km from coast
S075: South 0-75km from coast
N300: North 75-300km from coast
C300: Central 75-300km from coast
S300: South 75-300km from coast
Click to expand
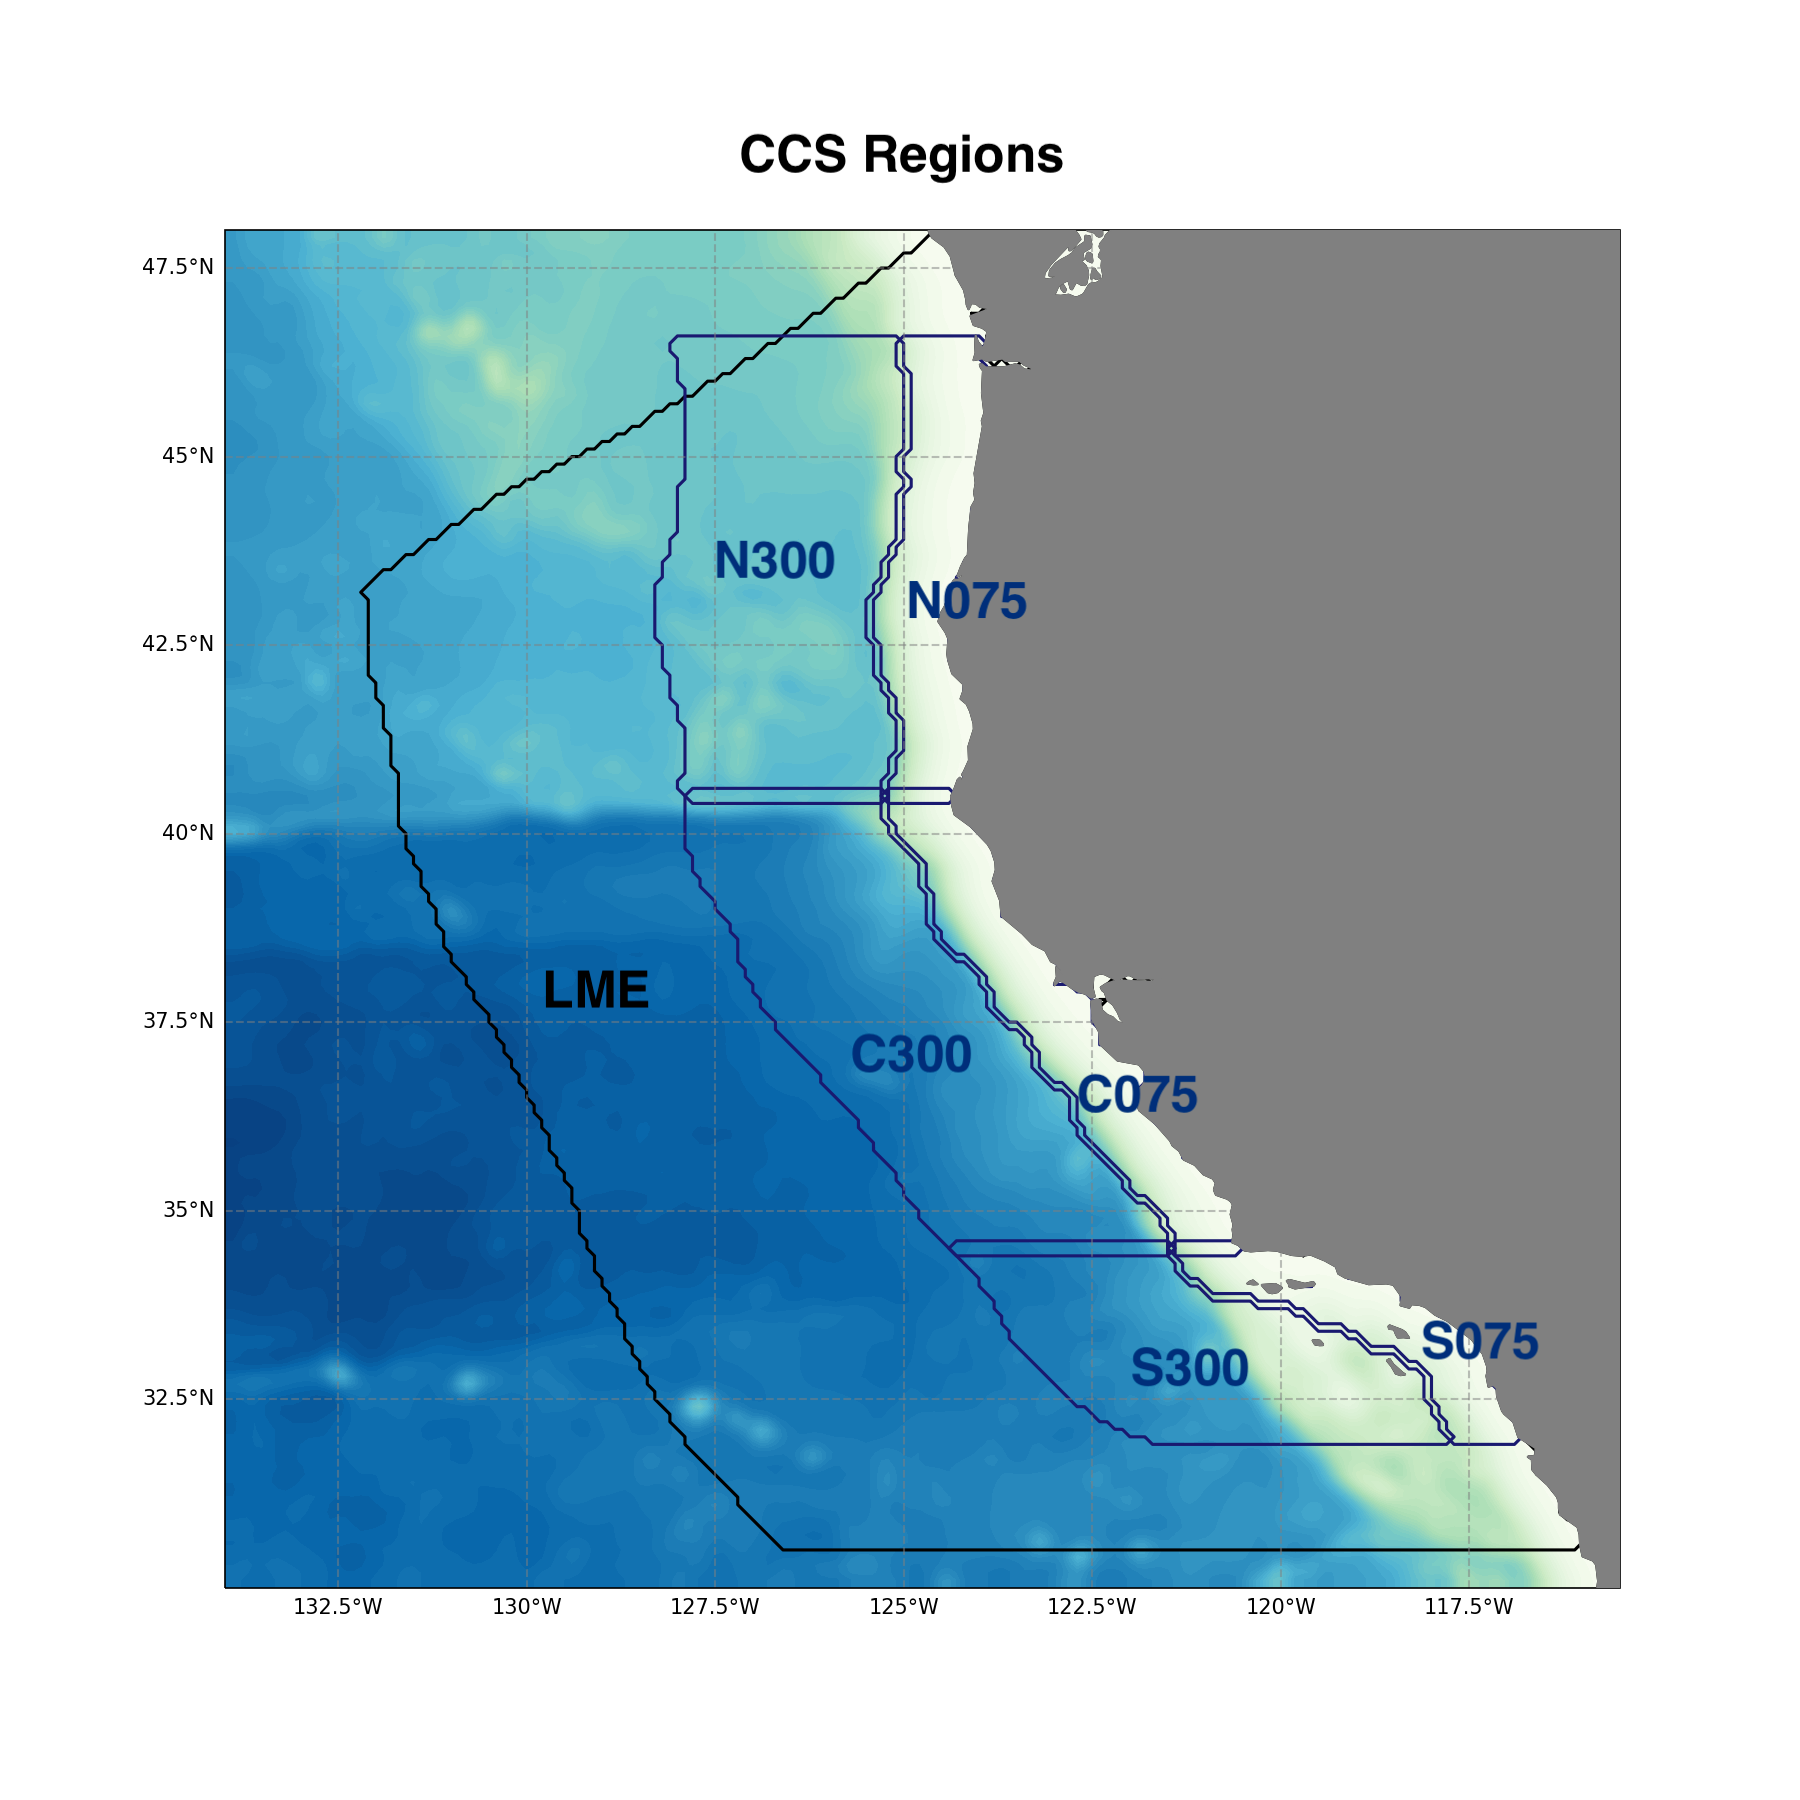
Click image to enlarge
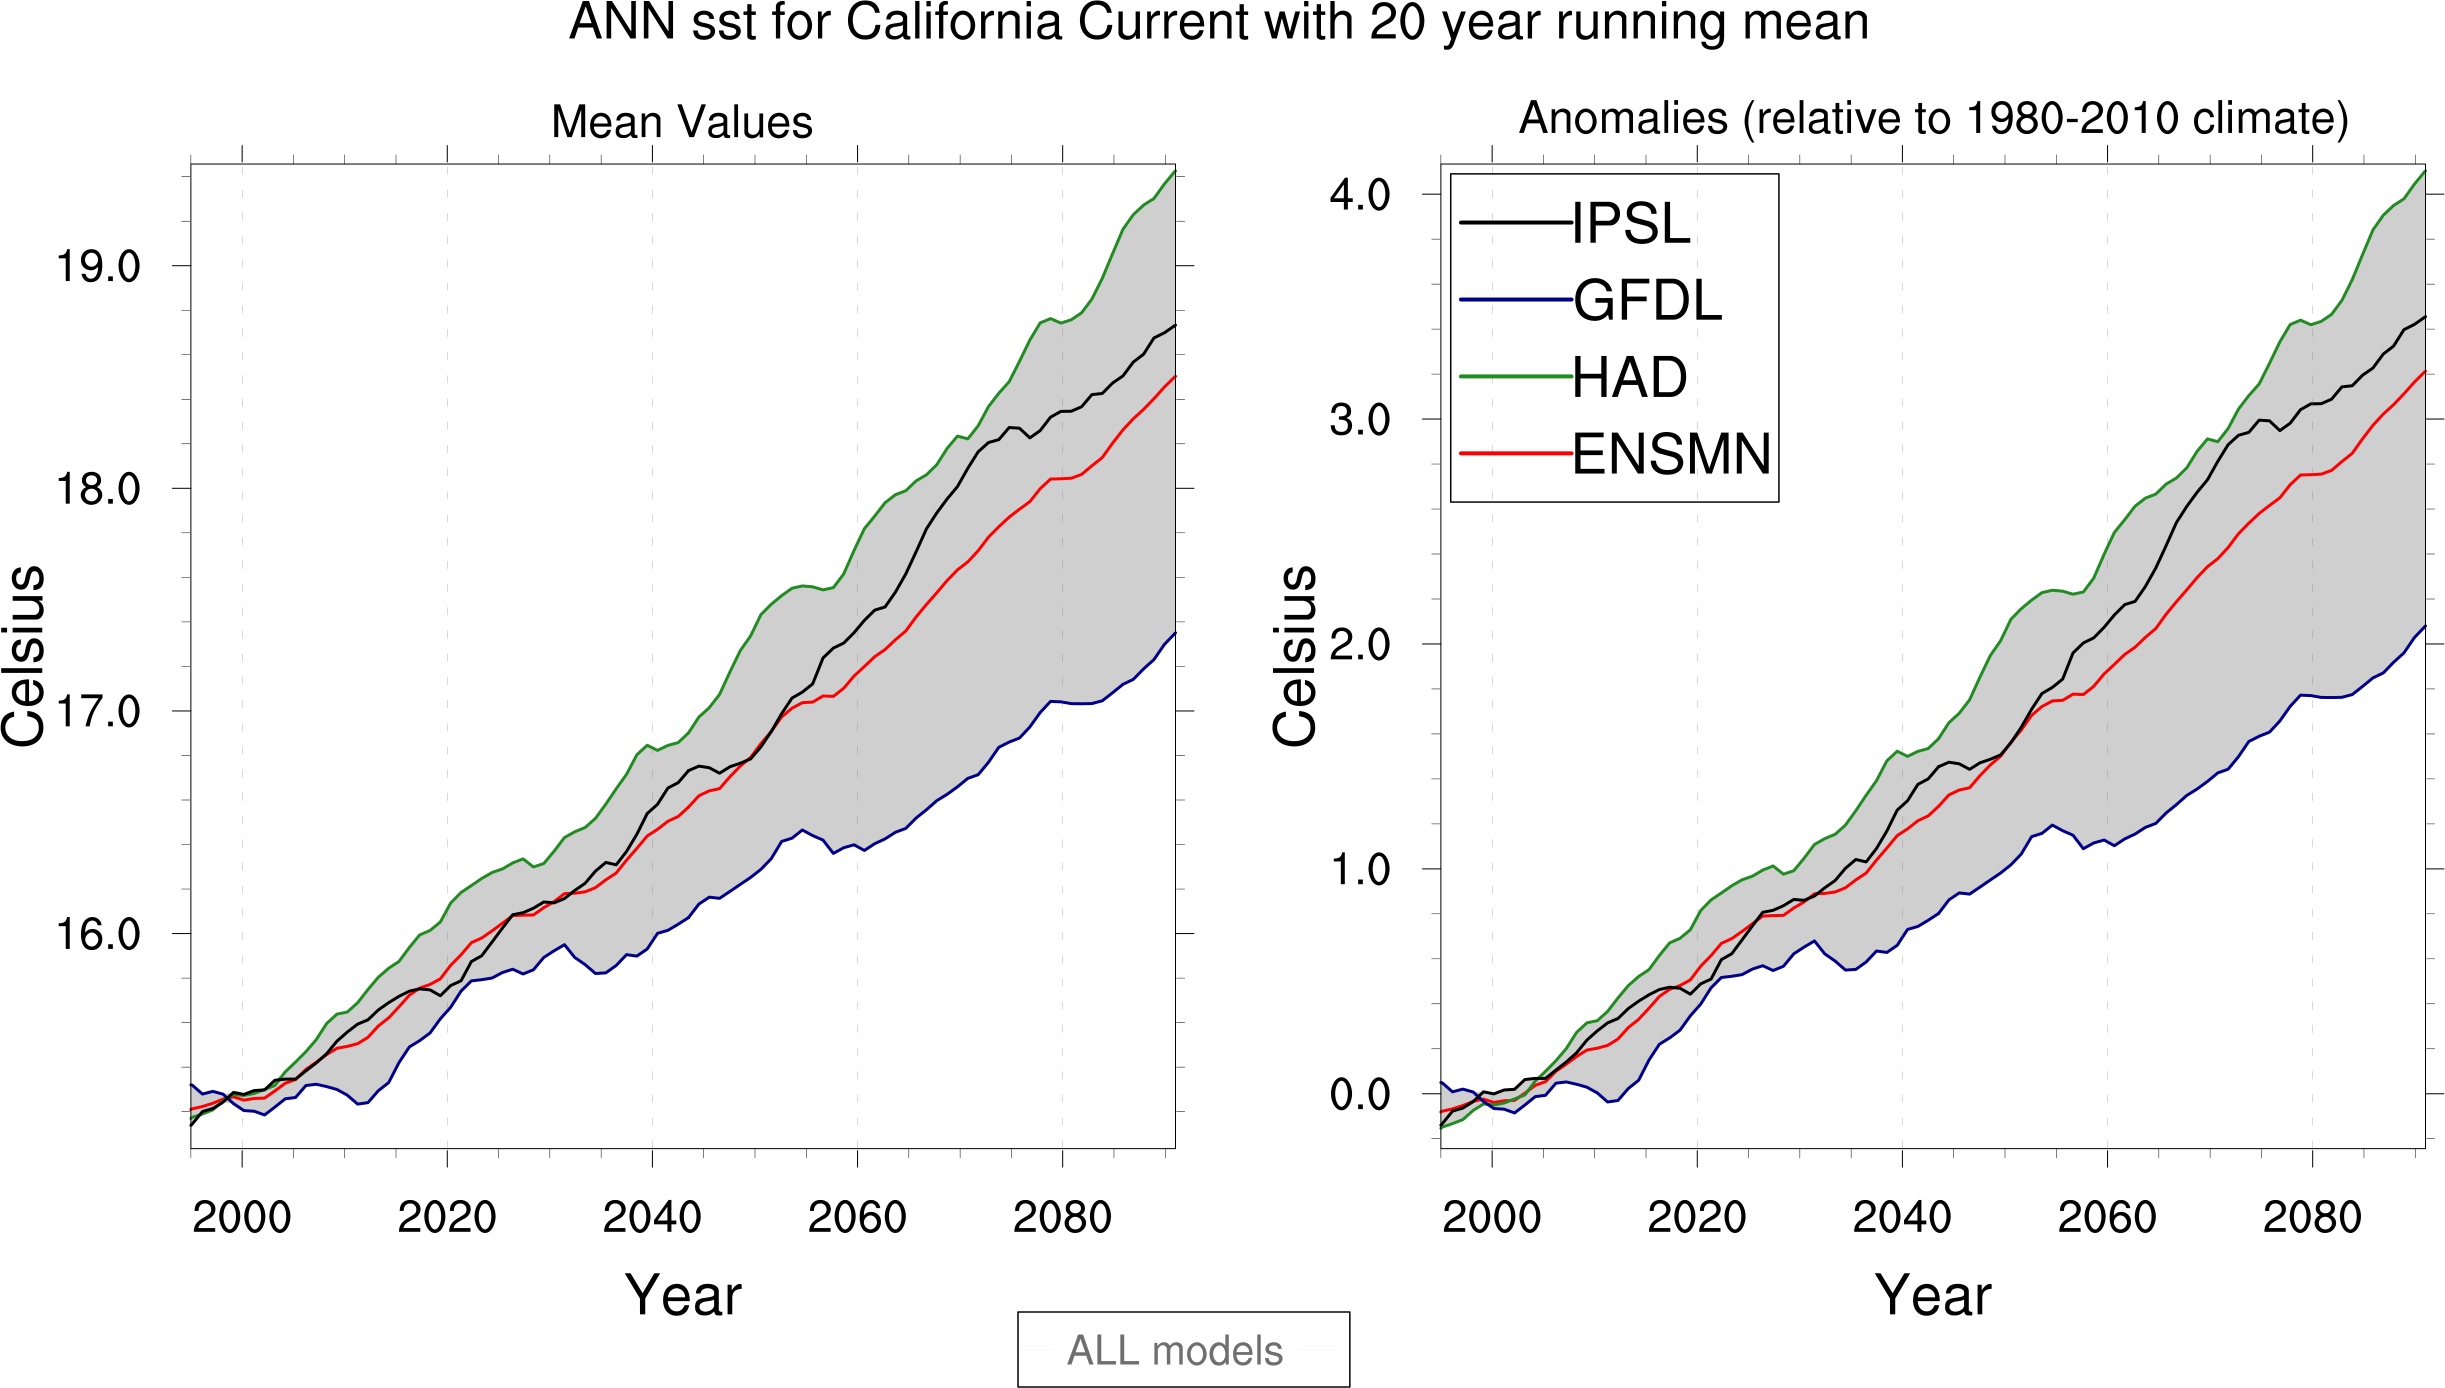
This is a Research and Development Application
Return to:
Climate Change Portal Home
Switch to:
CMIP5: Land and Rivers Portal
Switch to:
CMIP5: Ocean and Marine Ecosystems Portal
This page is maintained by
Jamie Scott