Lesley L. Smith – Re. Wildland Fire Potential
All plots preliminary.
Historical Fire Weather and Vapor Pressure Deficit and the effects of climate indices
For comparison, analysis of precipitation anomalies for 1984-2021 here.
Re. Vapor Pressure Deficit computed using ERA5 data
Analysis of Monthly anomalies for 1984-2021 here
Seasonal anomalies for 1984-2021


Conditioning via simultaneous climate indices El Nino Southern Oscillation
Seasonal anomalies for 1984-2021 conditioned by El Nino
DJF, MAM, SON VPDs are generally lesser in the southern U.S. for El_Nino, JJA may be greater in southwest


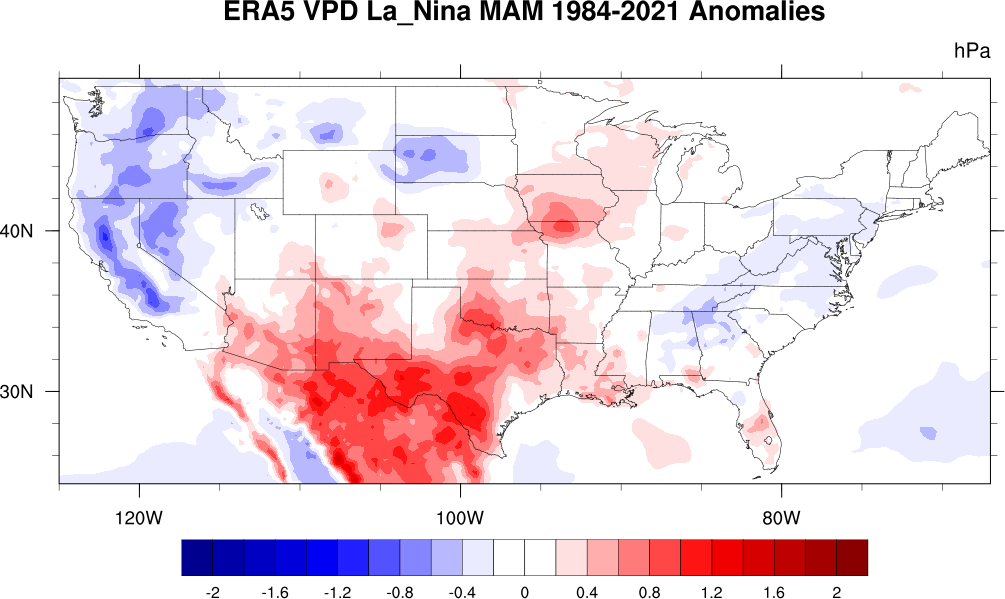
Seasonal anomalies for 1984-2021 conditioned by La Nina
DJF,MAM,SON VPDs are generally greater in the southern U.S. for La_Nina,JJA may be less in the southwest



-------------------------------
Re. Madden Julian Oscillation
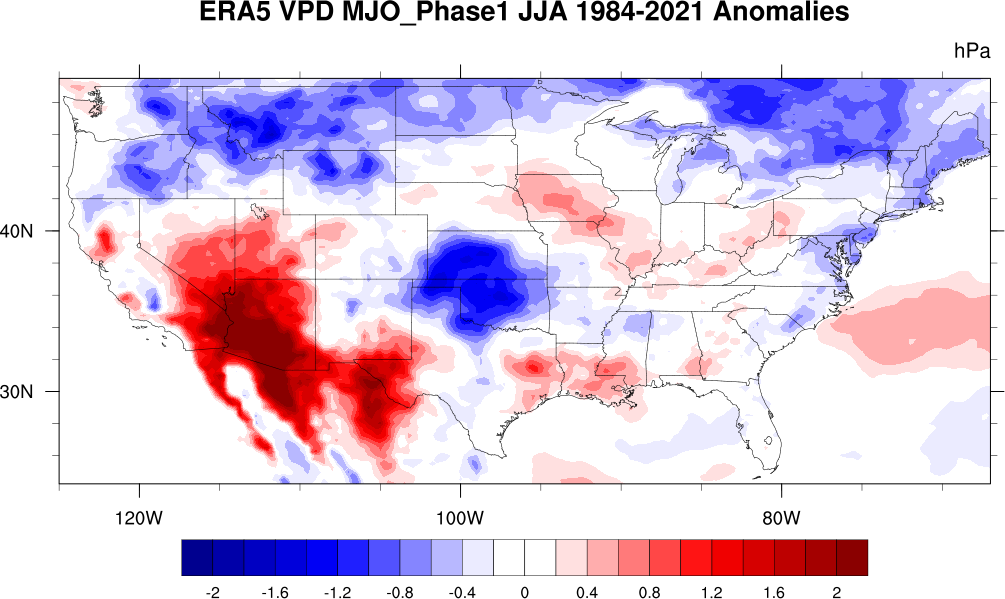
Seasonal anomalies for 1984-2021 conditioned by MJO_Phase1
Phase 1 seems to decrease VPD along the California coast in DJF, MAM, and SON.



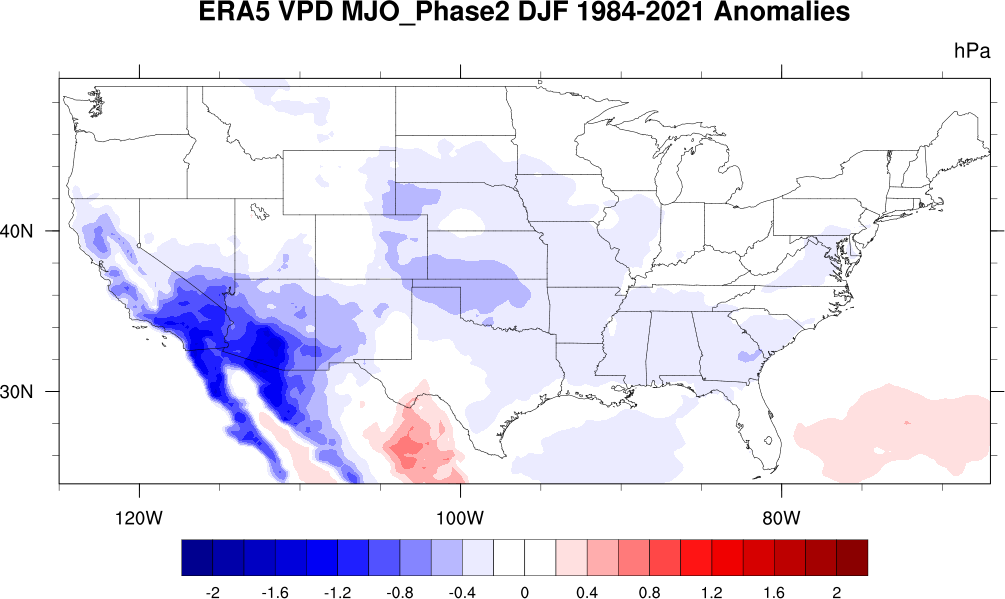
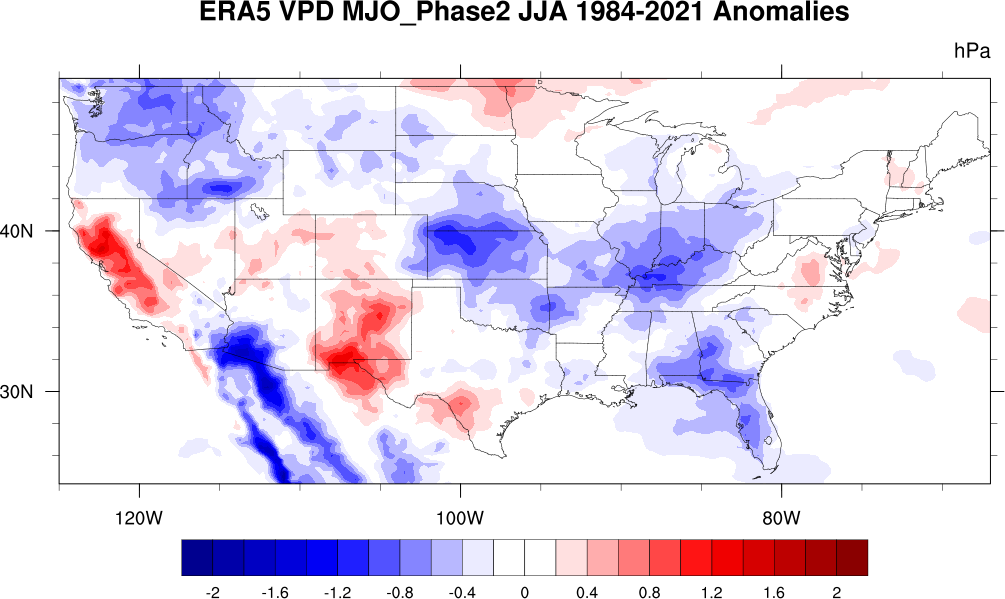
Seasonal anomalies for 1984-2021 conditioned by MJO_Phase2
Phase 2 seems to decrease VPD along the California coast in DJF, MAM, and SON.


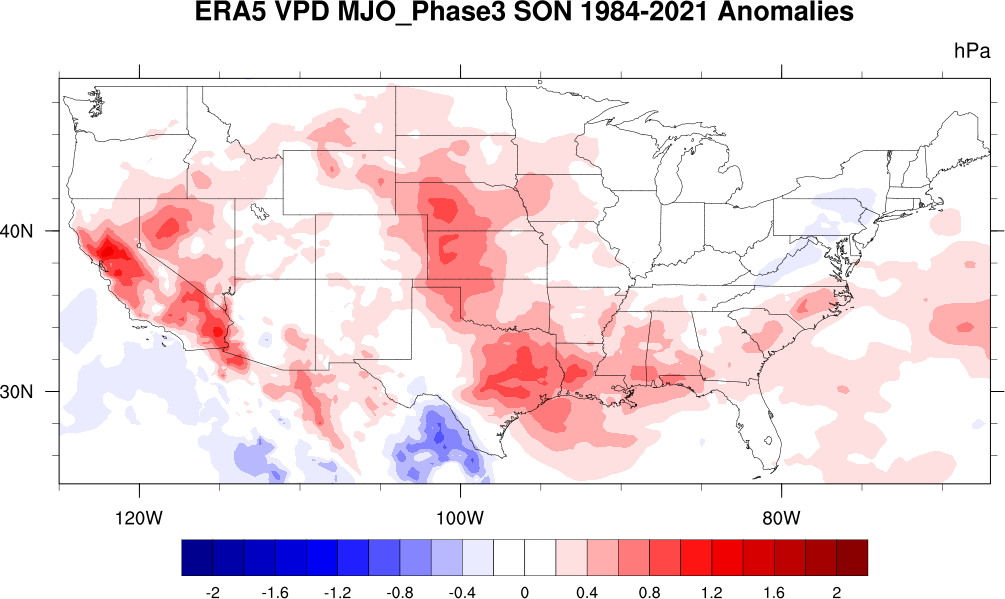
Seasonal anomalies for 1984-2021 conditioned by MJO_Phase3
The Phase 3 results seem to show decreased VPD in southern CONUS for DJF, MAM, JJA


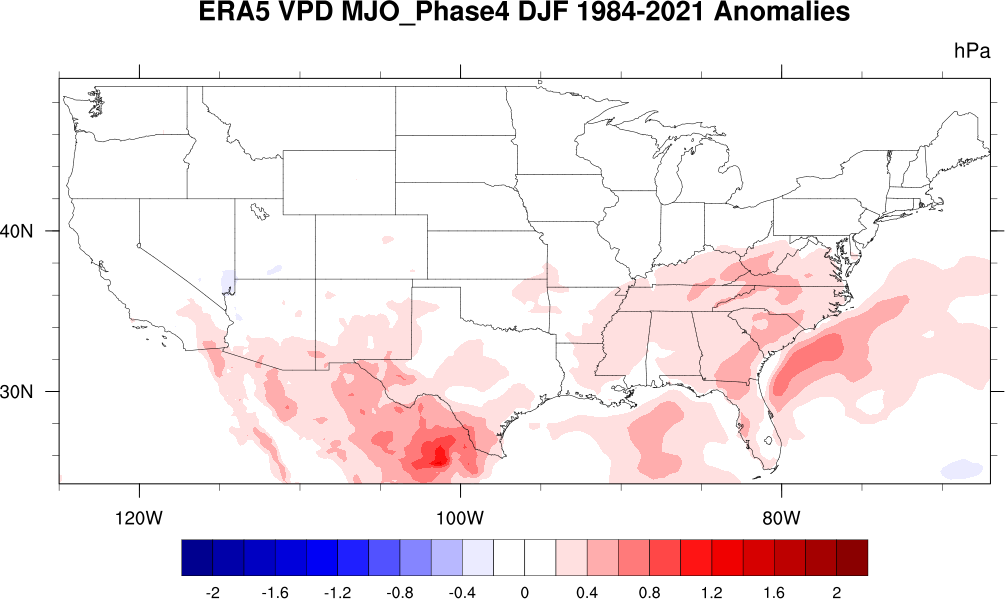
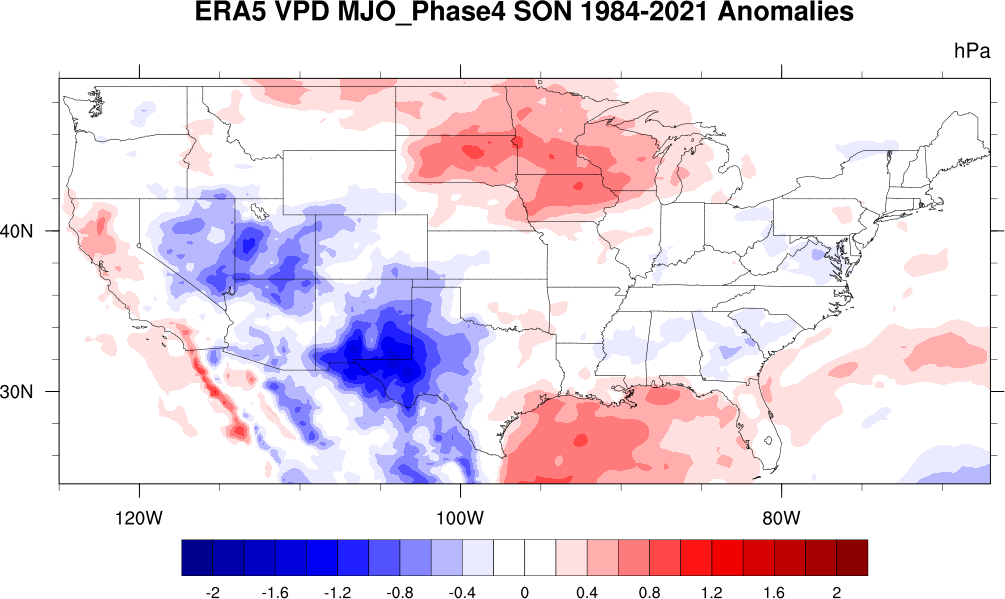
Seasonal anomalies for 1984-2021 conditioned by MJO_Phase4
The Phase 4 results seem to show decreased VPD for JJA and SON in southern CONUS


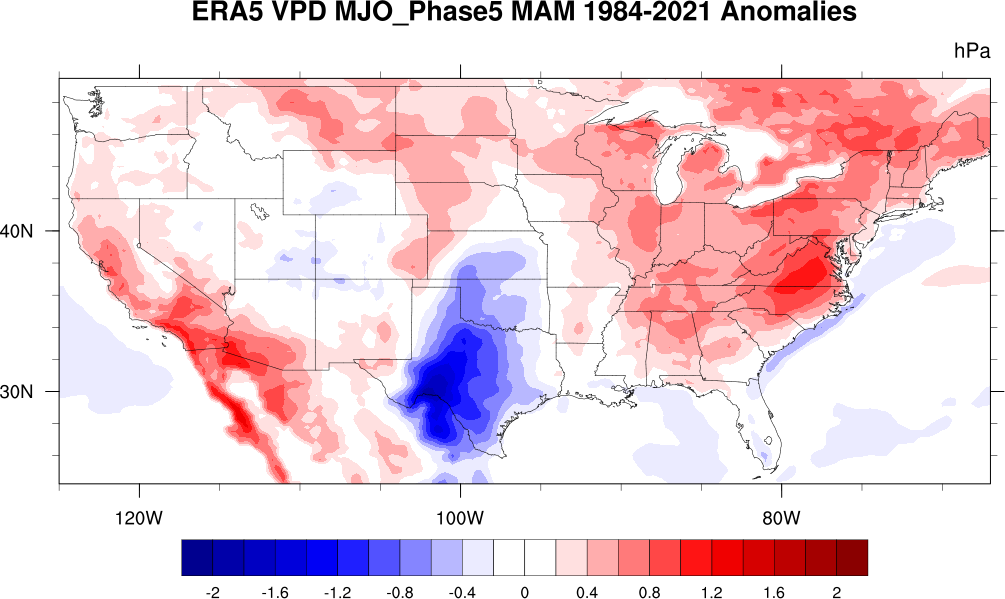
Seasonal anomalies for 1984-2021 conditioned by MJO_Phase5
VPD seems to decrease in southwestern CONUS for JJA and SON



Seasonal anomalies for 1984-2021 conditioned by MJO_Phase6
VPD may decrease in southwestern CONUS for SON


Seasonal anomalies for 1984-2021 conditioned by MJO_Phase7
VPD may decrease in southwestern CONUS for MAM, JJA, SON
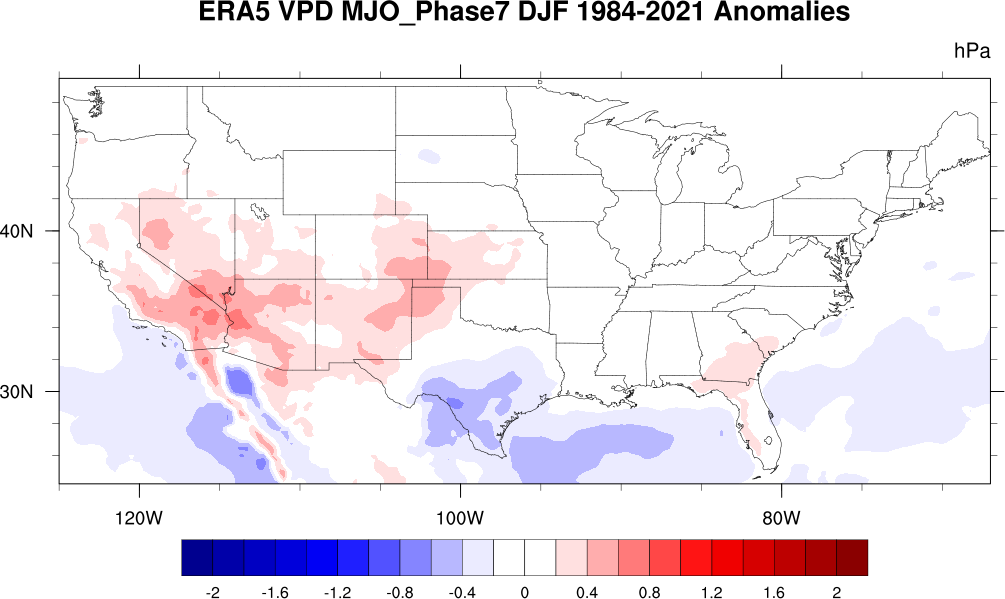


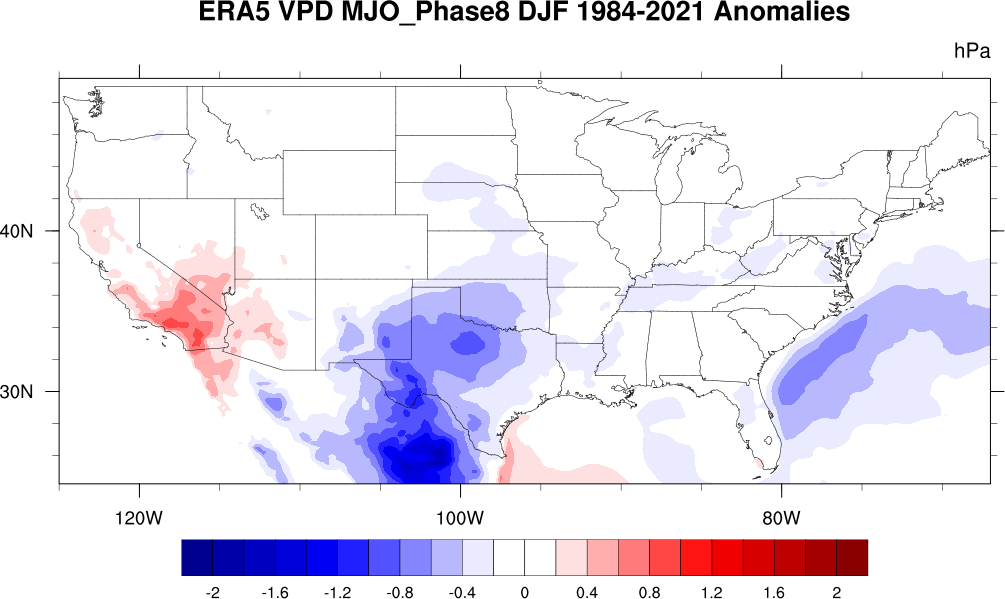
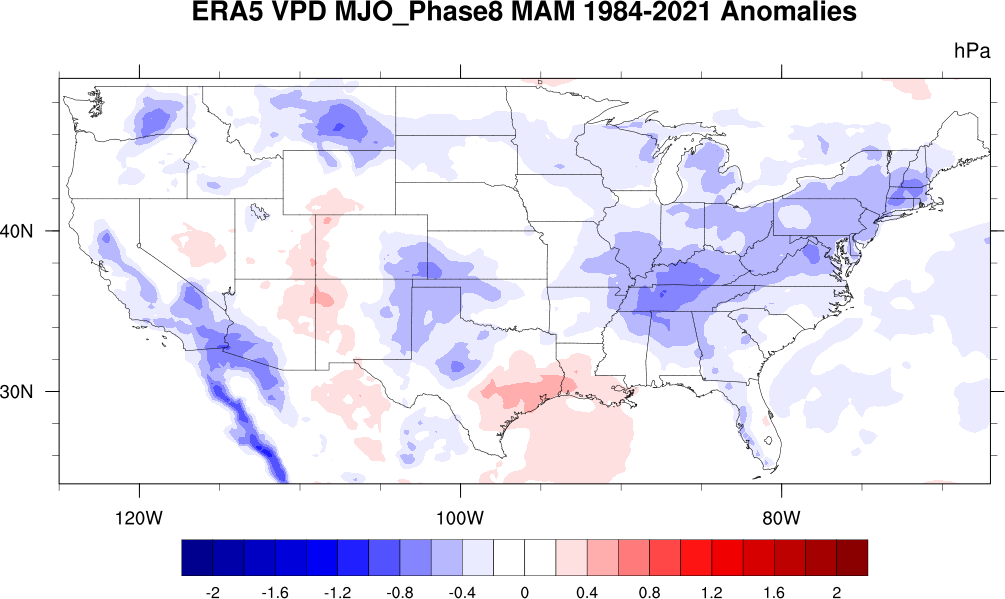
Seasonal anomalies for 1984-2021 conditioned by MJO_Phase8
VPD may decrease for southwestern CONUS for MAM


-------------------------------------
Conditioning via simultaneous climate indices Quasi Biennial Oscillation
Note: a positive QBO corresponds to Westerly winds and a negative QBO corresponds to Easterly winds
Seasonal anomalies for 1984-2021 conditioned by positive QBO

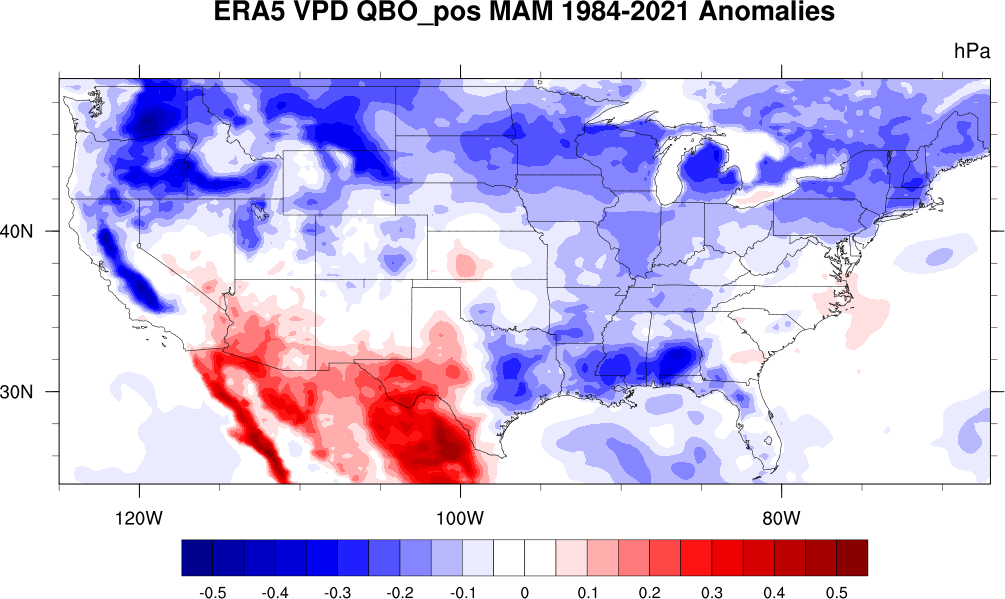


Seasonal anomalies for 1984-2021 conditioned by negative QBO


---------------------------------
Seasonal anomalies for 1984-2021 conditioned by MJO_Phase1 and El_Nino


Seasonal anomalies for 1984-2021 conditioned by MJO_Phase2 and El_Nino


Seasonal anomalies for 1984-2021 conditioned by MJO_Phase3 and El_Nino


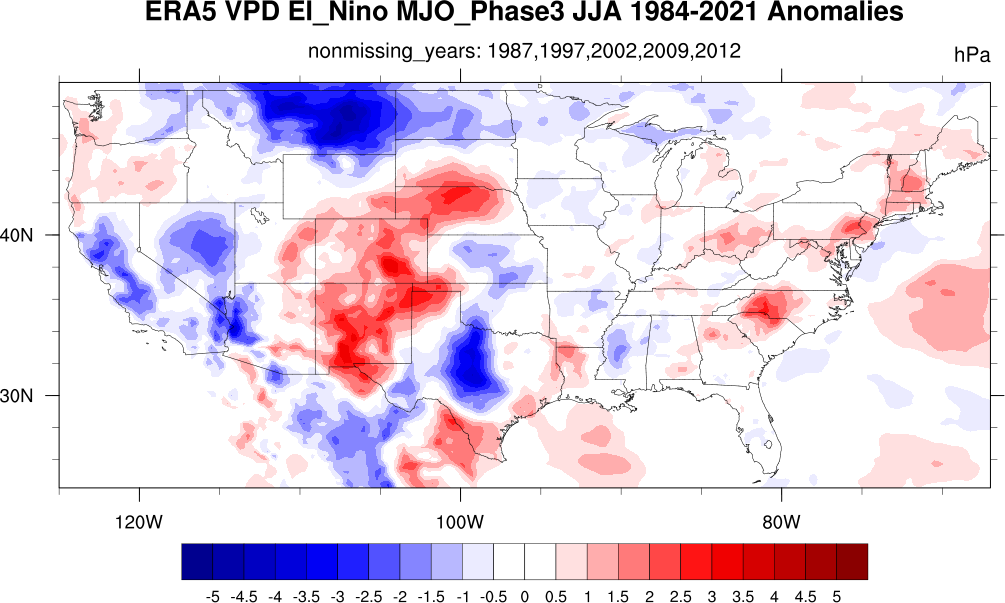

Seasonal anomalies for 1984-2021 conditioned by MJO_Phase4 and El_Nino


Seasonal anomalies for 1984-2021 conditioned by MJO_Phase5 and El_Nino


Seasonal anomalies for 1984-2021 conditioned by MJO_Phase6 and El_Nino


Seasonal anomalies for 1984-2021 conditioned by MJO_Phase7 and El_Nino
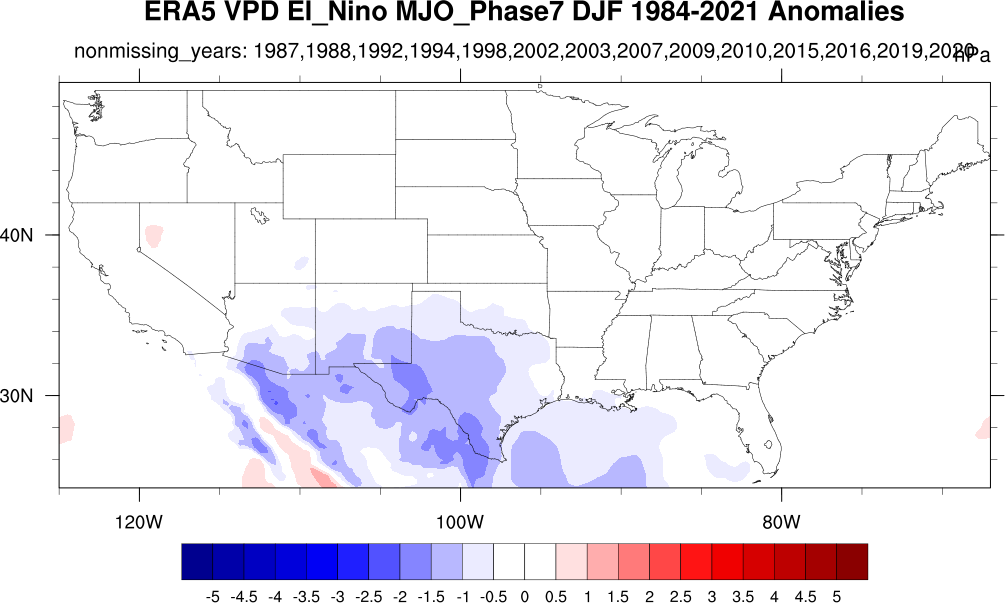

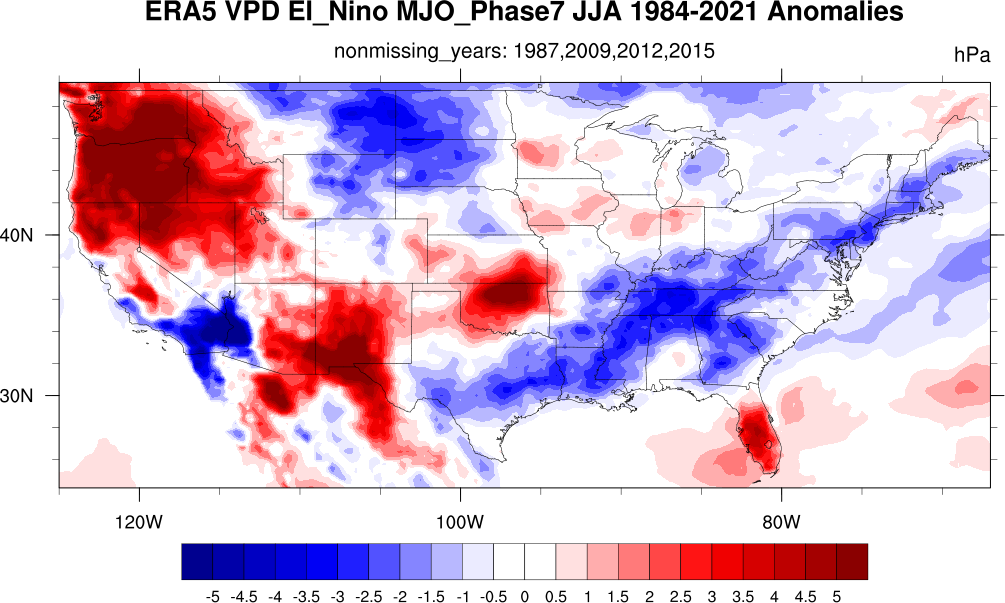

Seasonal anomalies for 1984-2021 conditioned by MJO_Phase8 and El_Nino


Seasonal anomalies for 1984-2021 conditioned by MJO_Phase1 and La_Nina


Seasonal anomalies for 1984-2021 conditioned by MJO_Phase2


Seasonal anomalies for 1984-2021 conditioned by MJO_Phase3 and La_Nina


Seasonal anomalies for 1984-2021 conditioned by MJO_Phase4 and La_Nina
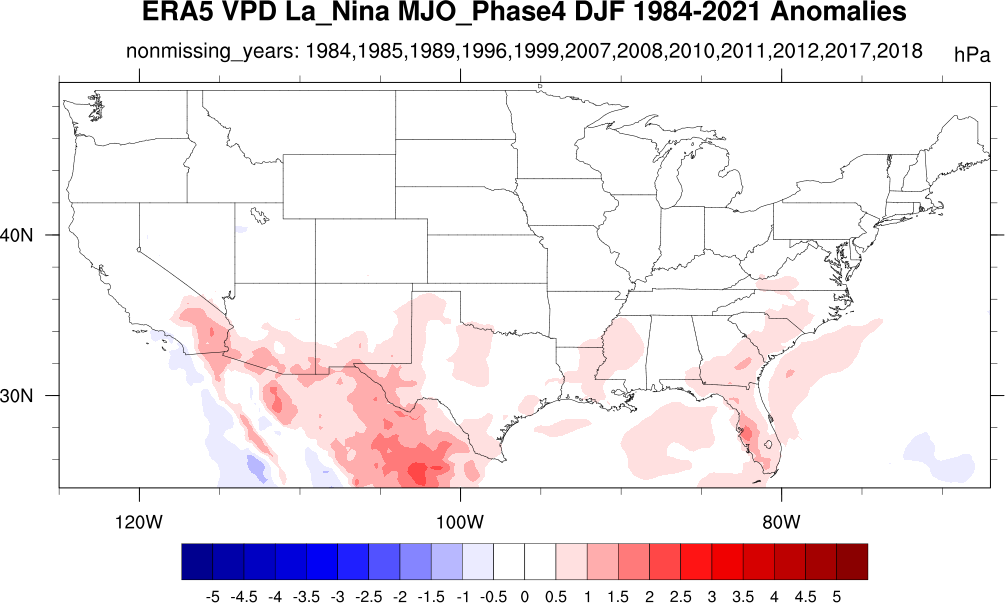


Seasonal anomalies for 1984-2021 conditioned by MJO_Phase5 and La_Nina


Seasonal anomalies for 1984-2021 conditioned by MJO_Phase6 and La_Nina


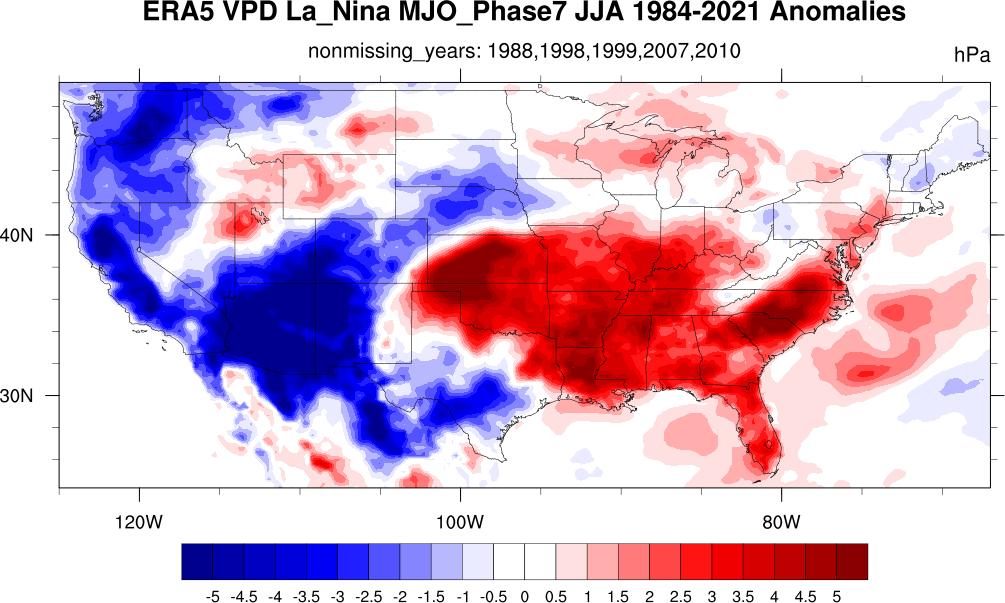
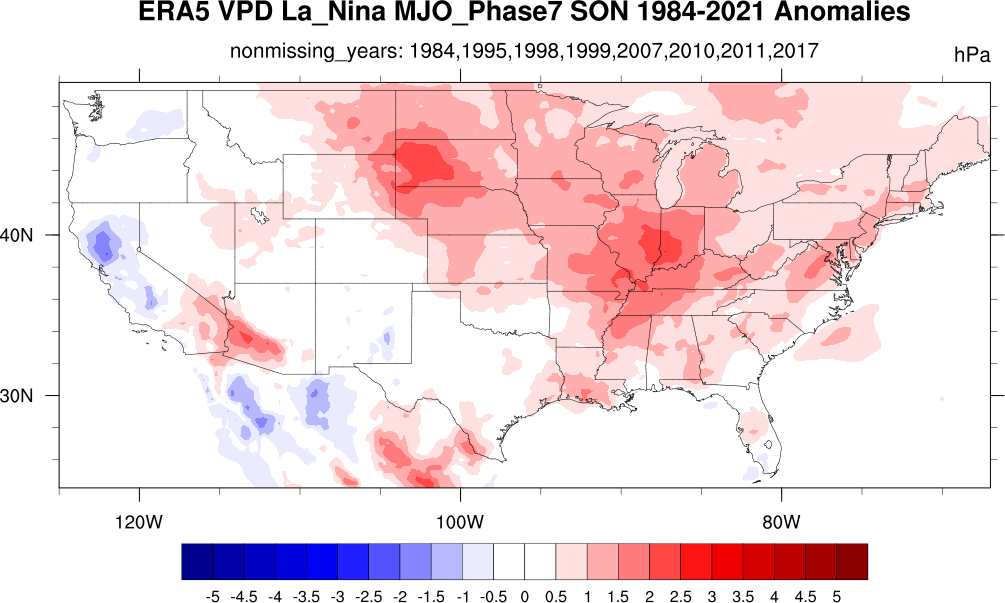
Seasonal anomalies for 1984-2021 conditioned by MJO_Phase7 and La_Nina


Seasonal anomalies for 1984-2021 conditioned by MJO_Phase8 and La_Nina


Re. Largest Historical ConUS Fires
All calculations done with ECMWF Reanalysis 5 (ERA5) Data
El Nino Southern Oscillation (ENSO) and Madden Julian Oscillation (MJO) precursors
The leftmost plots are the monthly ENSO Index for the 12 months preceding the event. If it is greater than 0.5 it is in an El Nino state. If it is less than -0.5 it is in a La Nina state. Values between 0.5 and -0.5 are generally considered ENSO neutral.
The center plots are the daily MJO Index for the 6 months preceding the event. The dates are color-coded, with January days dark purple, February days medium purple, March days light purple, and so on. The locations of the dots indicated the MJO Phase. Values inside the unit circle are considered MJO neutral. The large black dot indicates the first day of the plot with the large red dot indicating the last day of the plot, the ignition day.
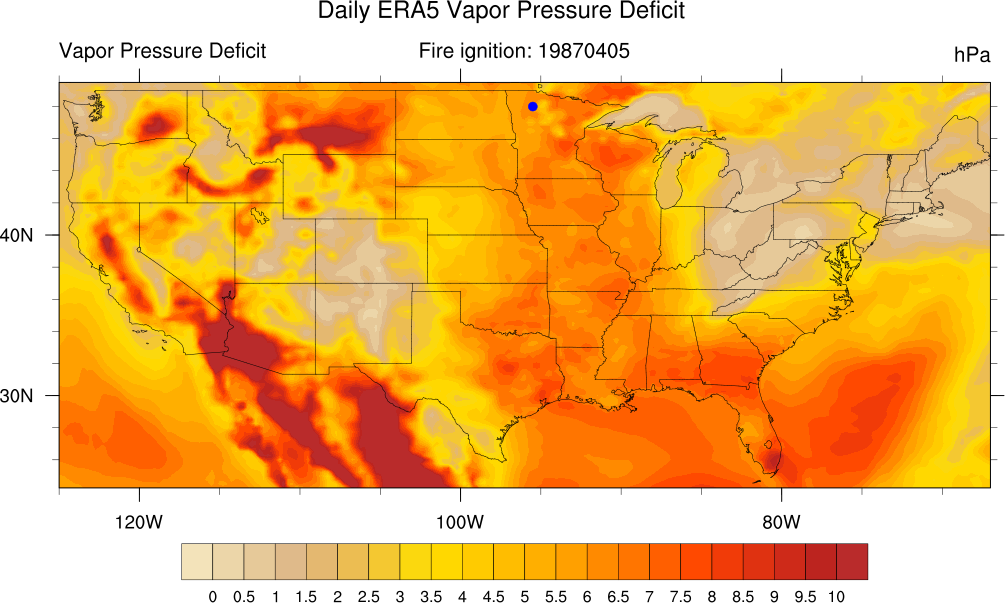
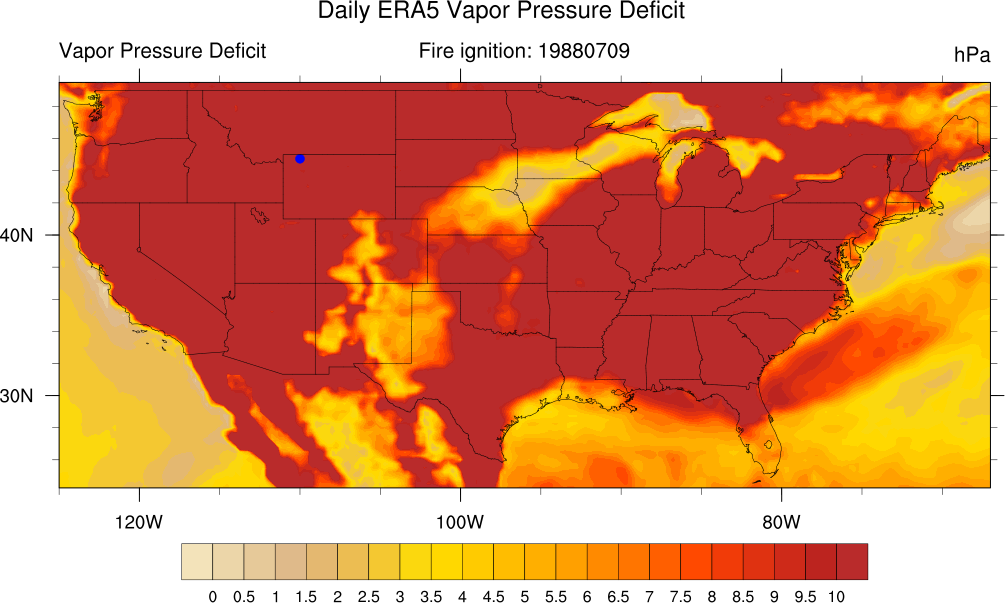
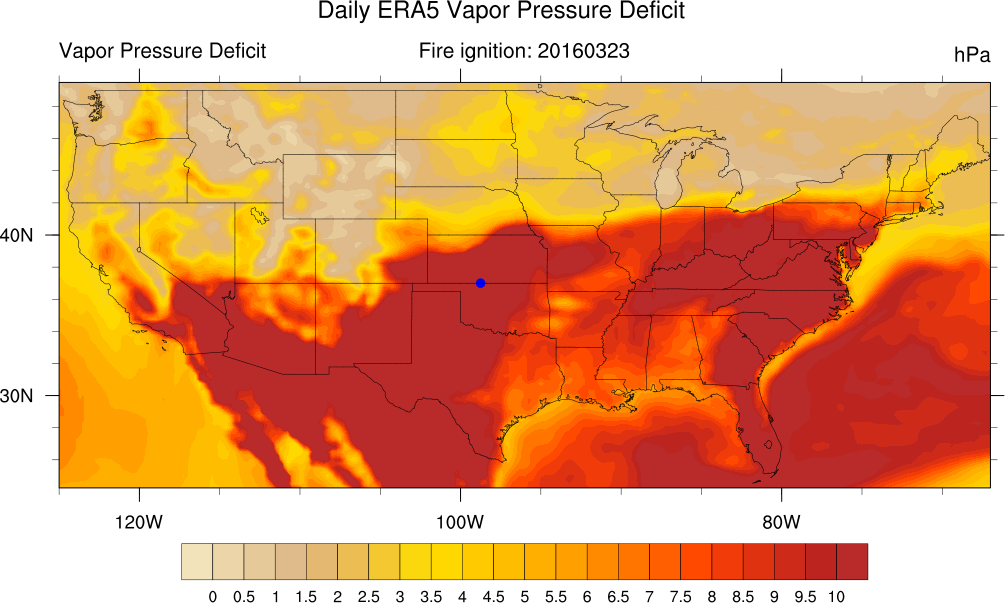
The rightmost plots are the daily Vapor Pressure Deficit (VPD) for the ignition day. The large blue dot shows the ignition location.
Region: Eastern Sector
Fire name: UNNAMED-2. Area Burned (Acres): 131401. Ignition Date:19870405. Lat:48.098. Lon:-95.46


Fire name: PAGAMI CREEK. Area Burned (Acres):85116. Ignition Date:20110817. Lat:47.828. Lon:-91.29


Region: Great Basin
Firename: MURPHY COMPLEX. Area Burned (Acres):567409. Ignition Date:20070721 Lat:42.16. Lon:-115.32


Firename: MARTIN. Area Burned (Acres):432180. Ignition Date:20180705. Lat:41.61. Lon:-116.9


Region: Northern Rockies
Fire name: NORTH FORK. Area Burned (Acres):563527. Ignition Date:19880722. Lat:44.68. Lon:-110.72


Fire name: CLOVERMIST. Area Burned (Acres):303427. Ignition Date:19880709. Lat:44.76. Lon:-109.9


Region: Northwest
Fire name: LONG DRAW. Area Burned (Acres):557620. Ignition Date:20120708. Lat:42.43. Lon:-117.62


Fire name: BISCUIT COMPLEX. Area Burned (Acres):495308. Ignition Date:20020713. Lat:42.44. Lon:-123.9


Region: Northern California
Fire name: AUGUST COMPLEX. Area Burned (Acres):1068802. Ignition Date:20200817. Lat:39.94. Lon:-123.03


Fire name: DIXIE.Area Burned (Acres):979795. Ignition Date:20210714. Lat:40.32. Lon:-120.86


Region: Southern California
Fire name: CREEK. Area Burned (Acres): 381441. Ignition Date:20200905. Lat:37.32. Lon:-119.21


Fire name: THOMAS. Area Burned (Acres): 281982. Ignition Date:20171204. Lat:34.46. Lon:-119.3


Region: Rocky Mountain
Fire name: OKS - STARBUCK. Area Burned (Acres): 657299. Ignition Date:20170307. Lat:37.08. Lon:-99.89


Fire name: ANDERSON CREEK FIRE. Area Burned (Acres):374423. Ignition Date:20160323. Lat:37.11. Lon:-98.83


Region: Southern
Fire name: EAST AMARILLO COMPLEX. Area Burned (Acres):593364. Ignition Date: 20060312. Lat:35.51. Lon:-100.78


Fire name: BIG TURNAROUND COMPLEX. Area Burned (Acres):328827. Ignition Date:20070425. Lat:30.59. Lon:-82.37


Region: Southwest
Fire name: WALLOW. Area Burned (Acres):563664. Ignition Date:20110529. Lat:33.79. Lon:-109.25


Fire name: RODEO. Area Burned (Acres):461774. Ignition Date:20020618. Lat:34.23. Lon:-110.46


-------------------------------------------------------------------------------------------
Sample VPD for first 1000 timesteps of 2010: here