Lesley L. Smith – El Nino 2016
All plots here preliminary.
Right click to see bigger plots.
Back to main Smith page
Winter El Nino Model Dynamics
ENSO's effect on U.S. weather
Older plots including average and variance DJF Z500 from CAM here.------------------------------------------------------------------
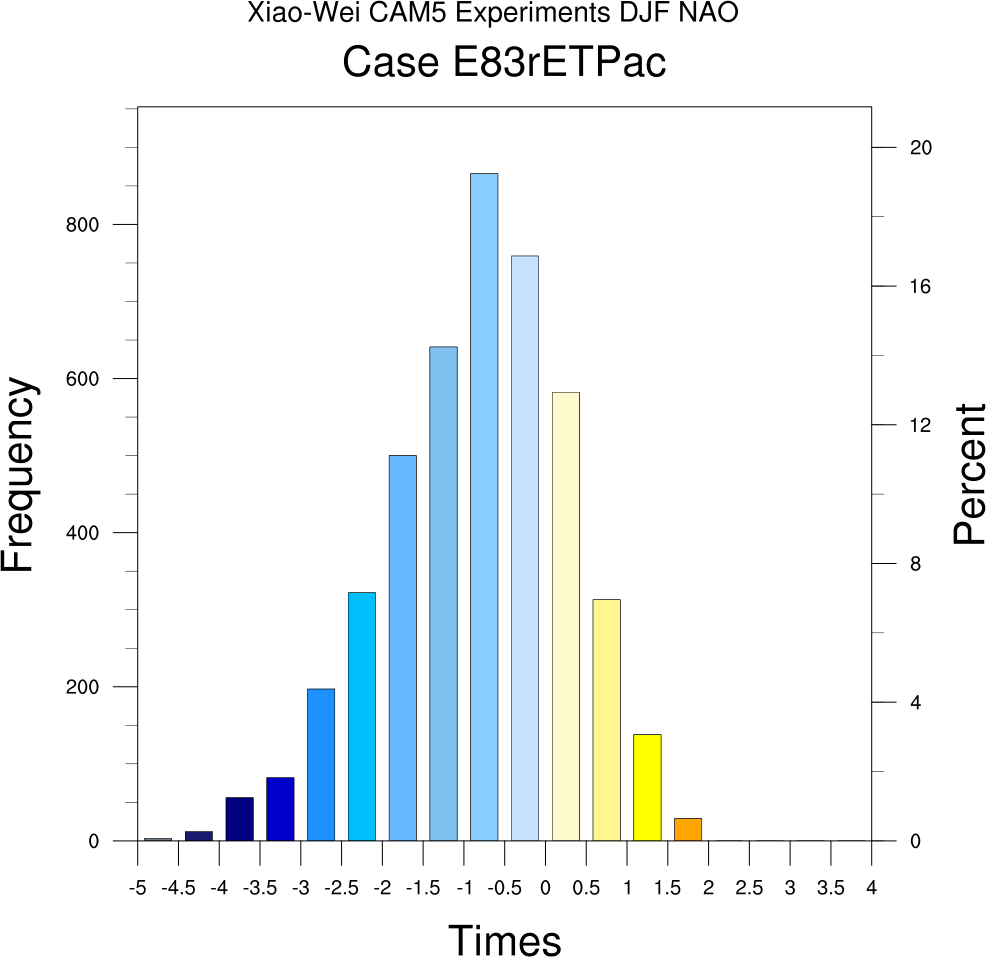
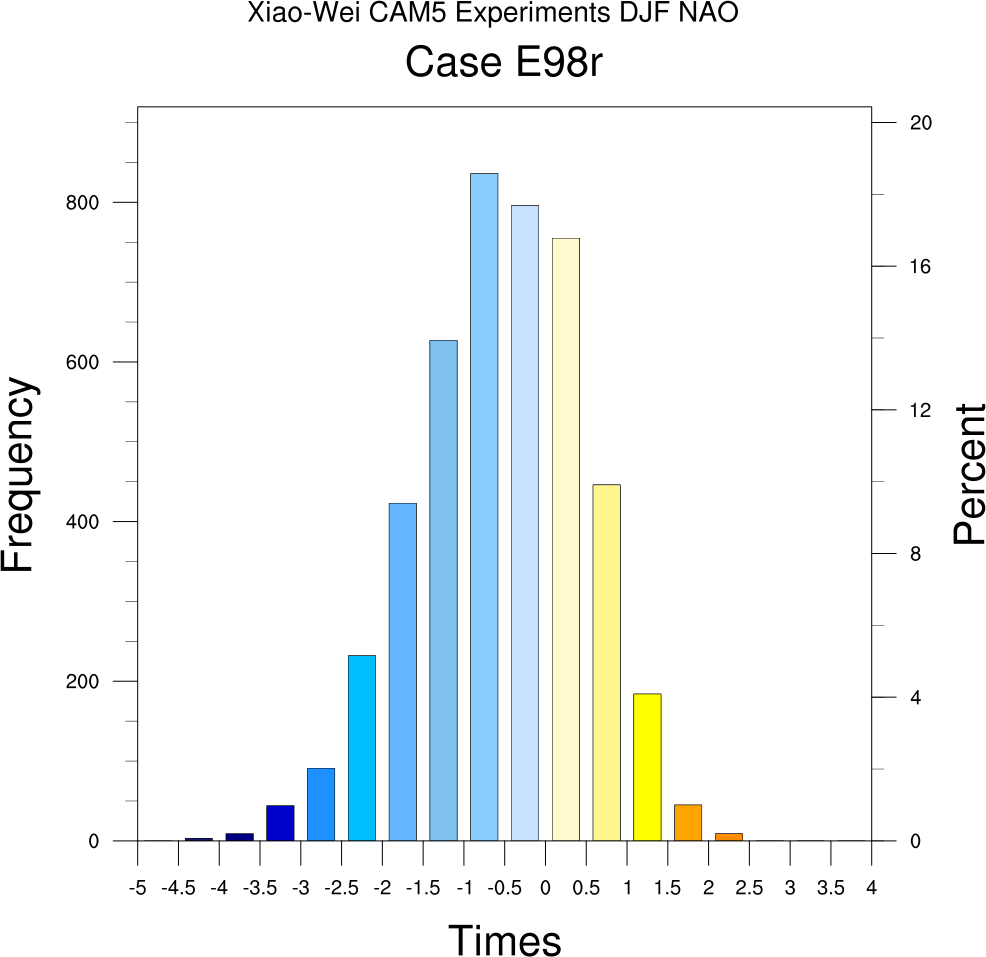
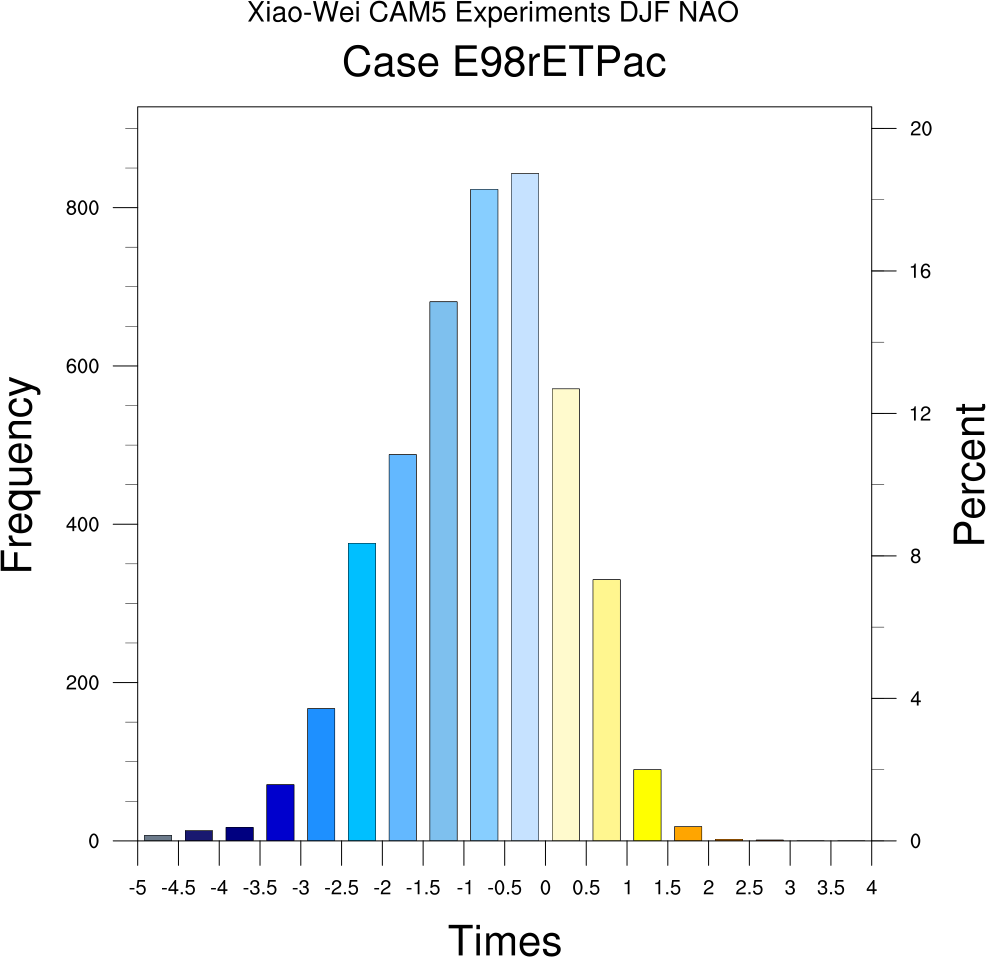
Analyses of Xiao-Wei CAM and related Data
2.5 to 6-day filtered data polar stereographic plots at bottom
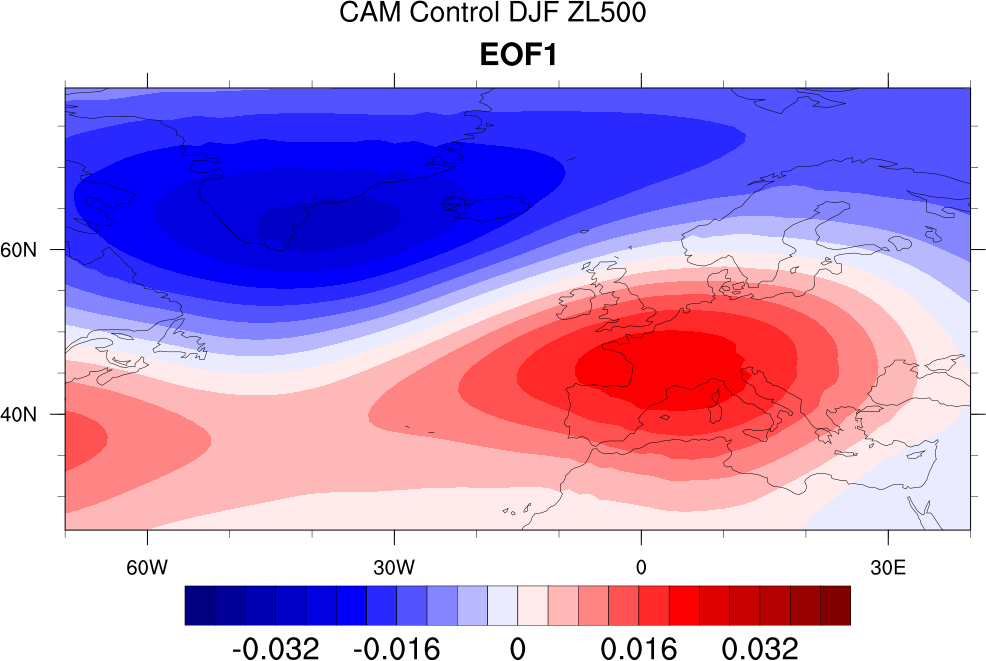
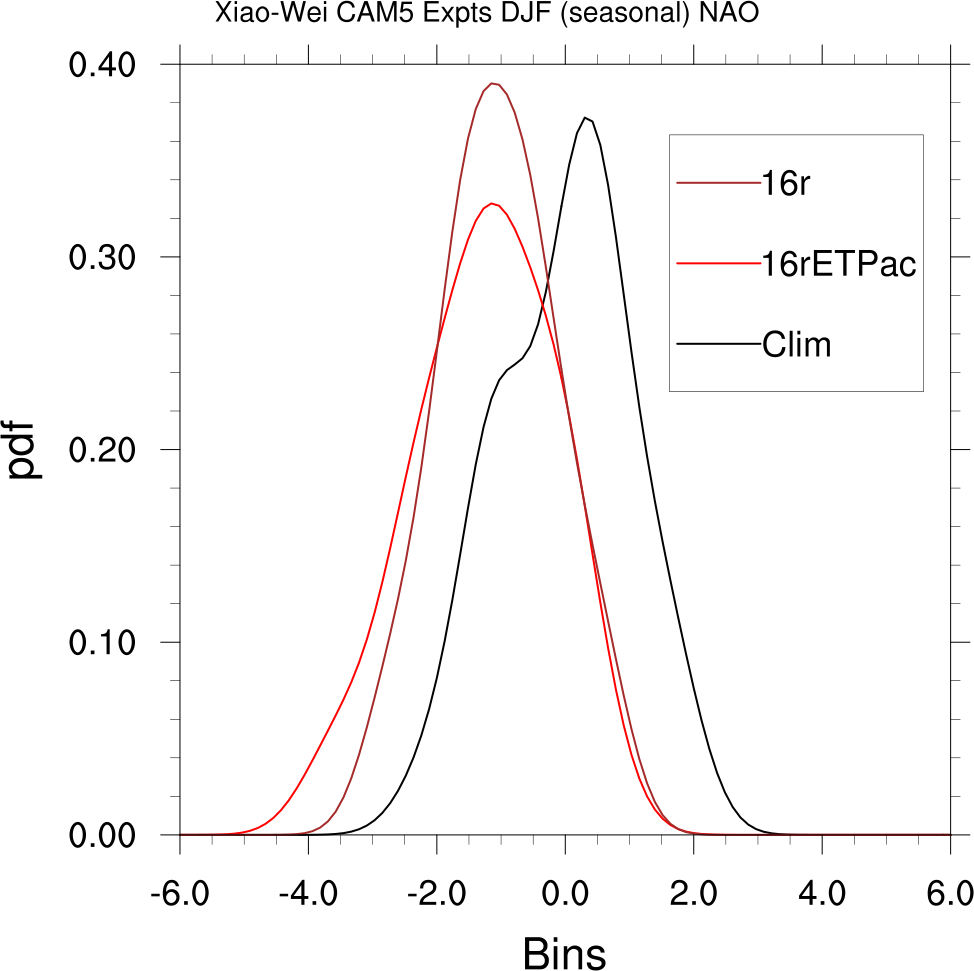
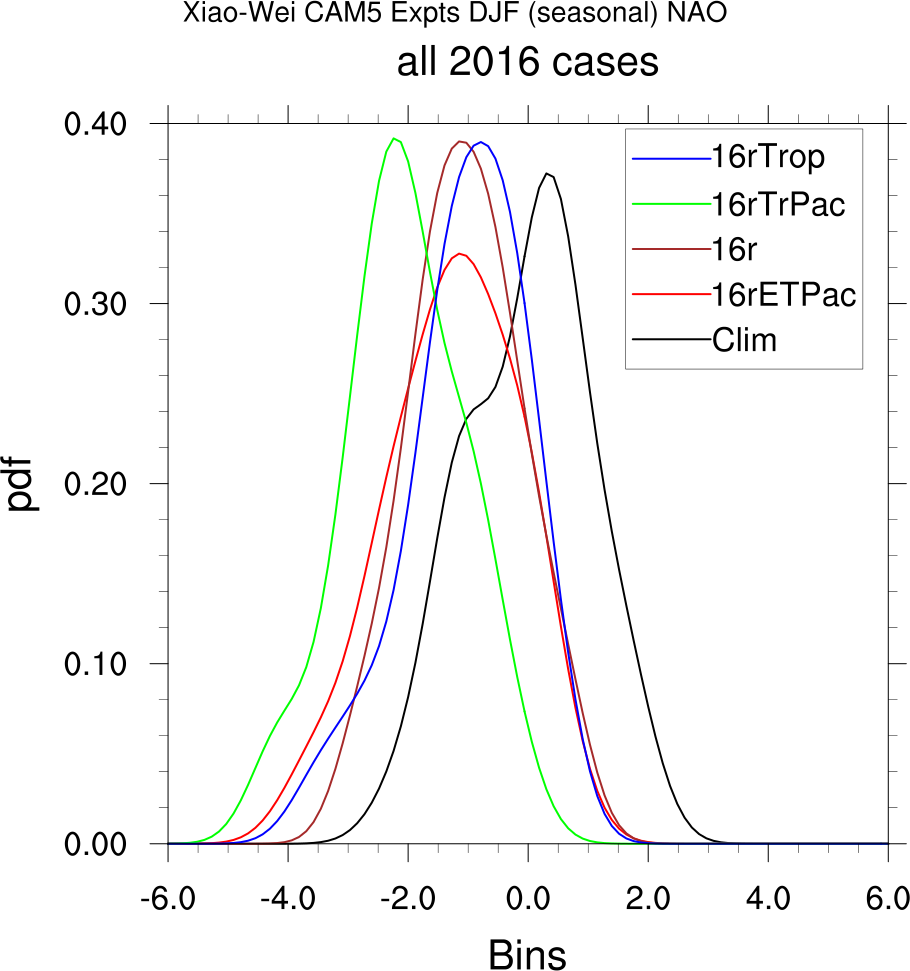
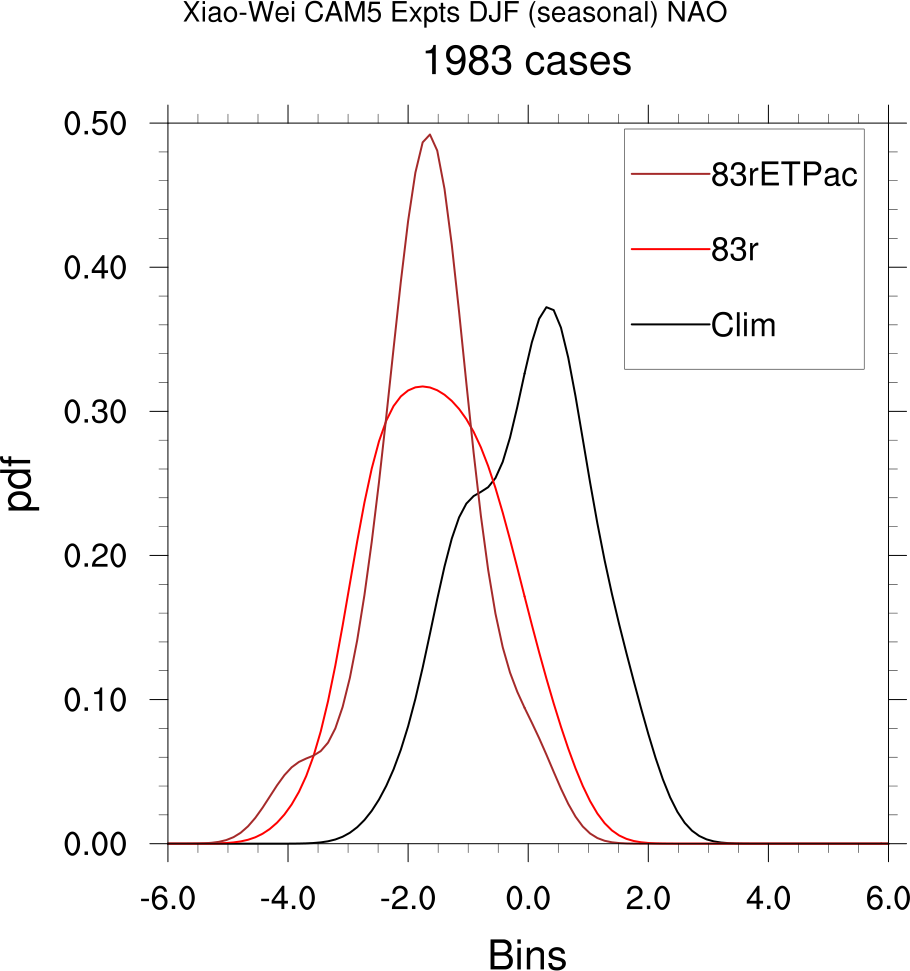
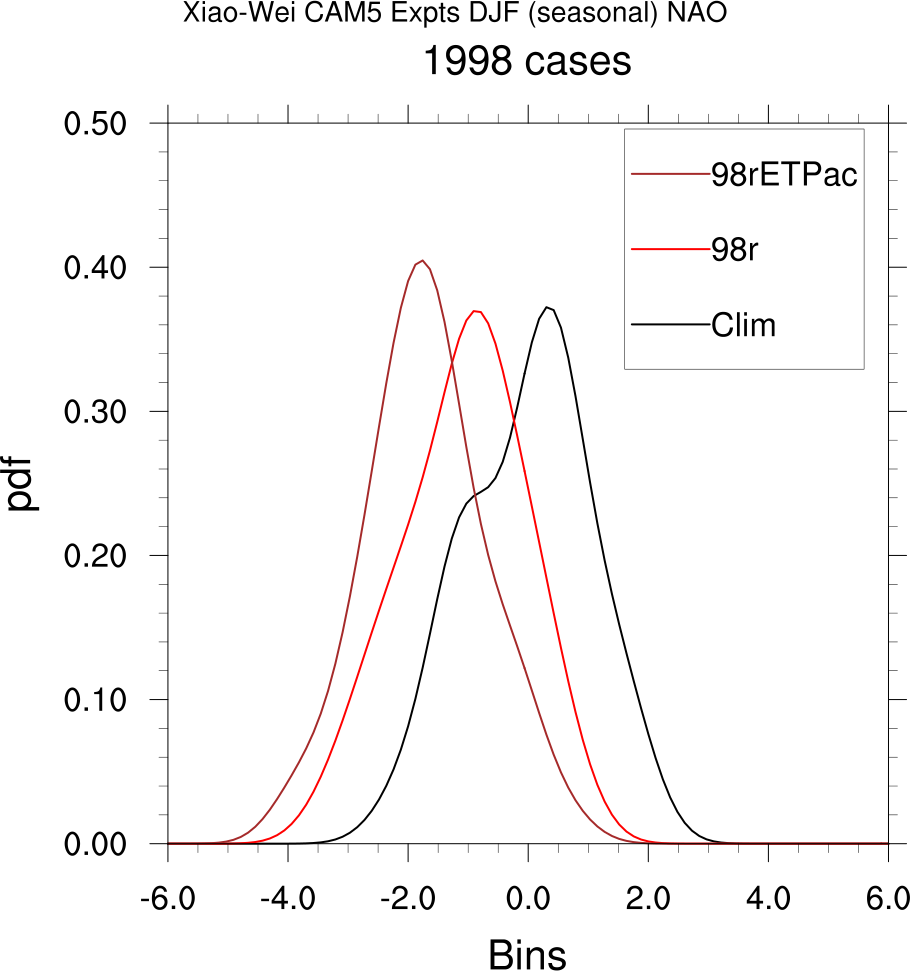
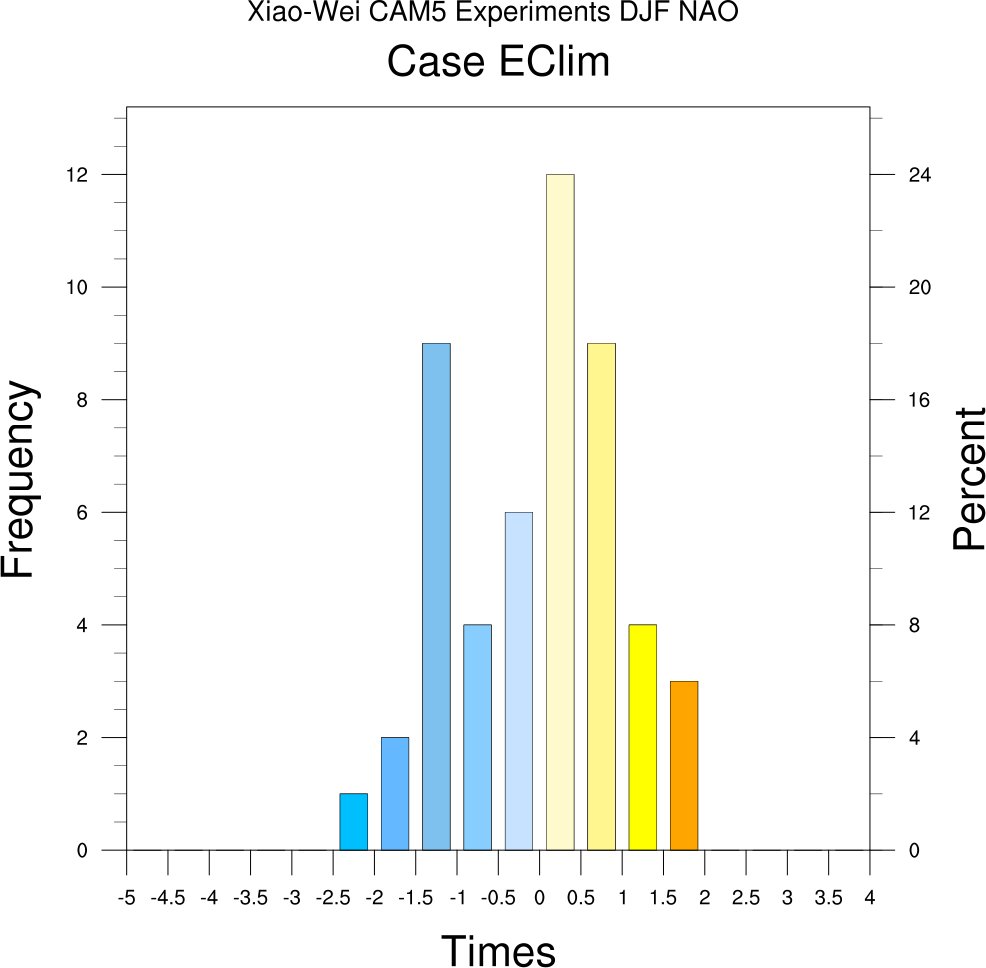
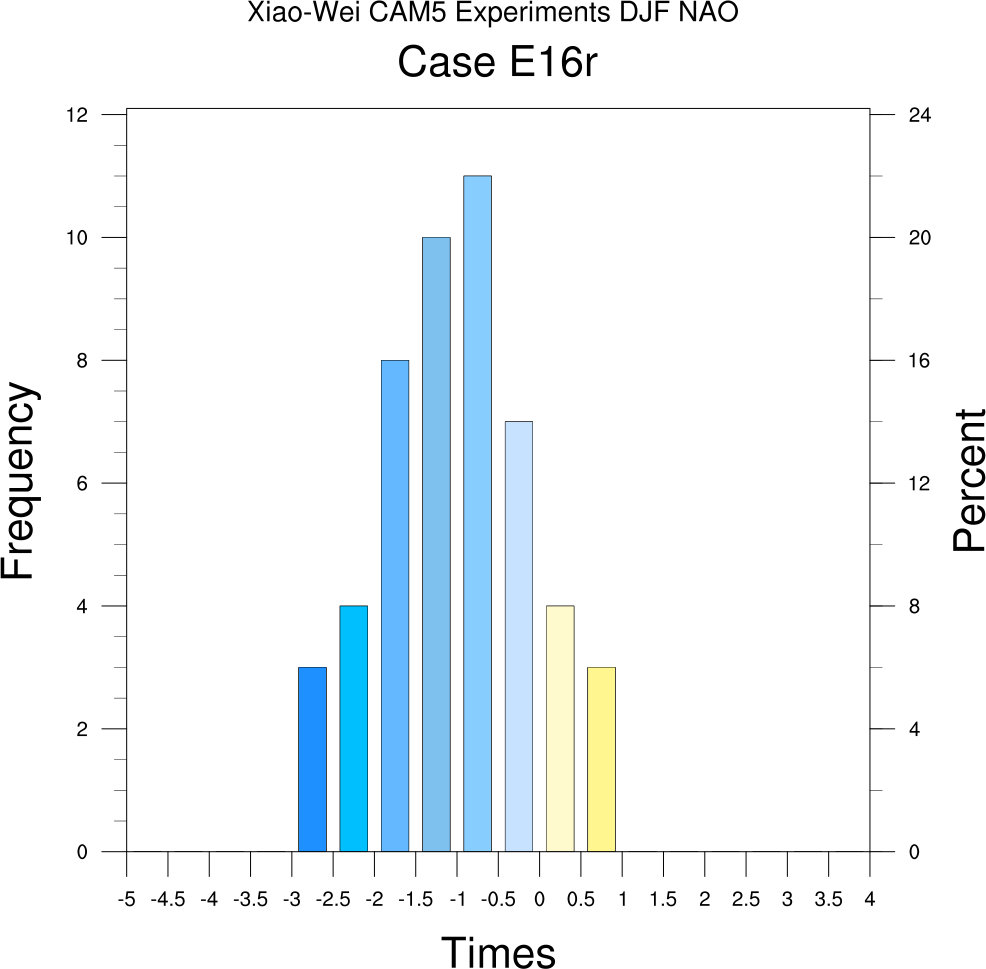
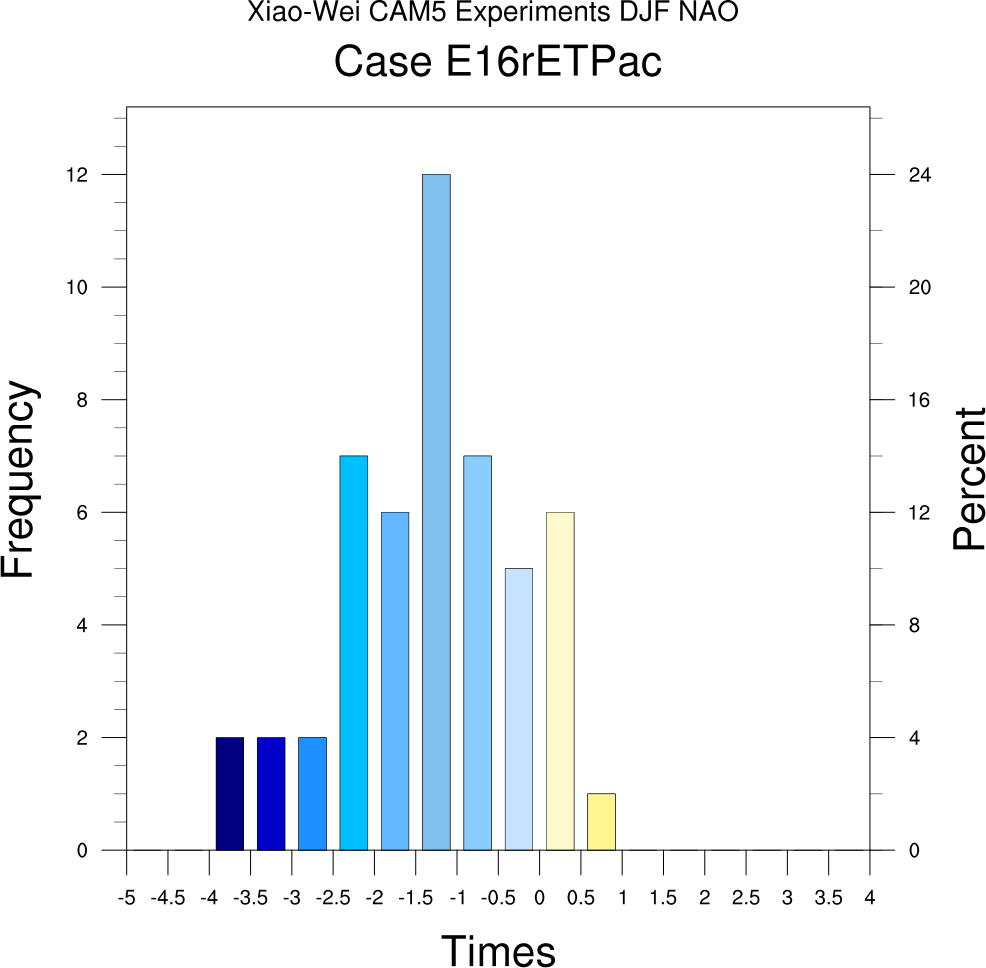
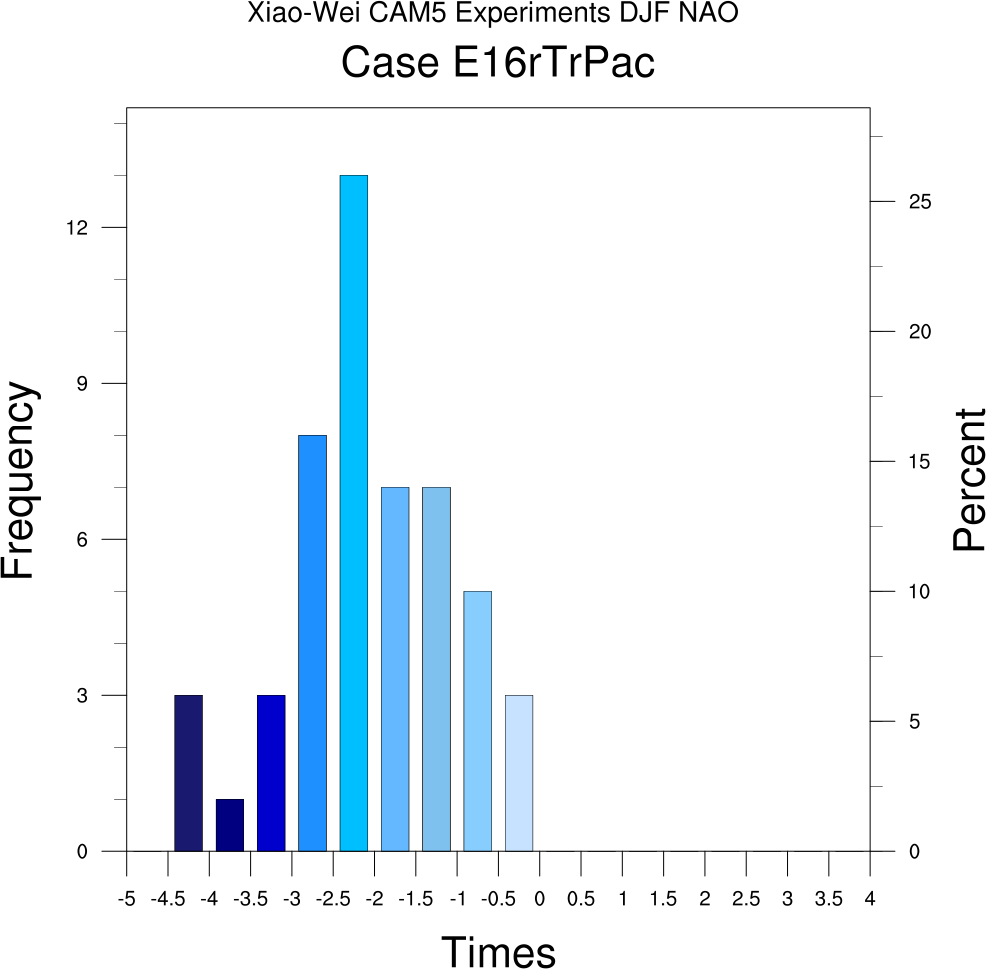
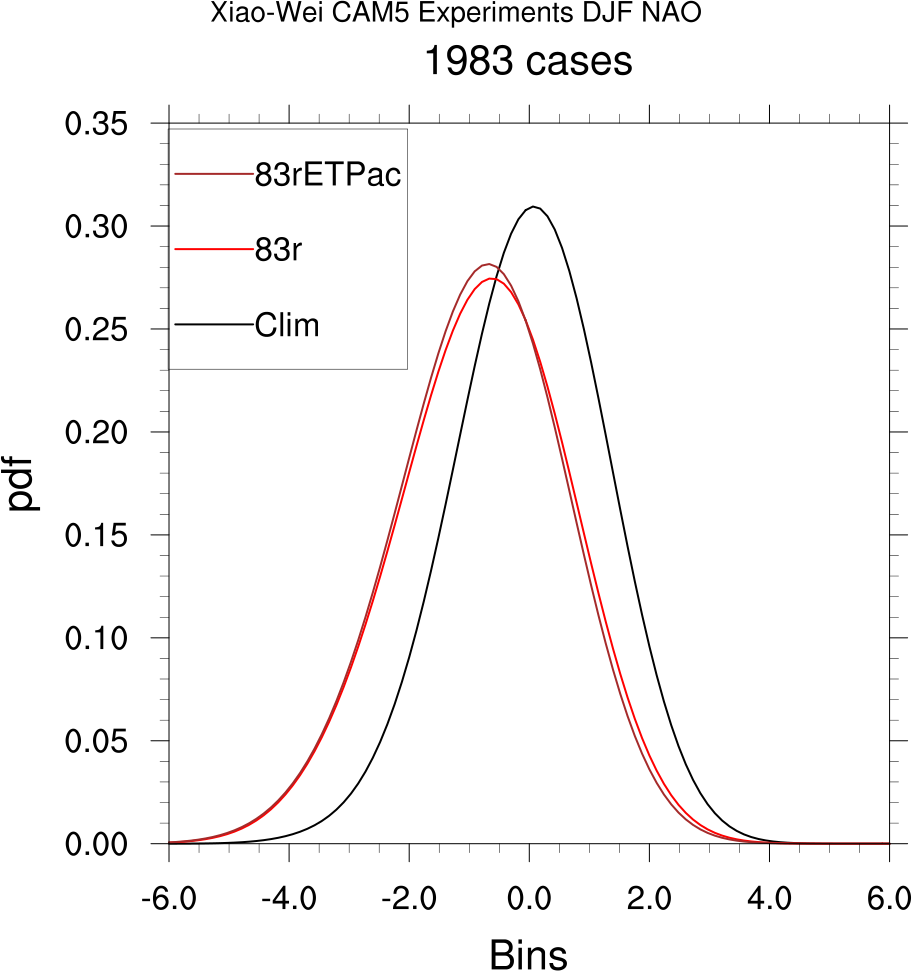
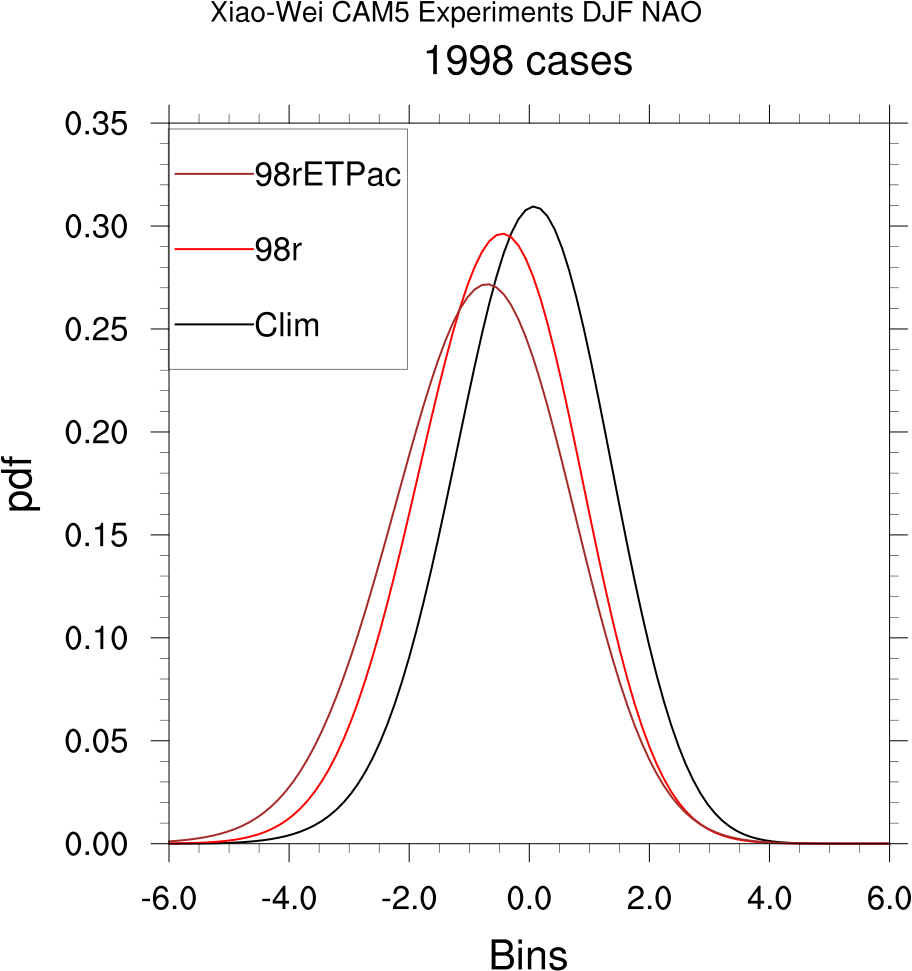
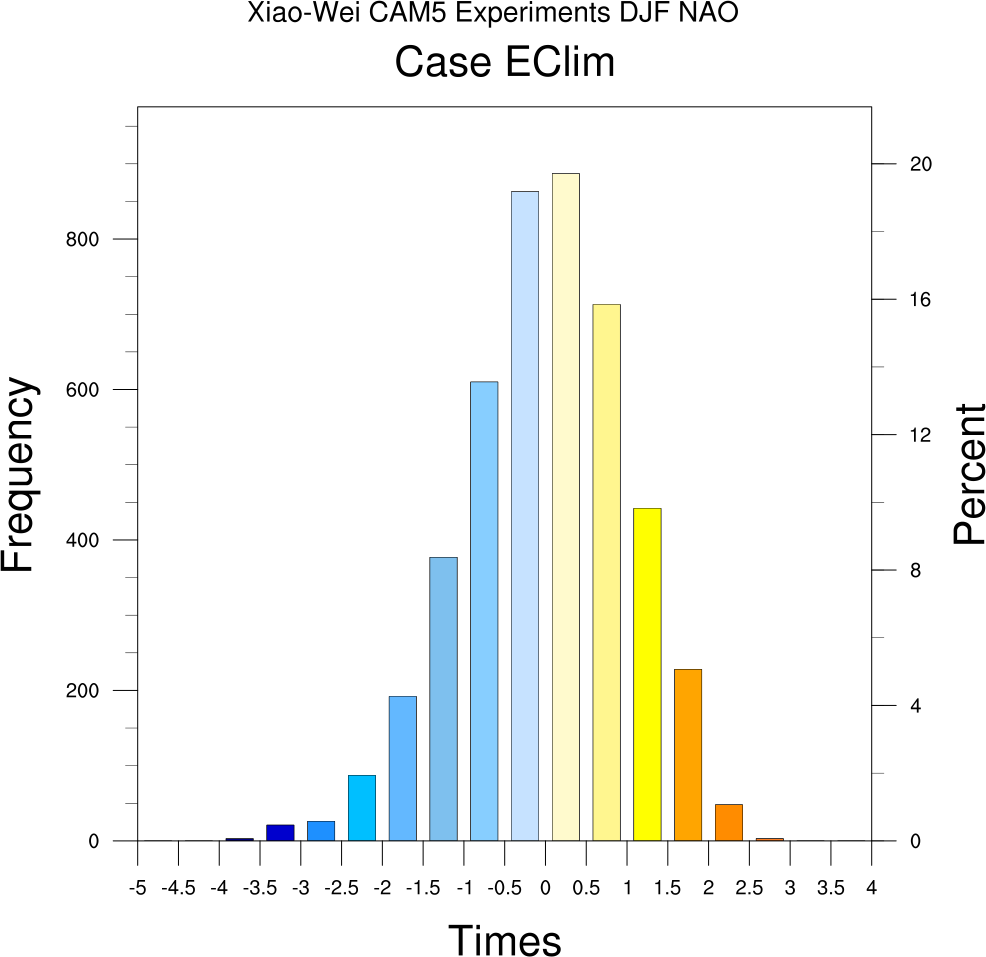
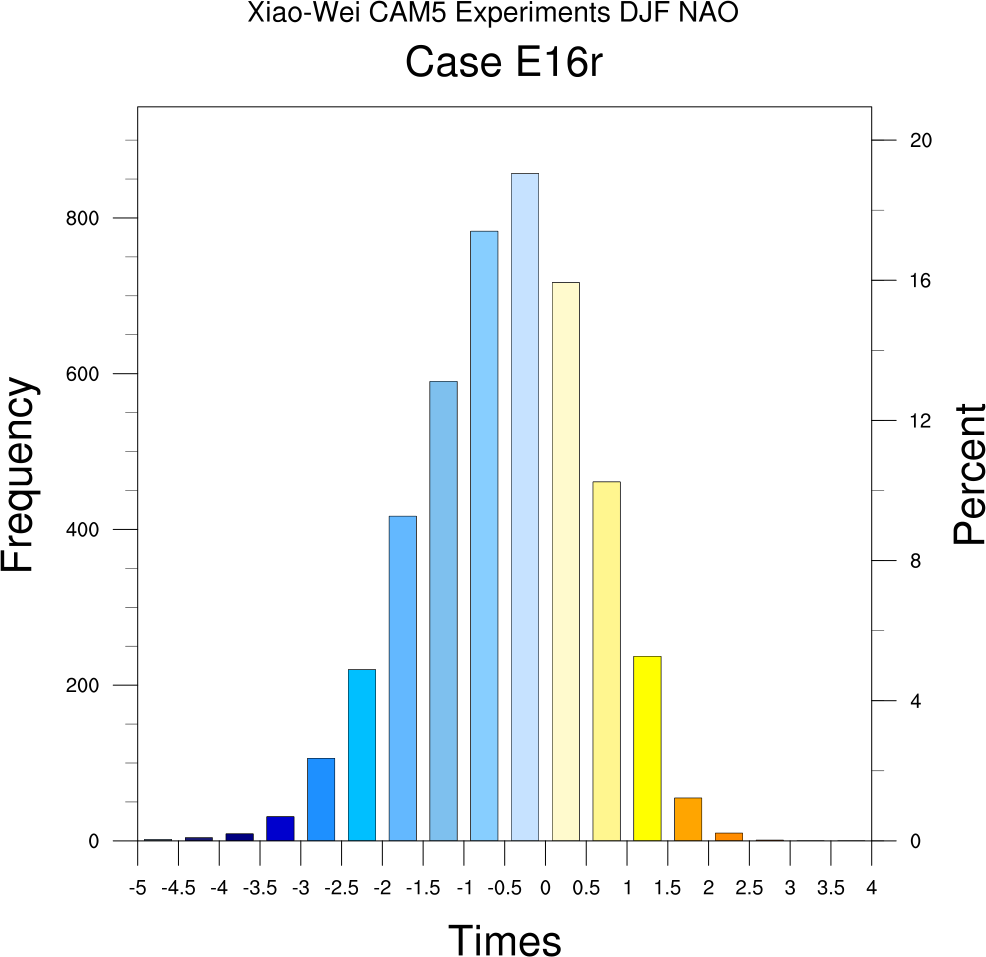
NAO from Control Climatology Z500:
Time-series projections on Control Climatology NAO:
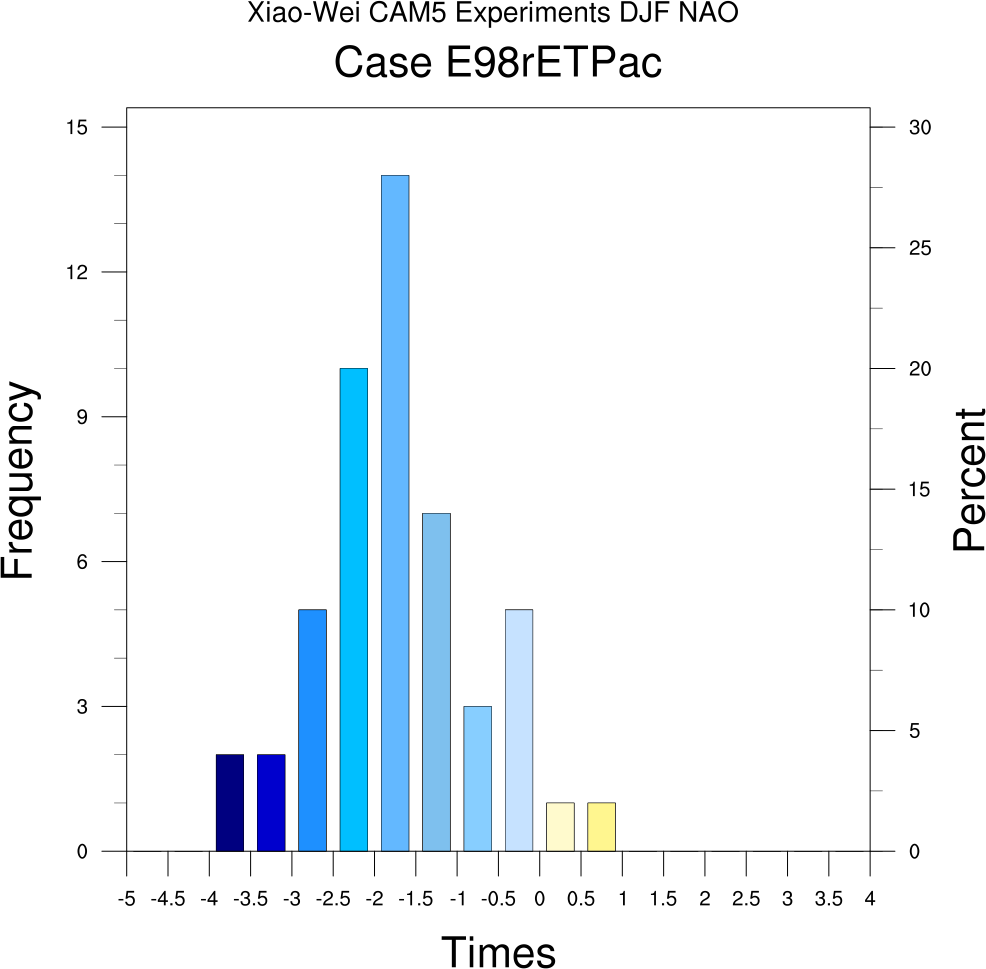
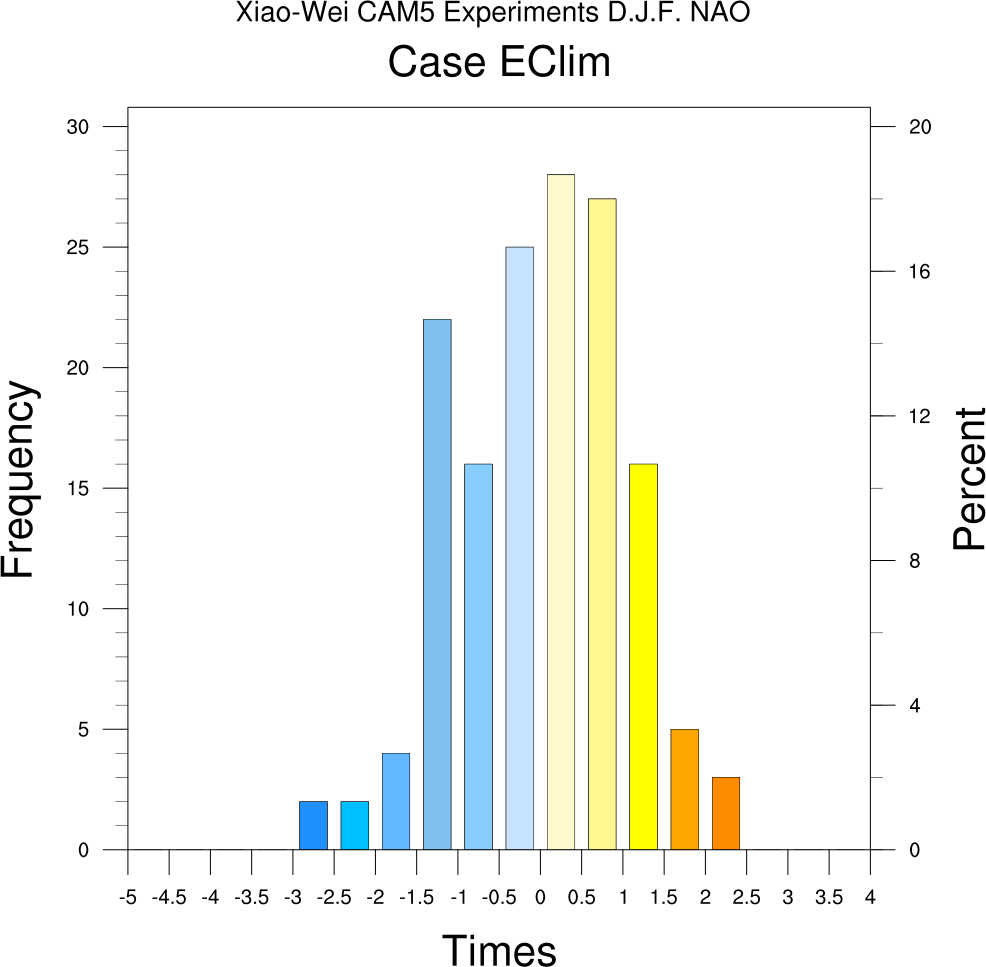
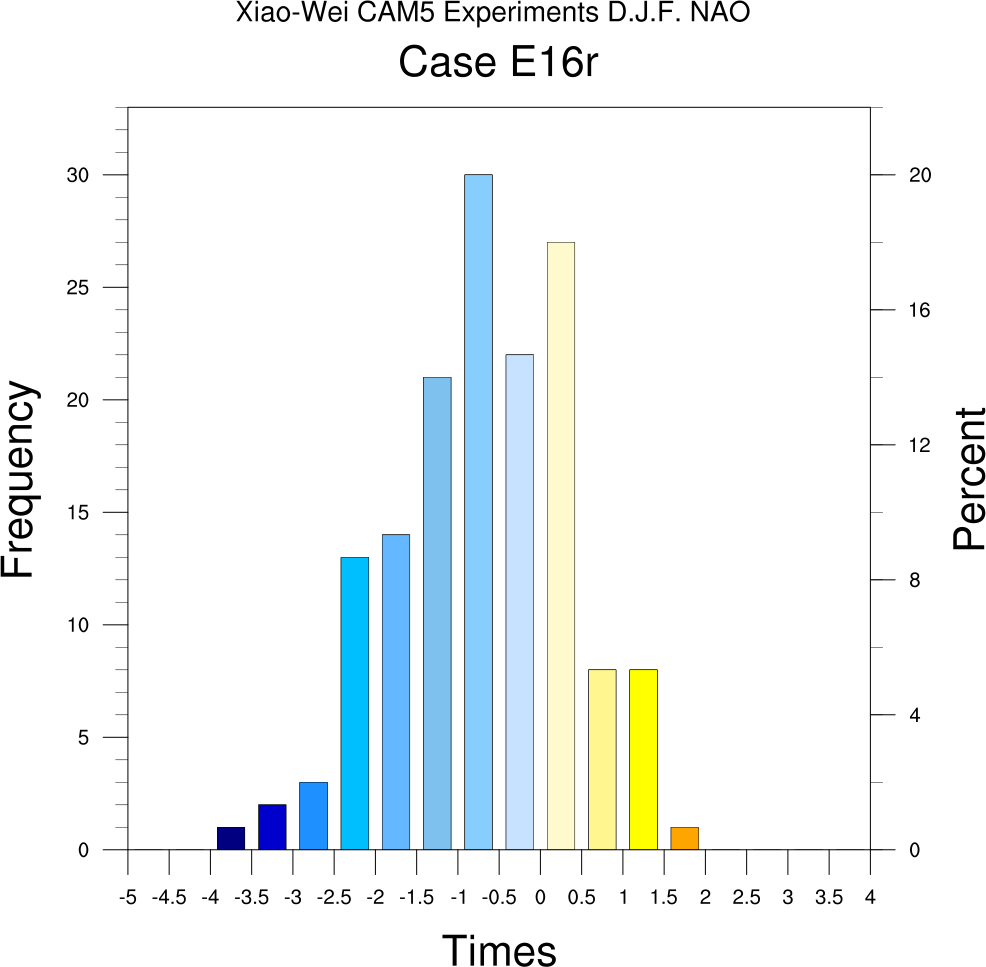
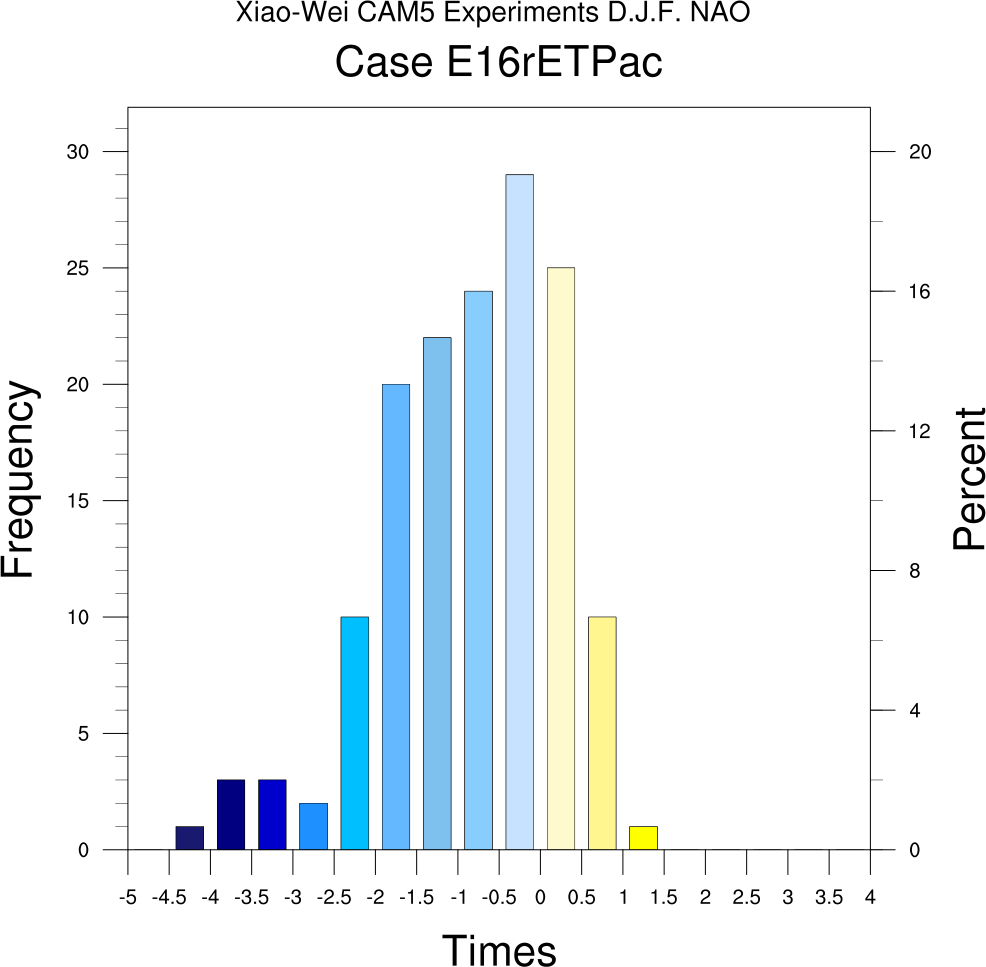
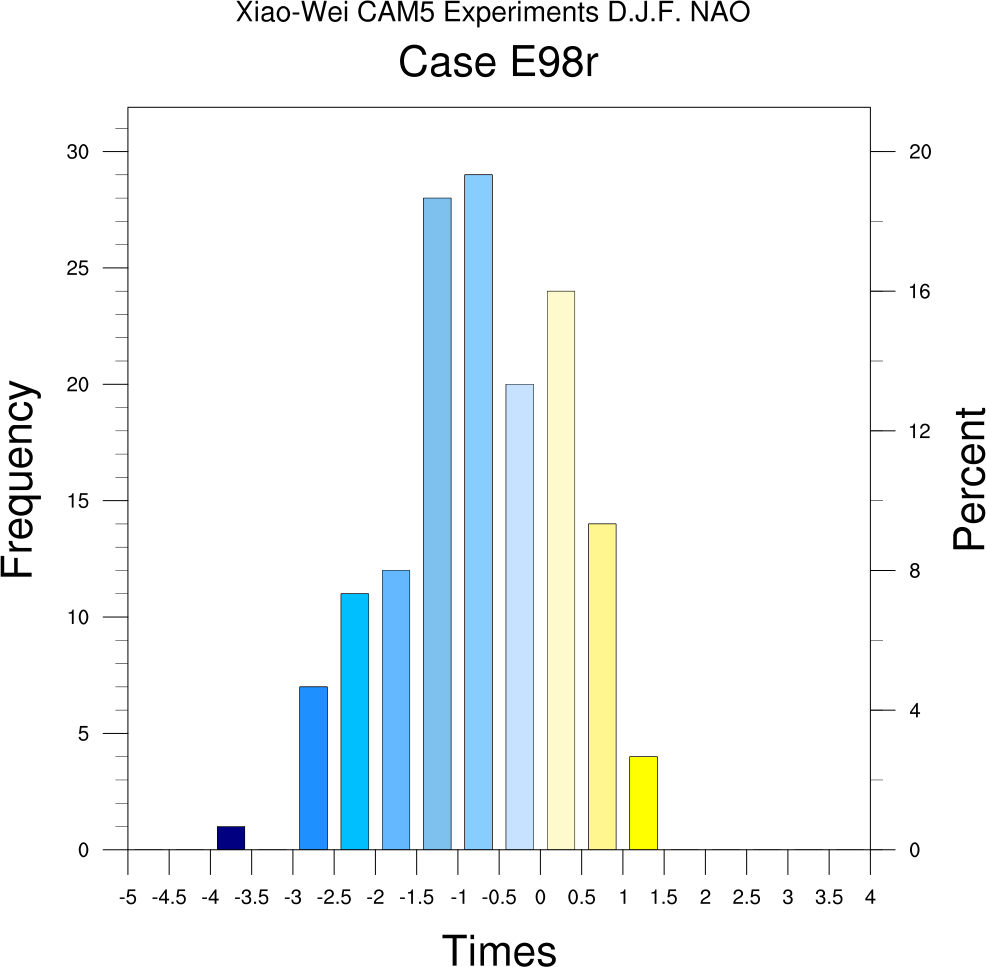
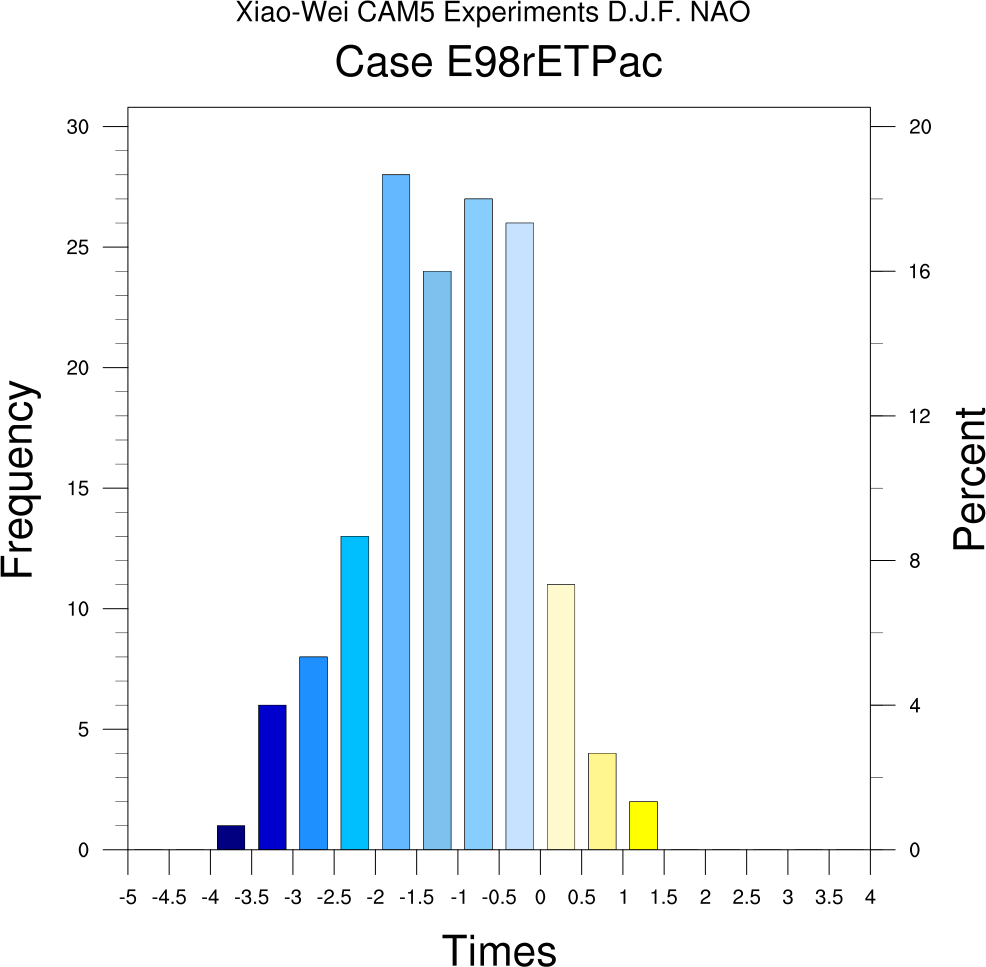
Following plots created from seasonal DJF data (1 per year):
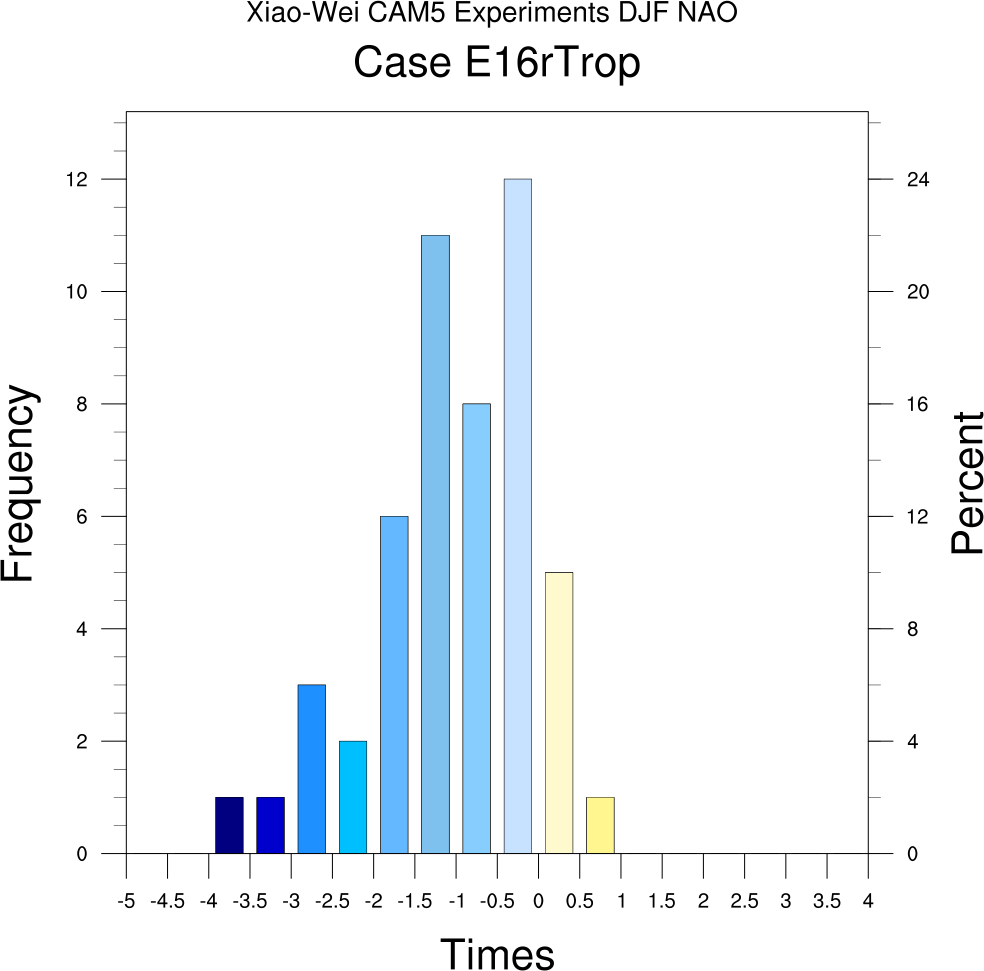
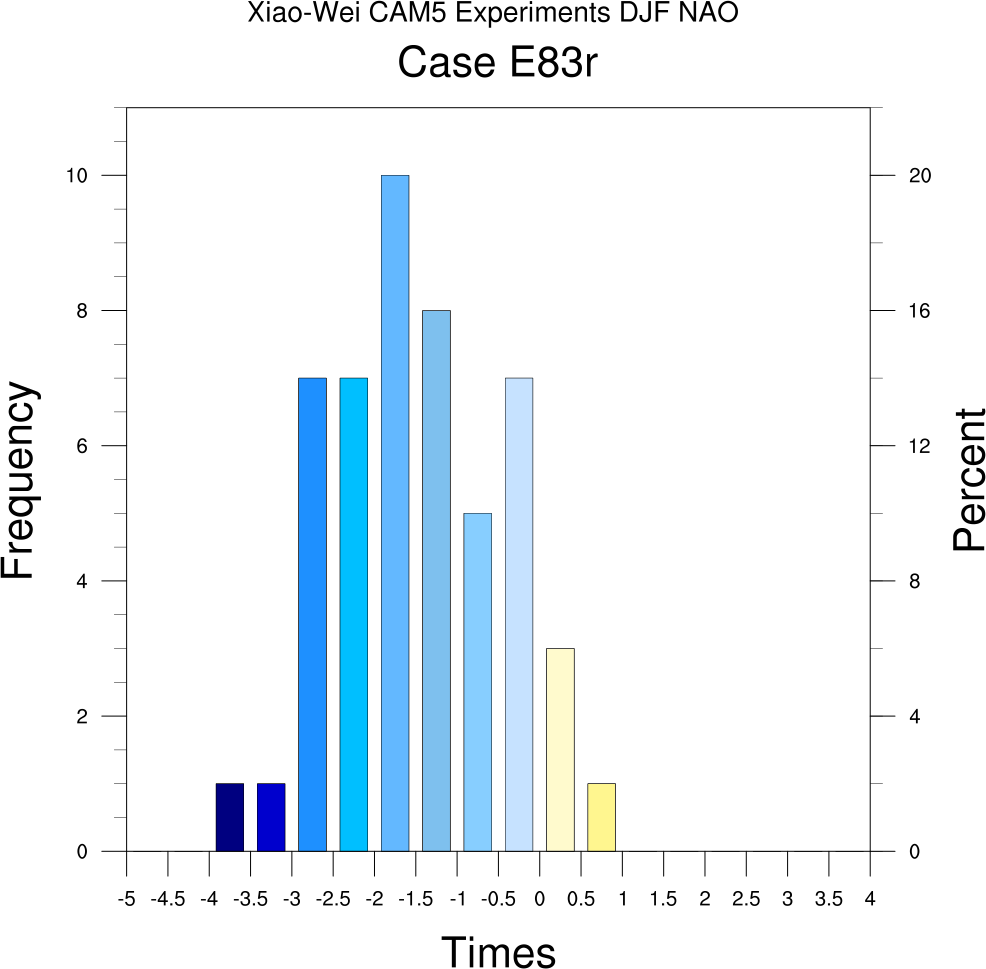
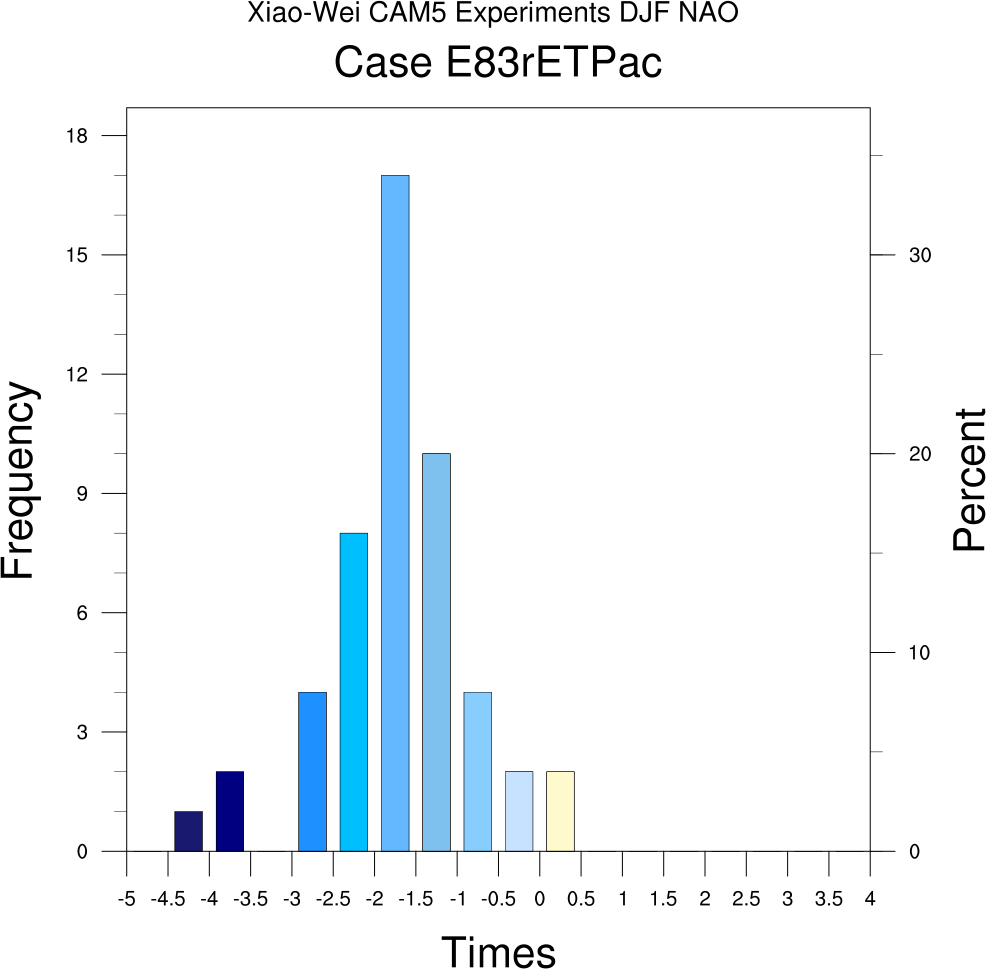
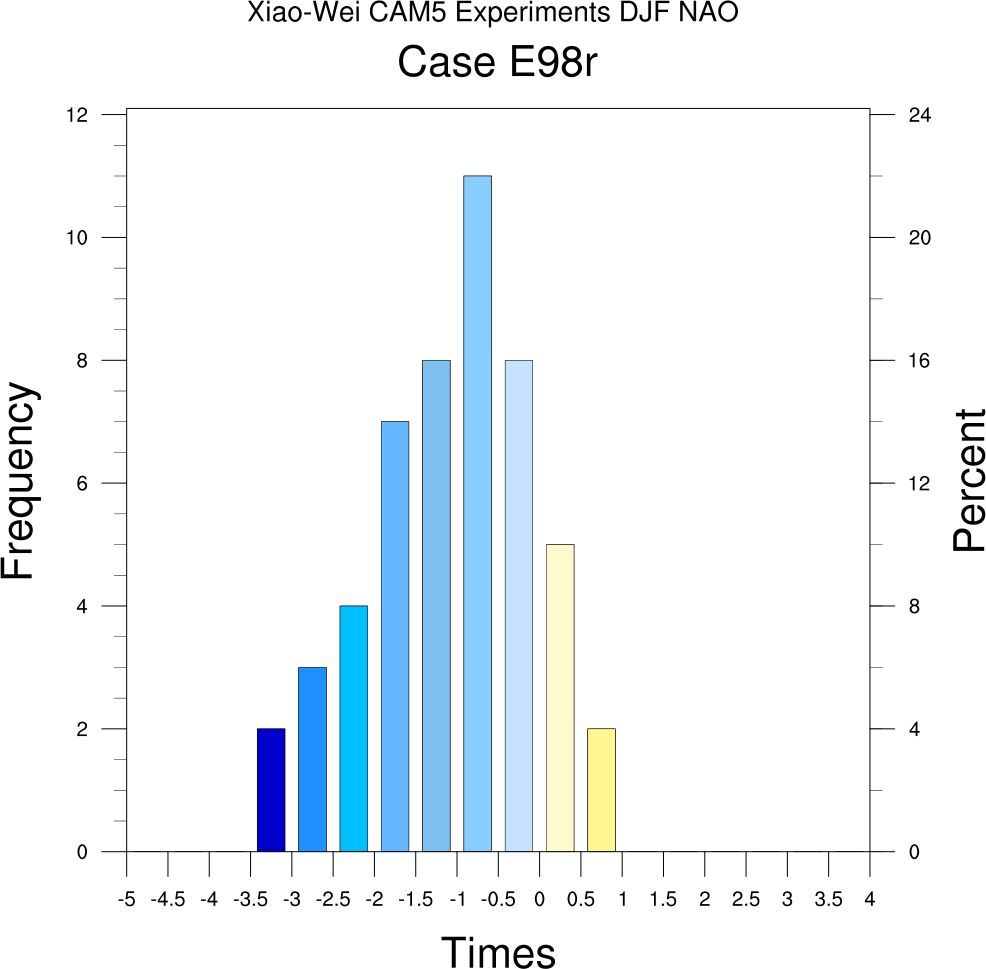
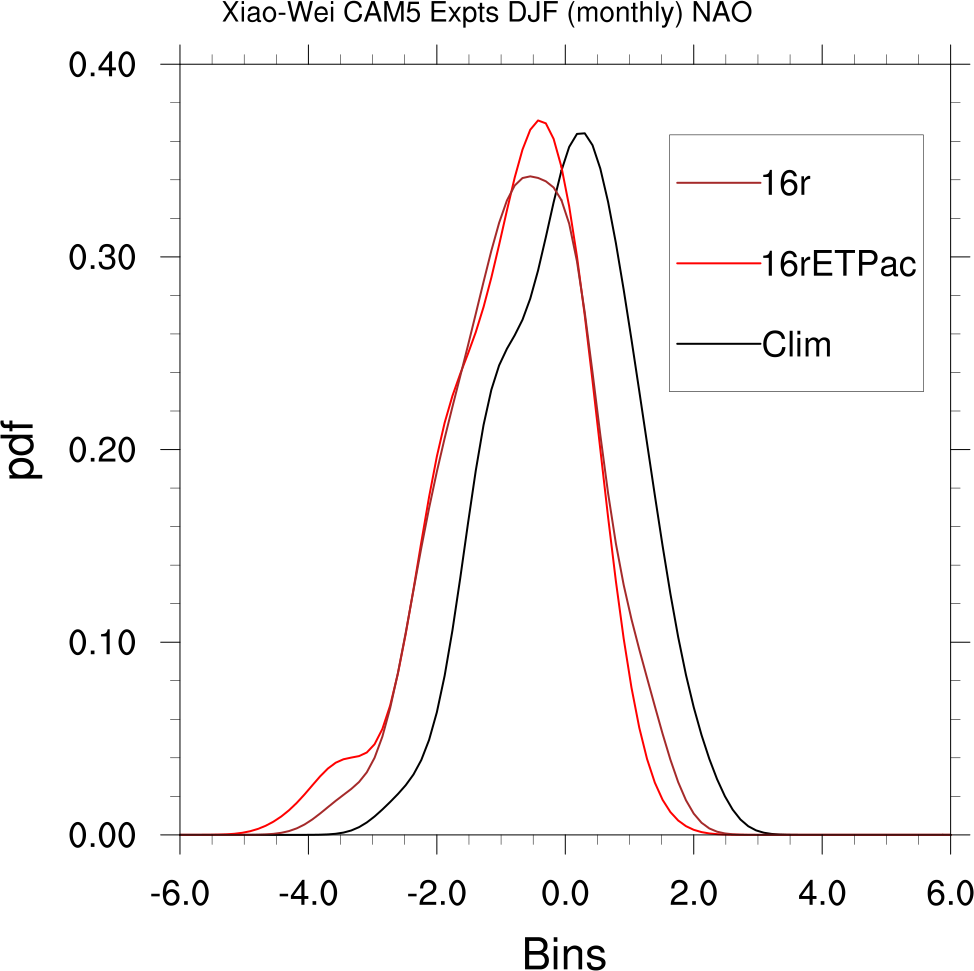
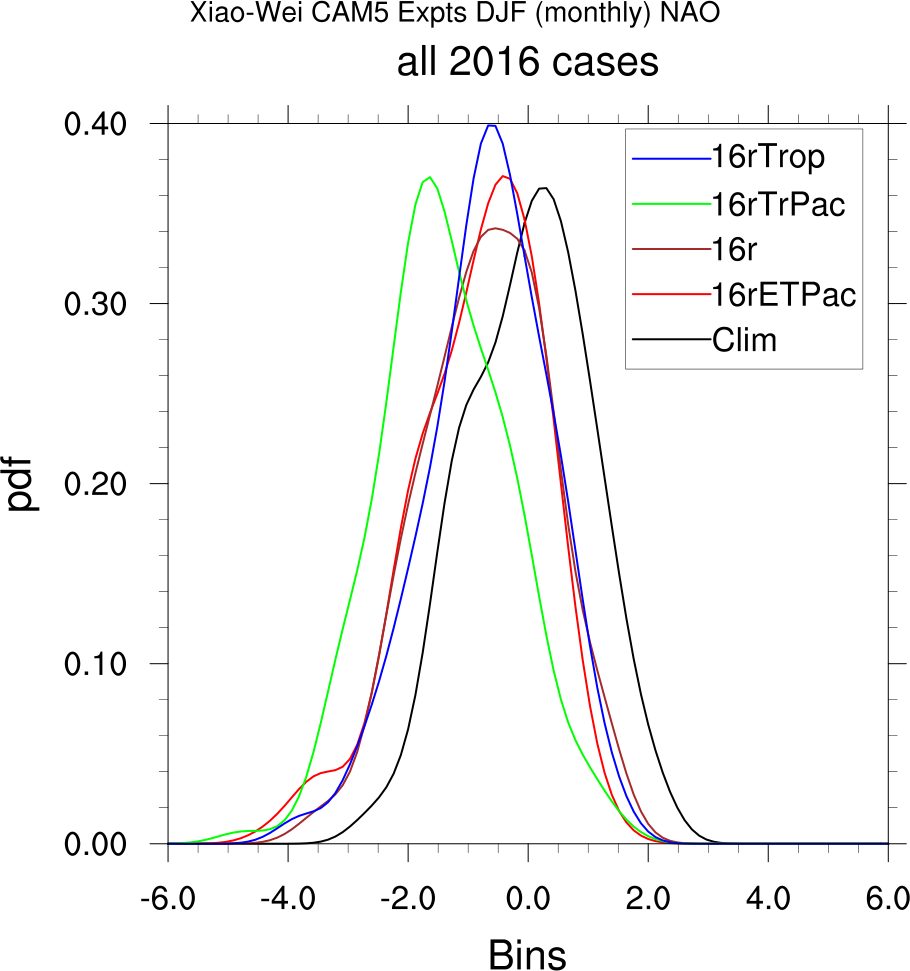
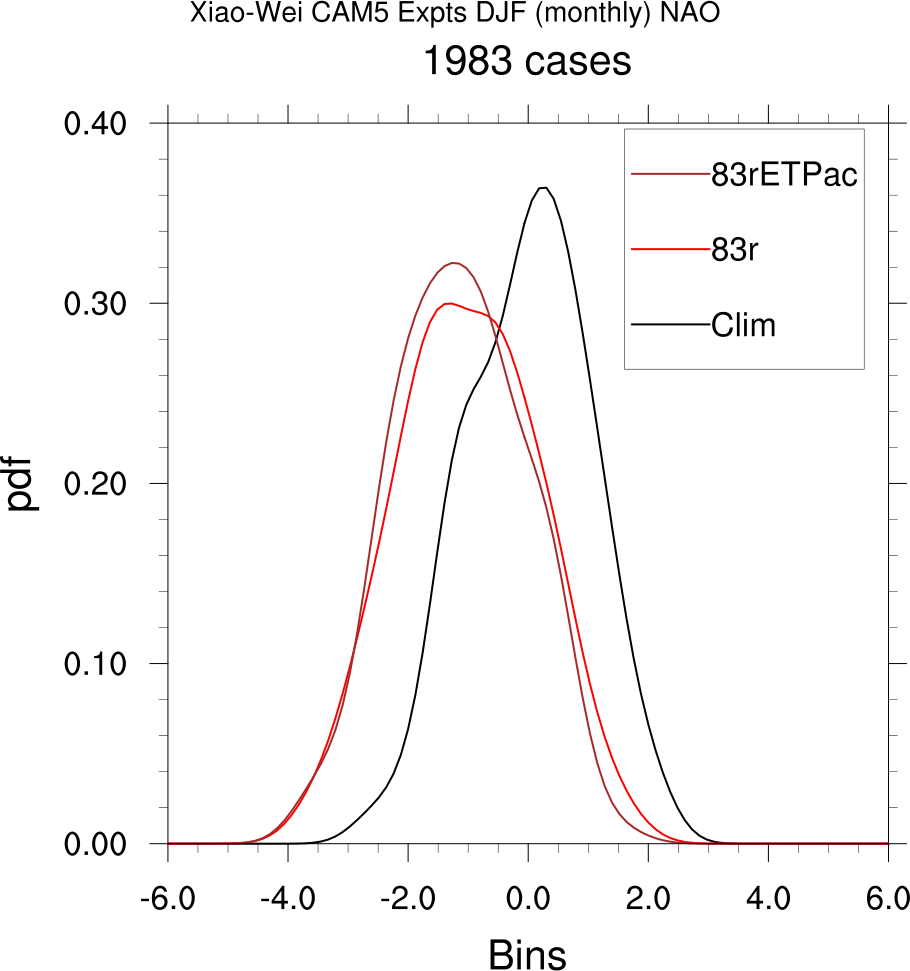
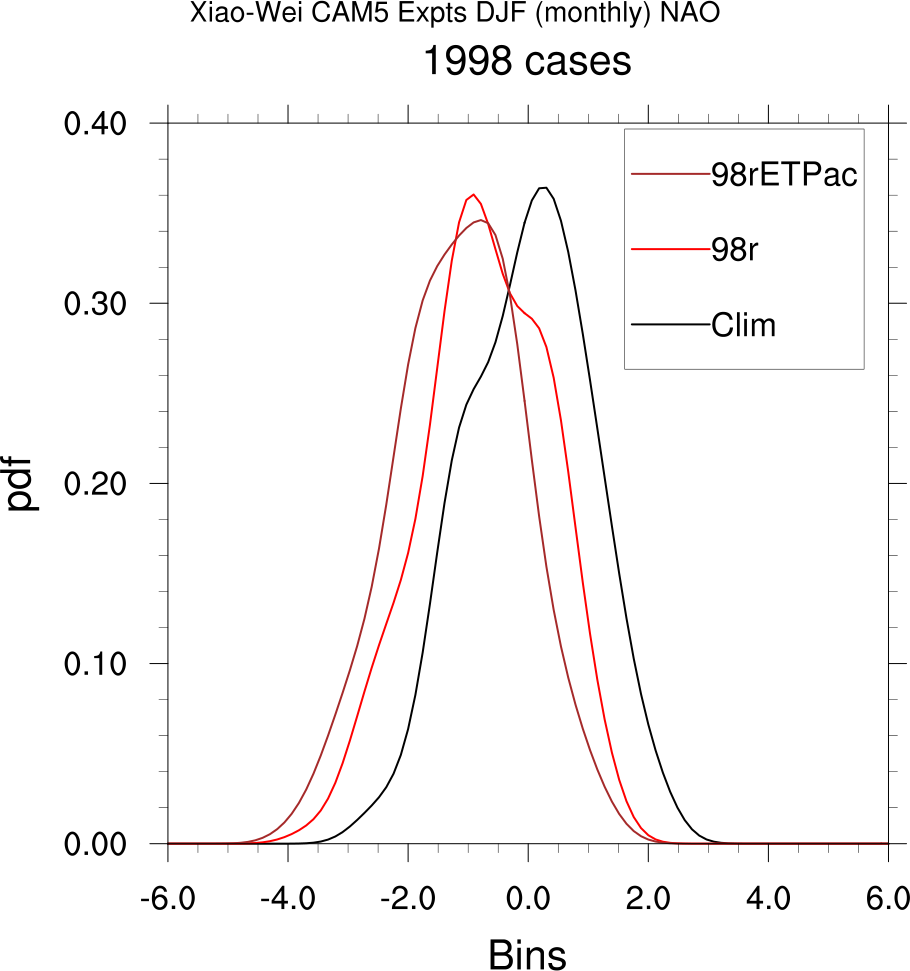
Following plots created from monthly DJF data (3 per year):
------------------------------
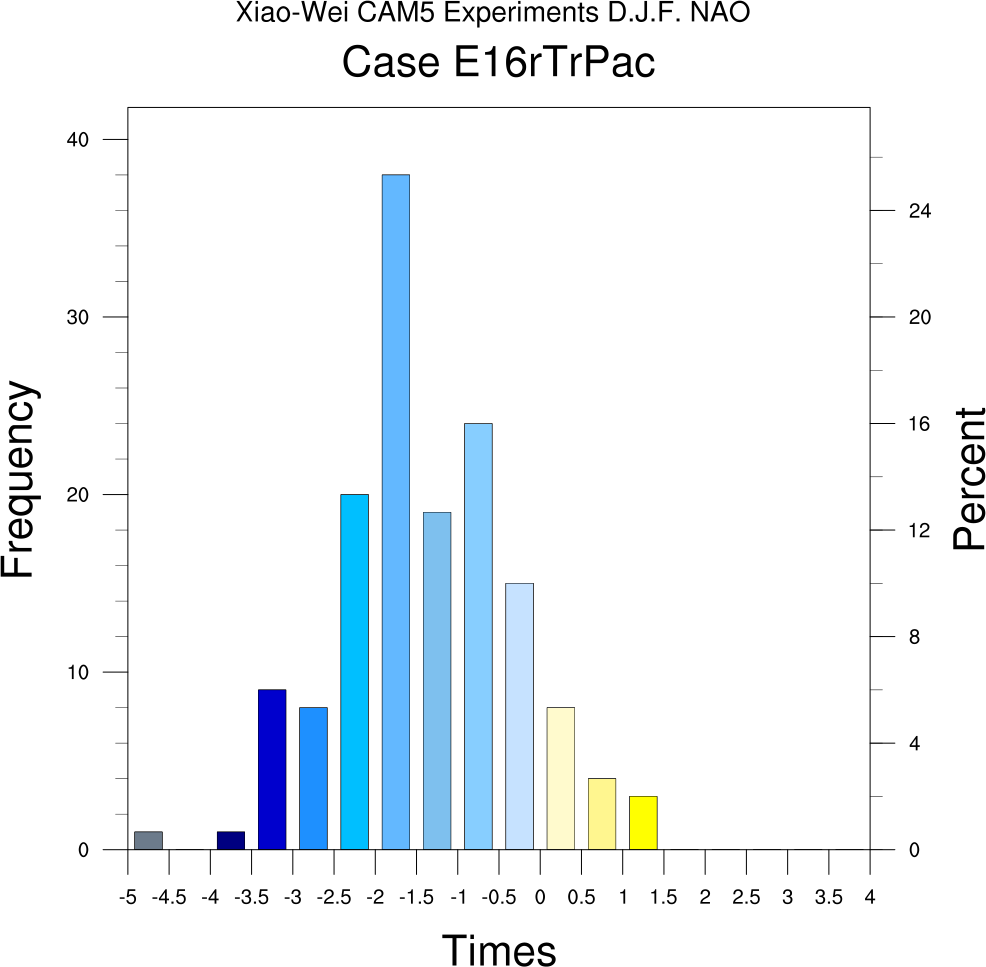
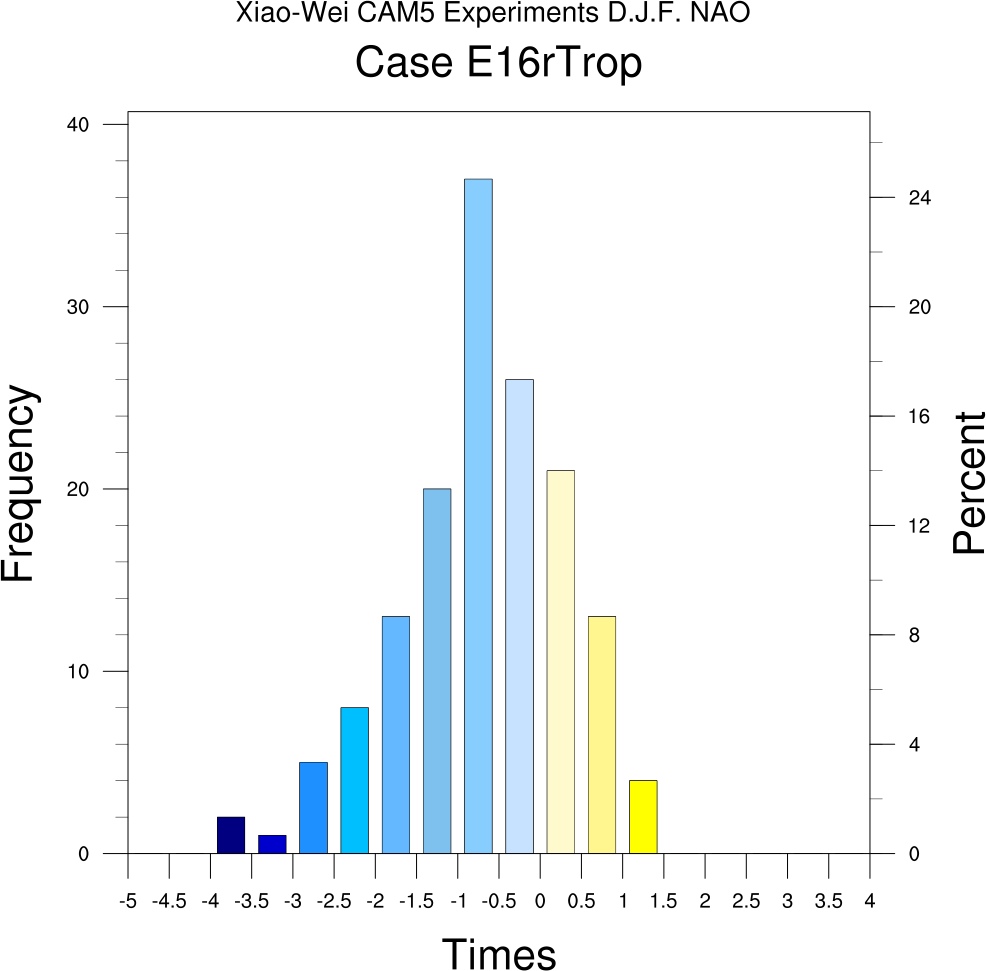
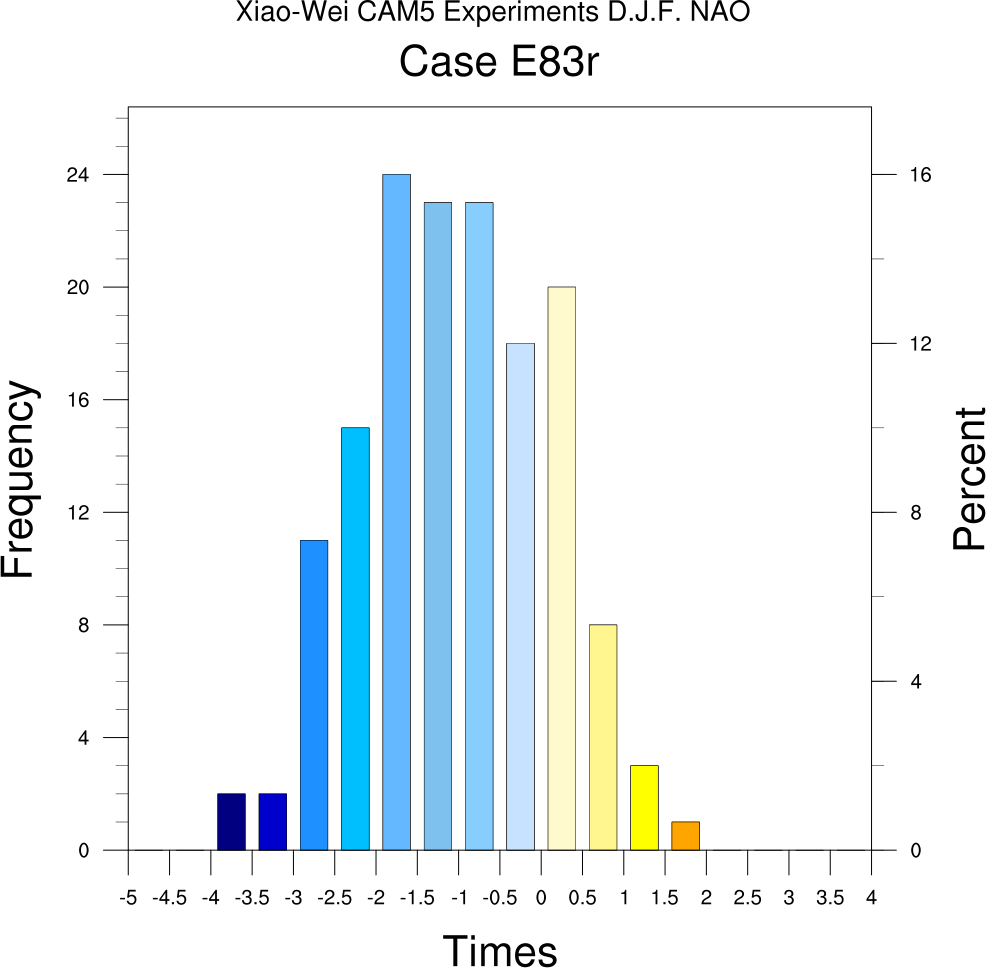
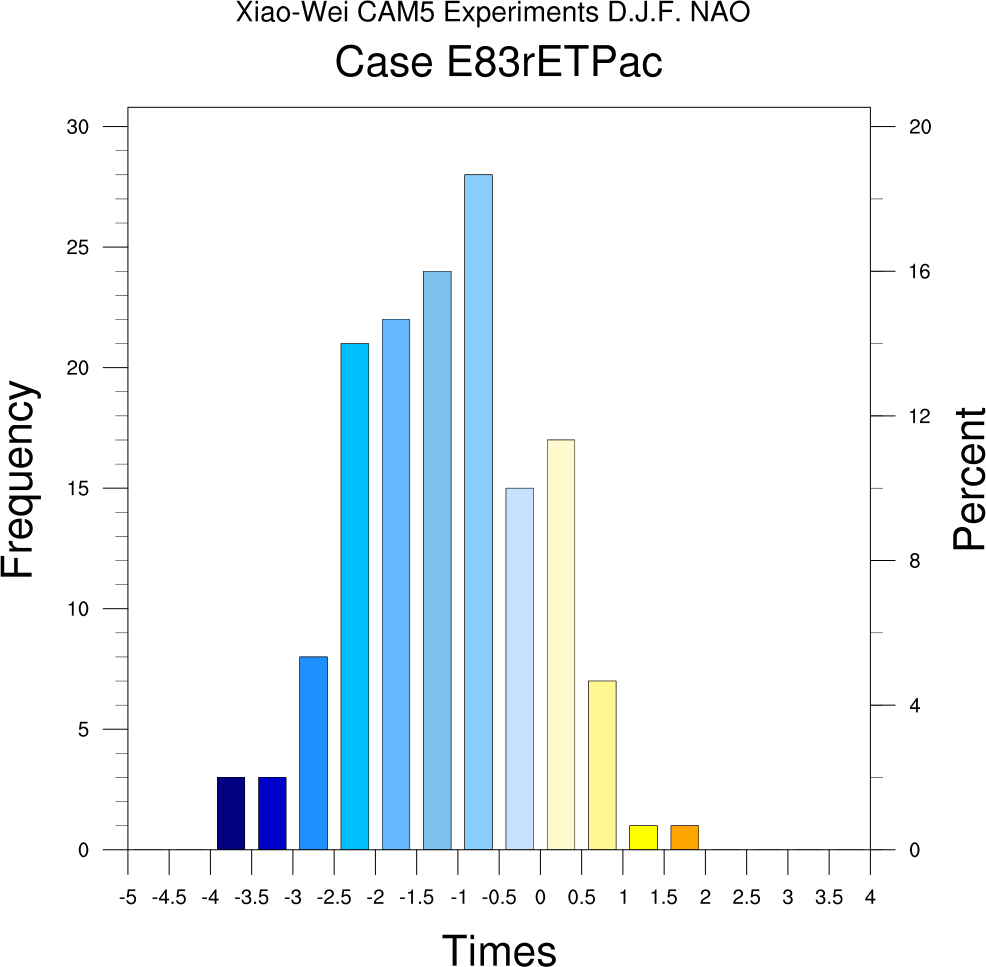
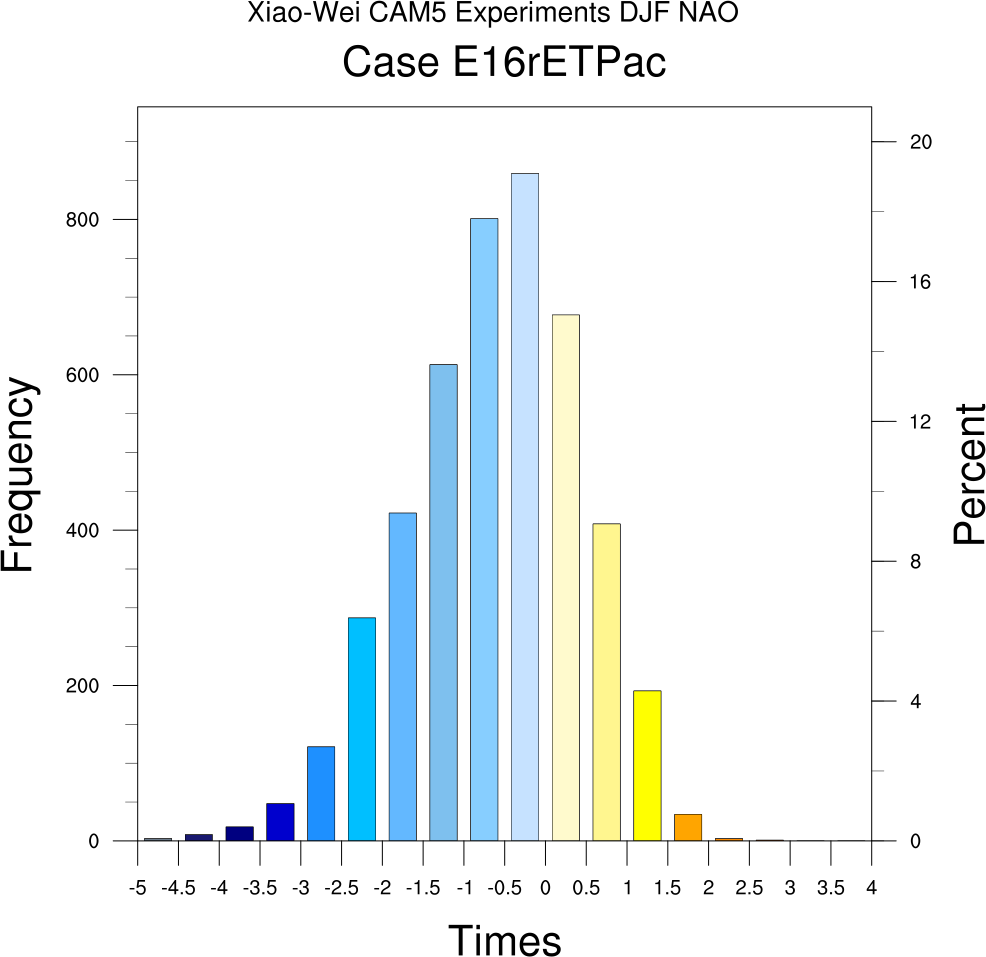
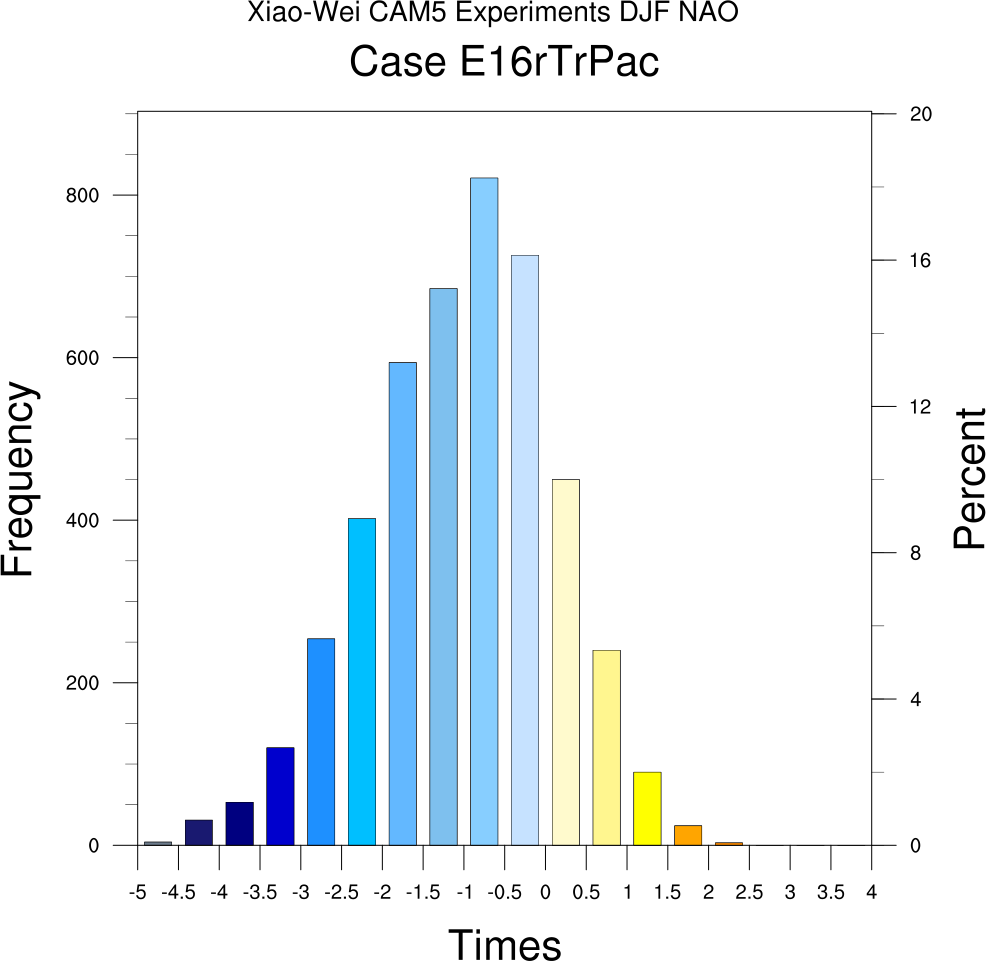
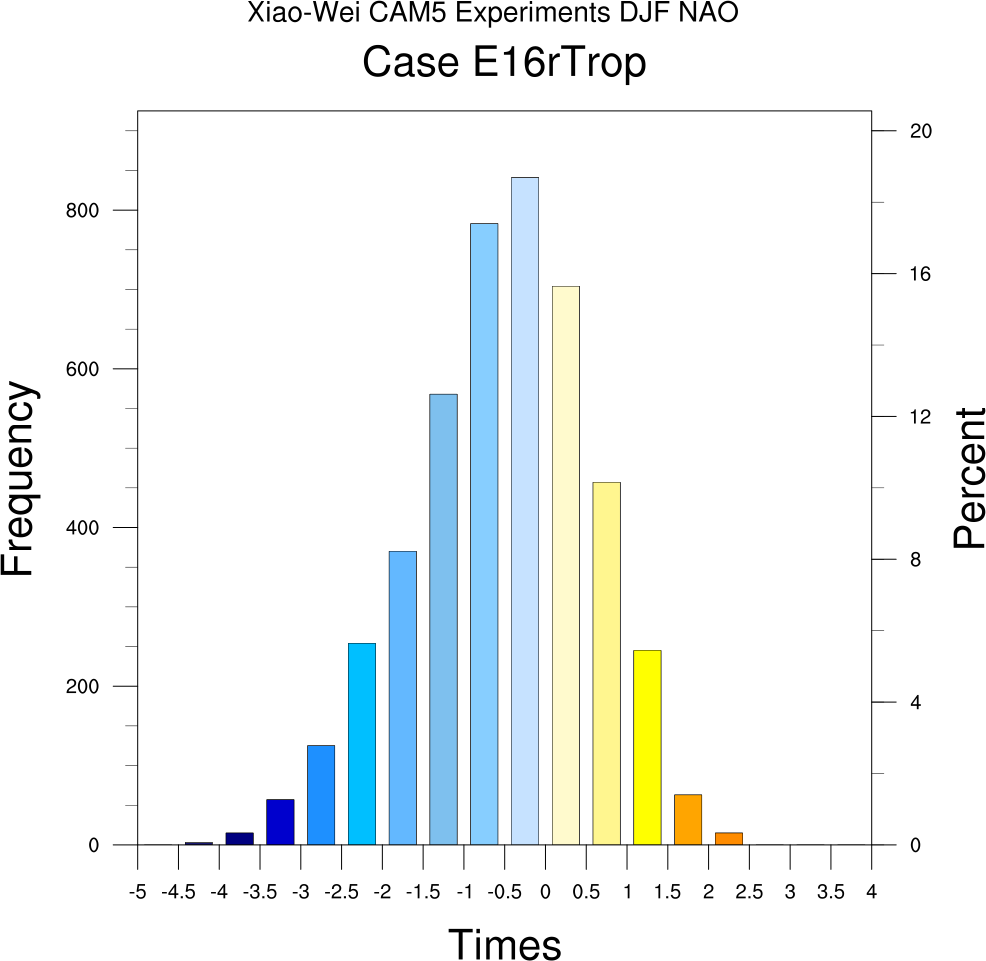
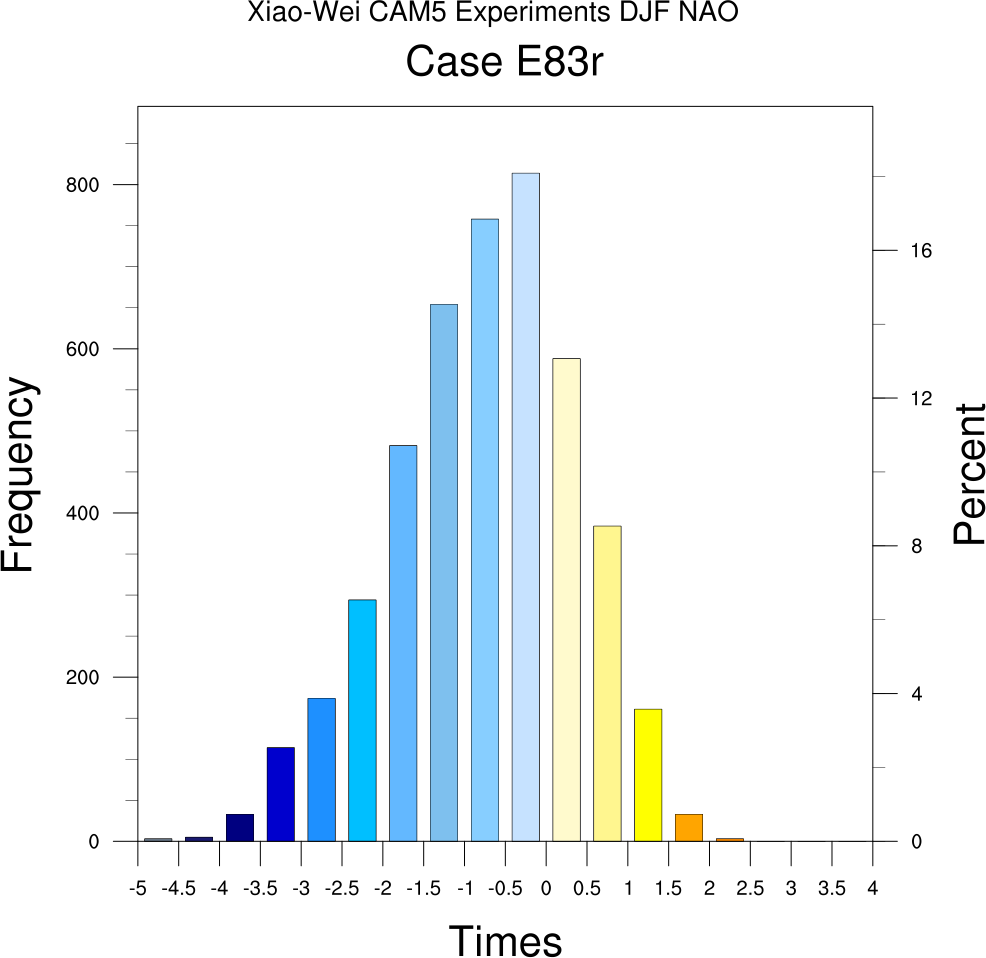
Following plots created from daily DJF data (90 per year):
-----------------------------------------
==========================================================================================================================
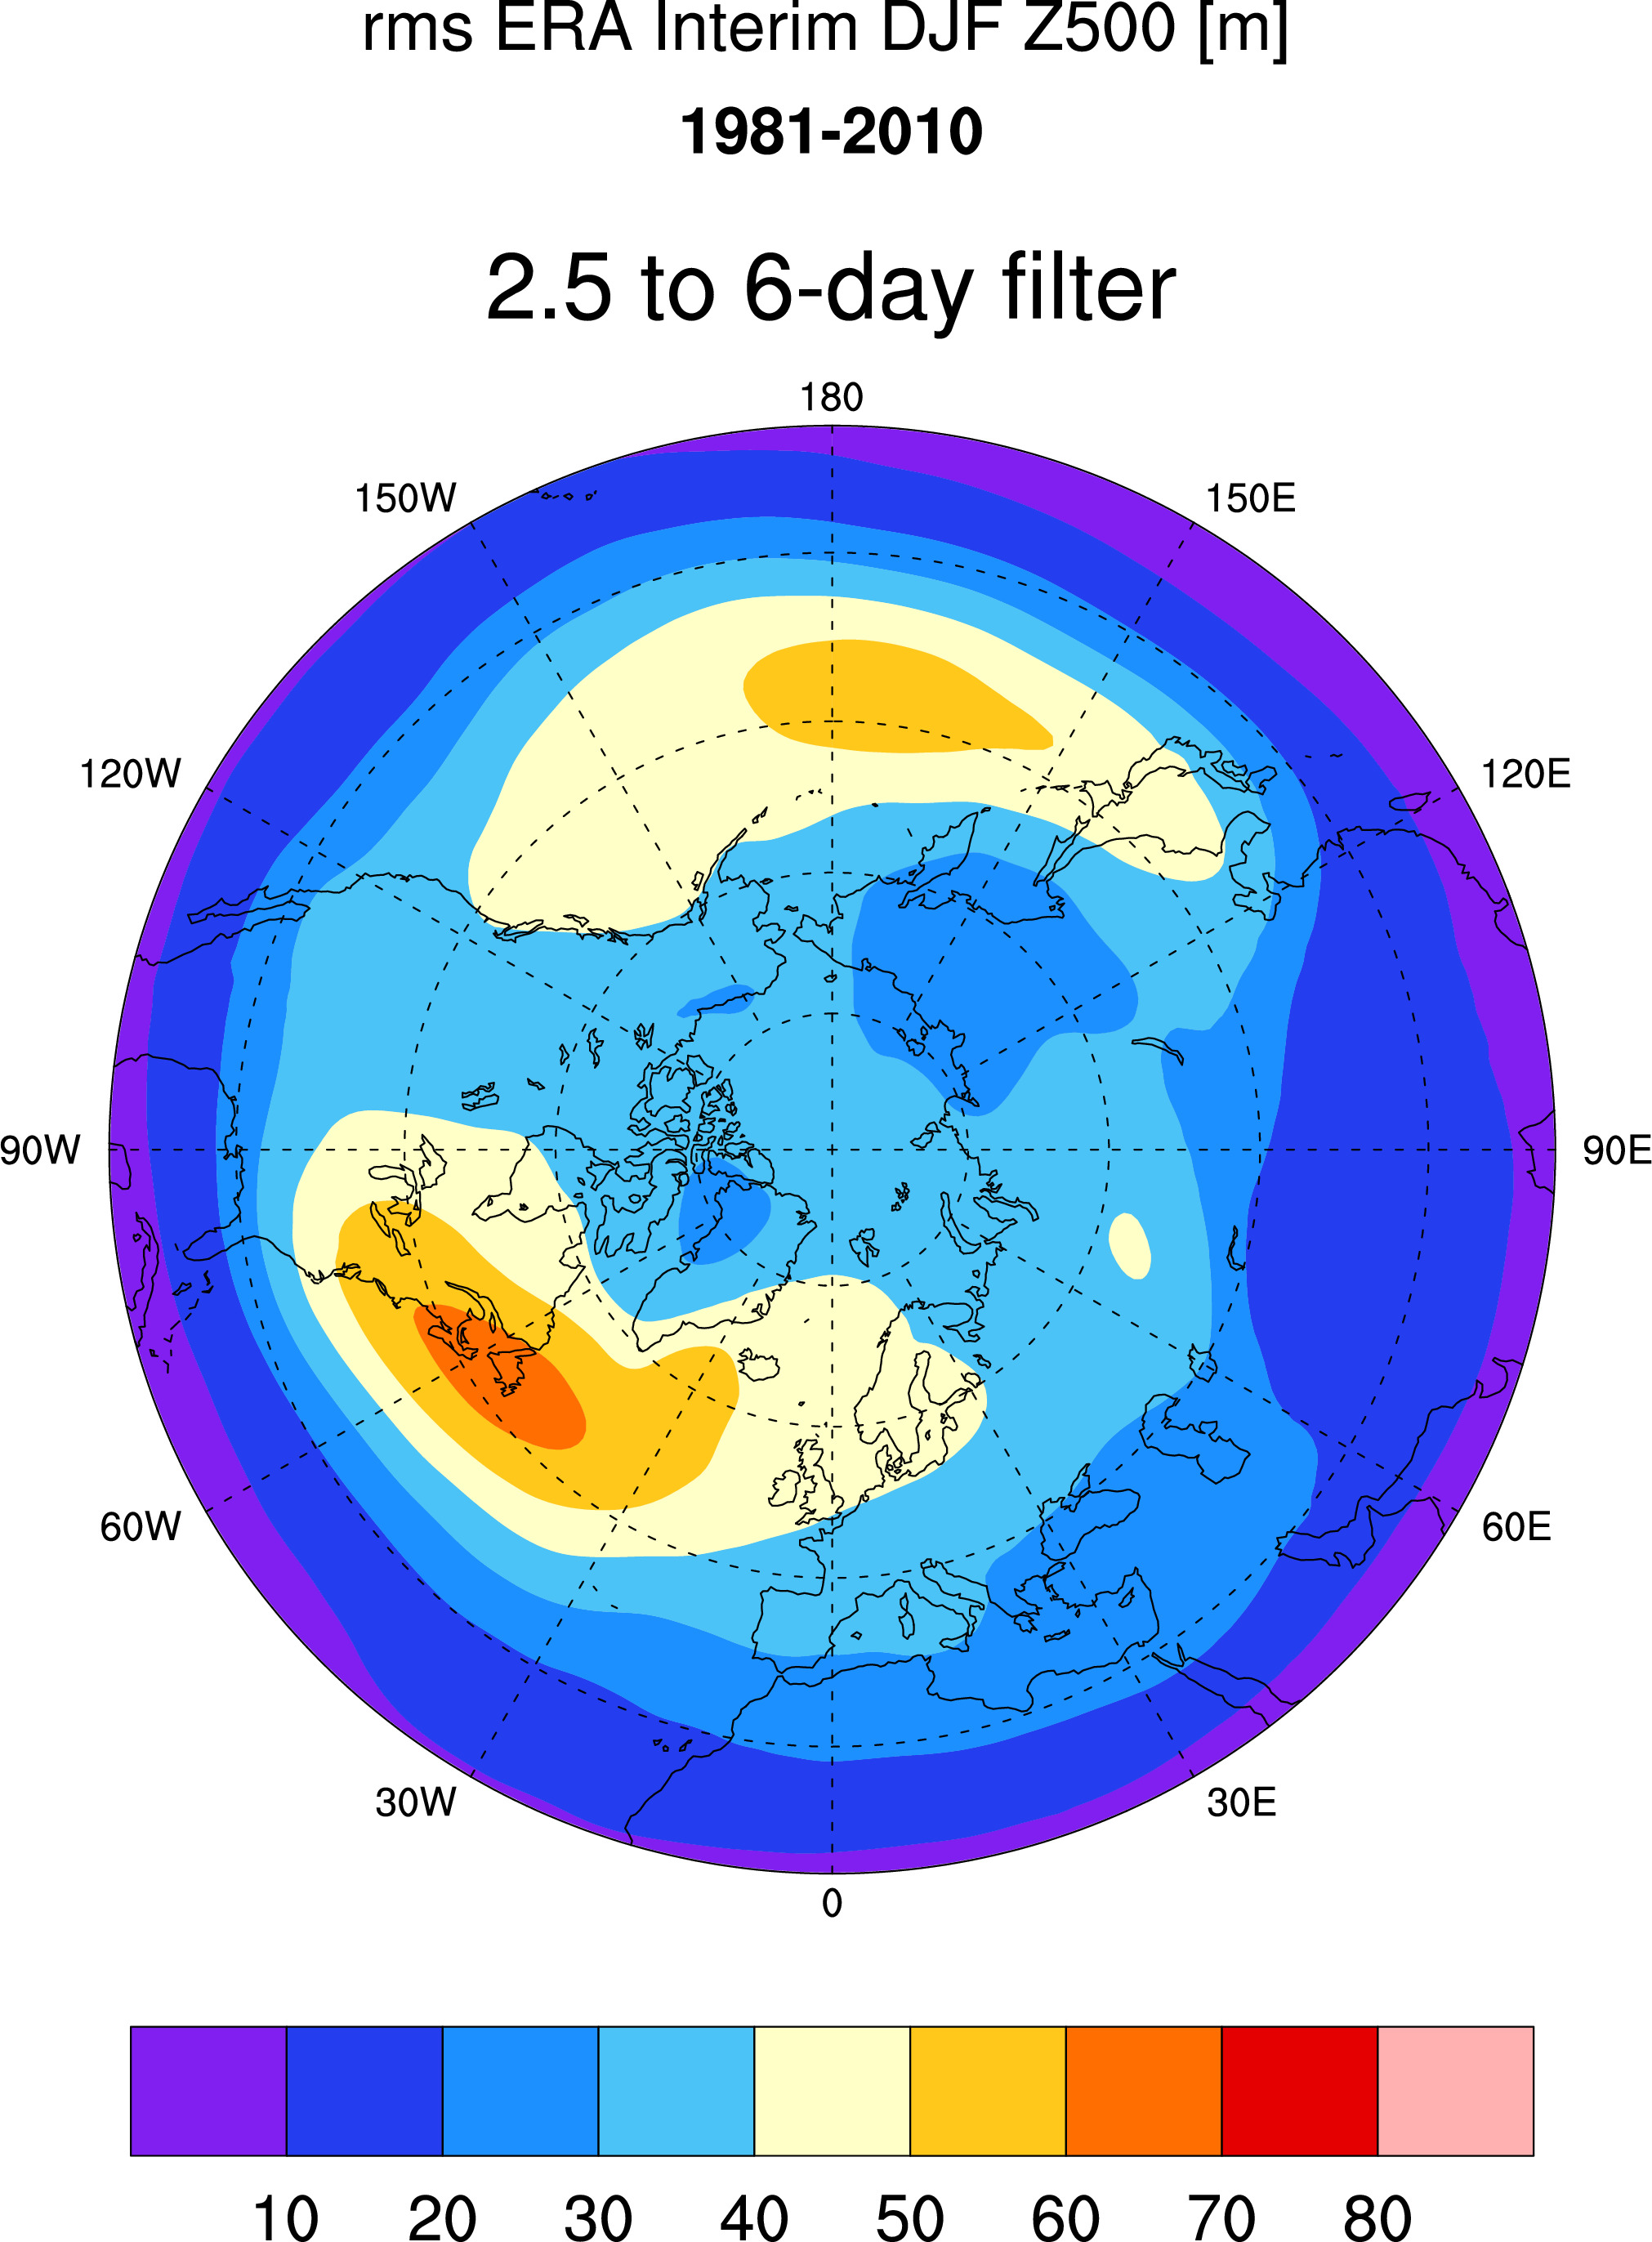
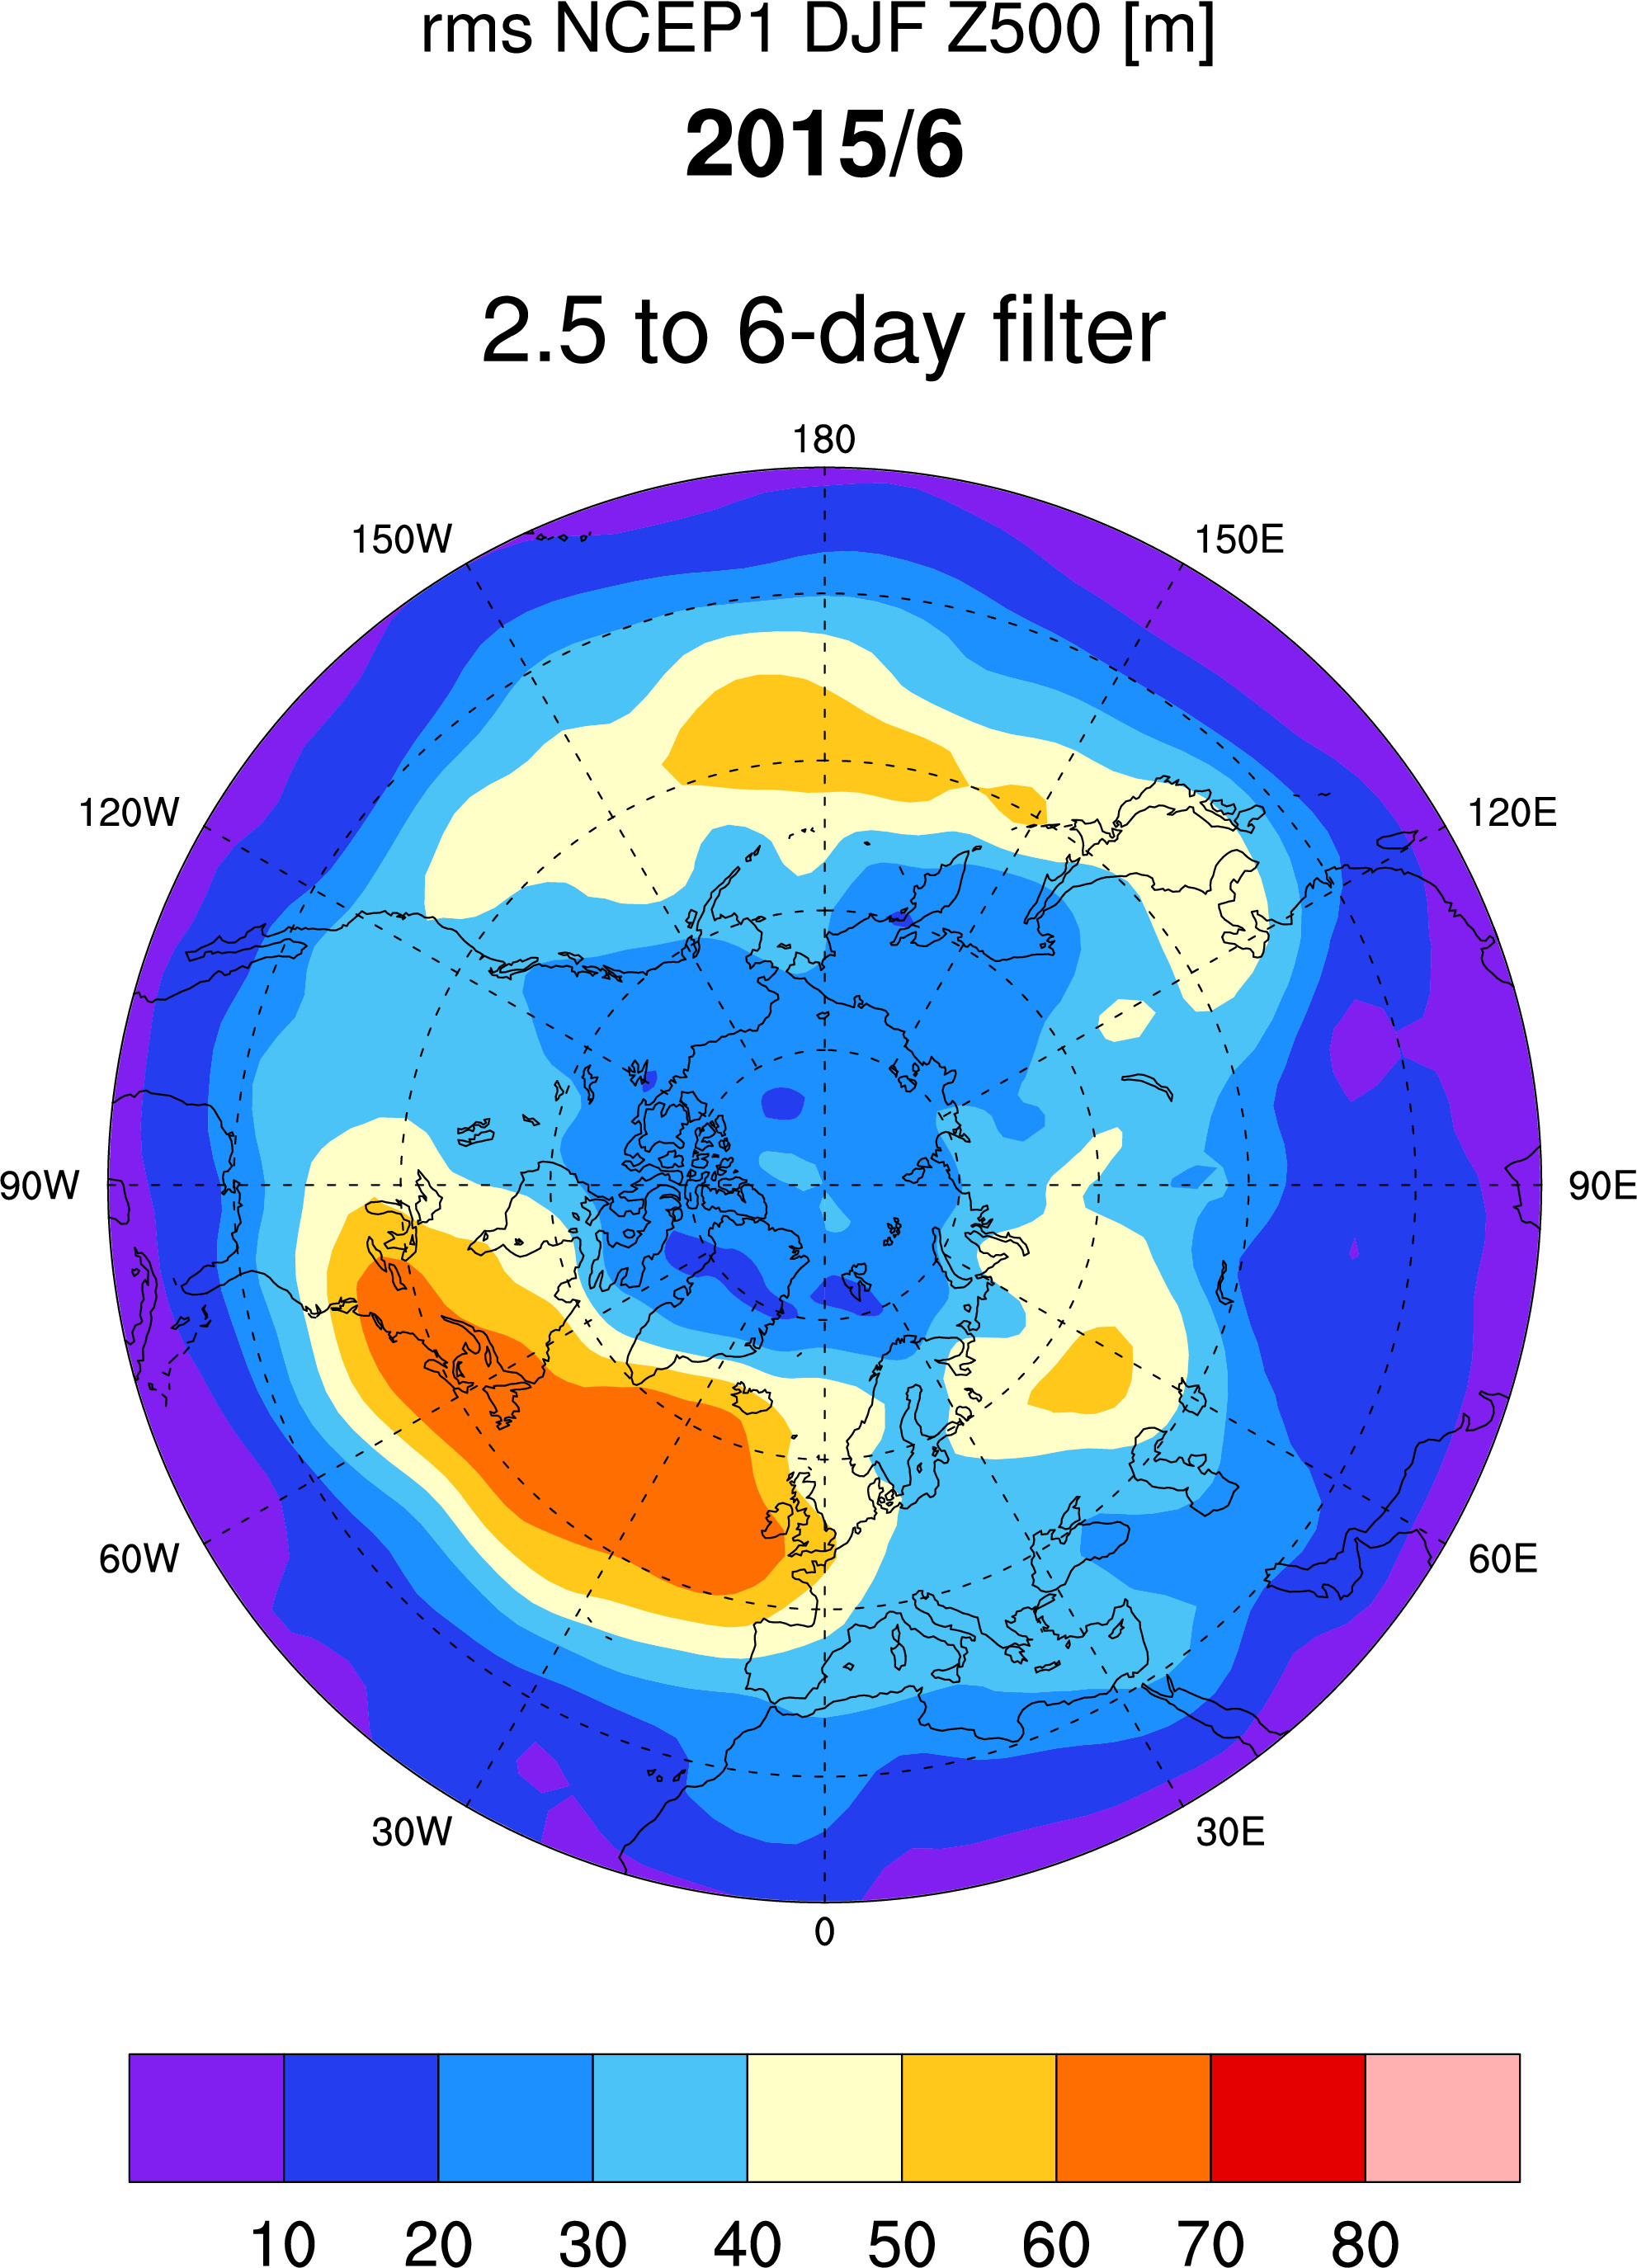
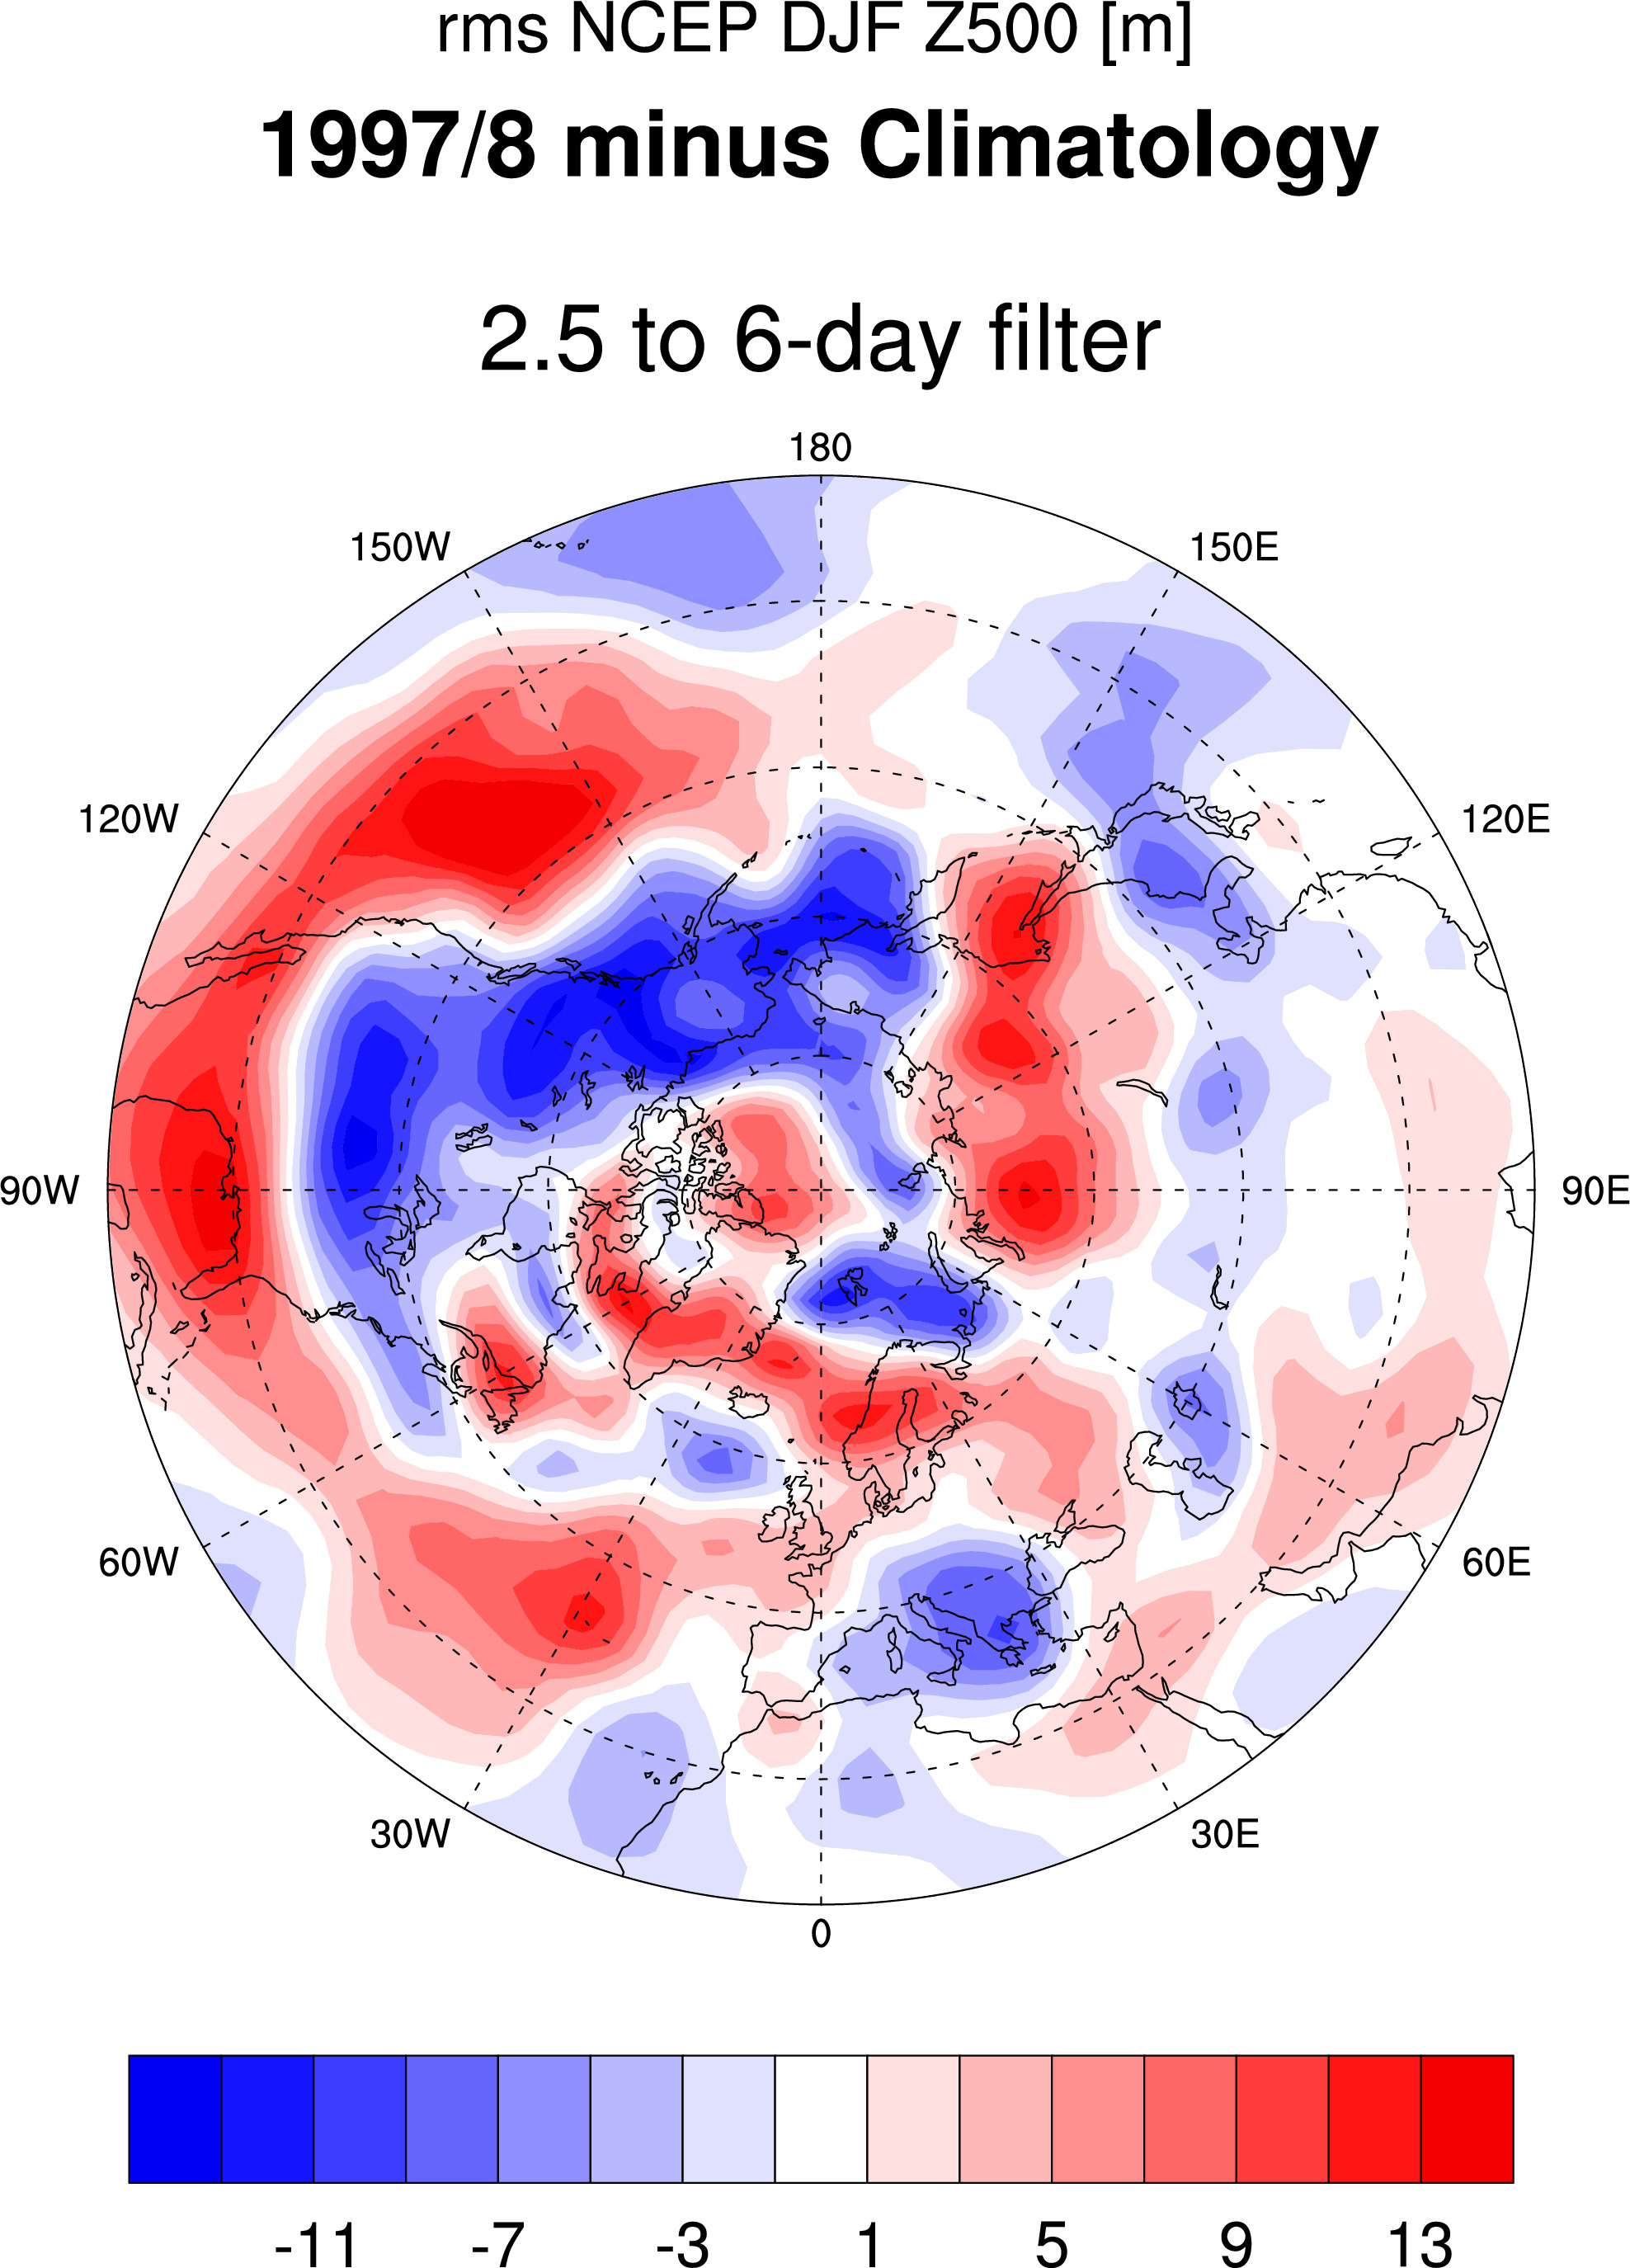
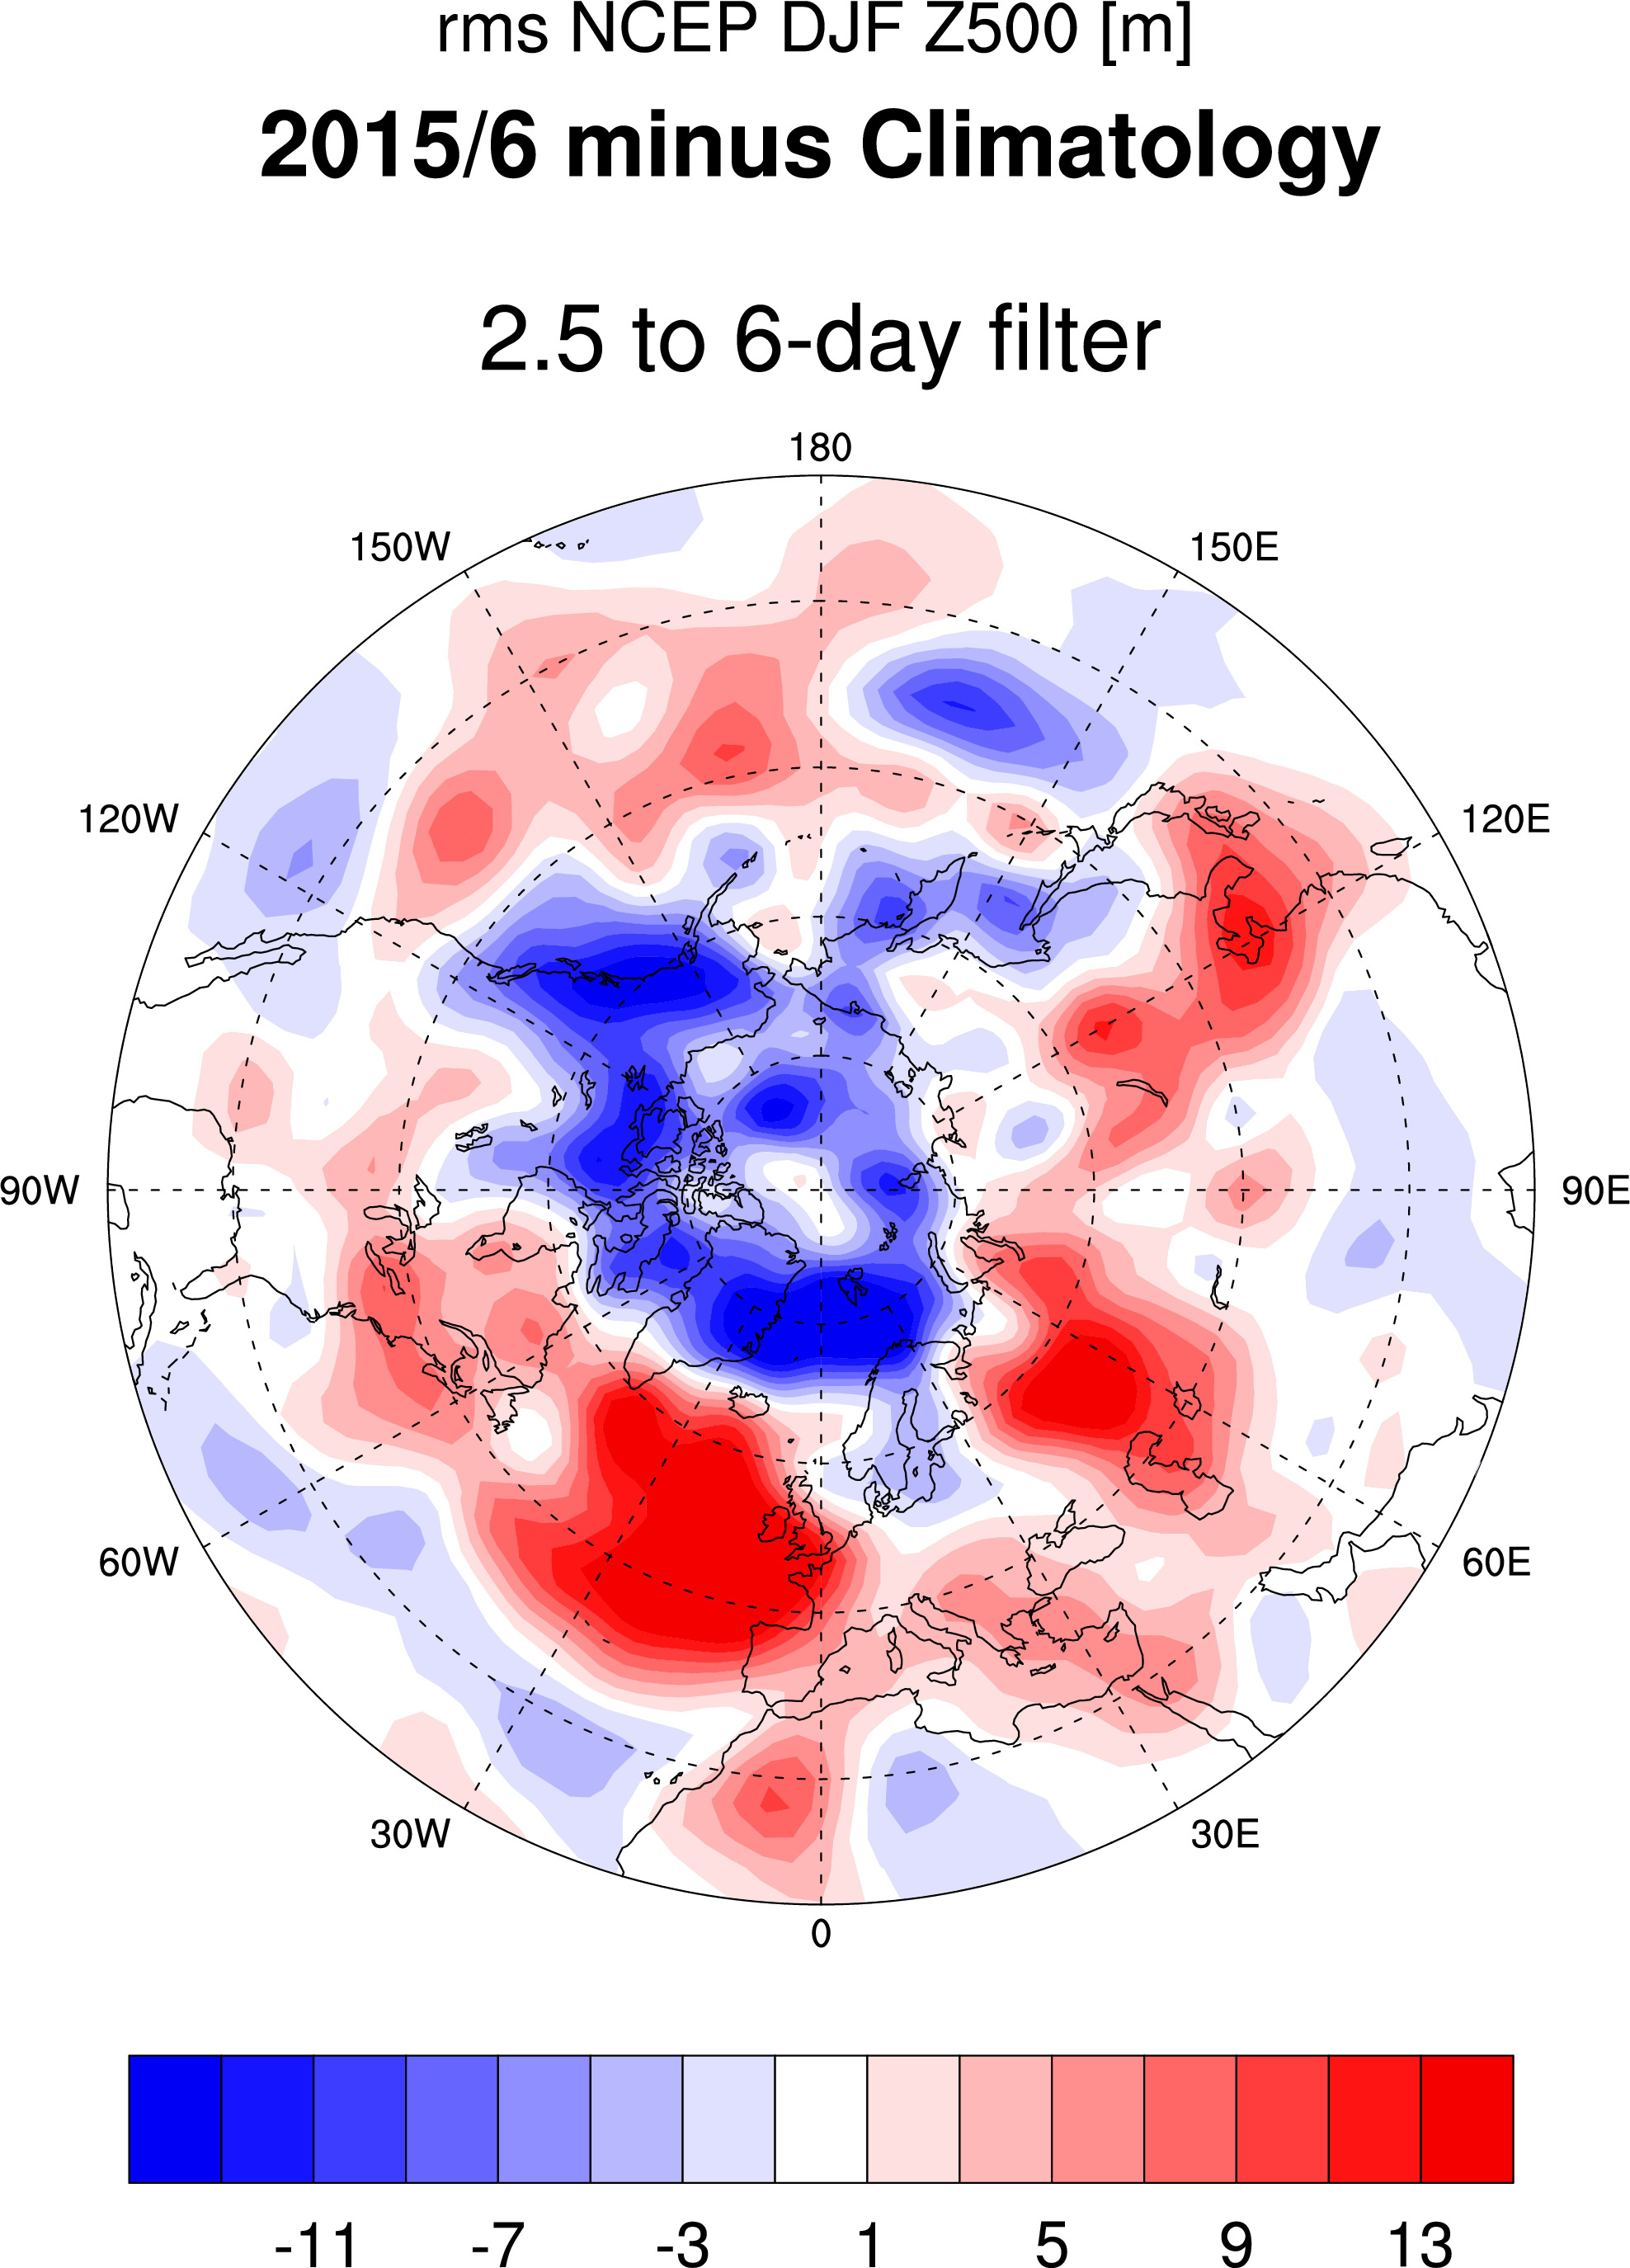
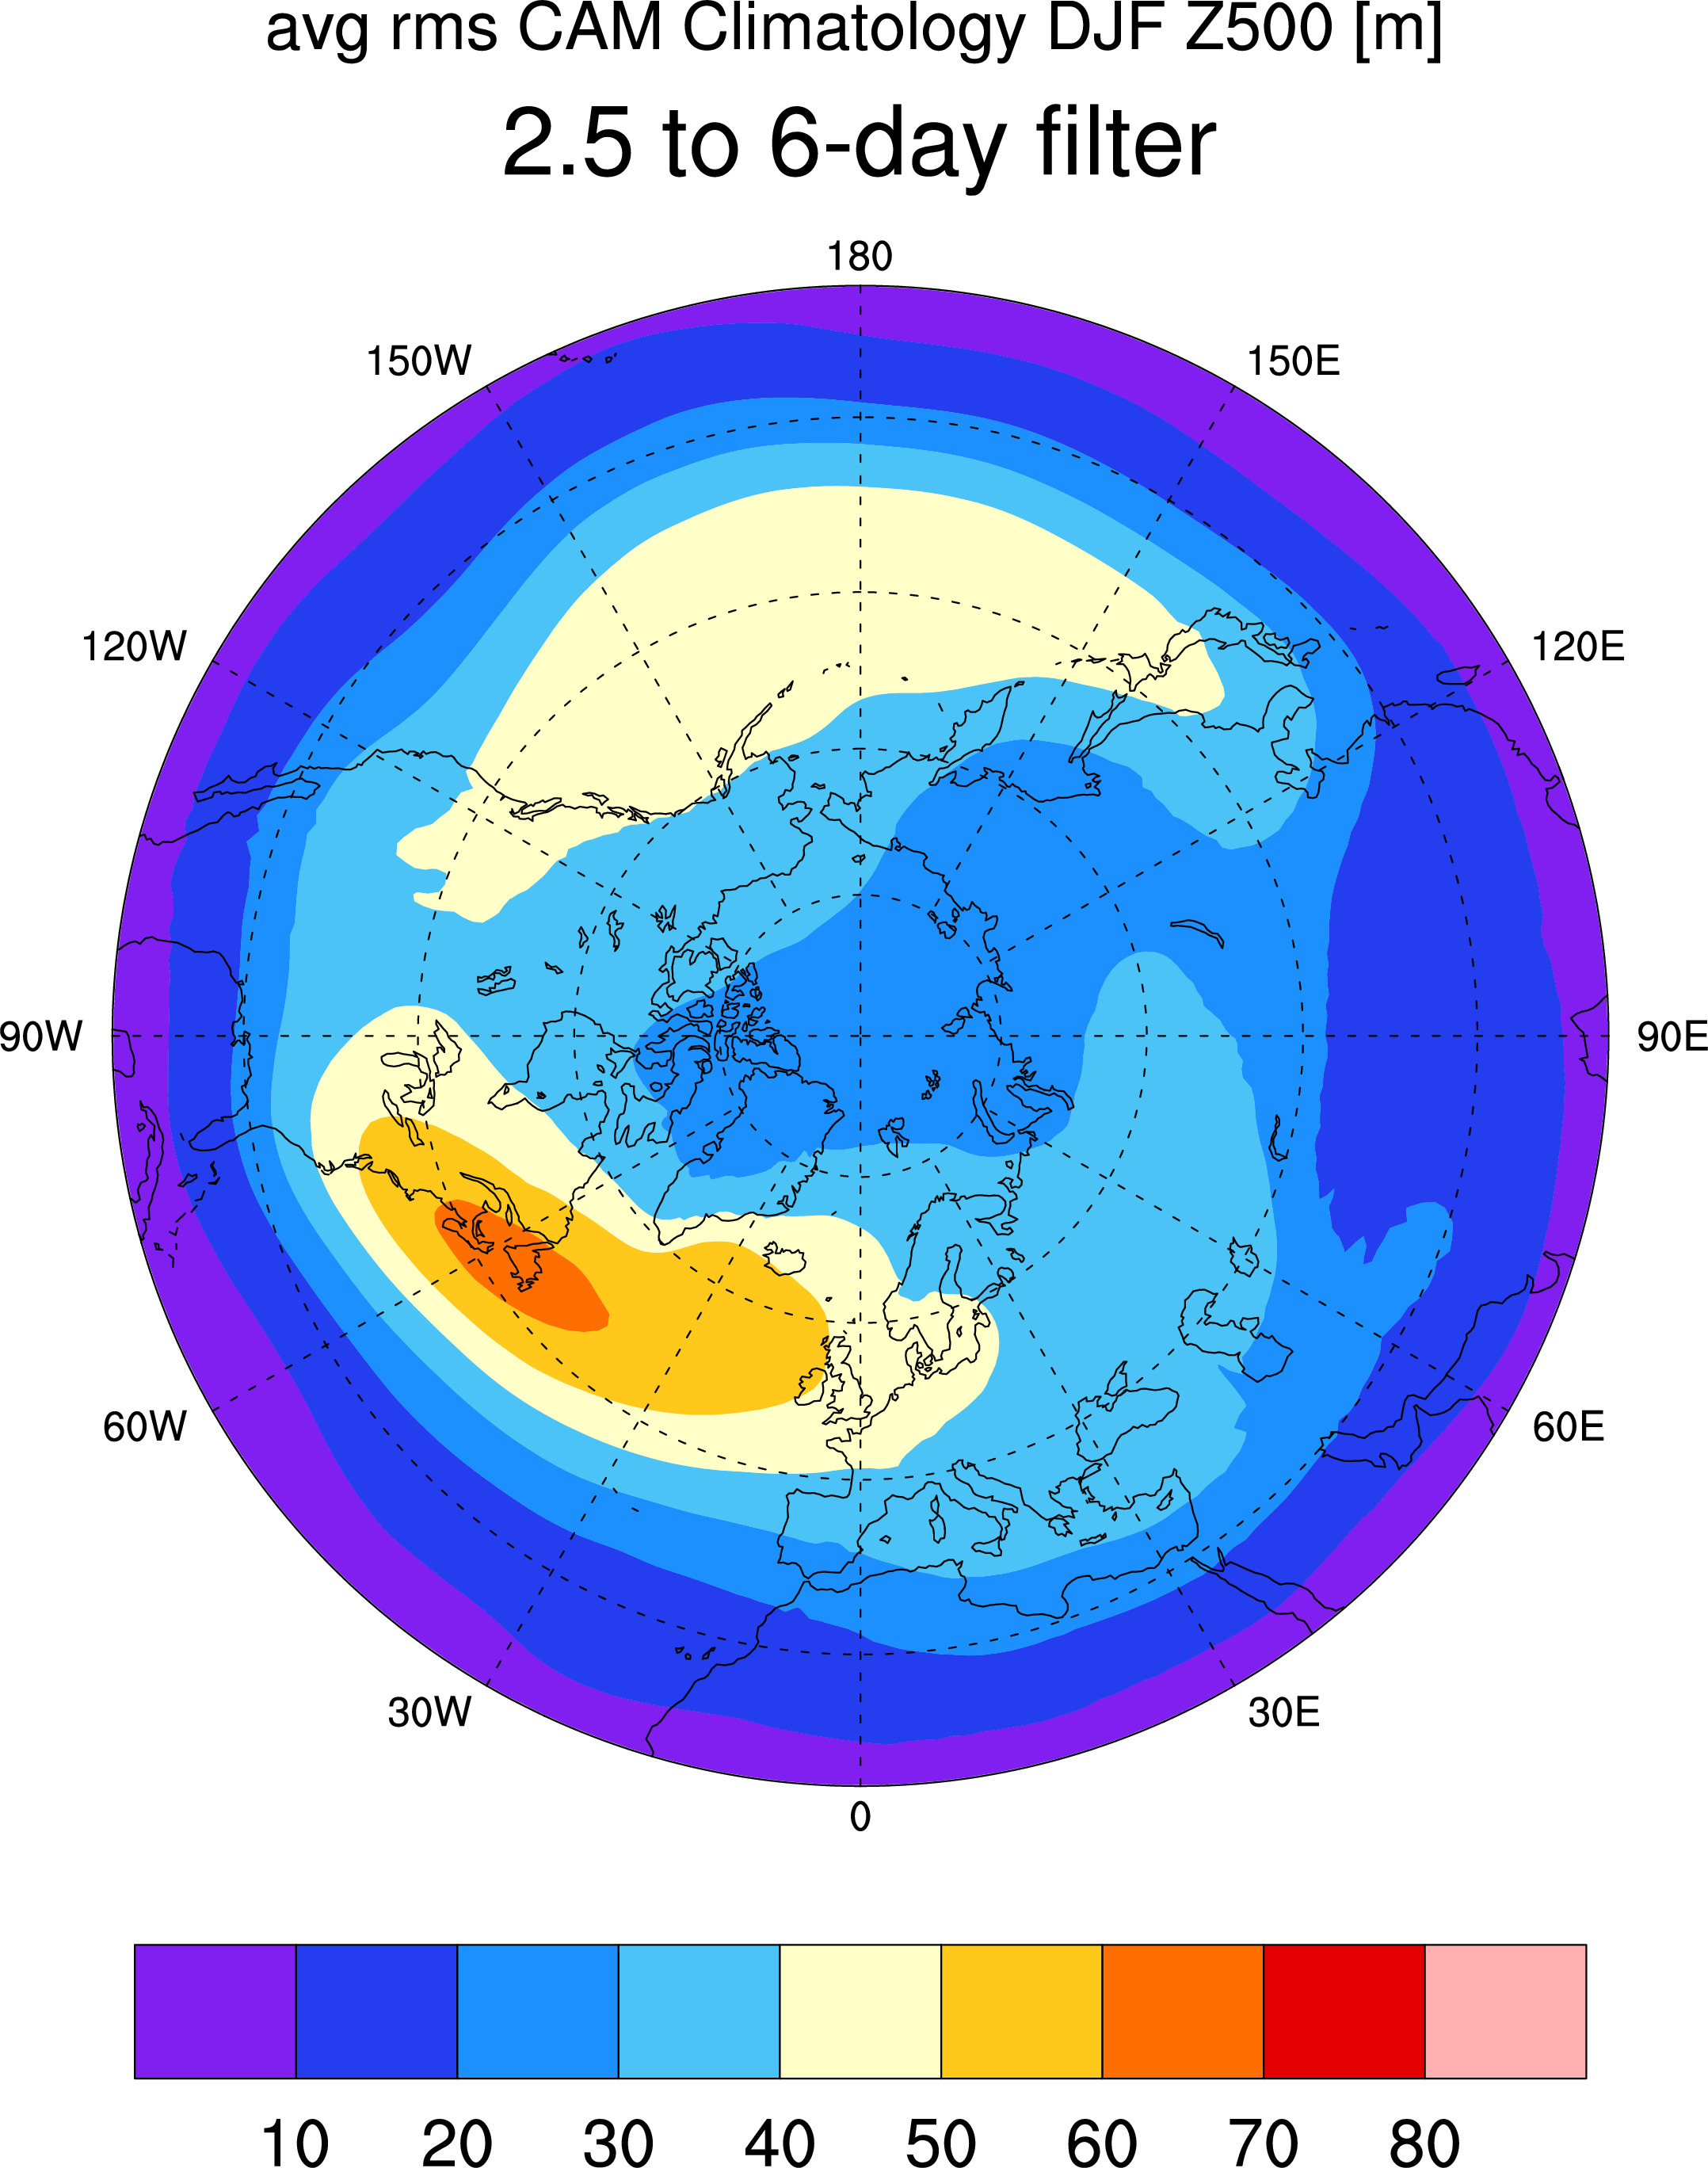
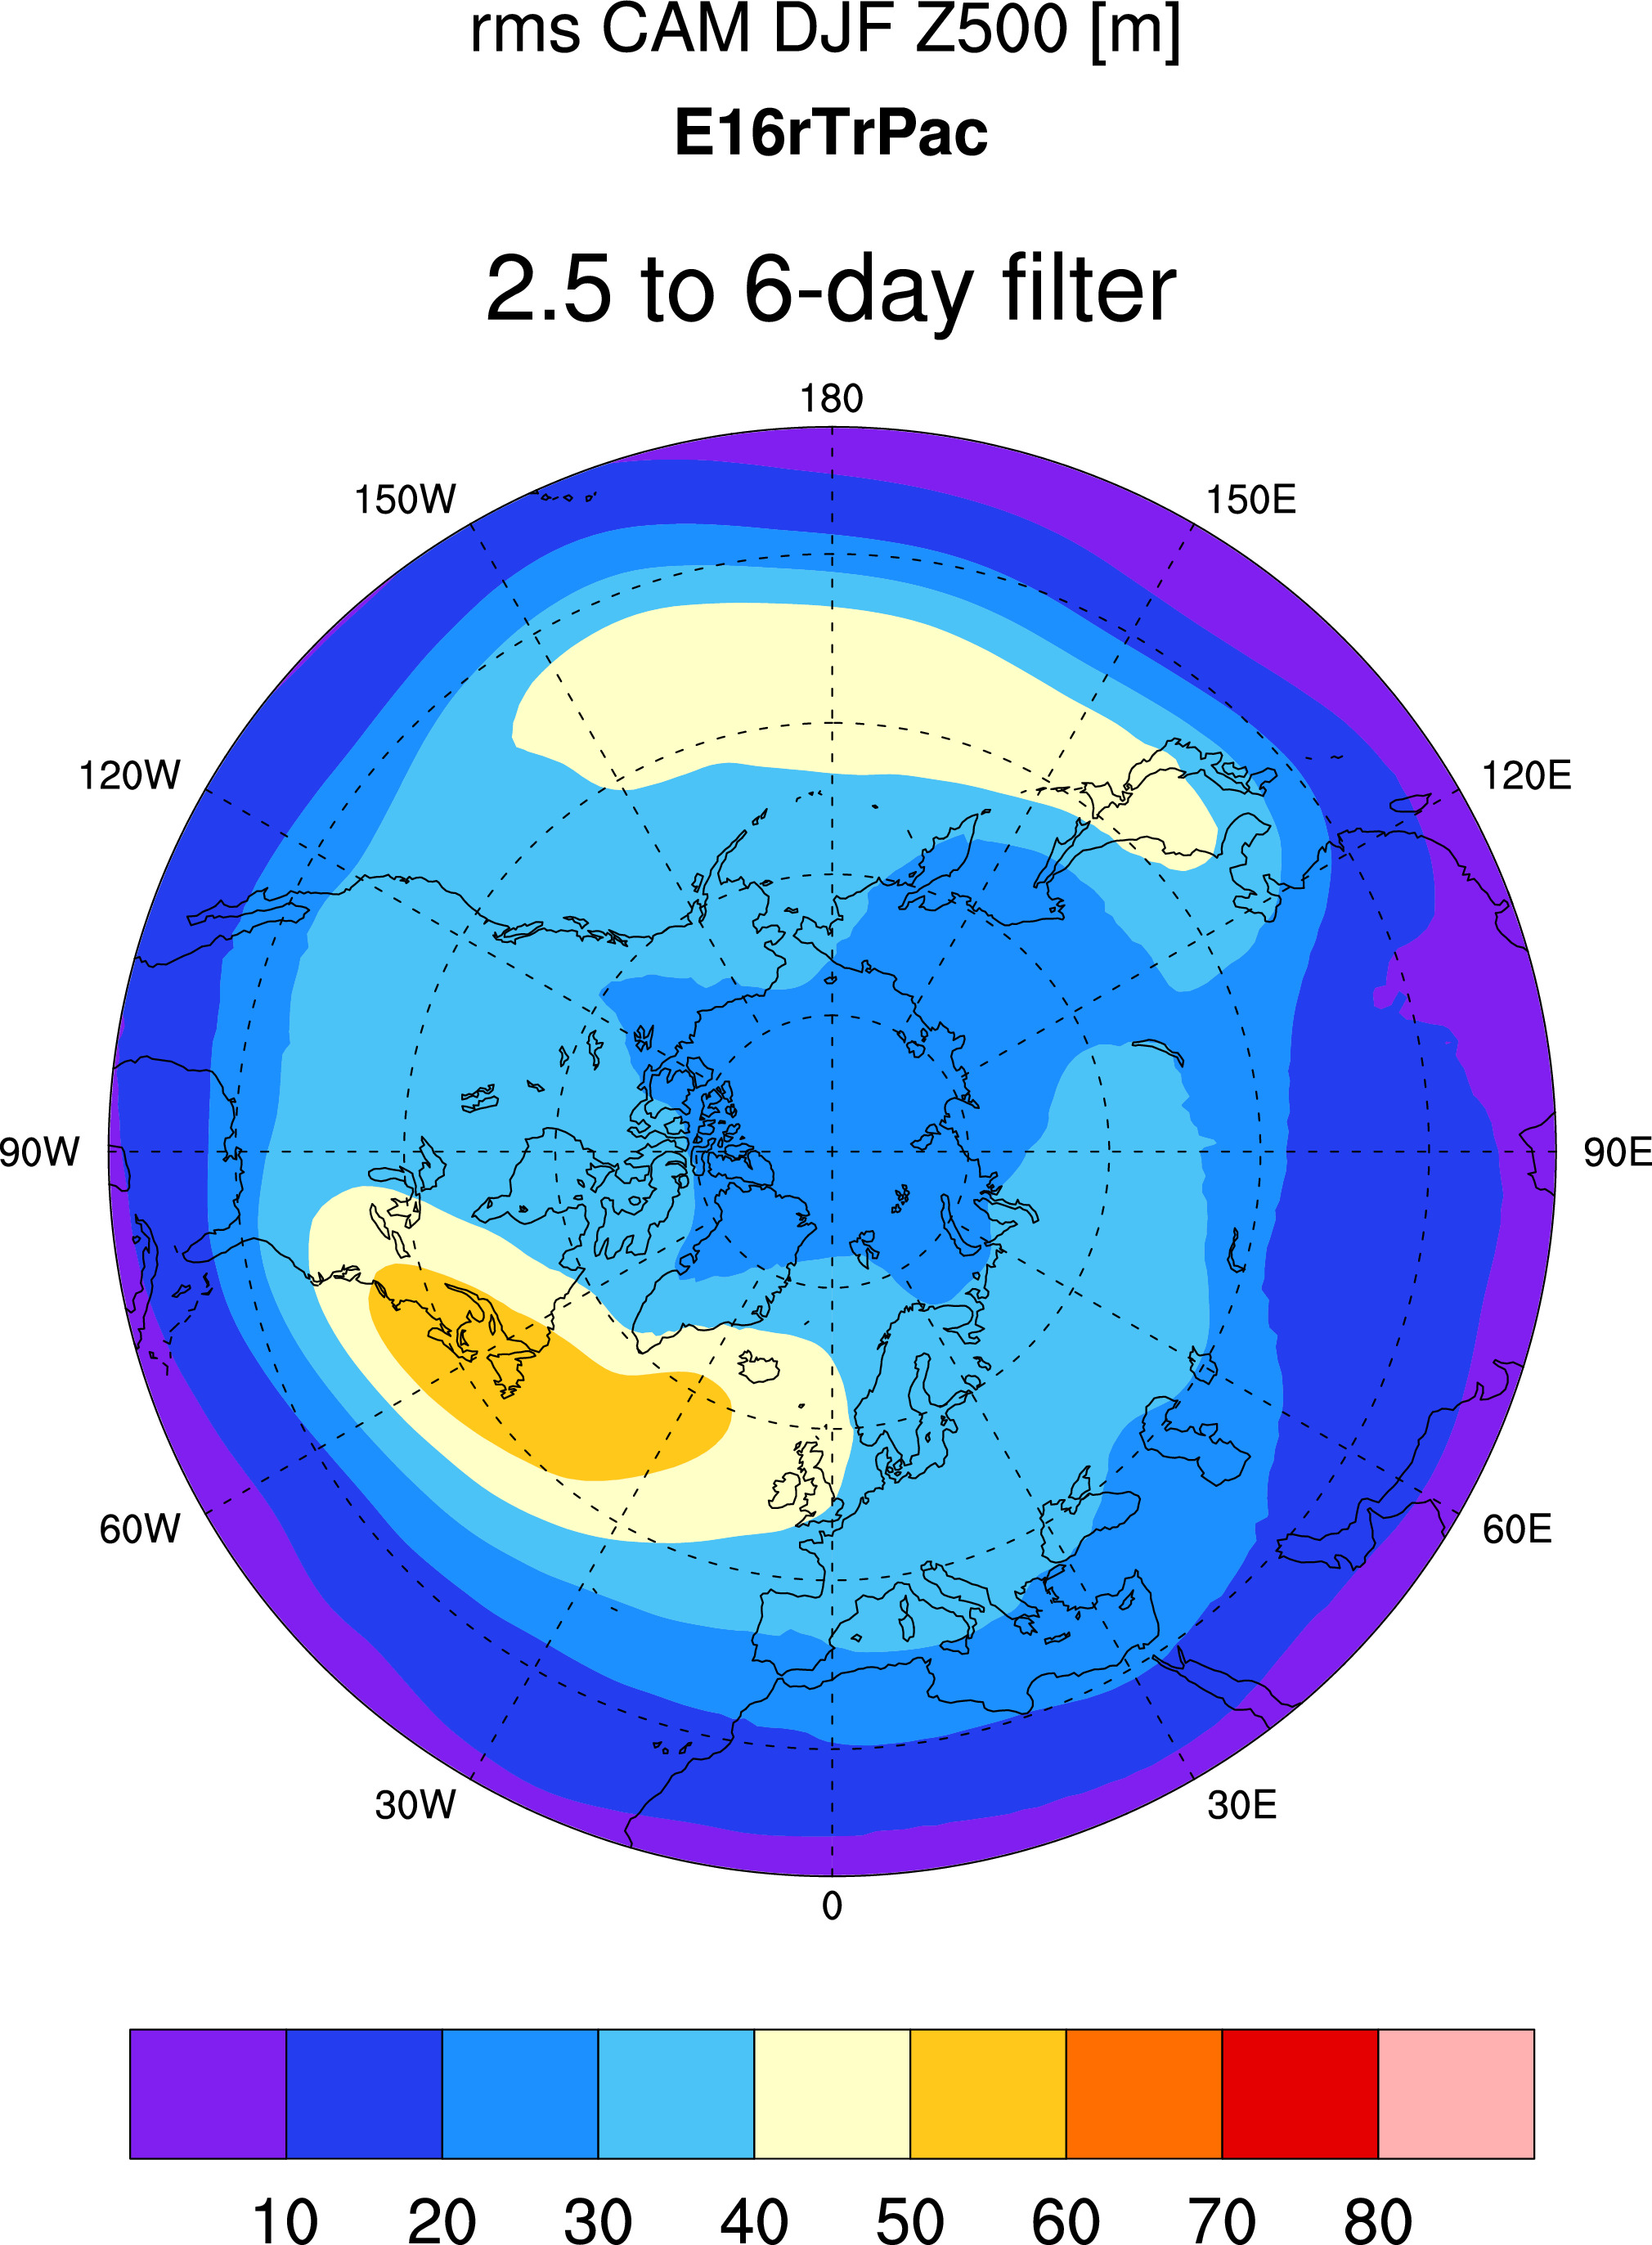
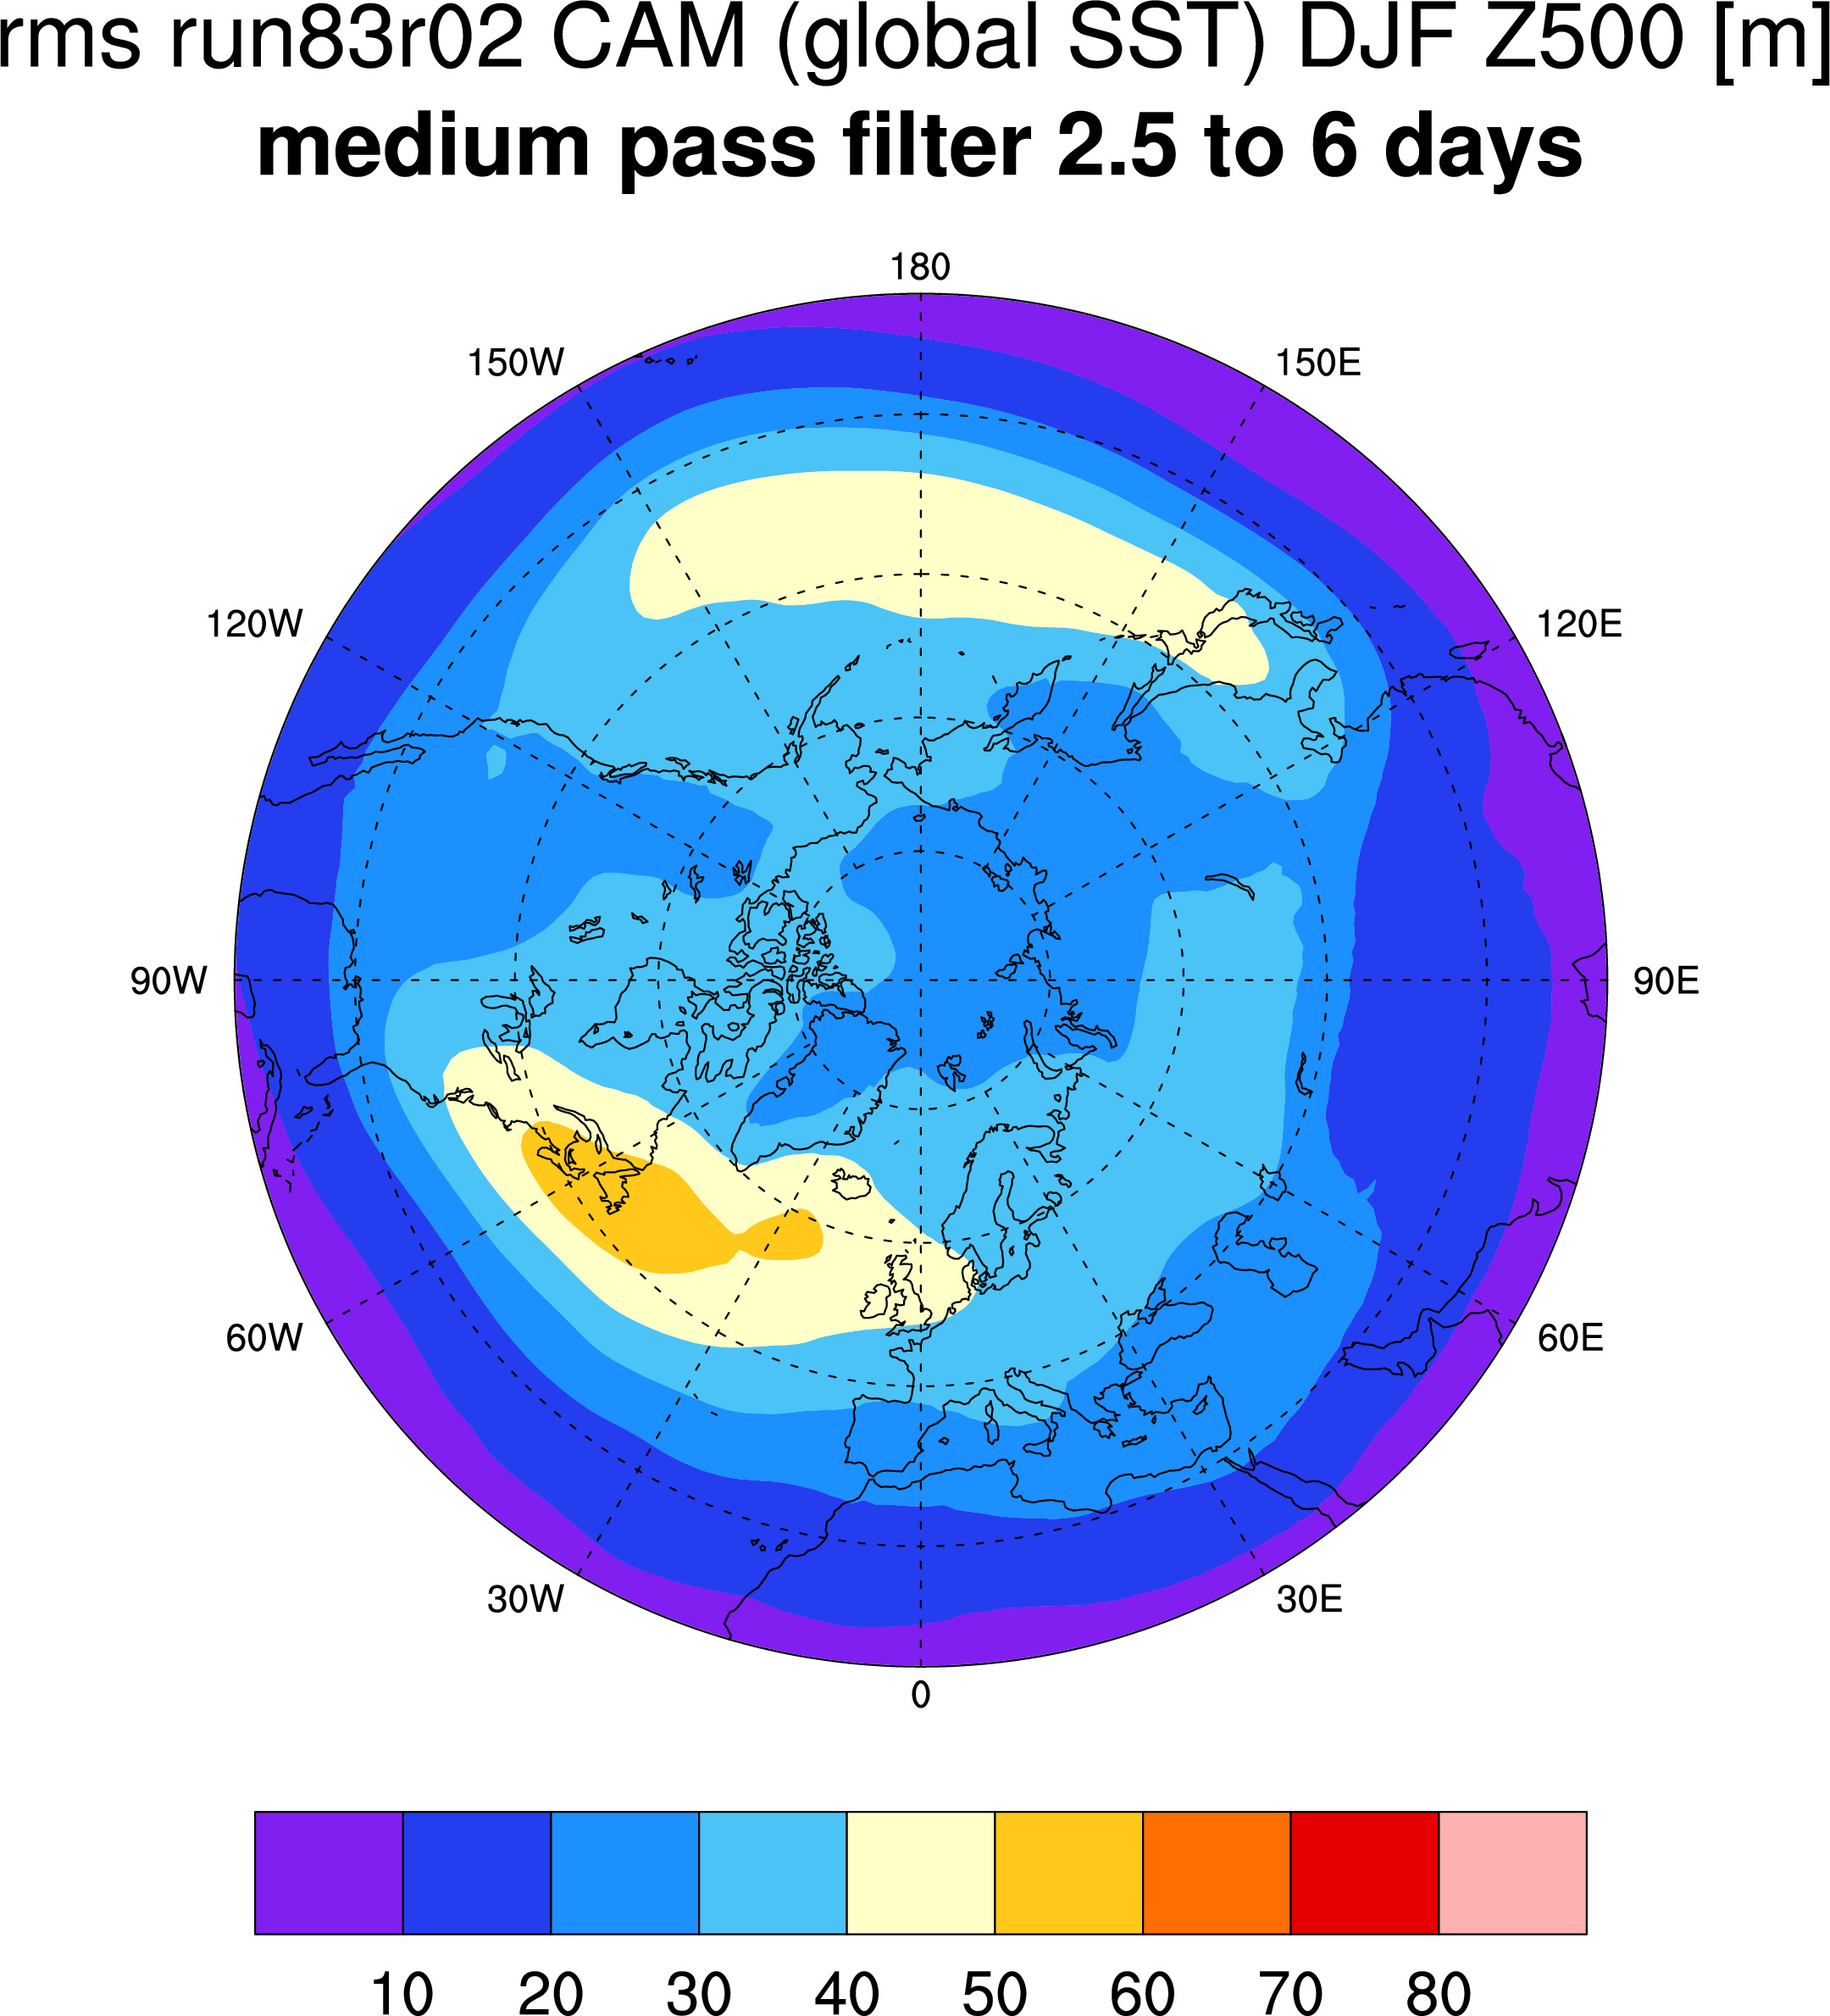
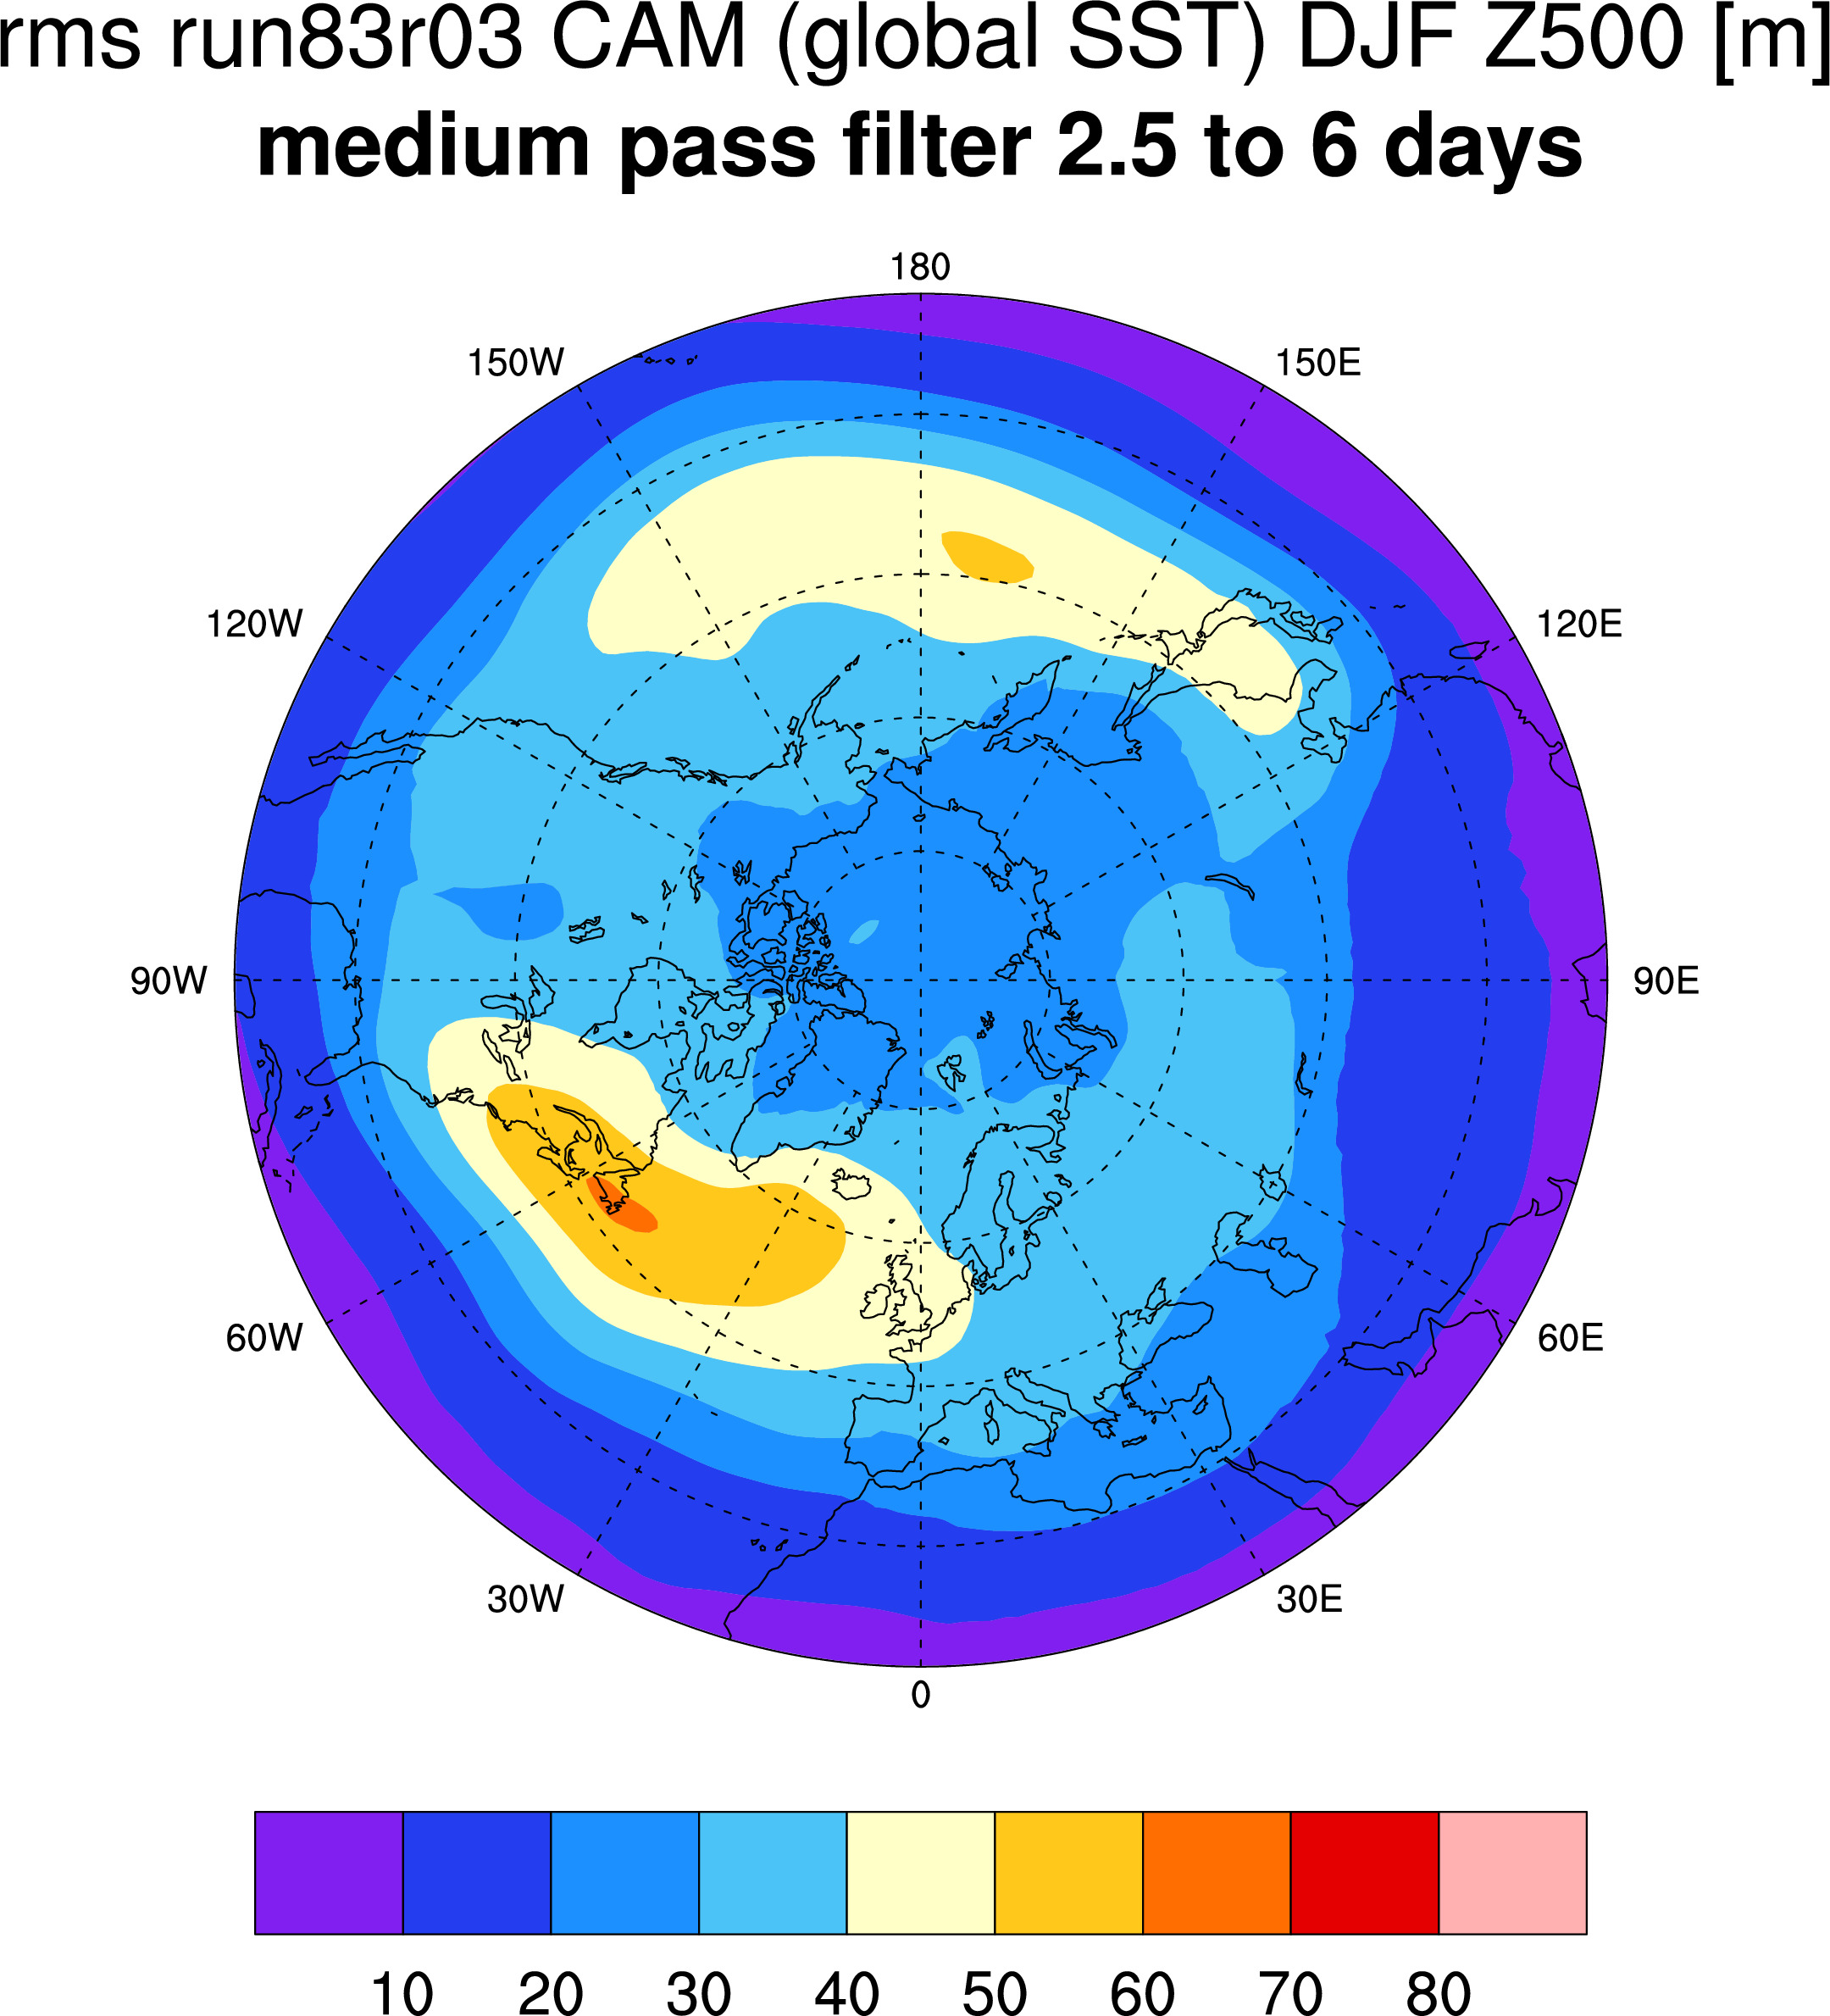
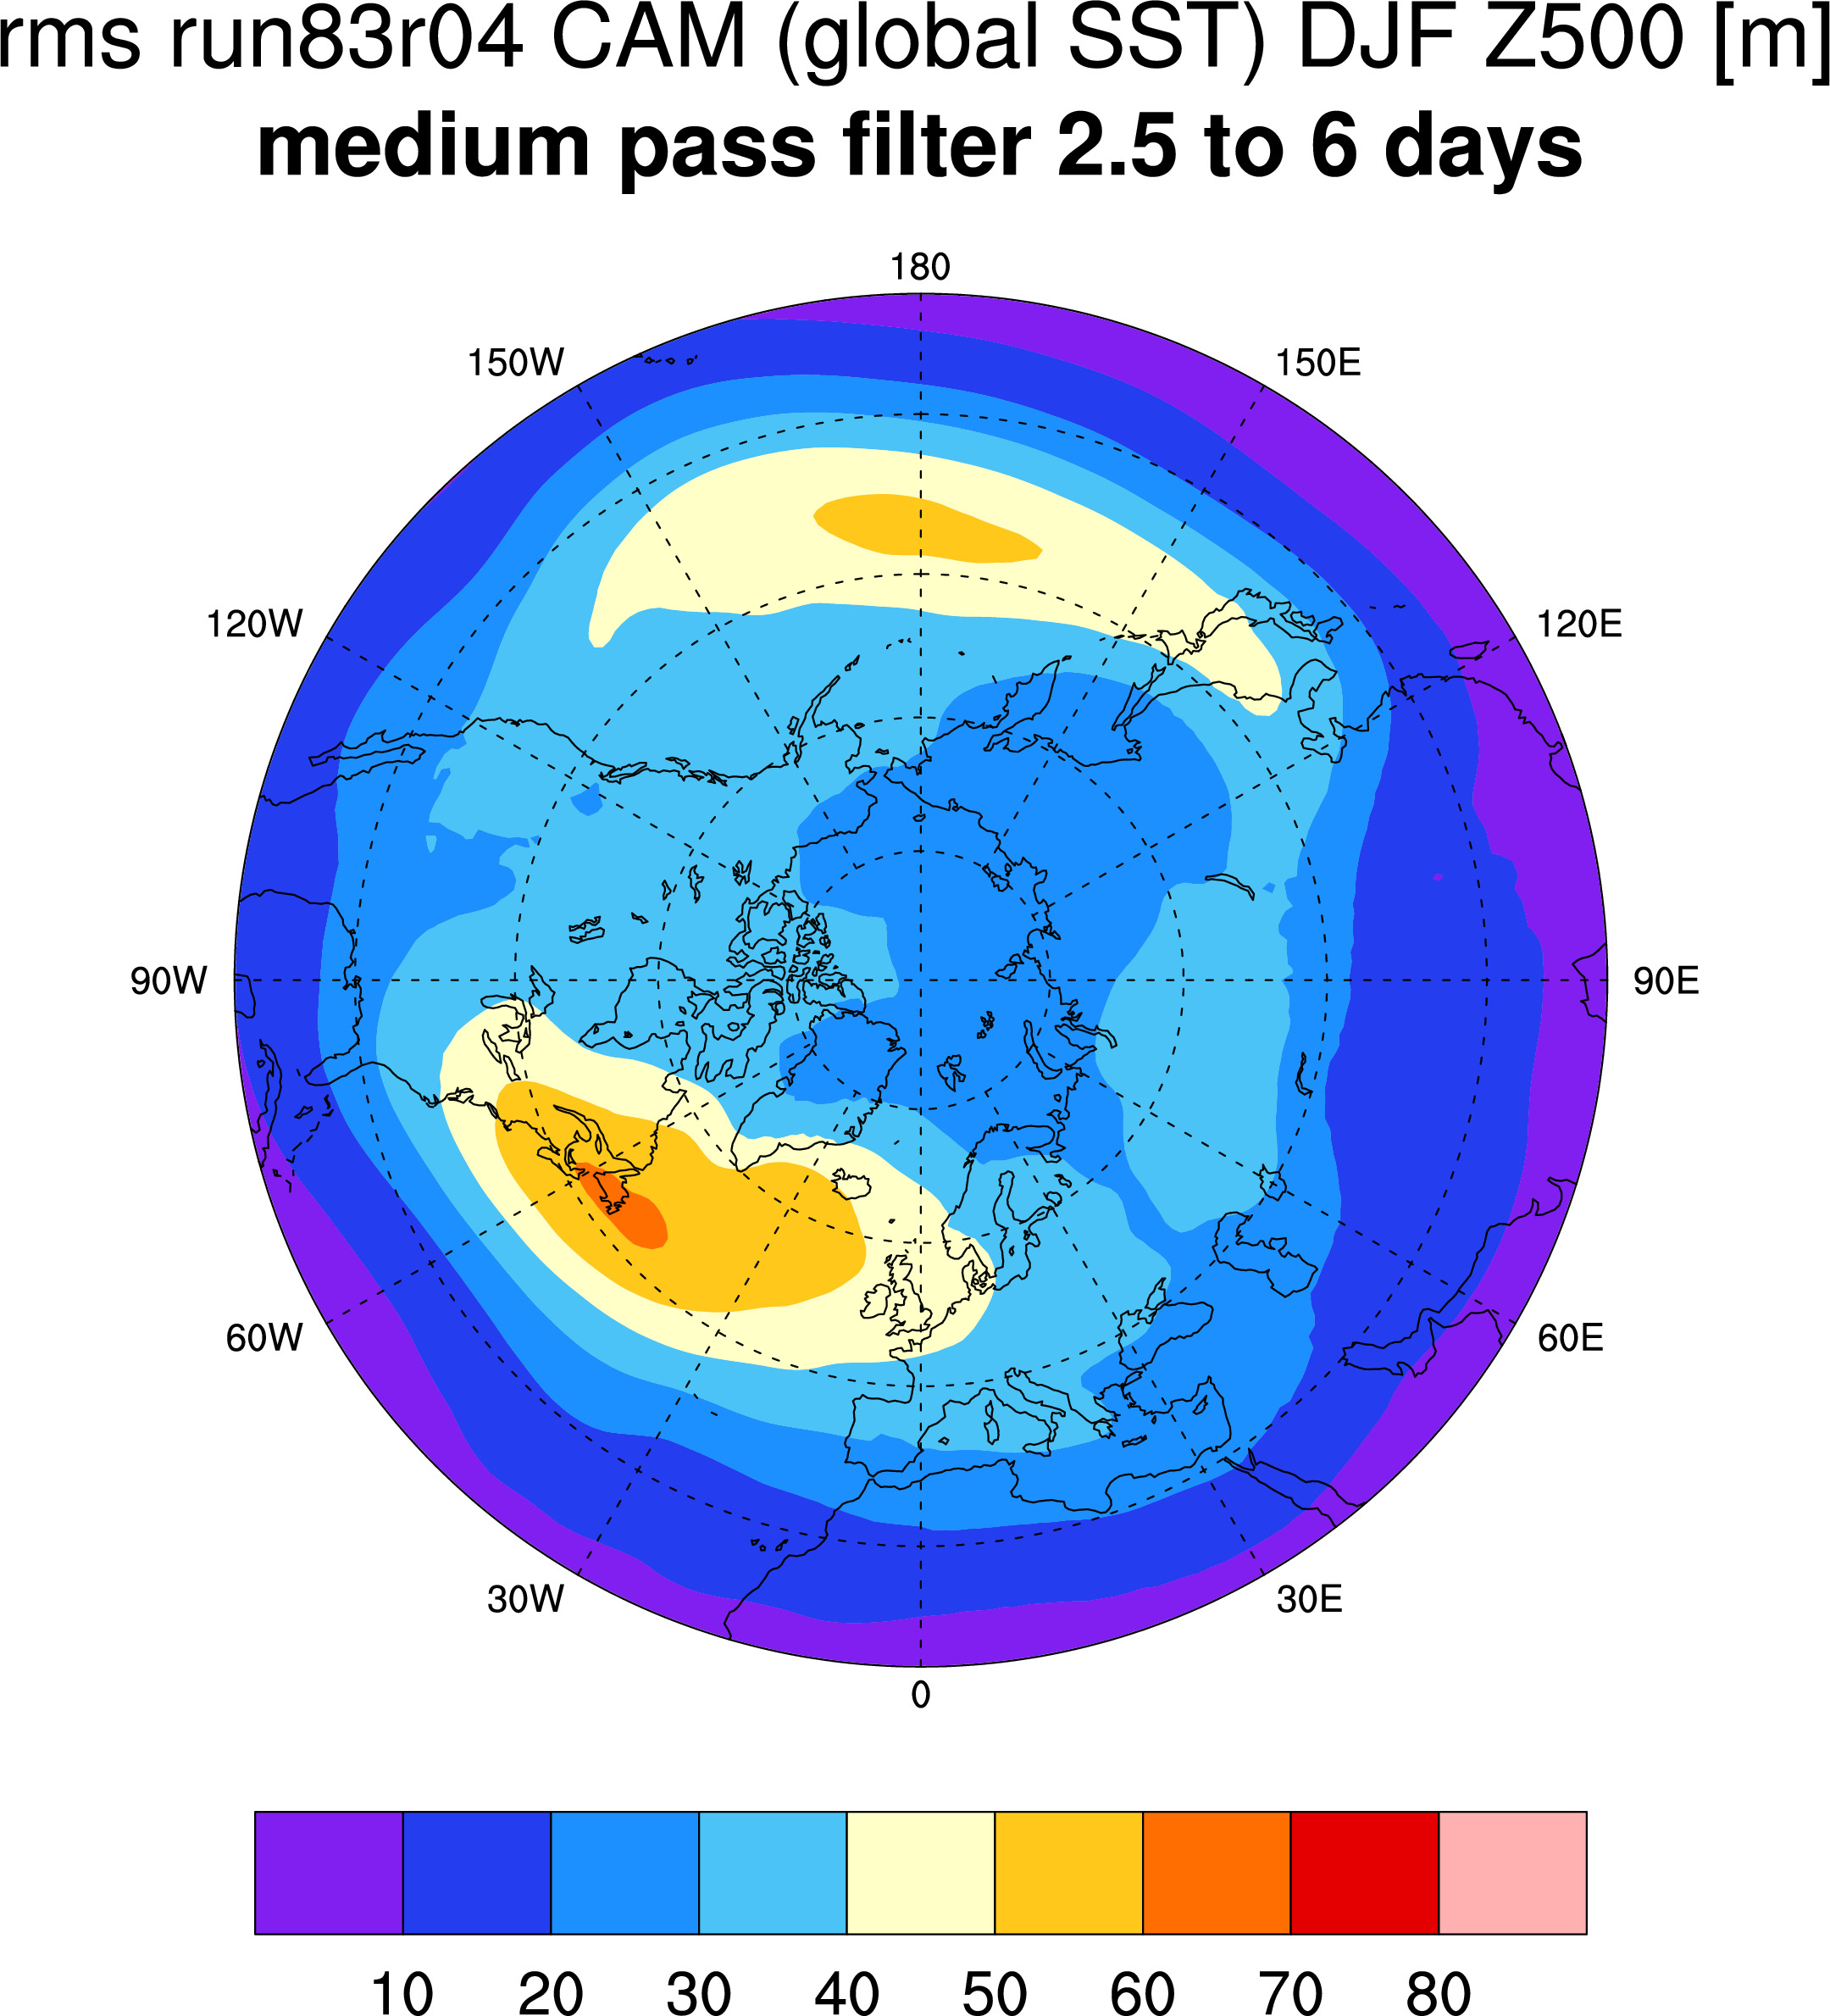
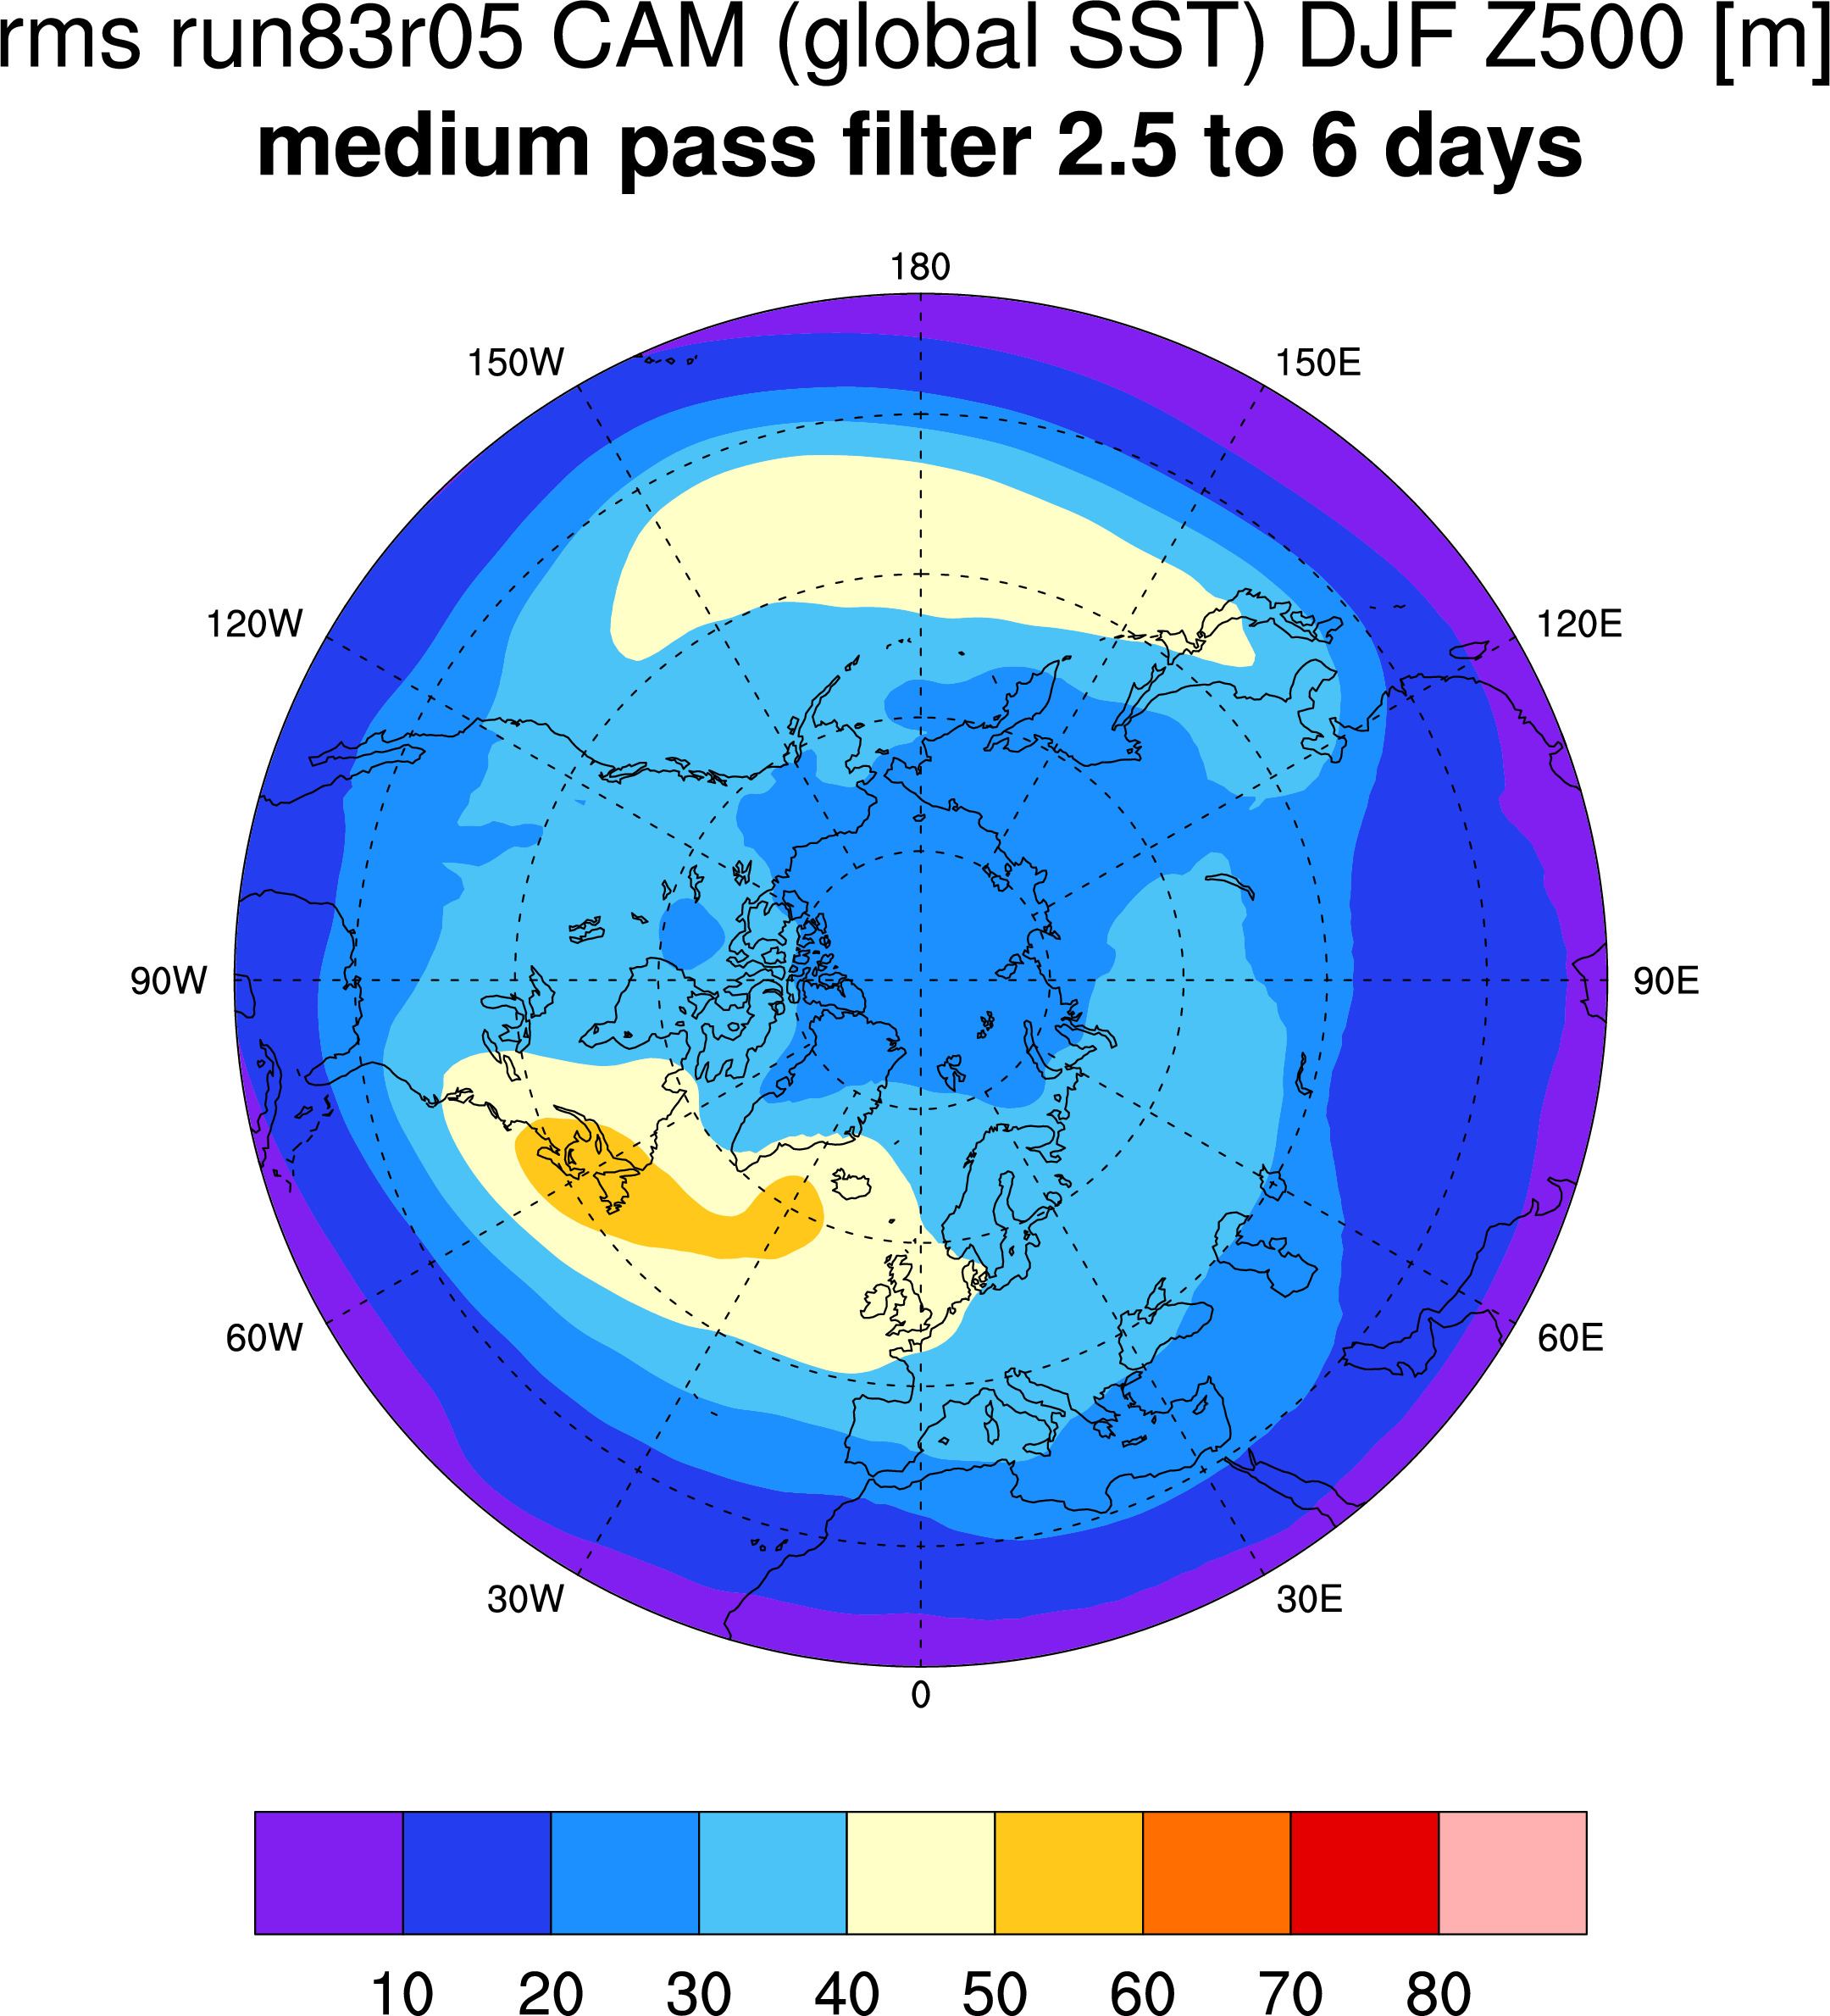
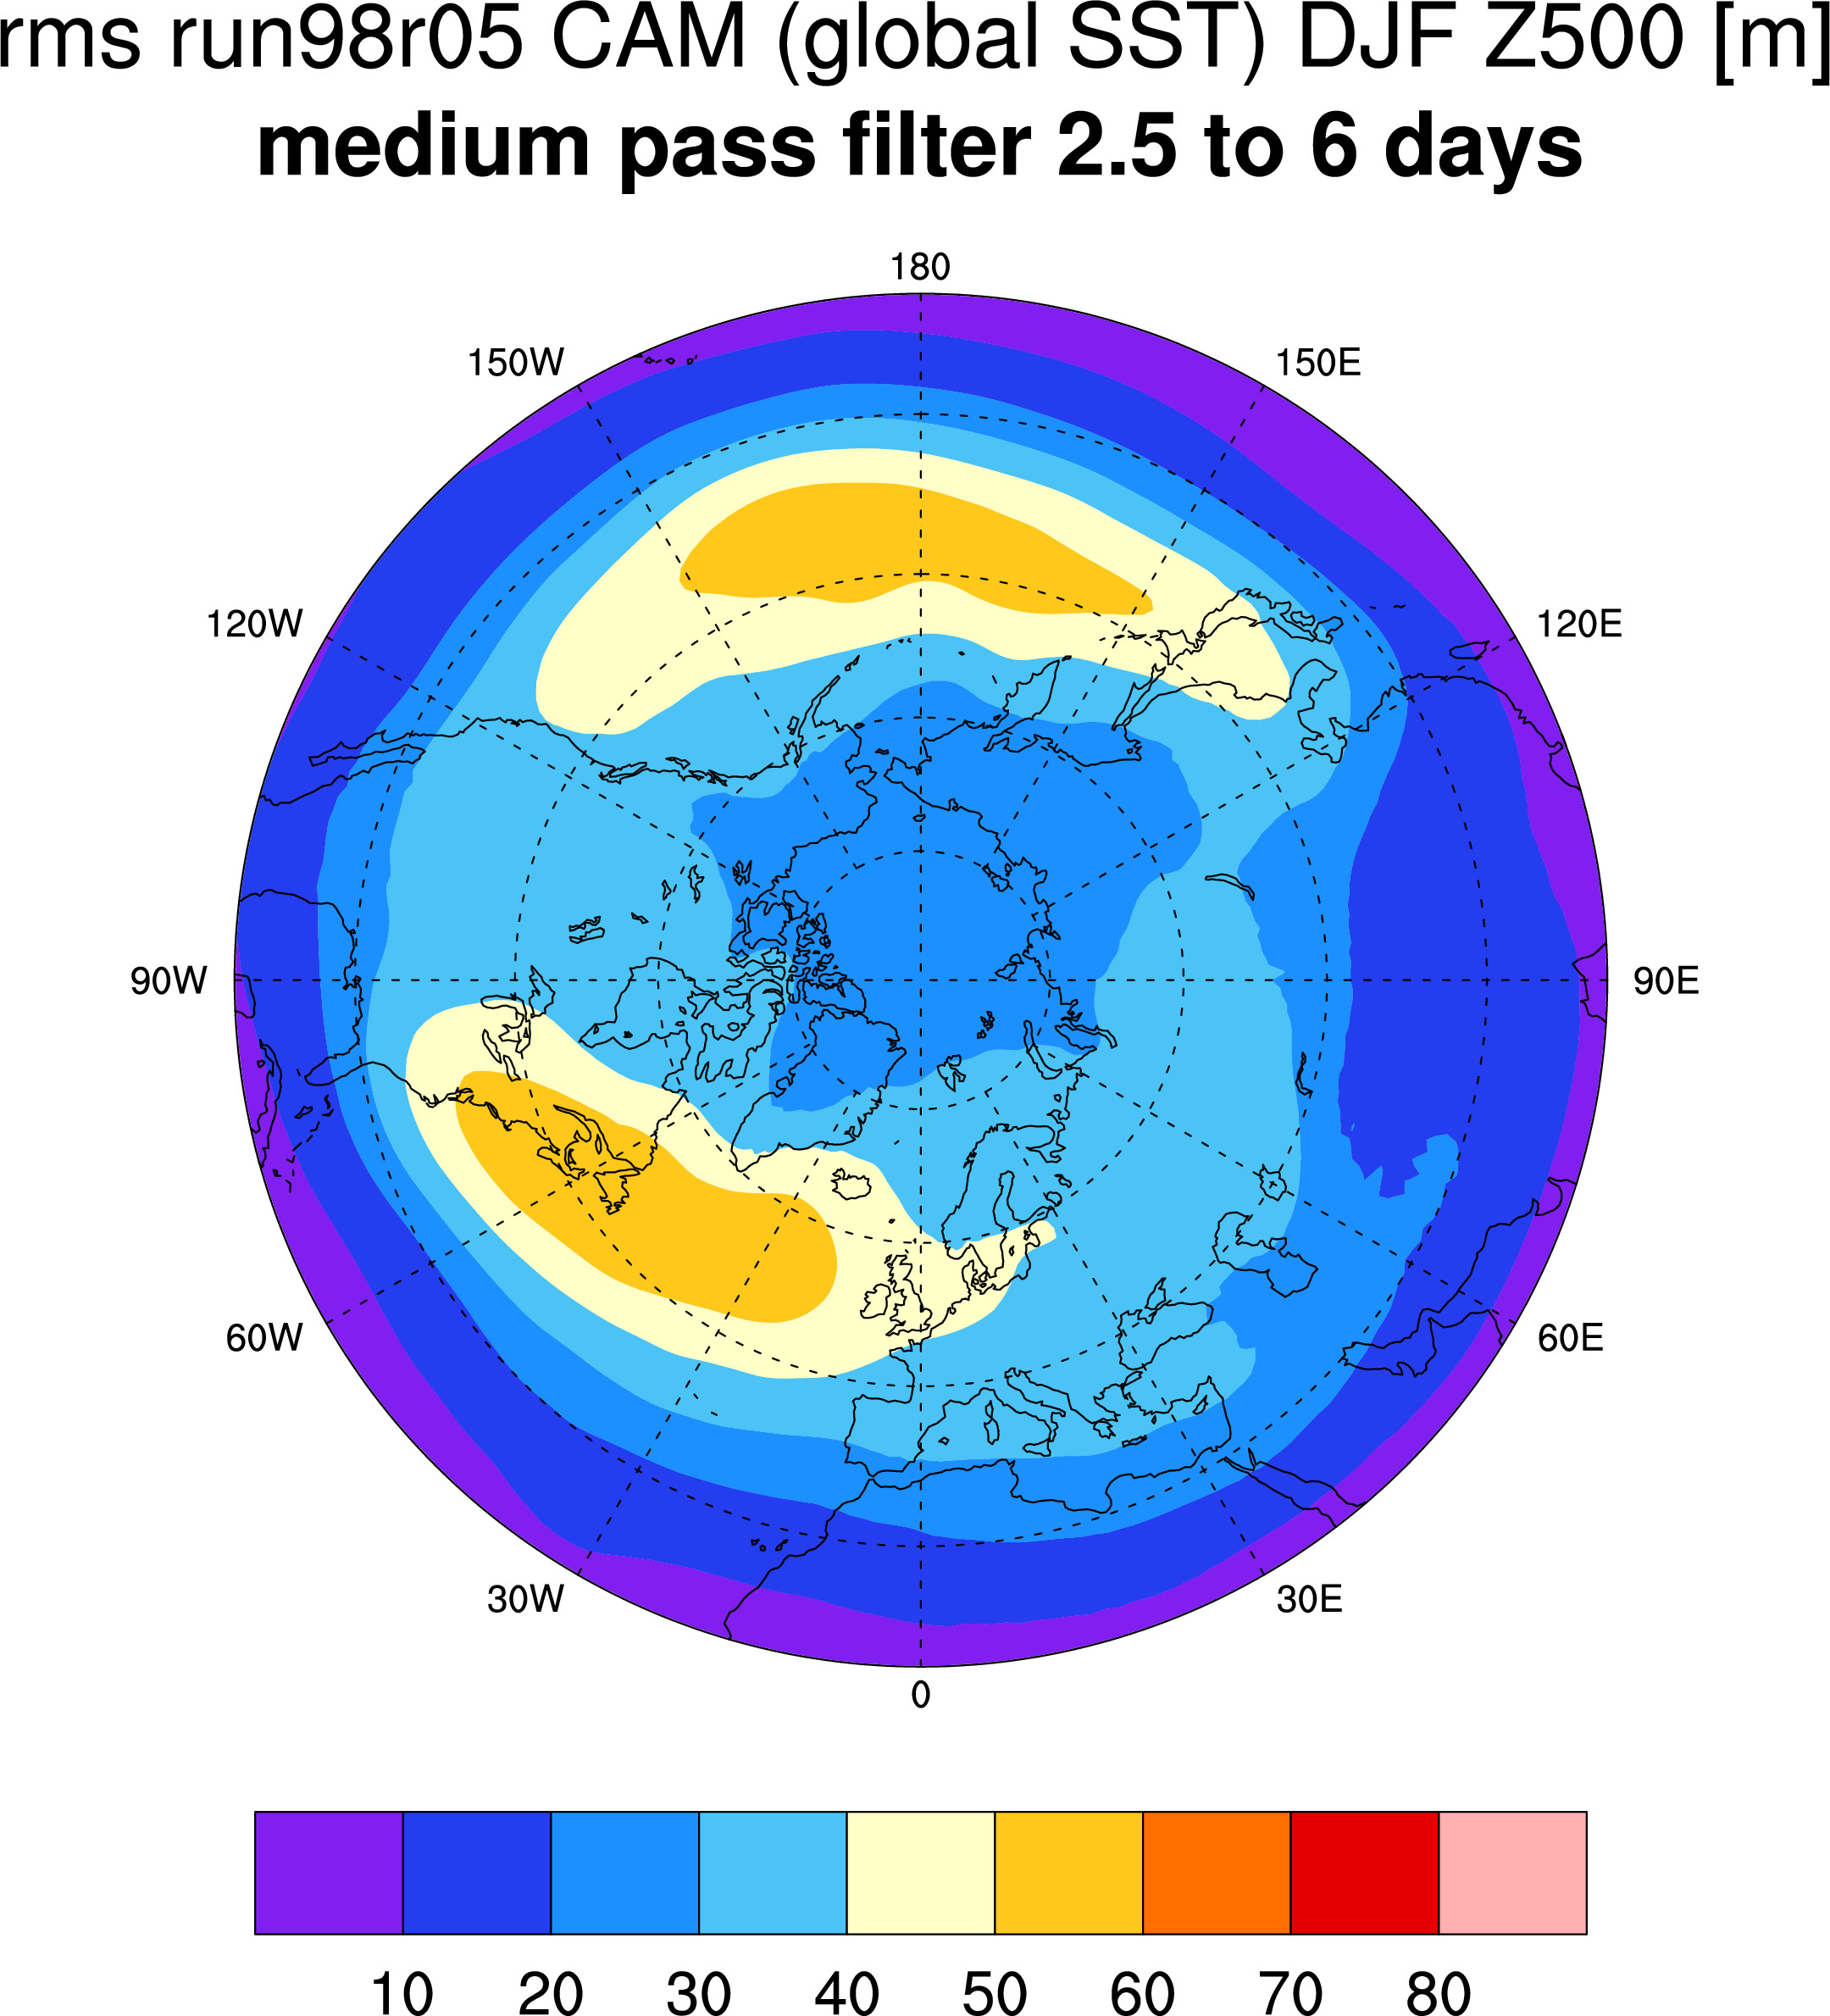
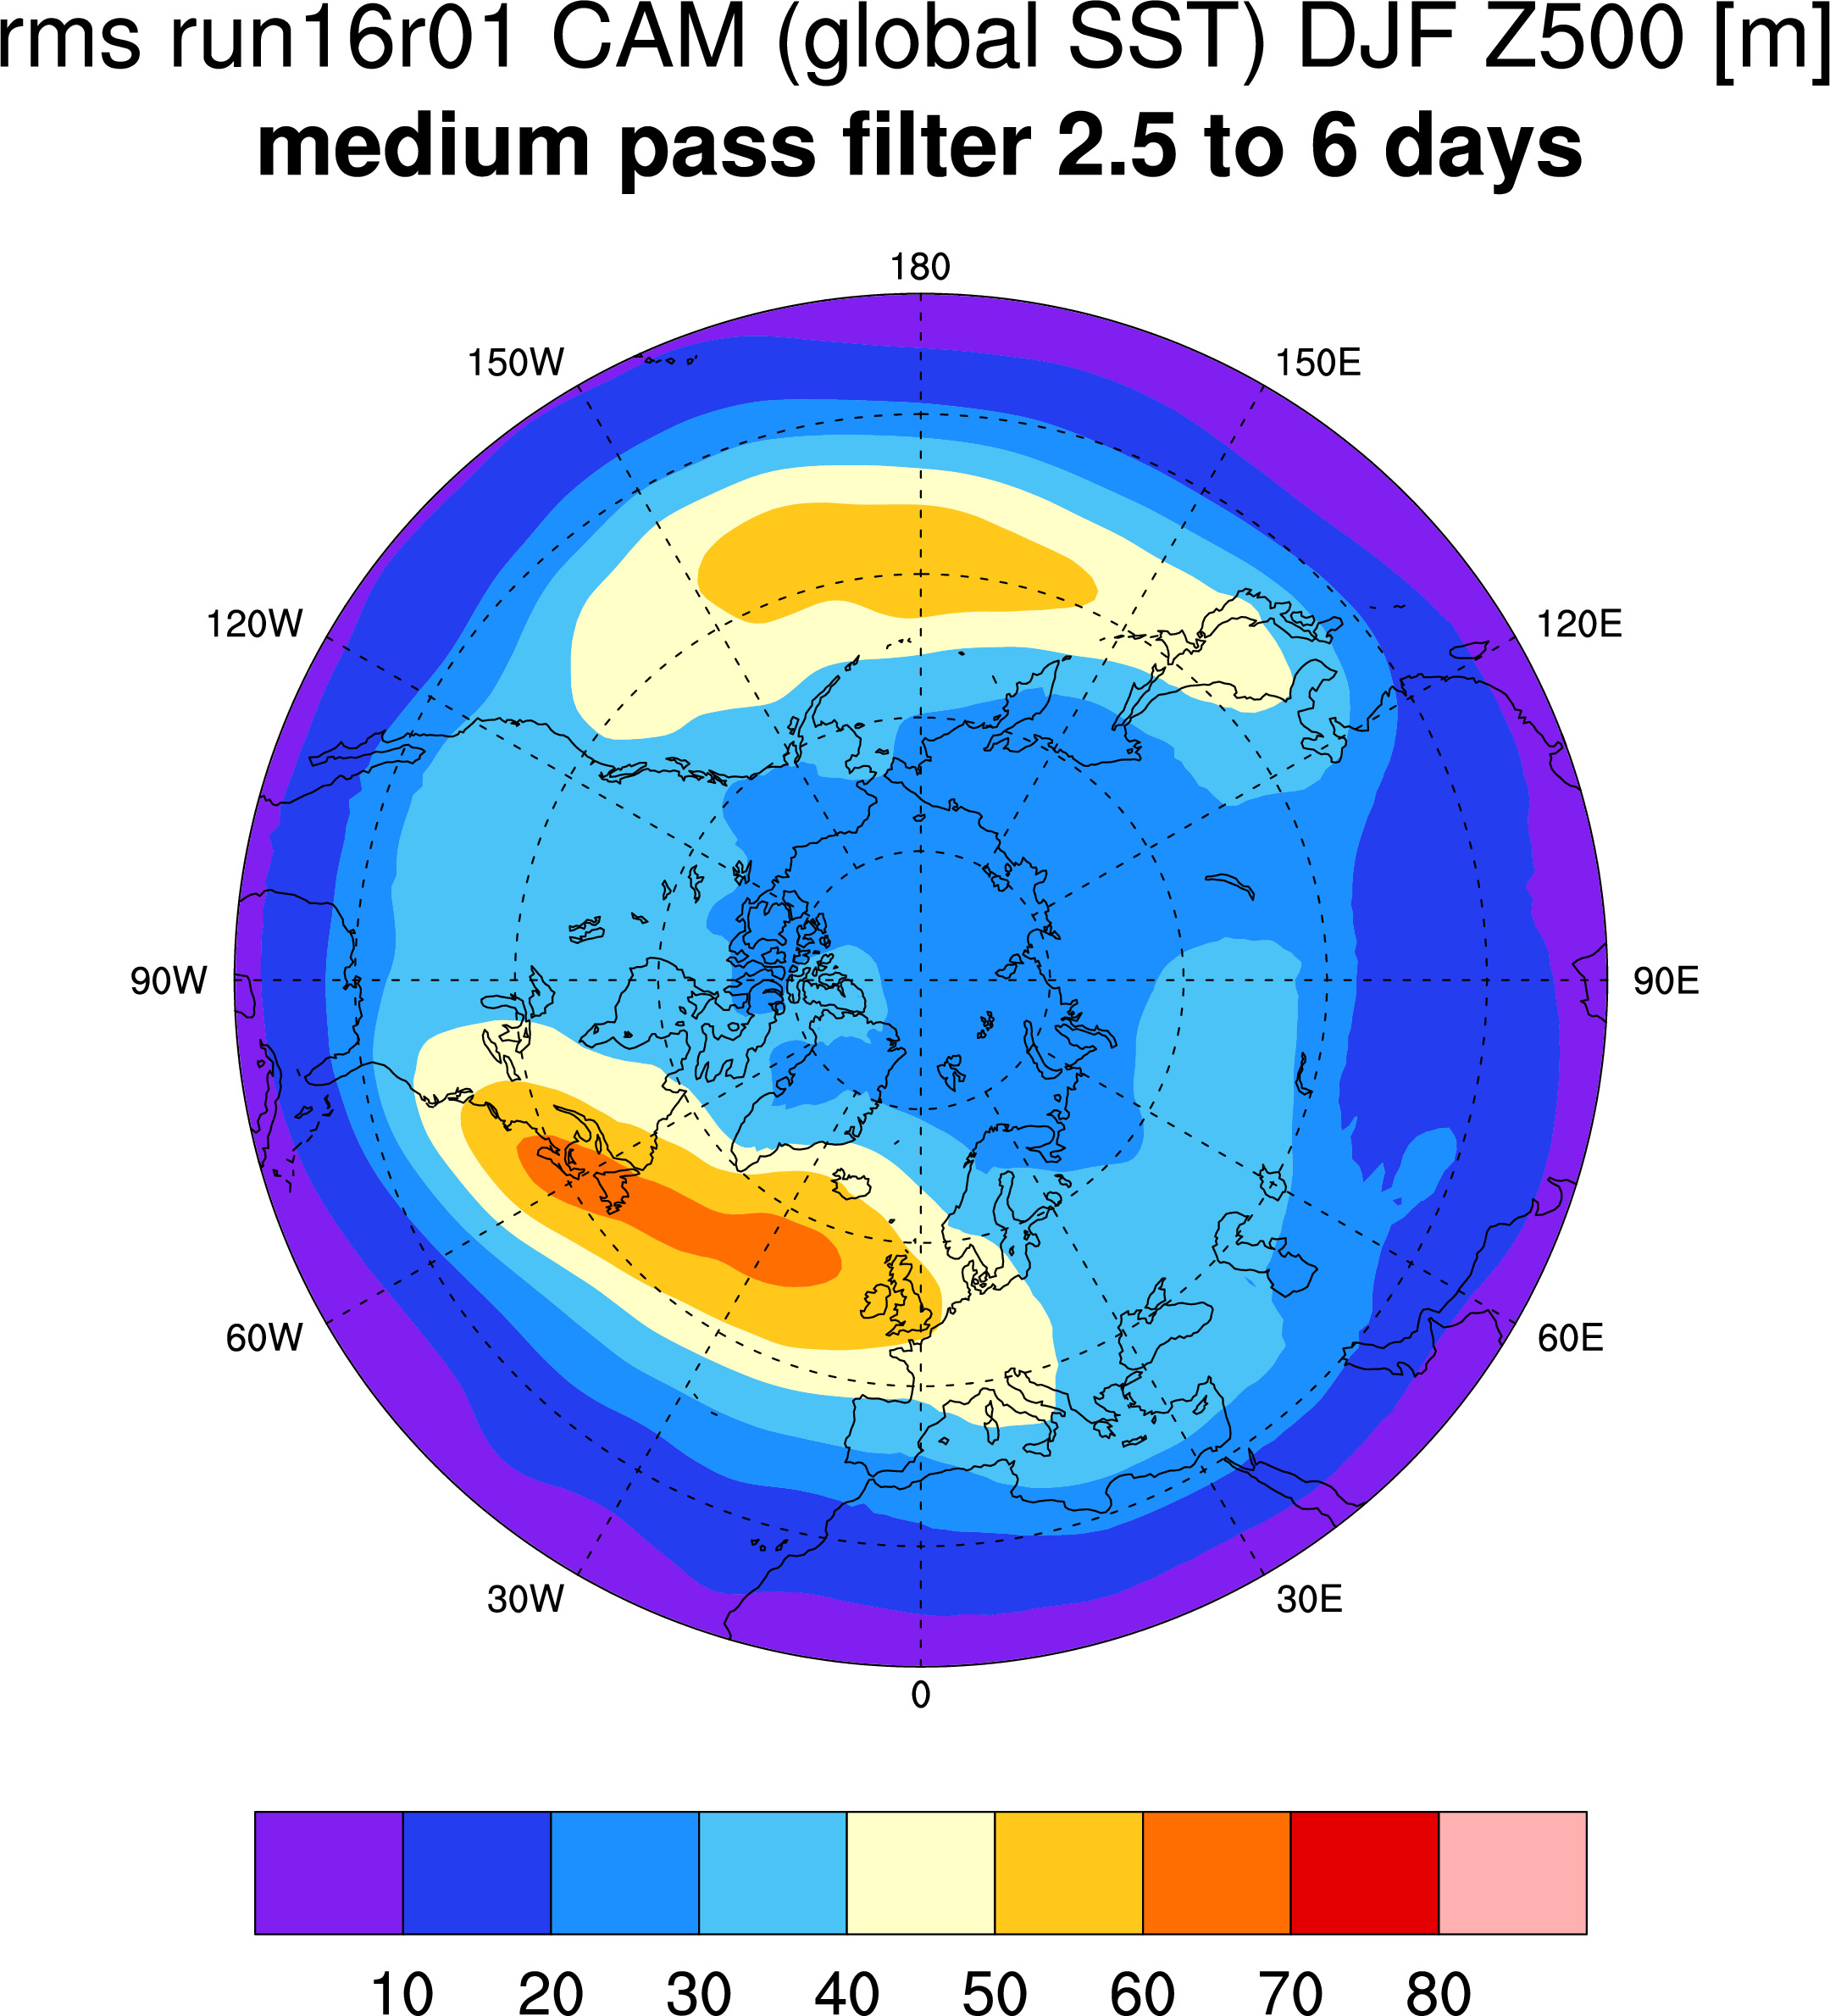
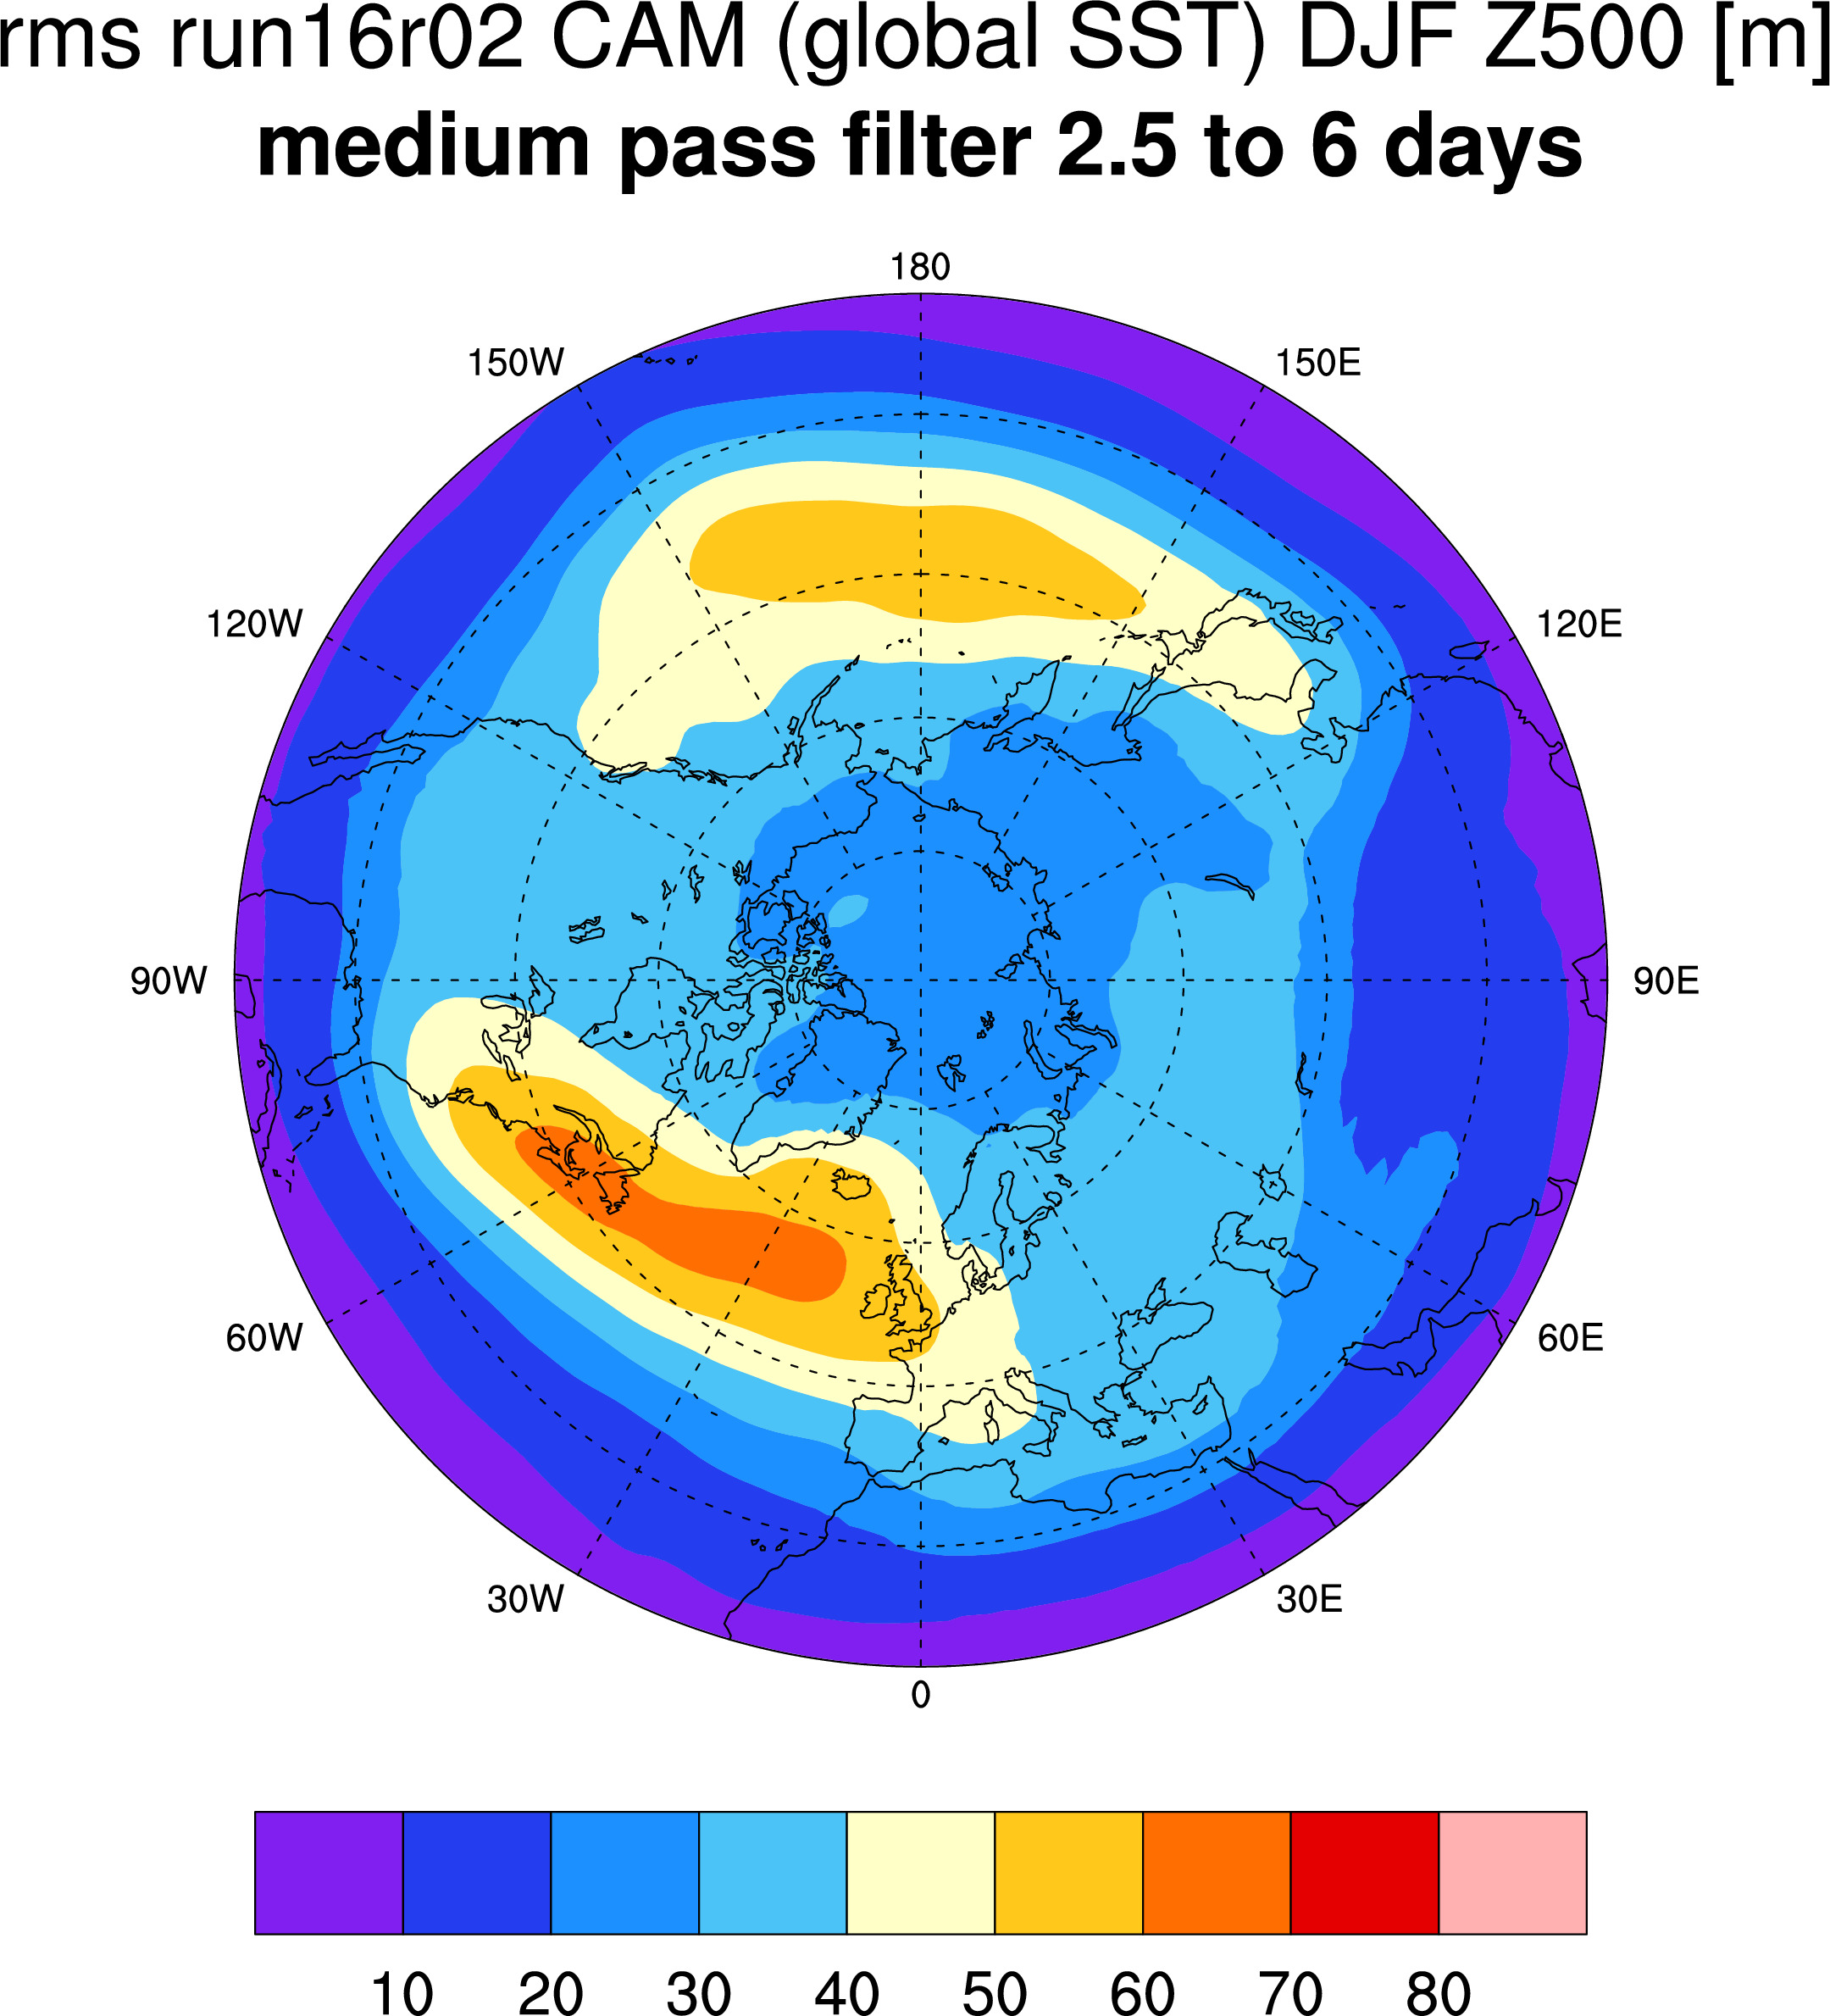
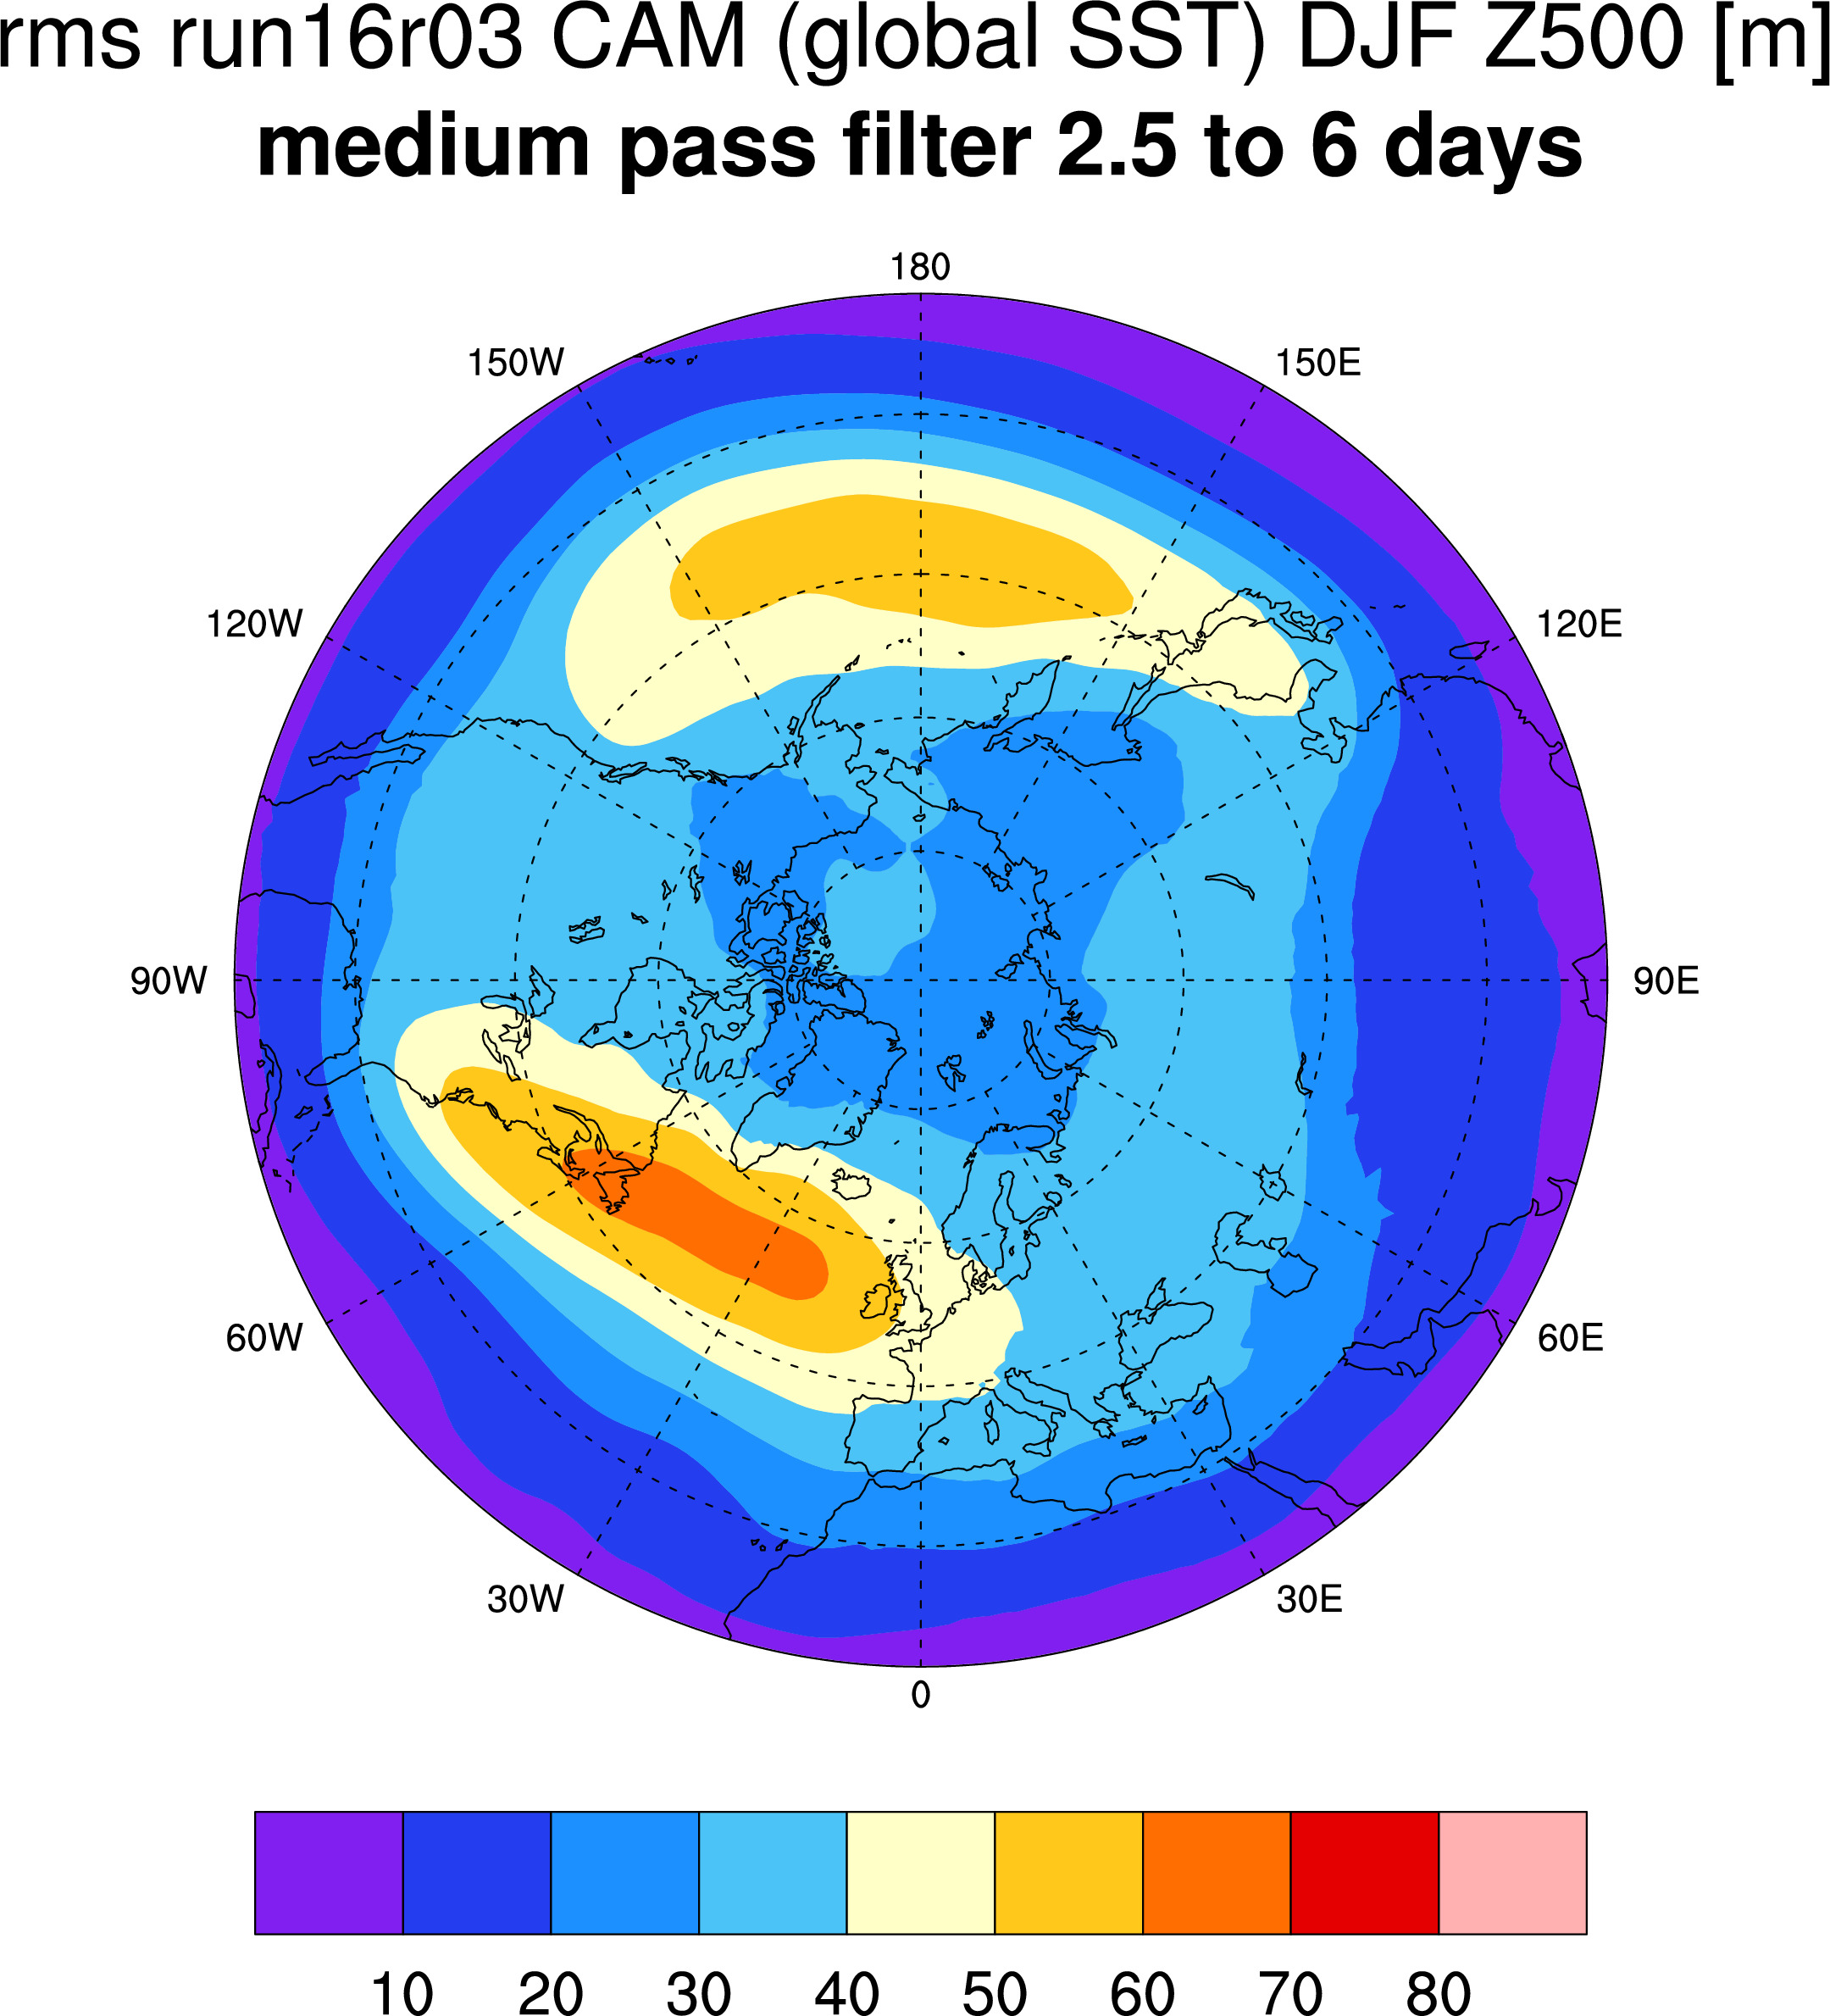
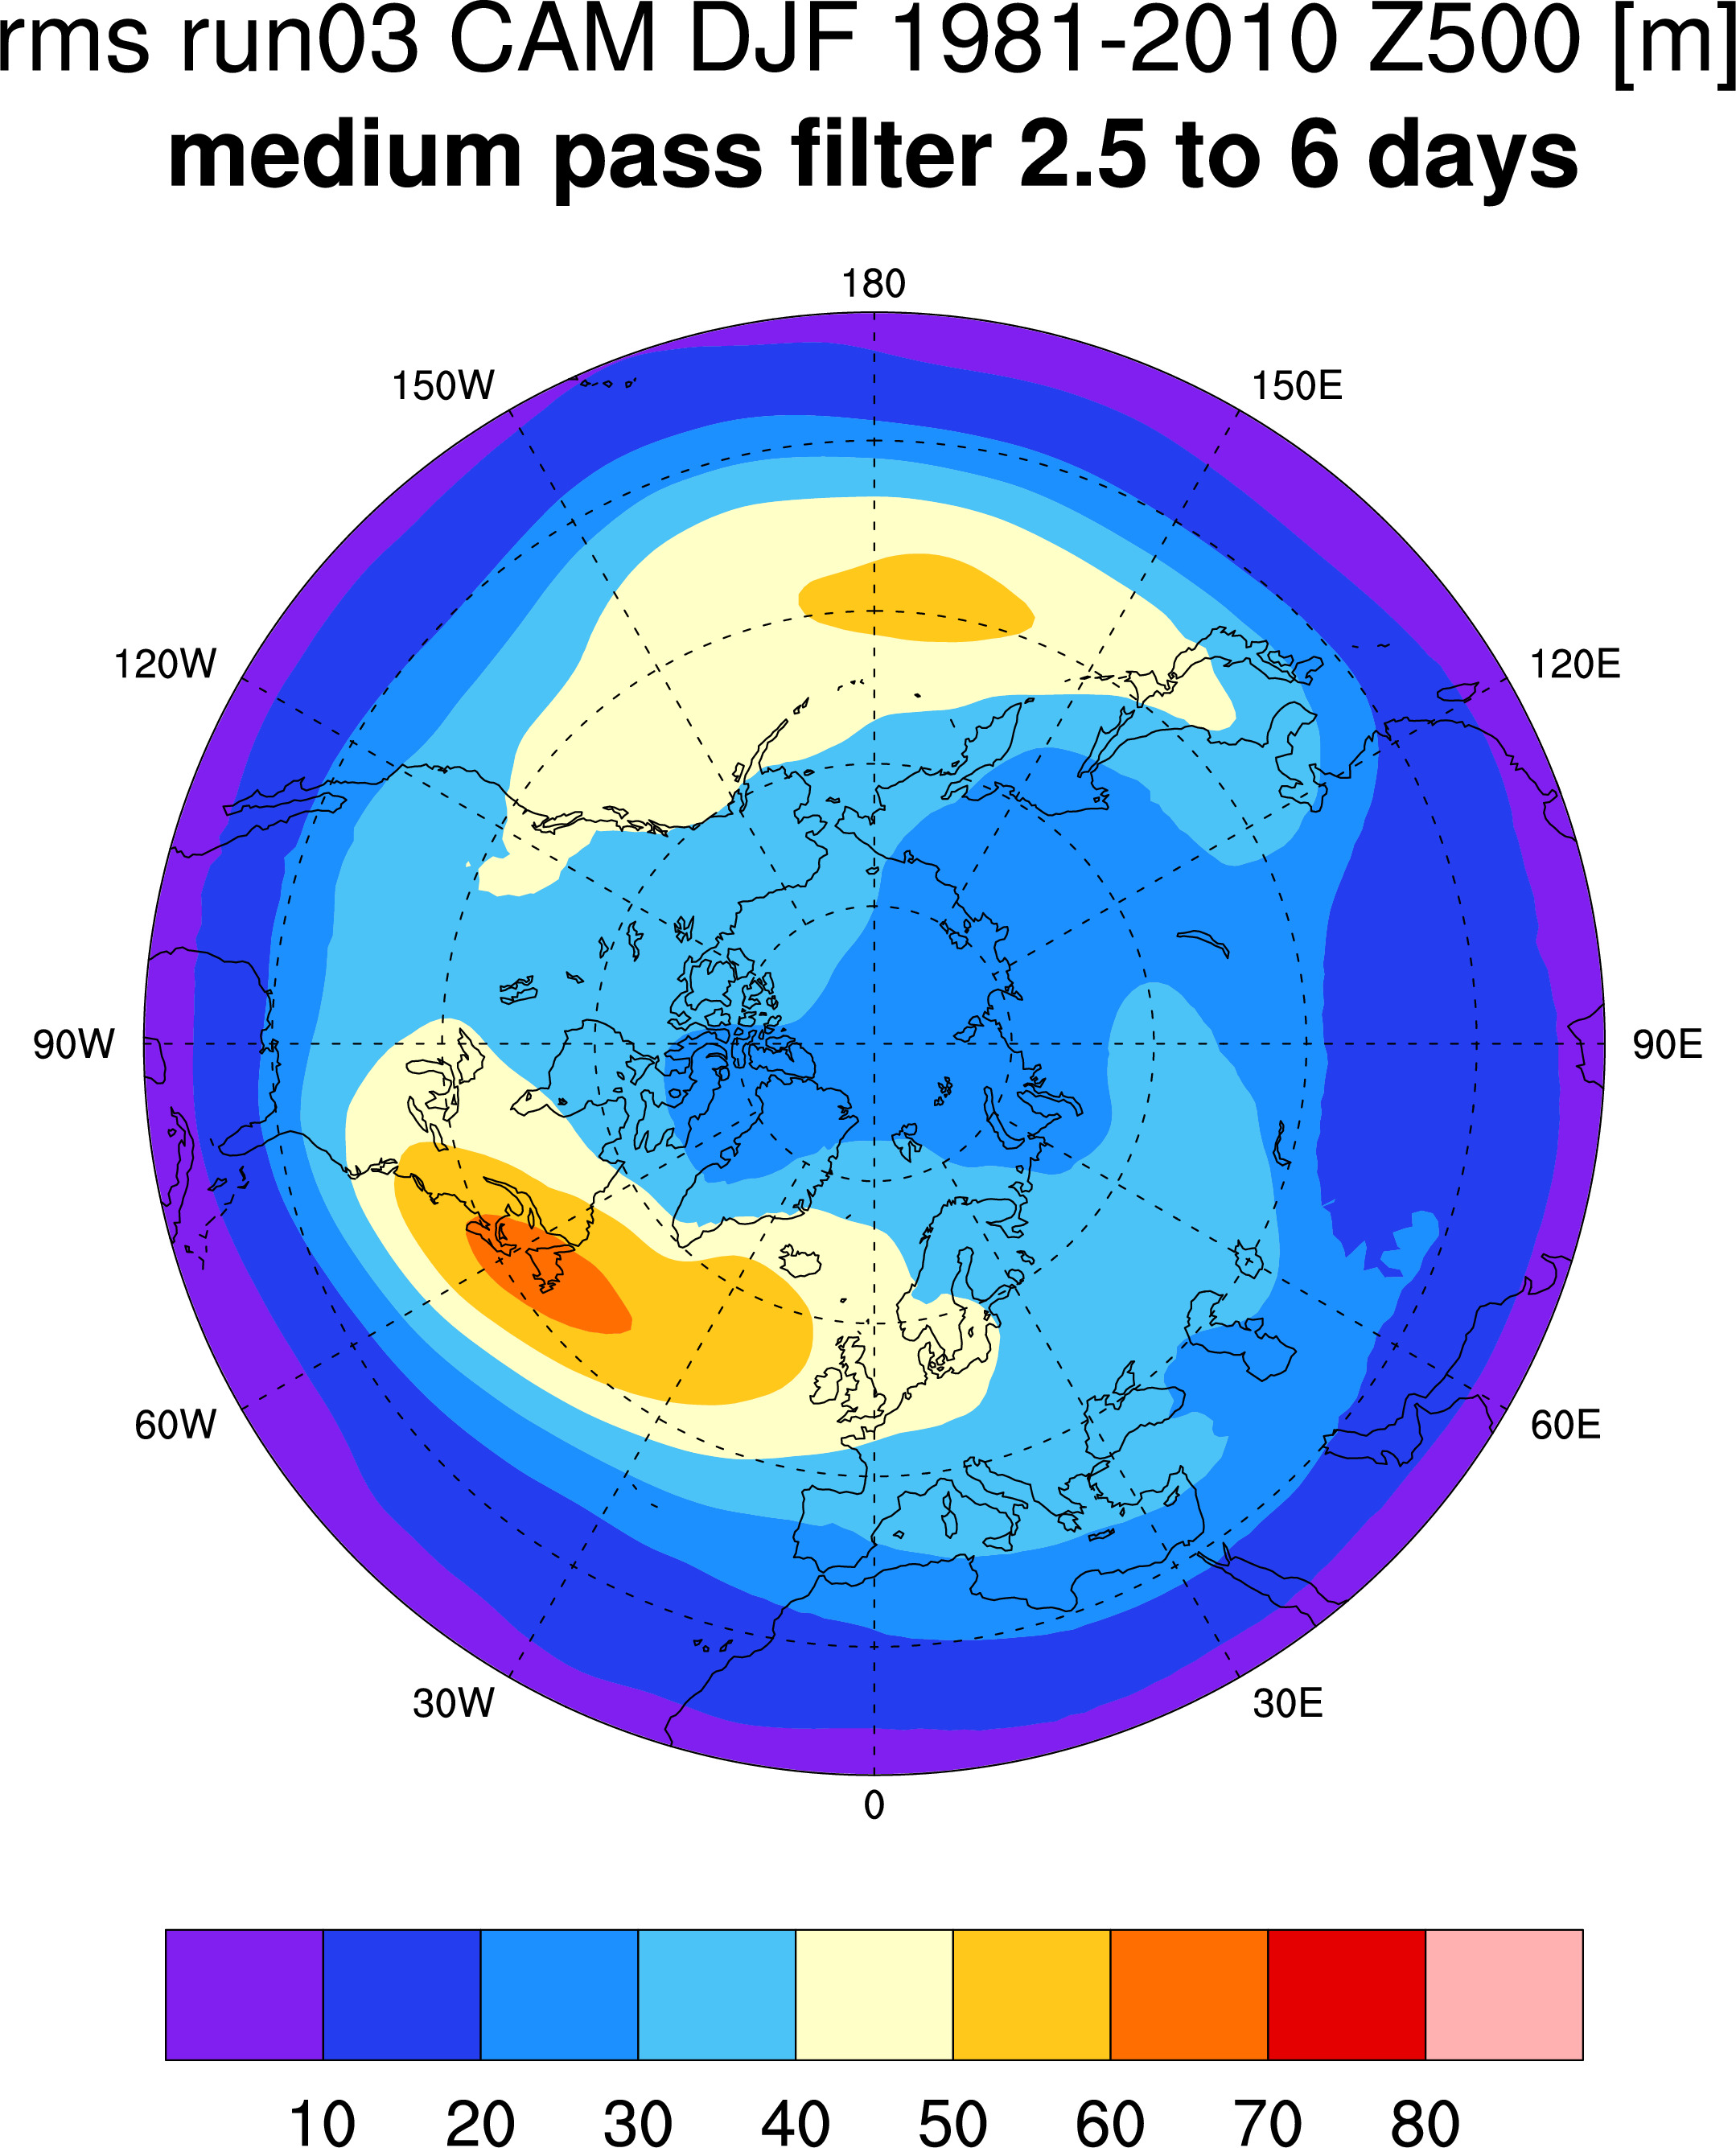
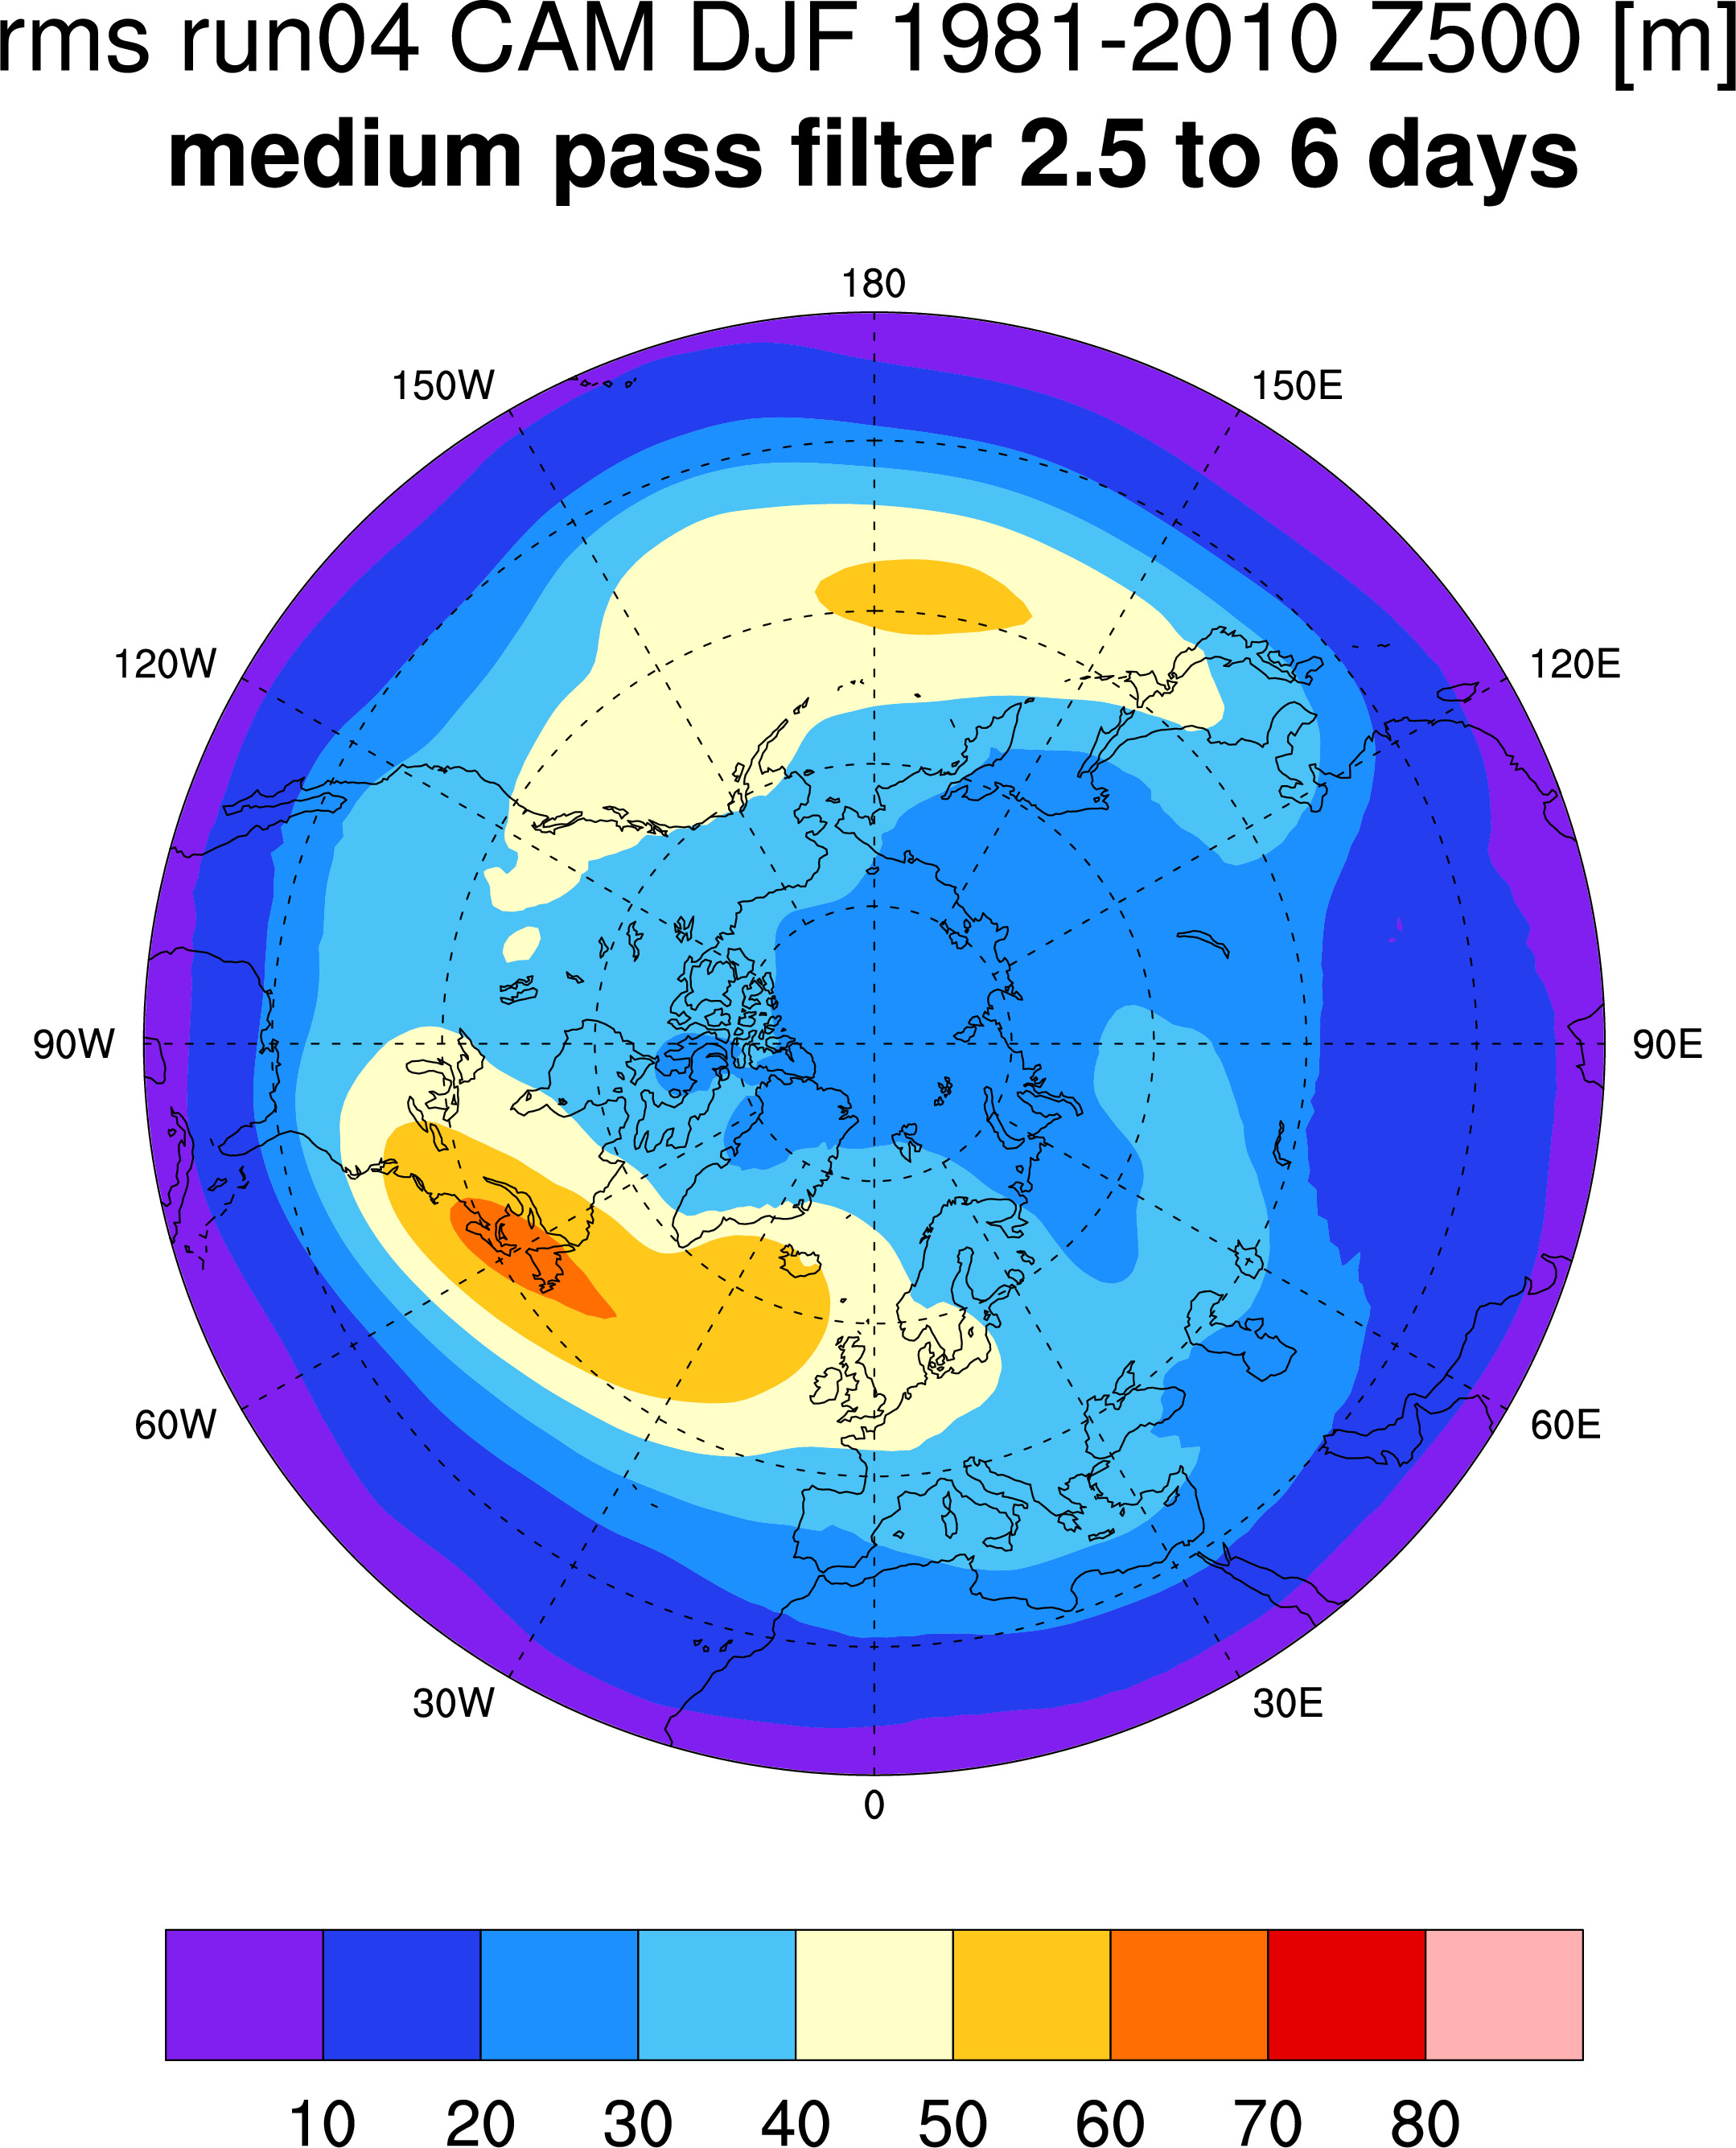
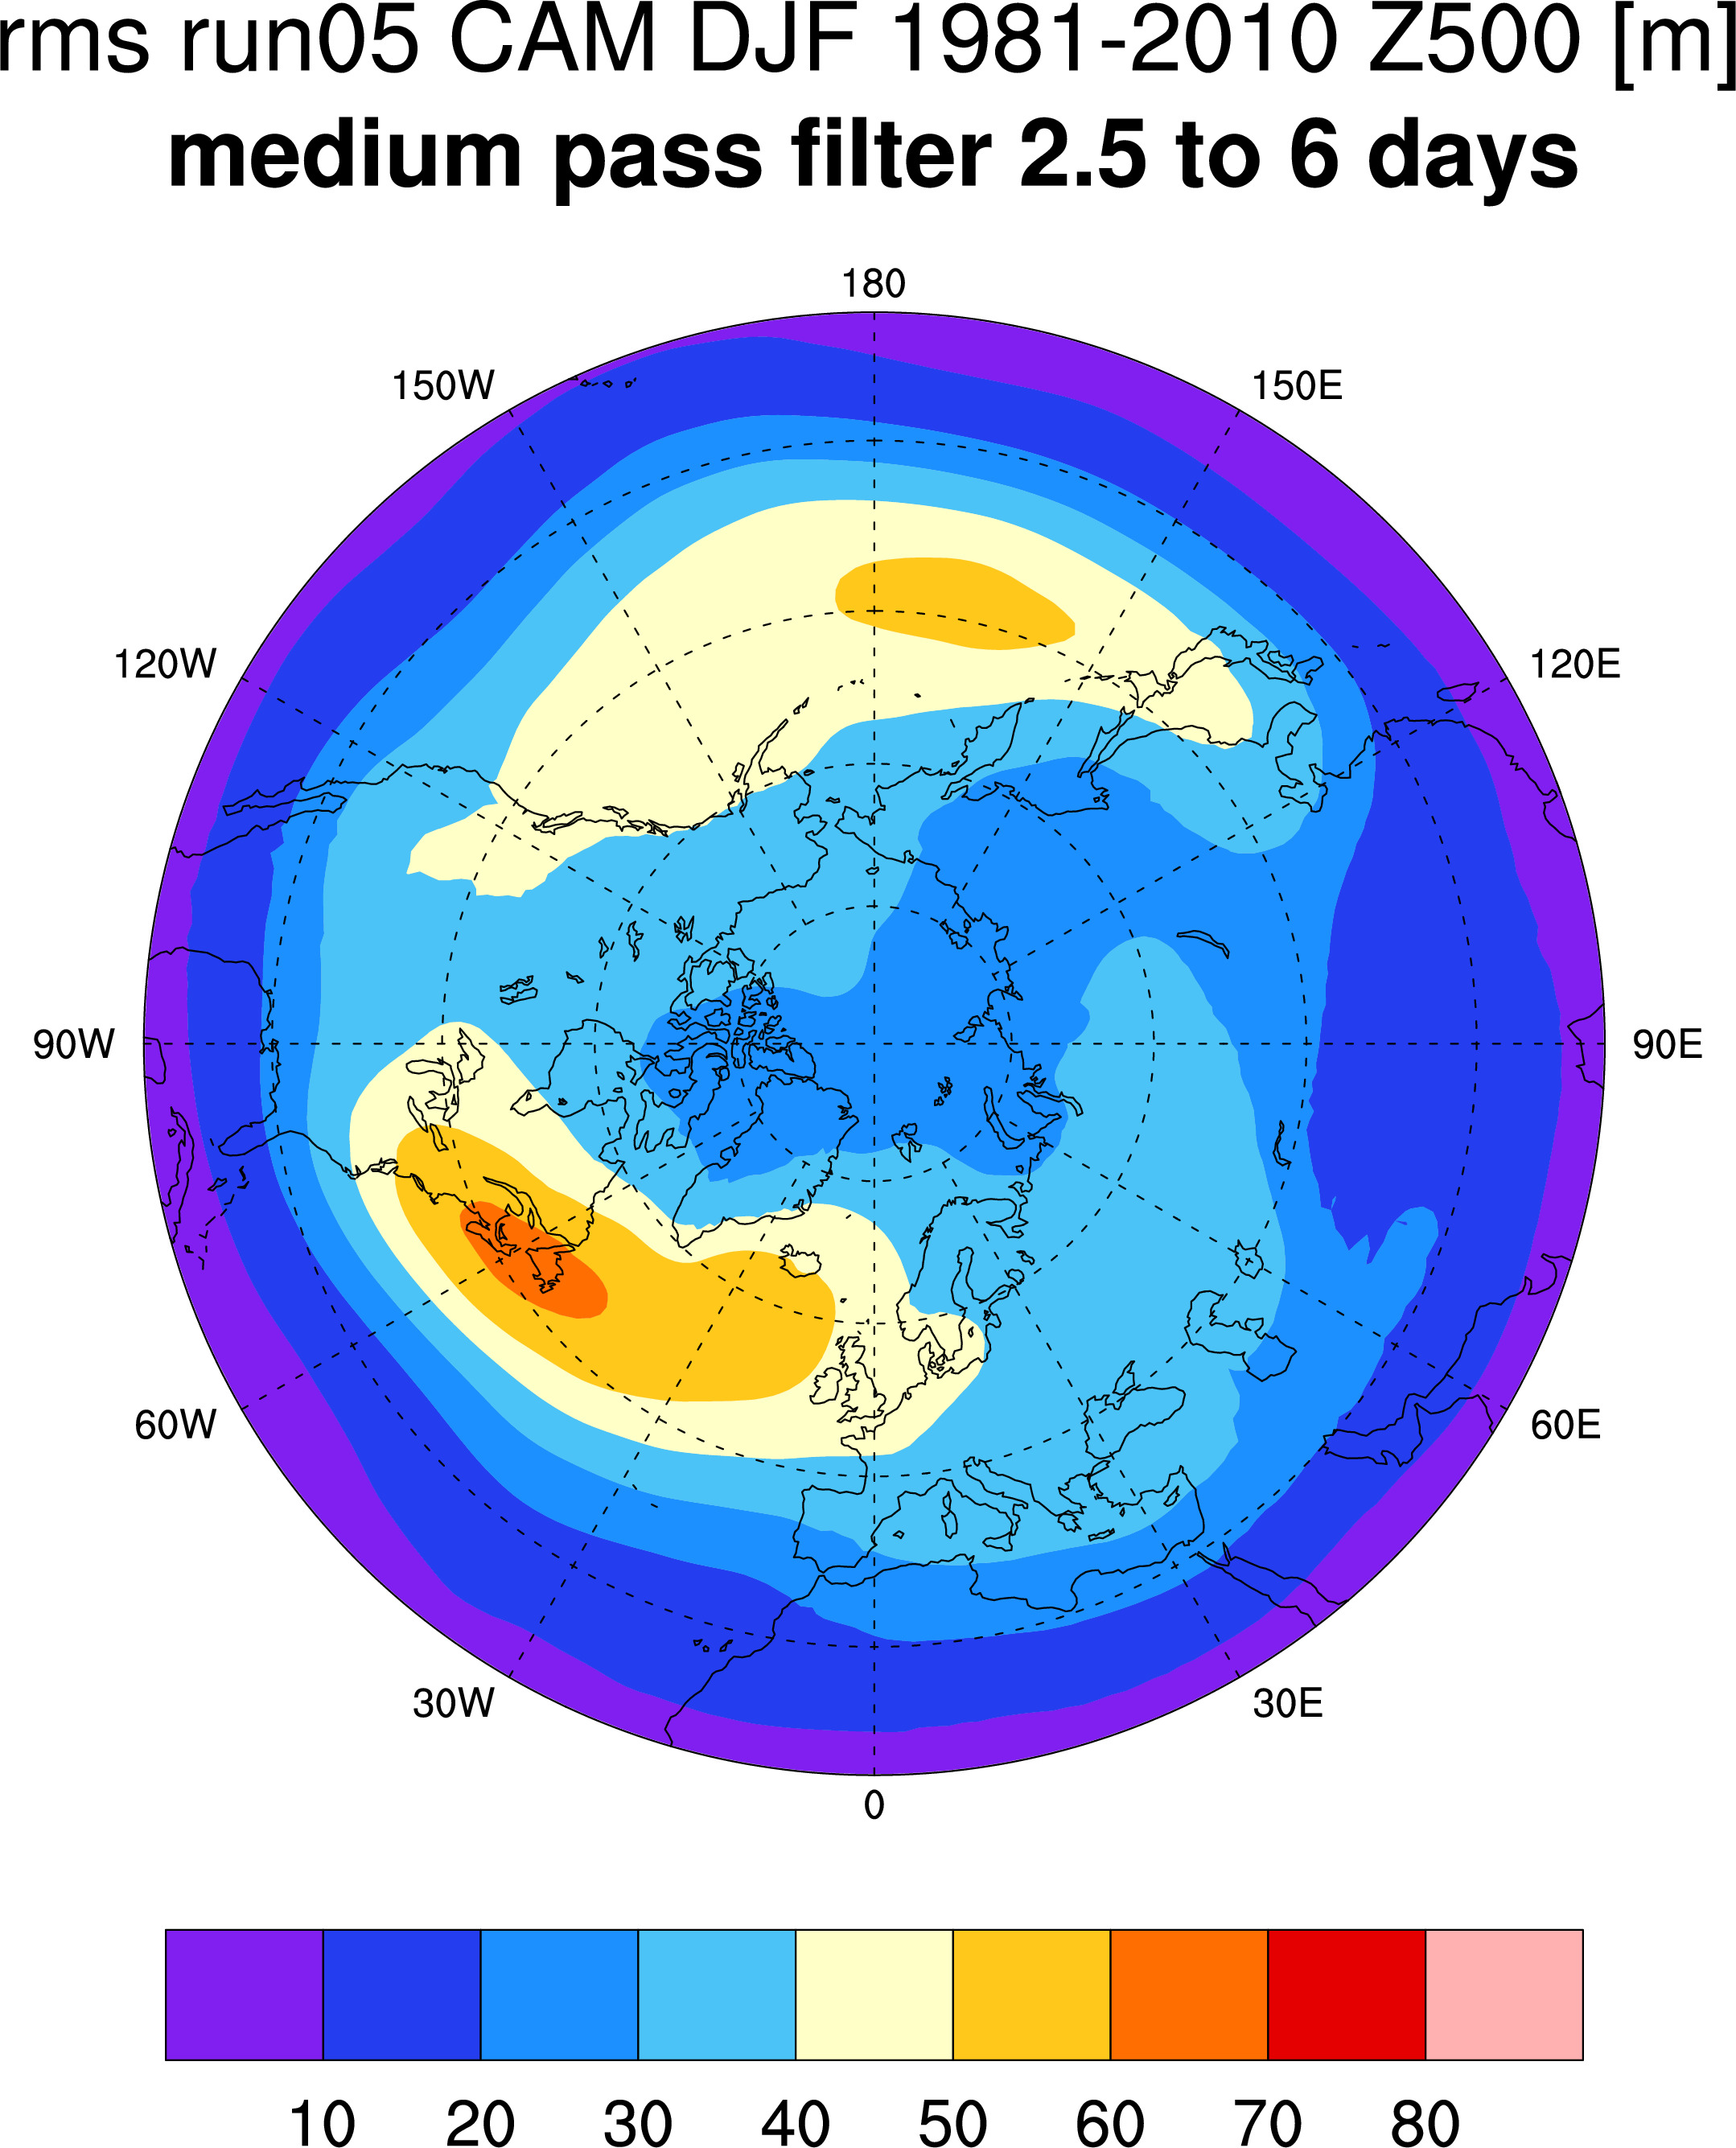
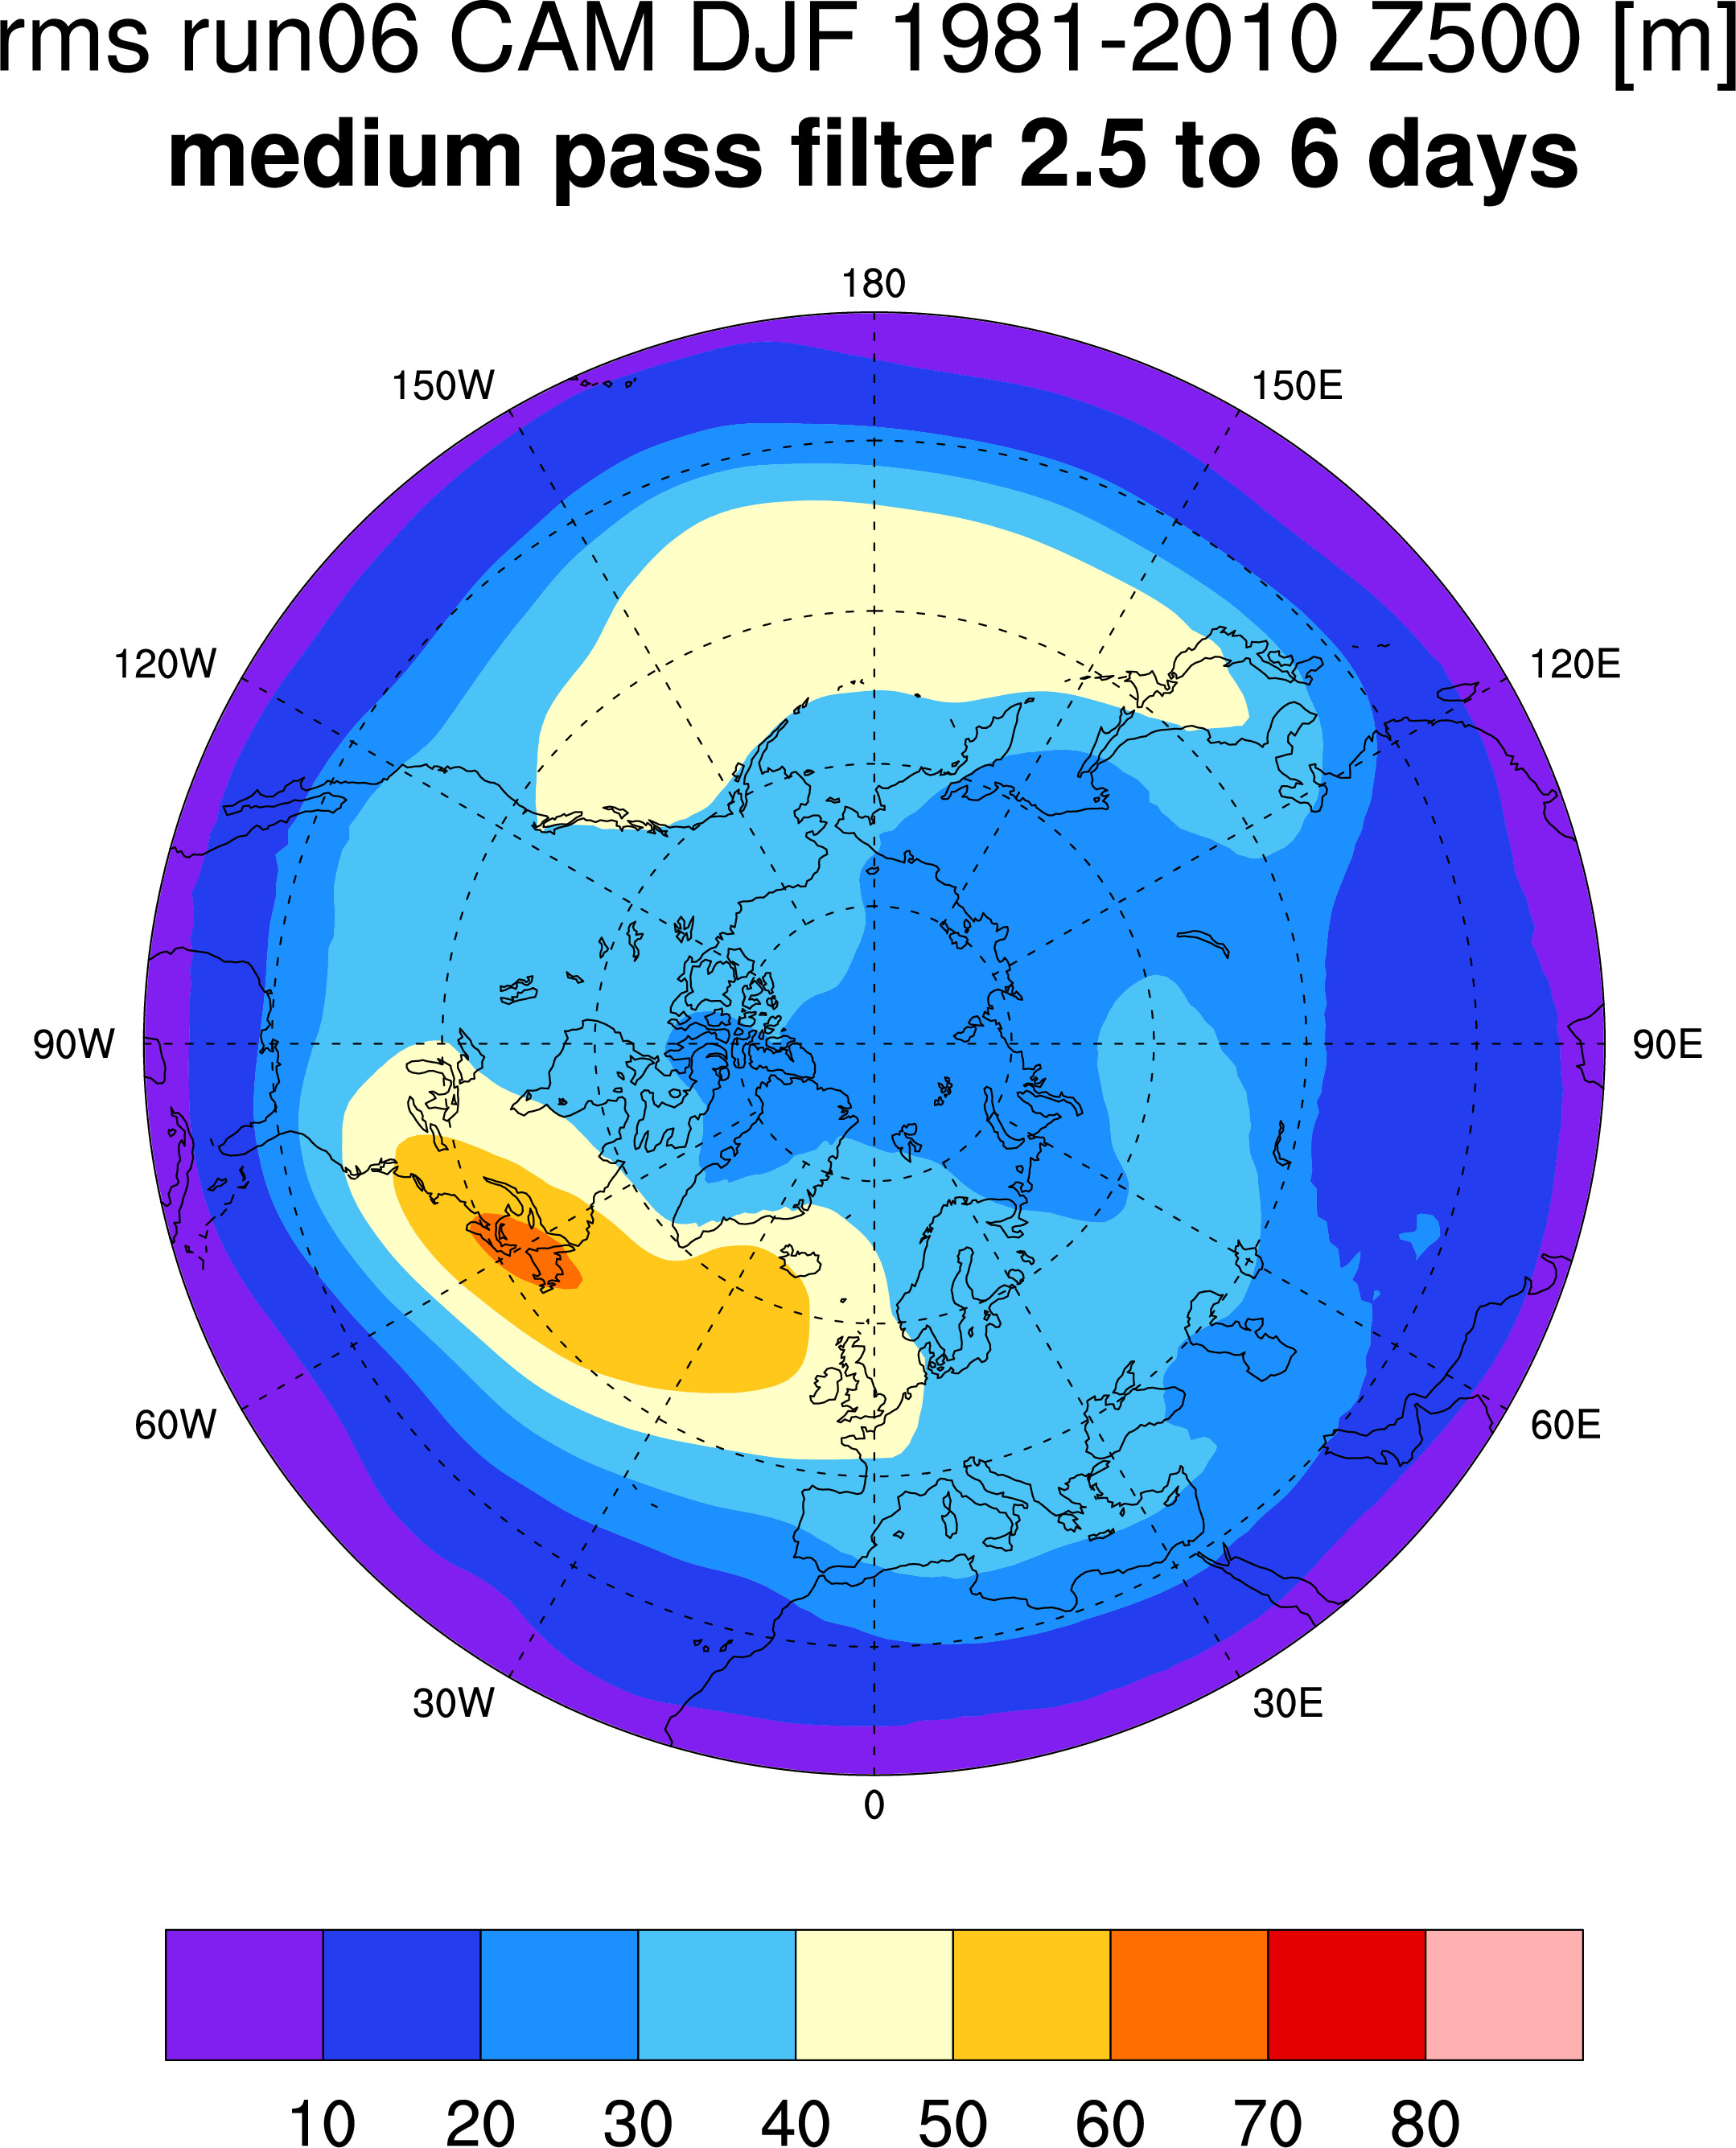
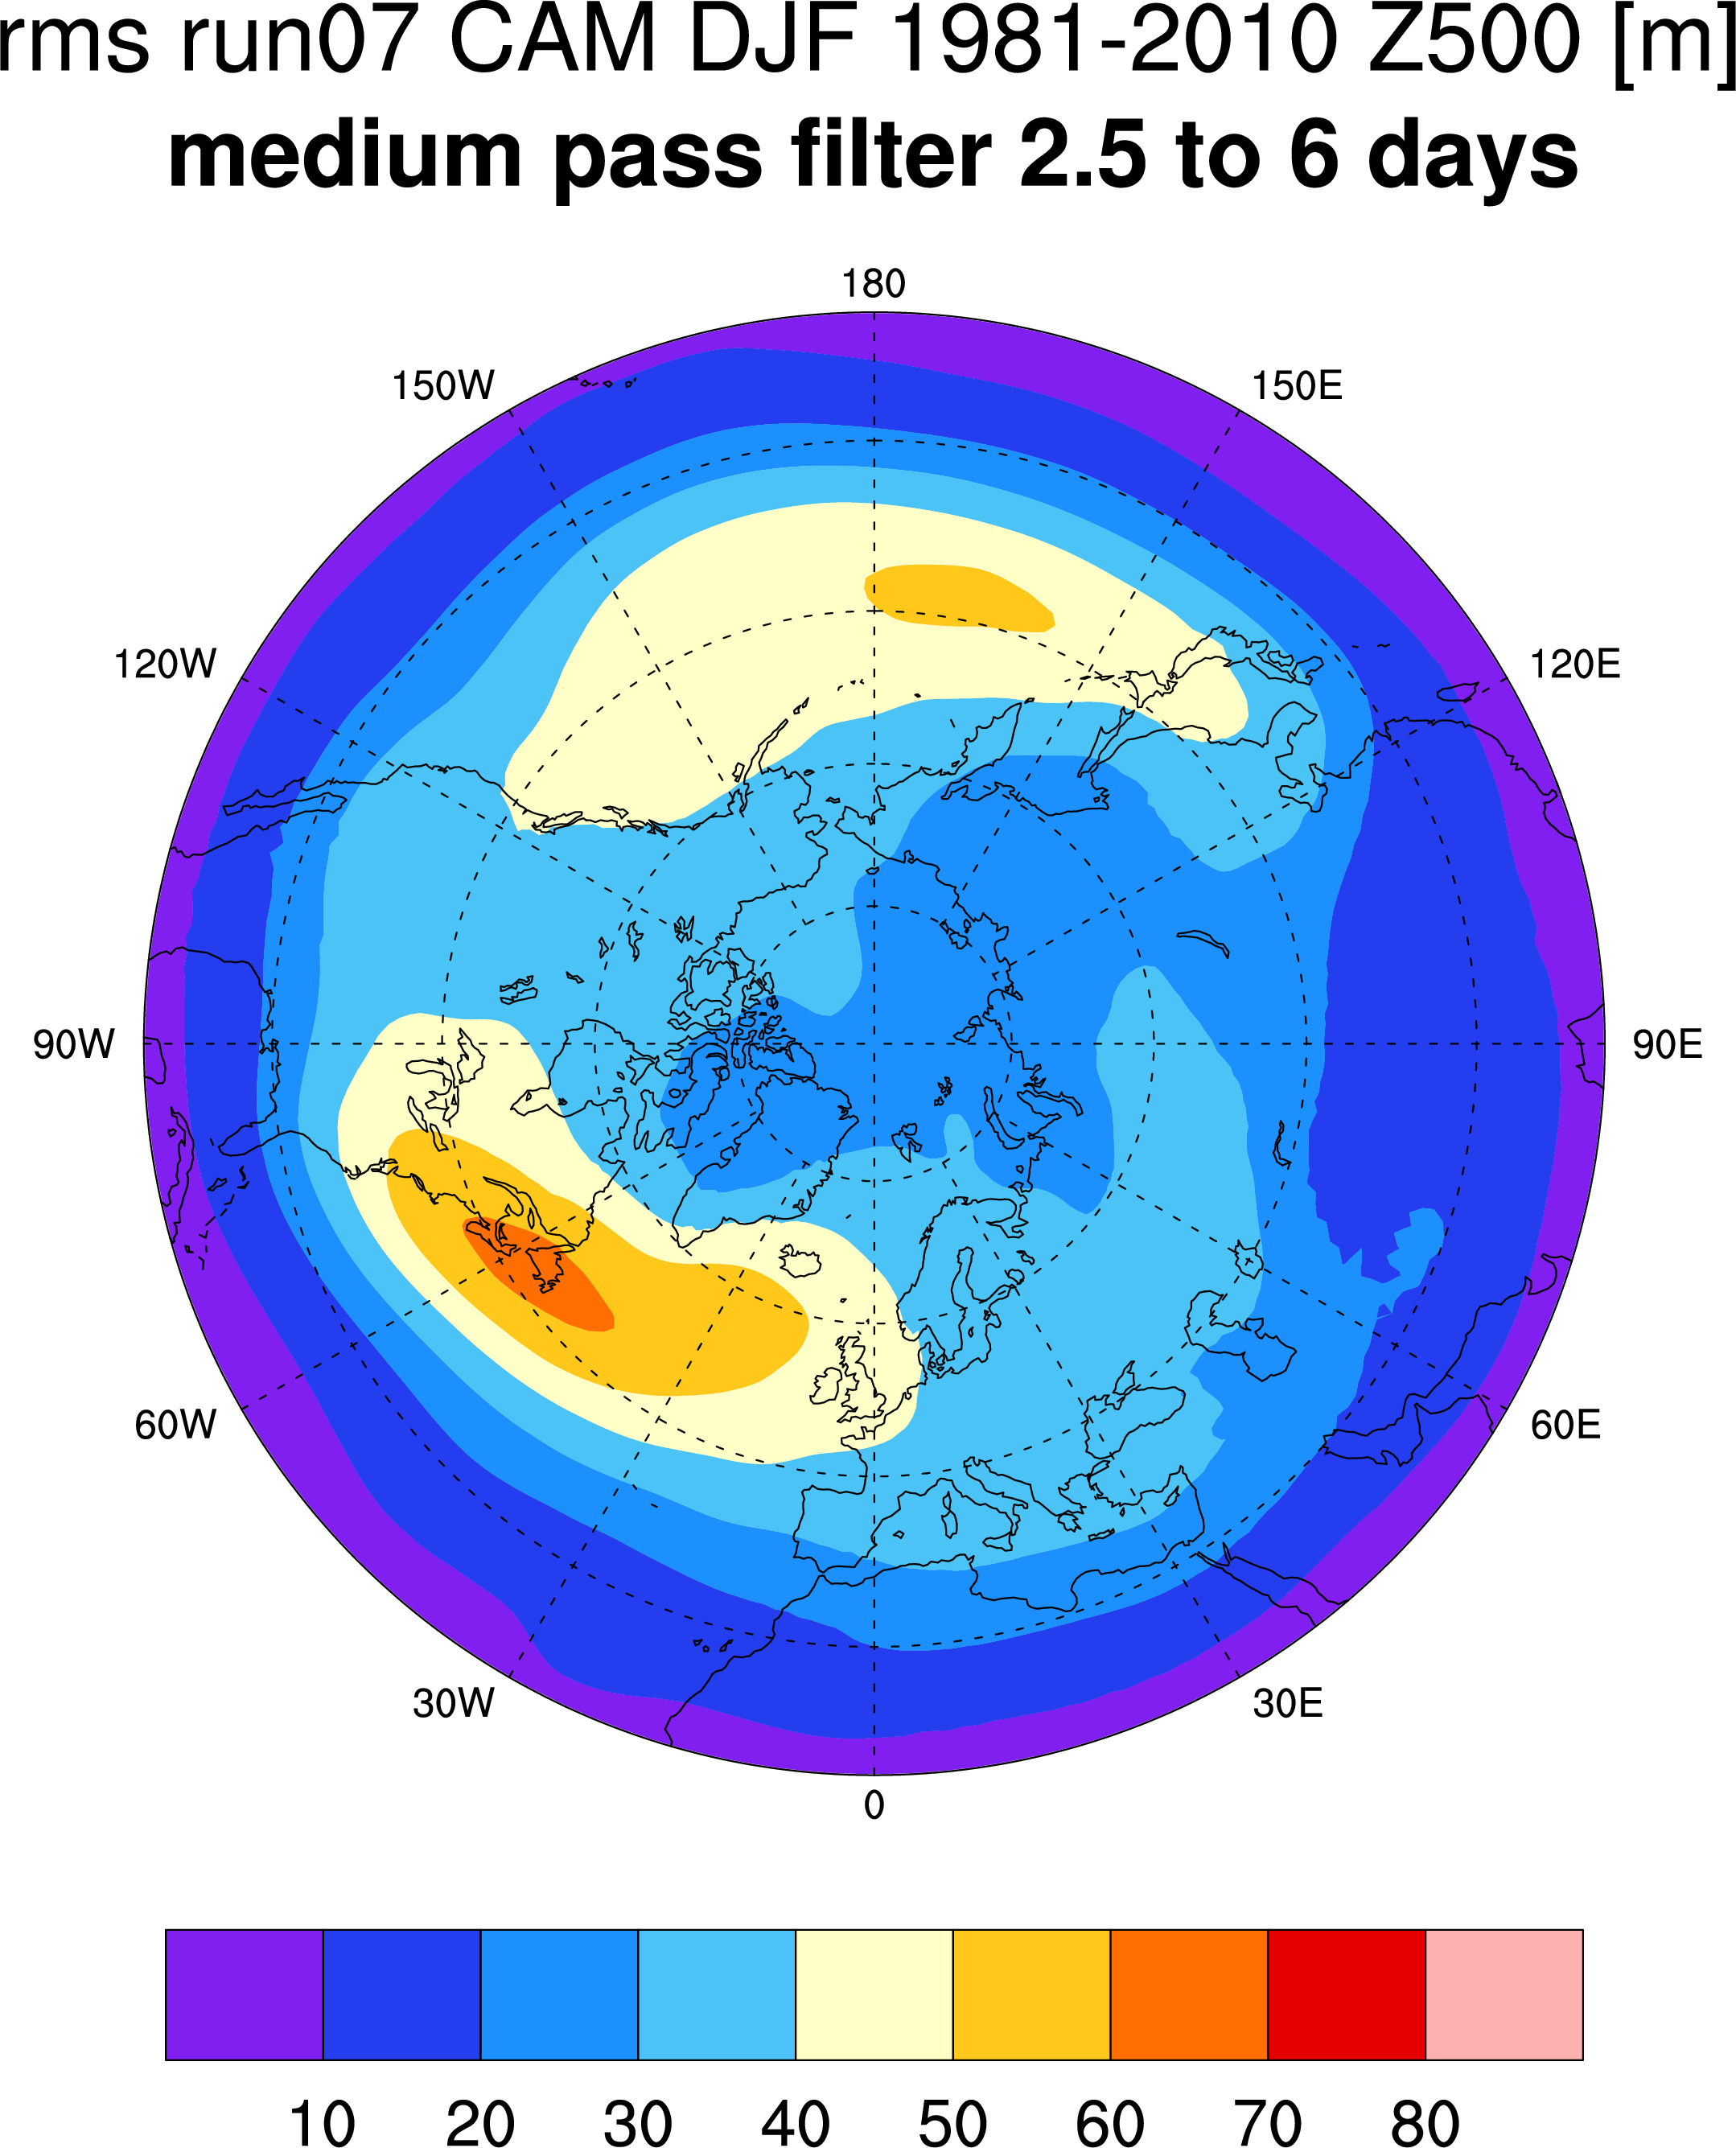
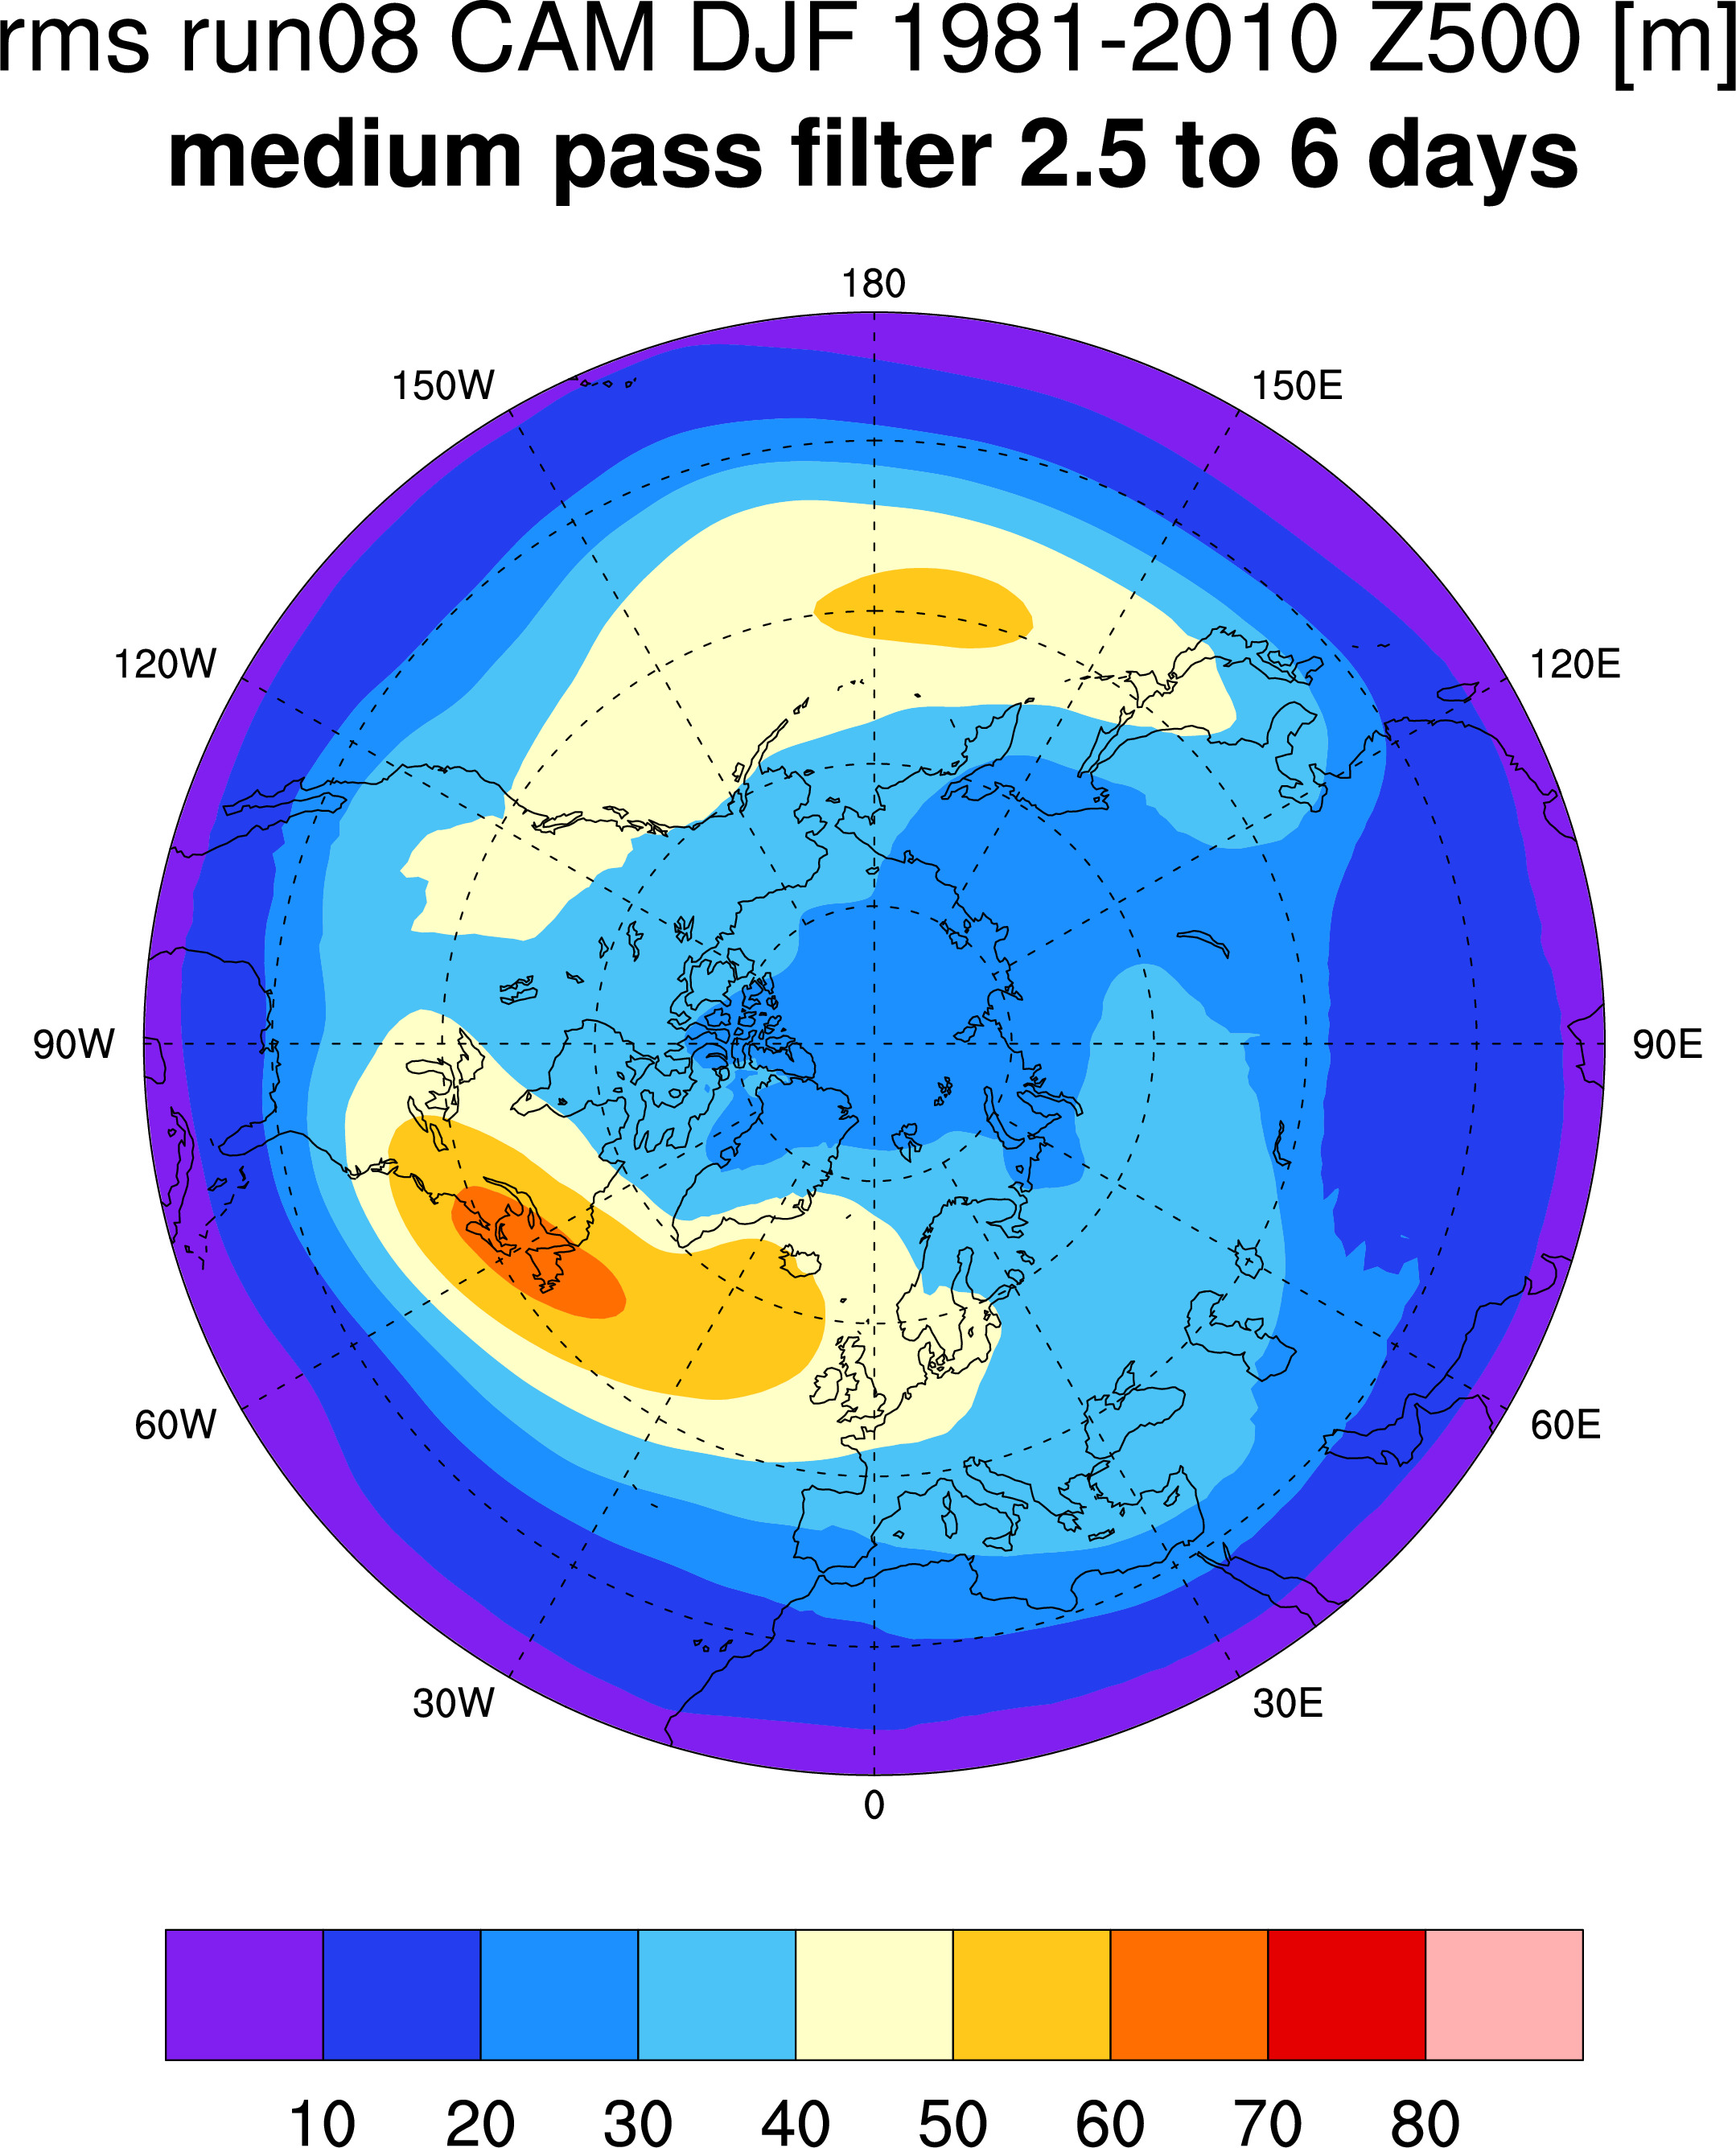
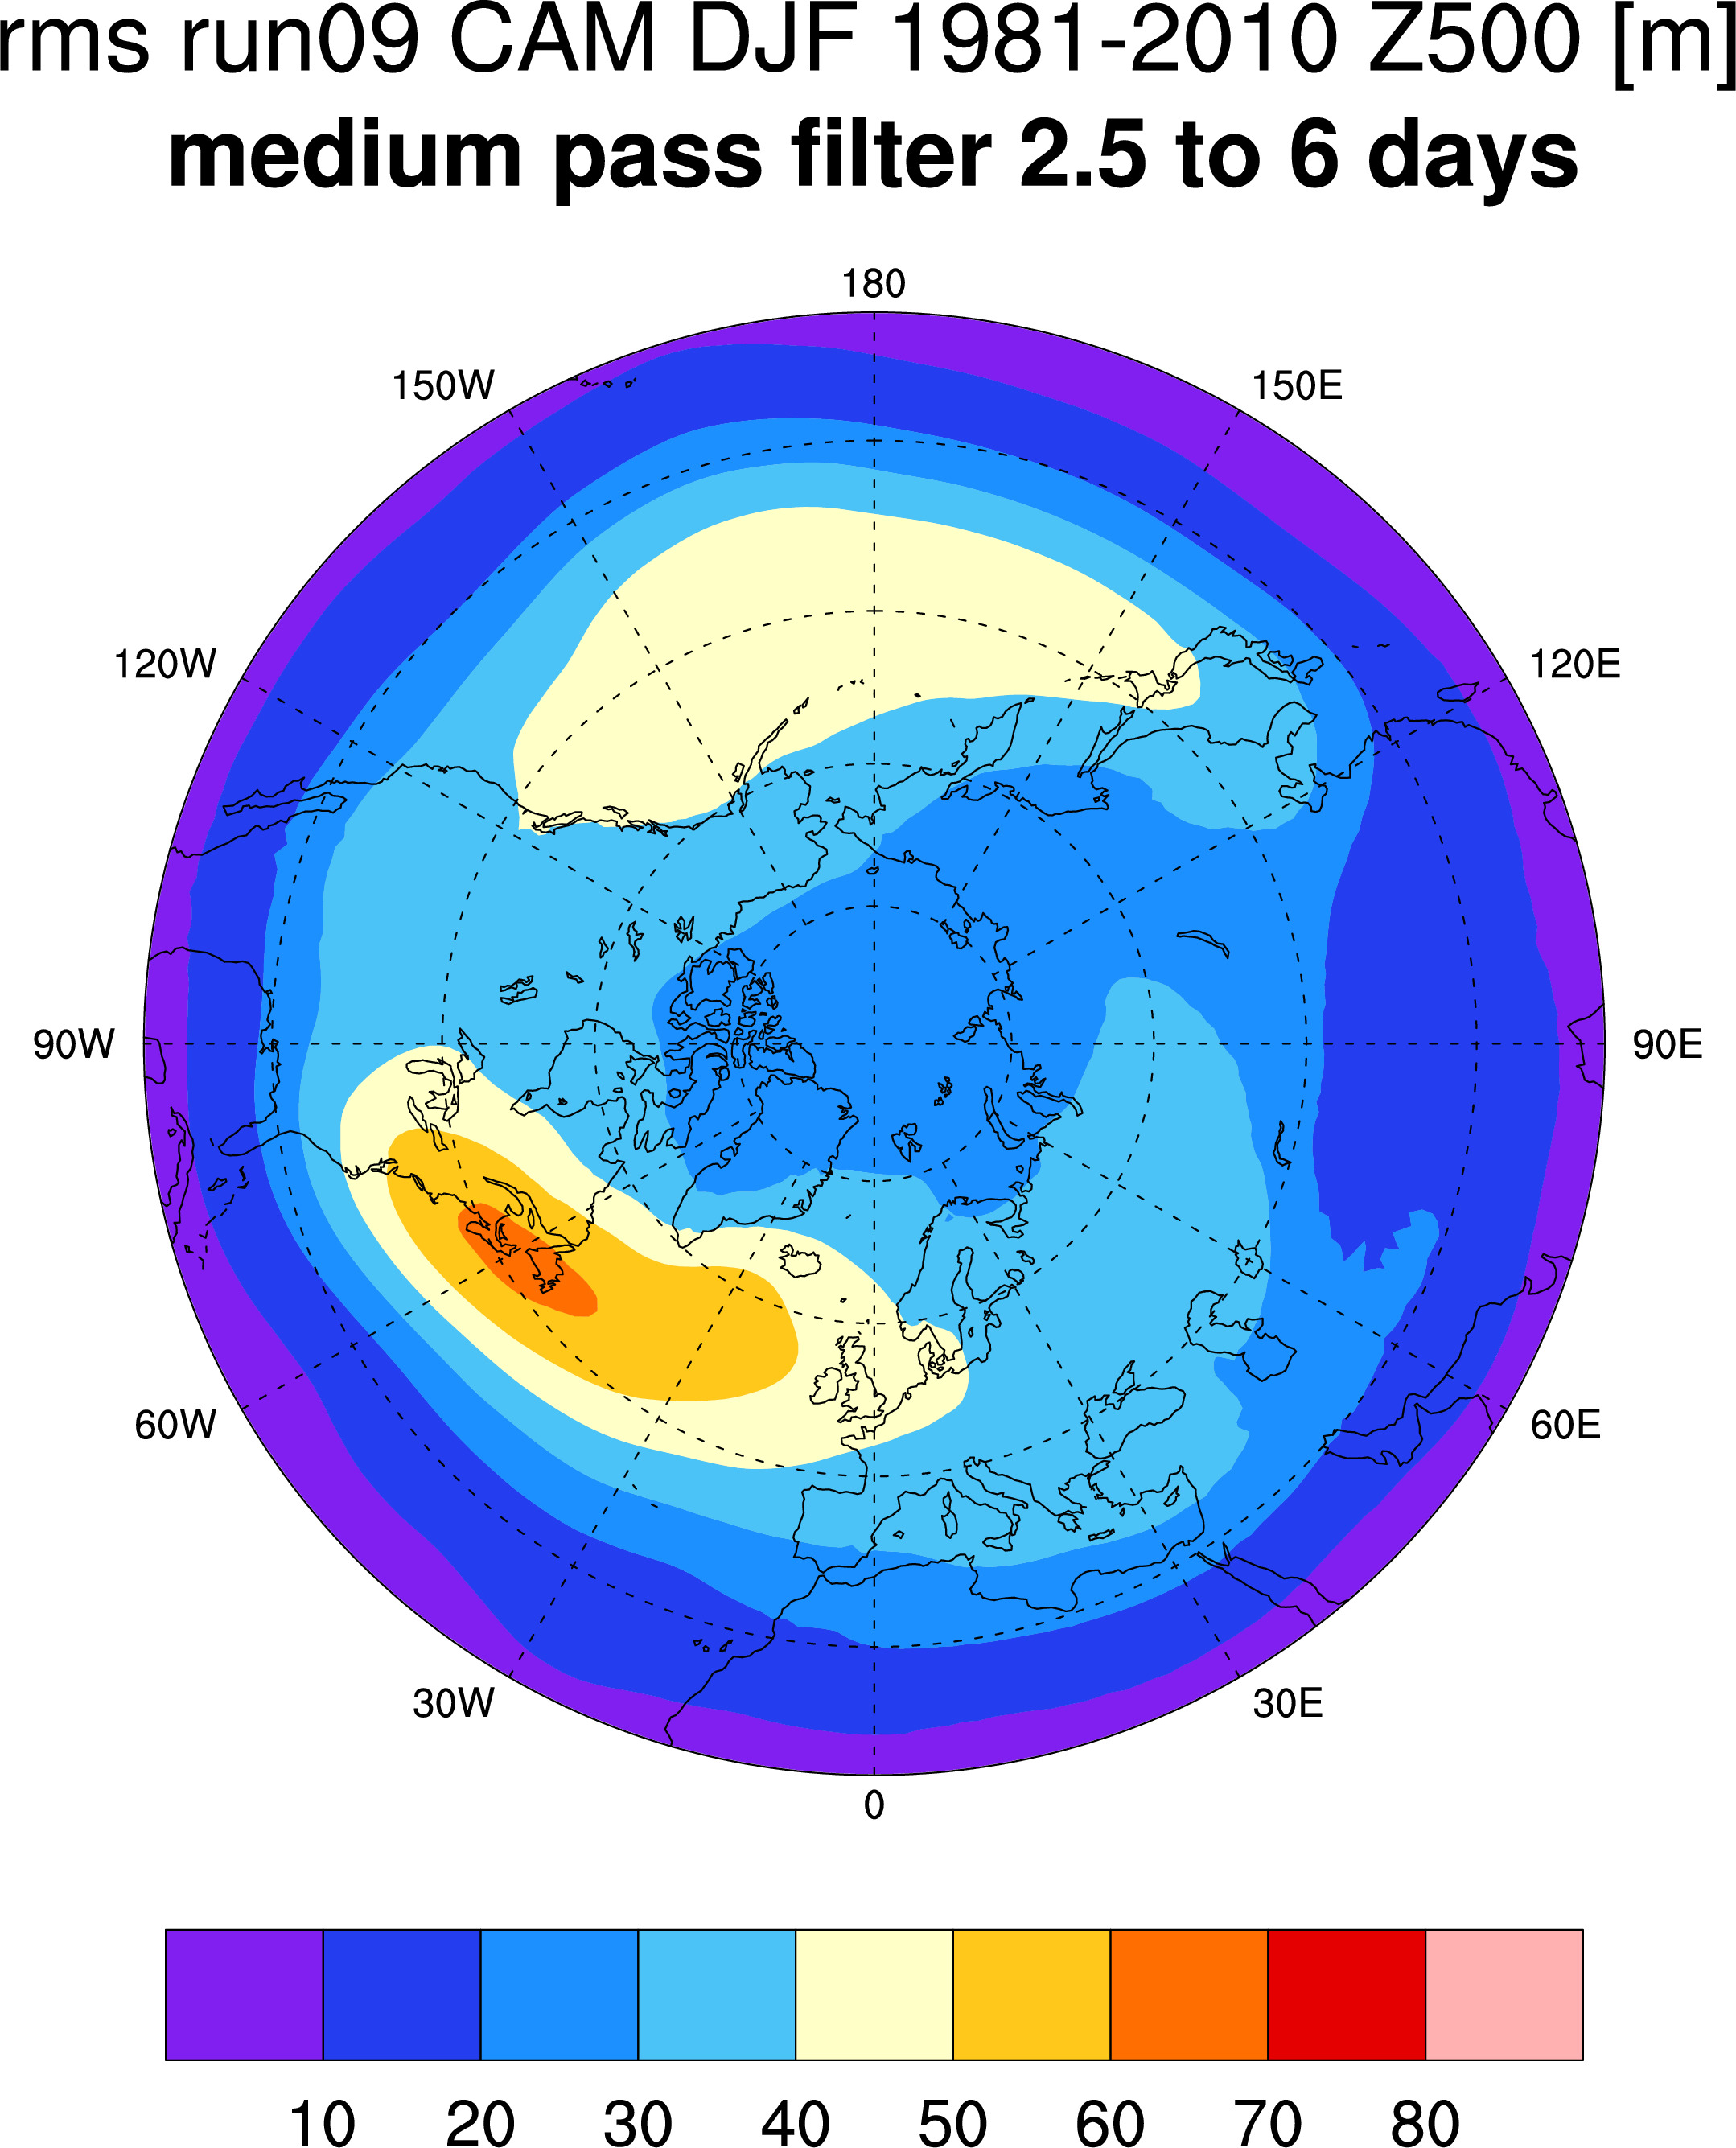
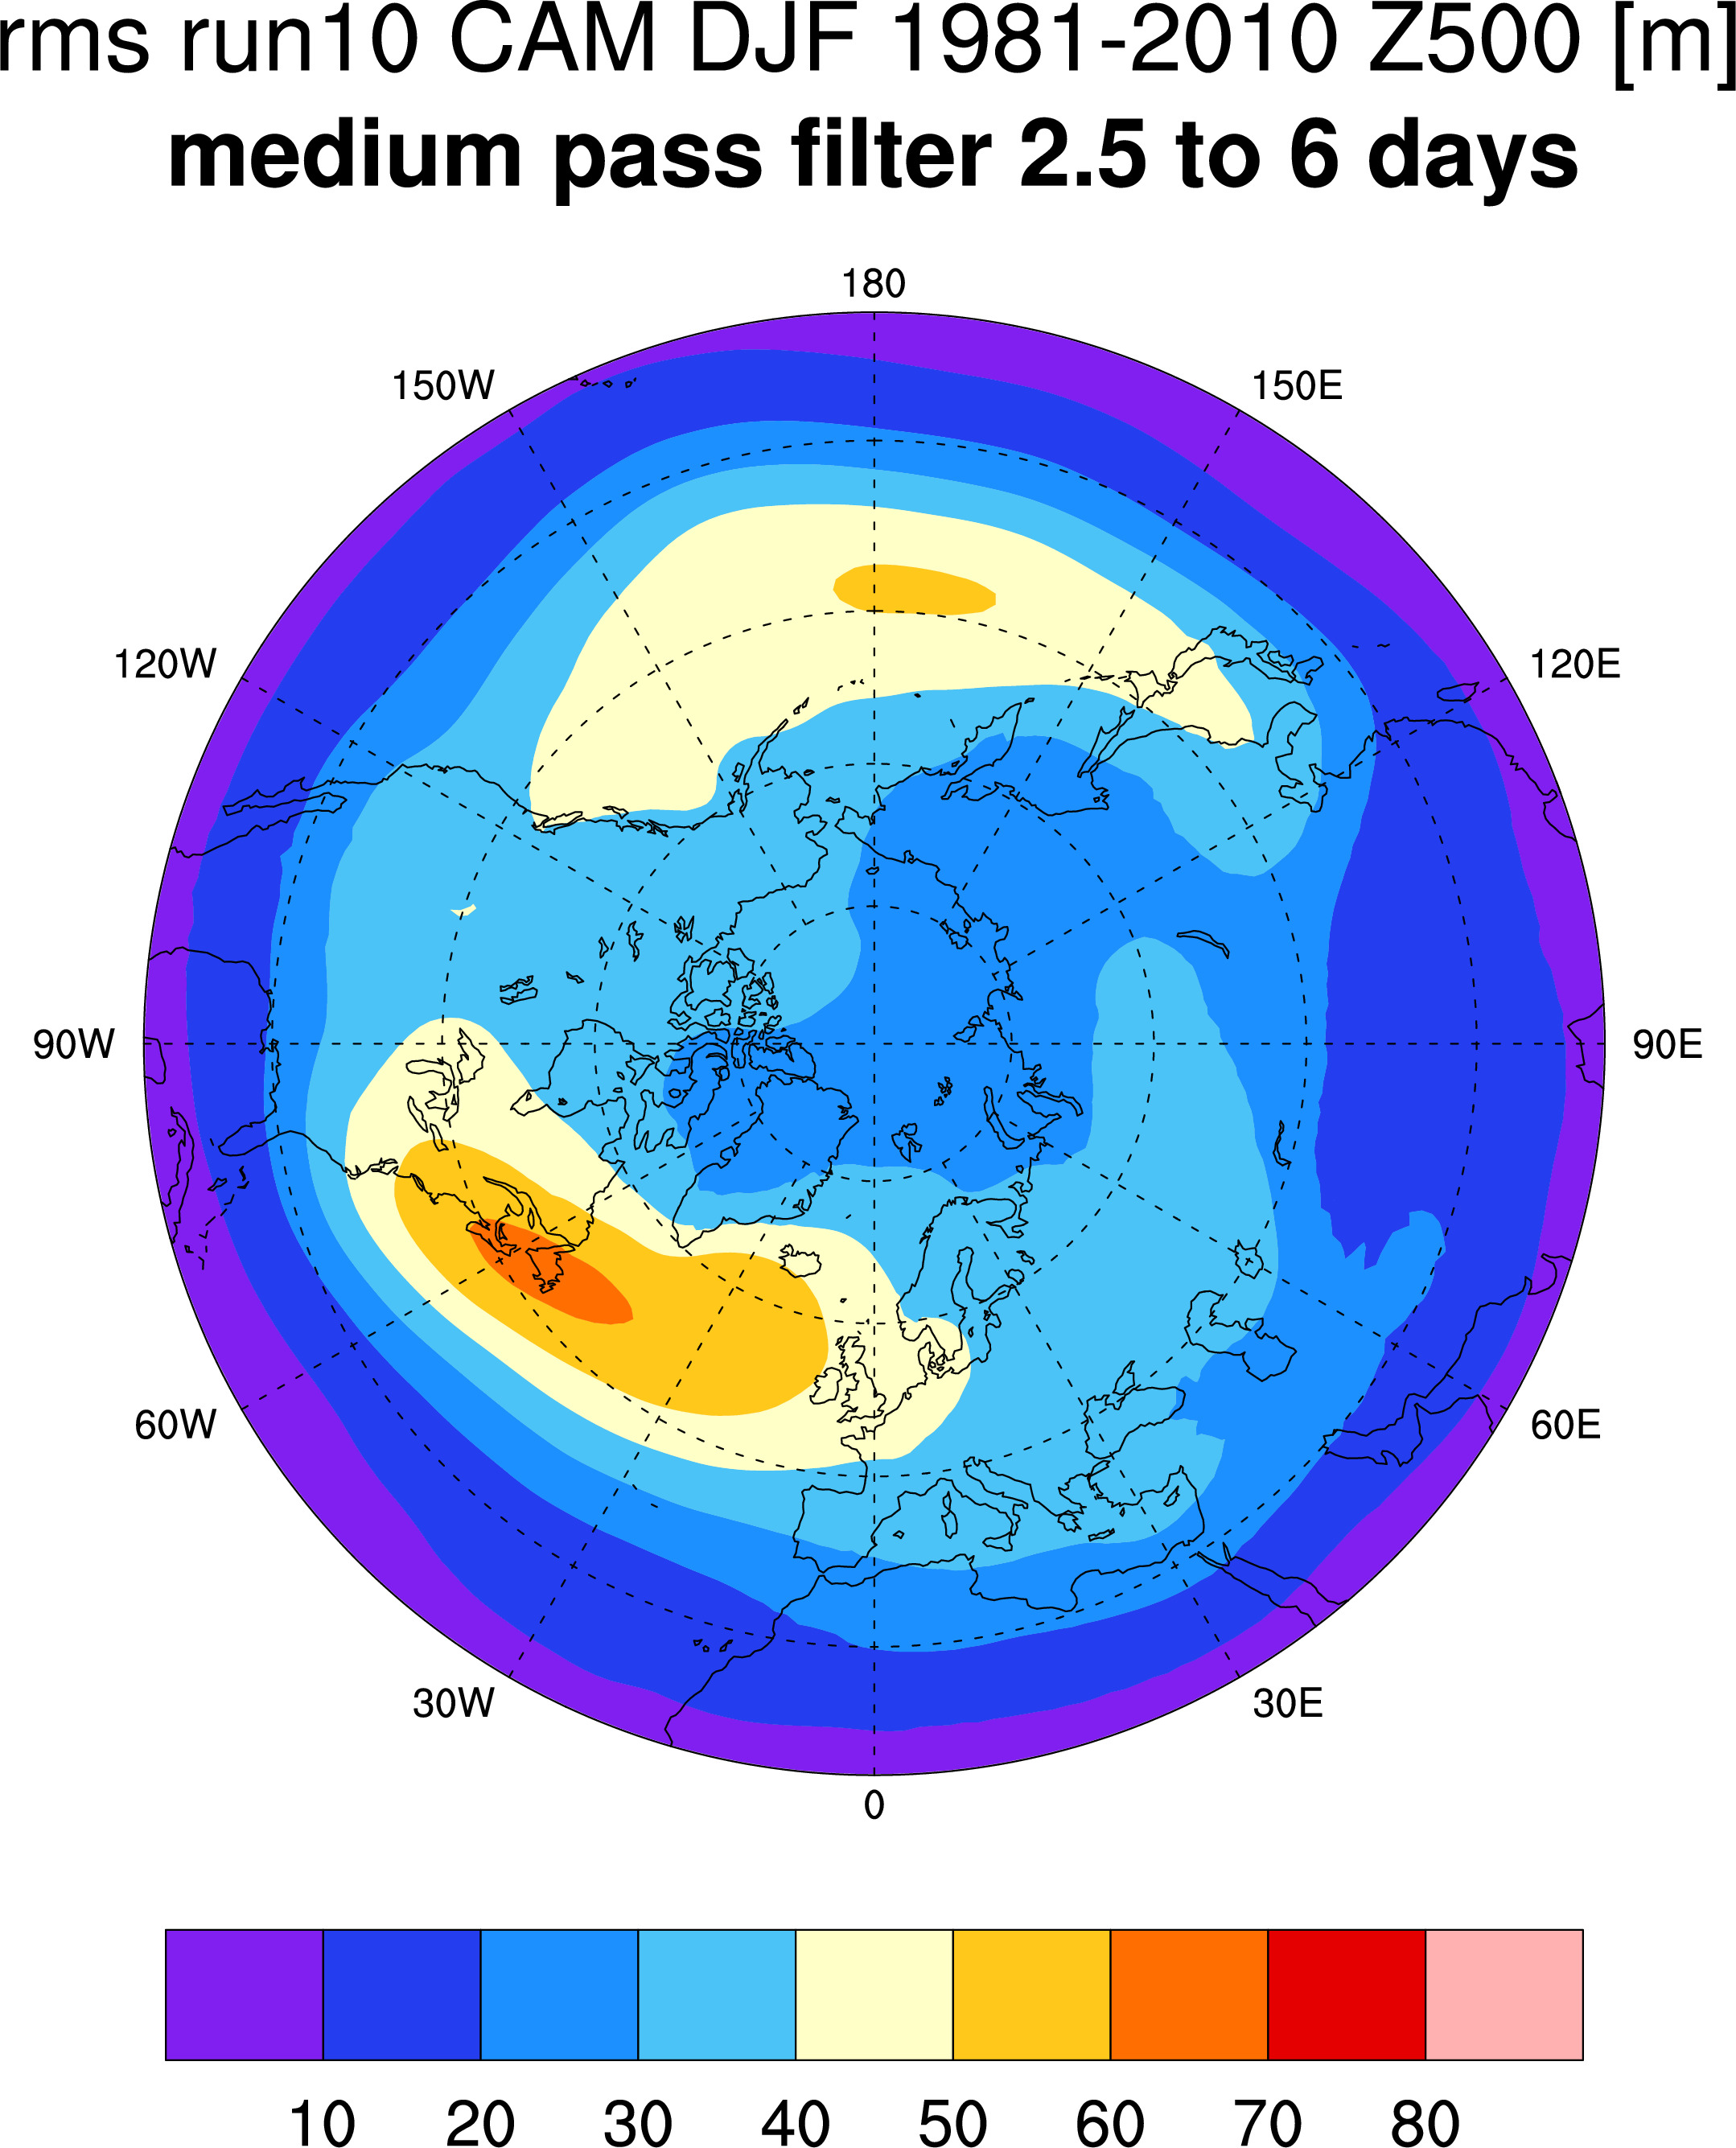
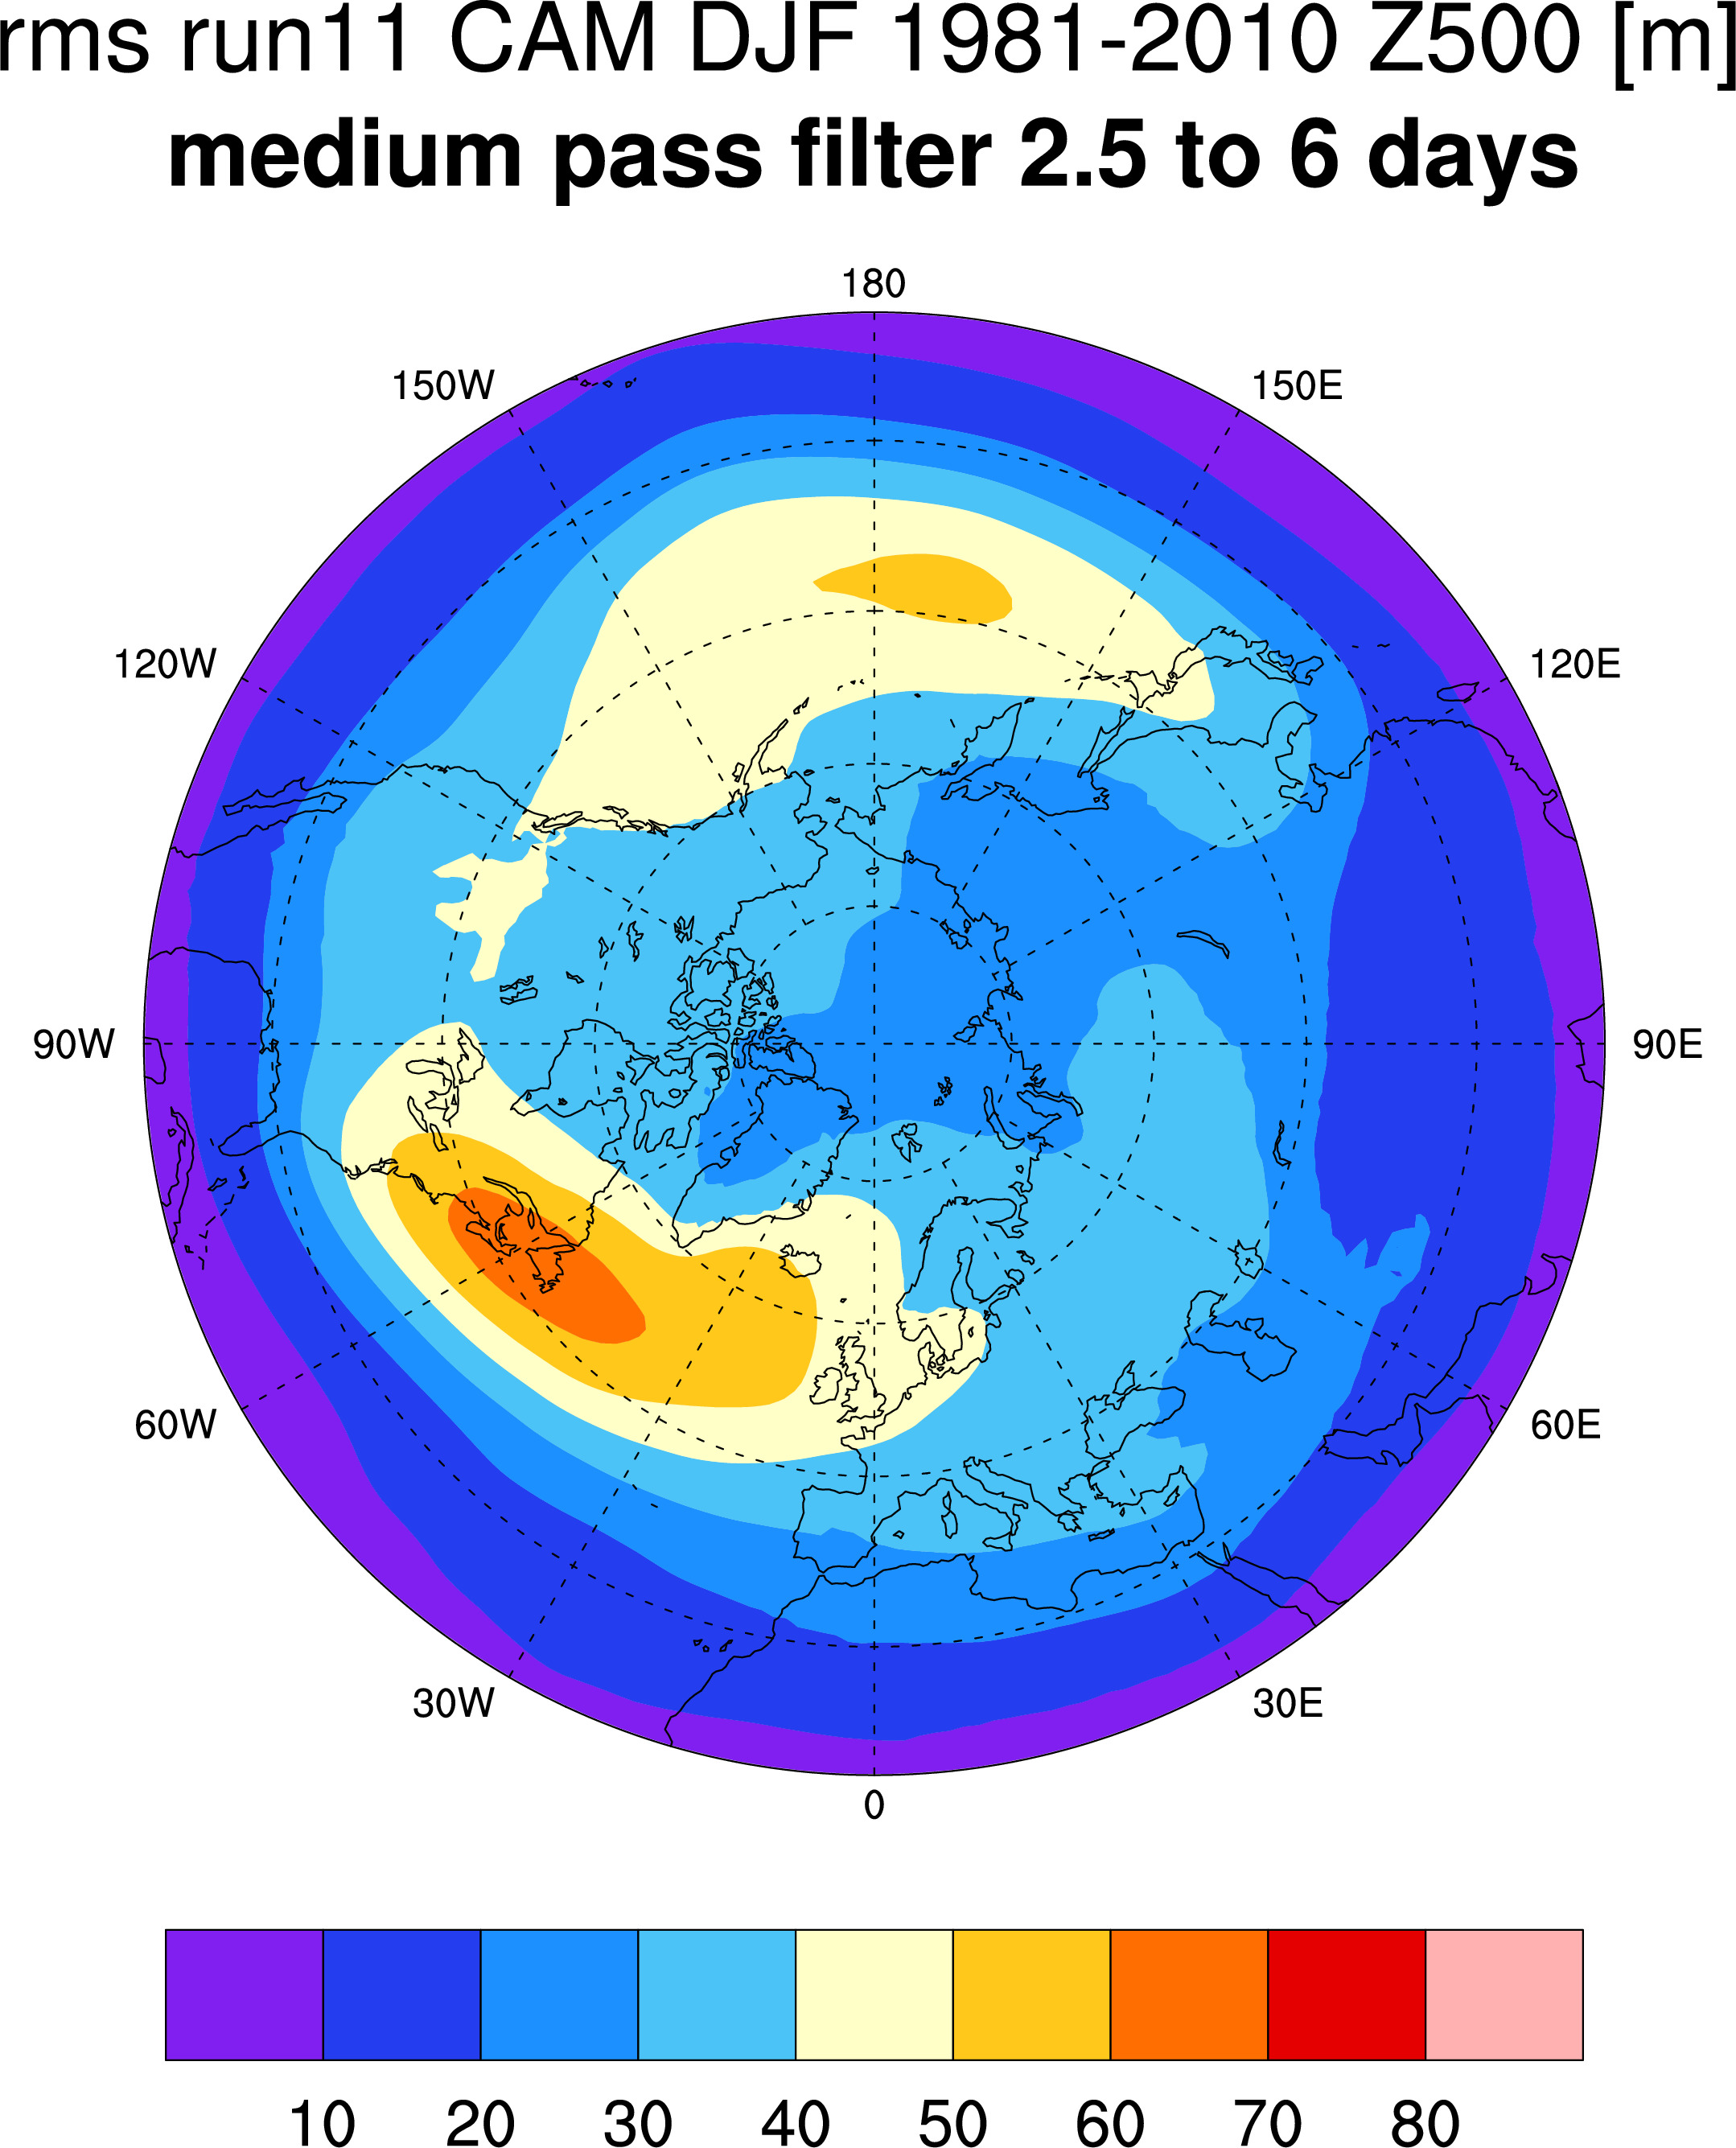
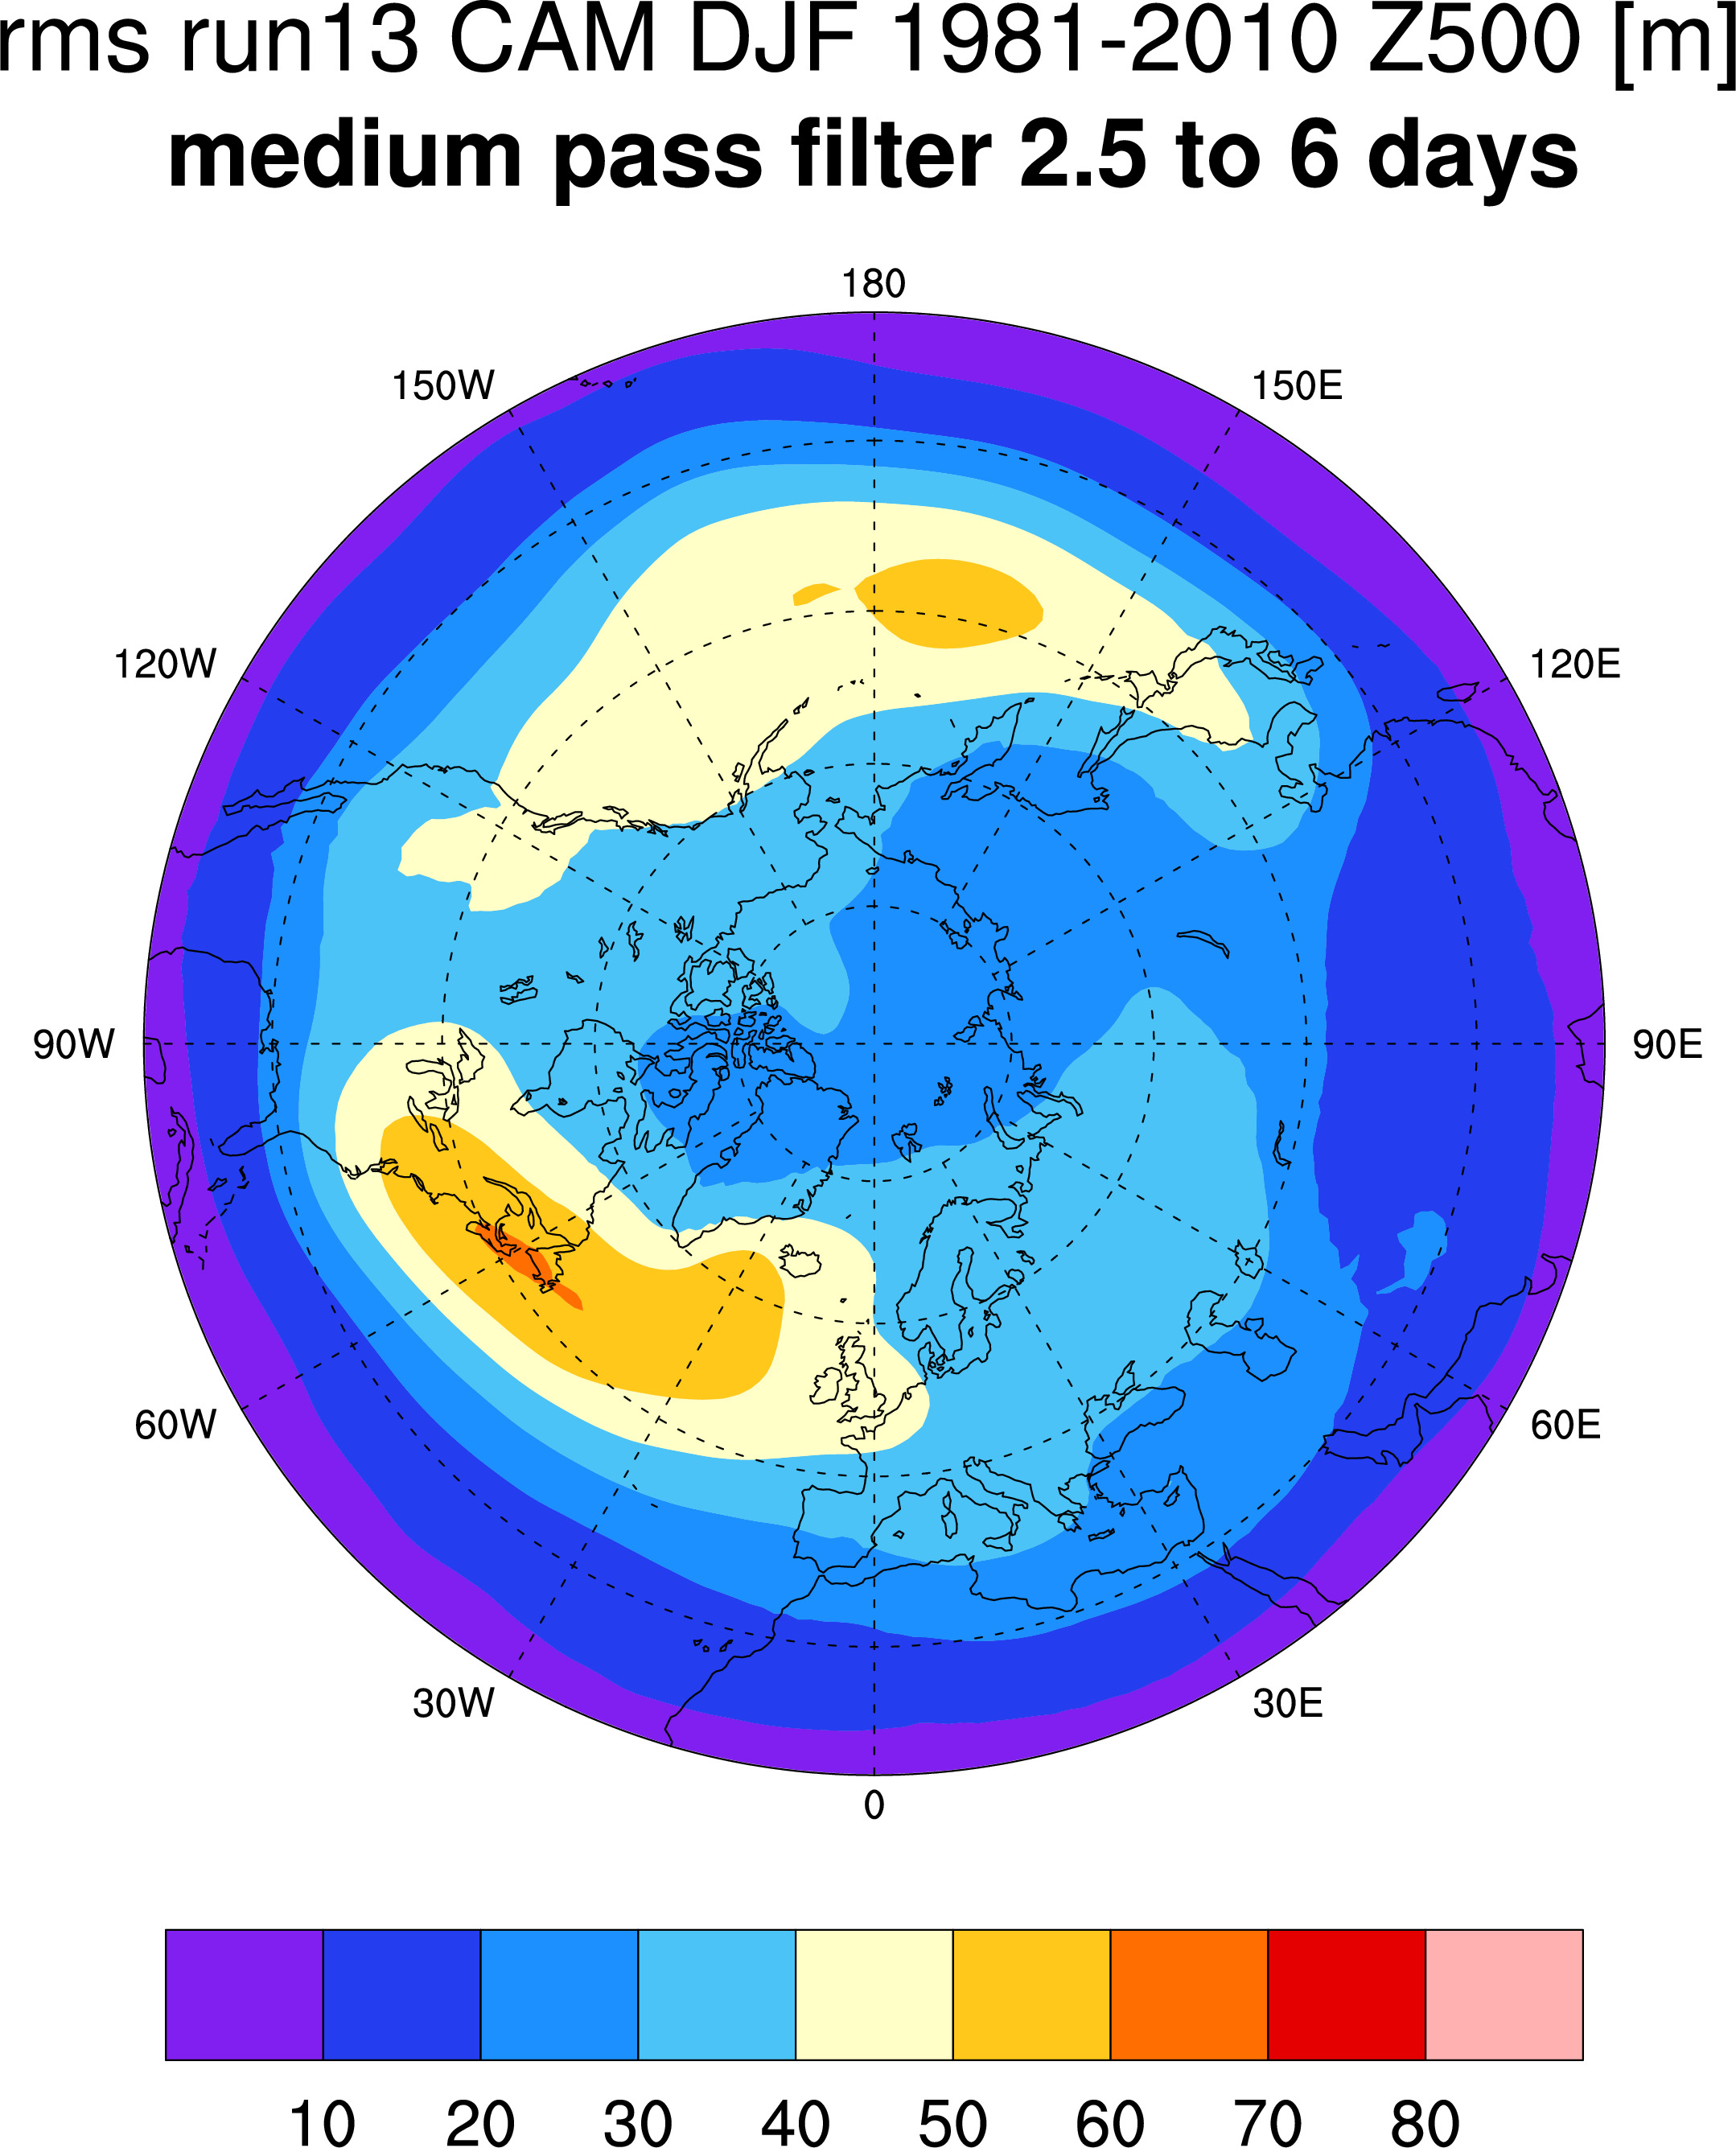
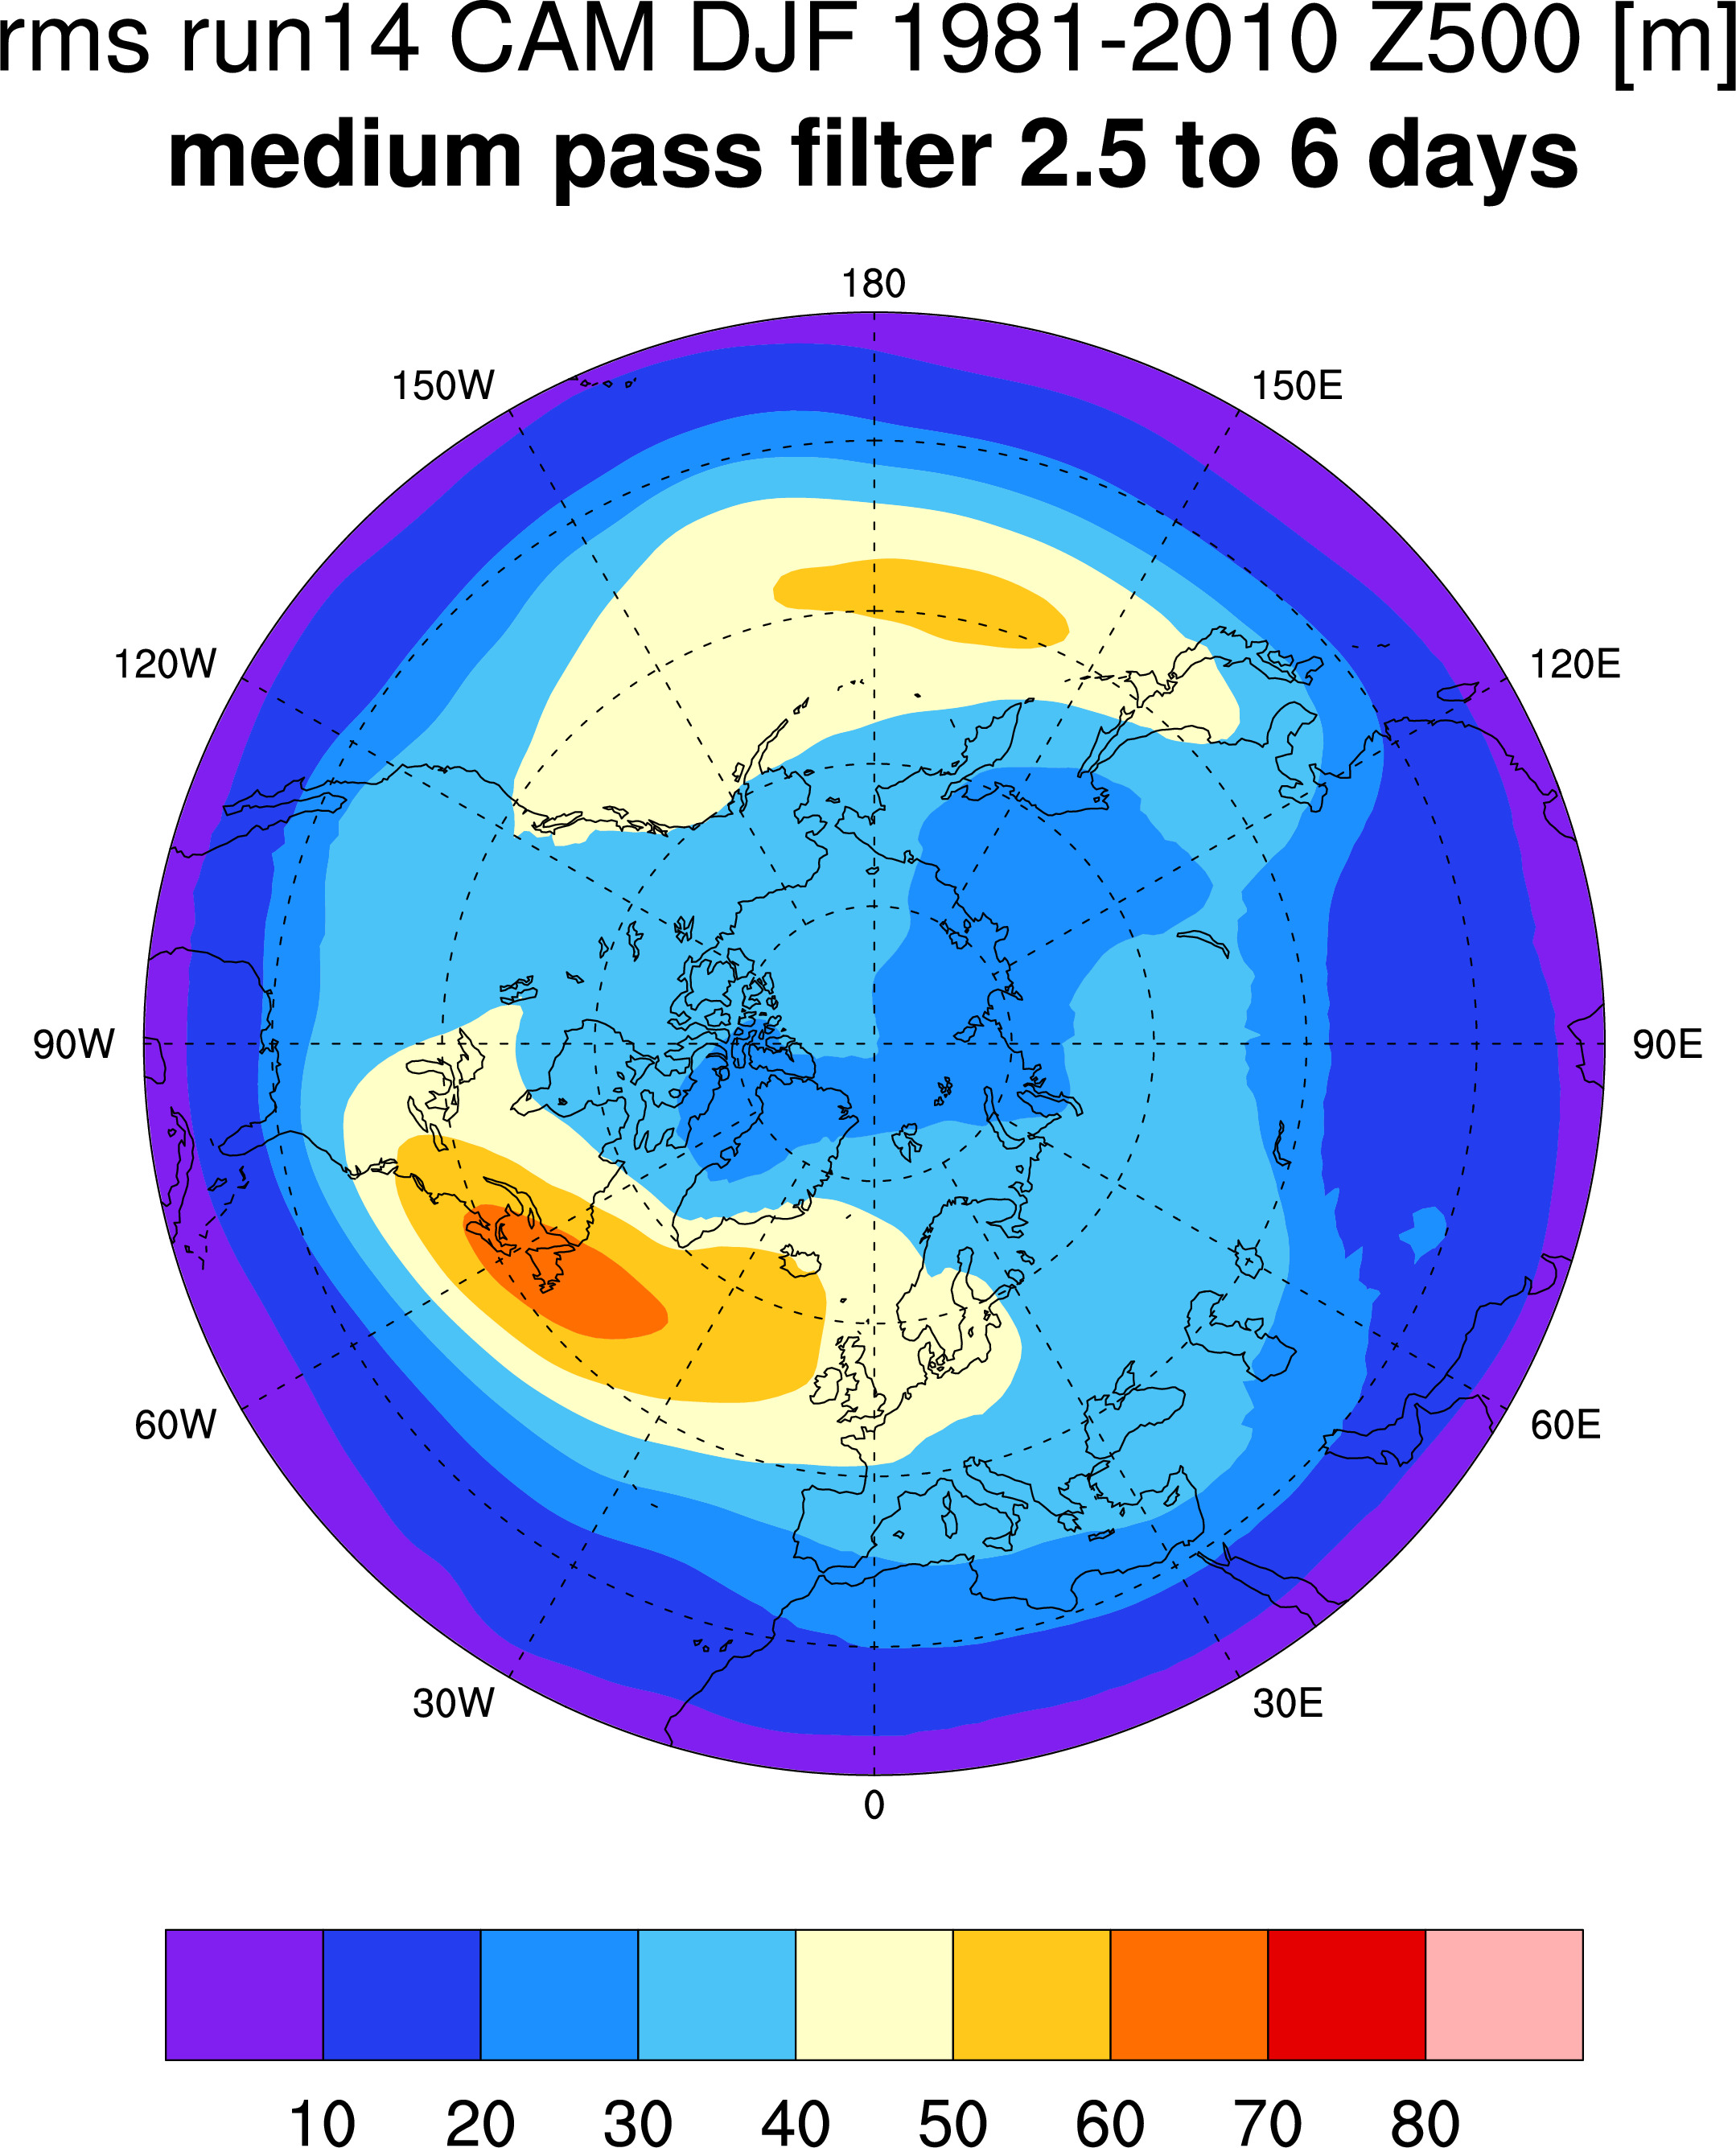
2.5 to 6-day filtered data polar stereographic plots
Reanalyses:
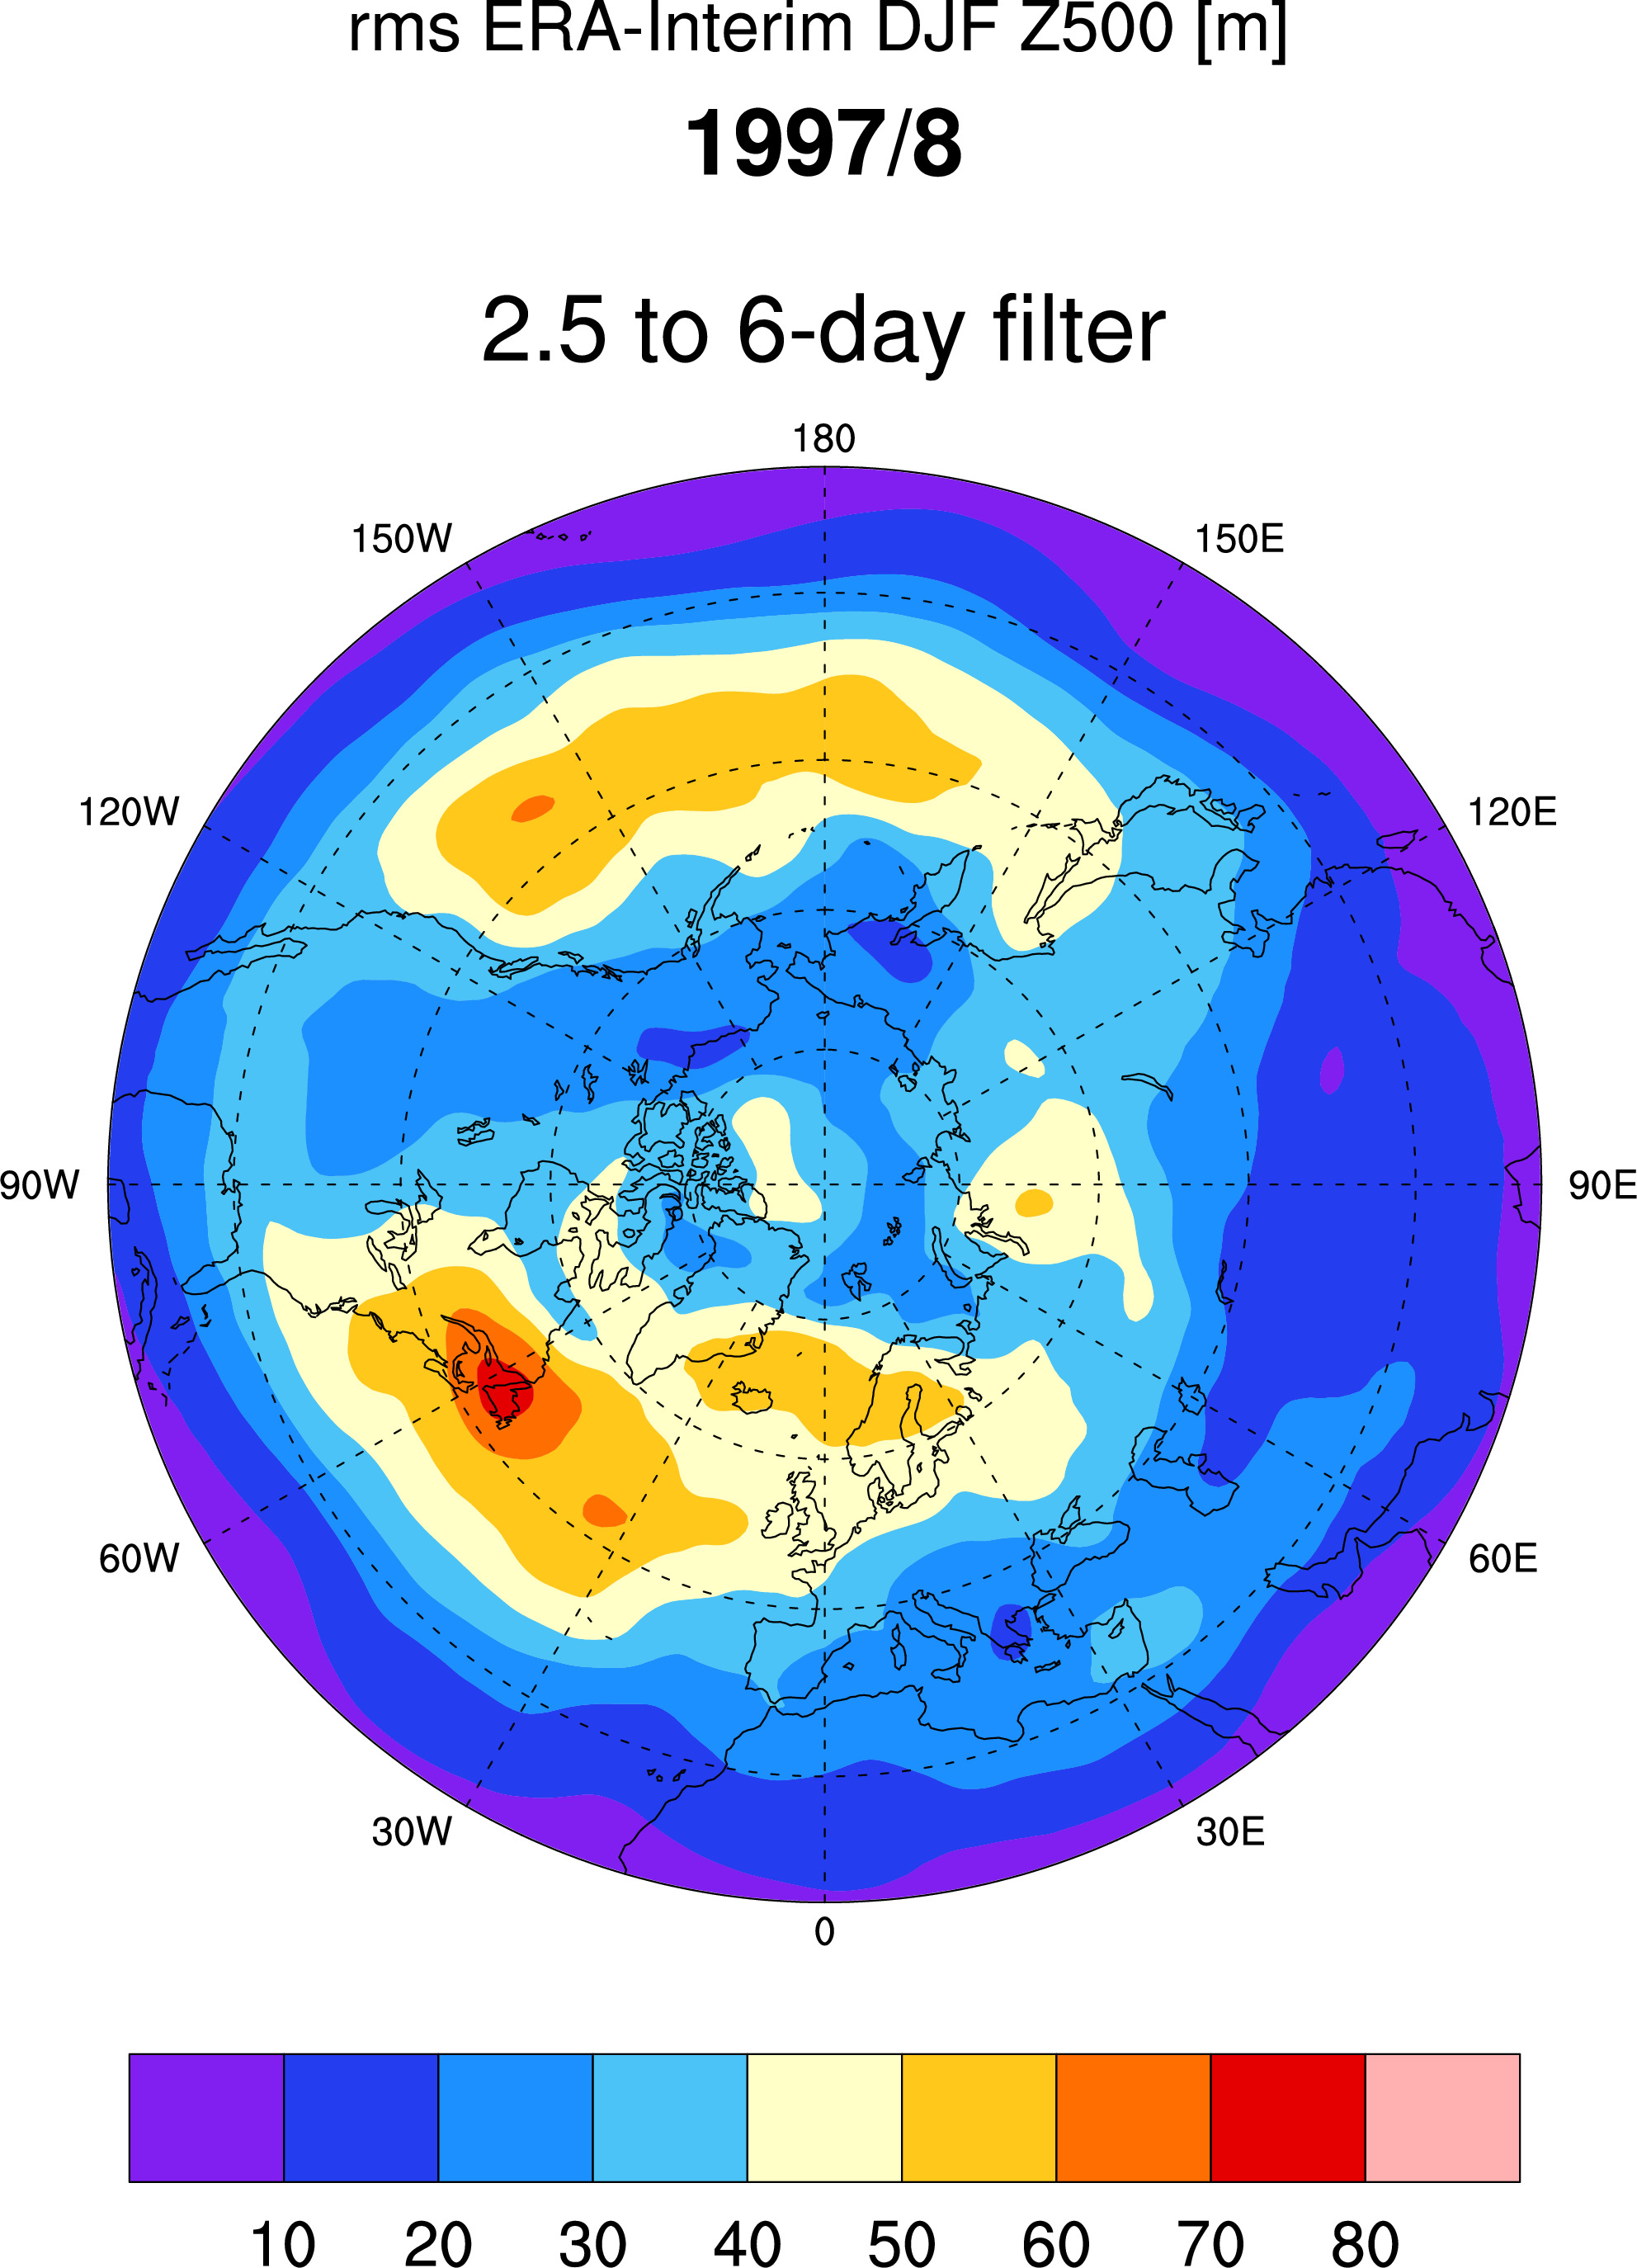
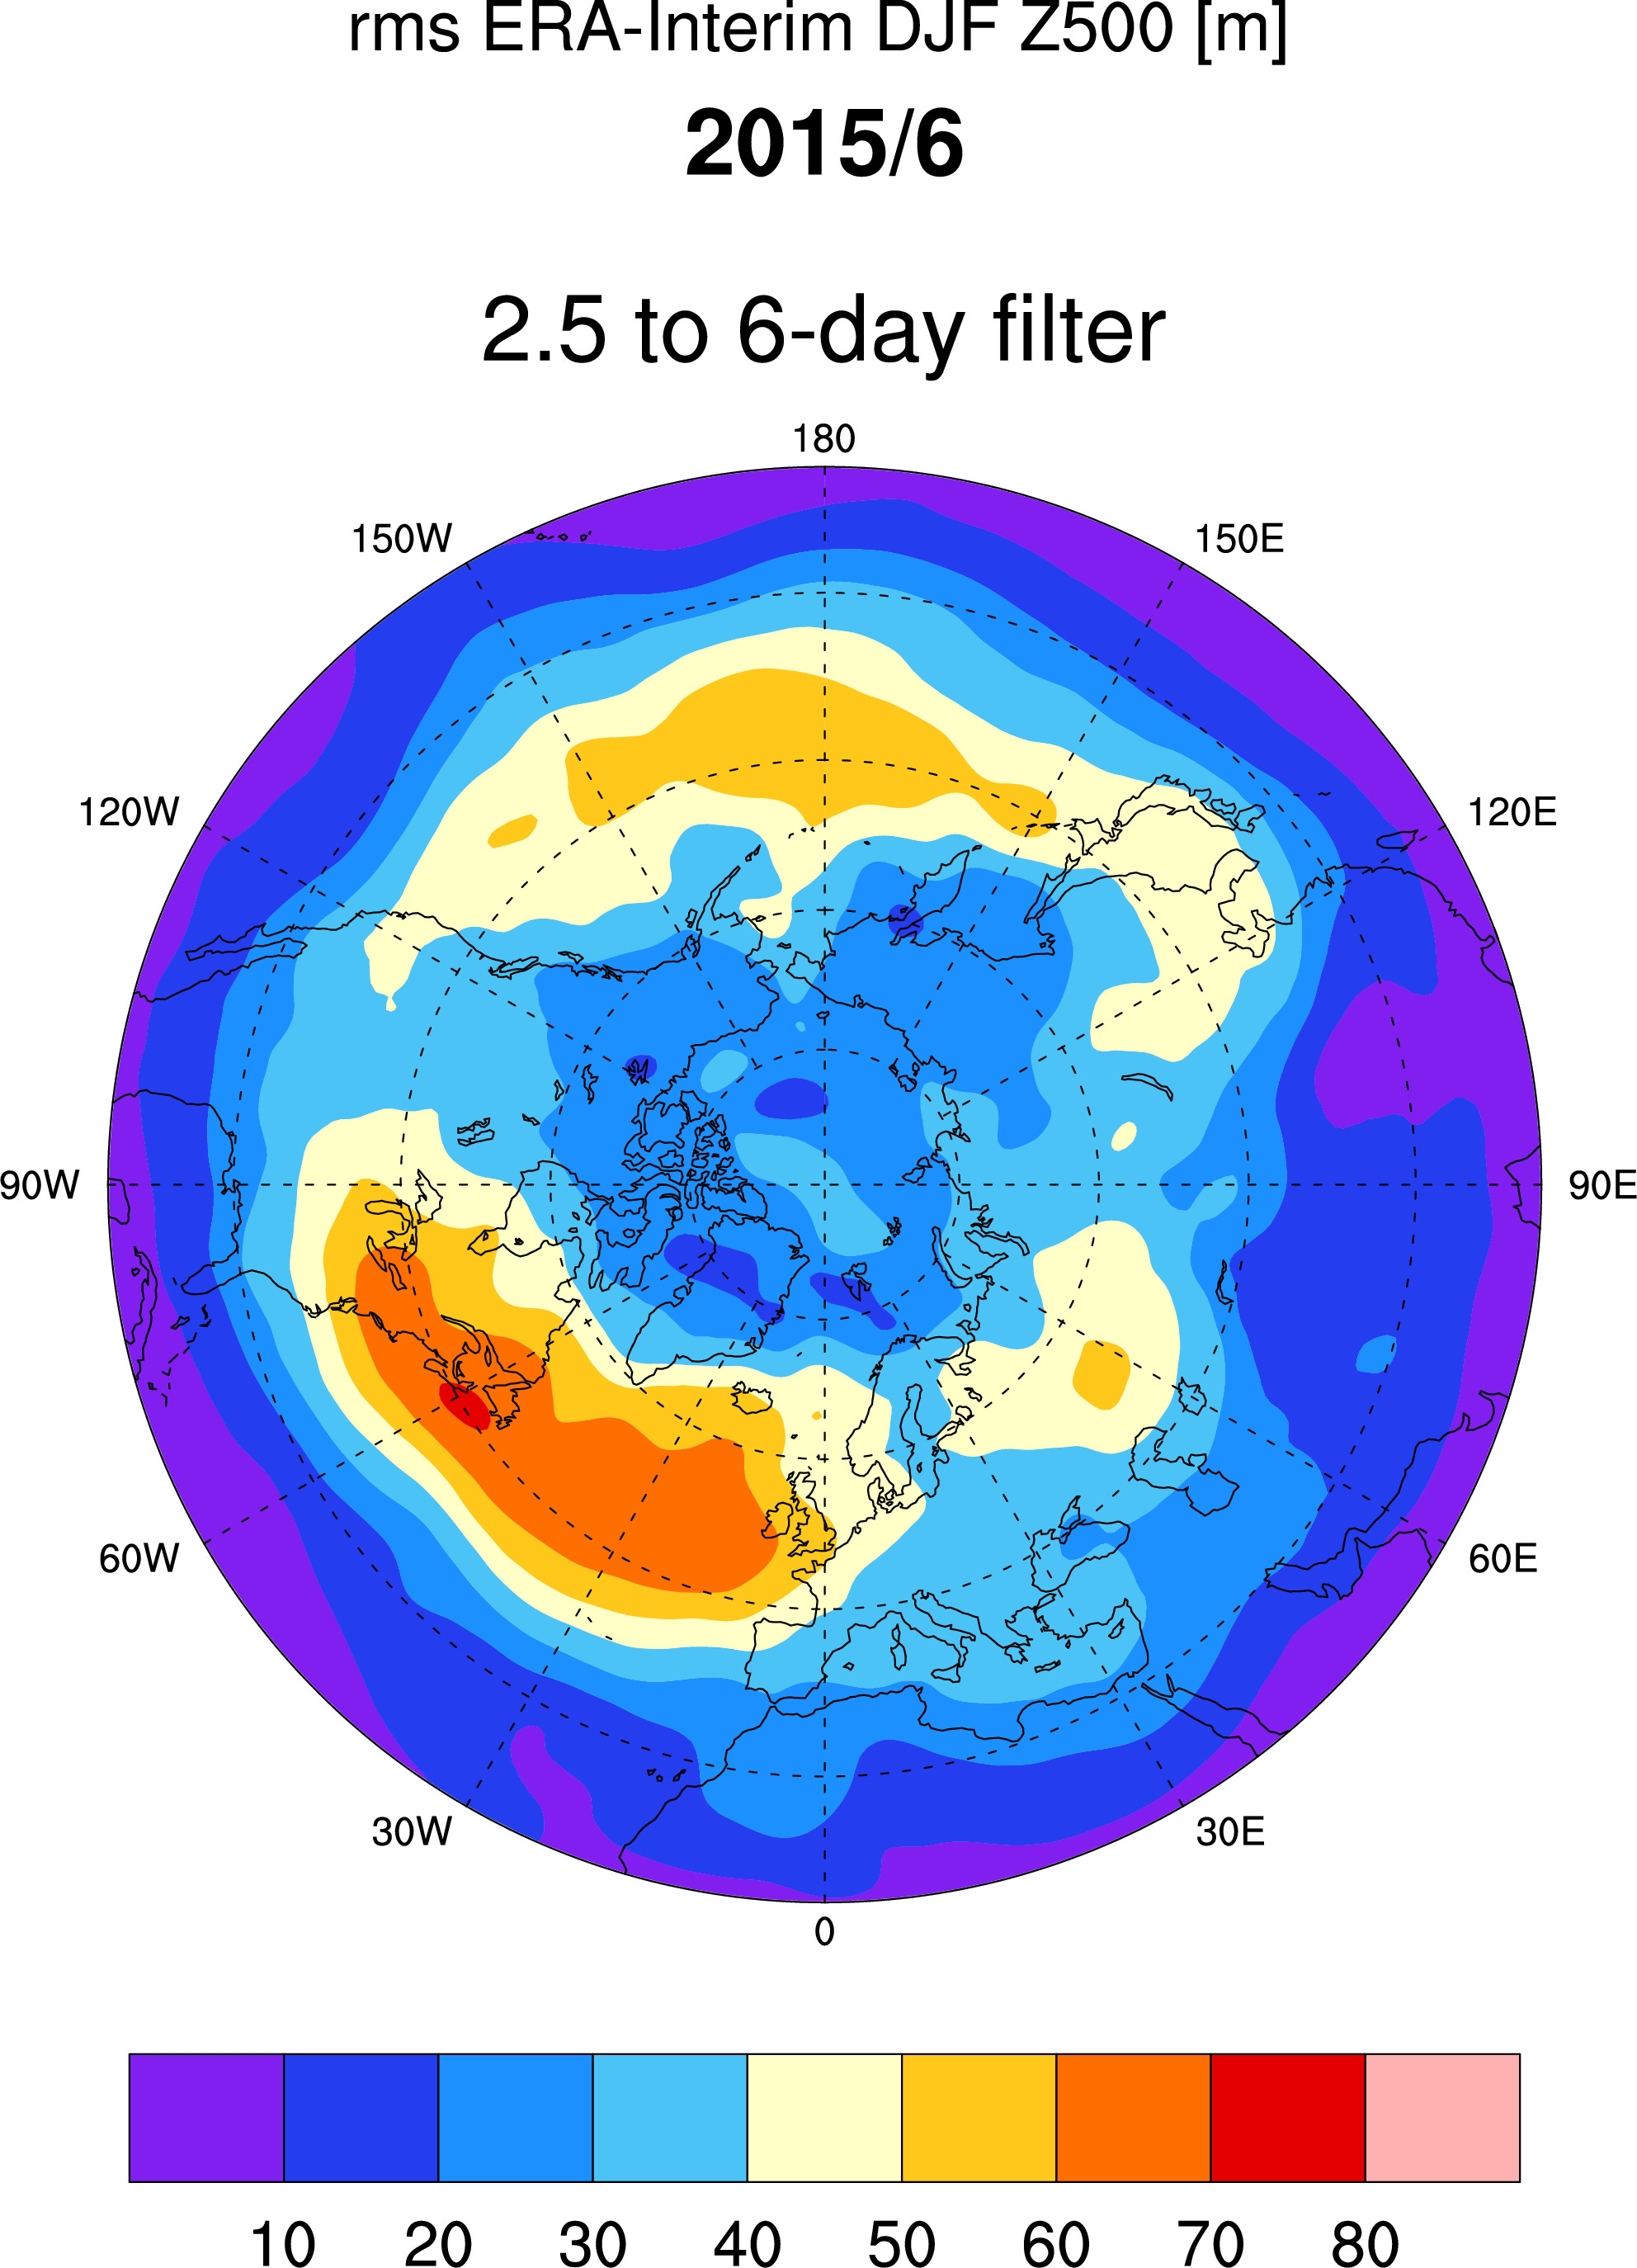
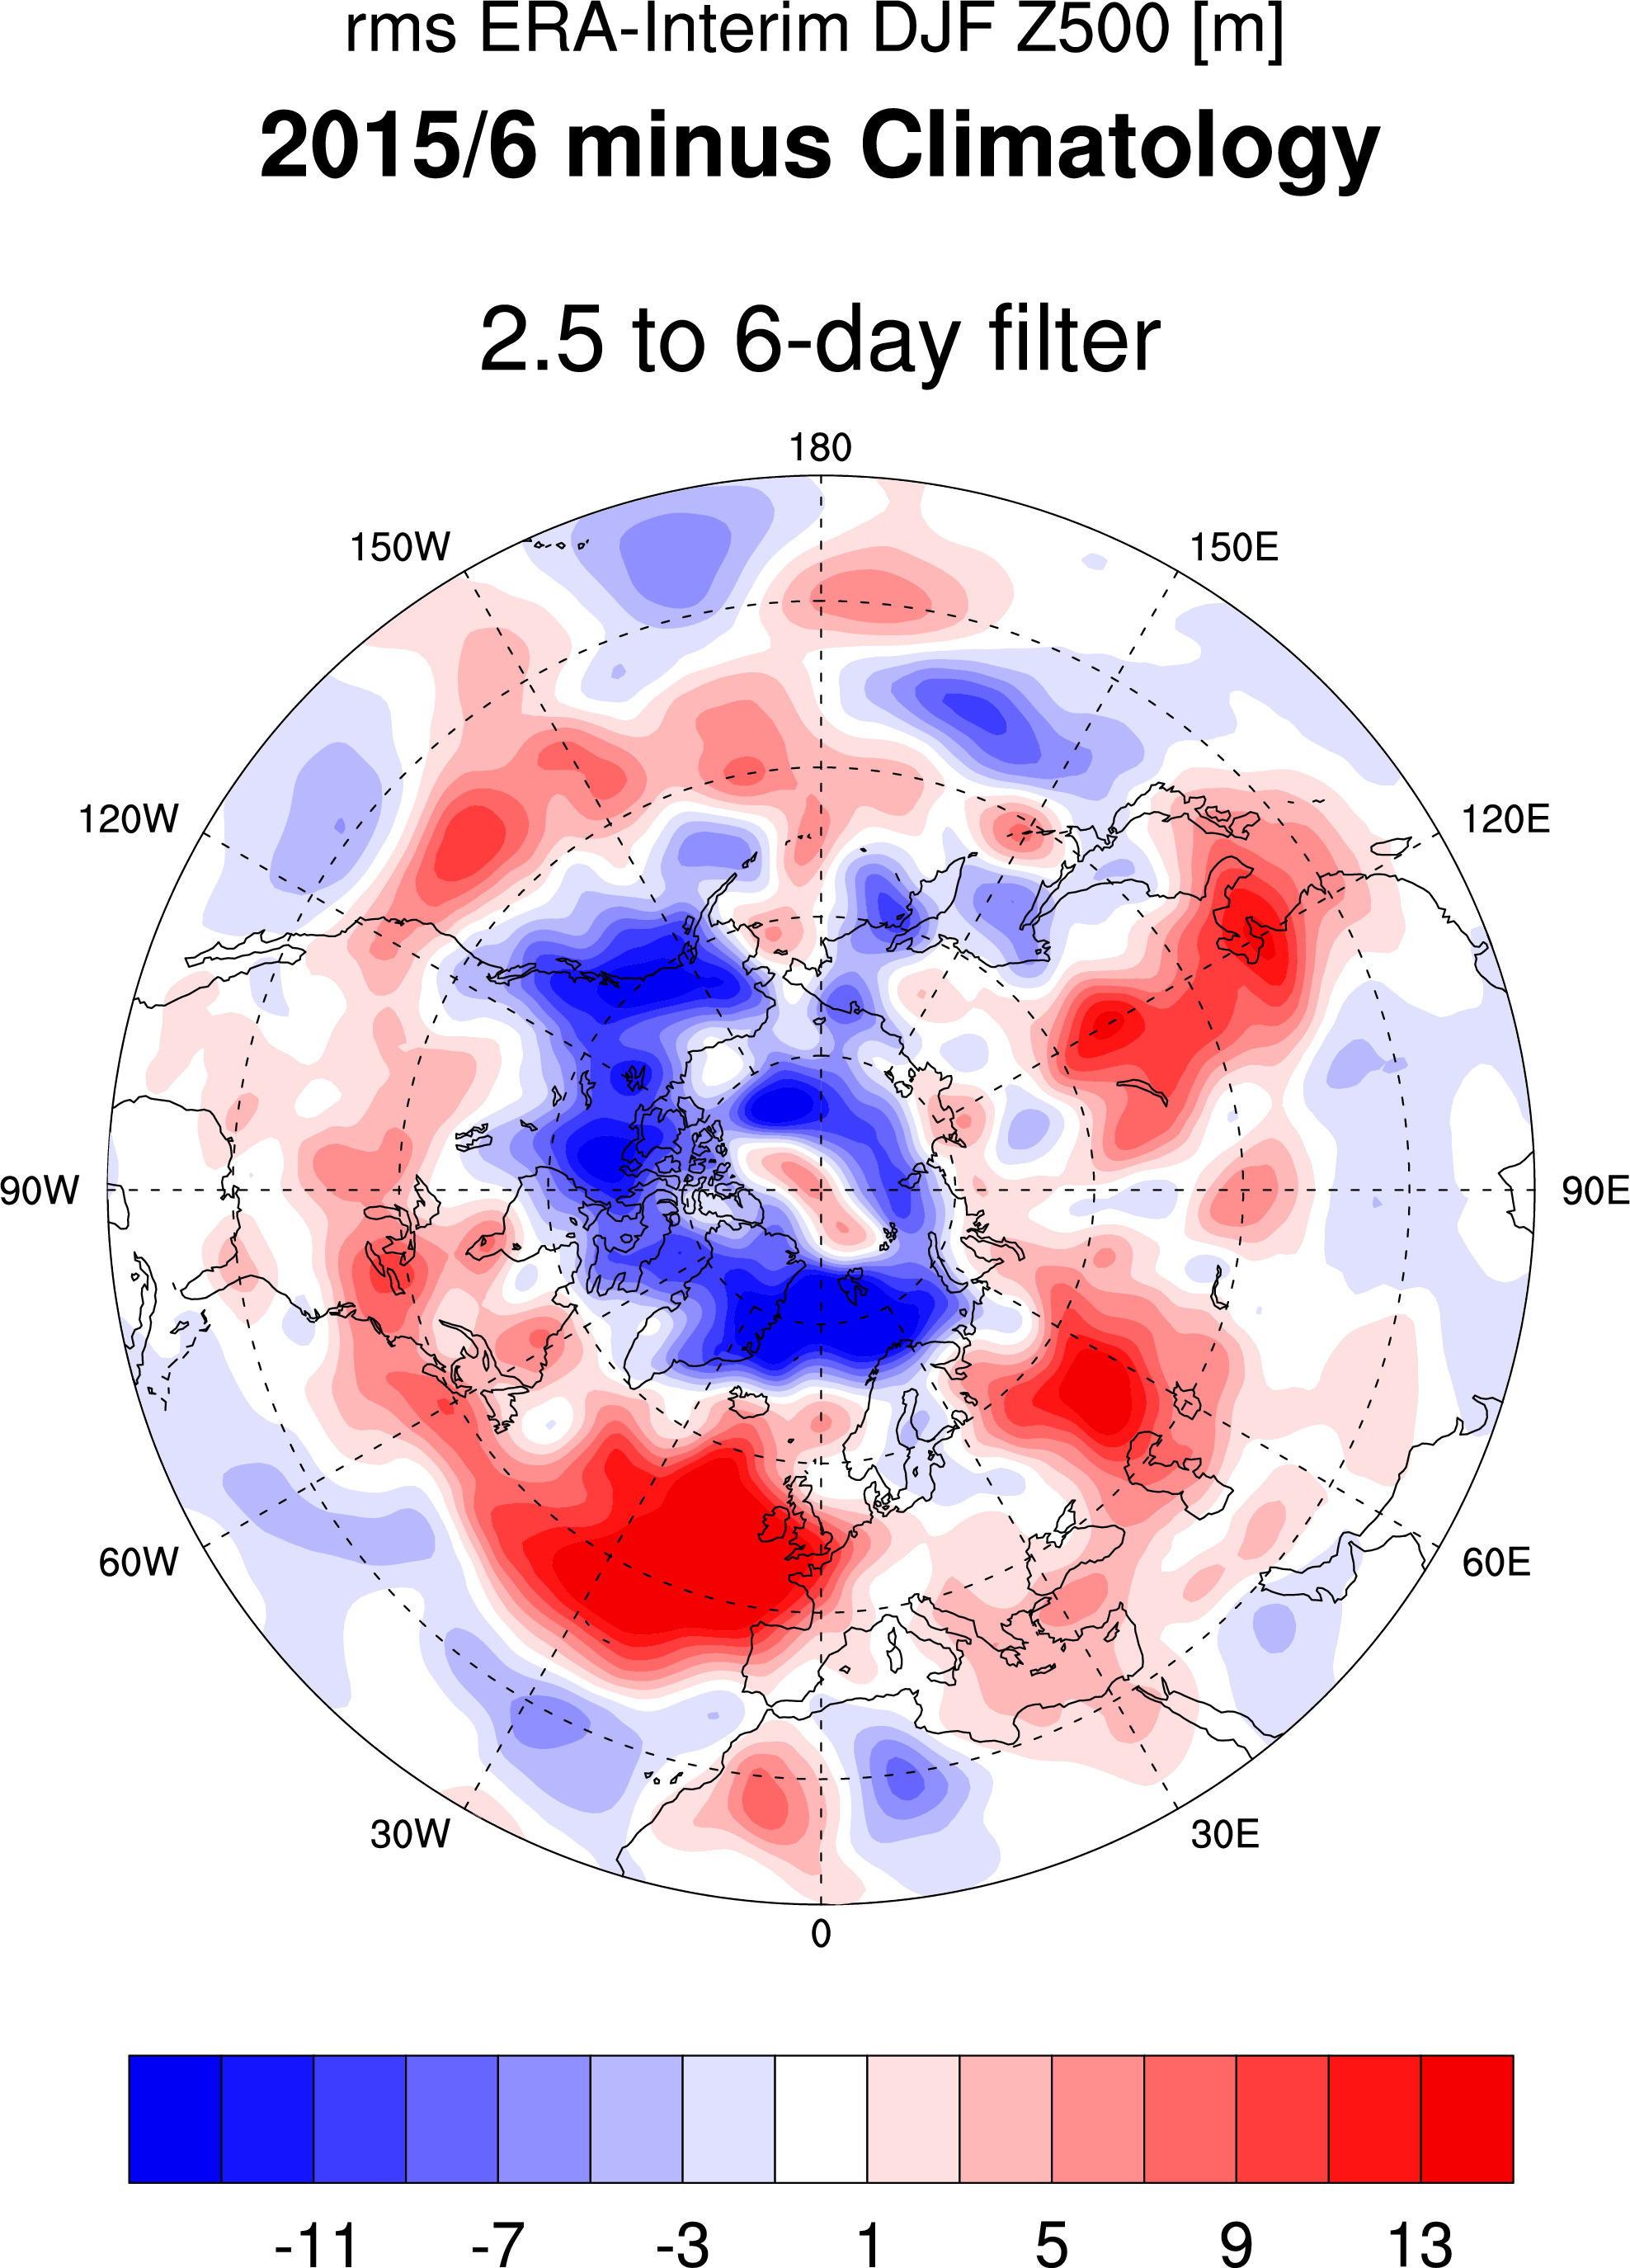
ERA-Interim data:

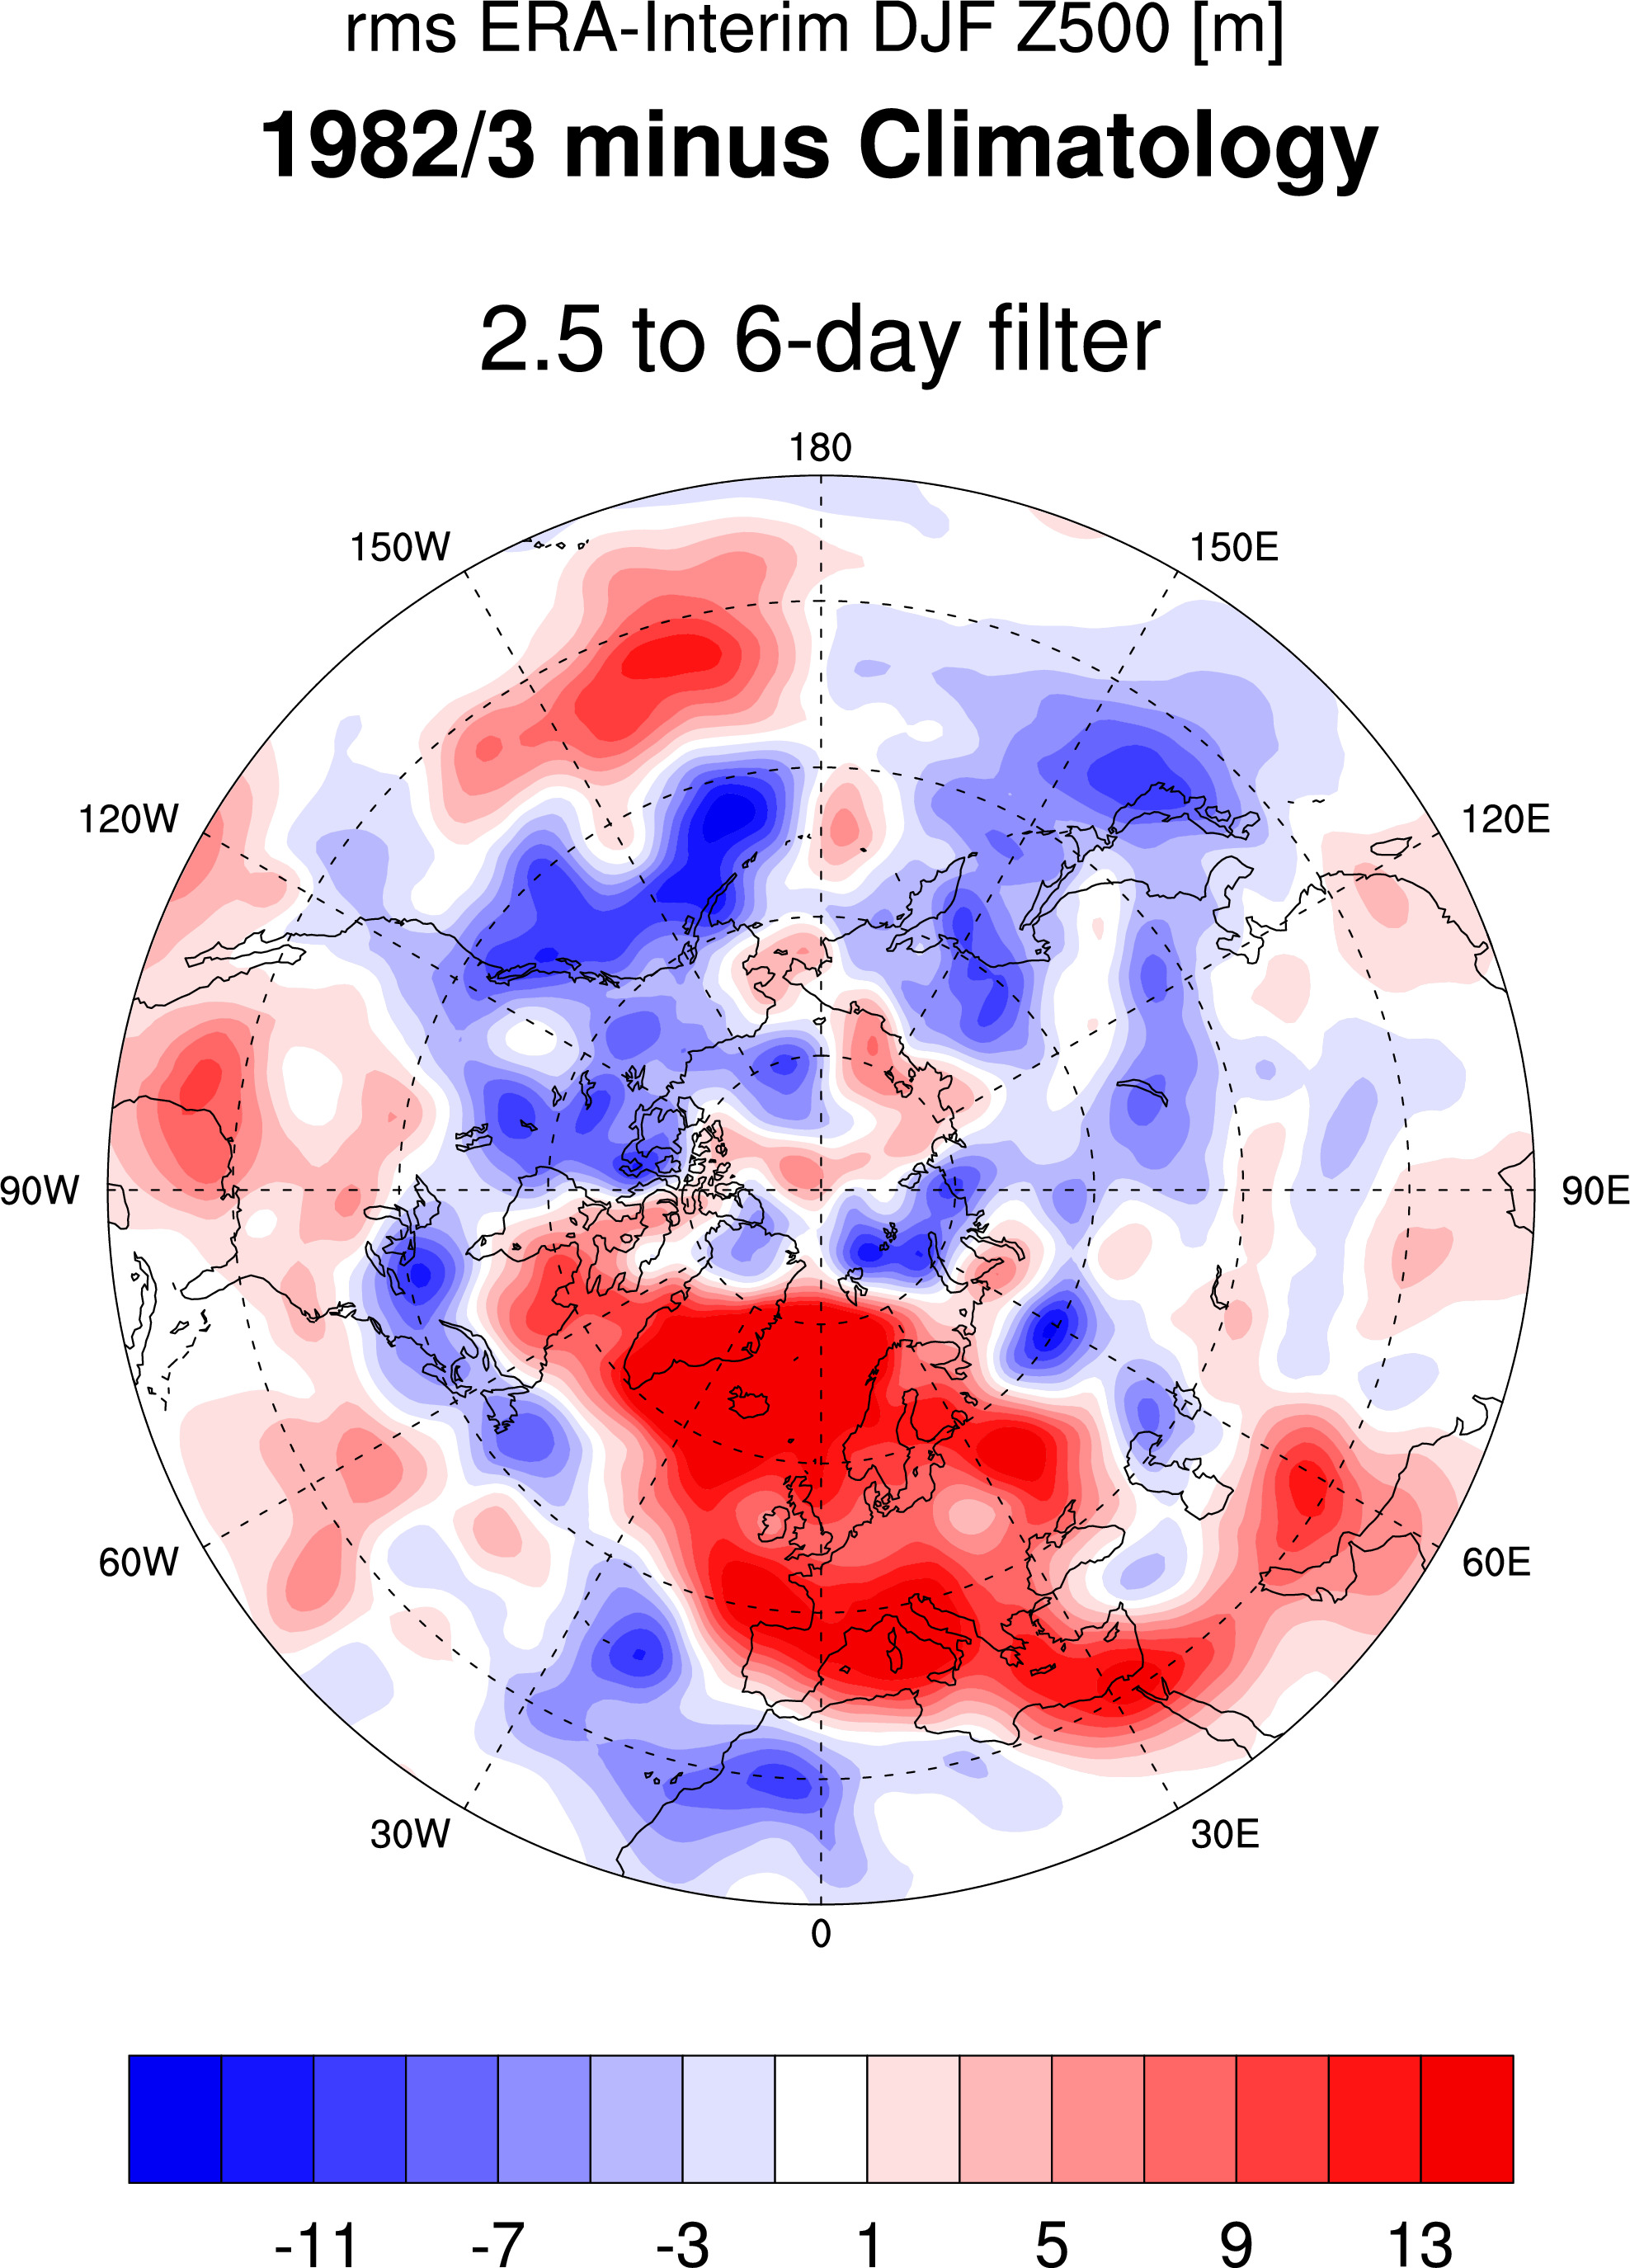
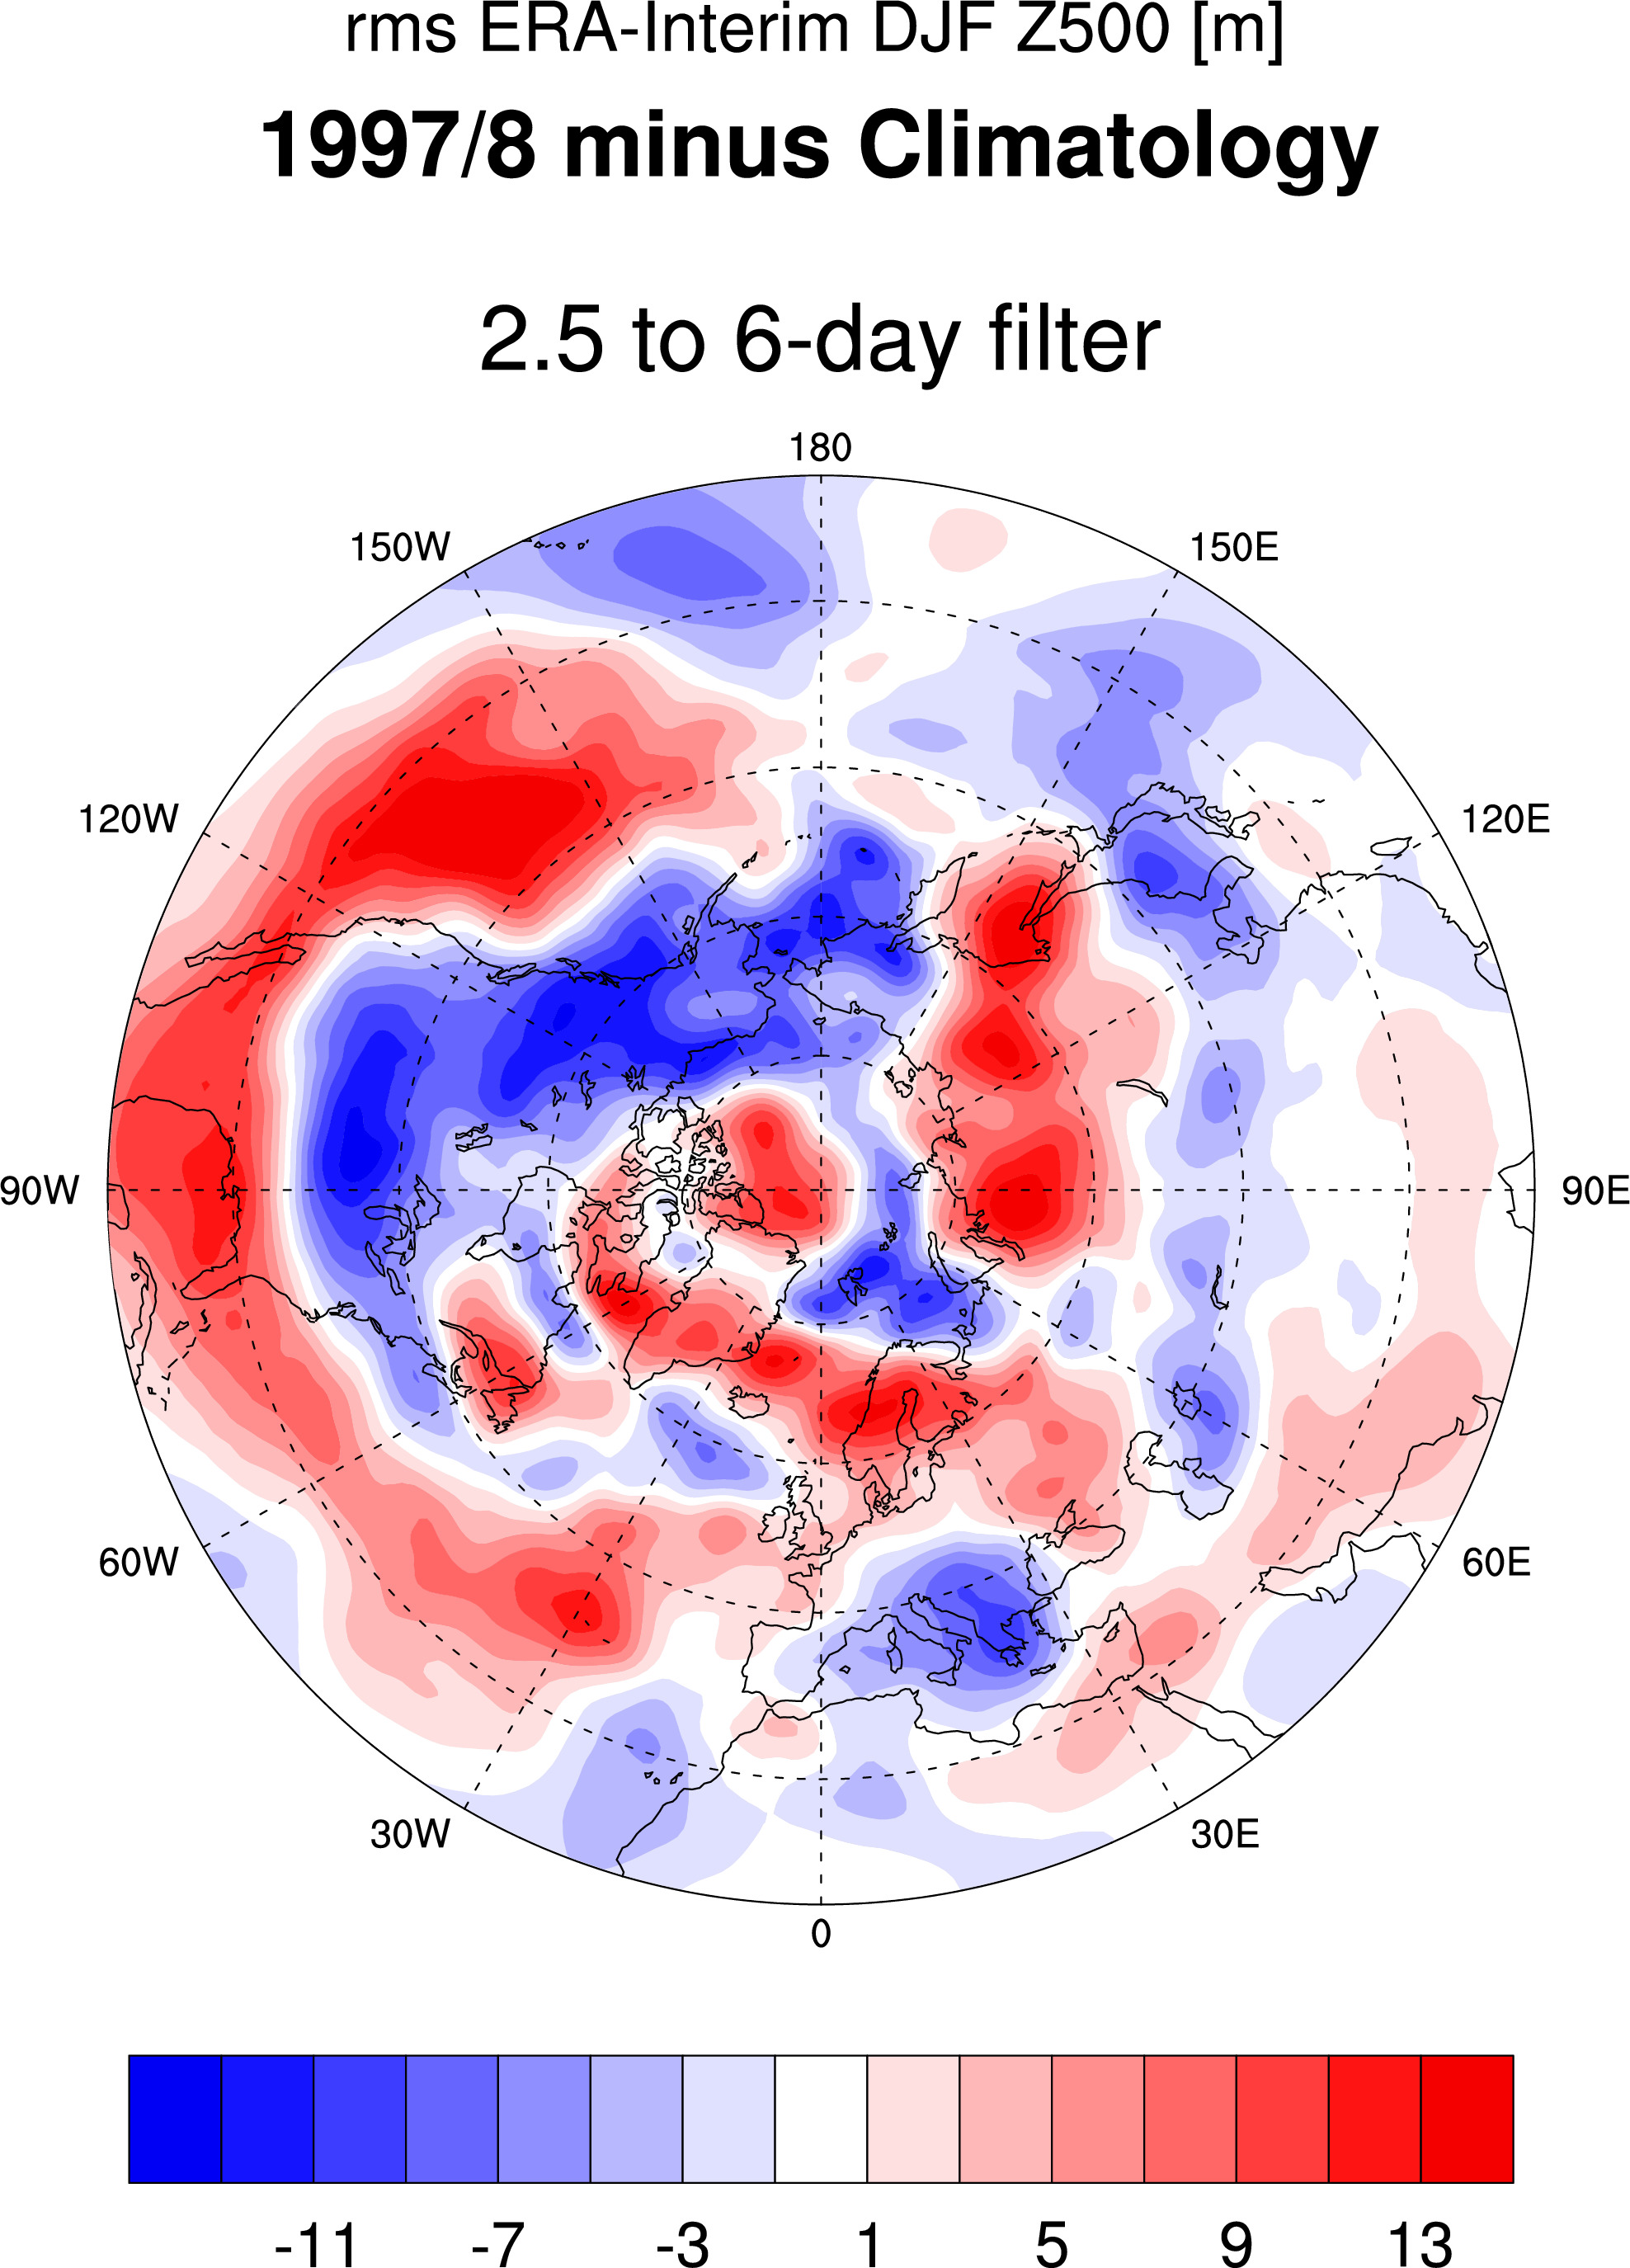
ERA-Interim differences:
-----------------------------------------------------------------------------------------------------------
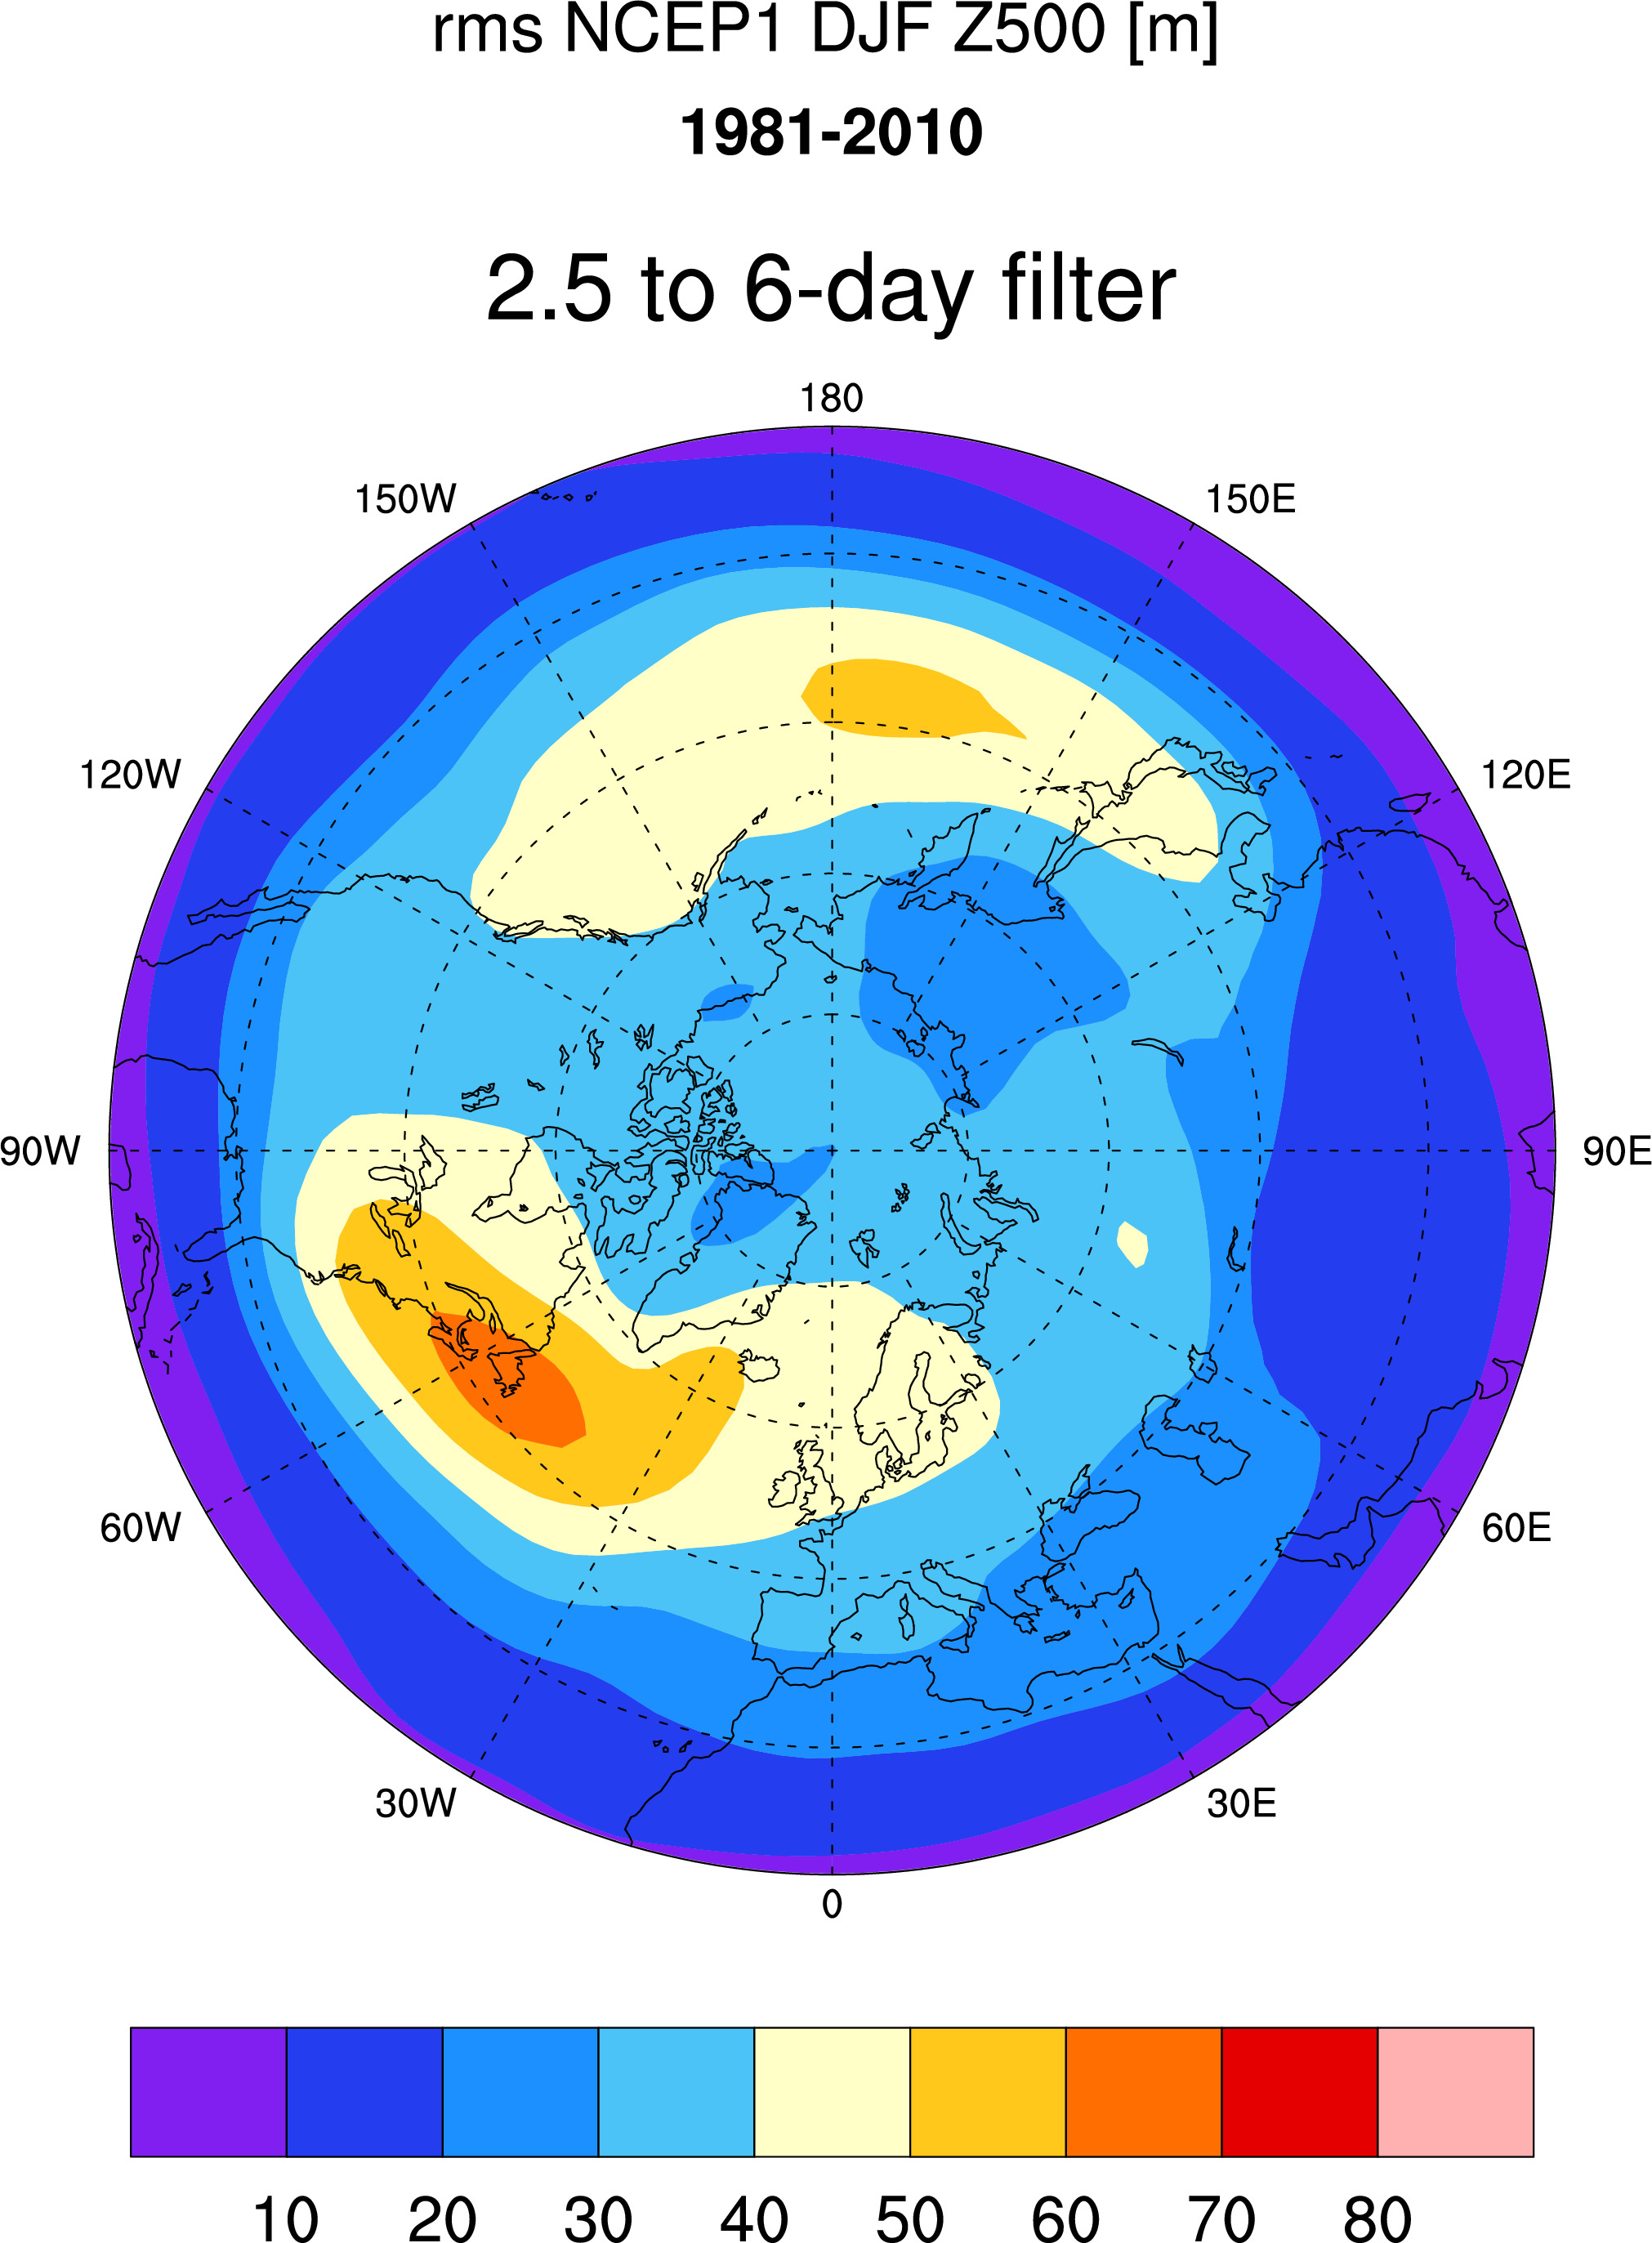
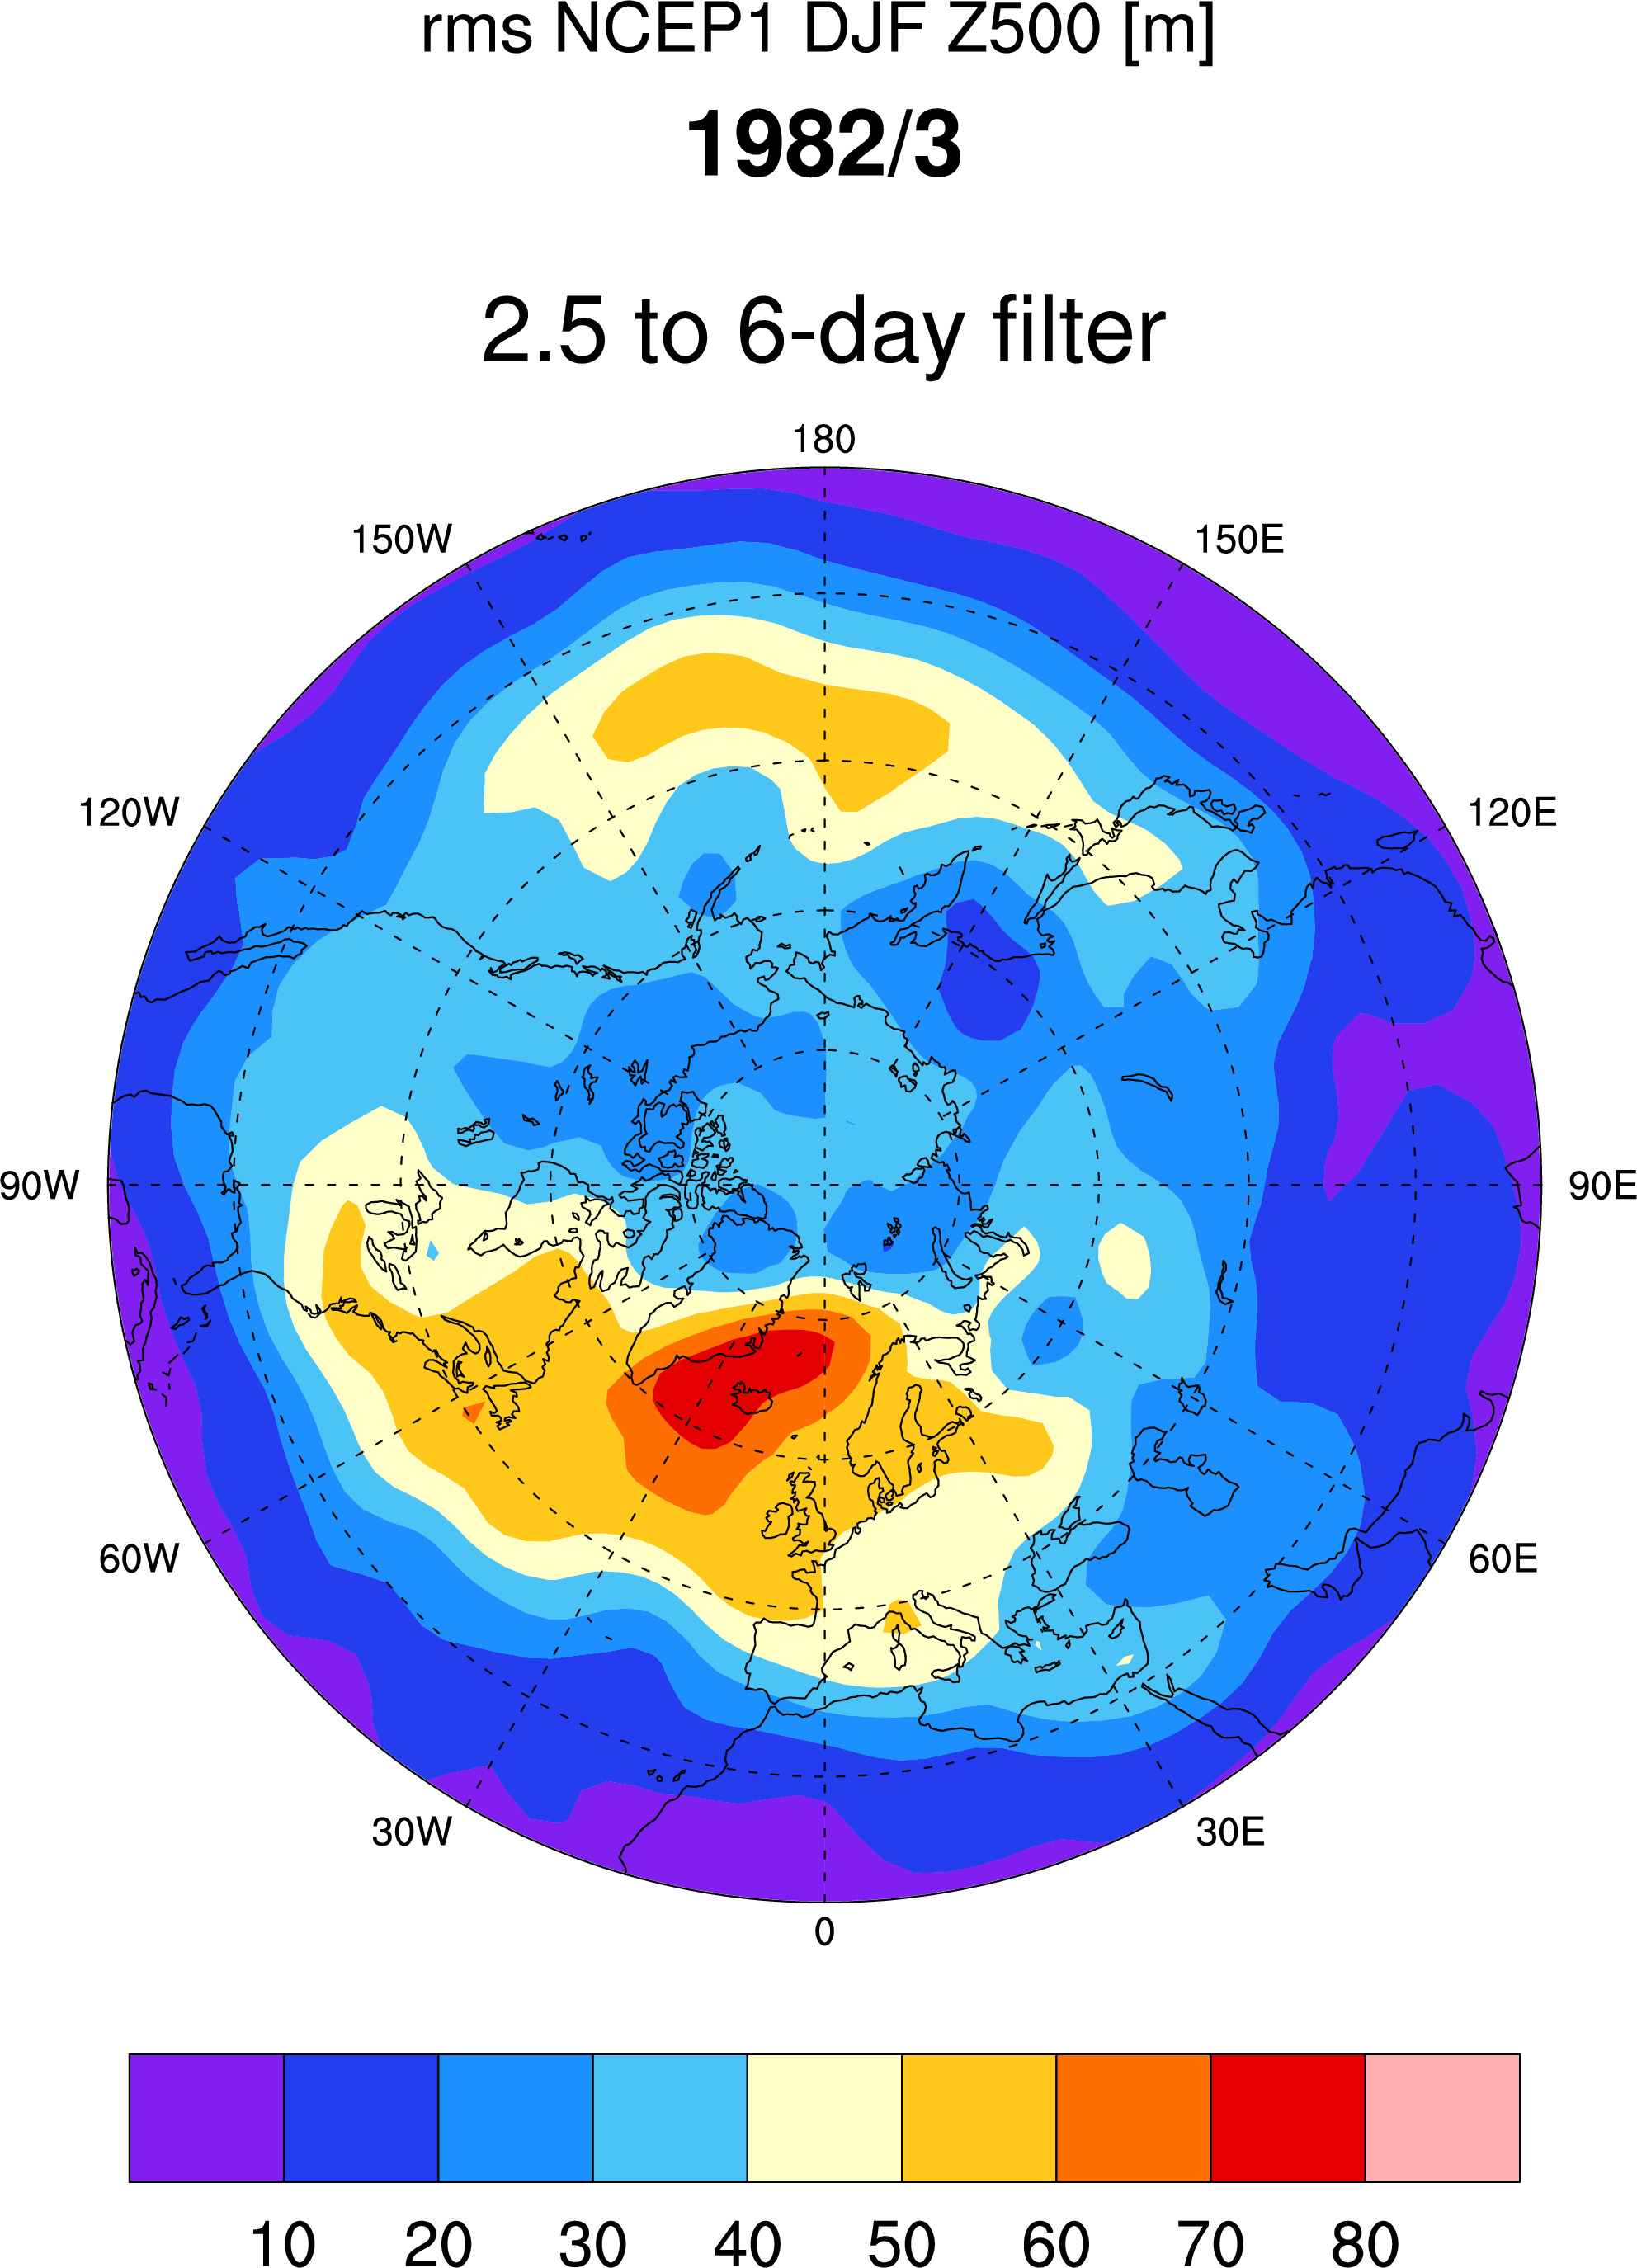
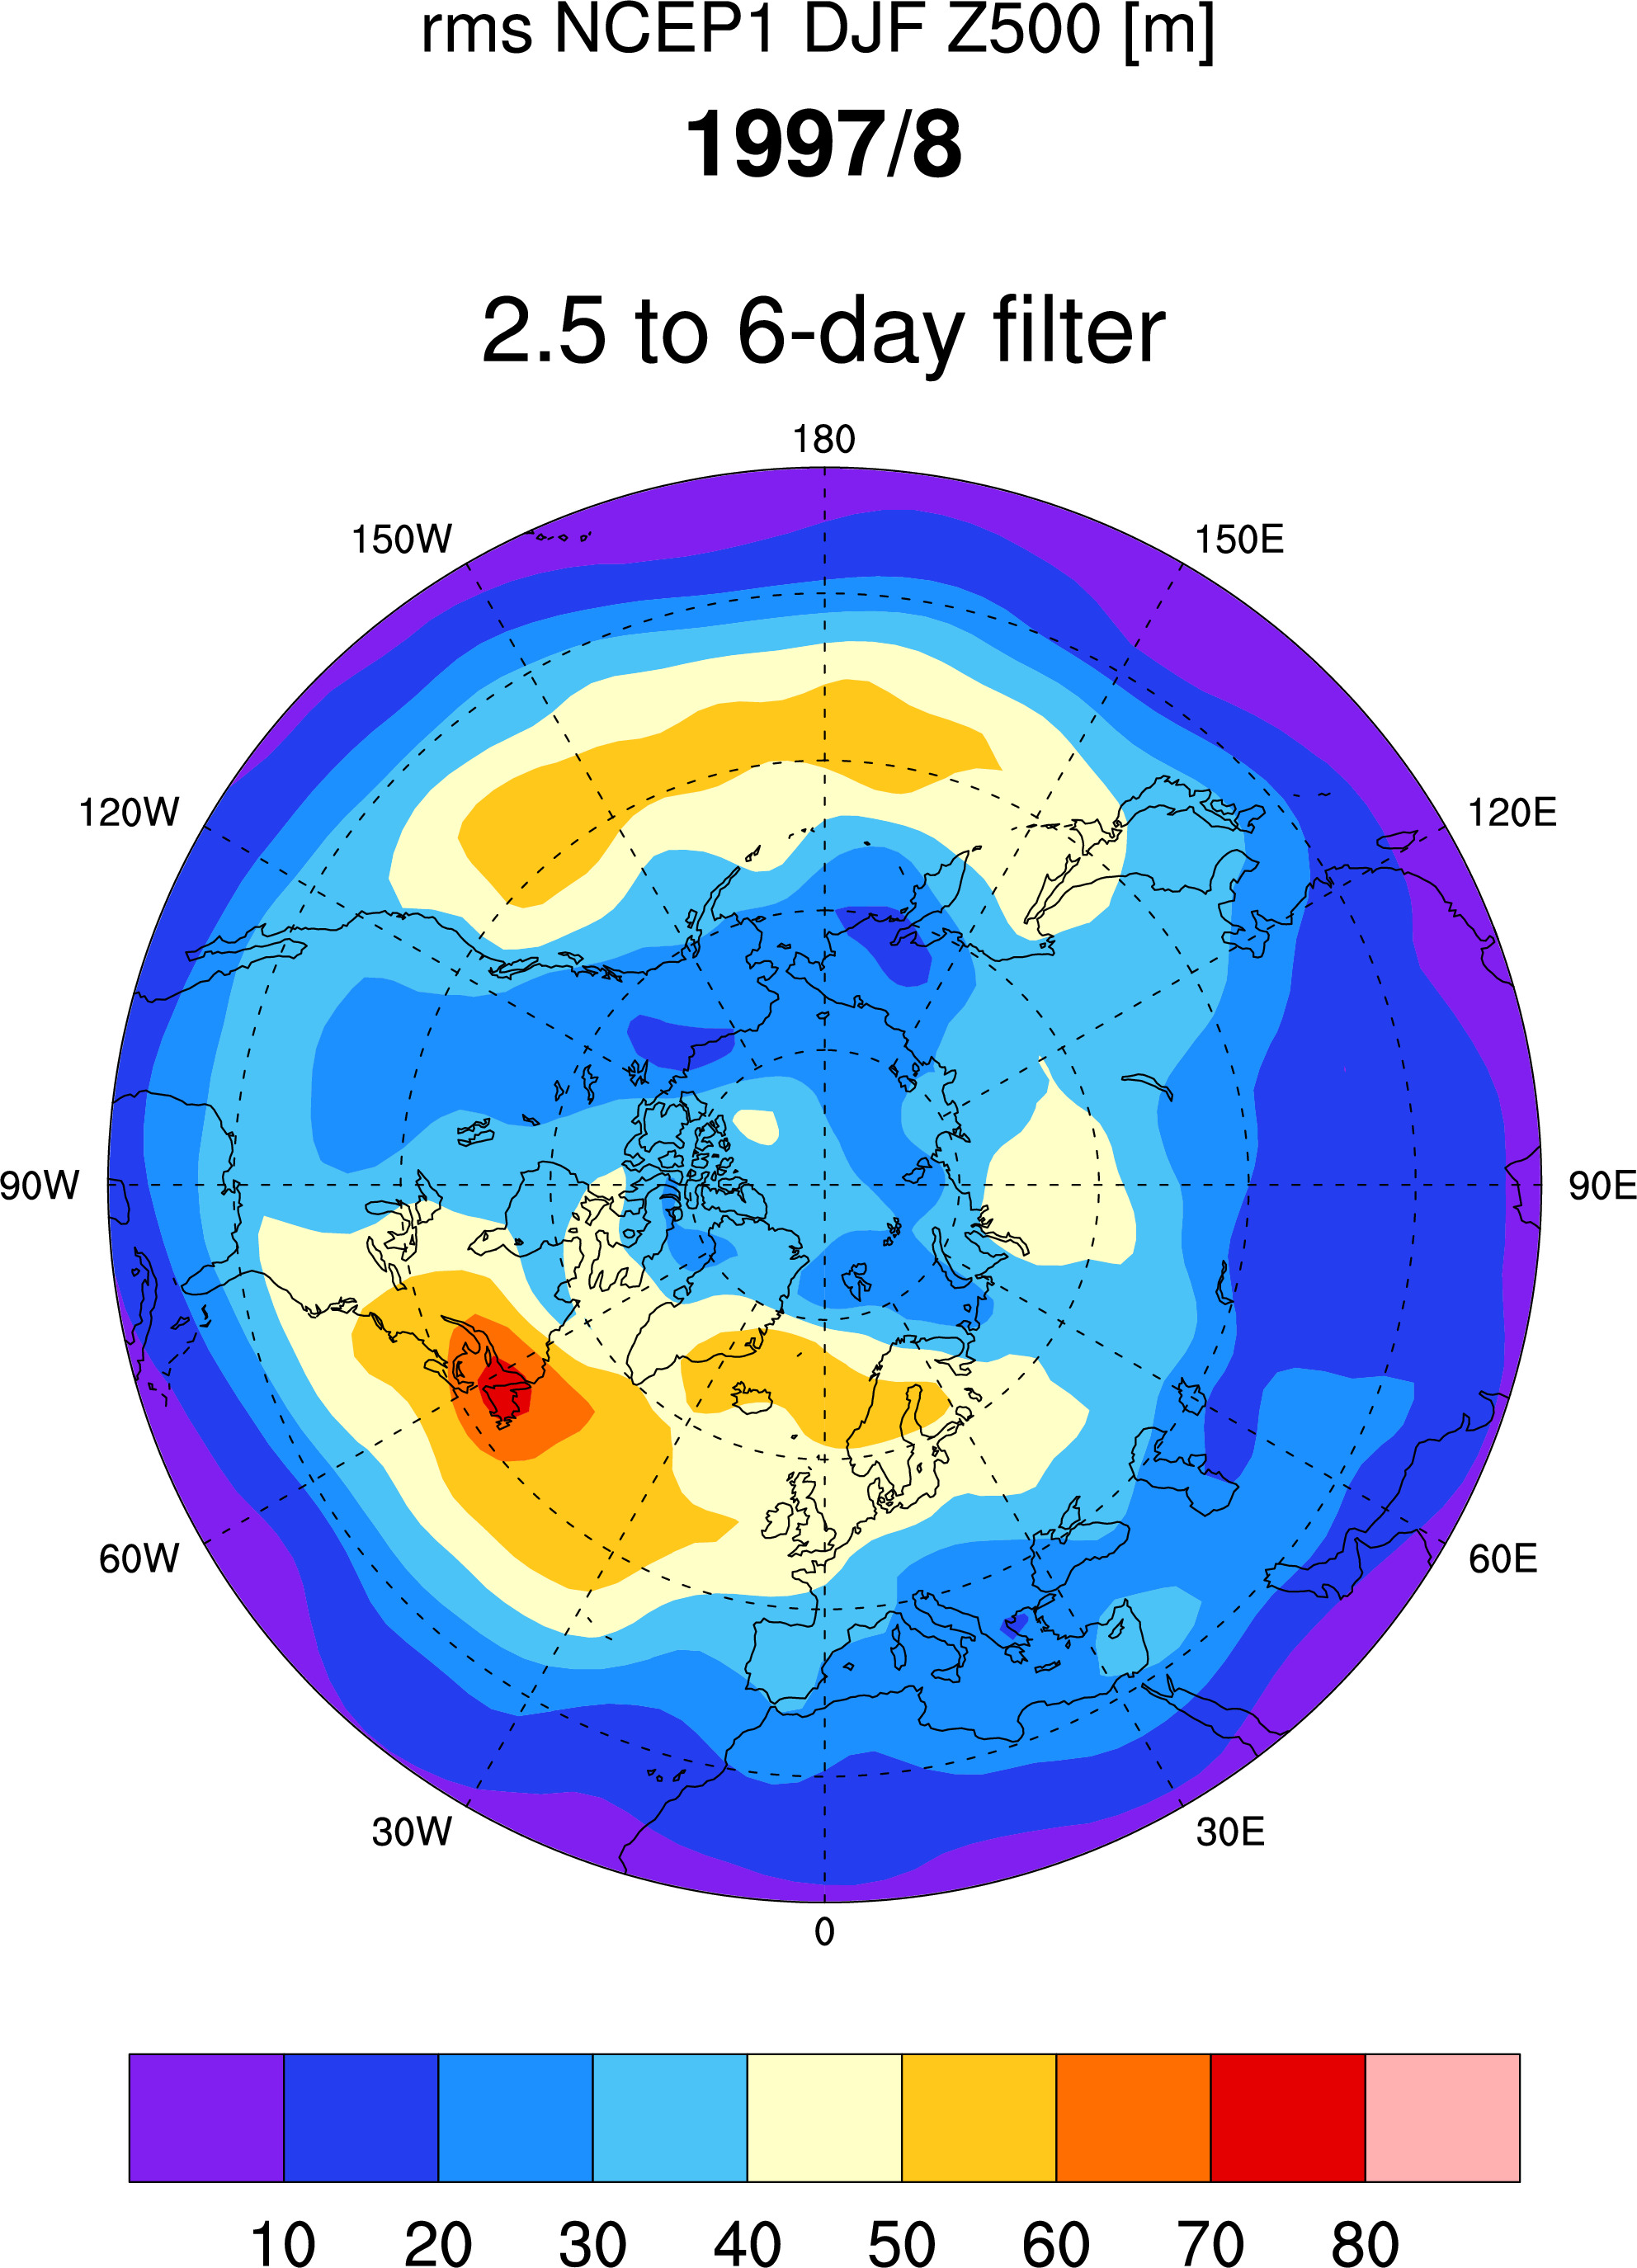
NCEP1 data:
NCEP differences:

=============================================================================================================
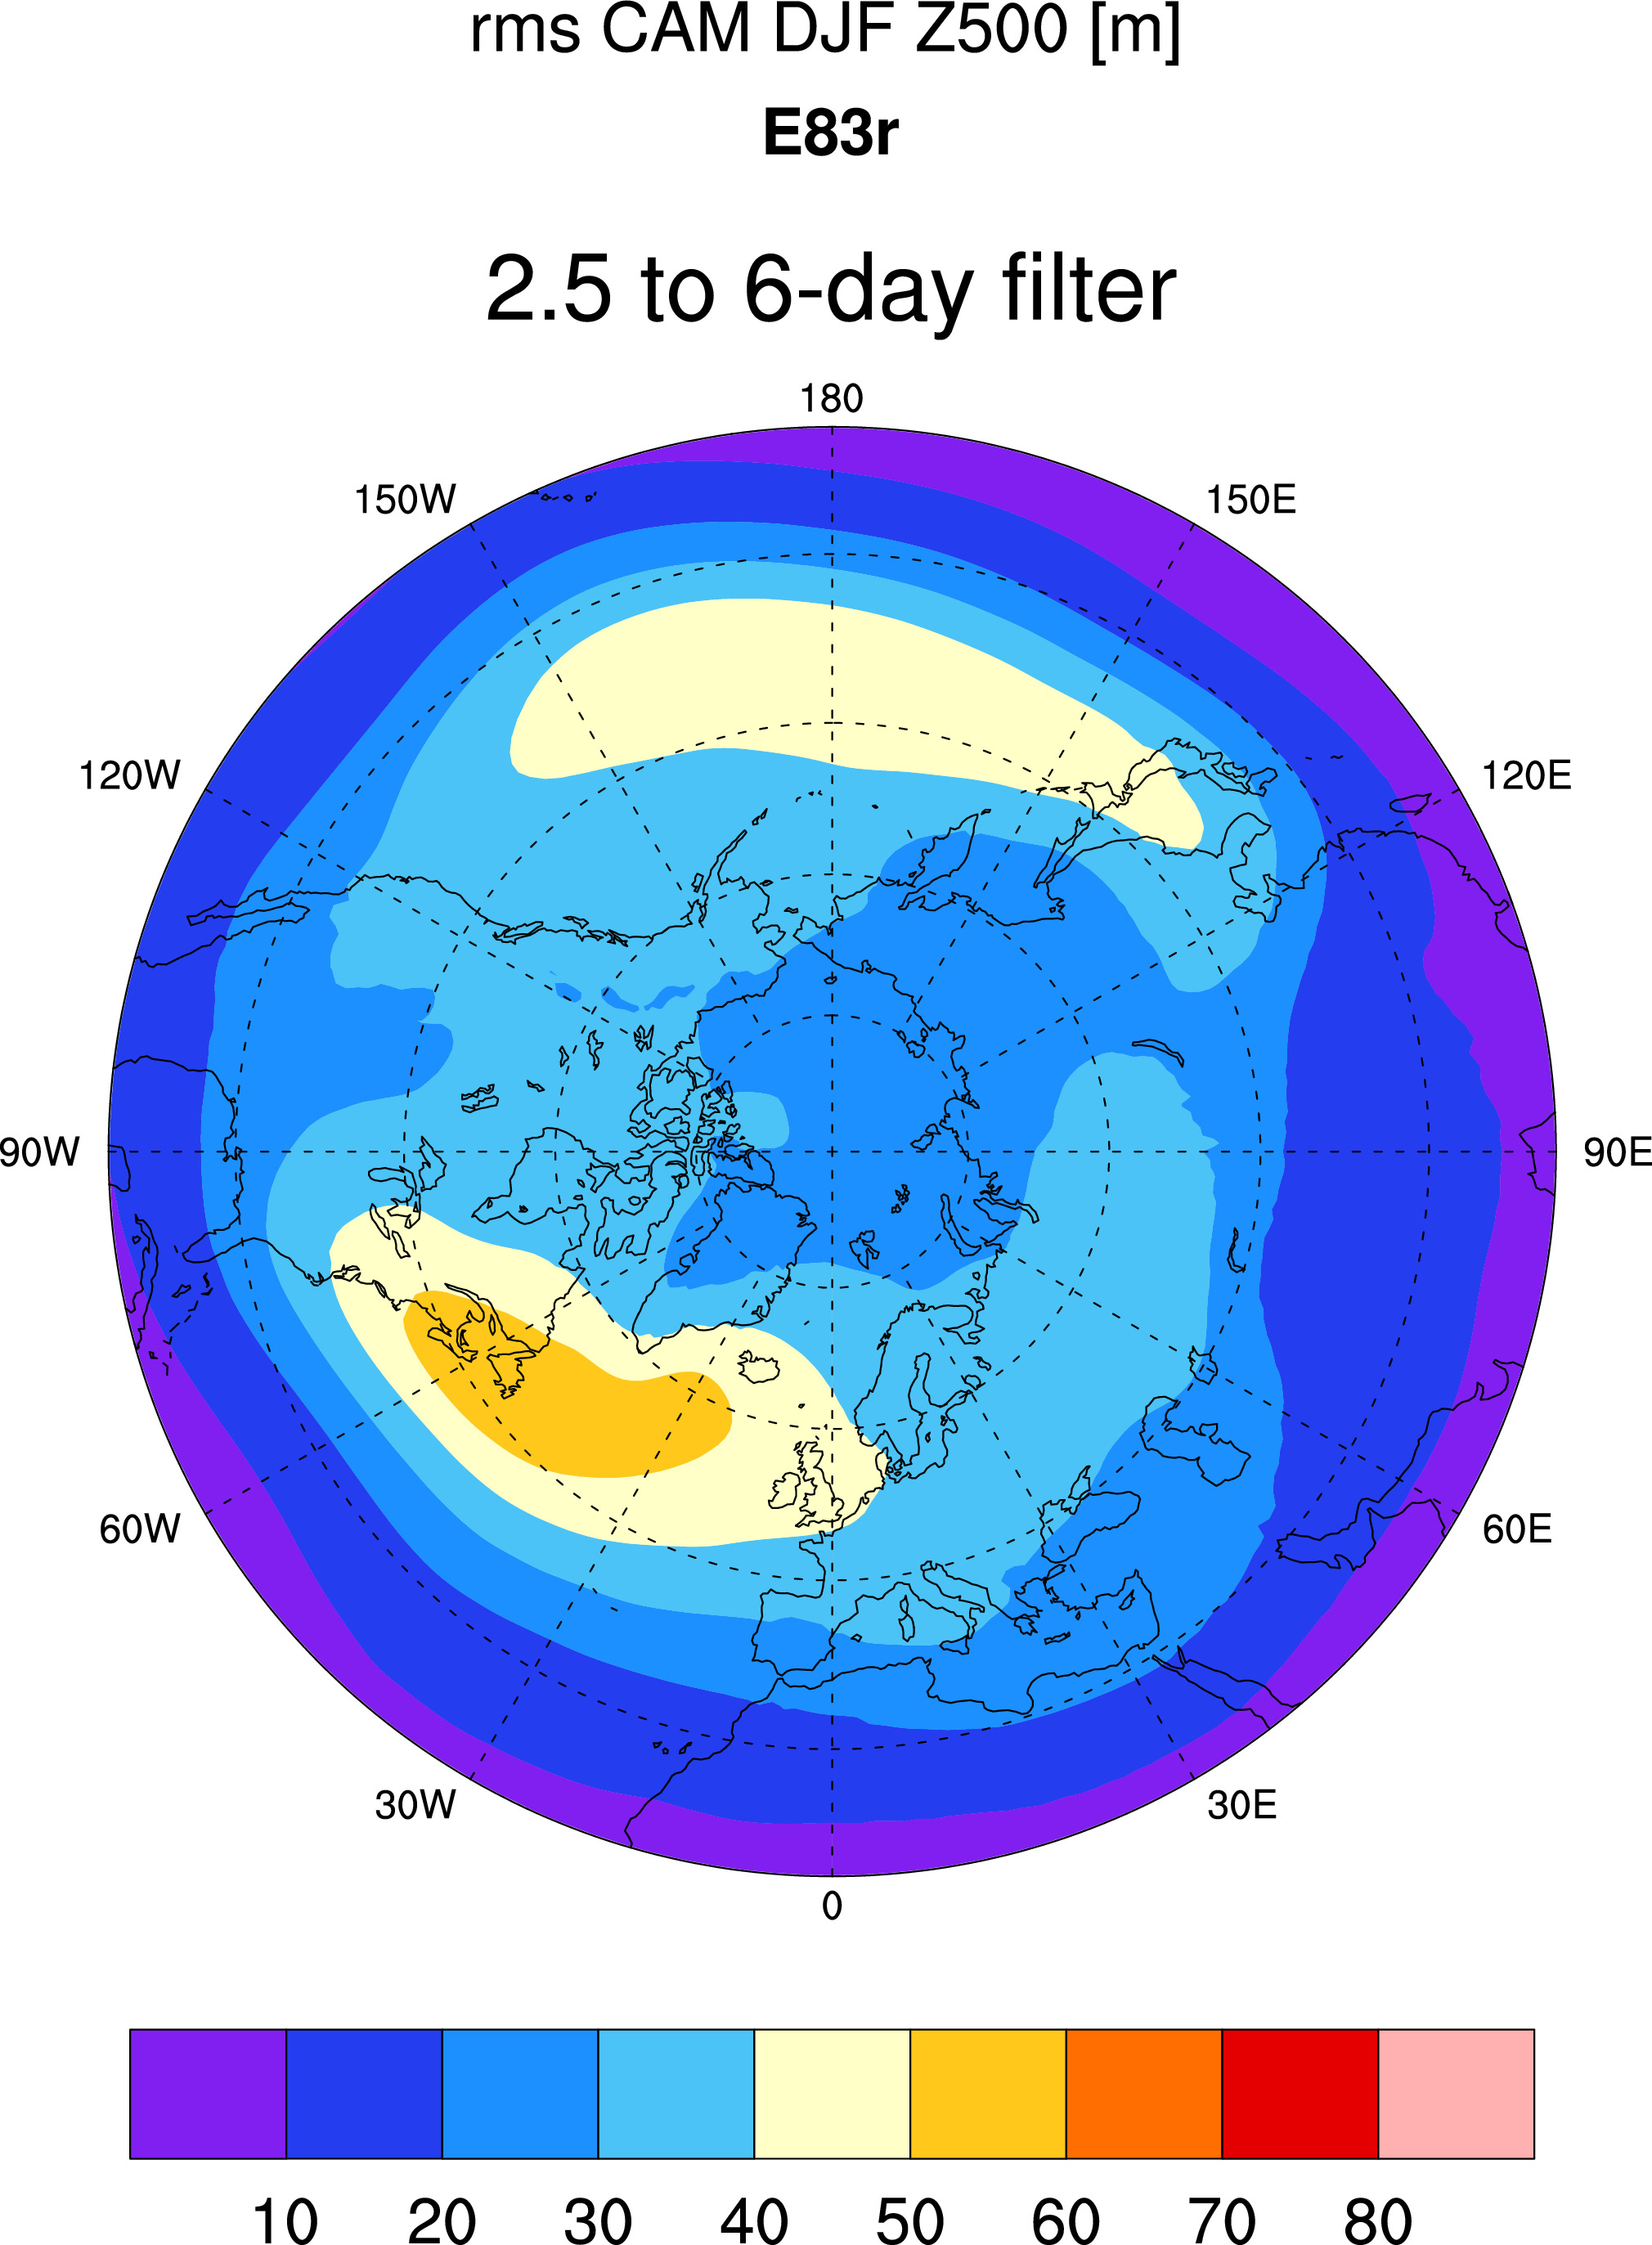
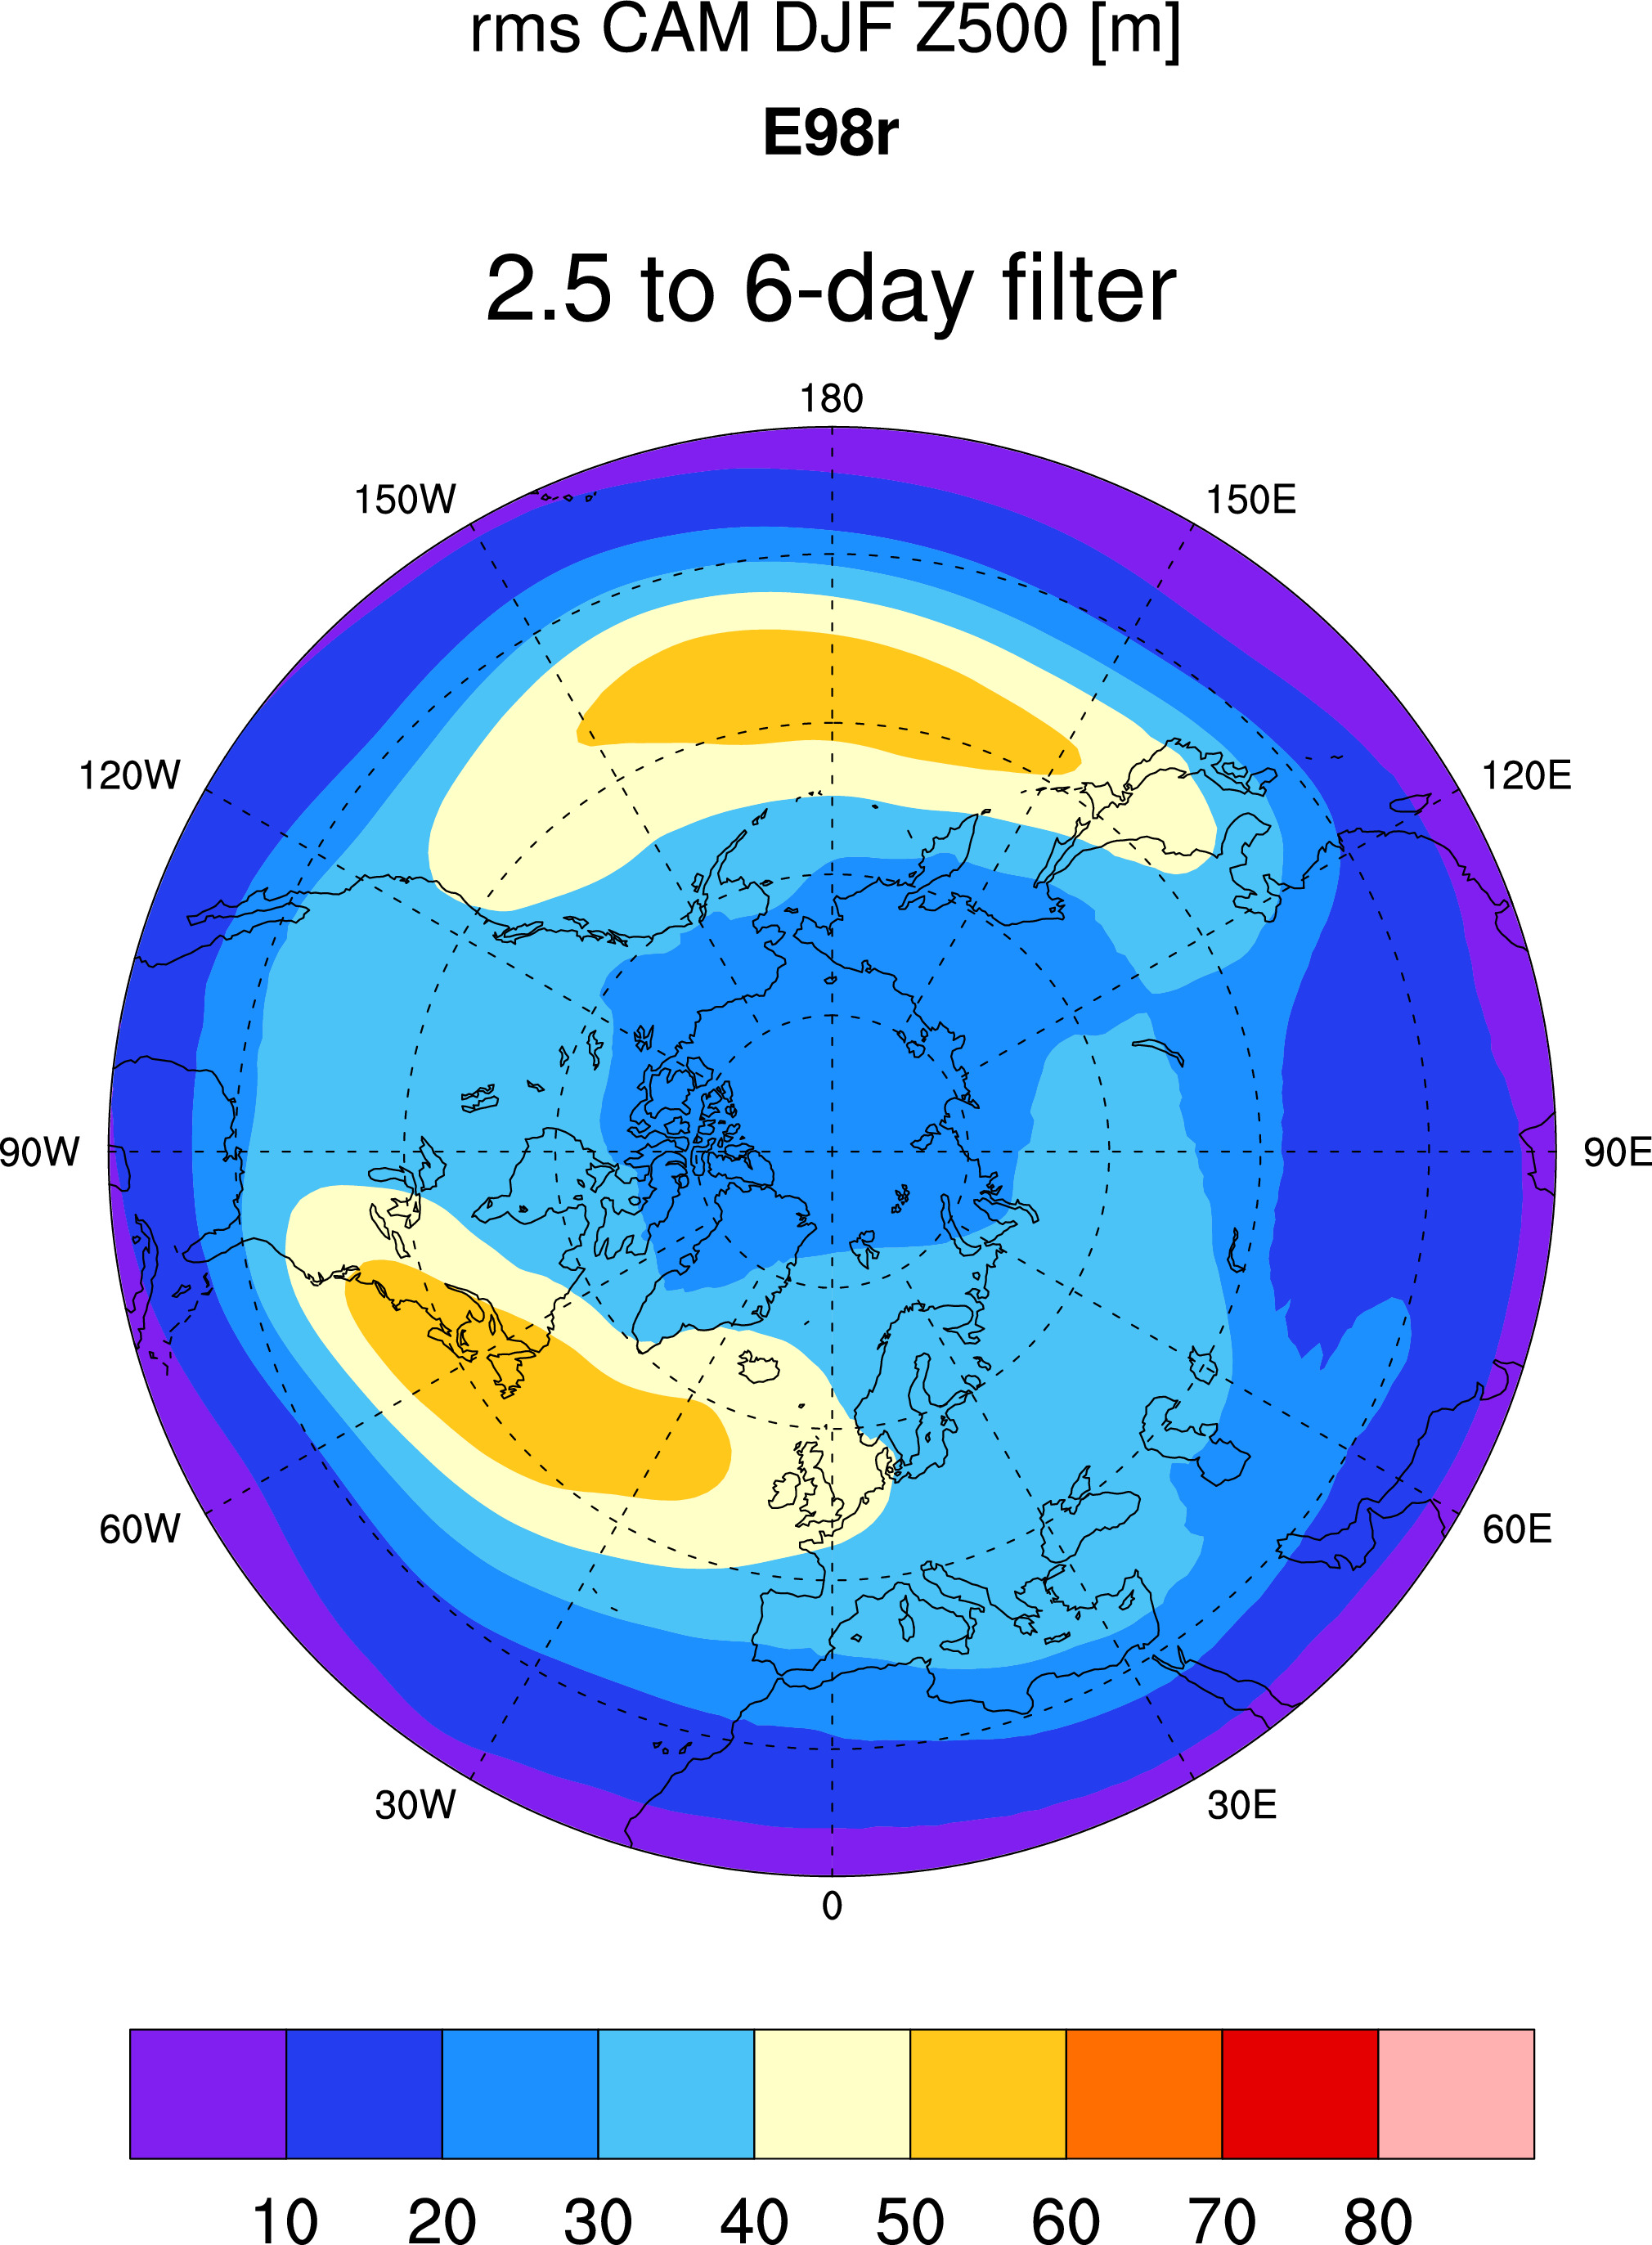
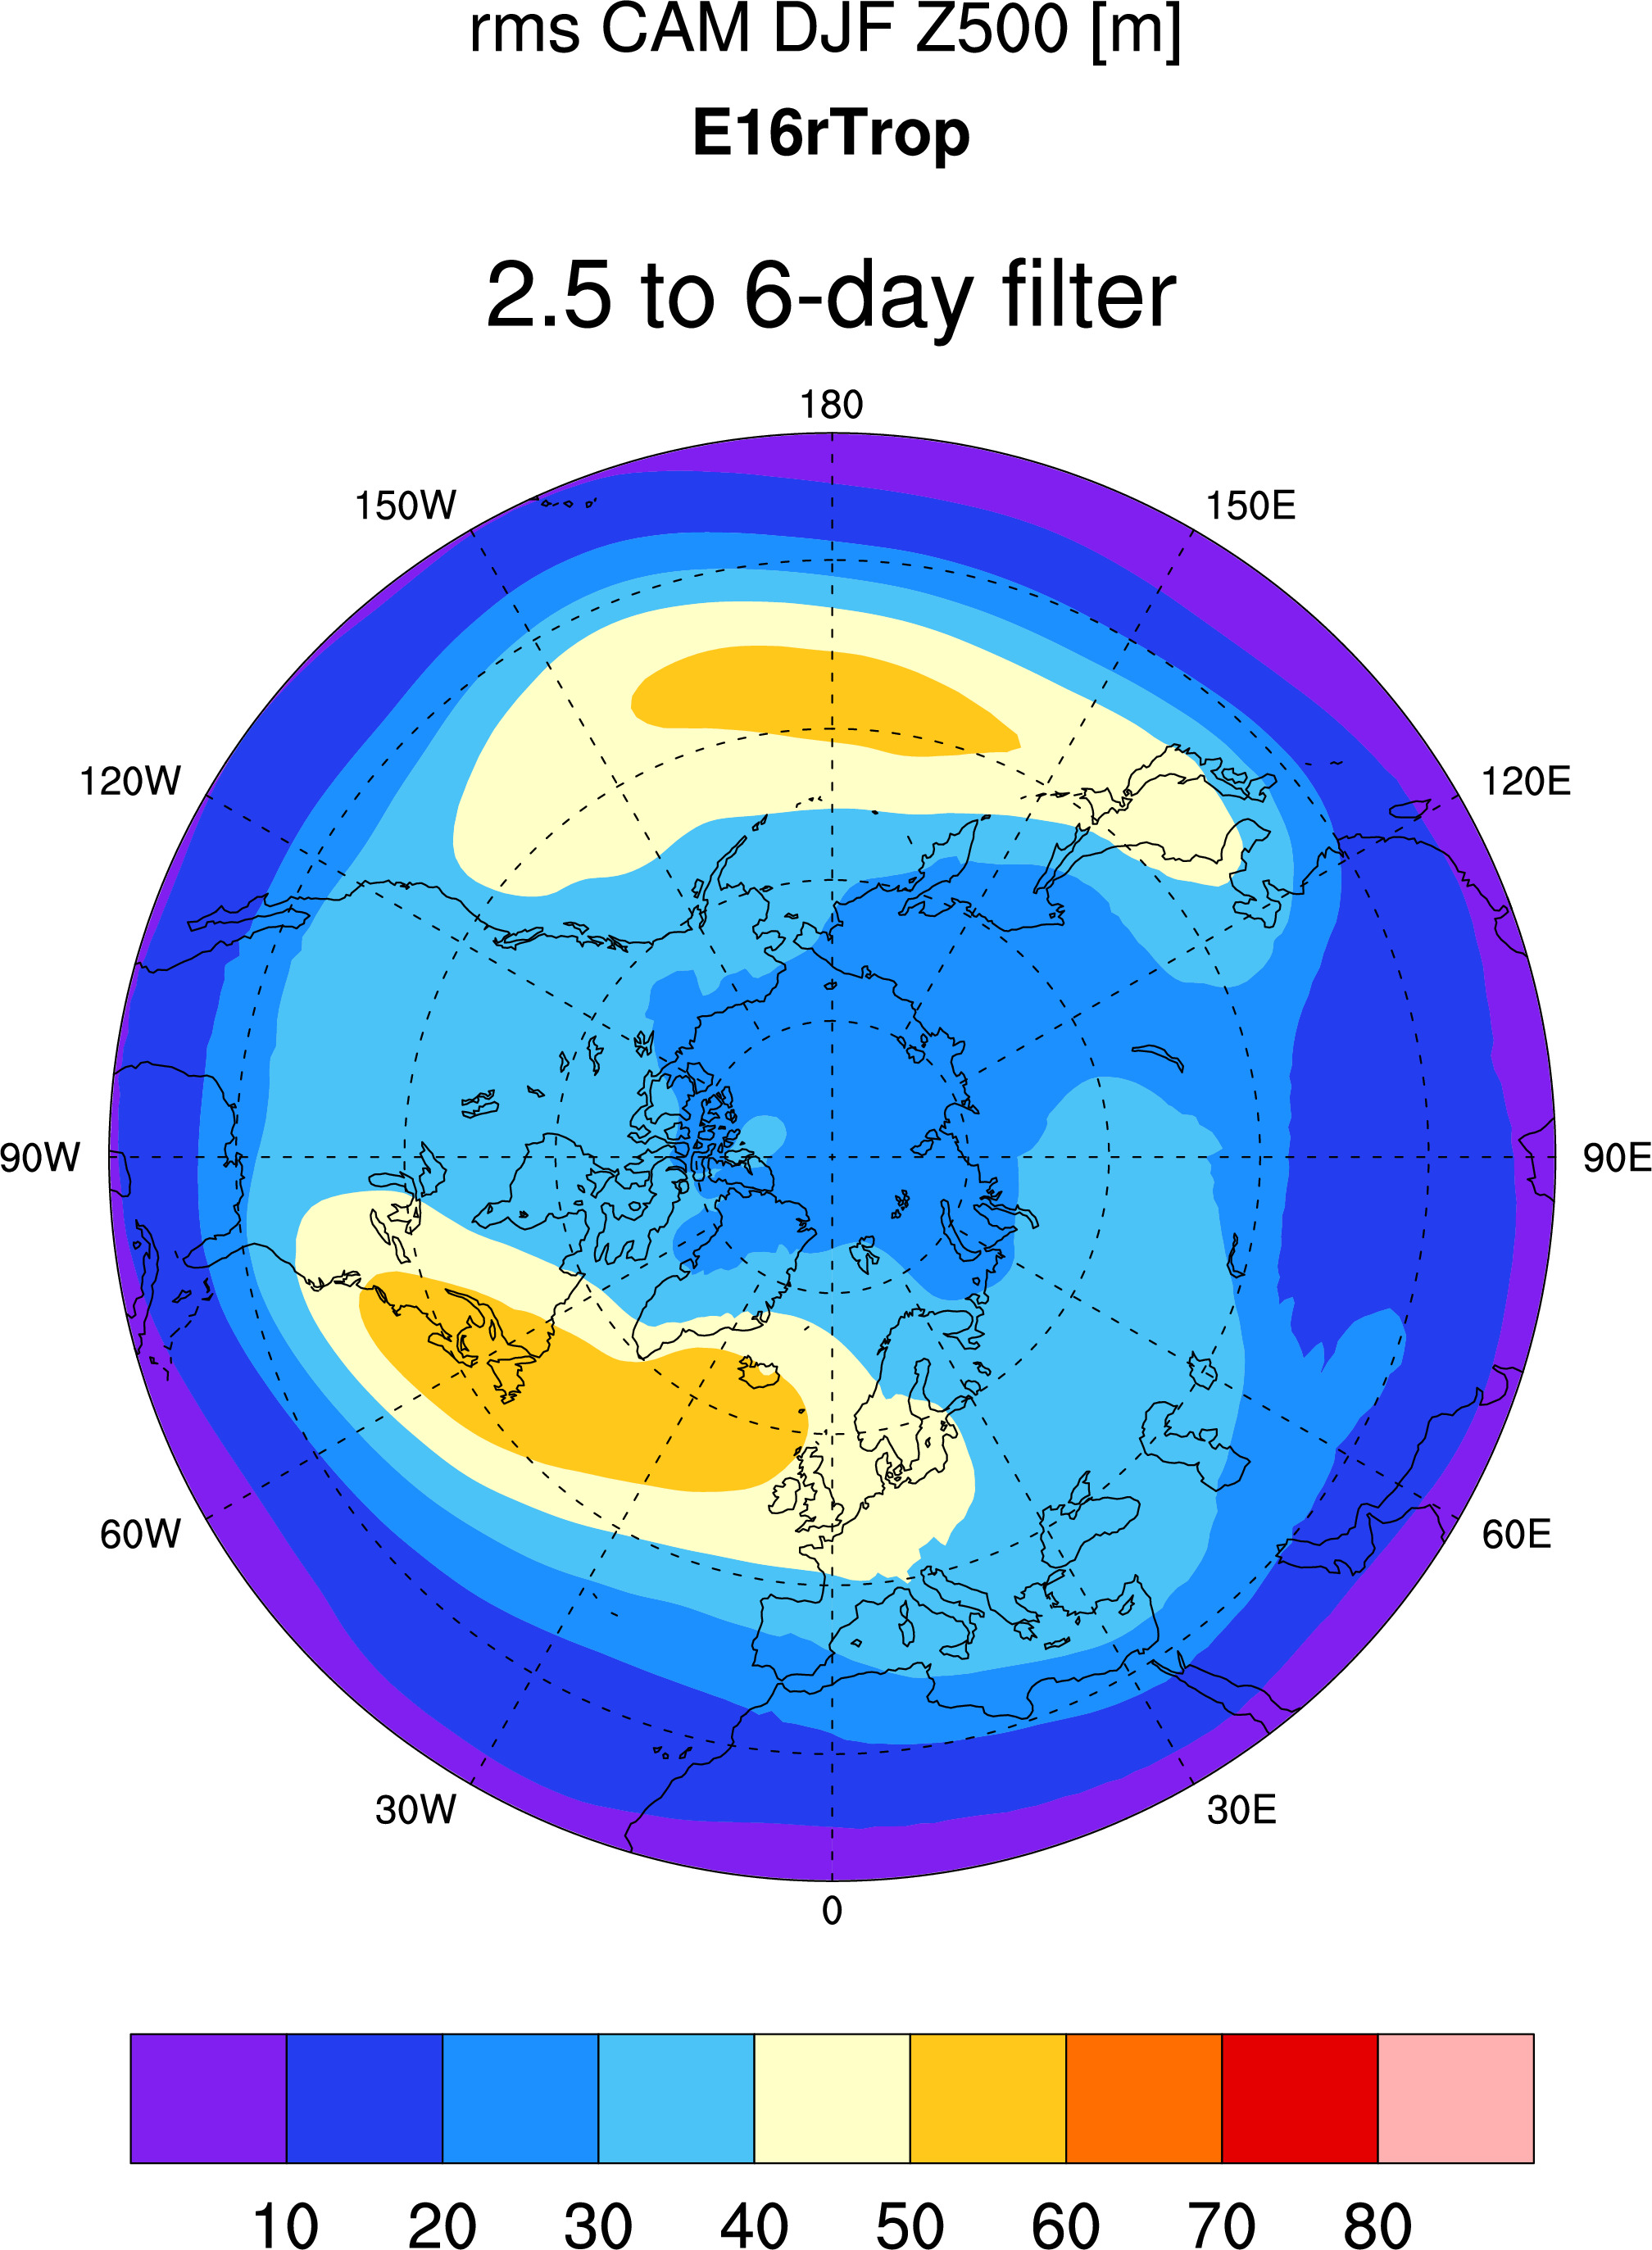
Control Run from CAM:
----------------------------------
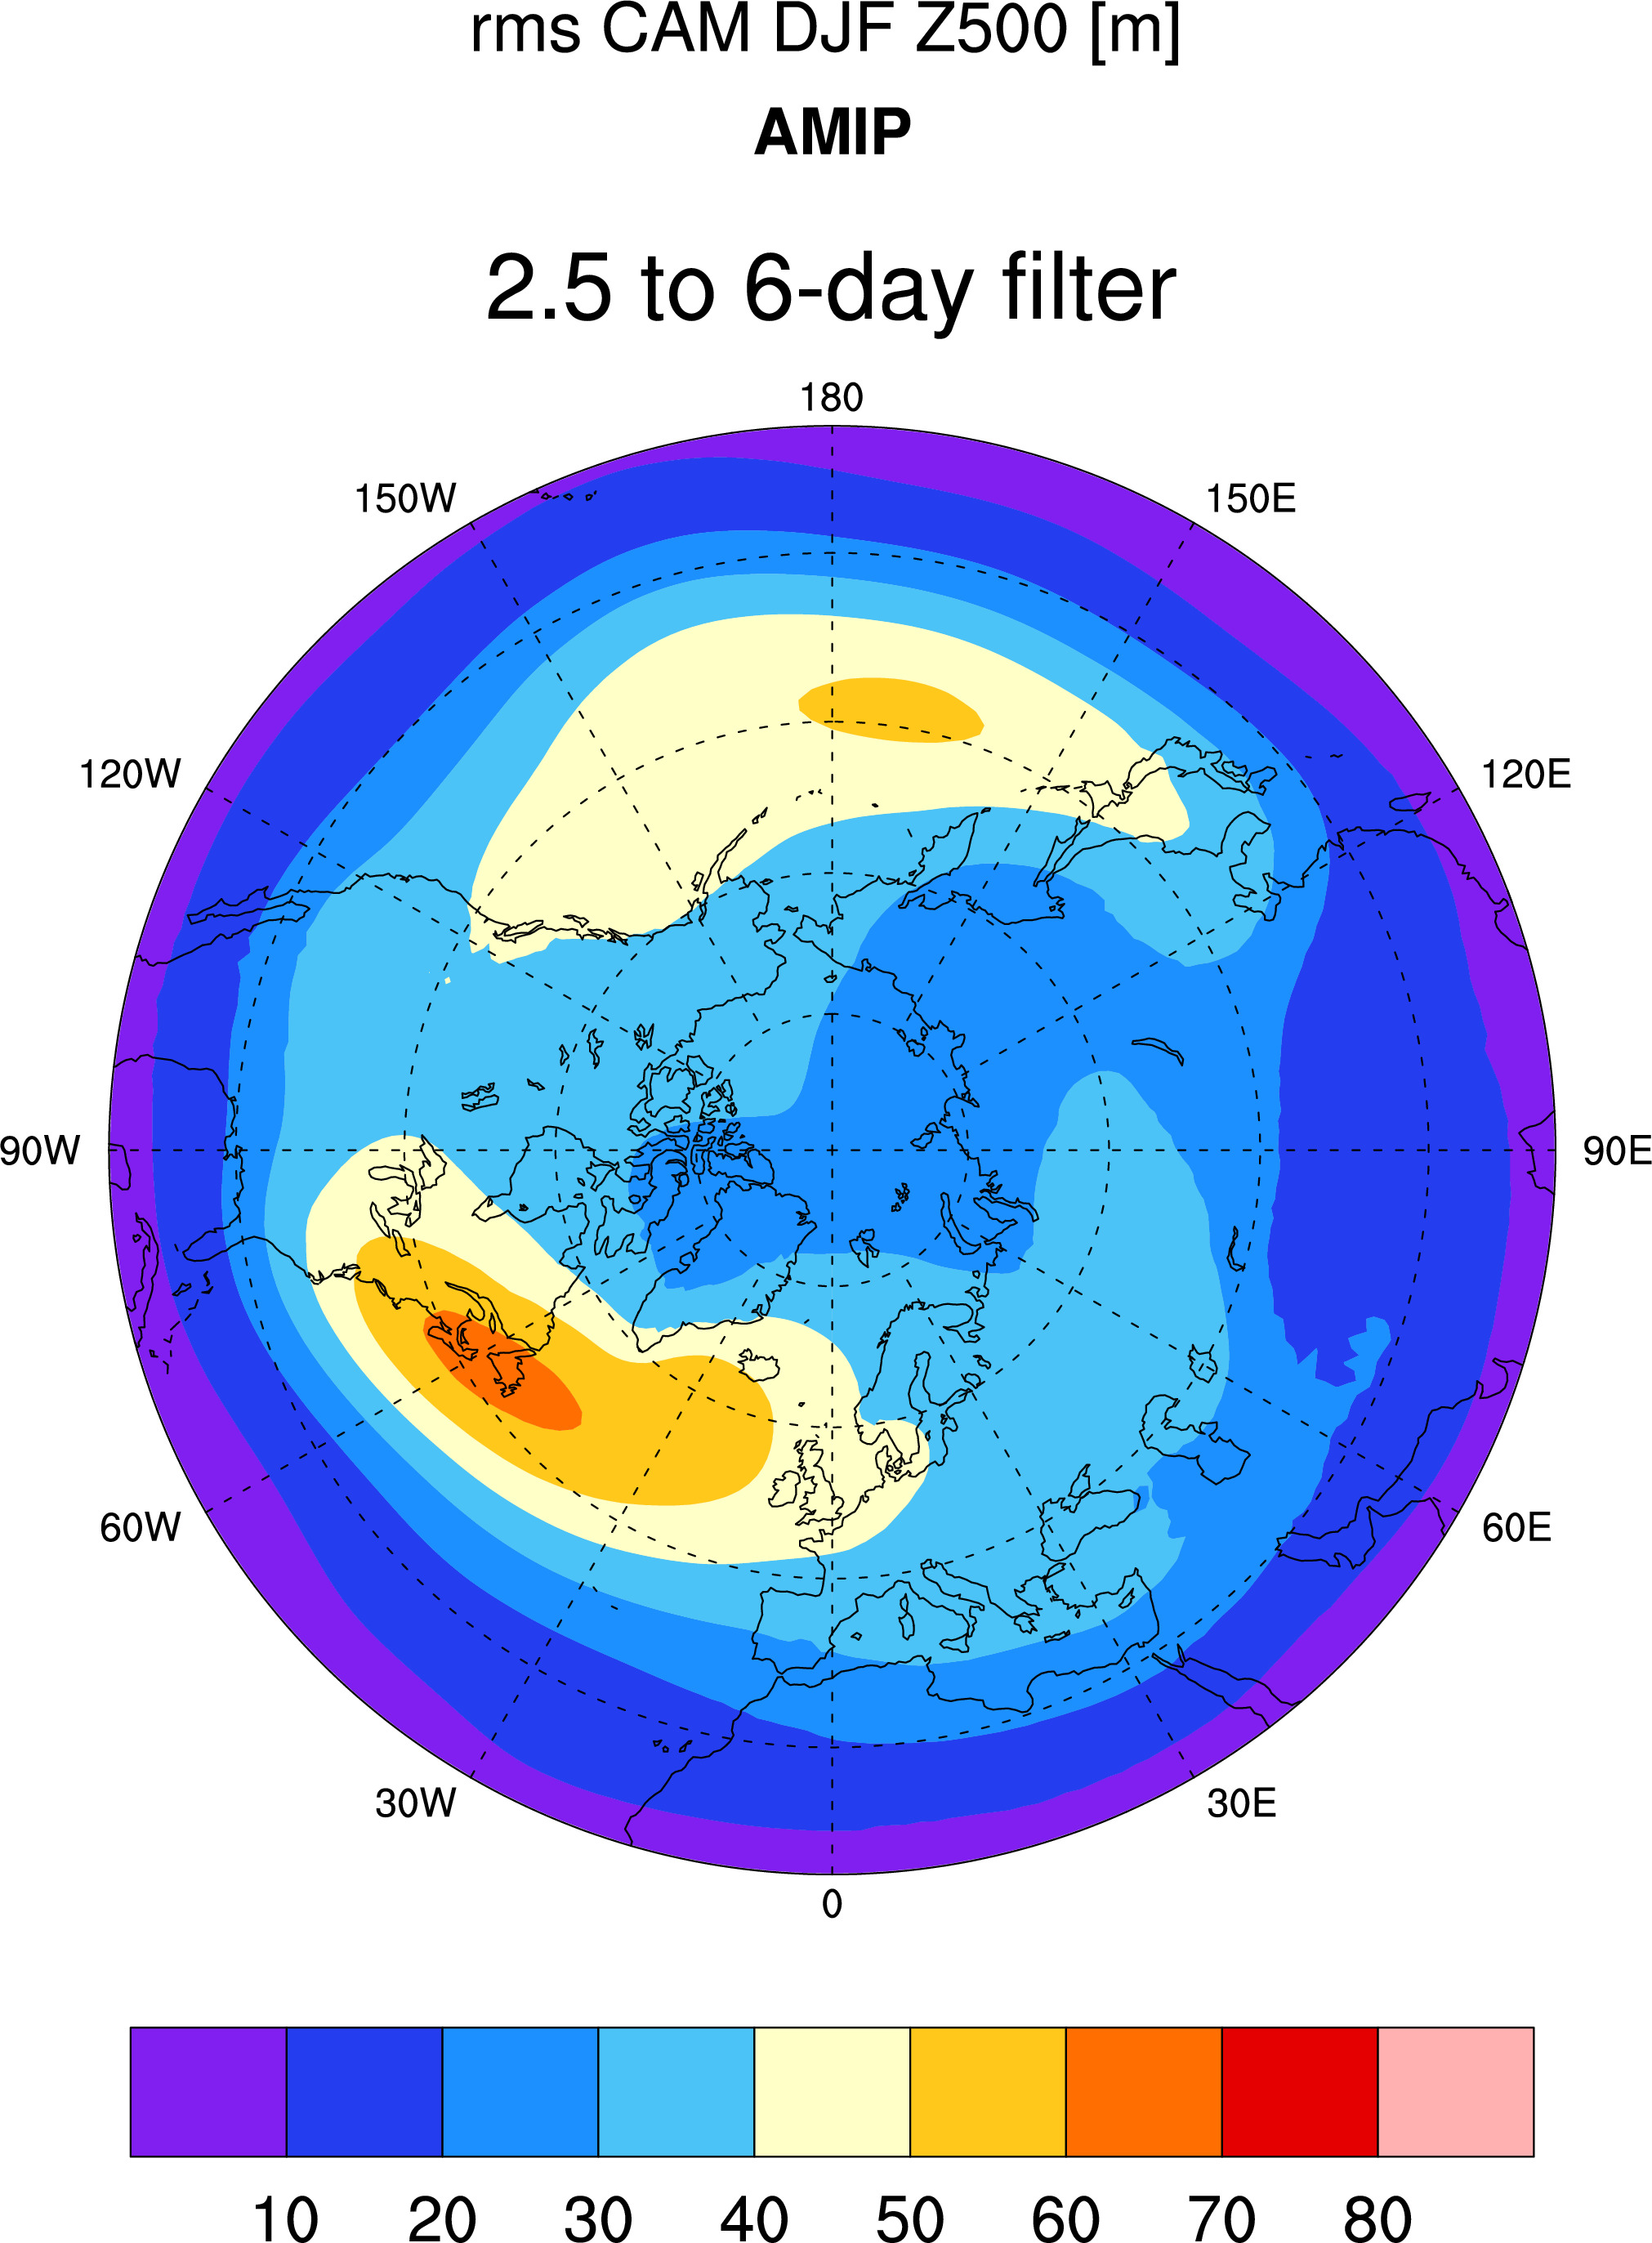
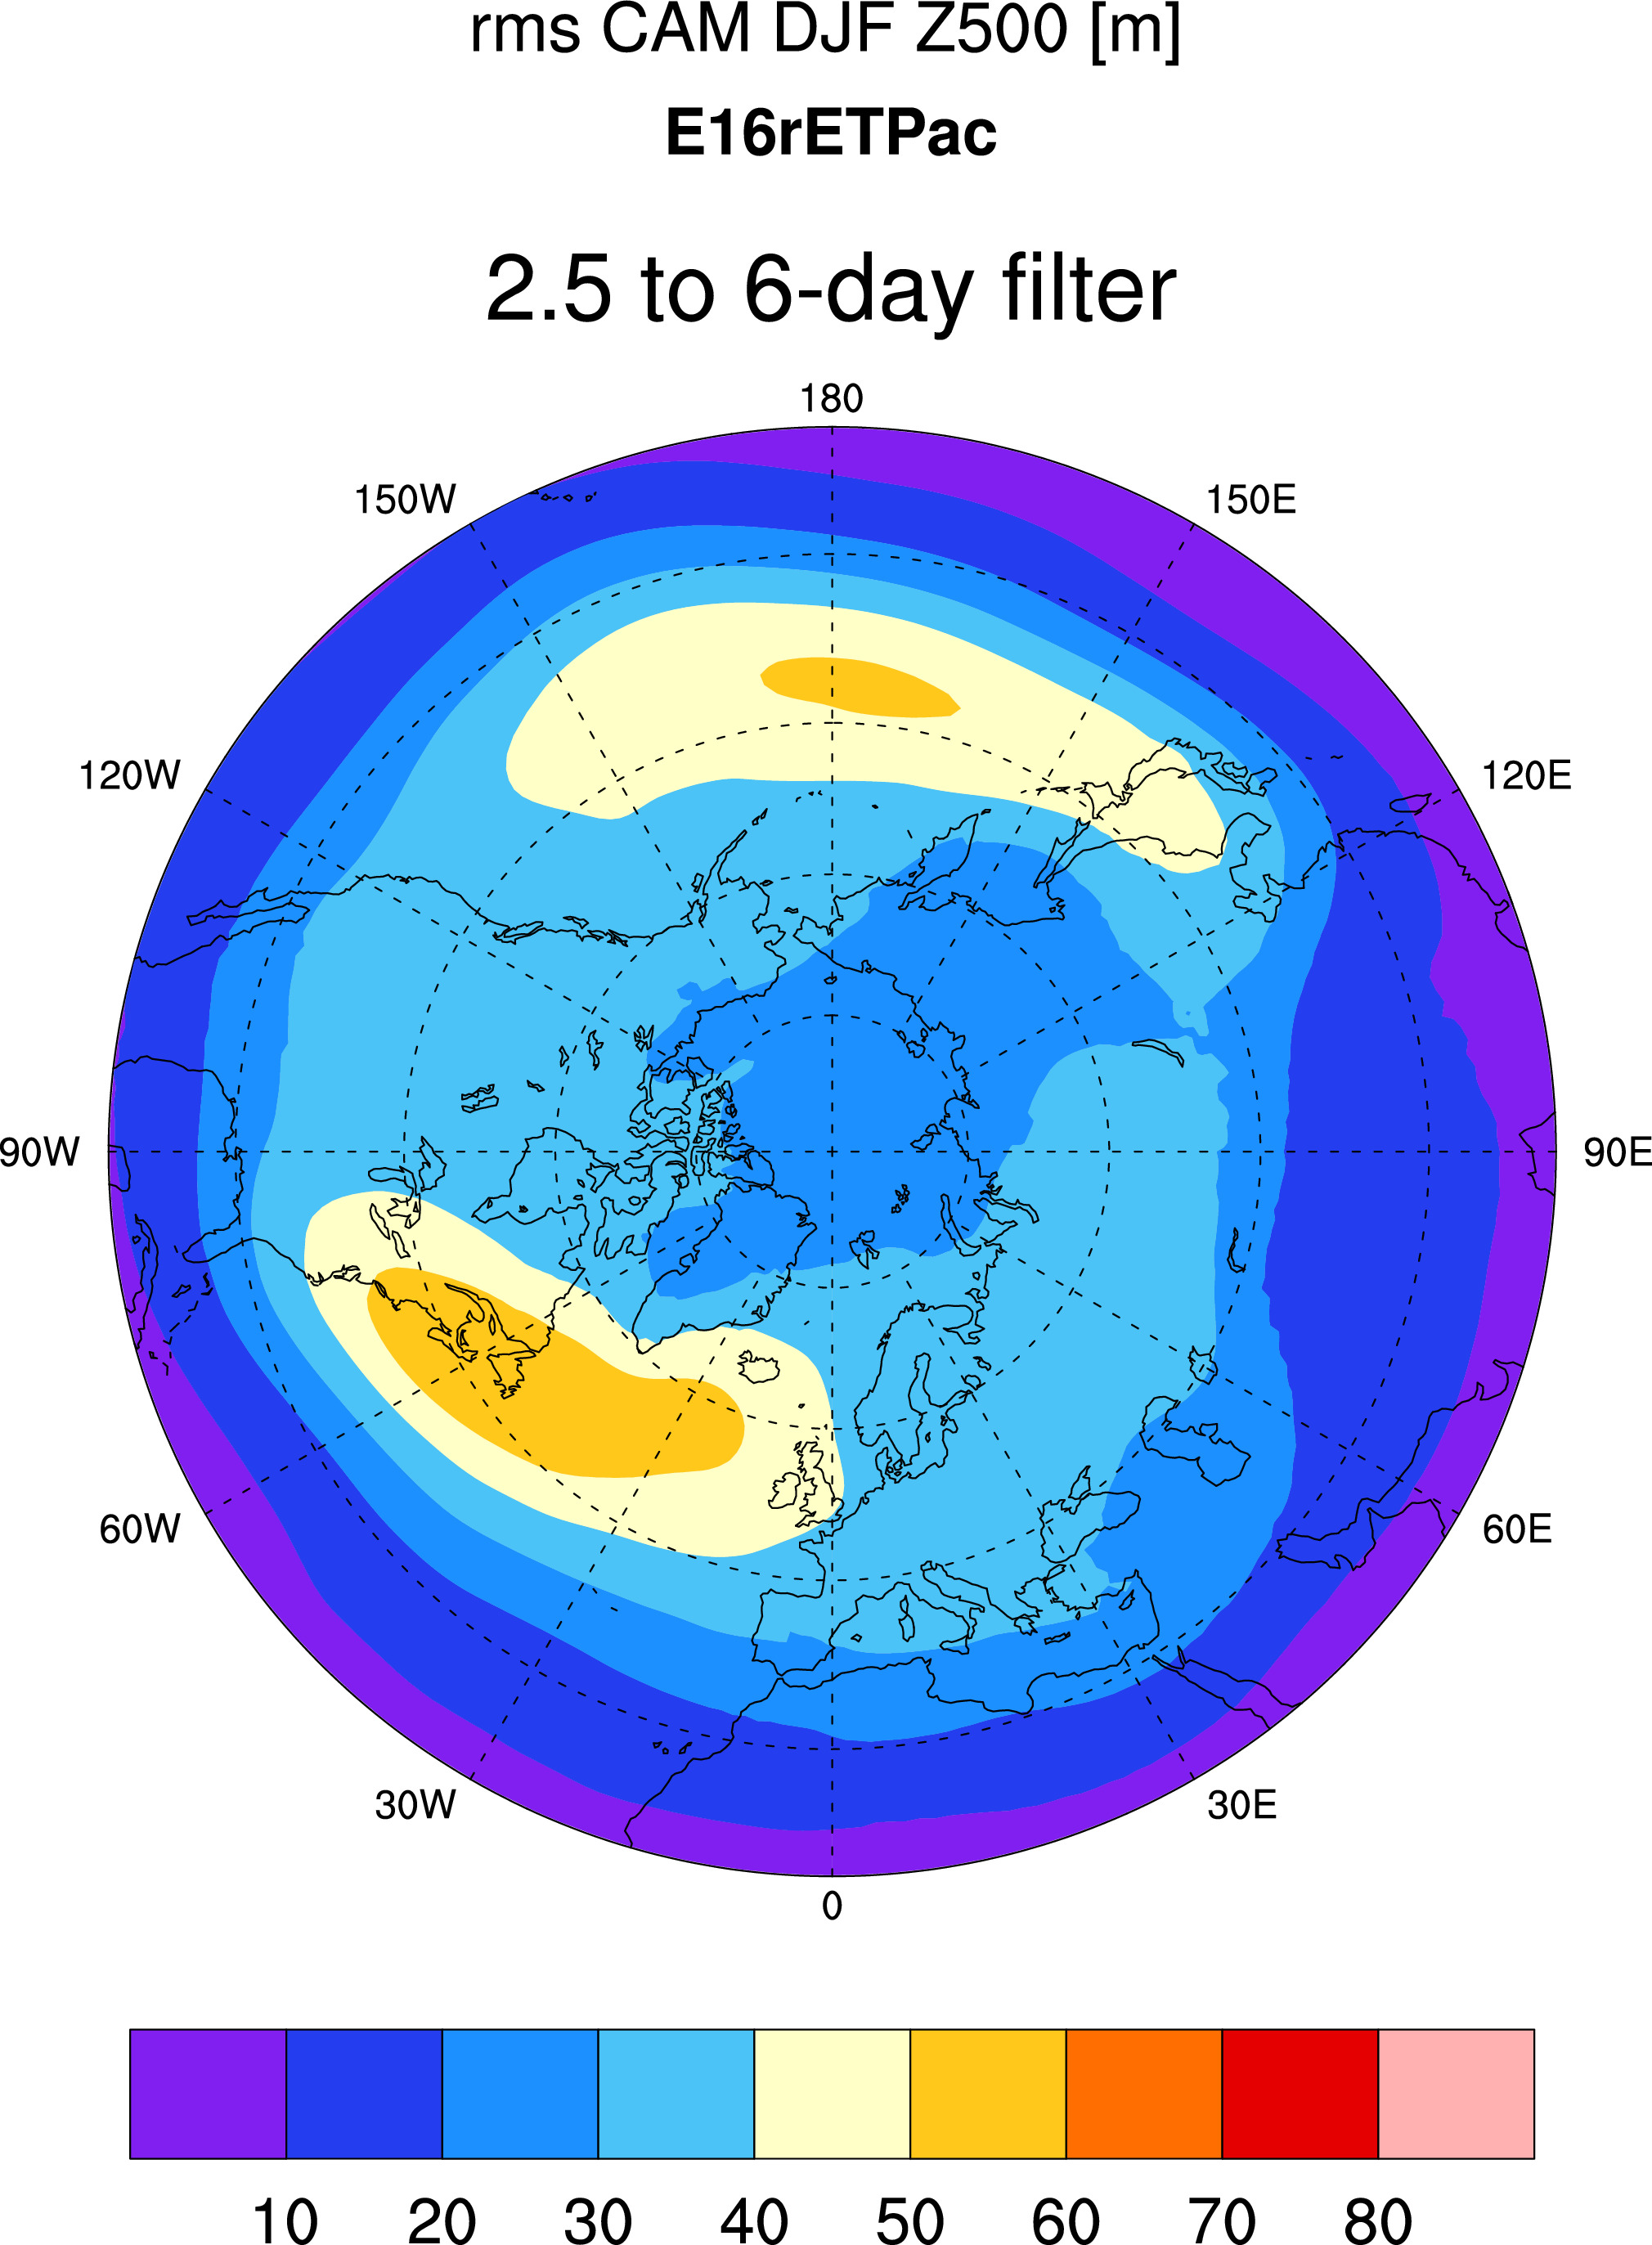
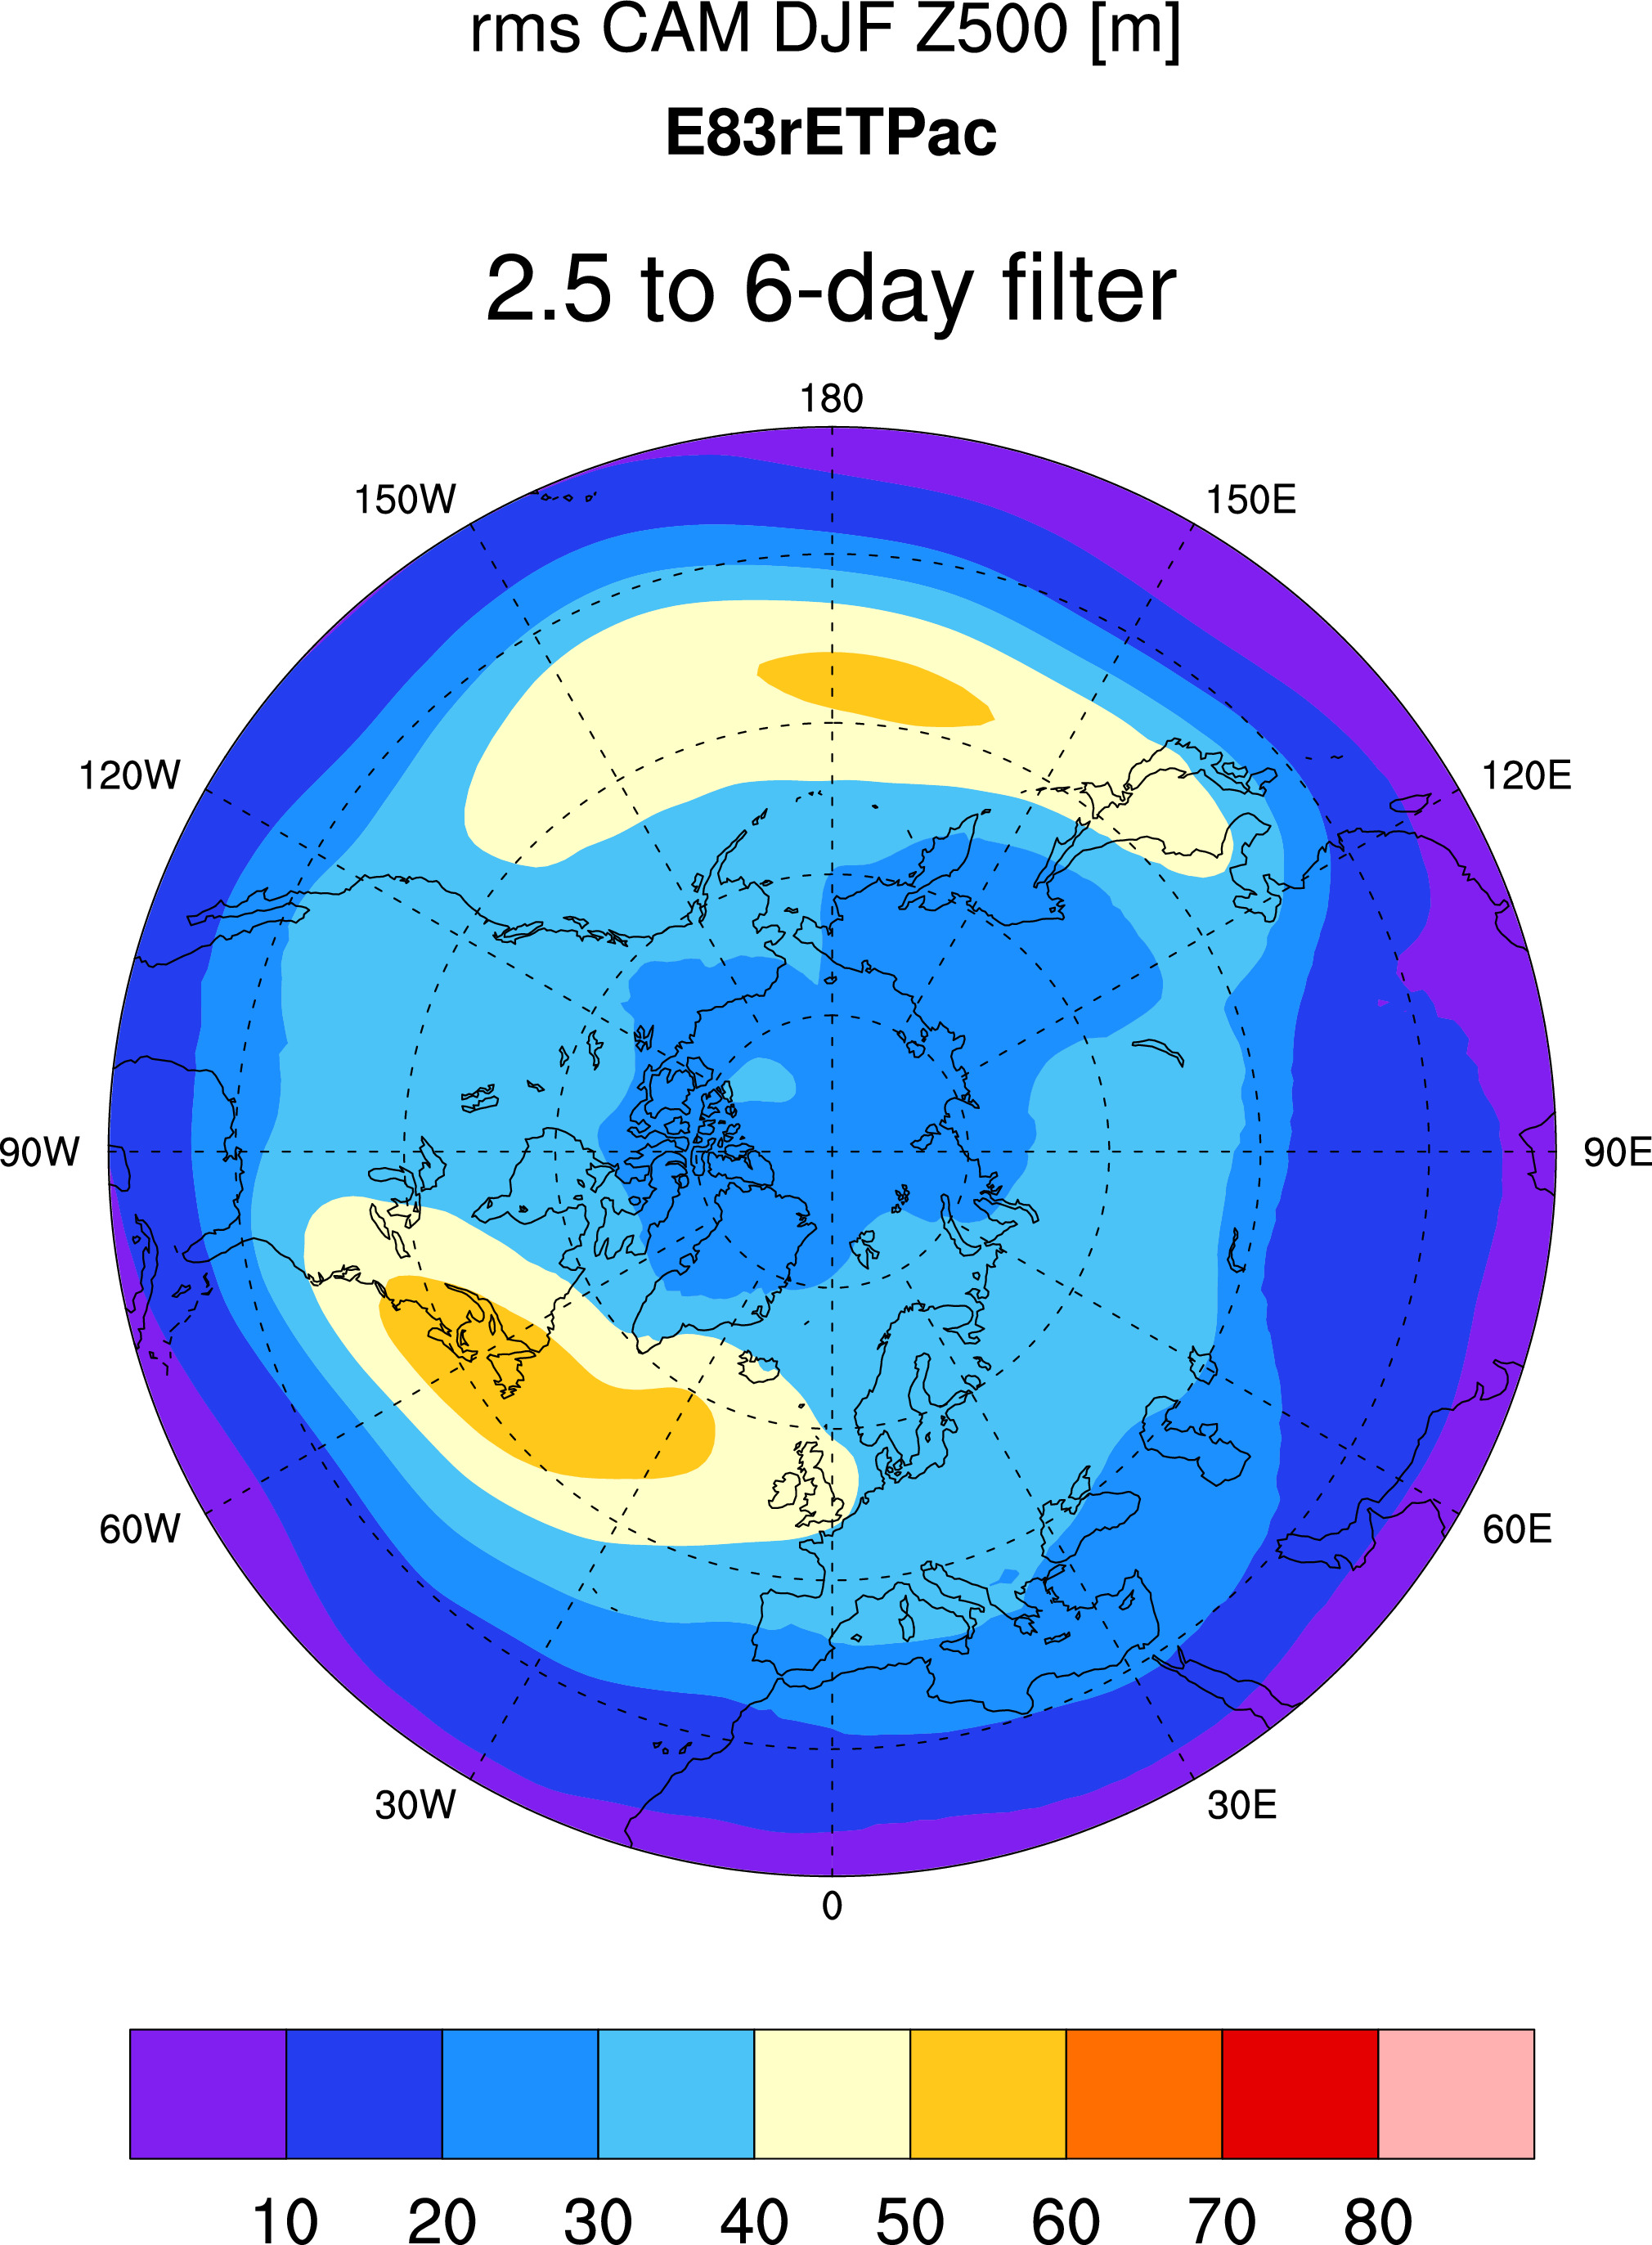
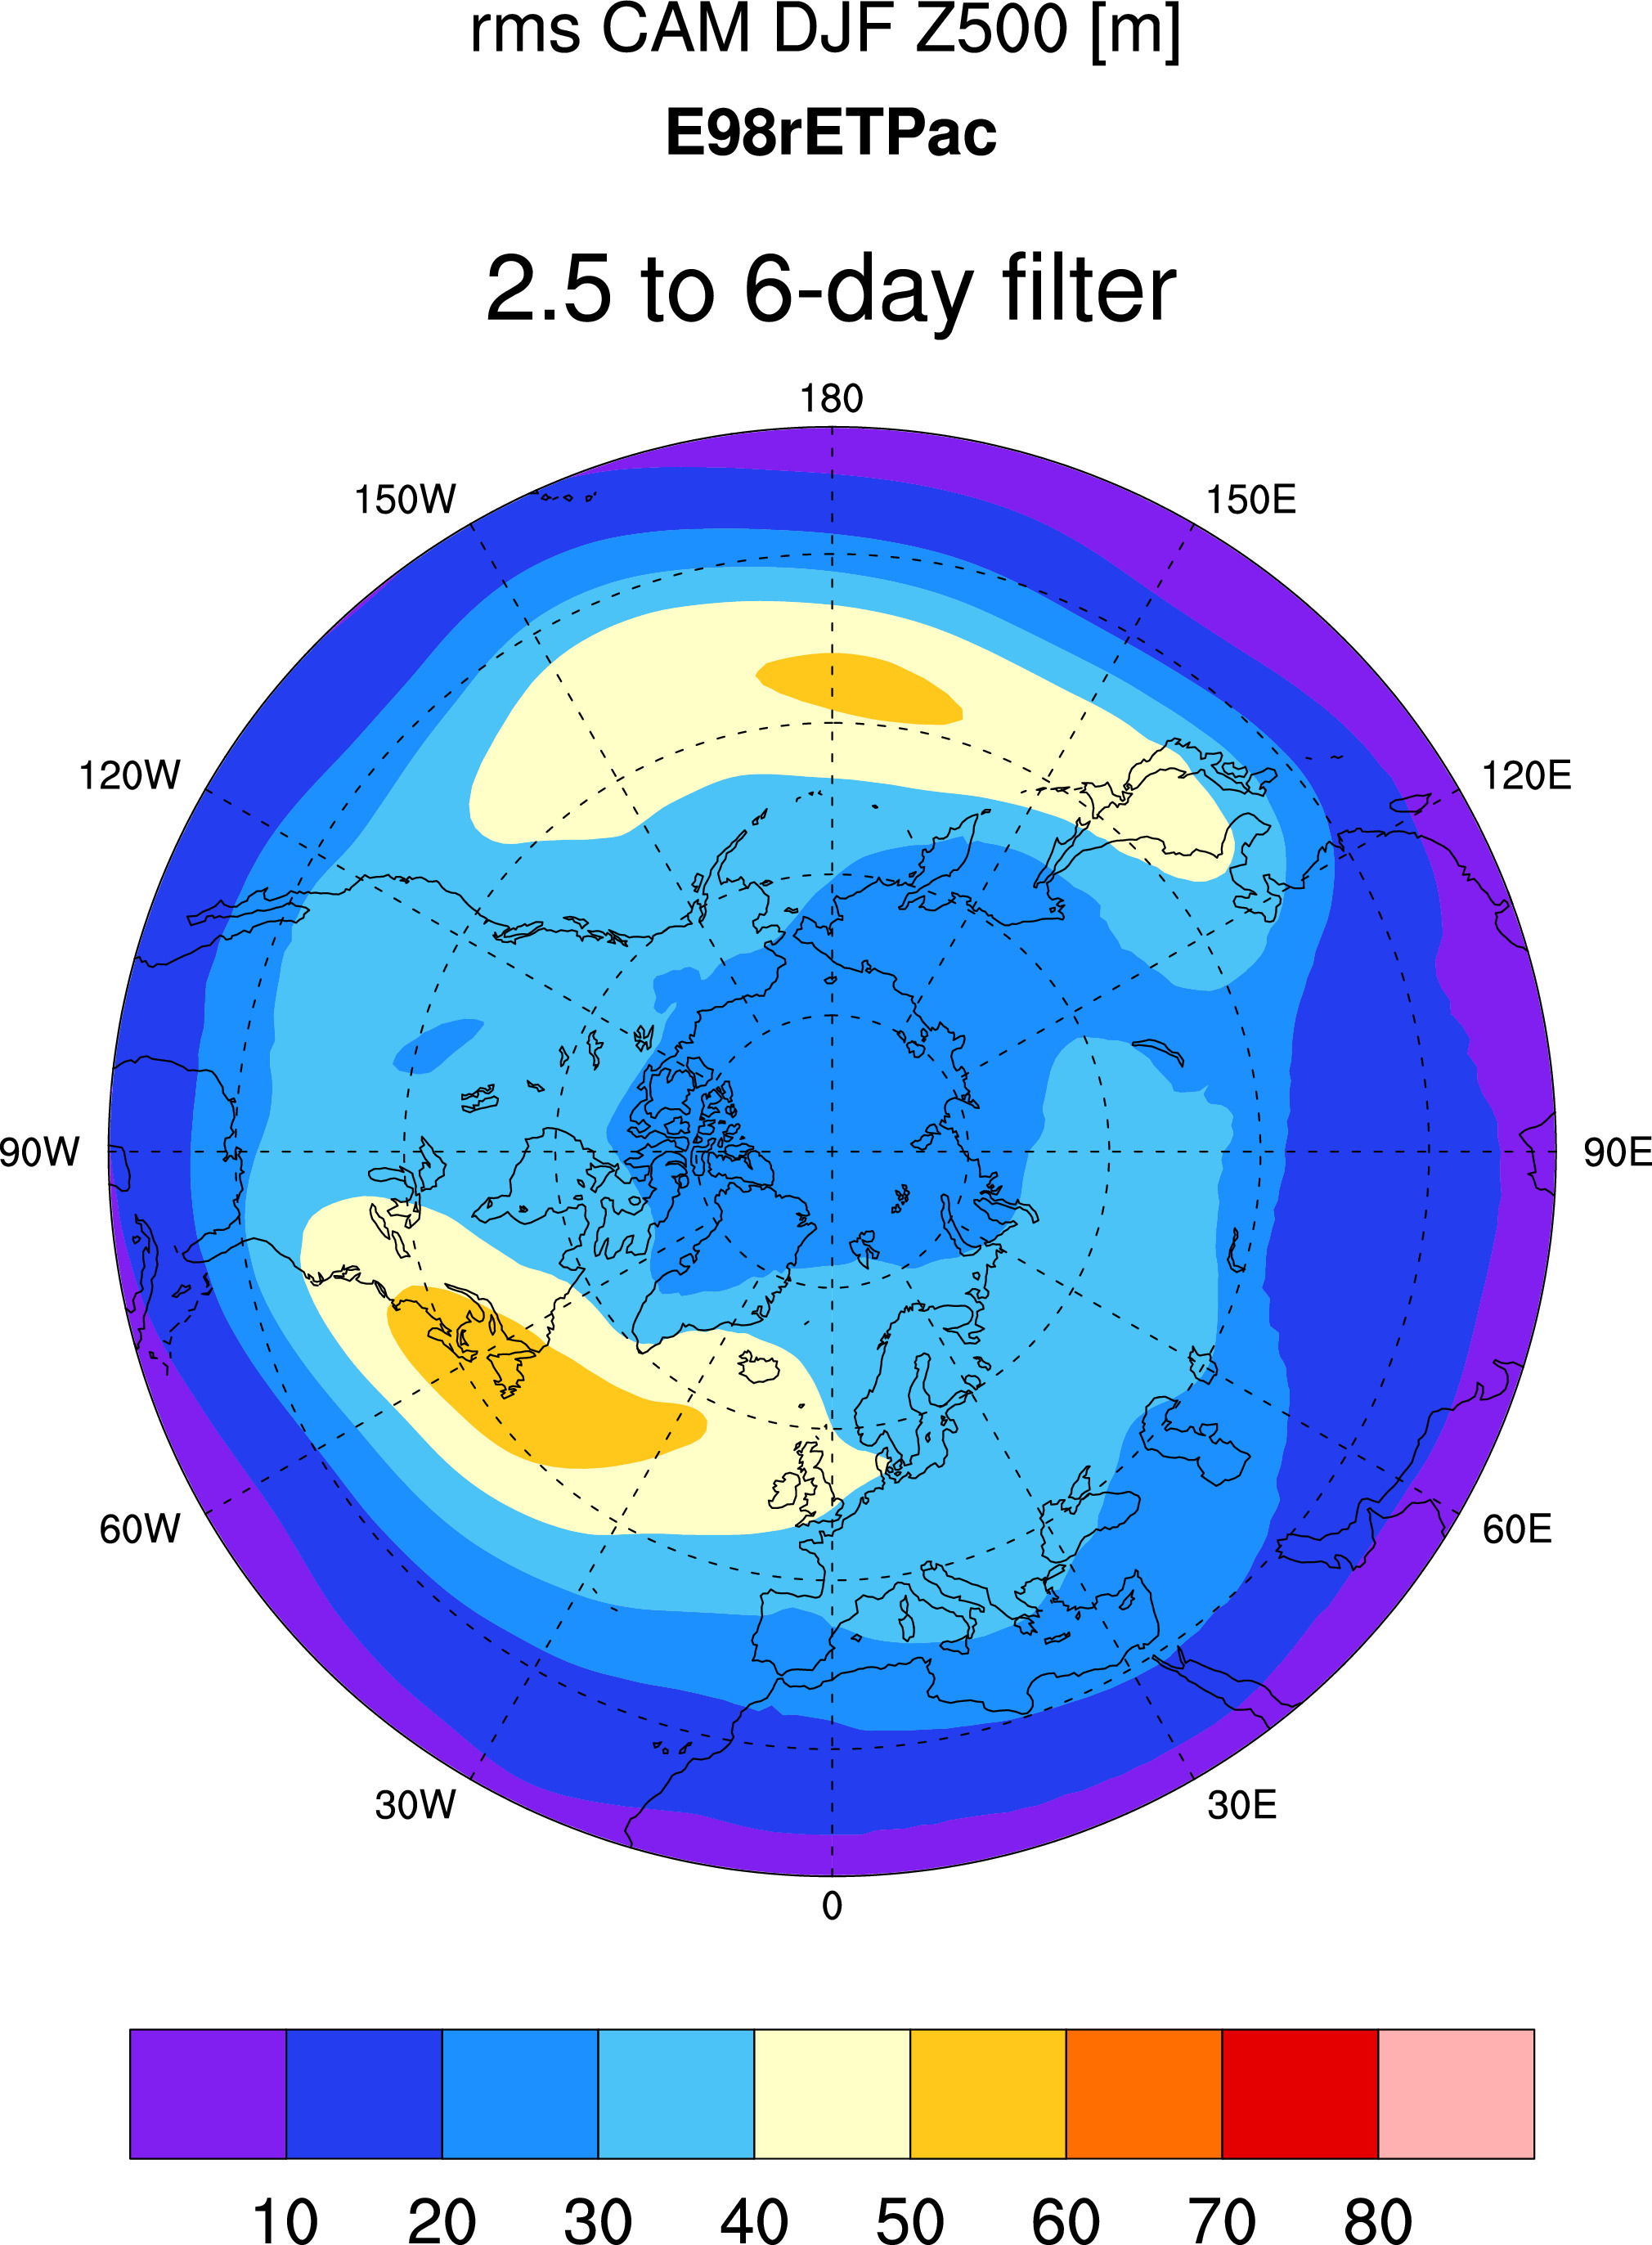
Averages for all the various cases:
============================================================================================================
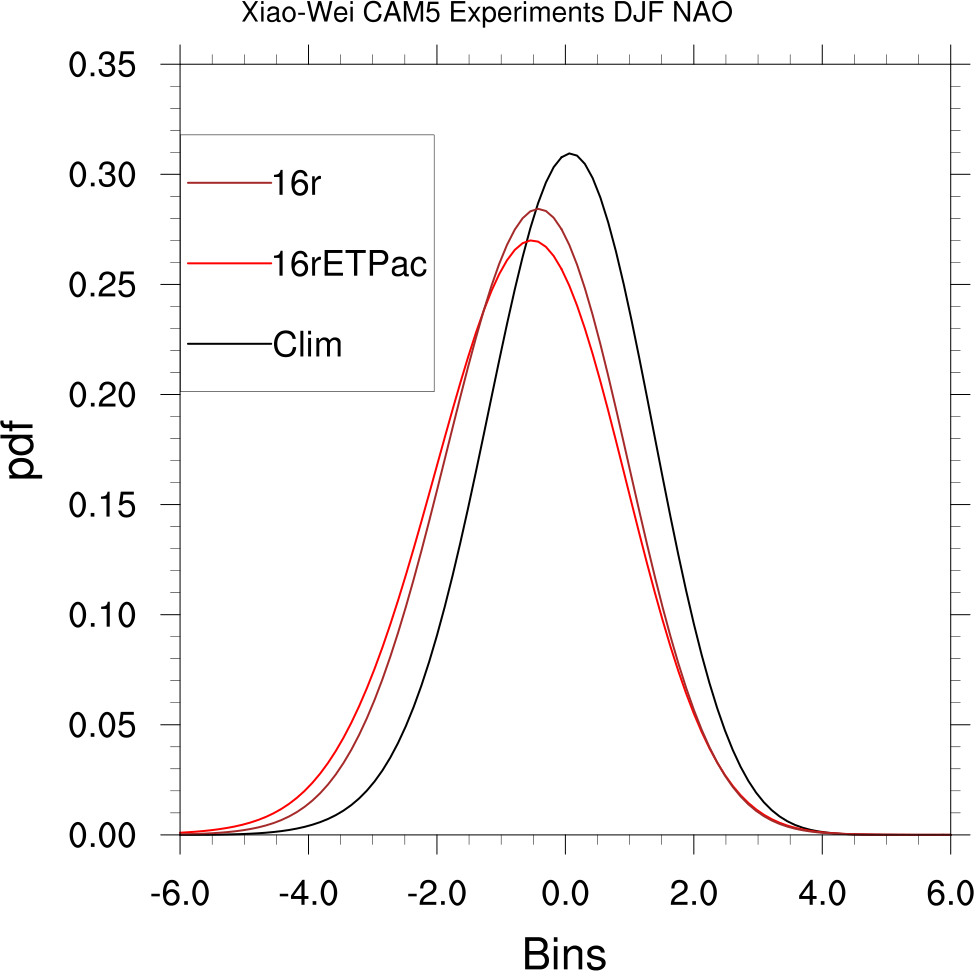
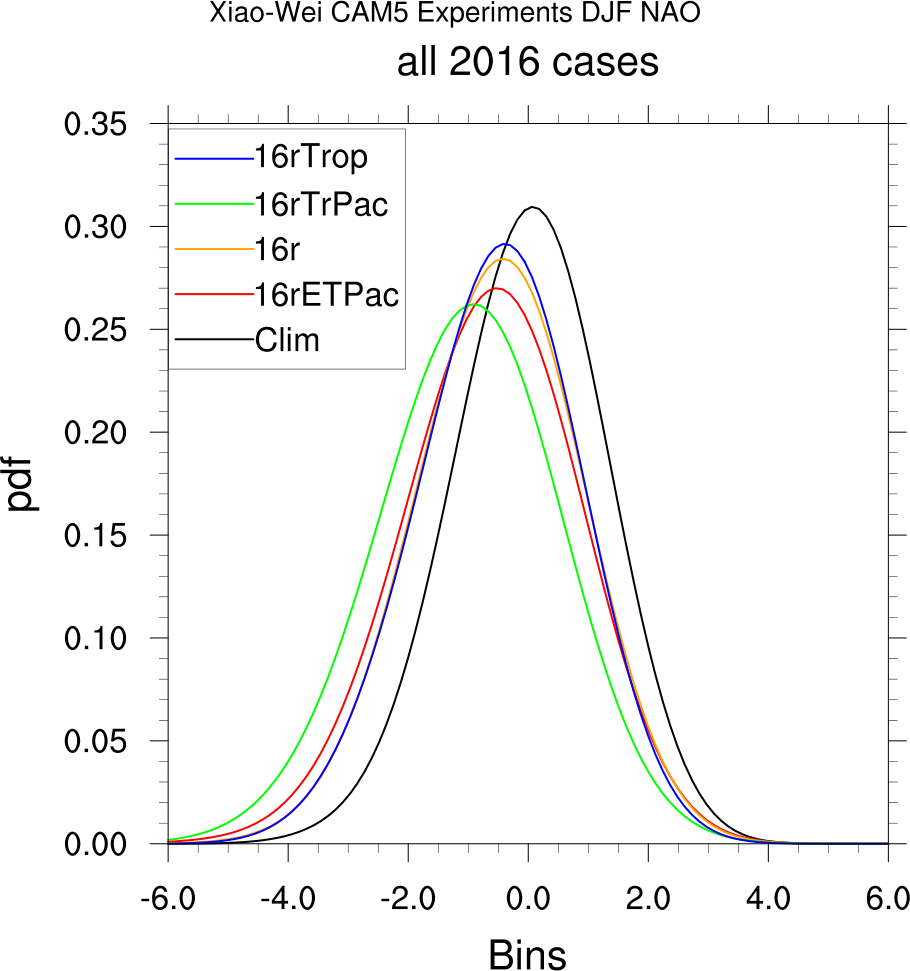
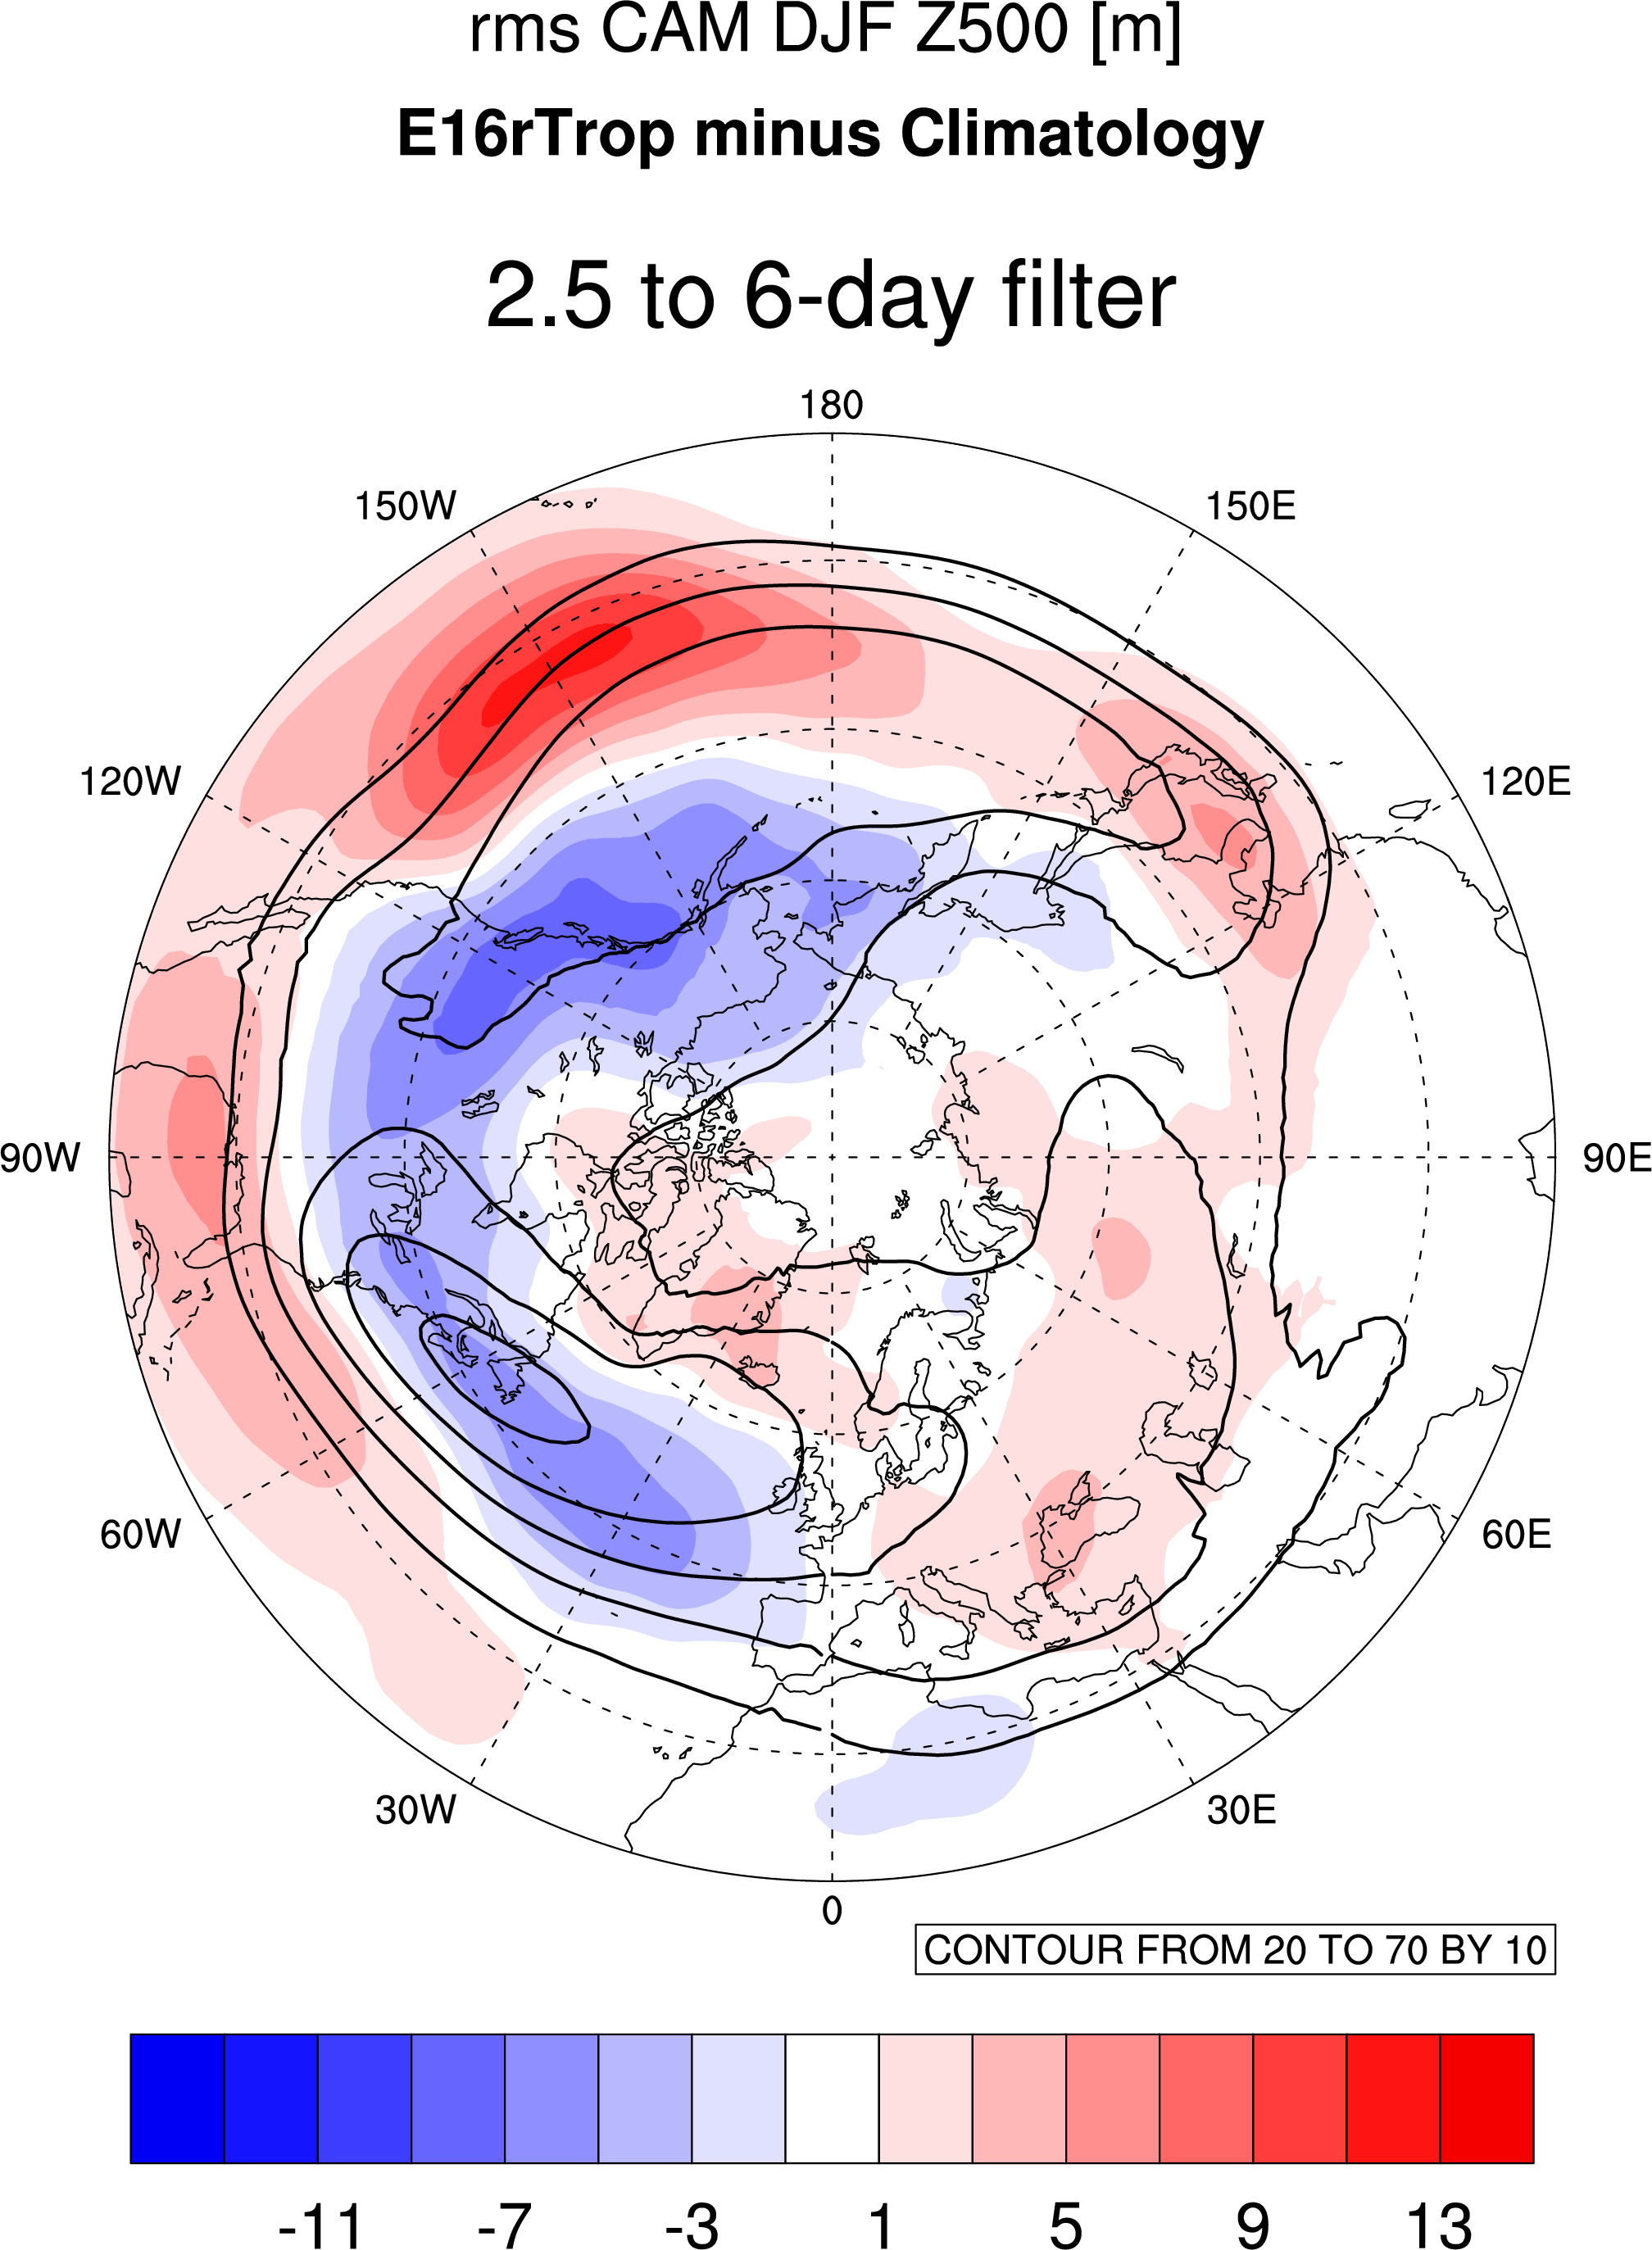
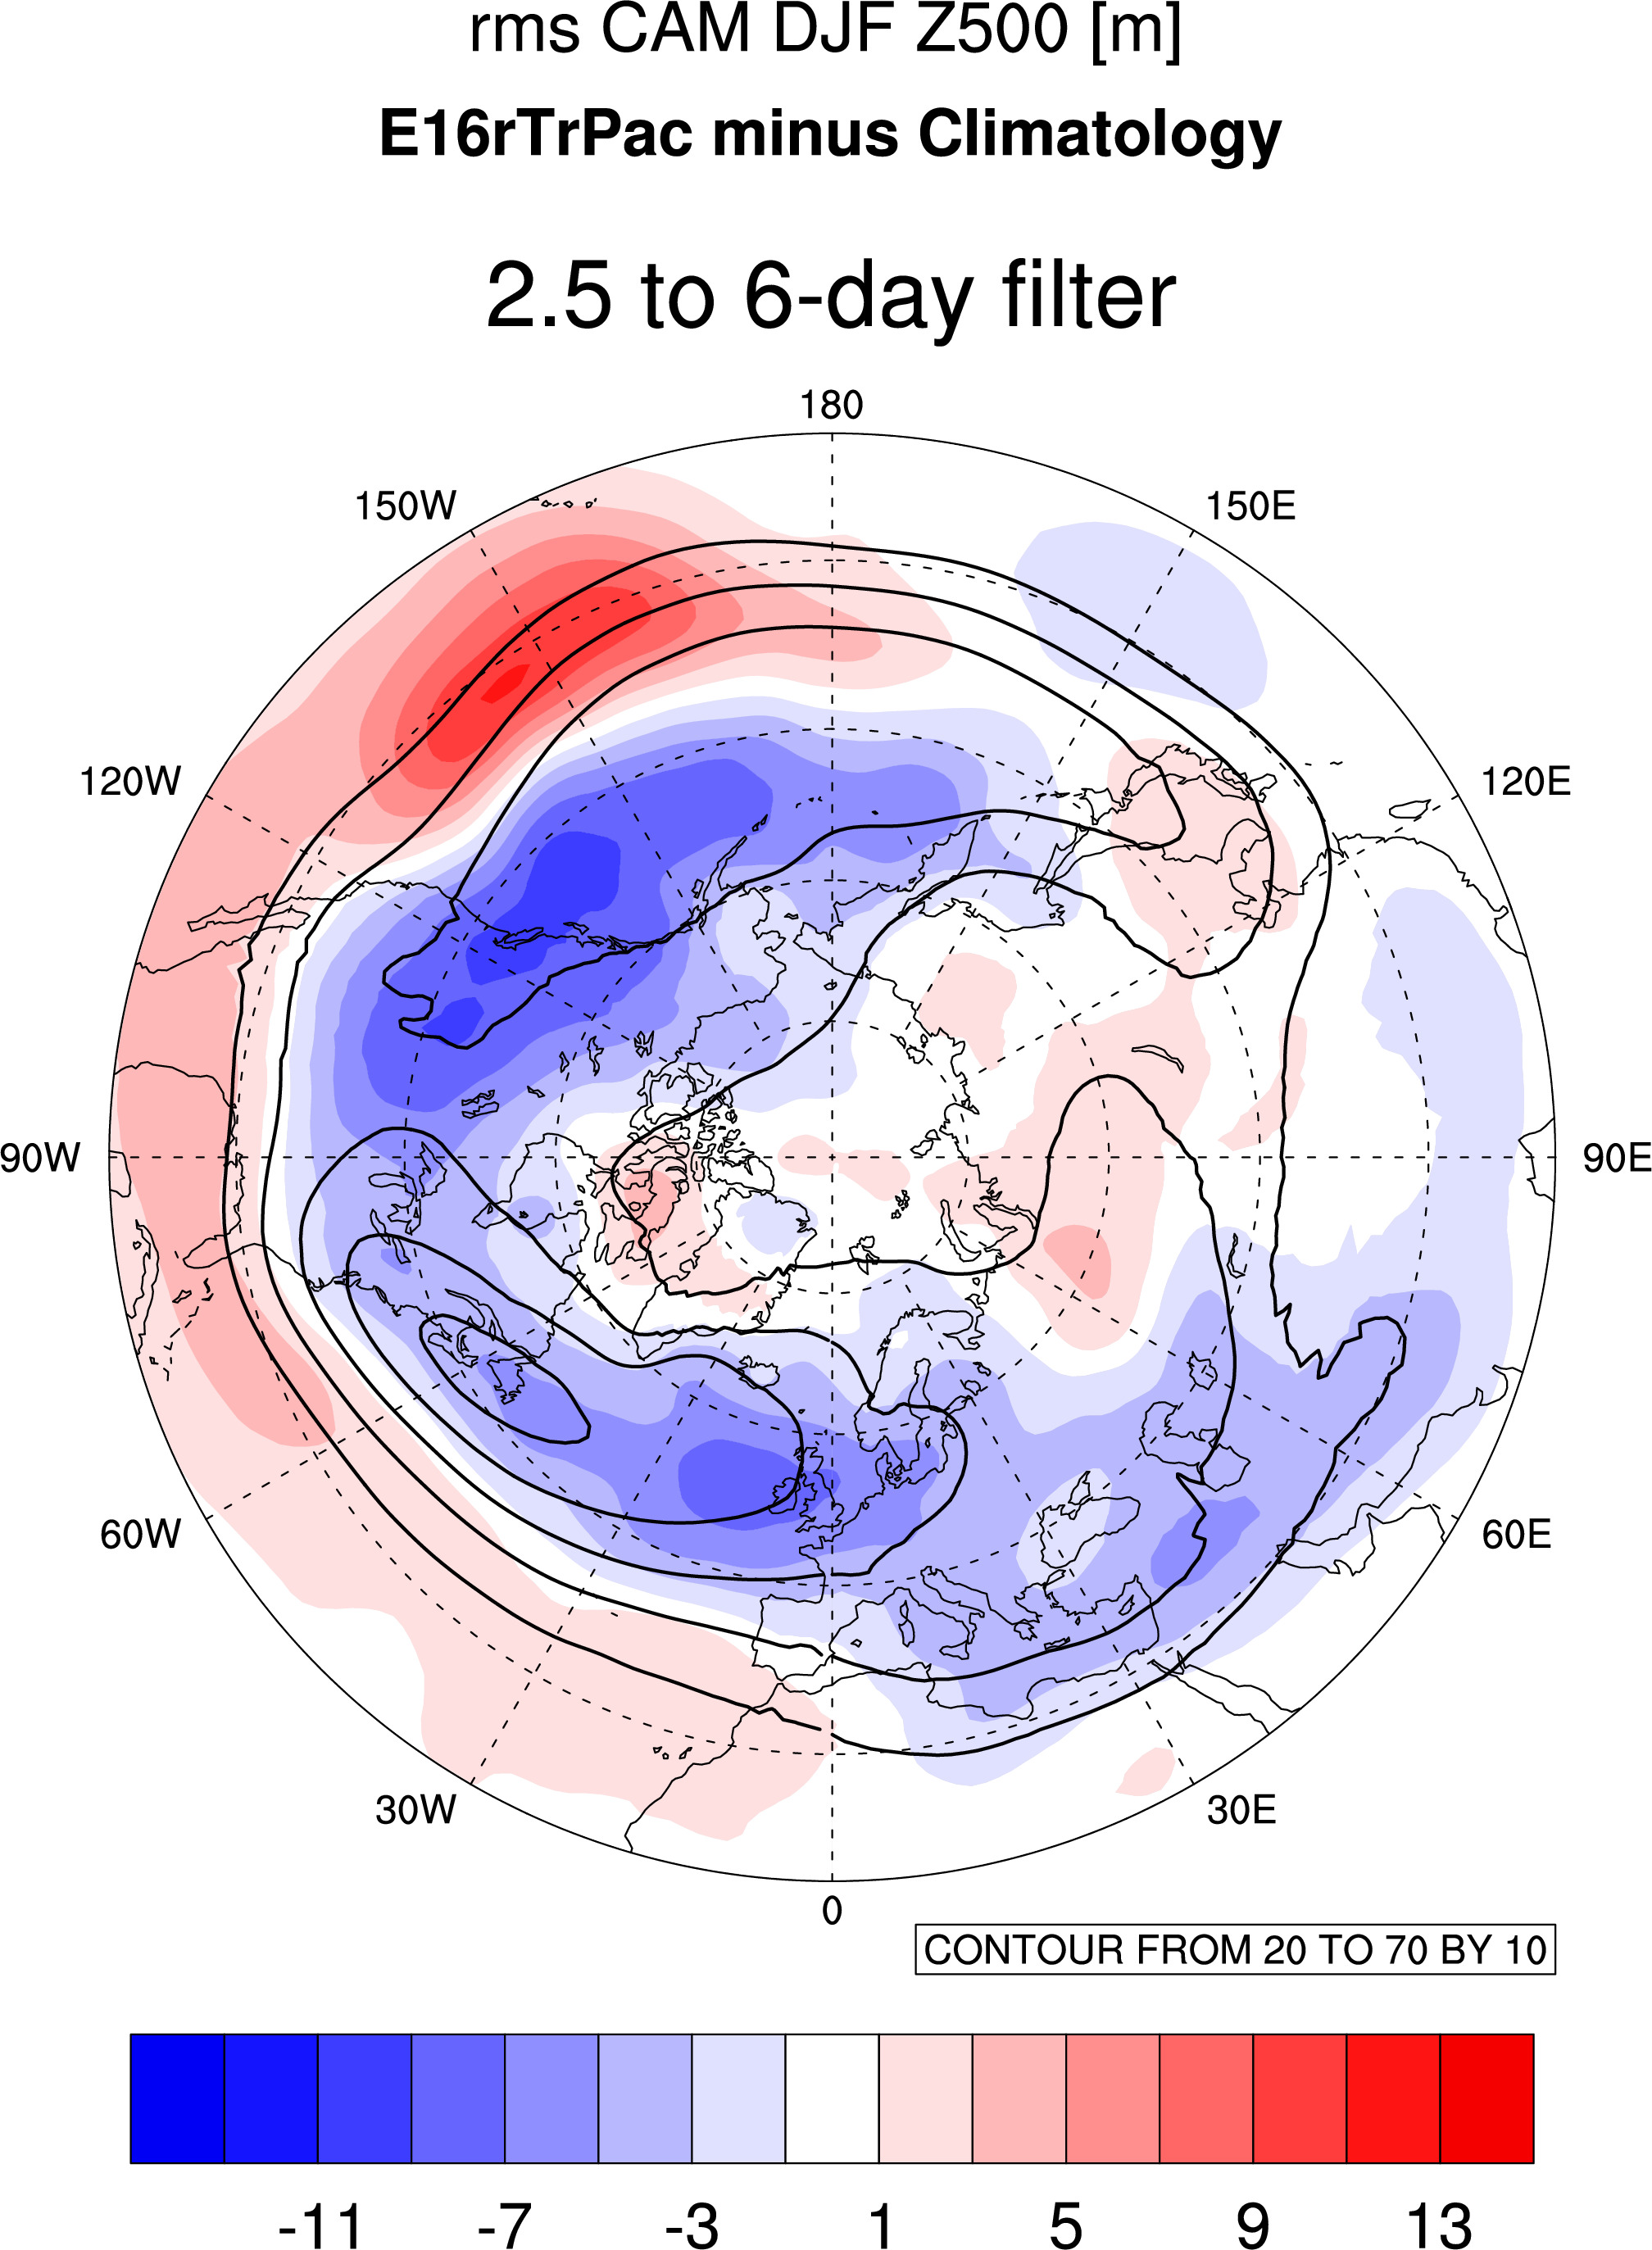
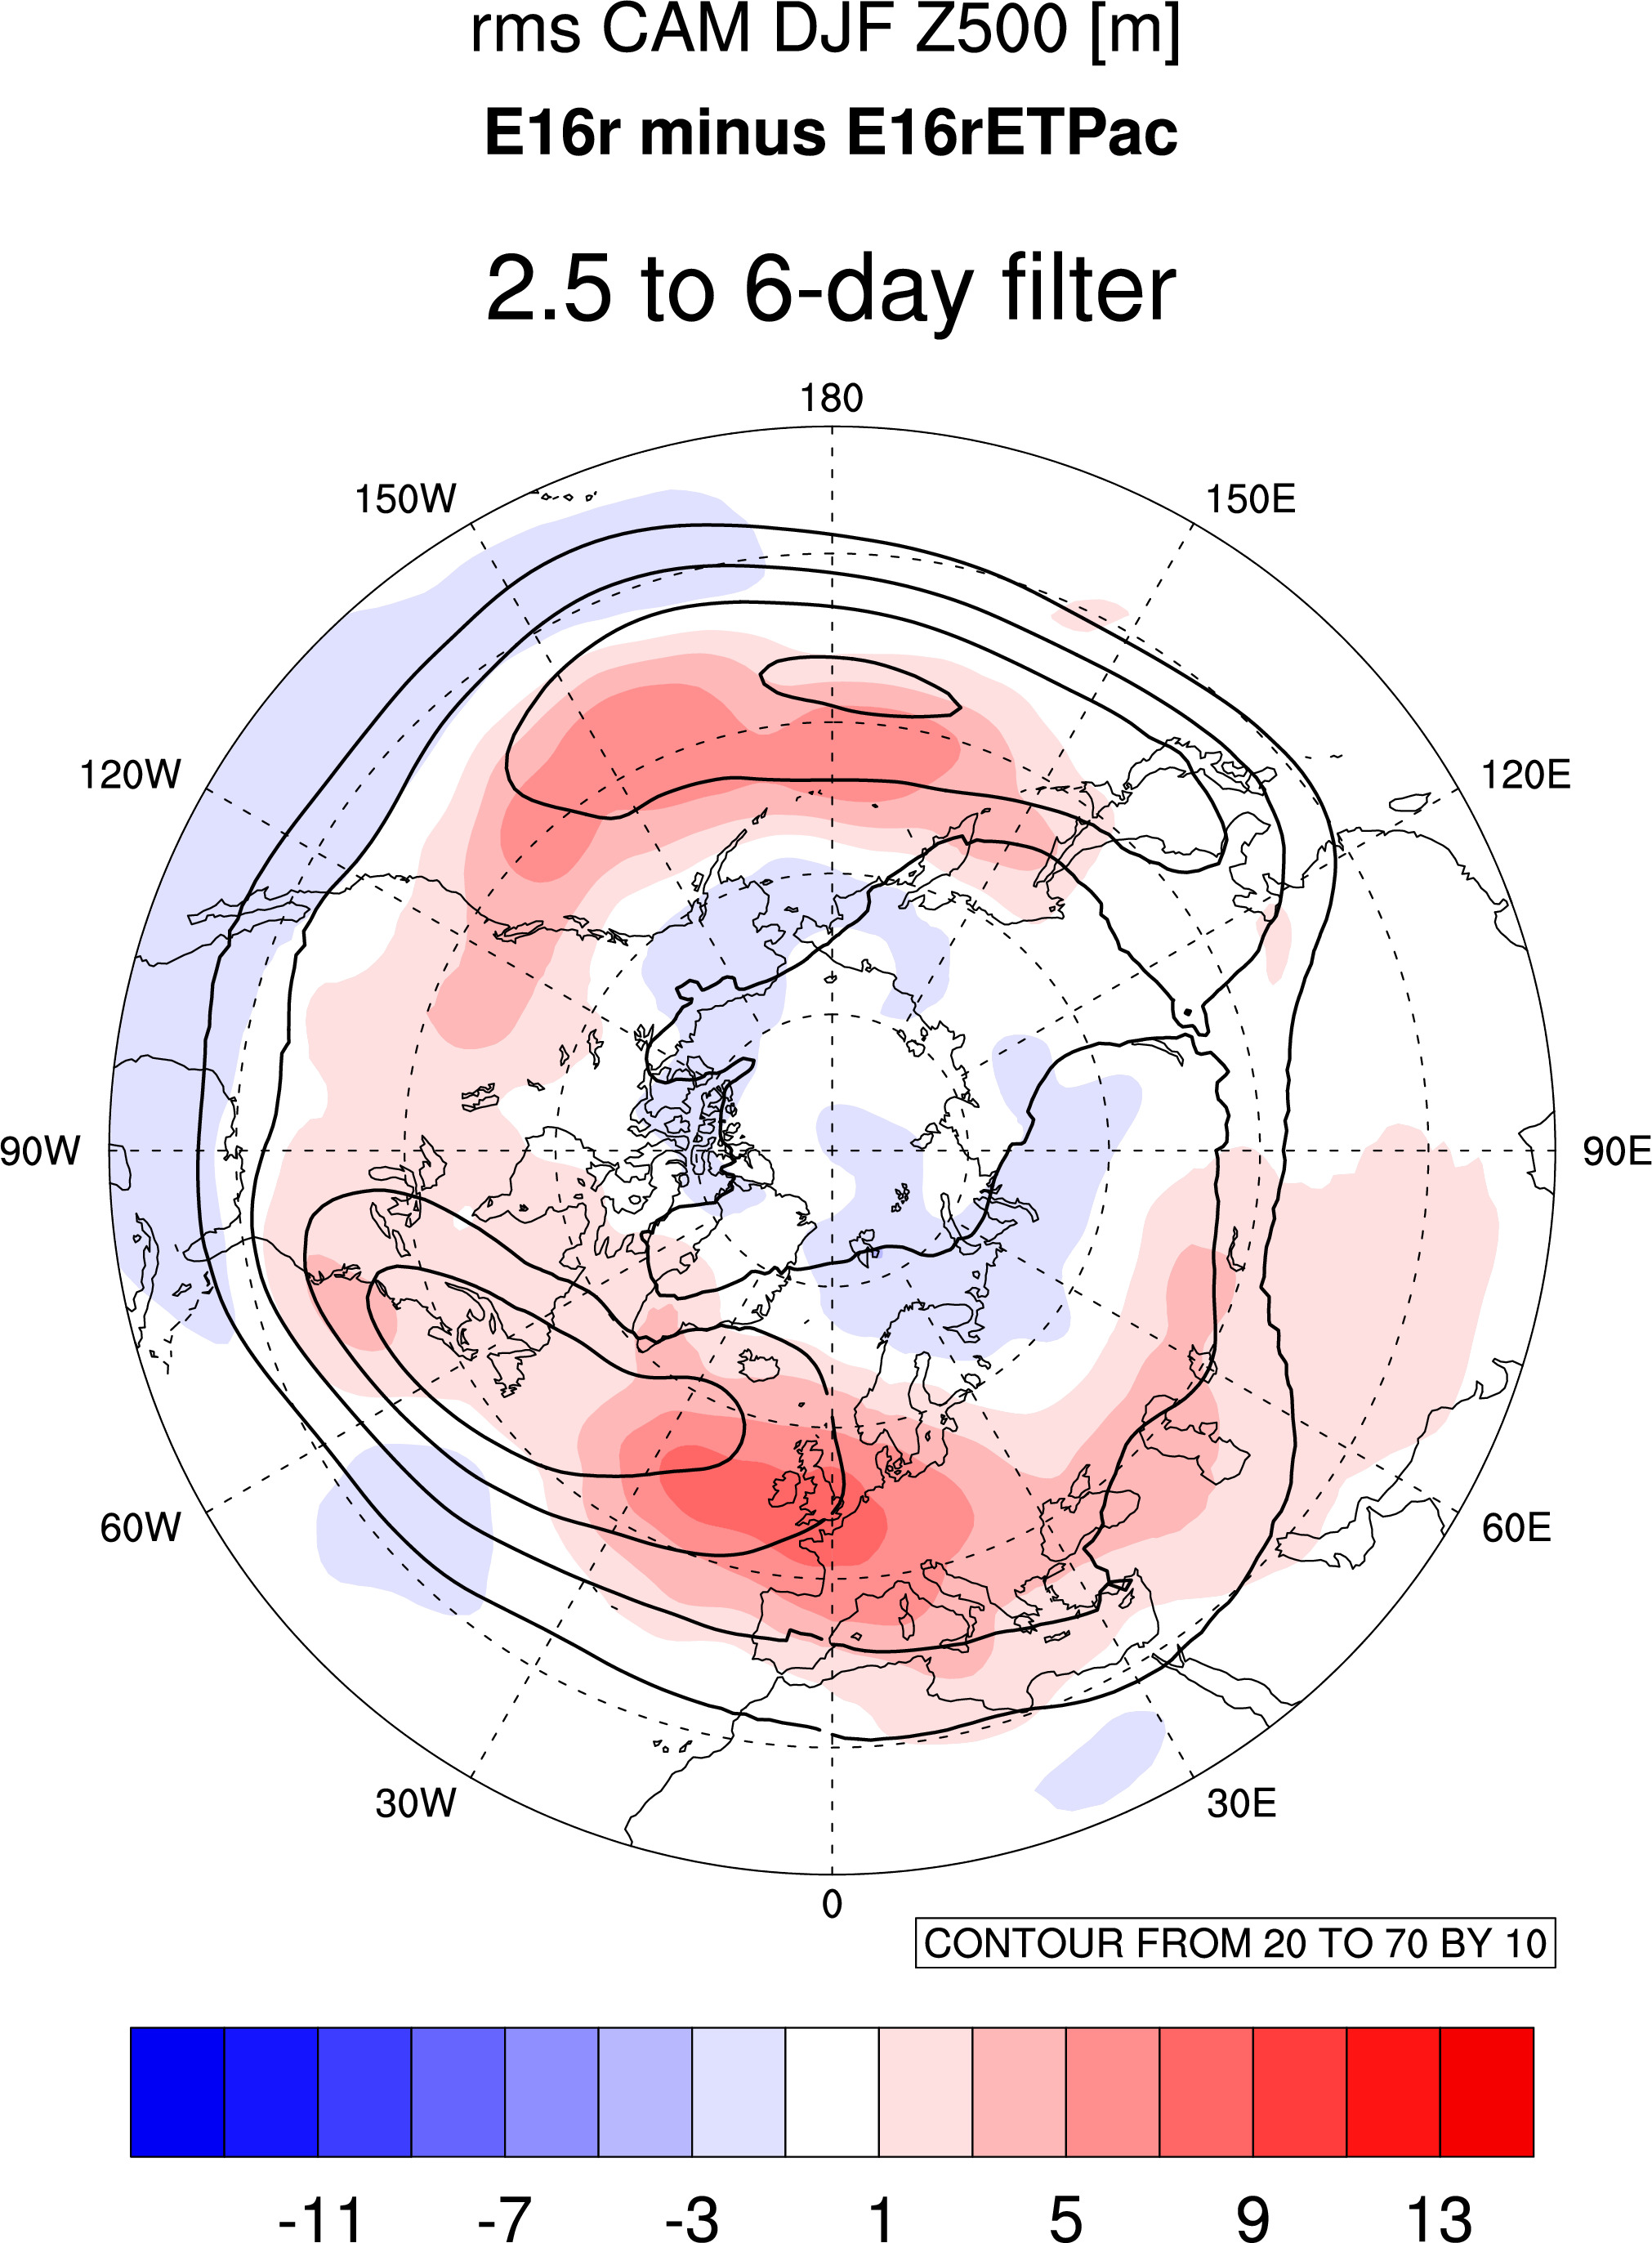
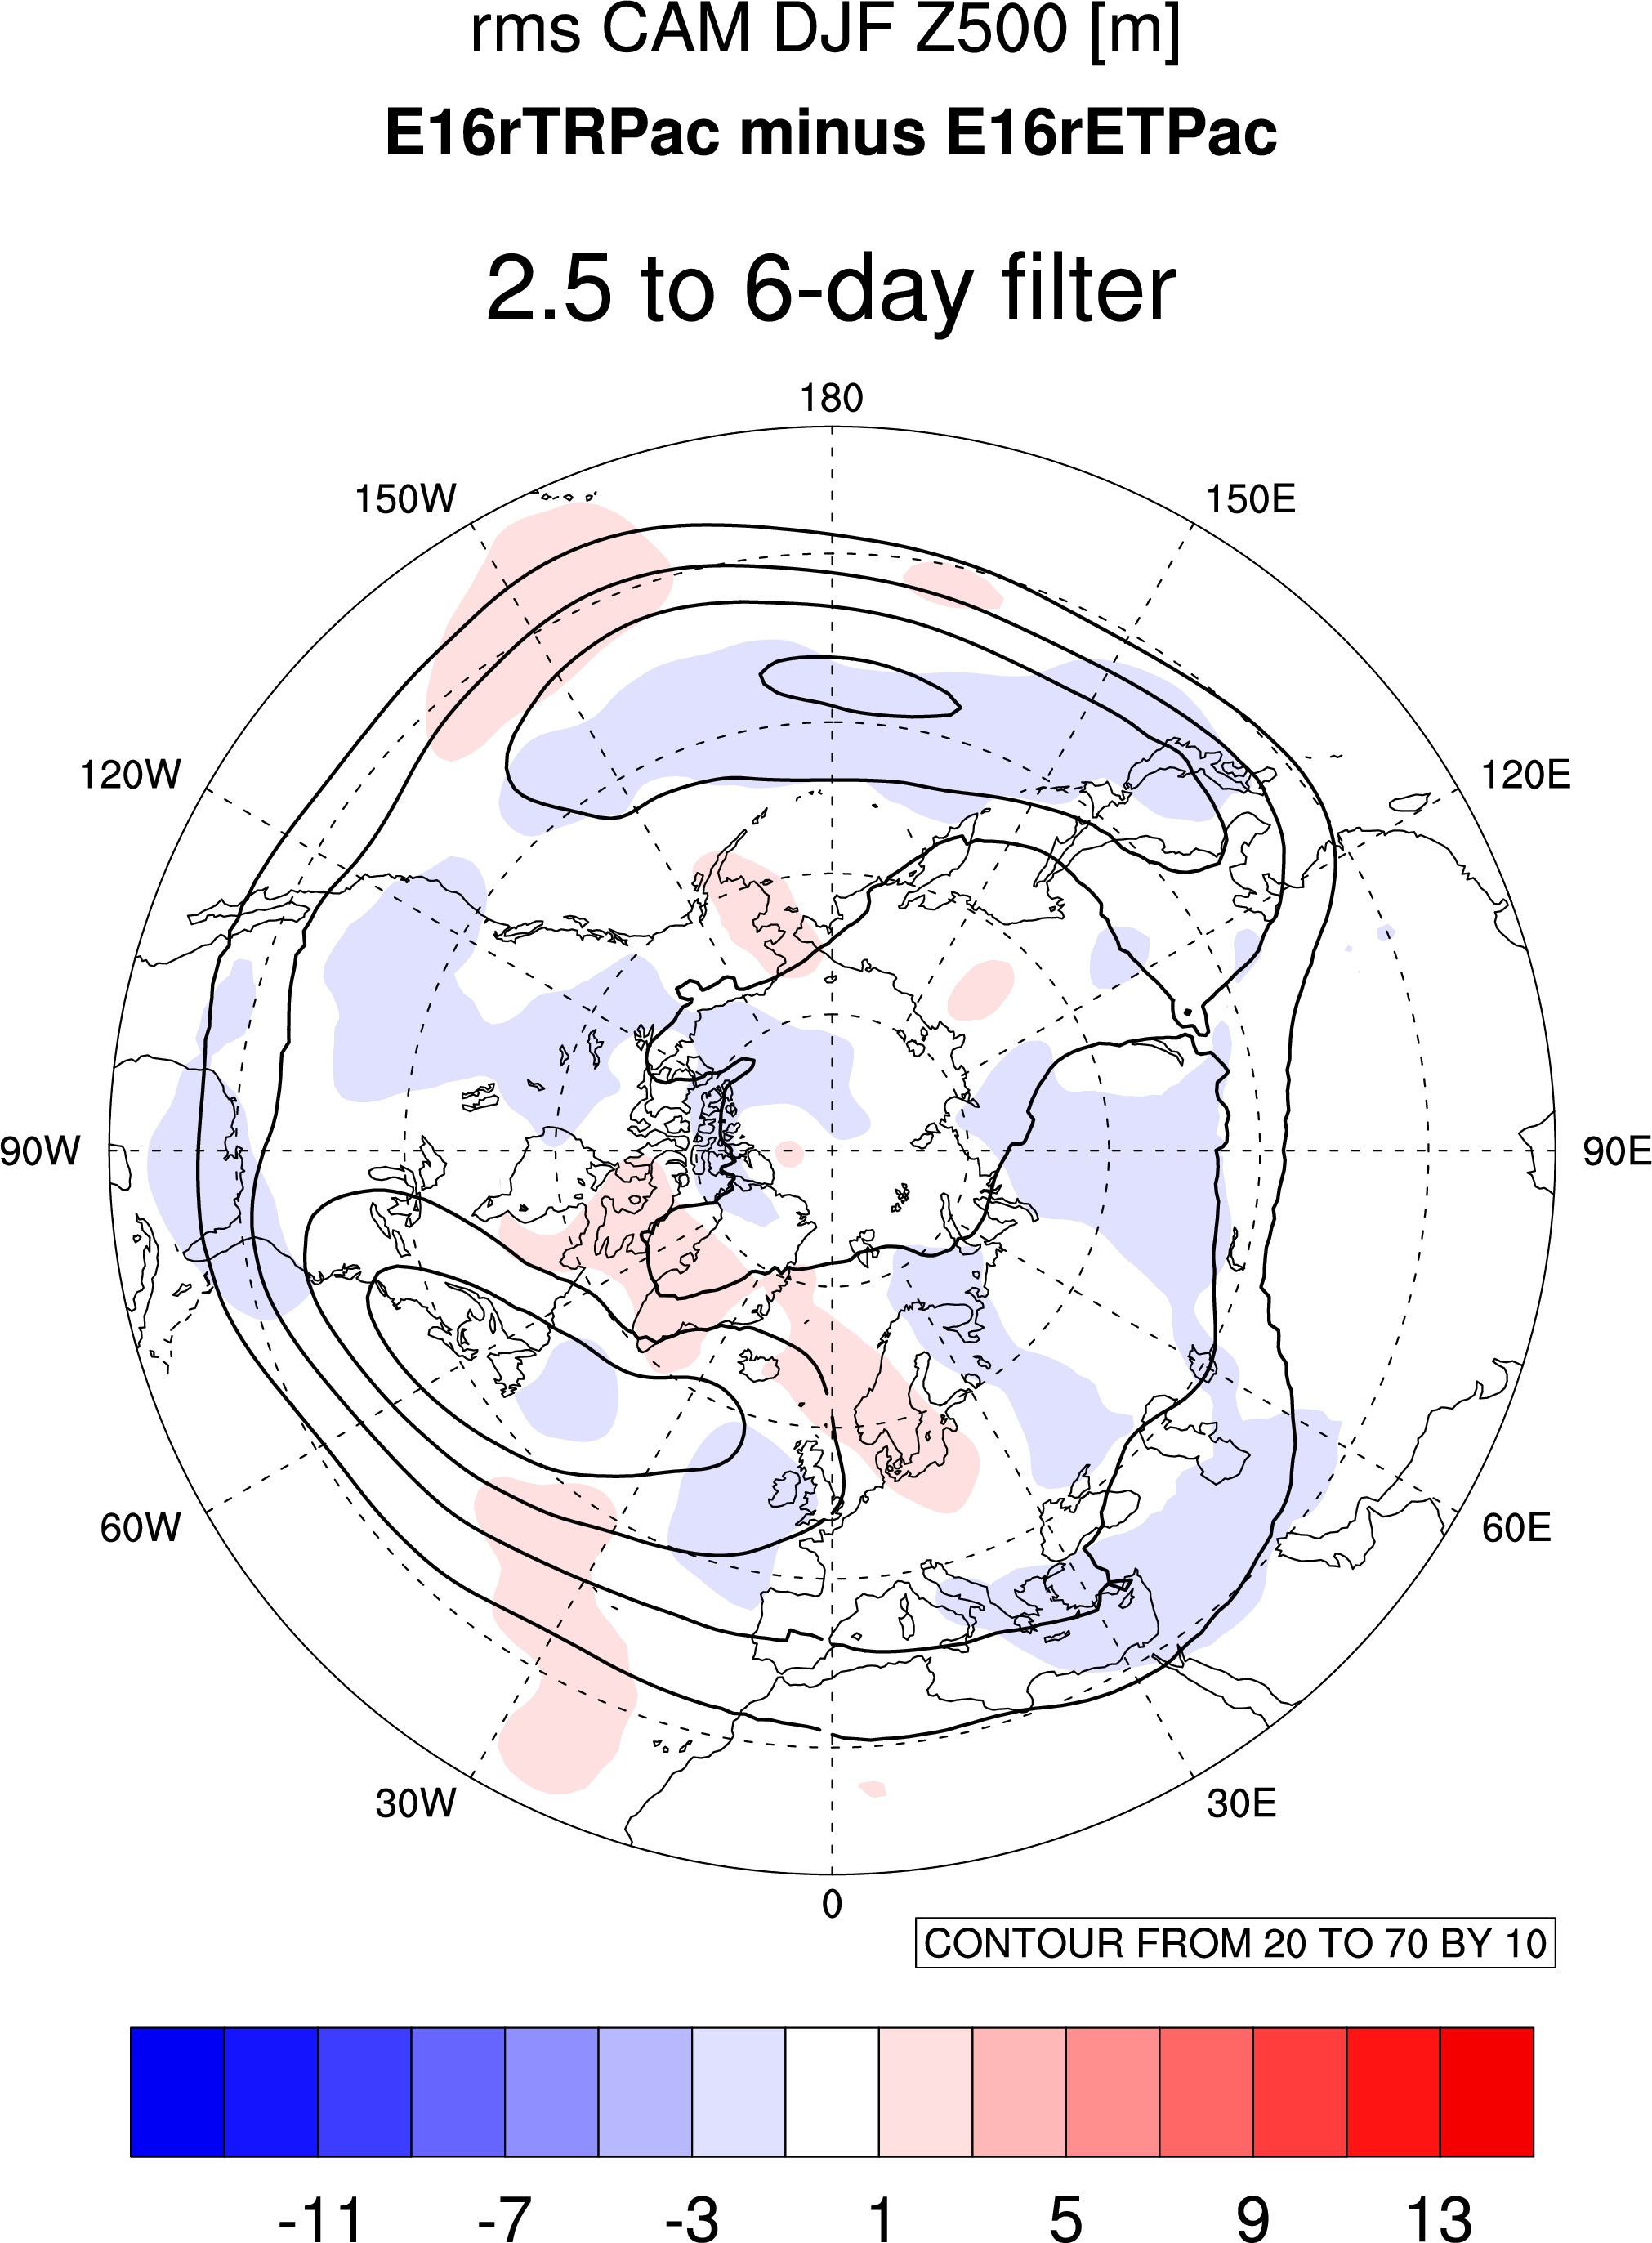
Comparing different runs:
Comparing to Control runs:
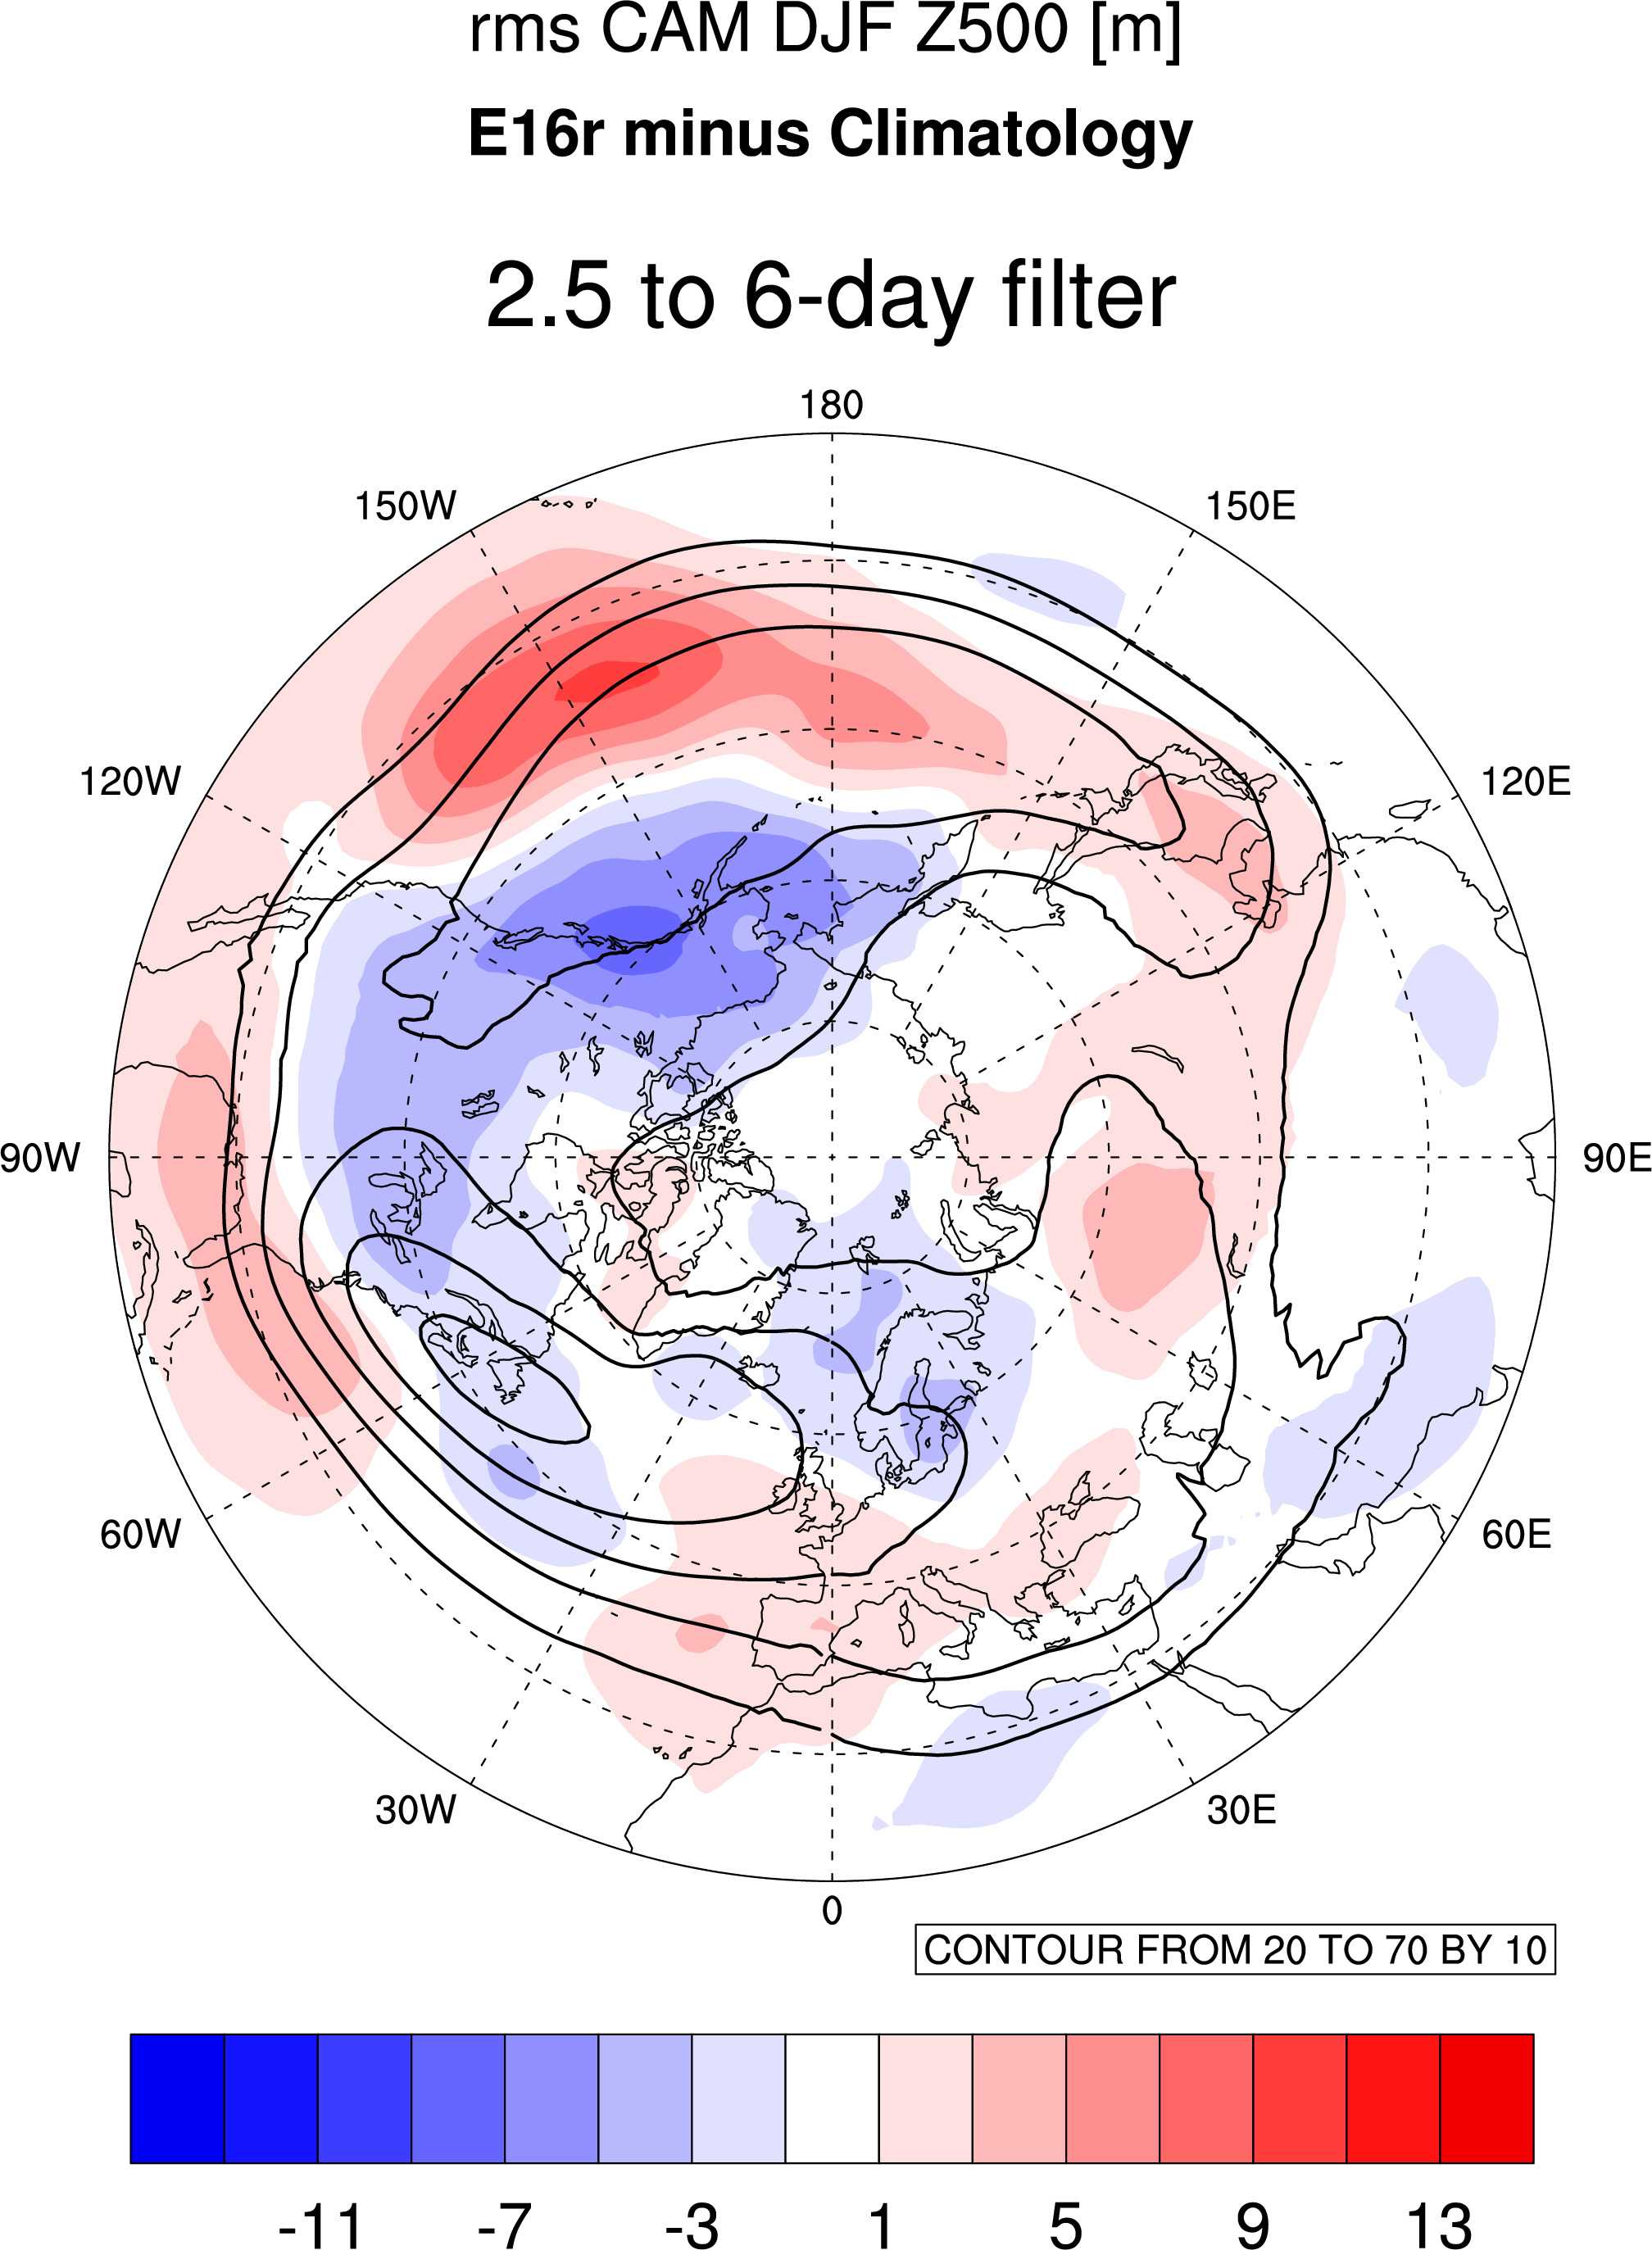
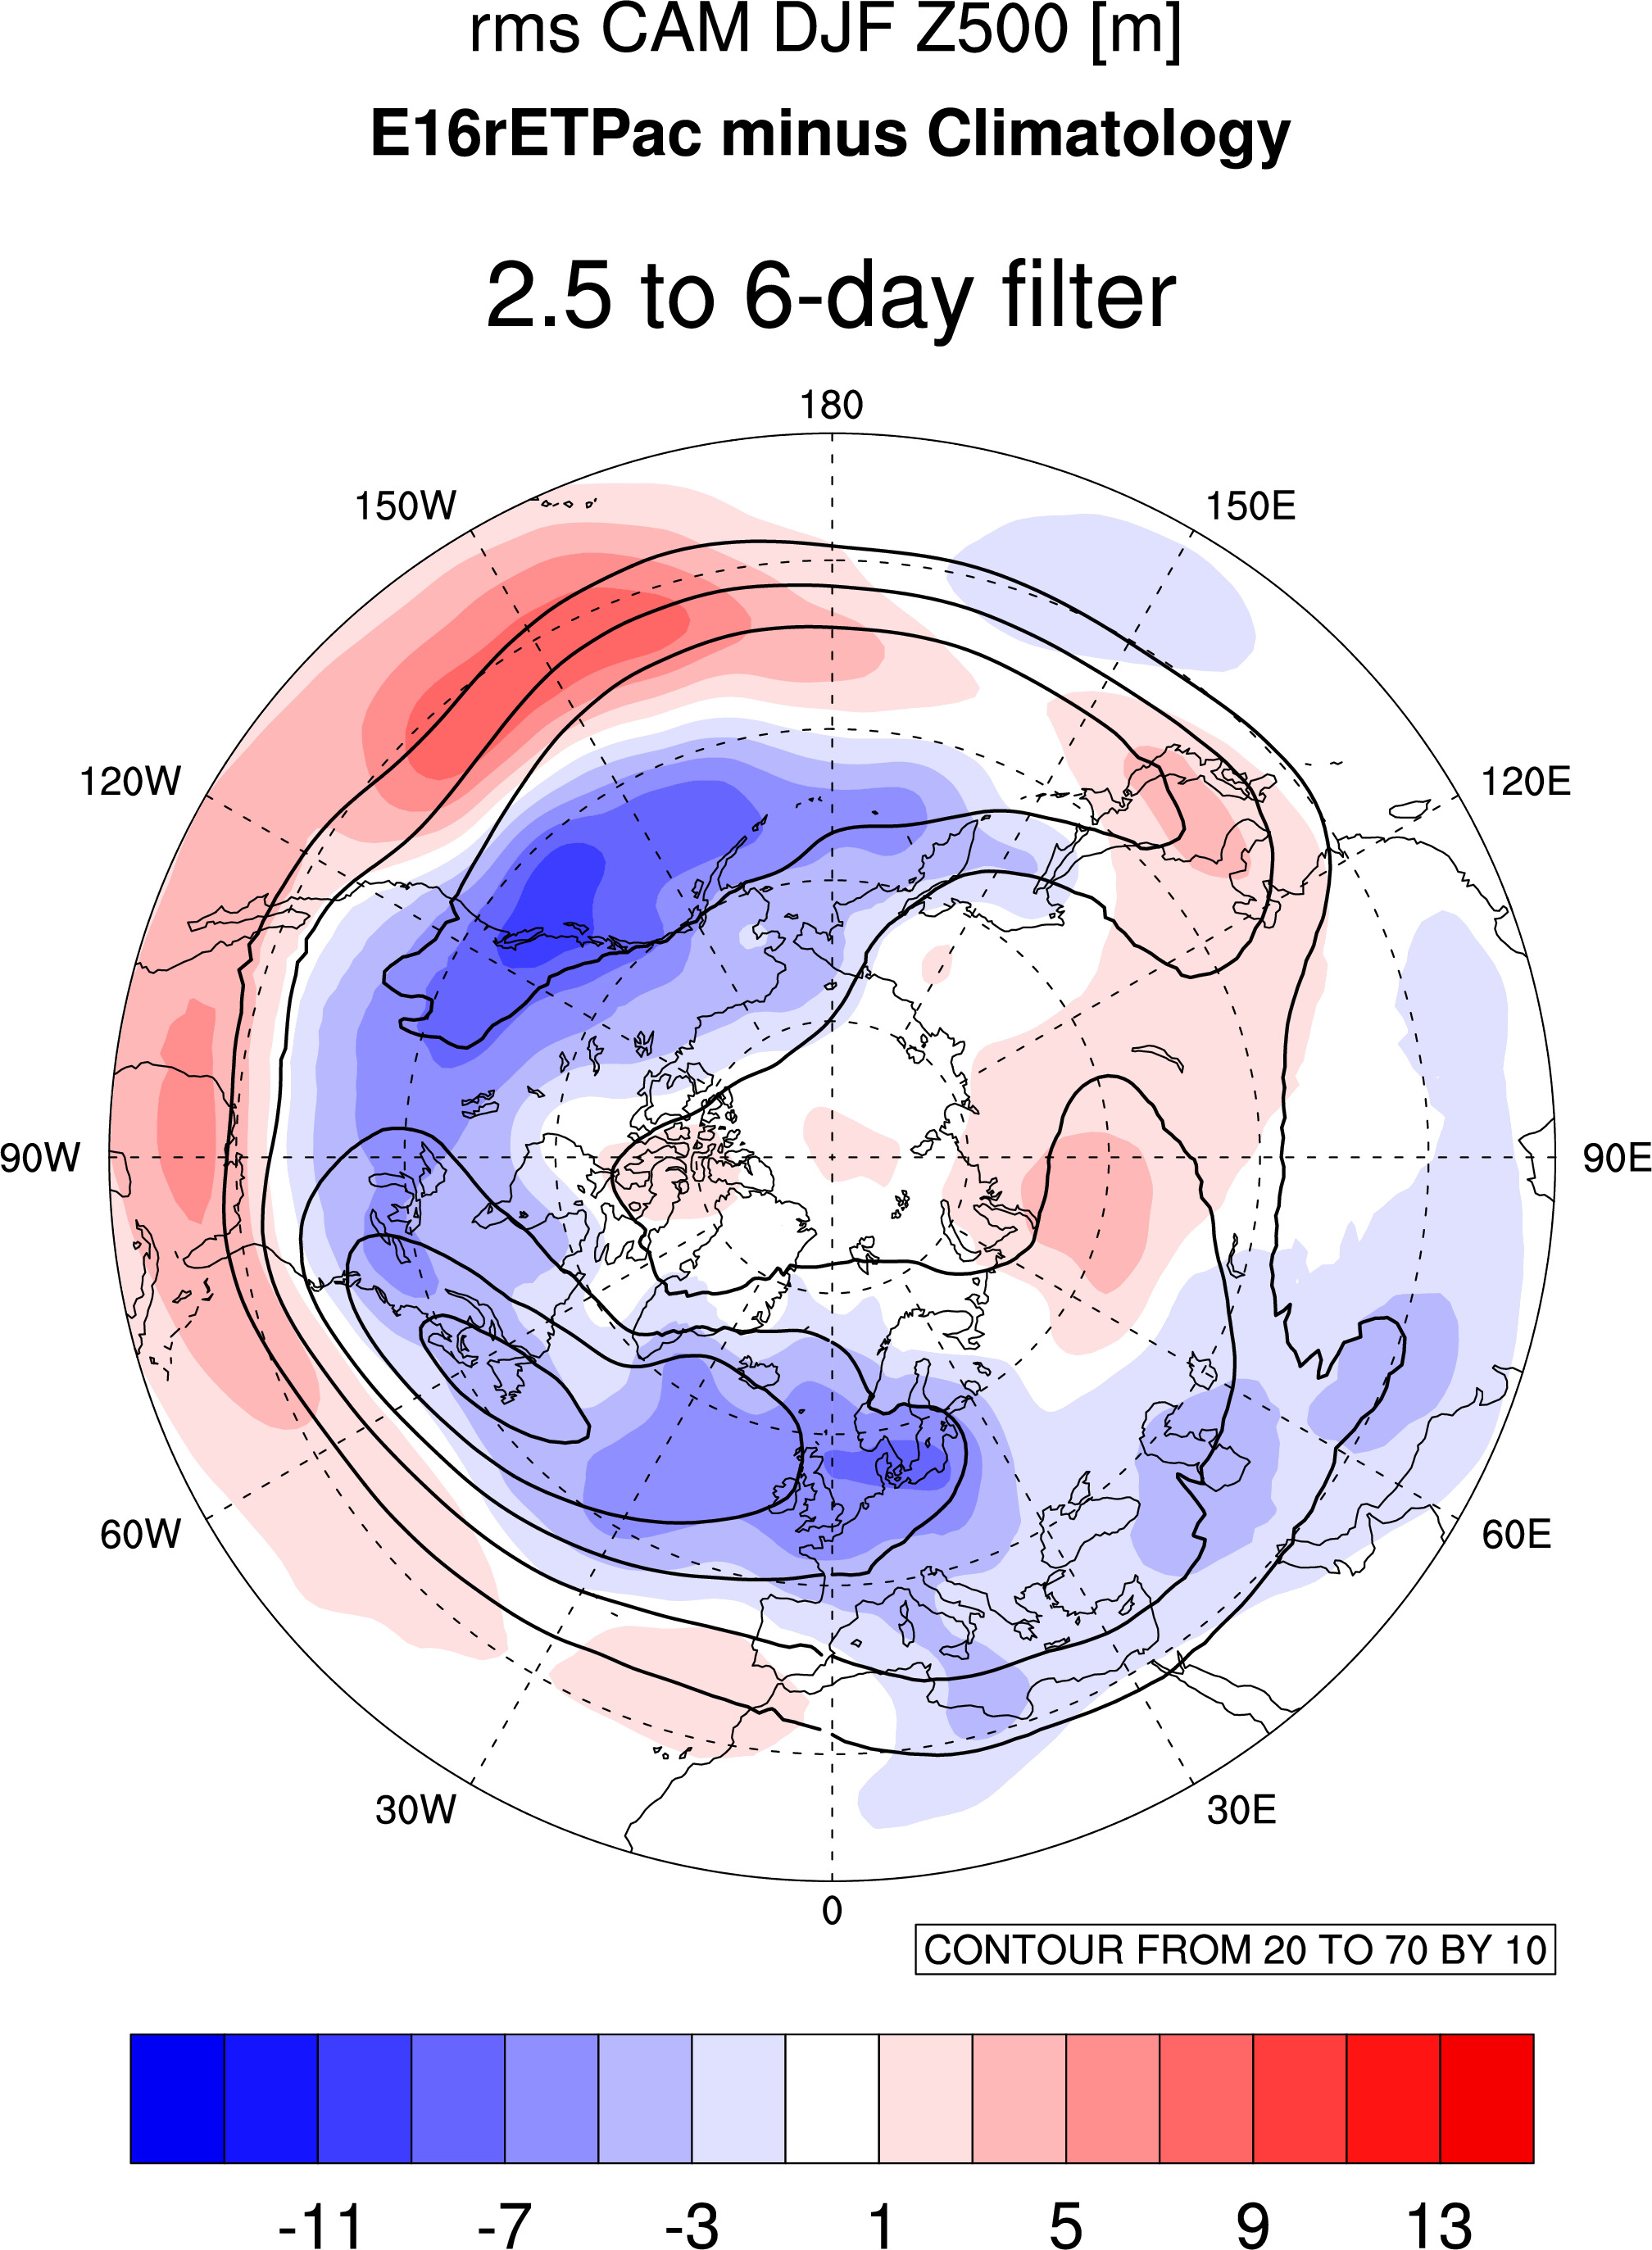
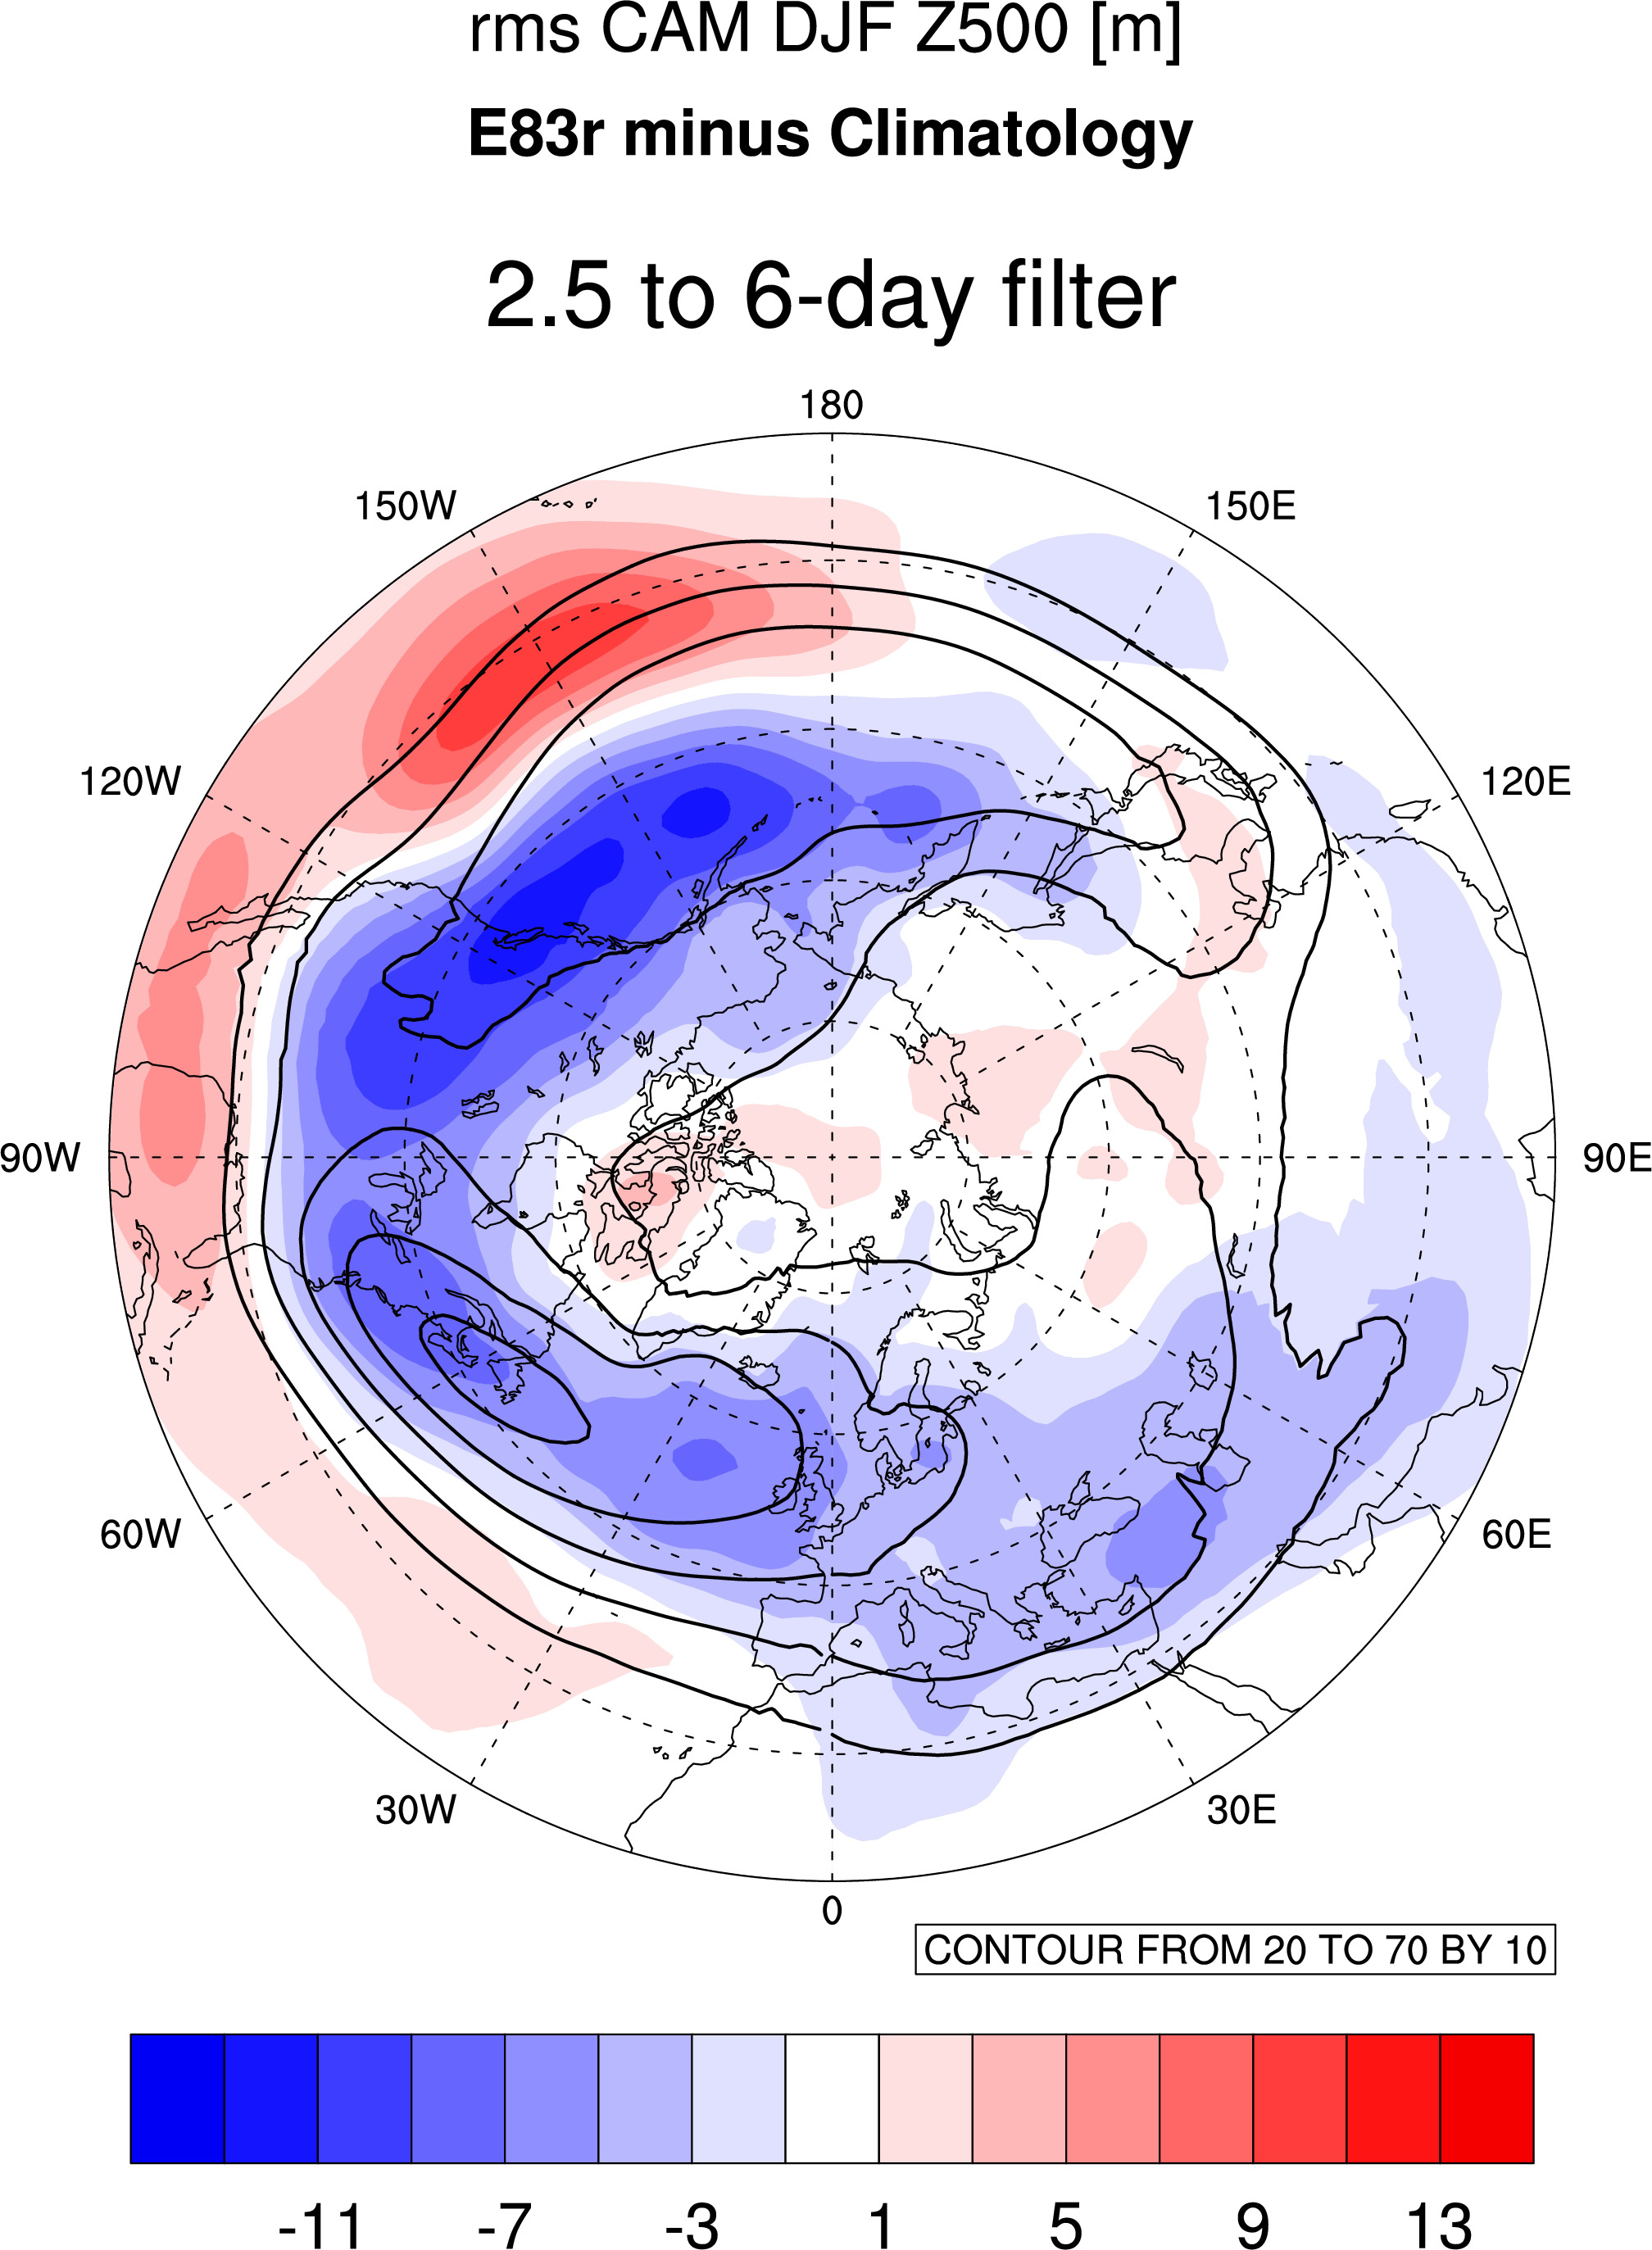
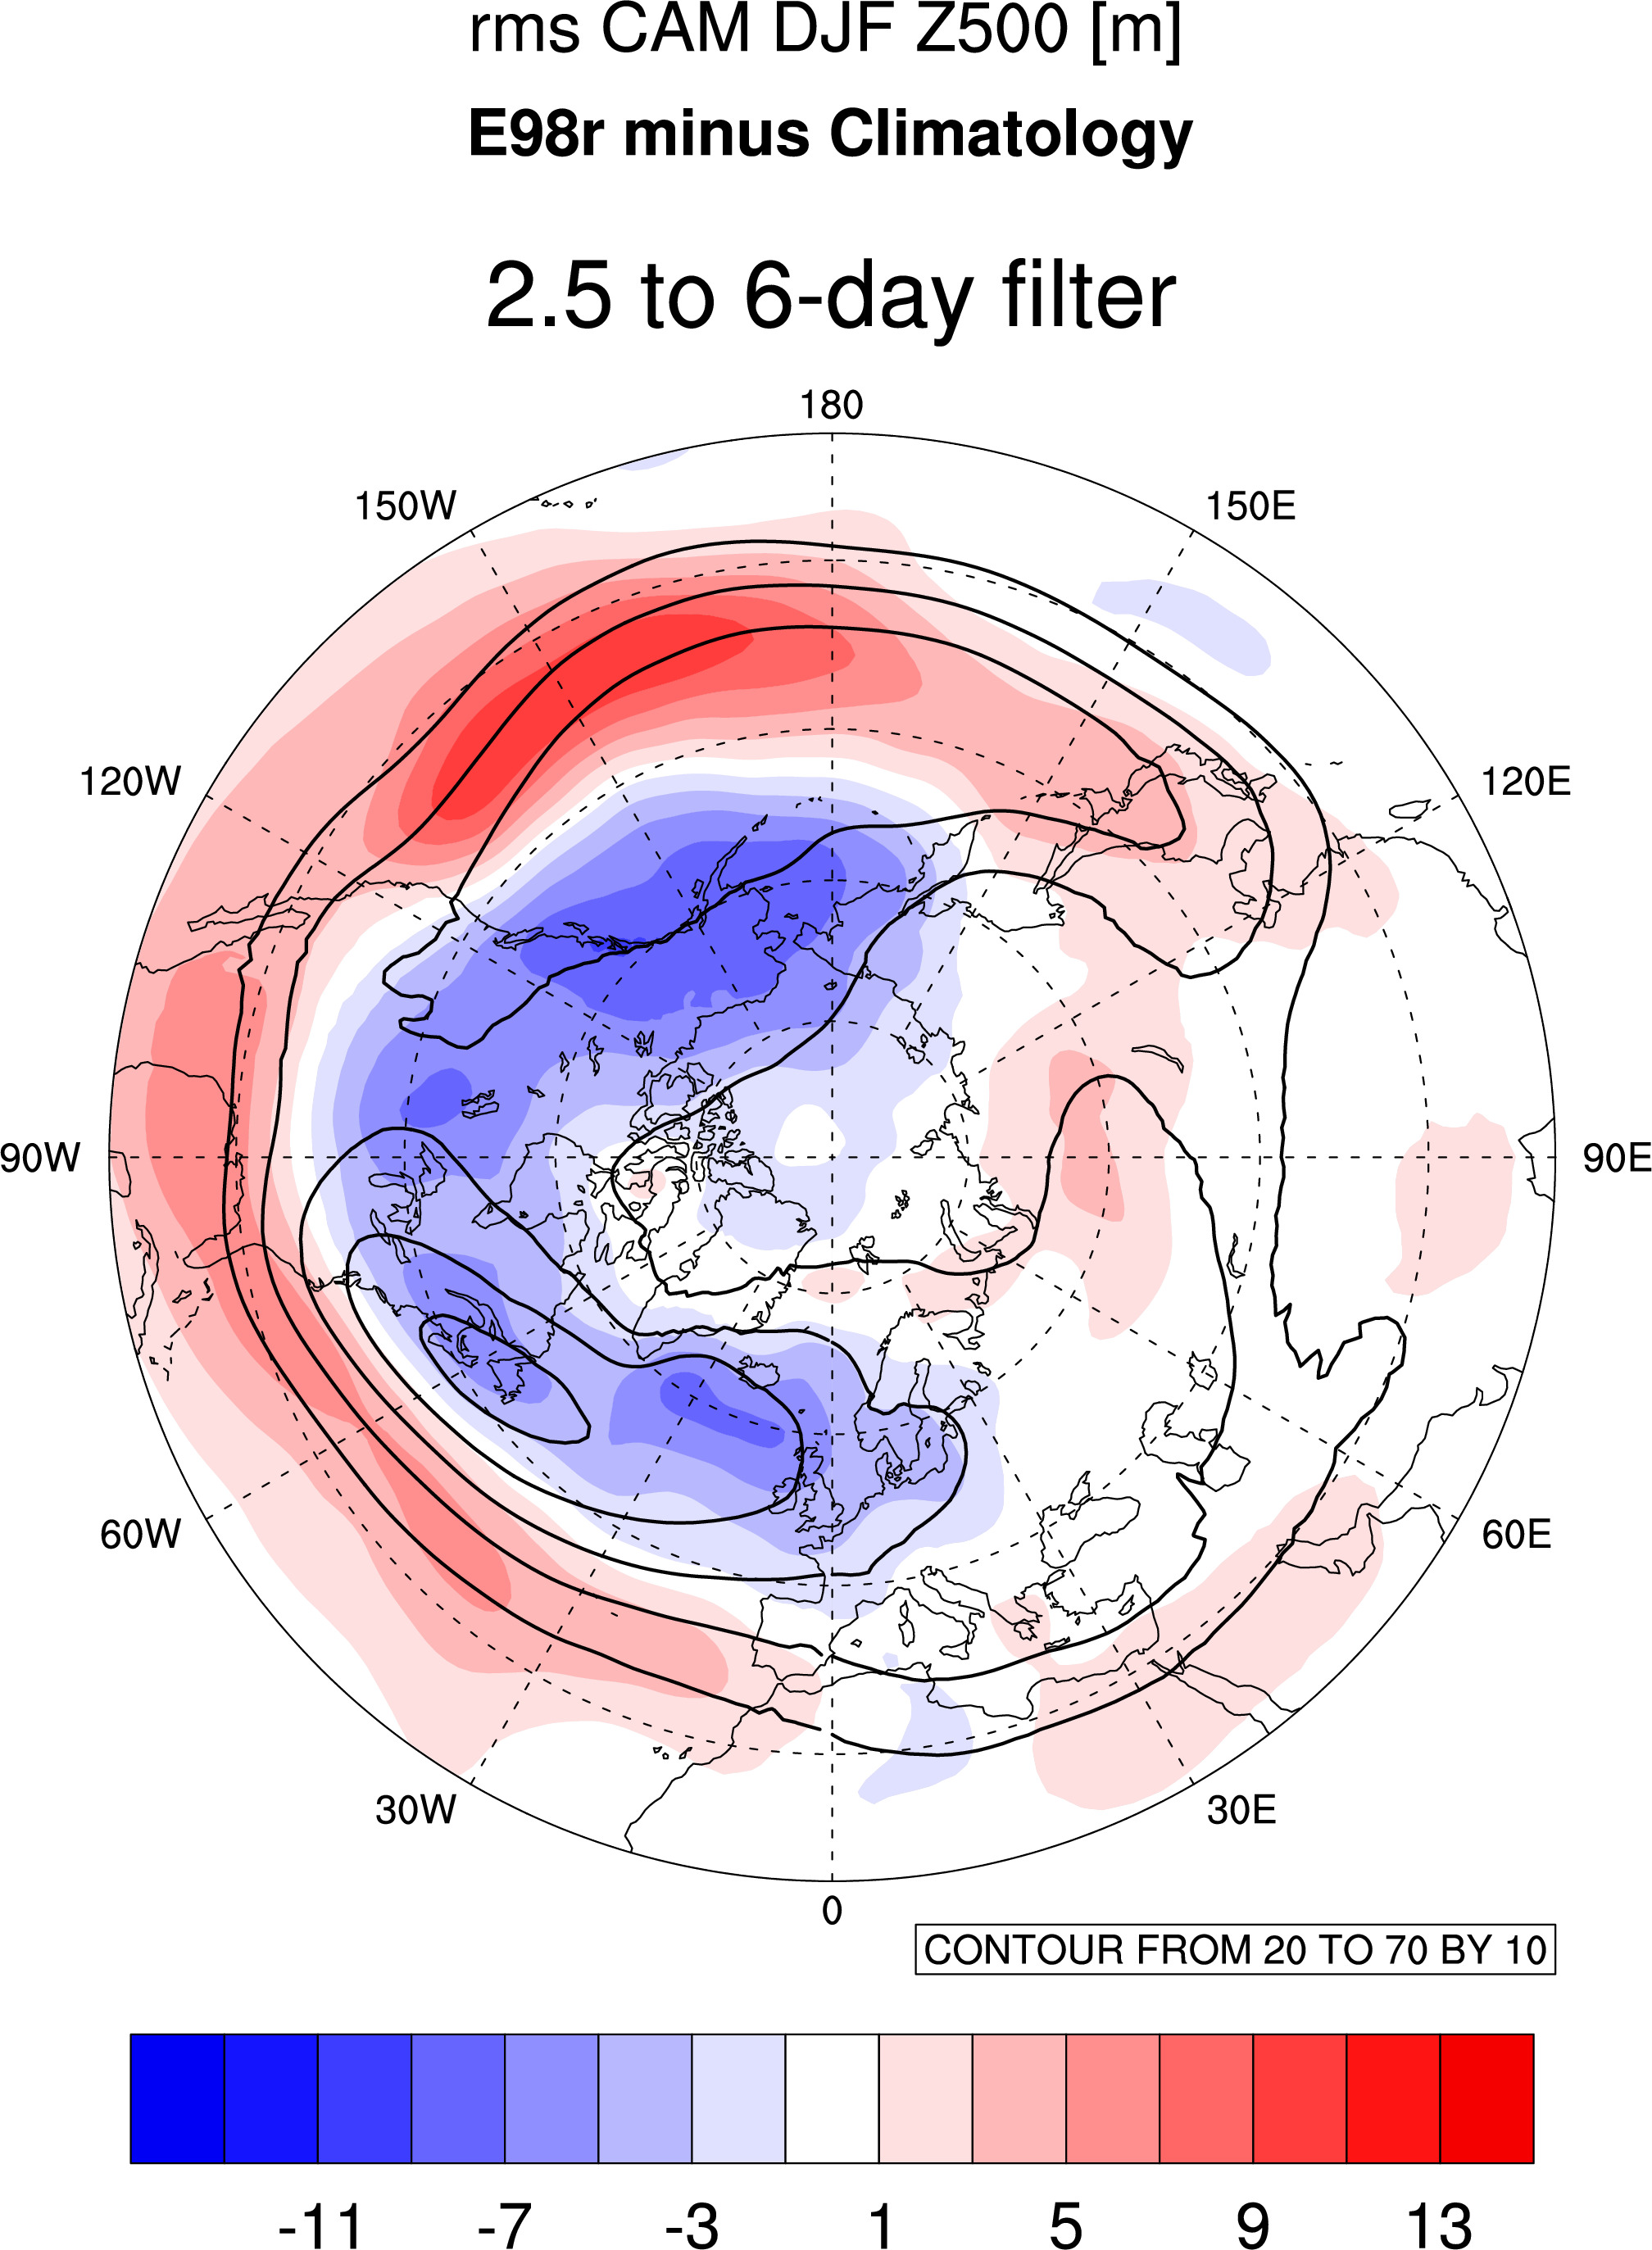
where contour lines above are climatology from Control Run.
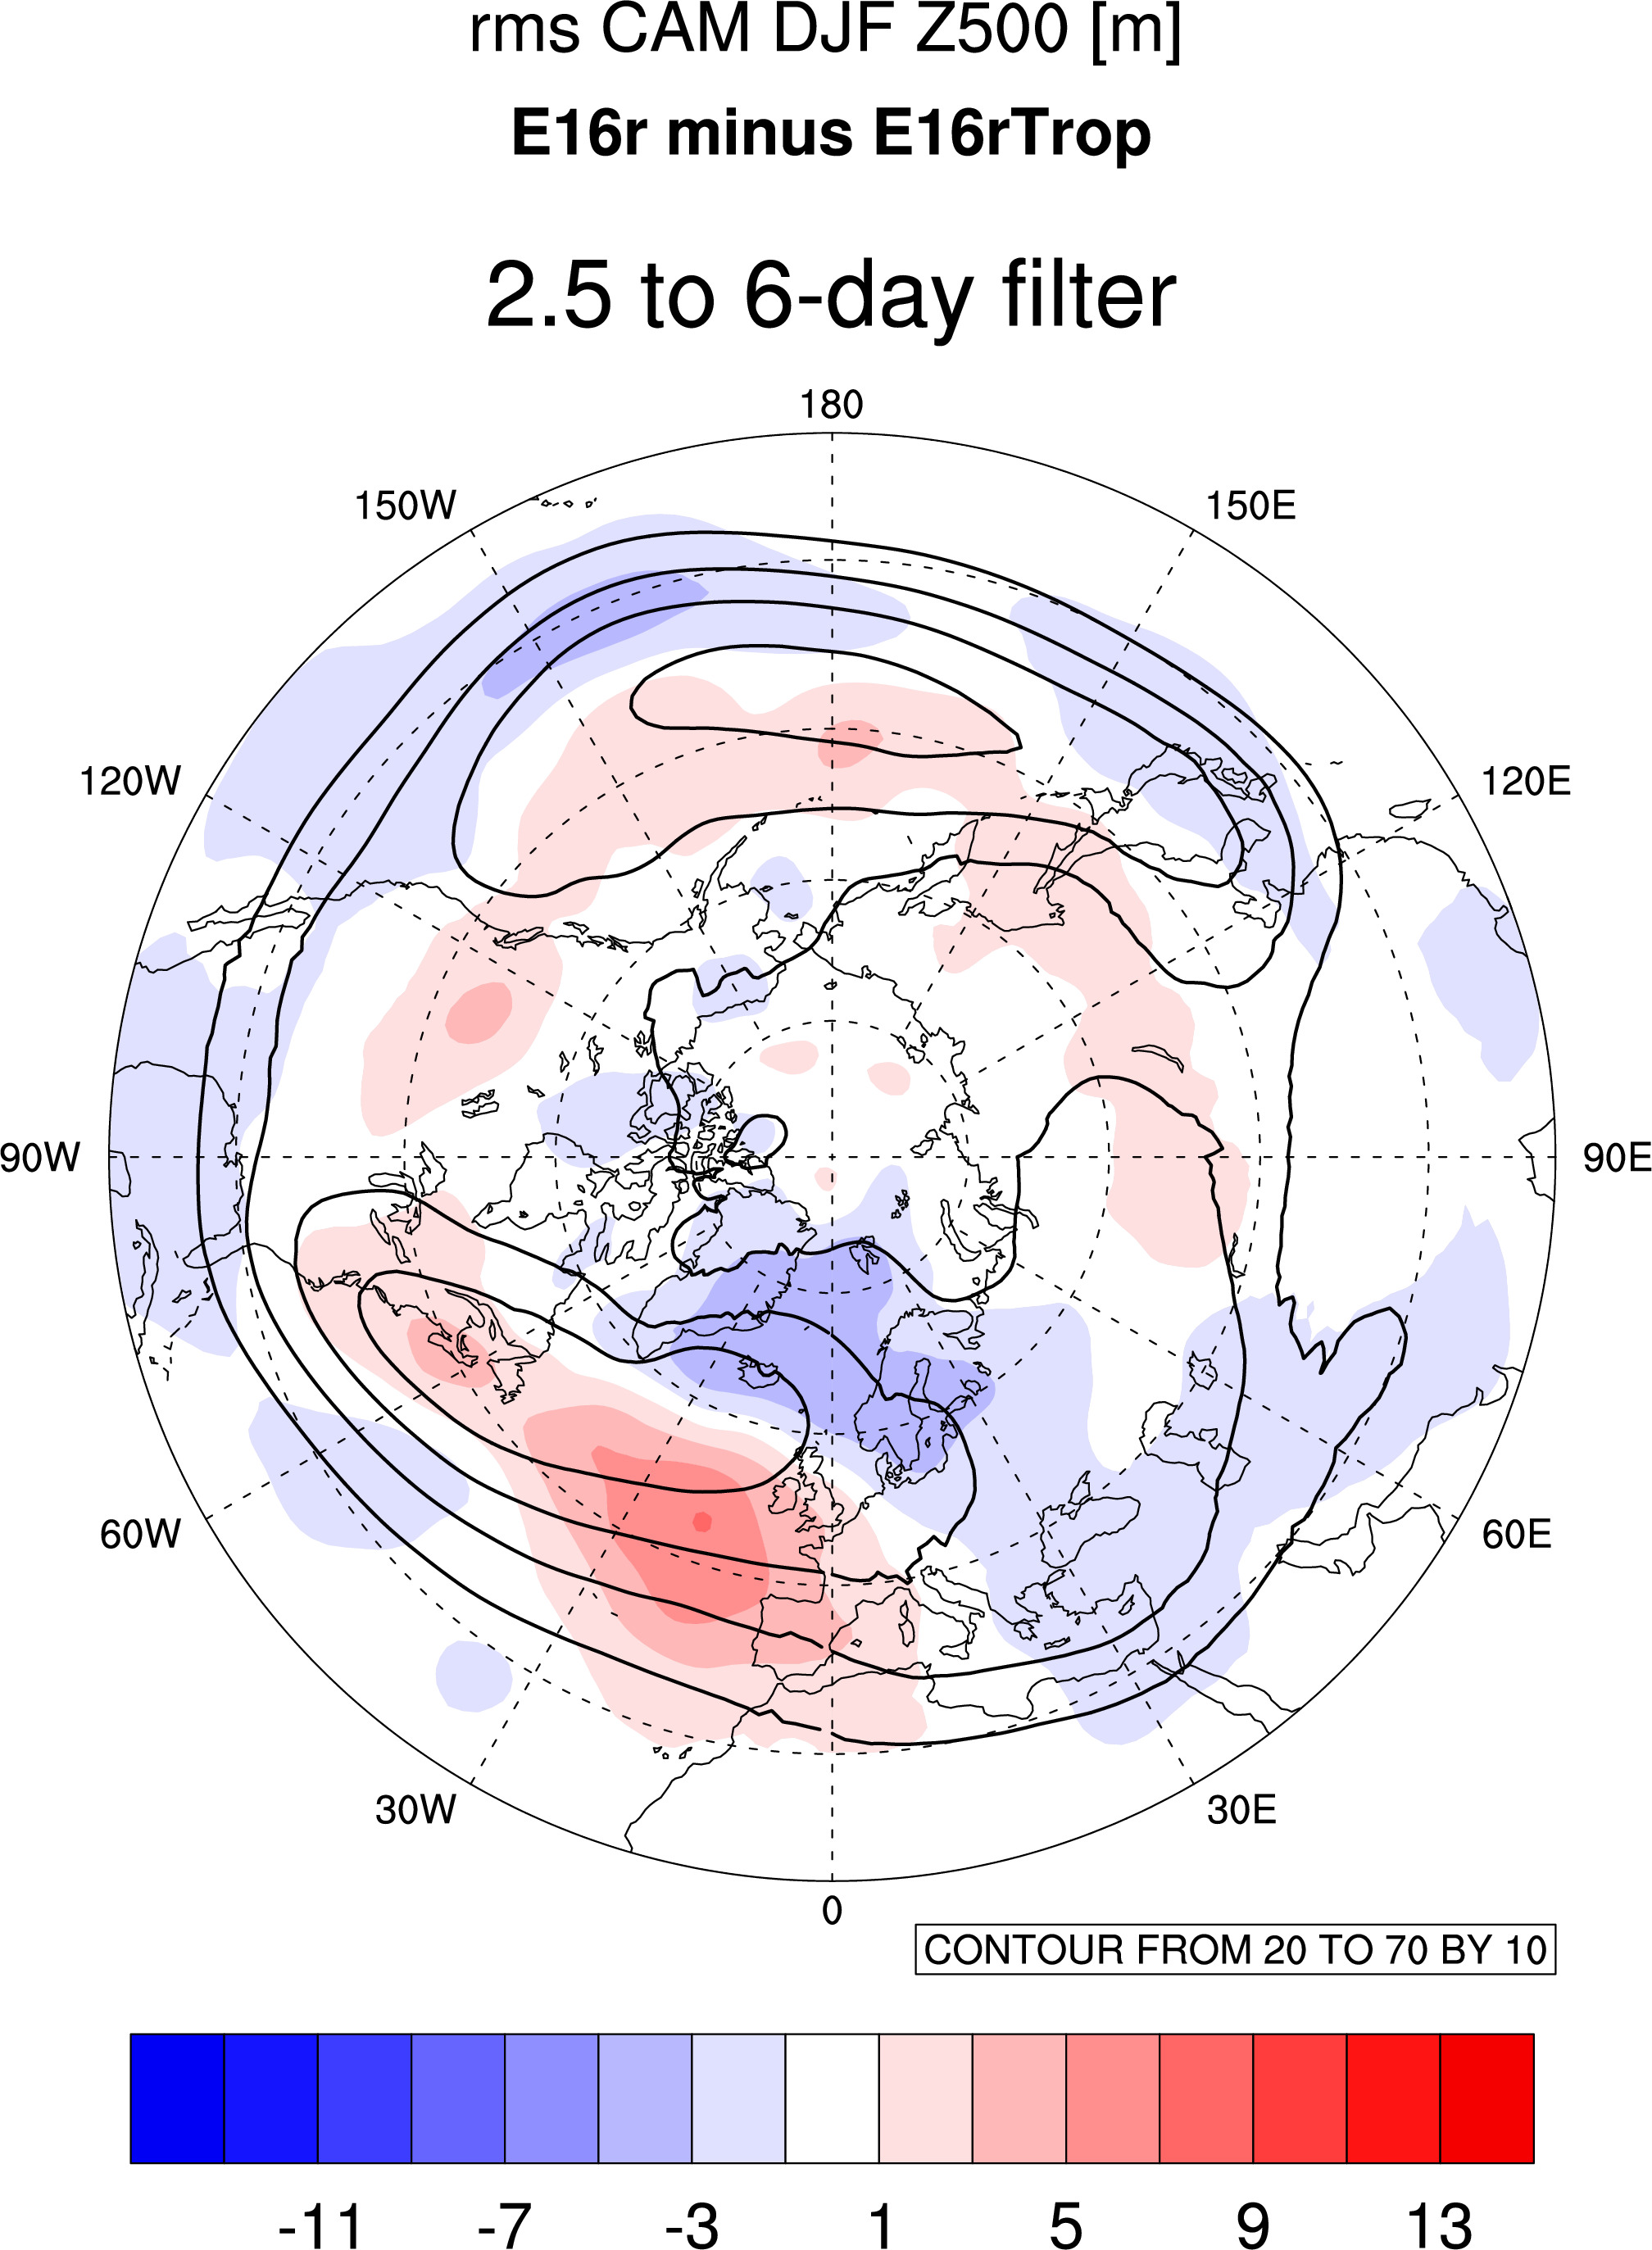
where contour lines above are E16rTrop.
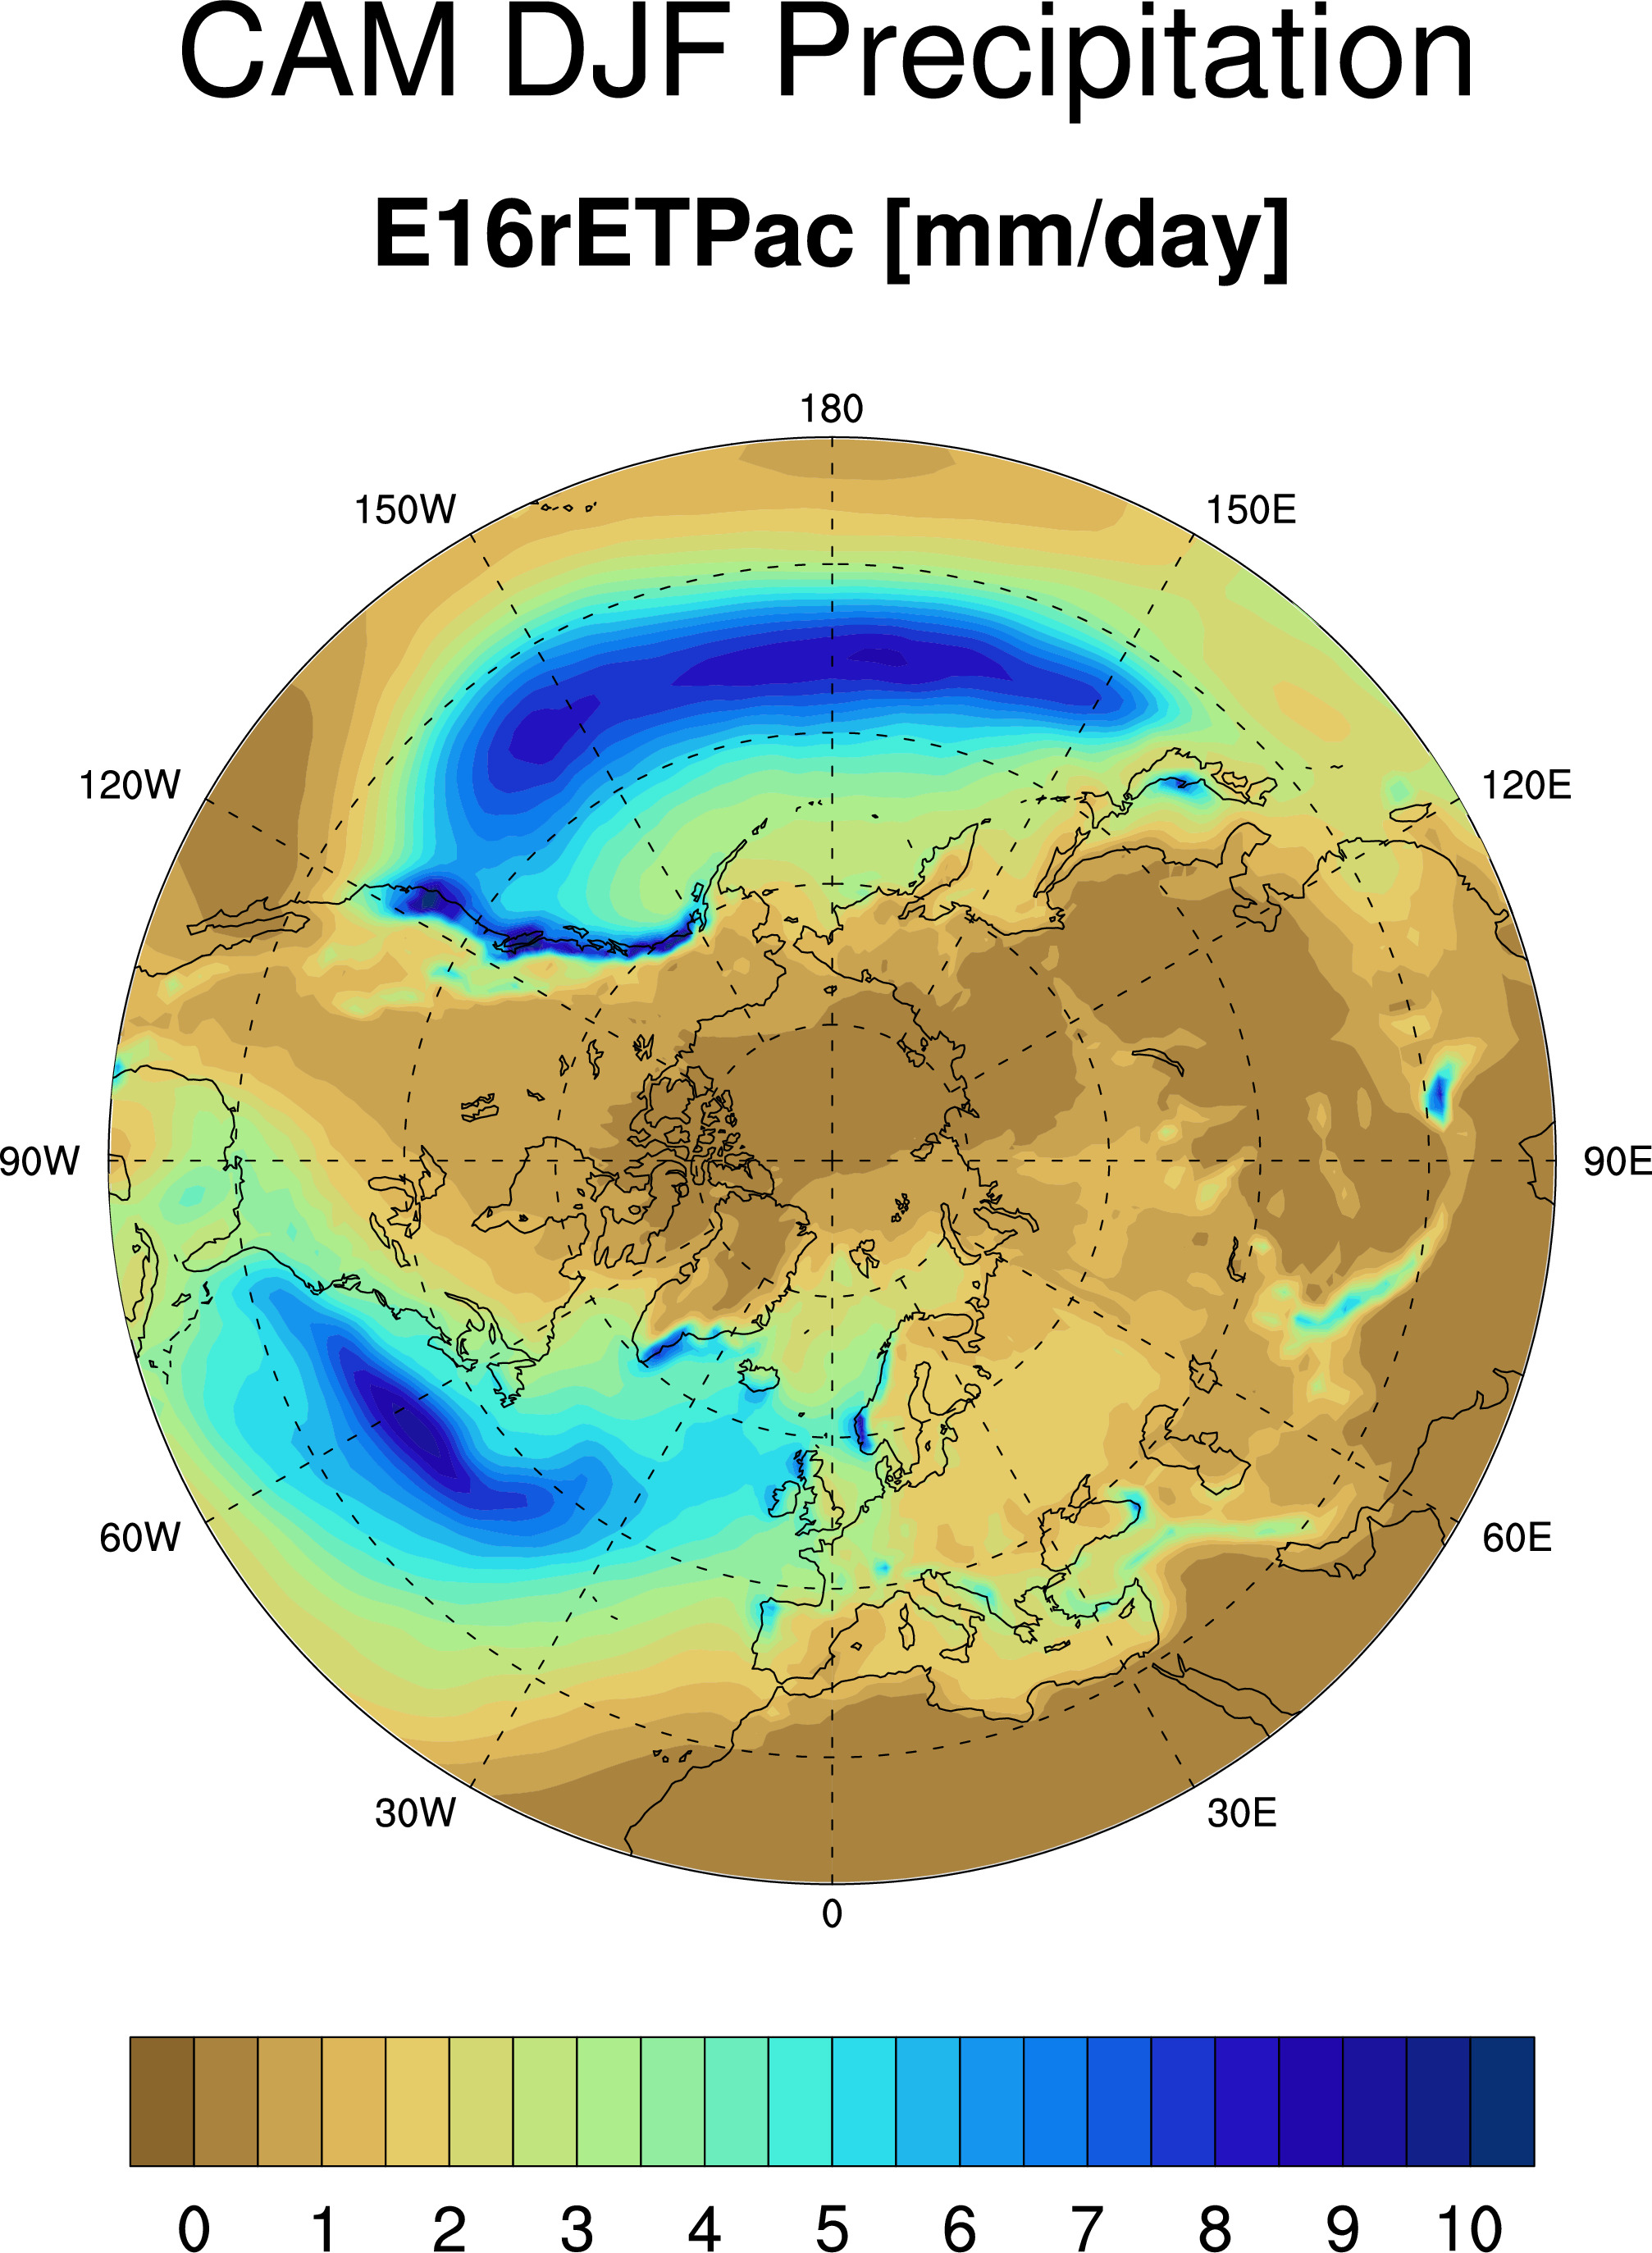
where contour lines are for ETPac cases.
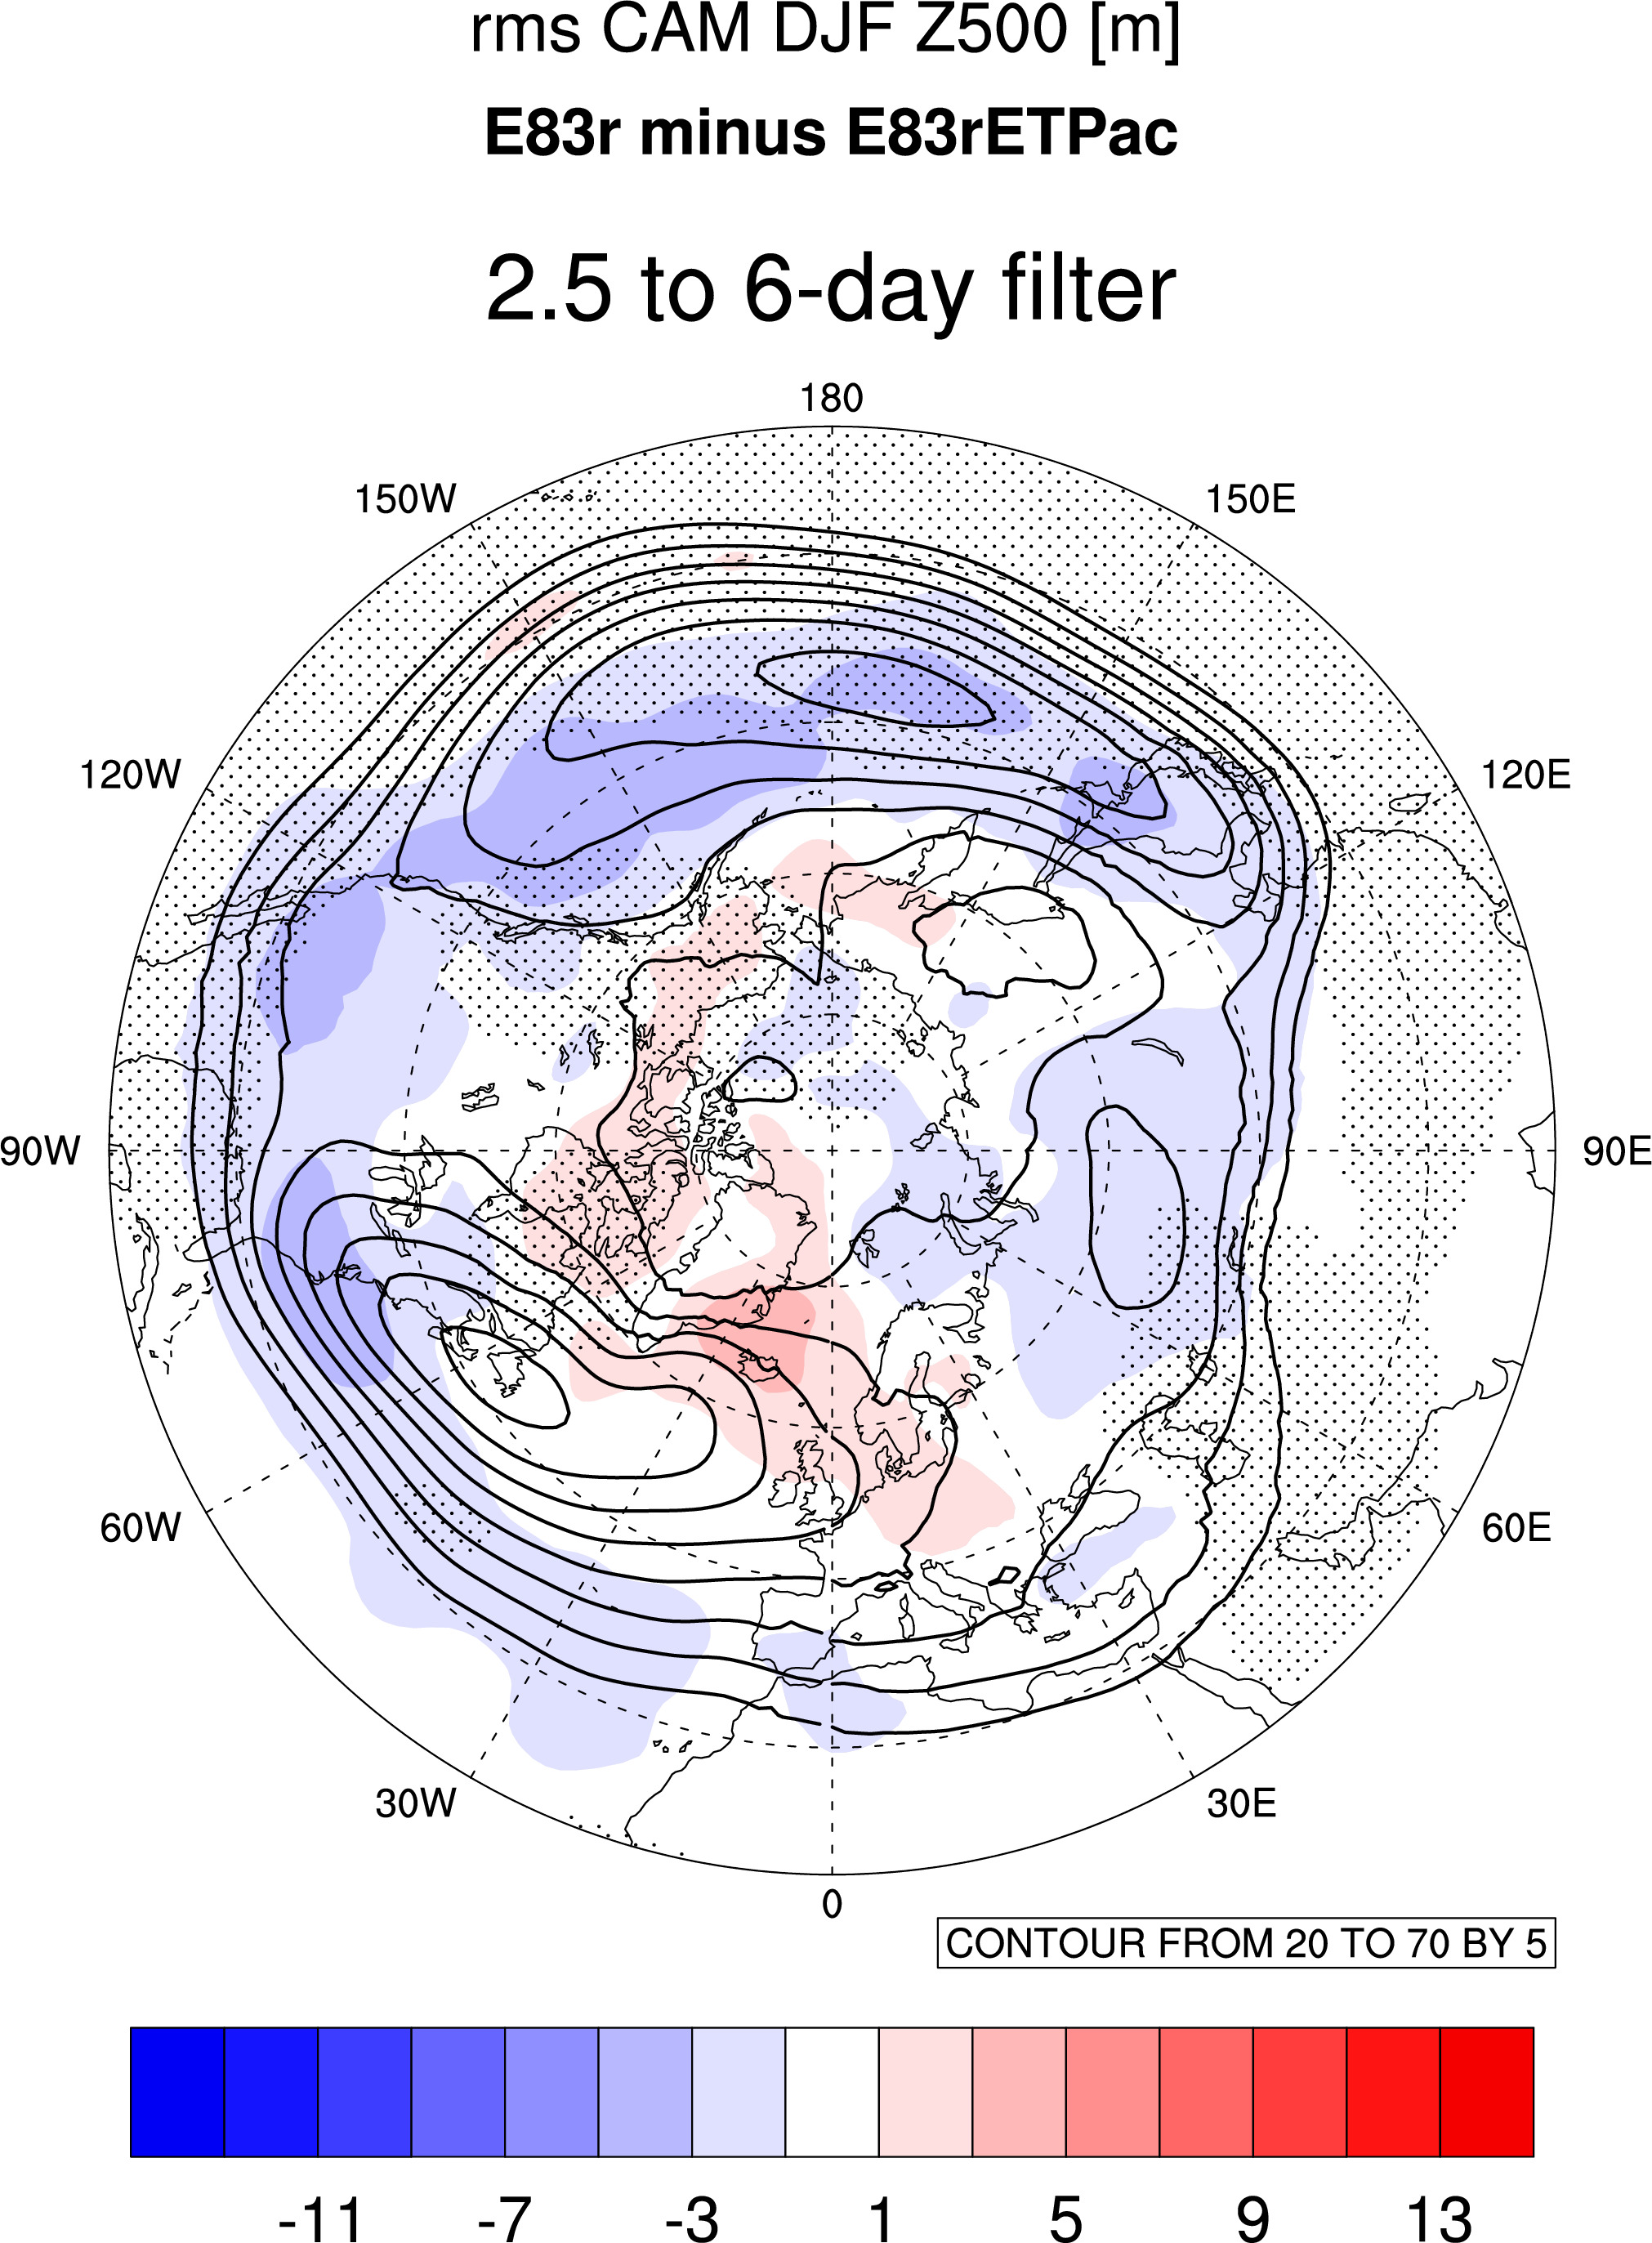
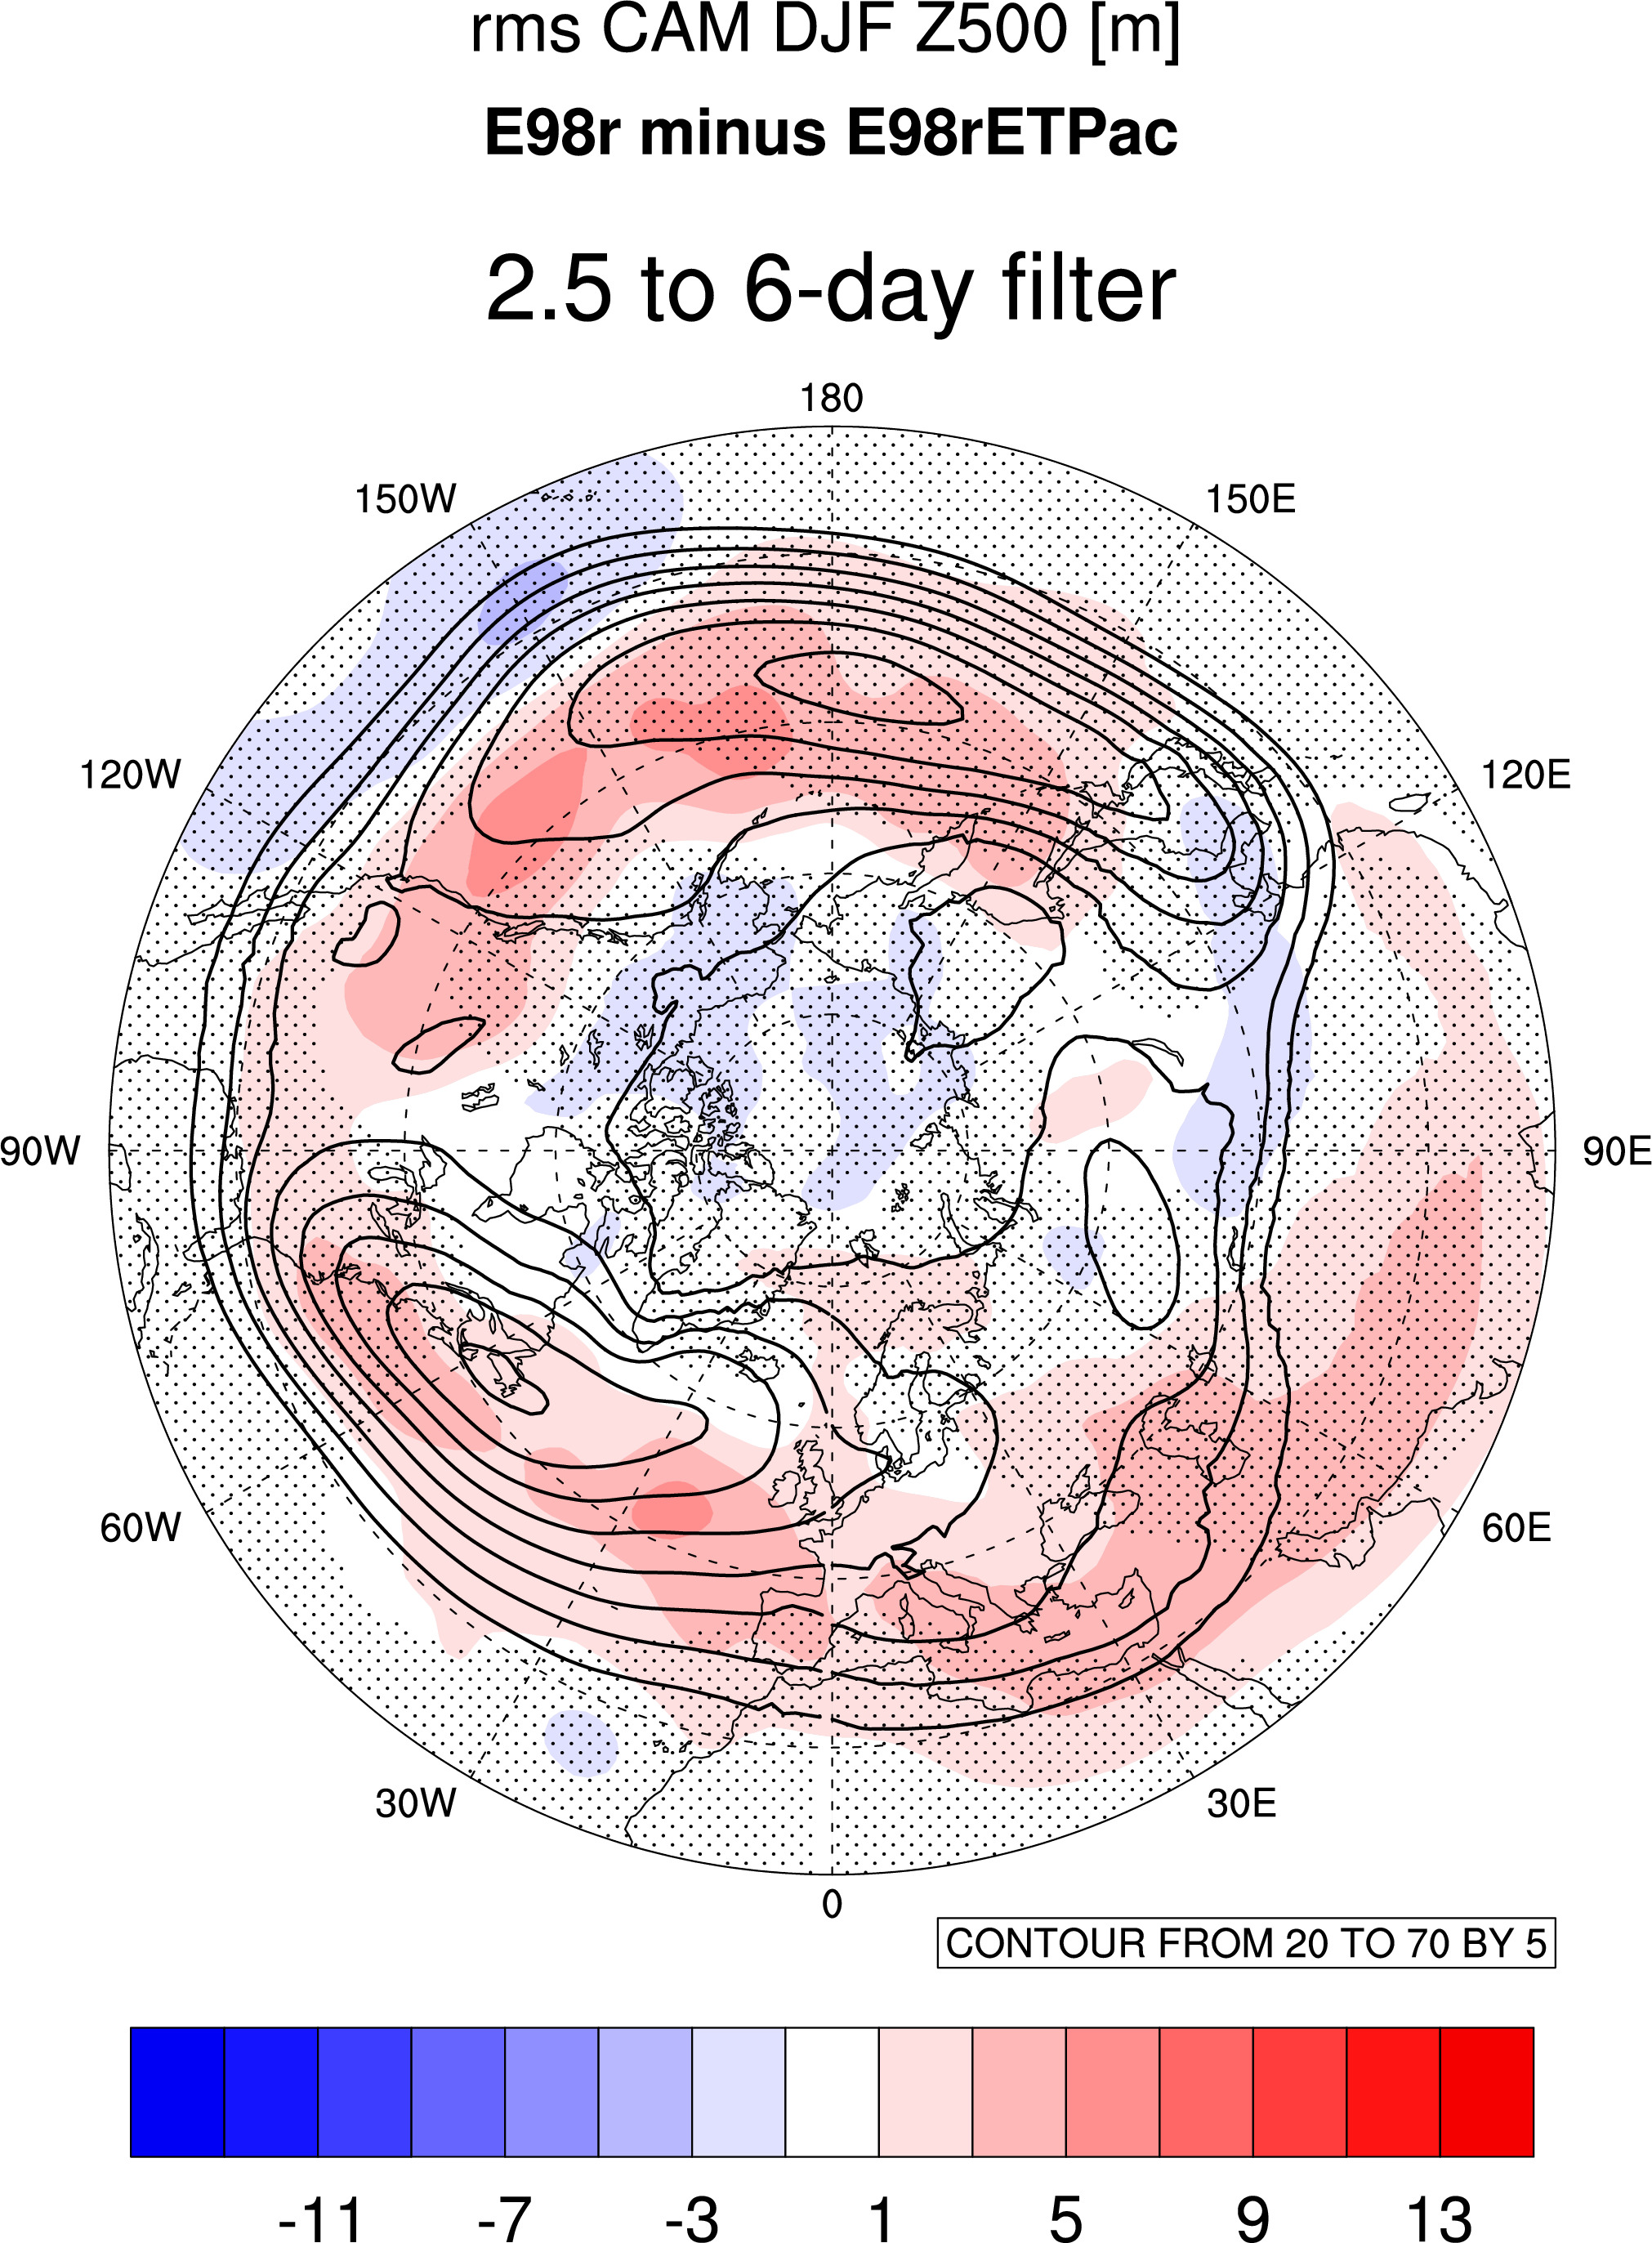
where stippling indicates 95% from t-test.
Xiao-Wei CAM E2015r ETPac case
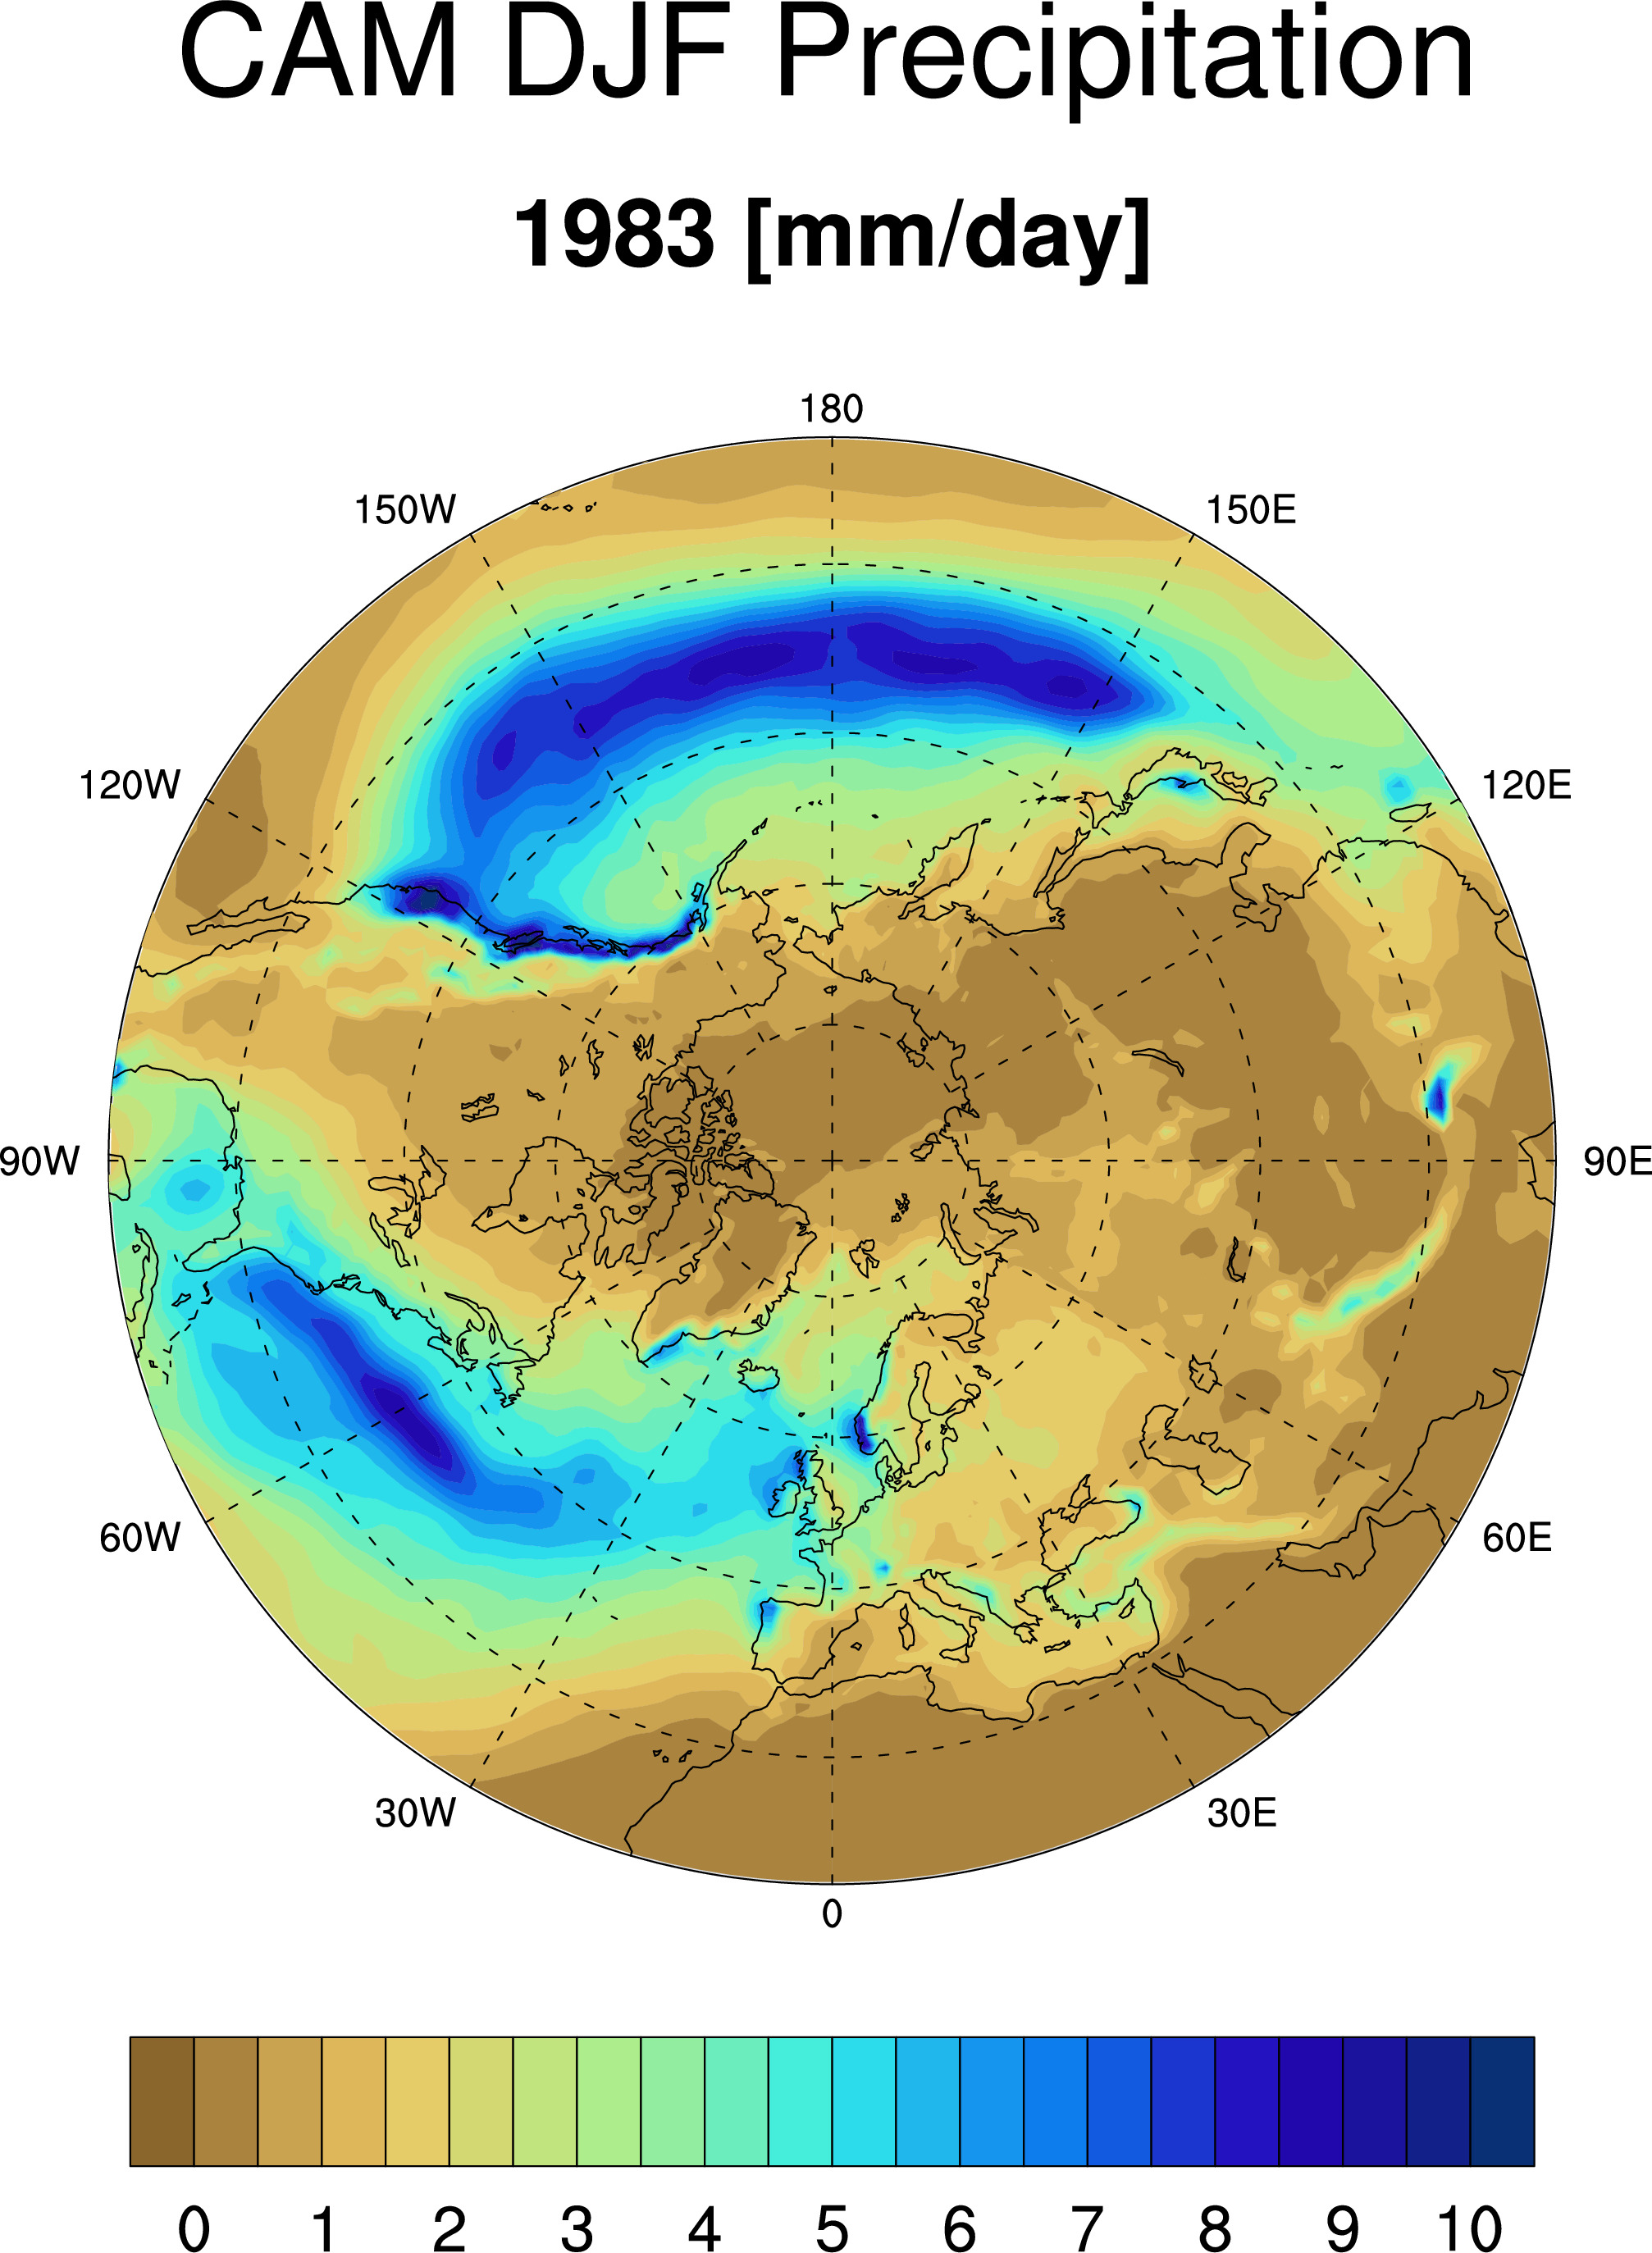
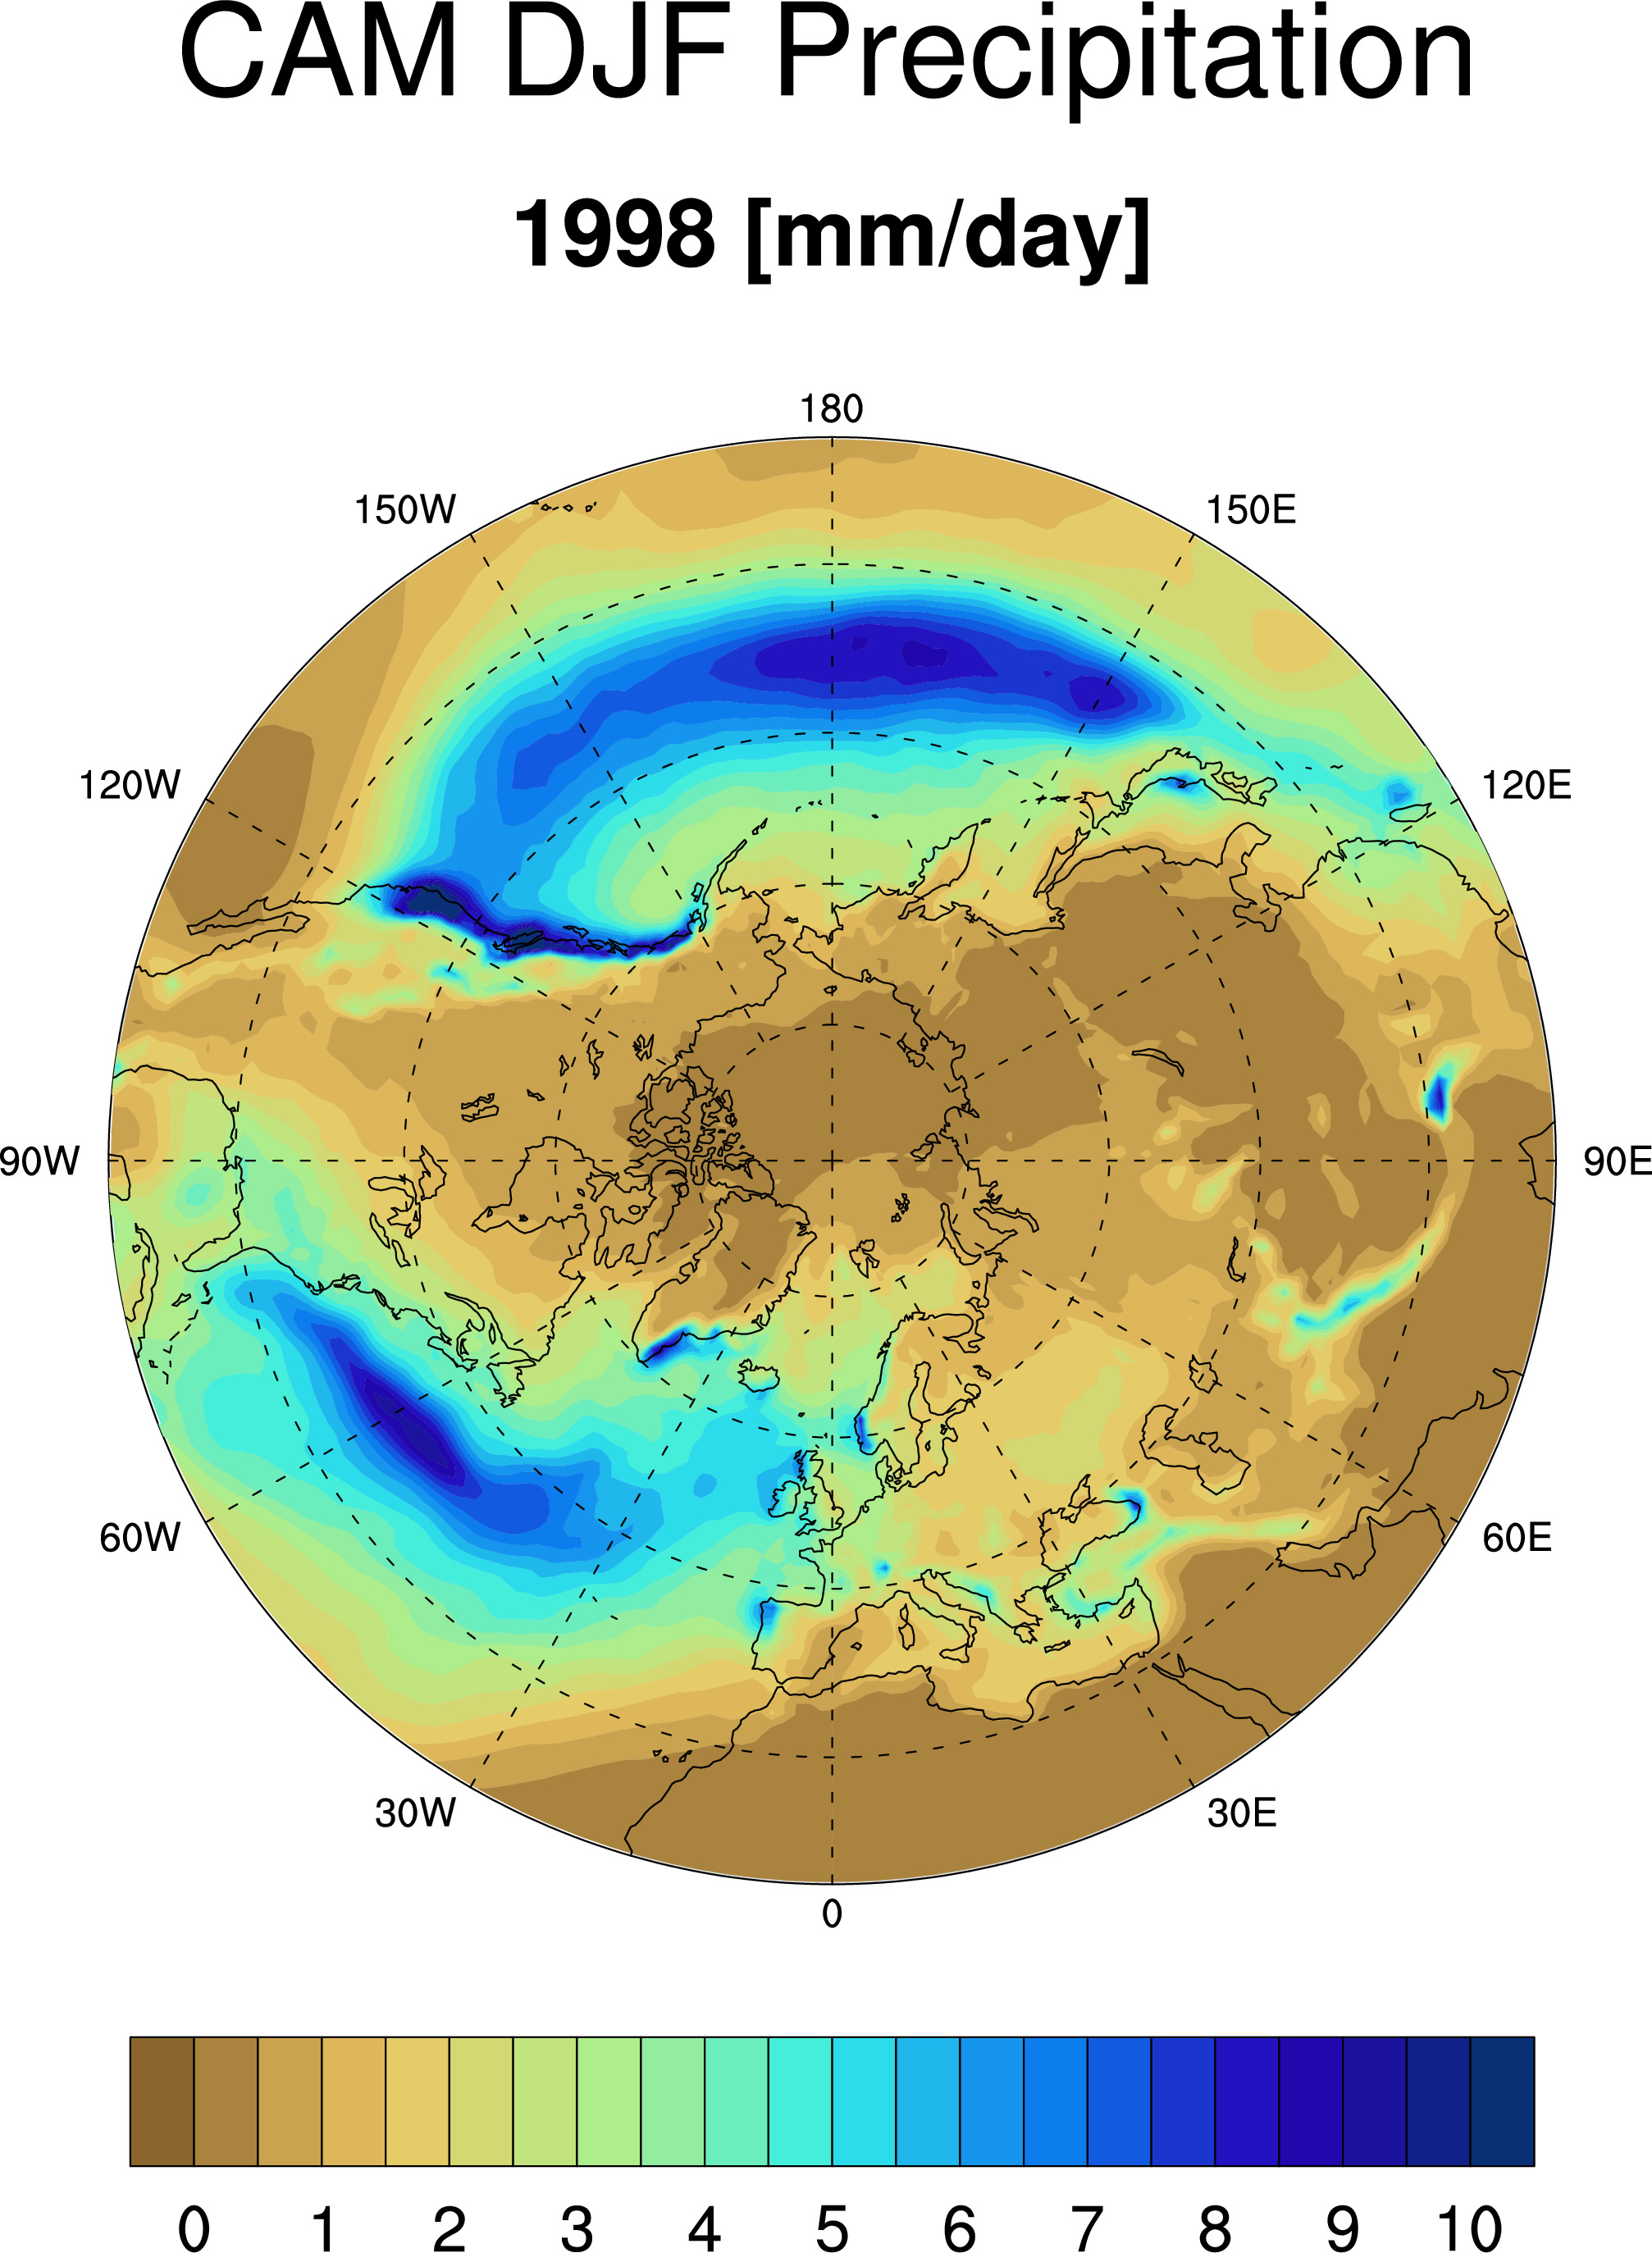
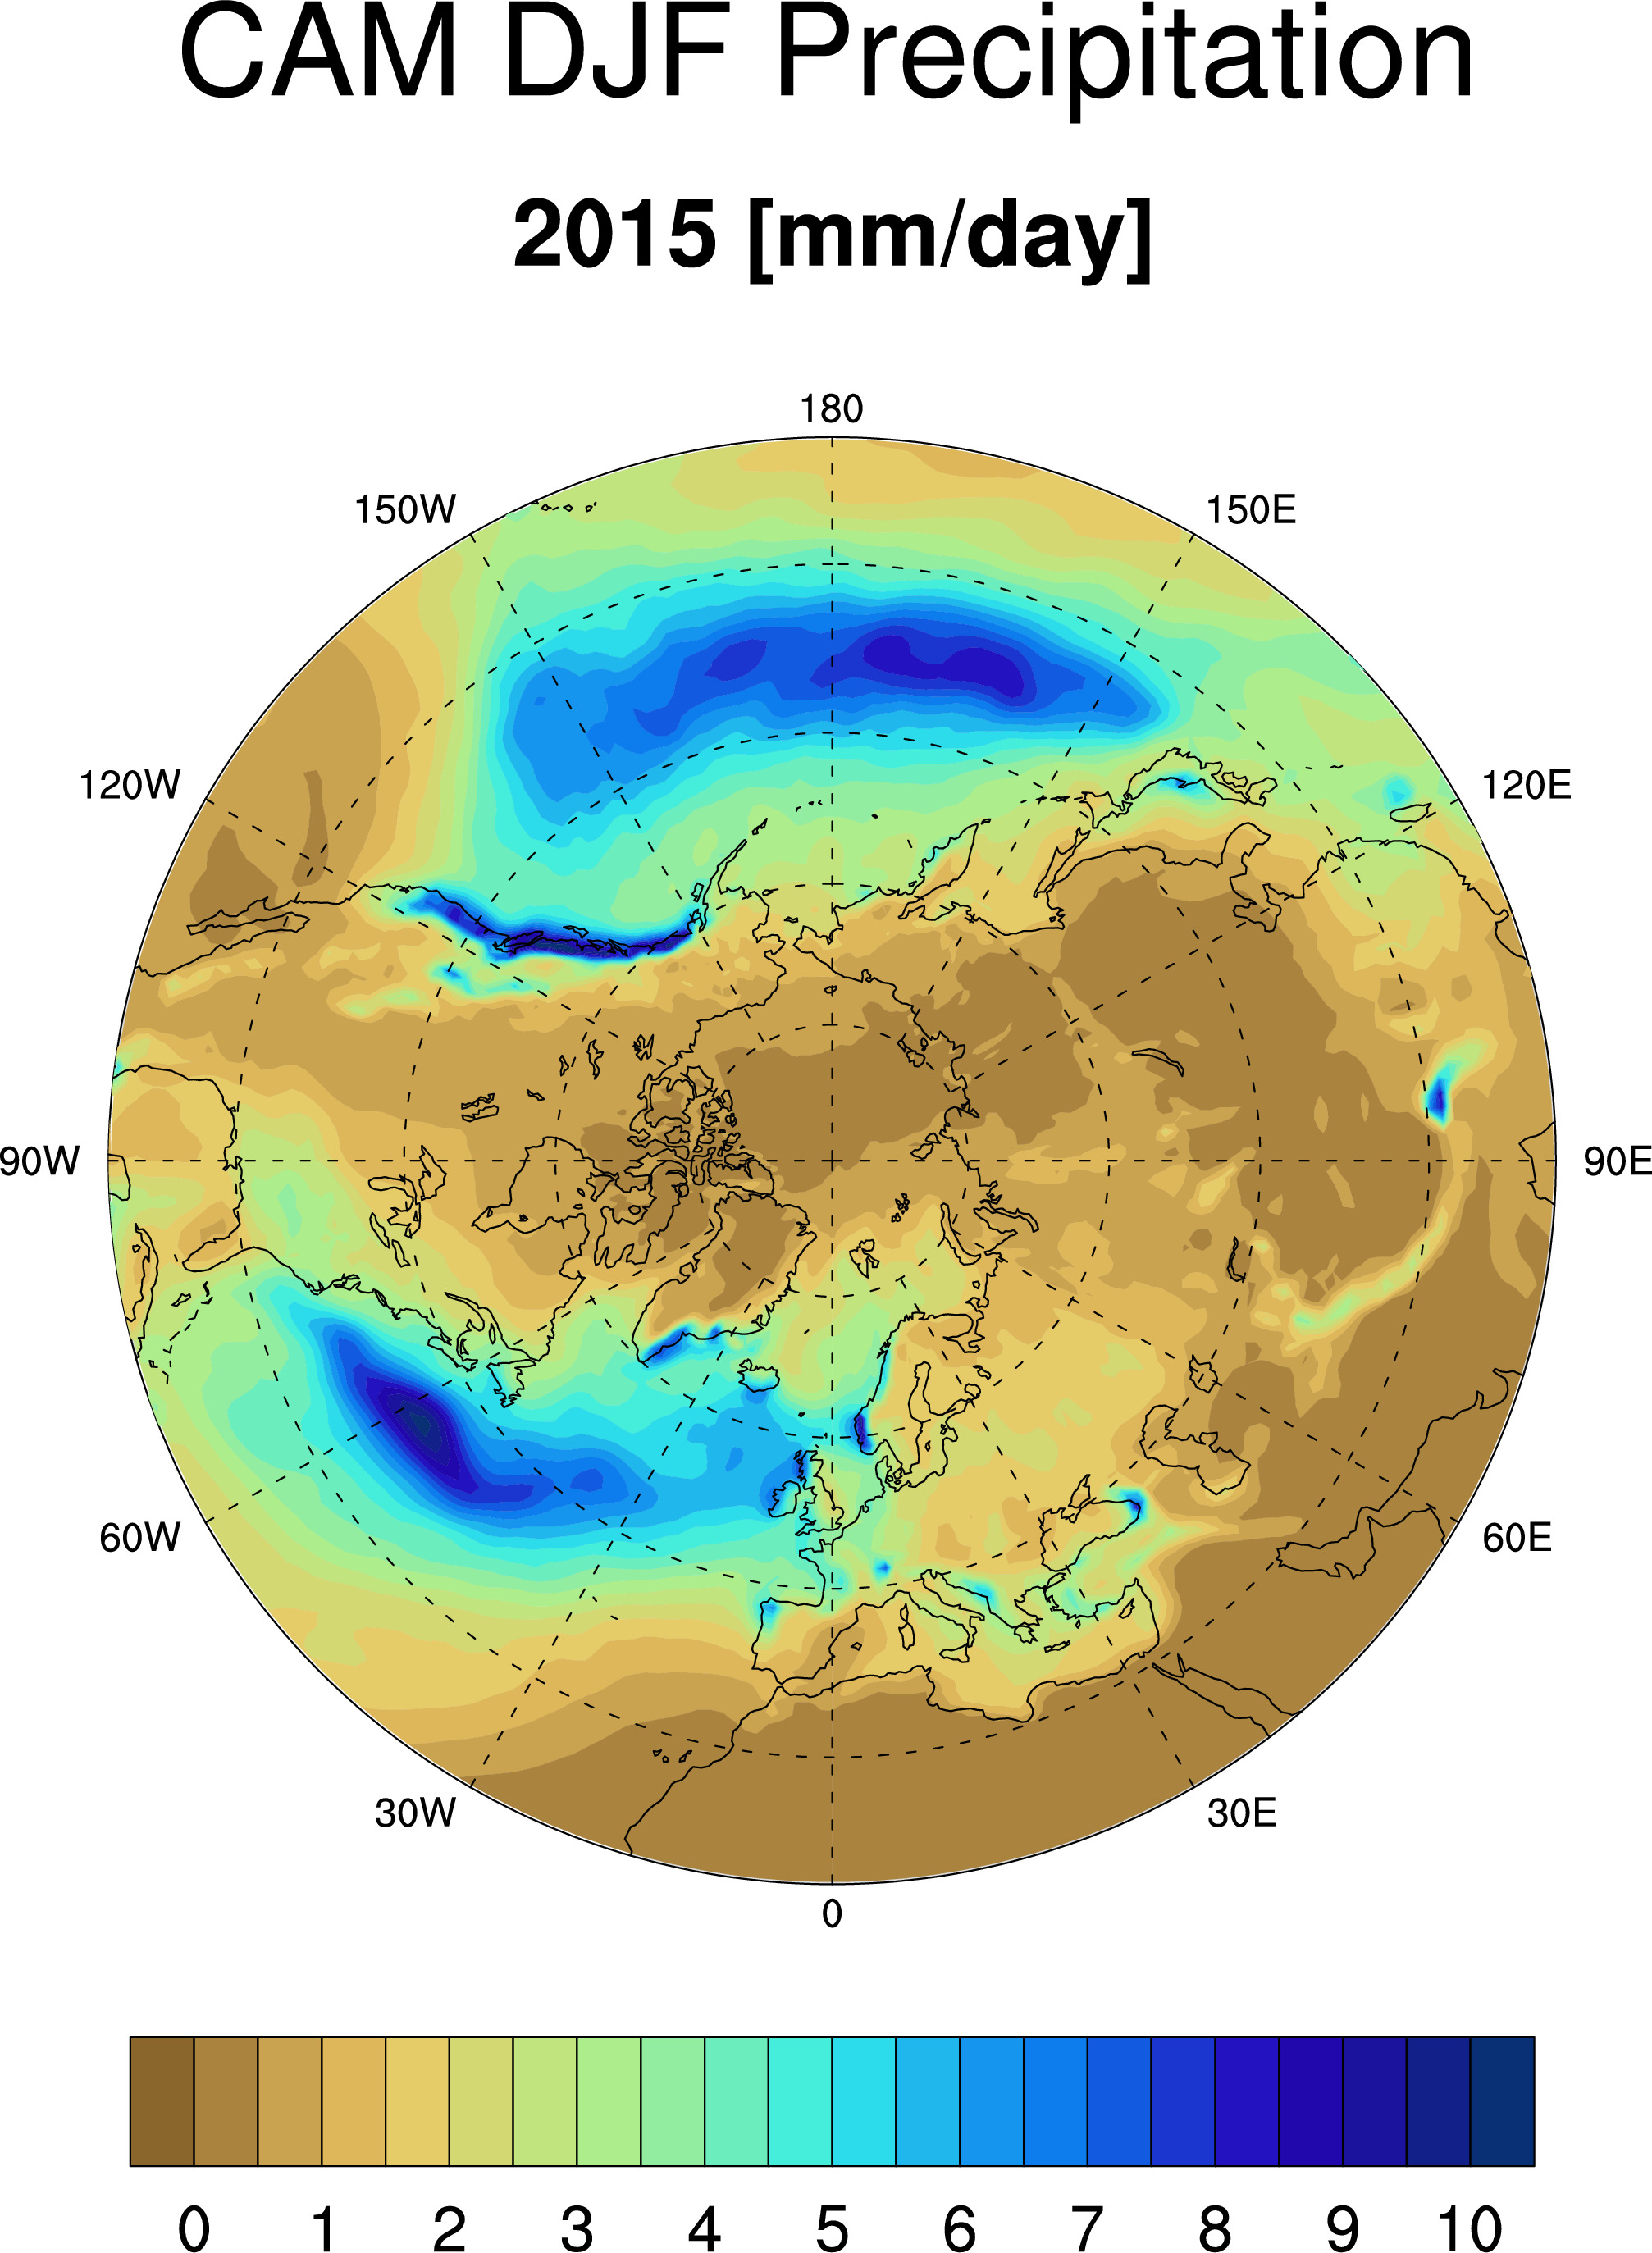
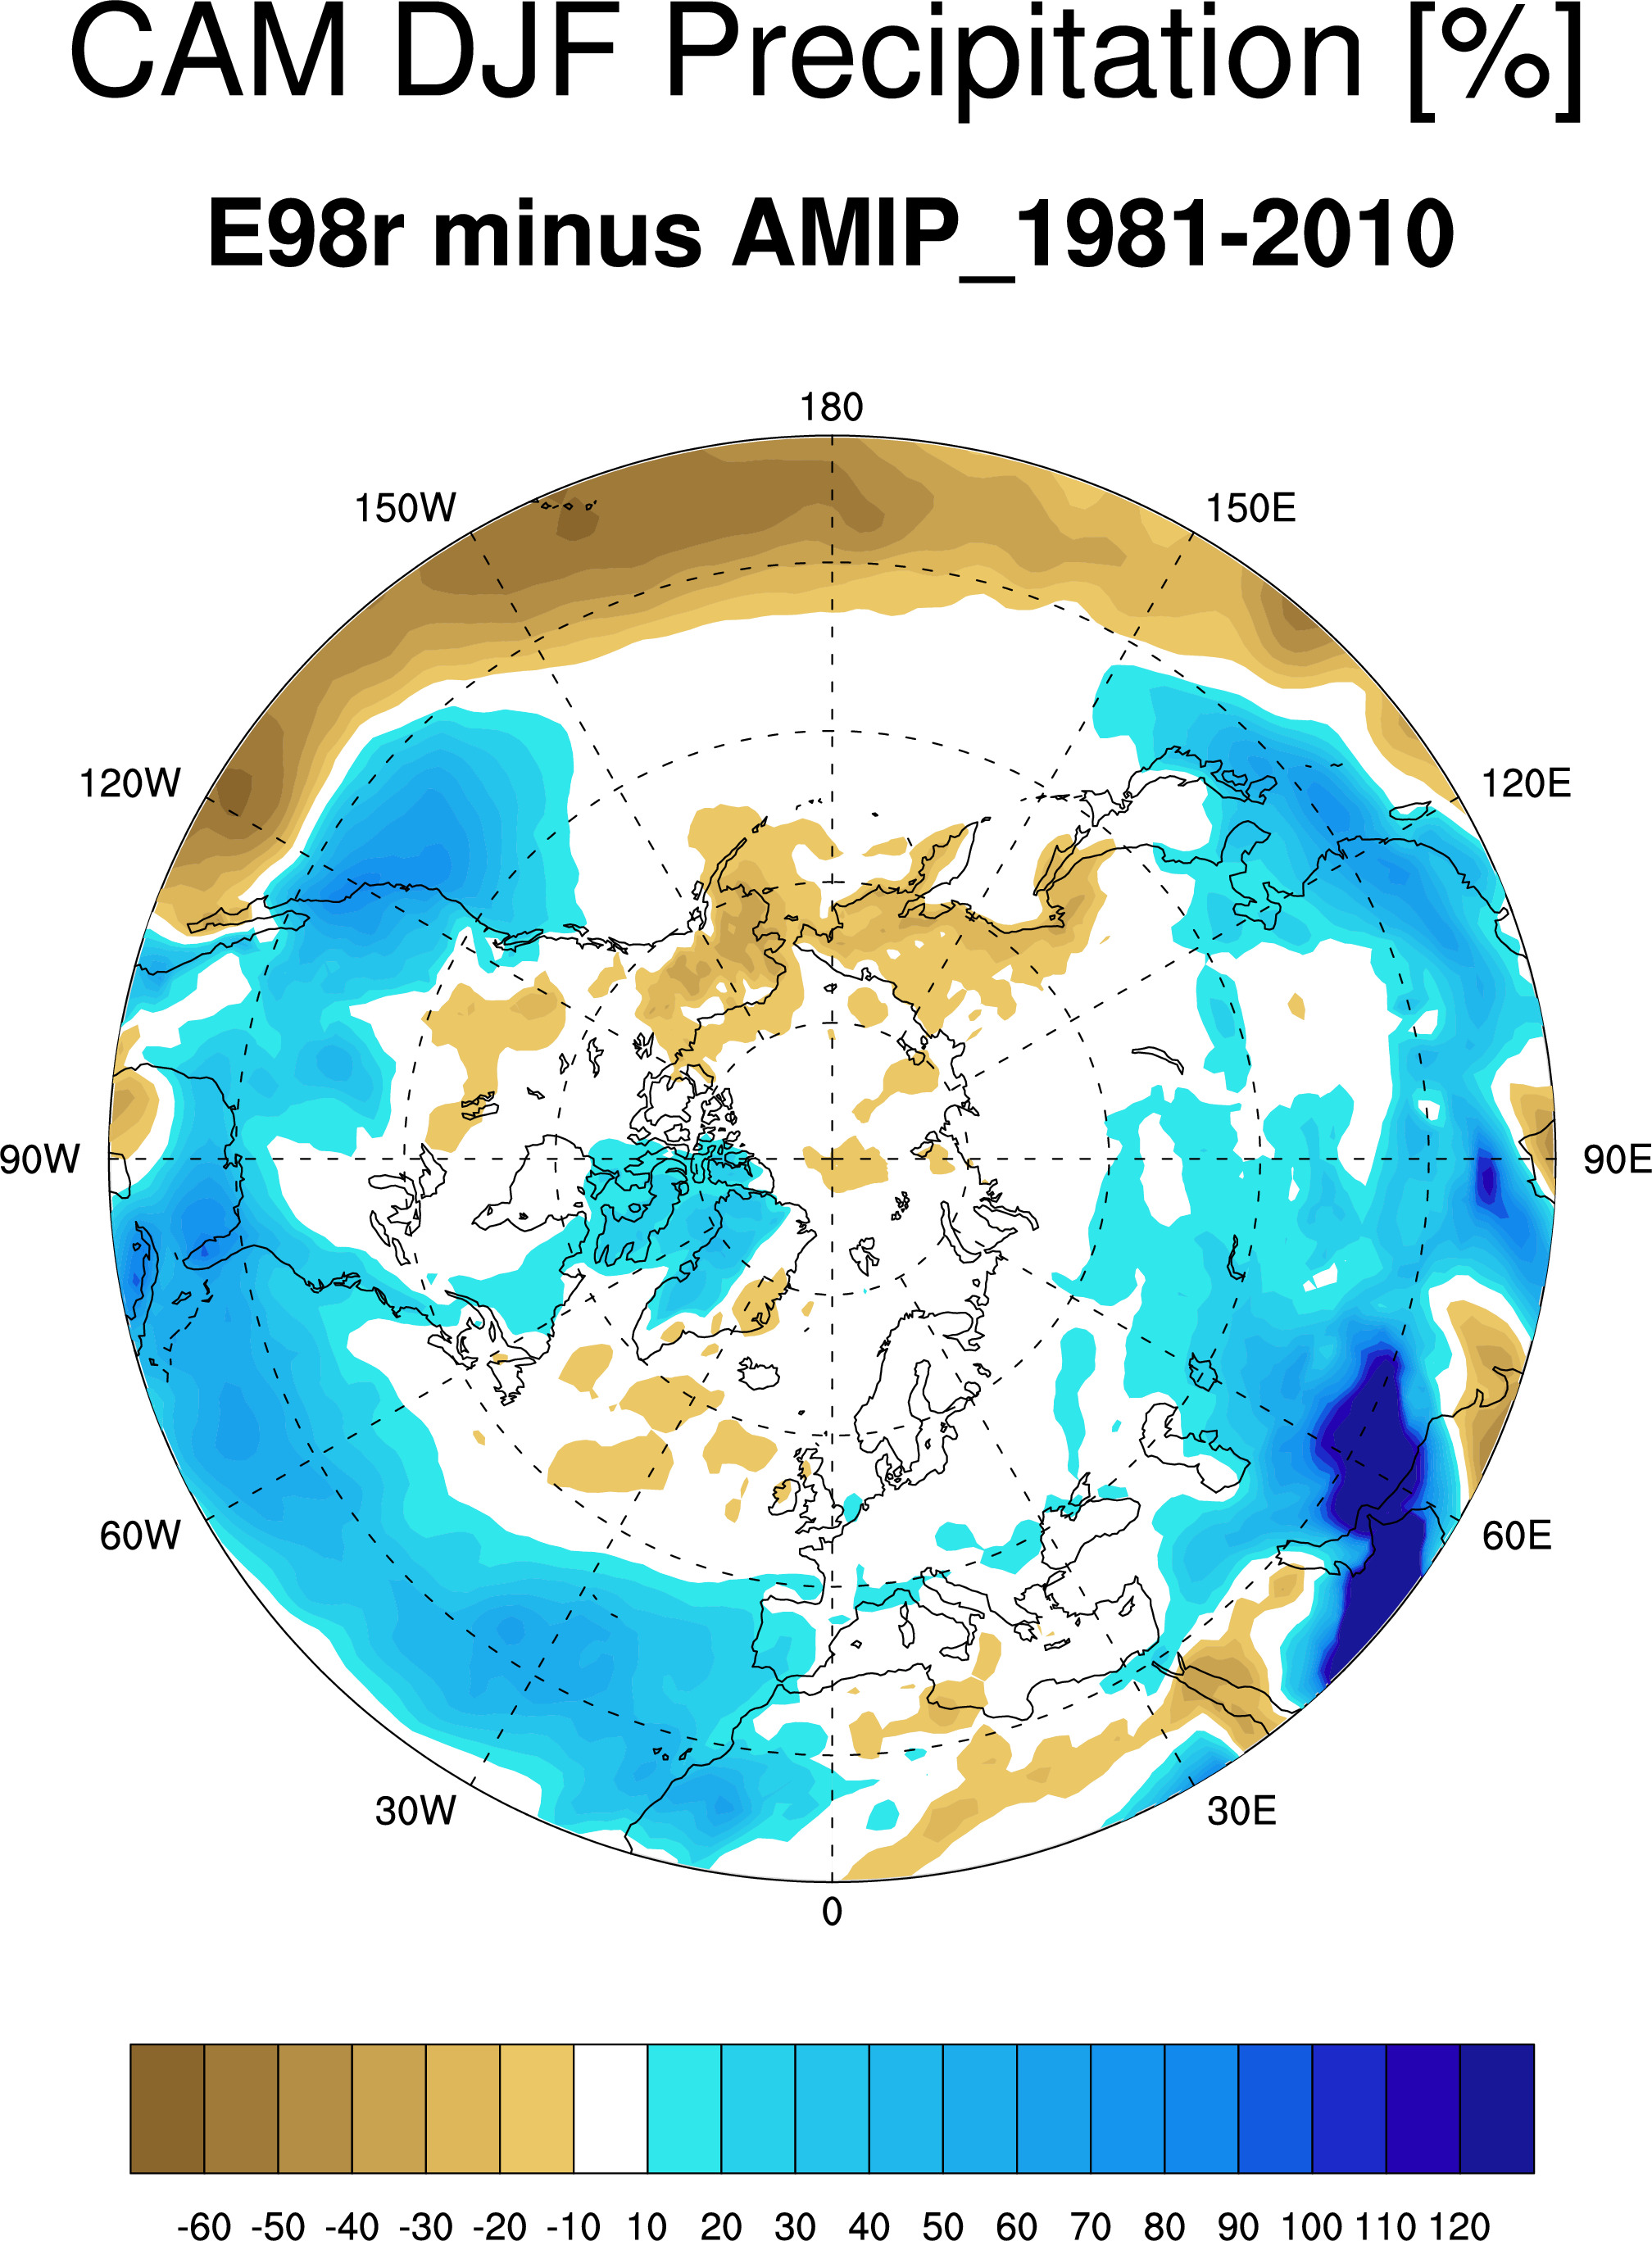
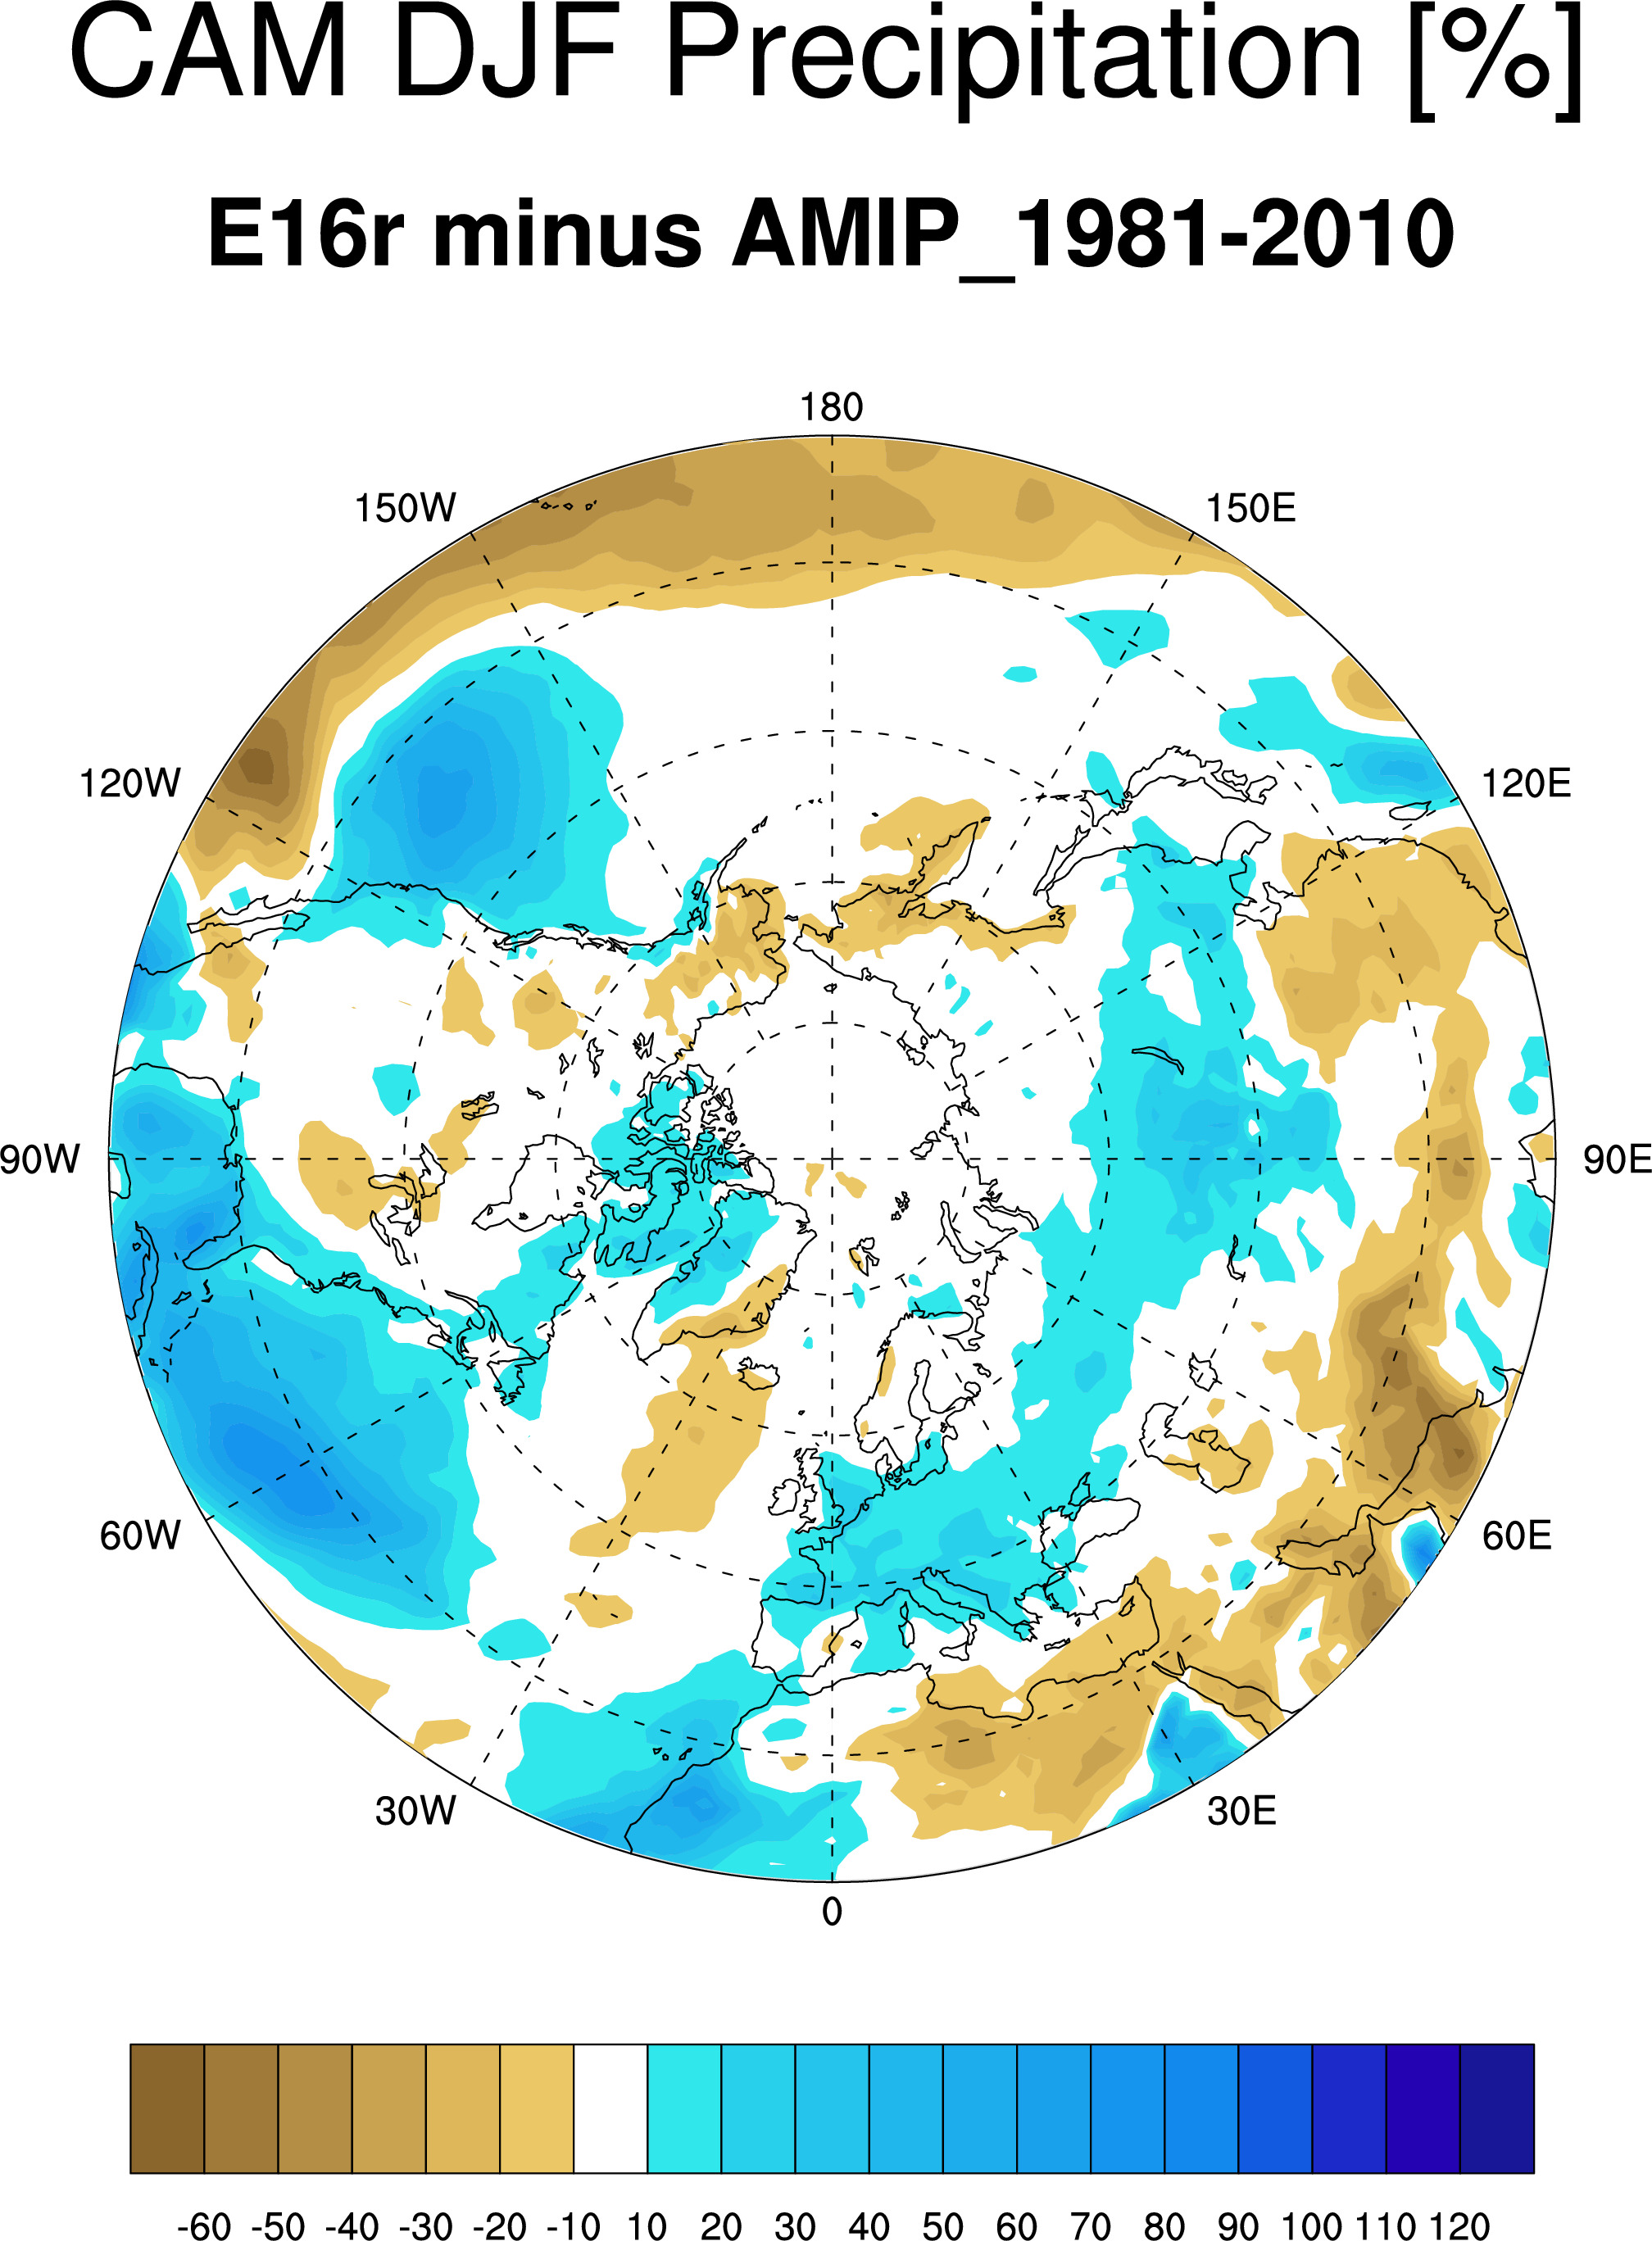
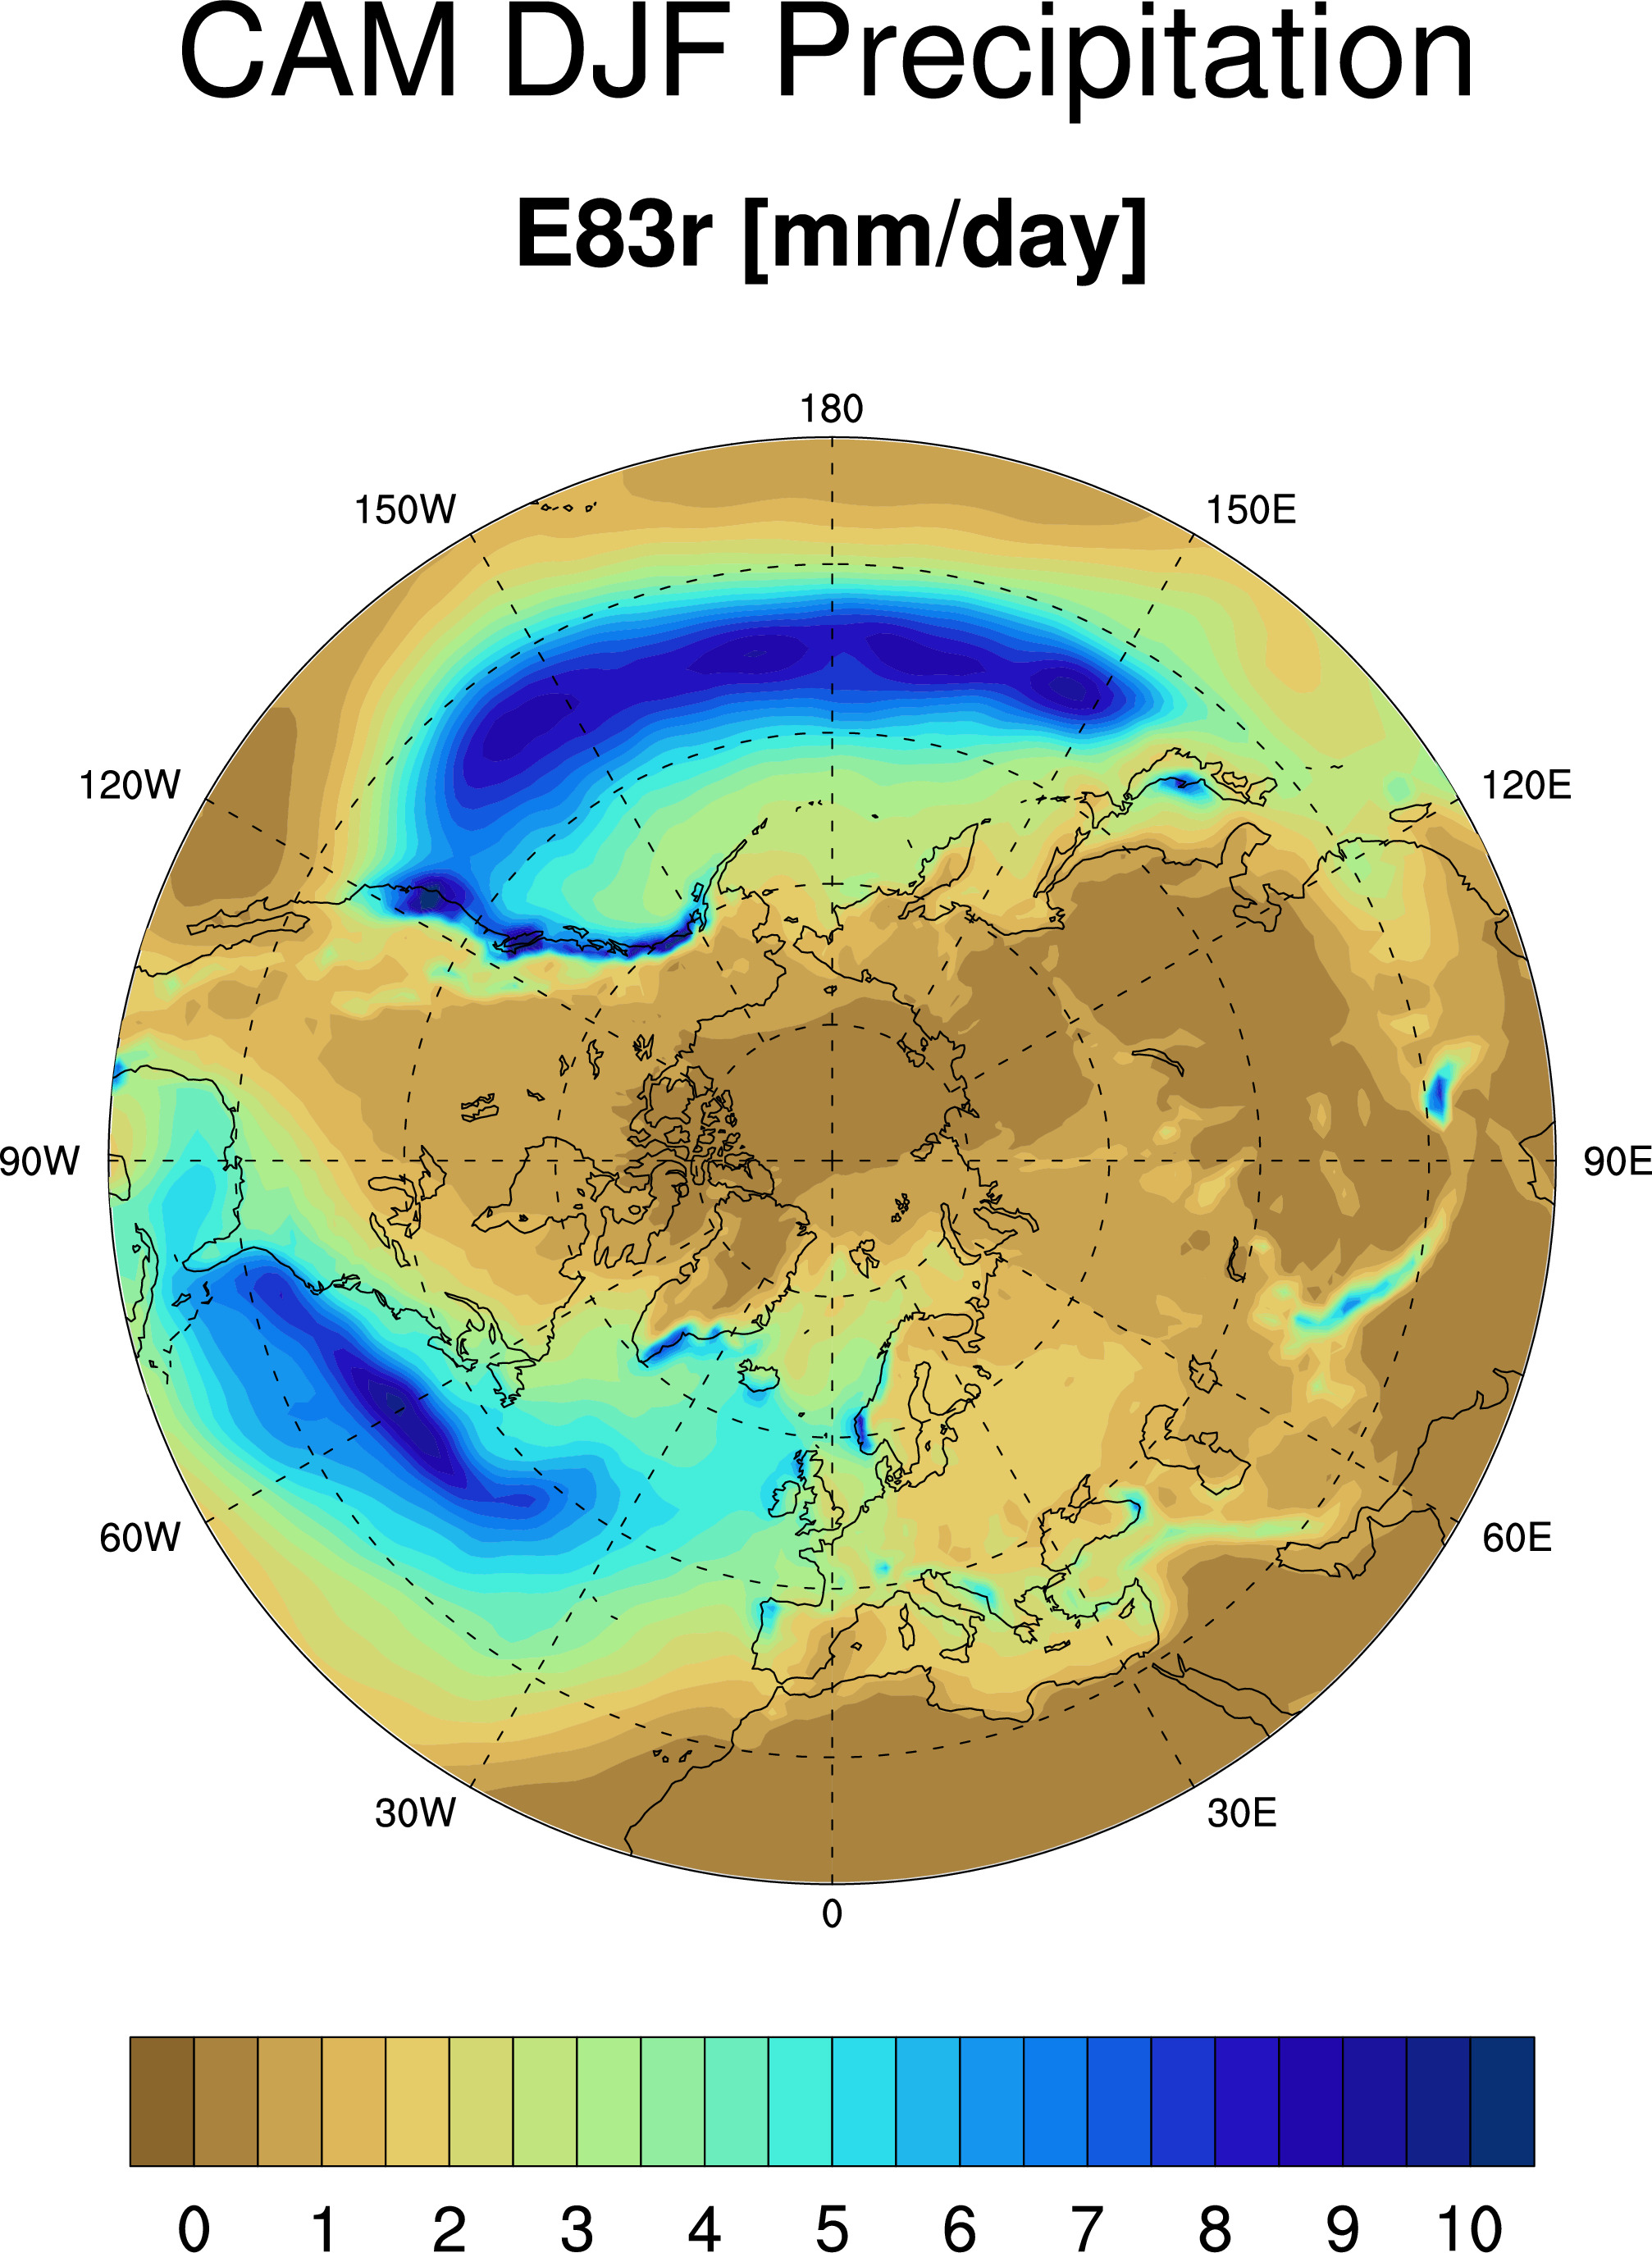
CAM DJF Precipitation
Differences wrt to AMIP 1981-2010 CAM: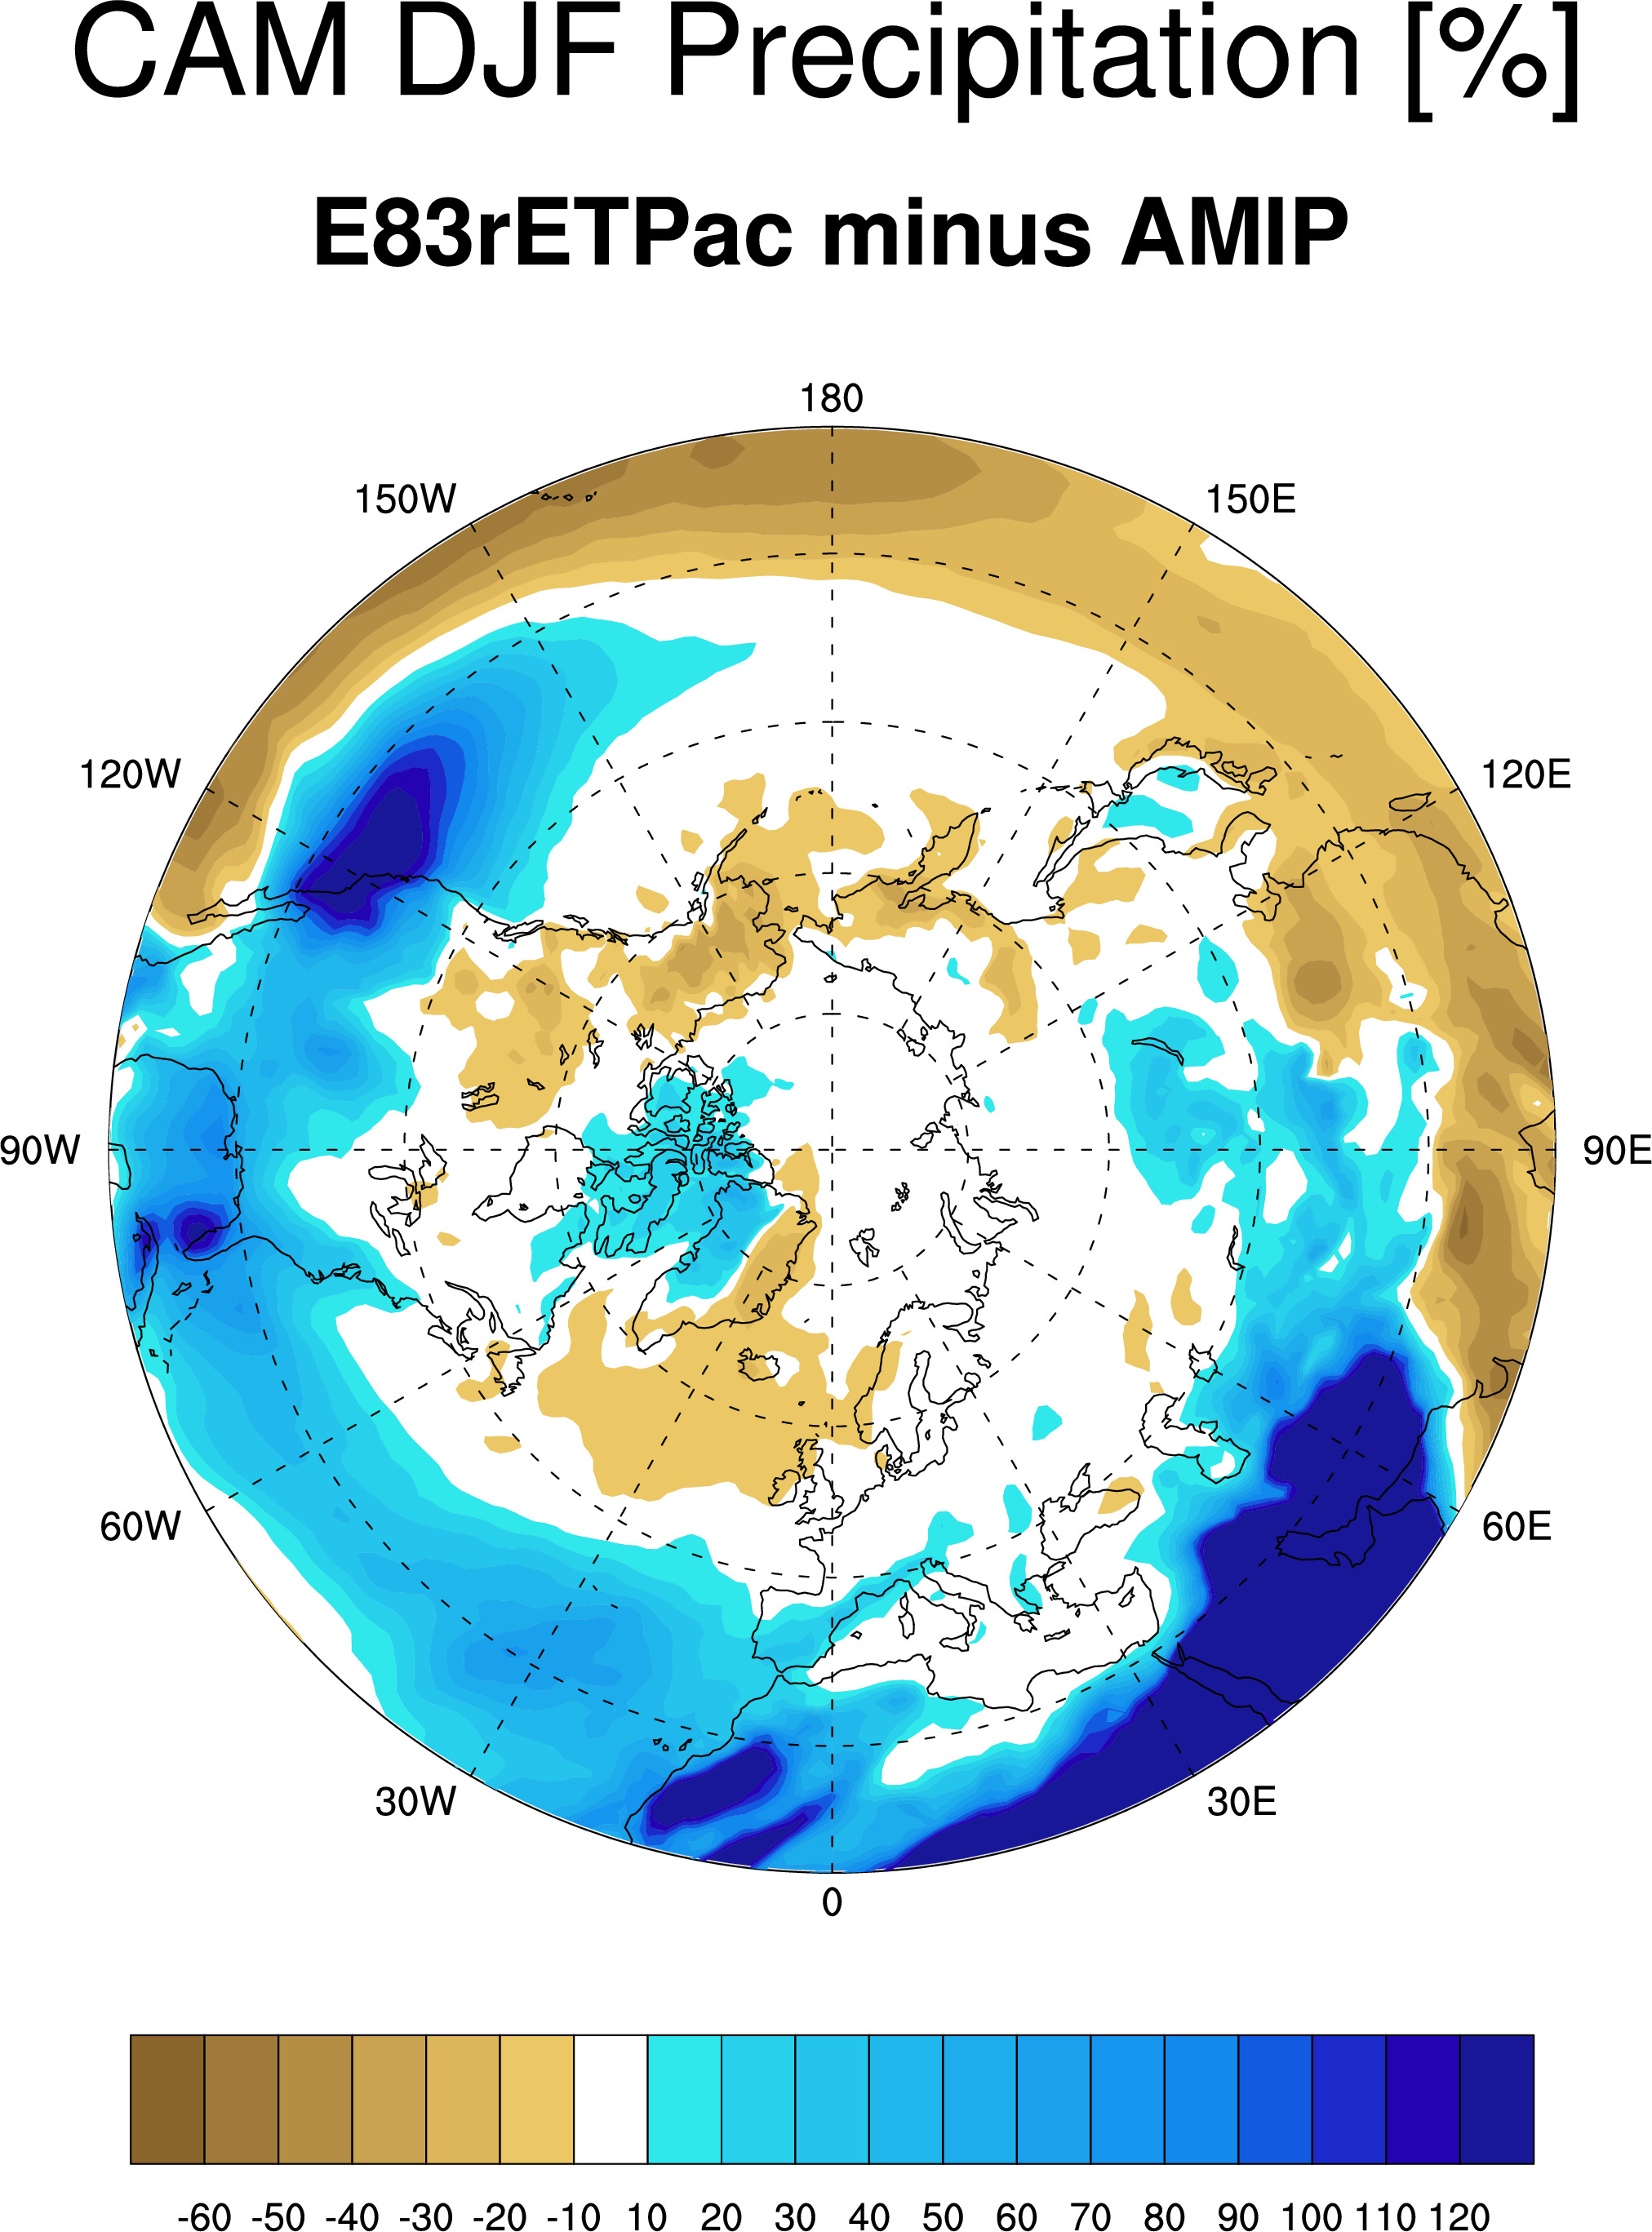
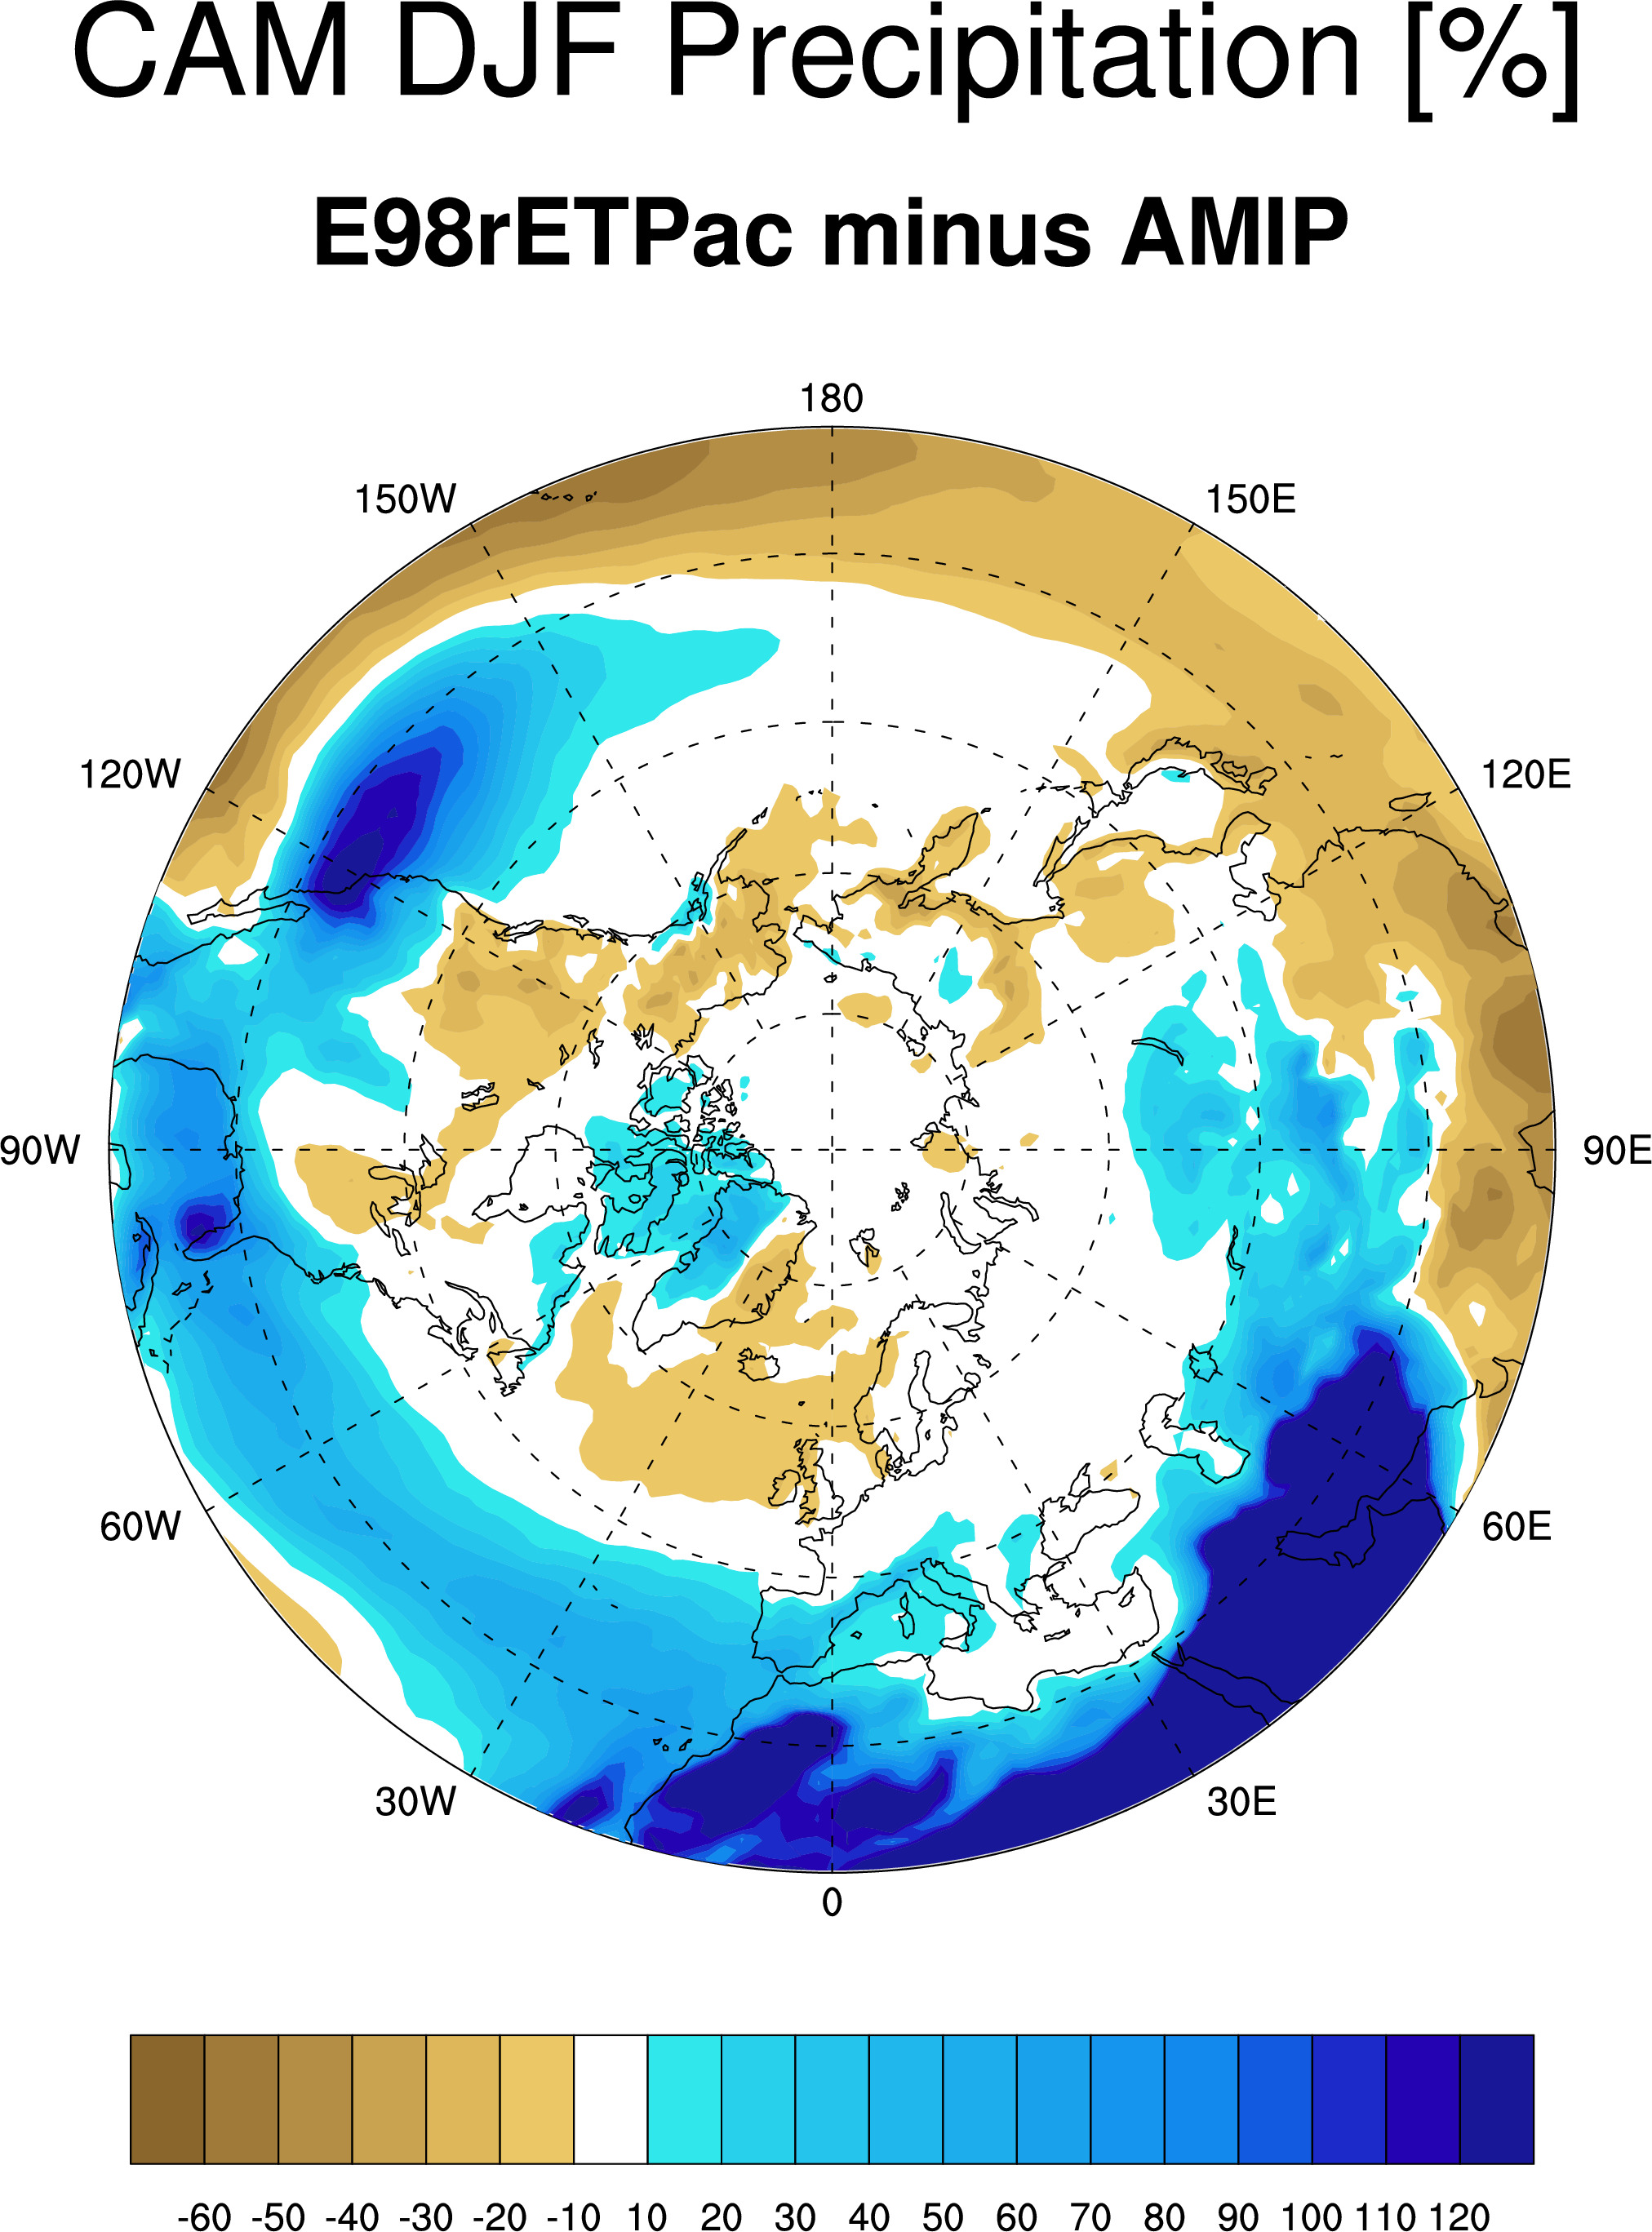
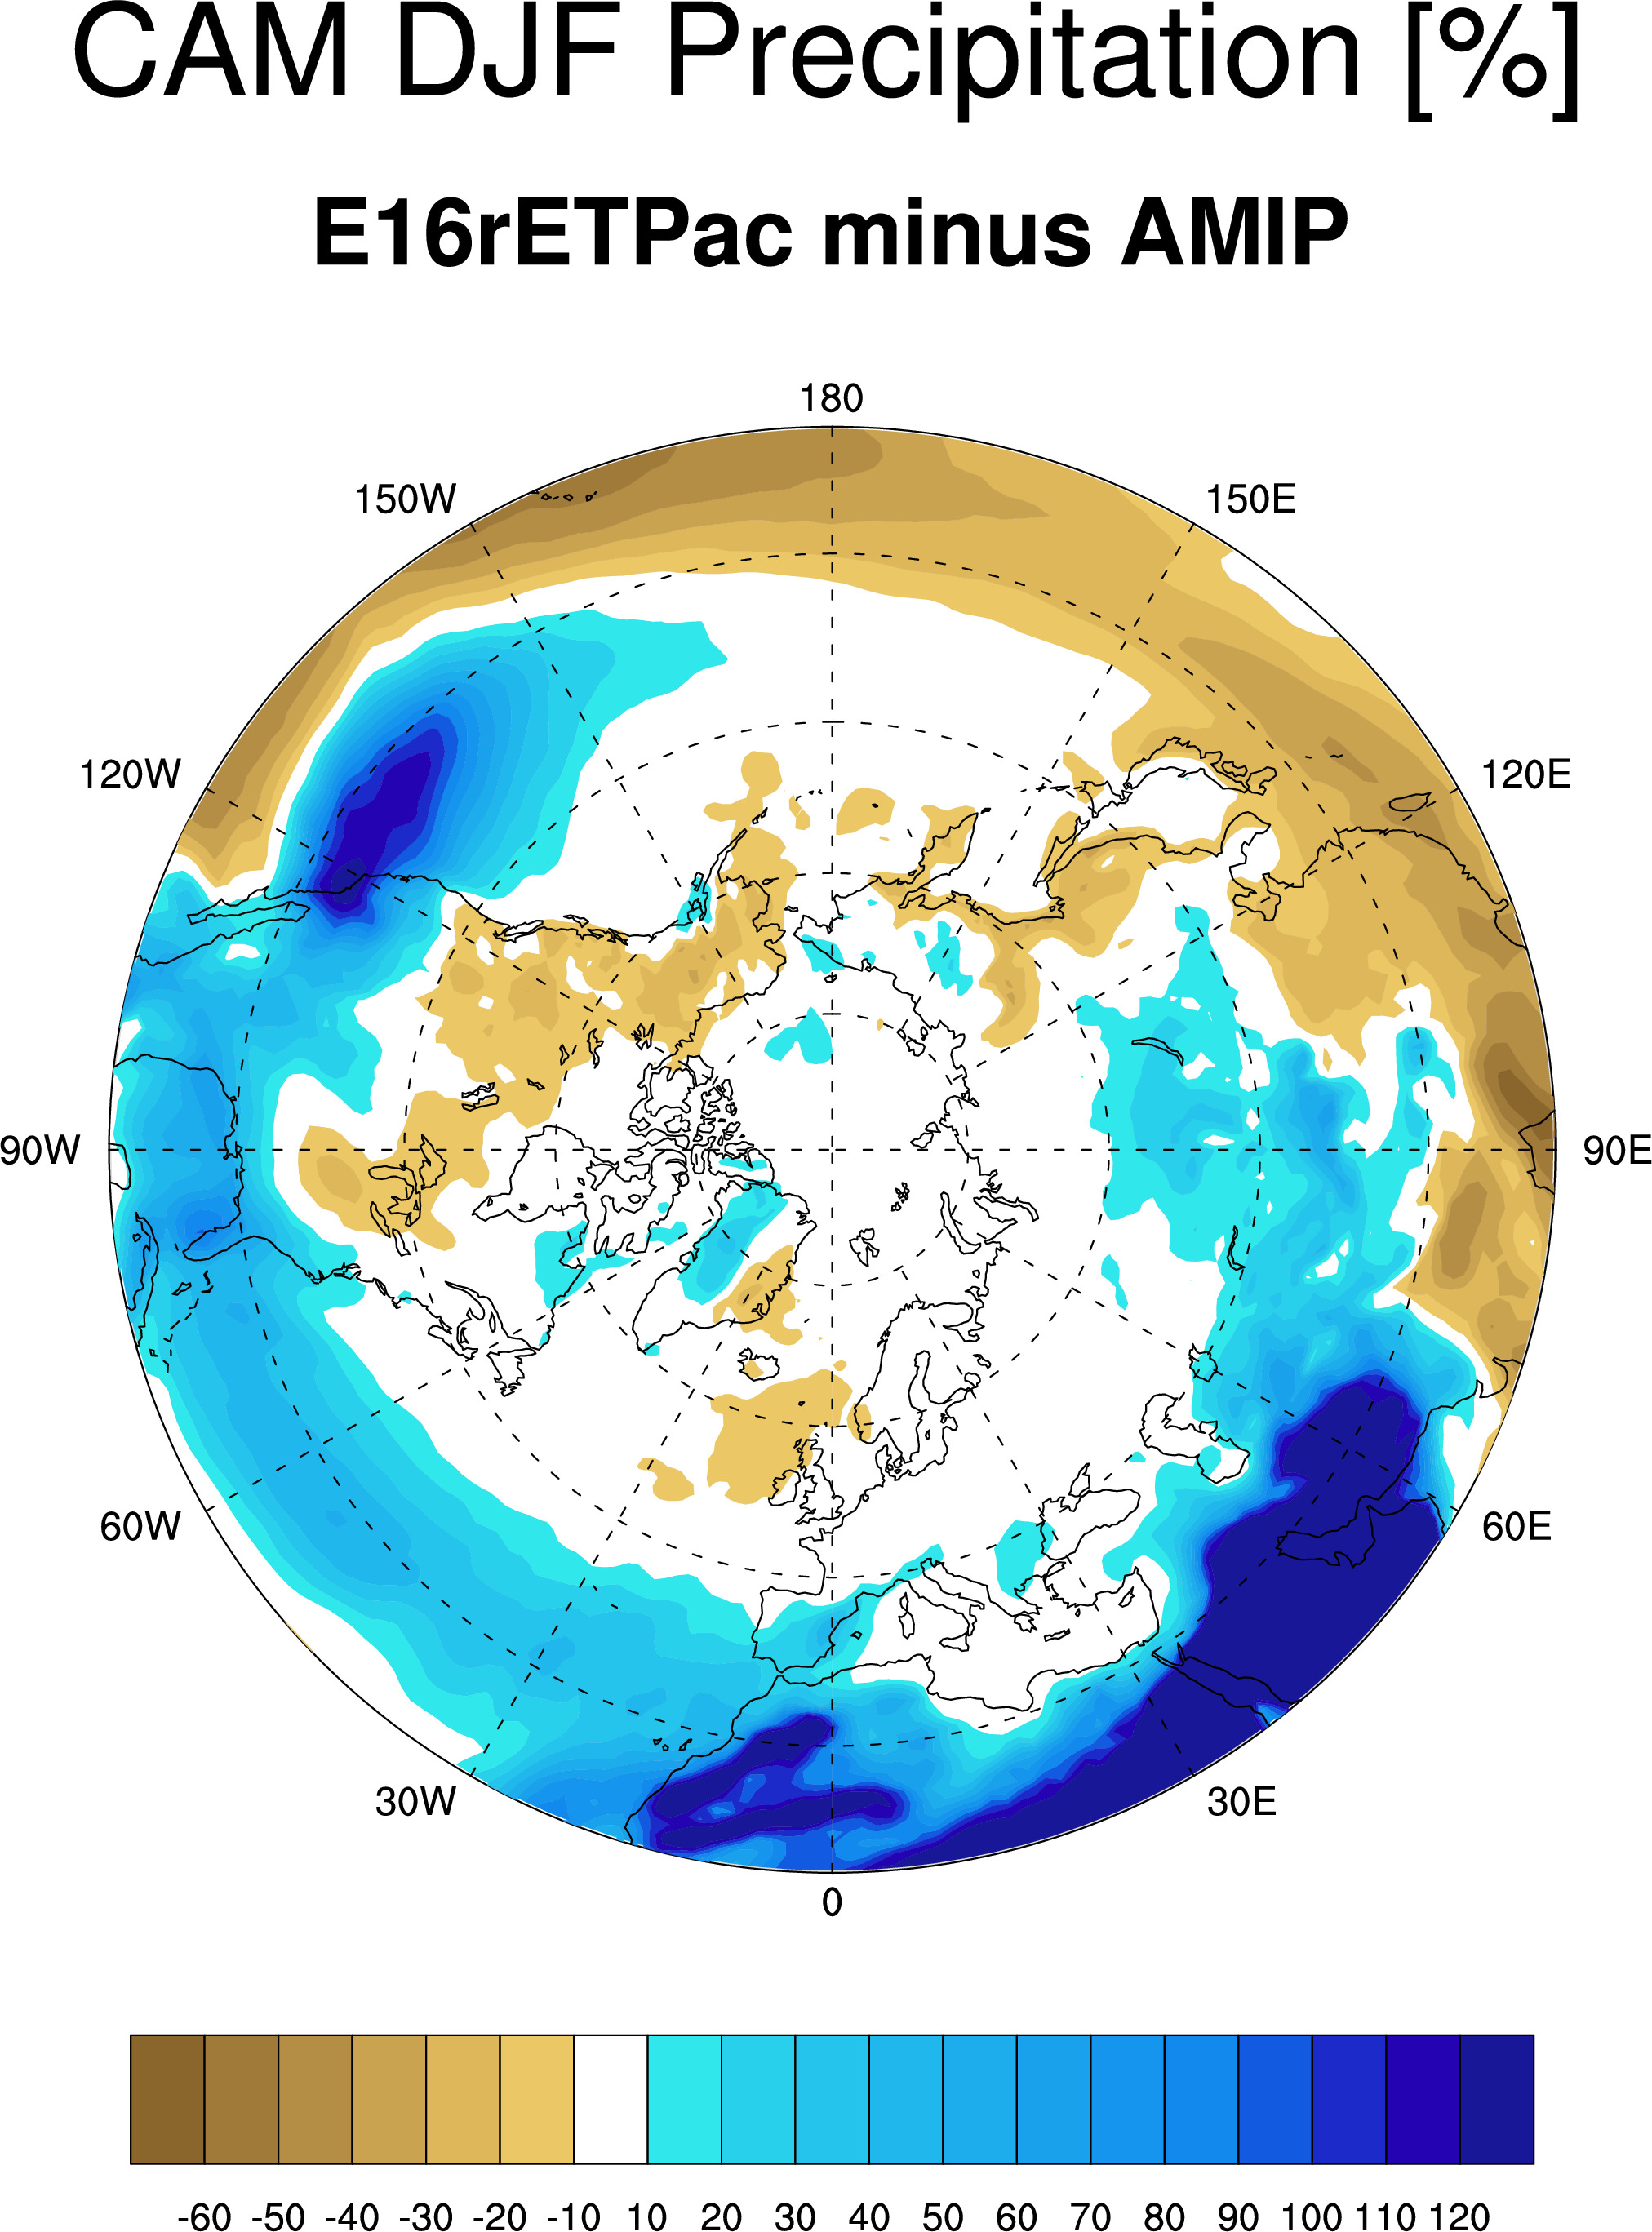
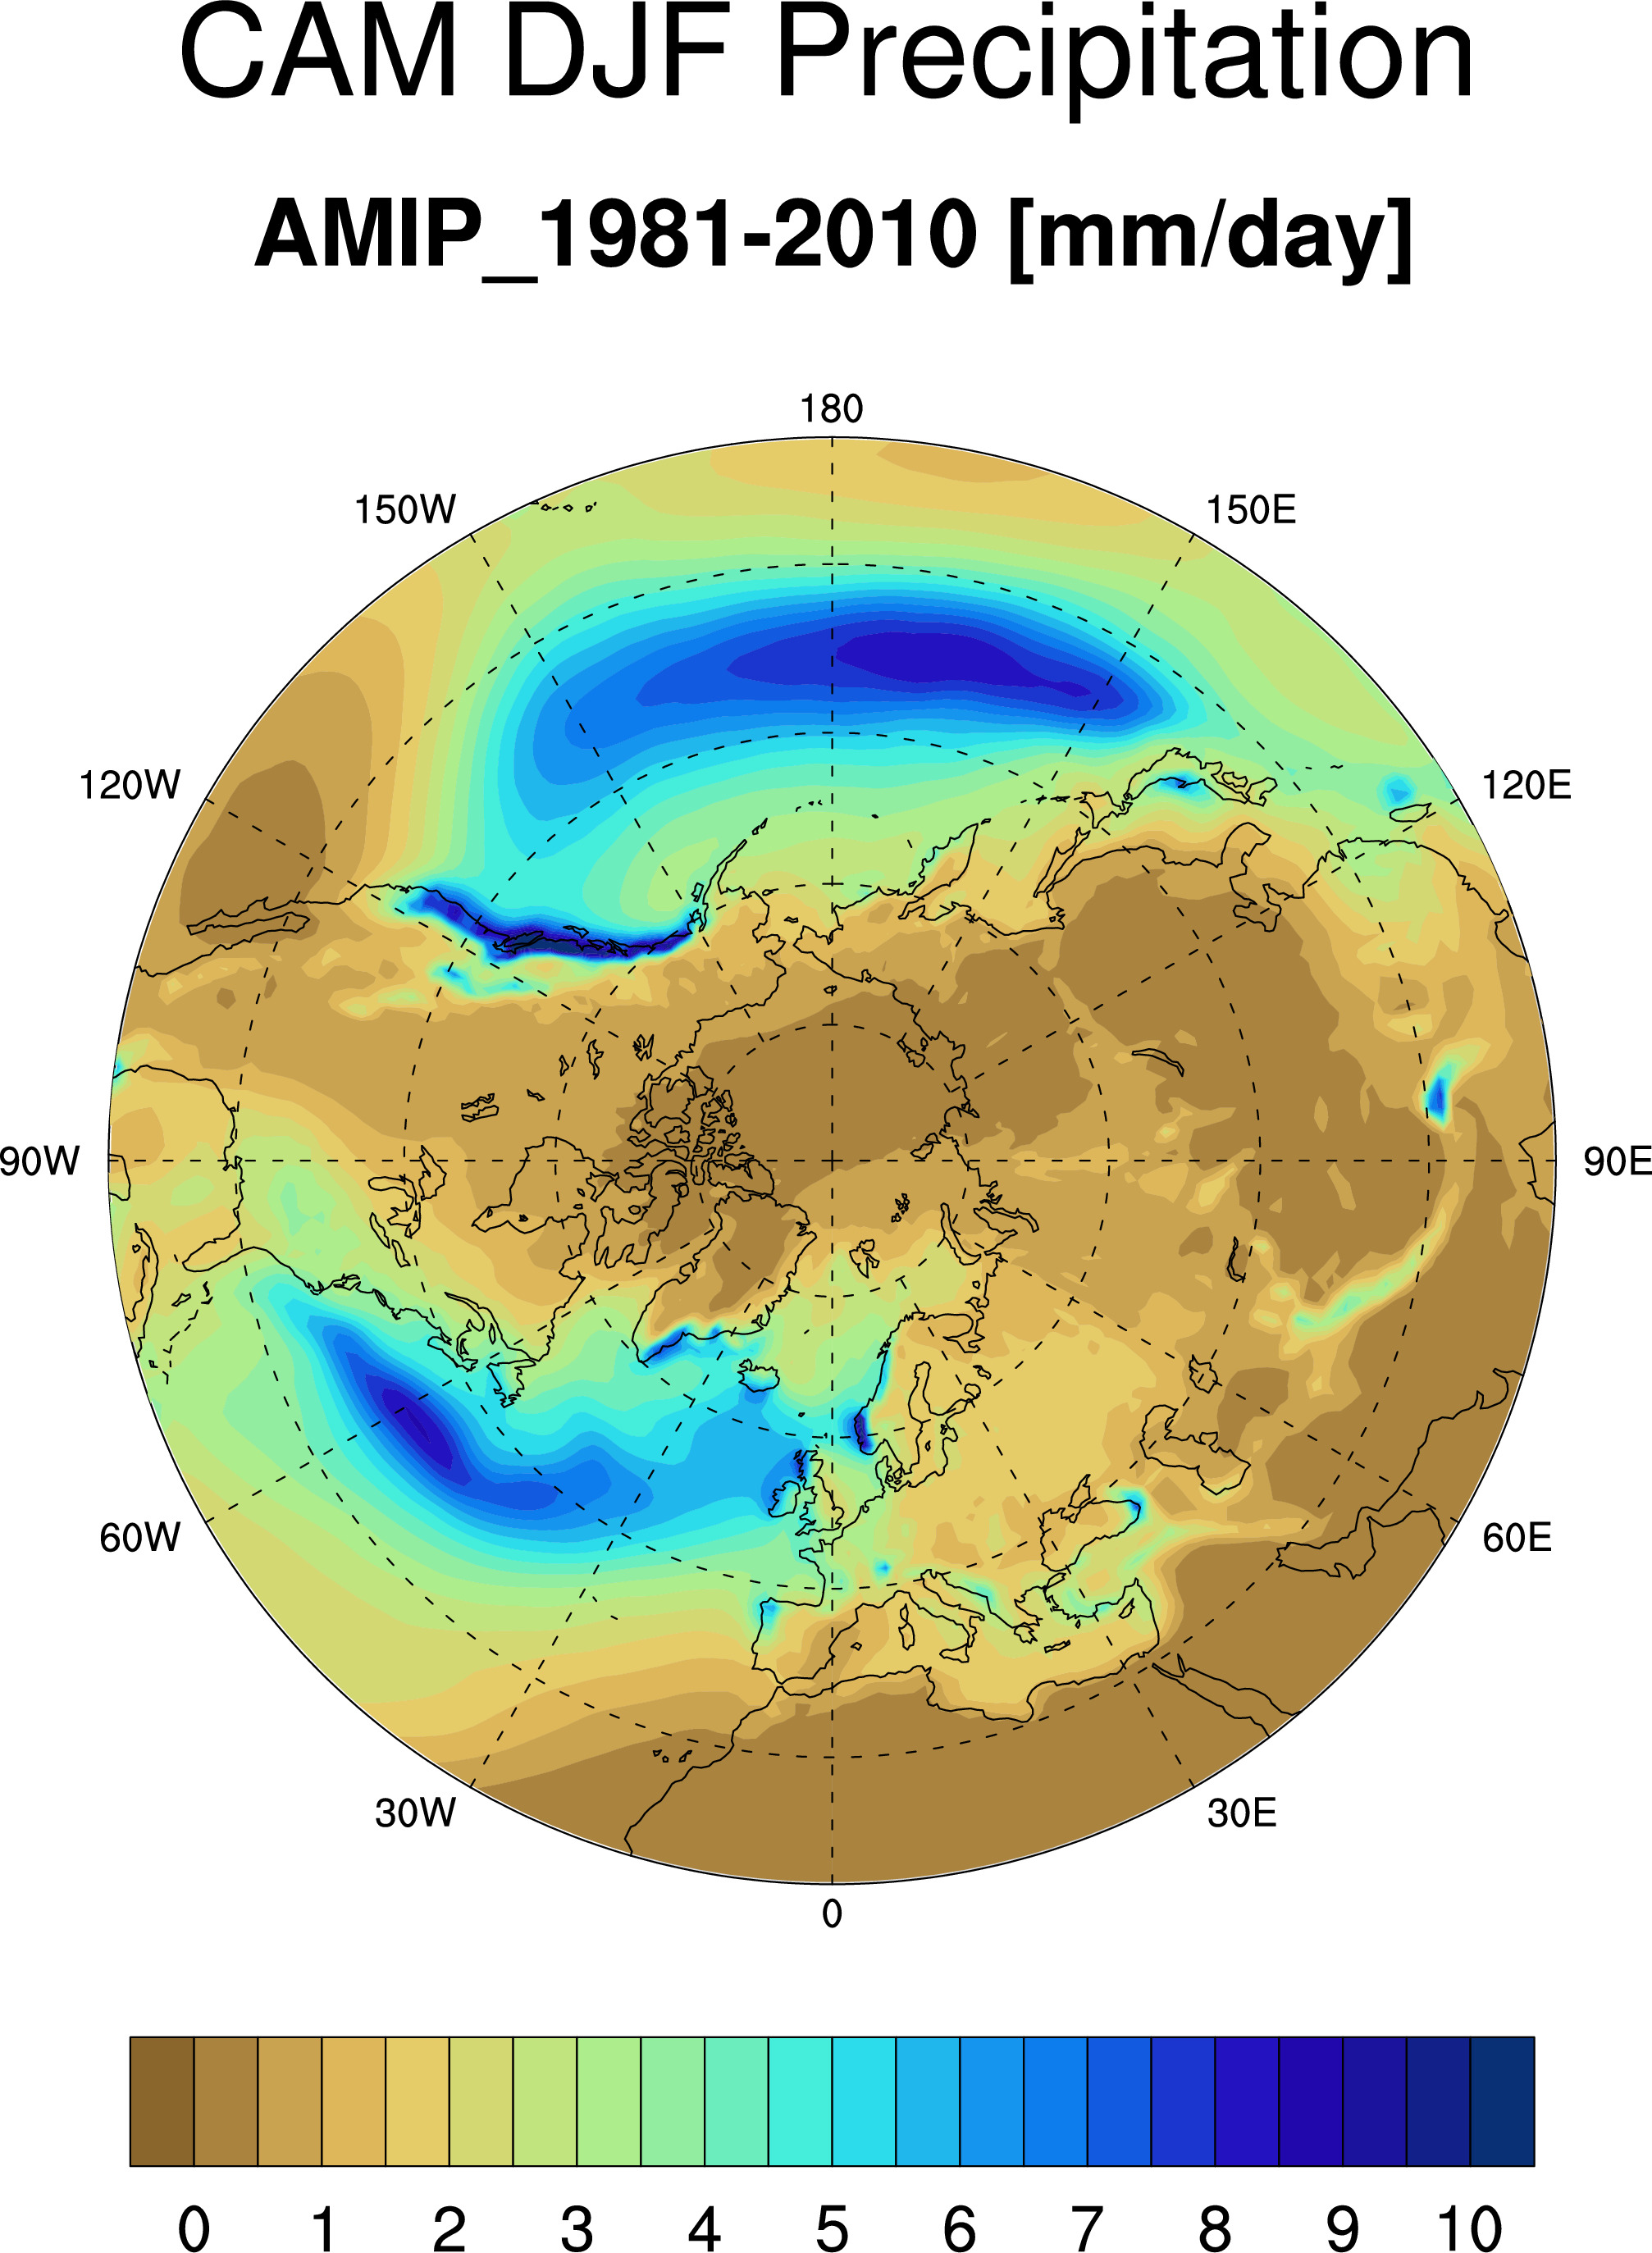
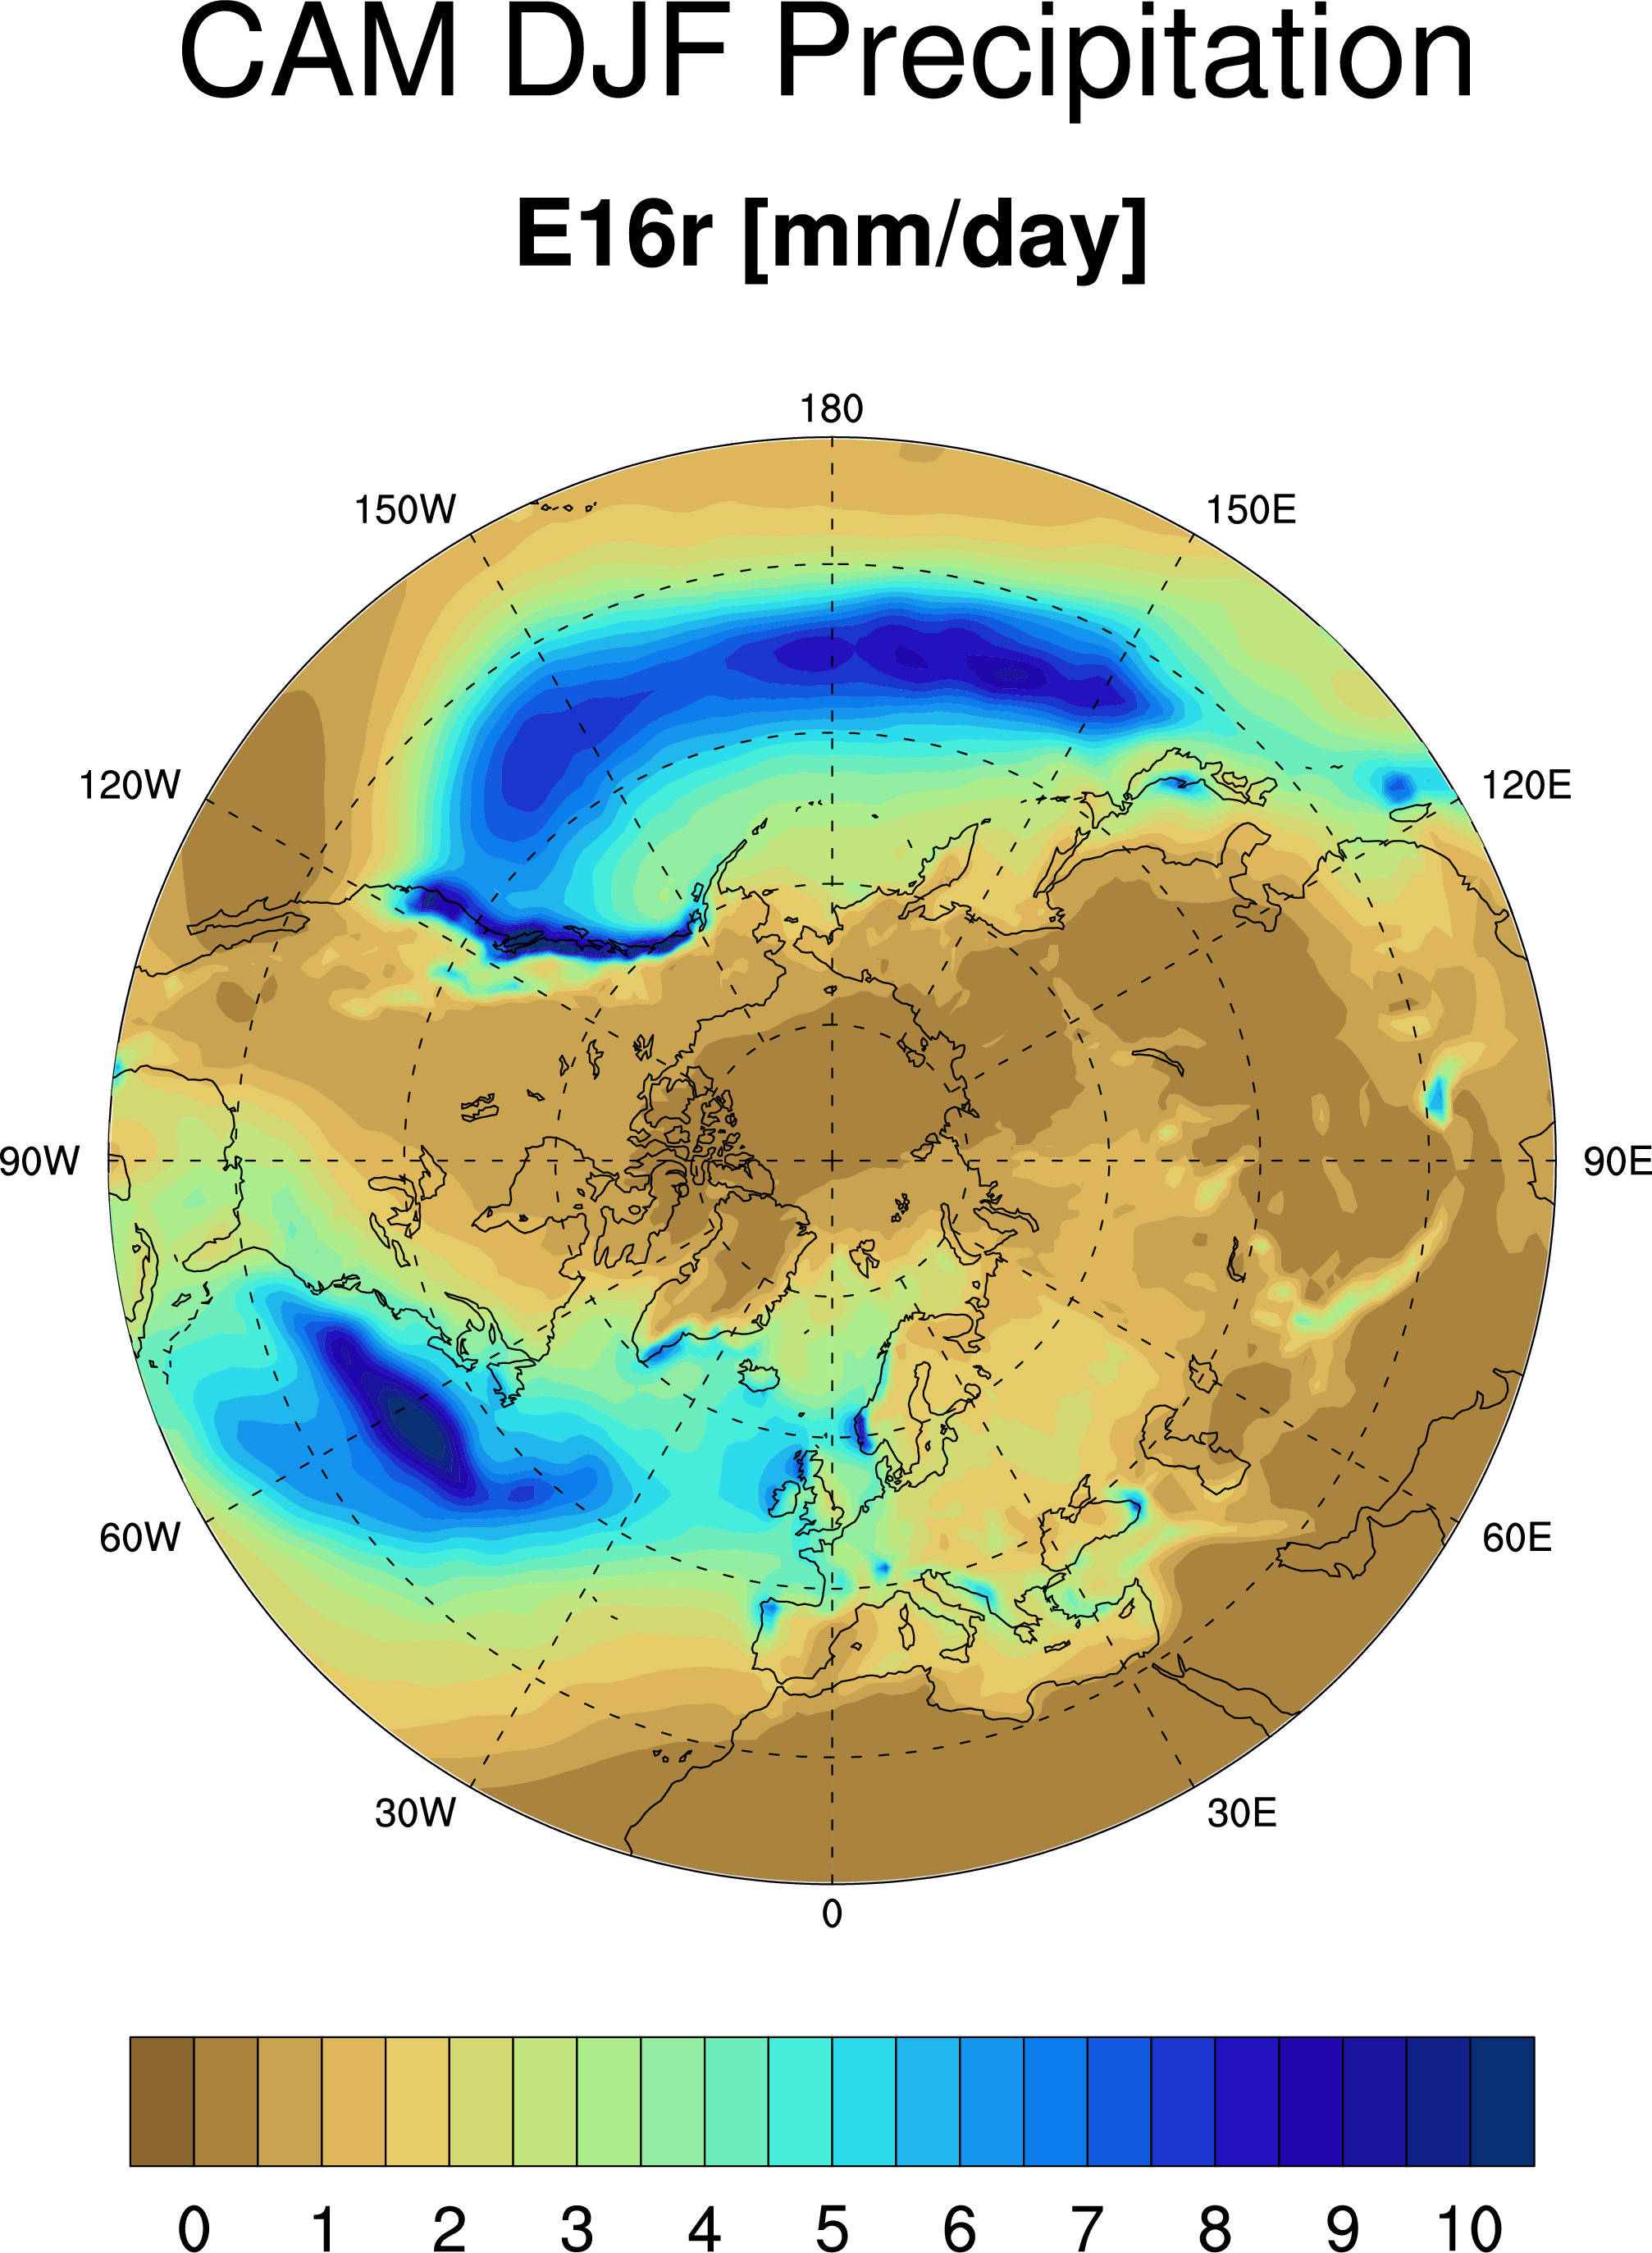
DJF mean precipitation:
-------------------------------------------------------------------
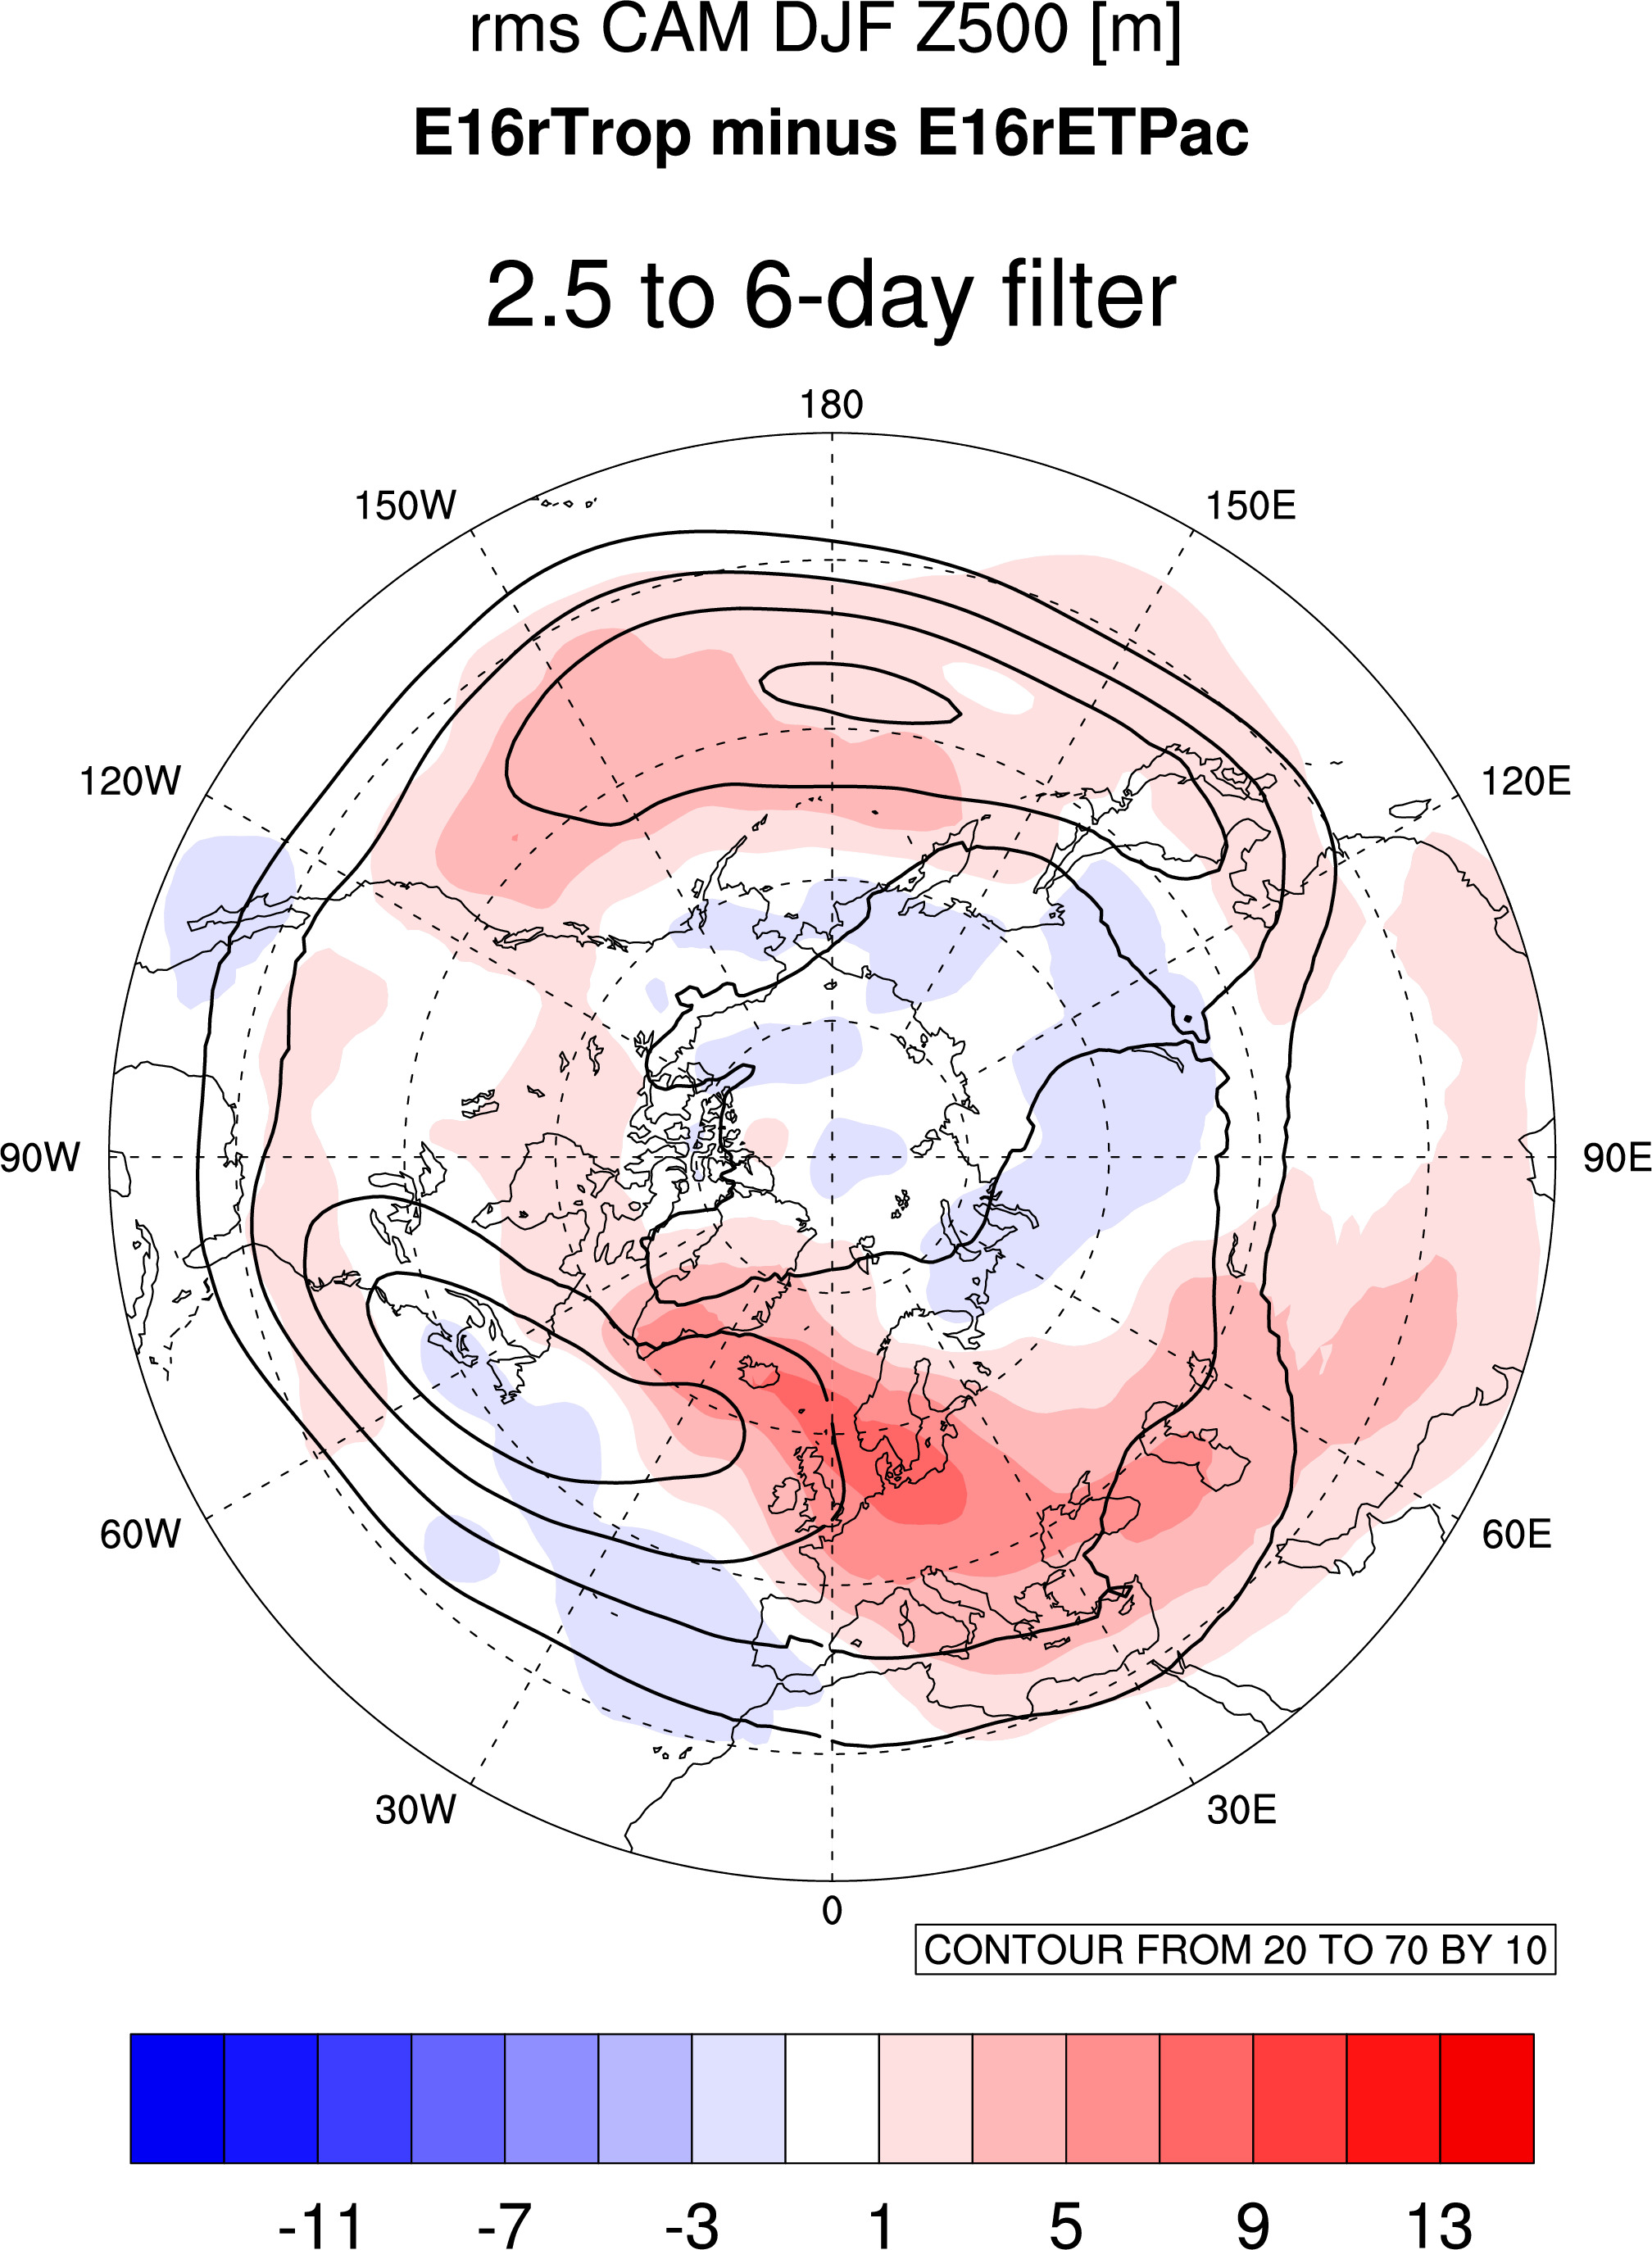
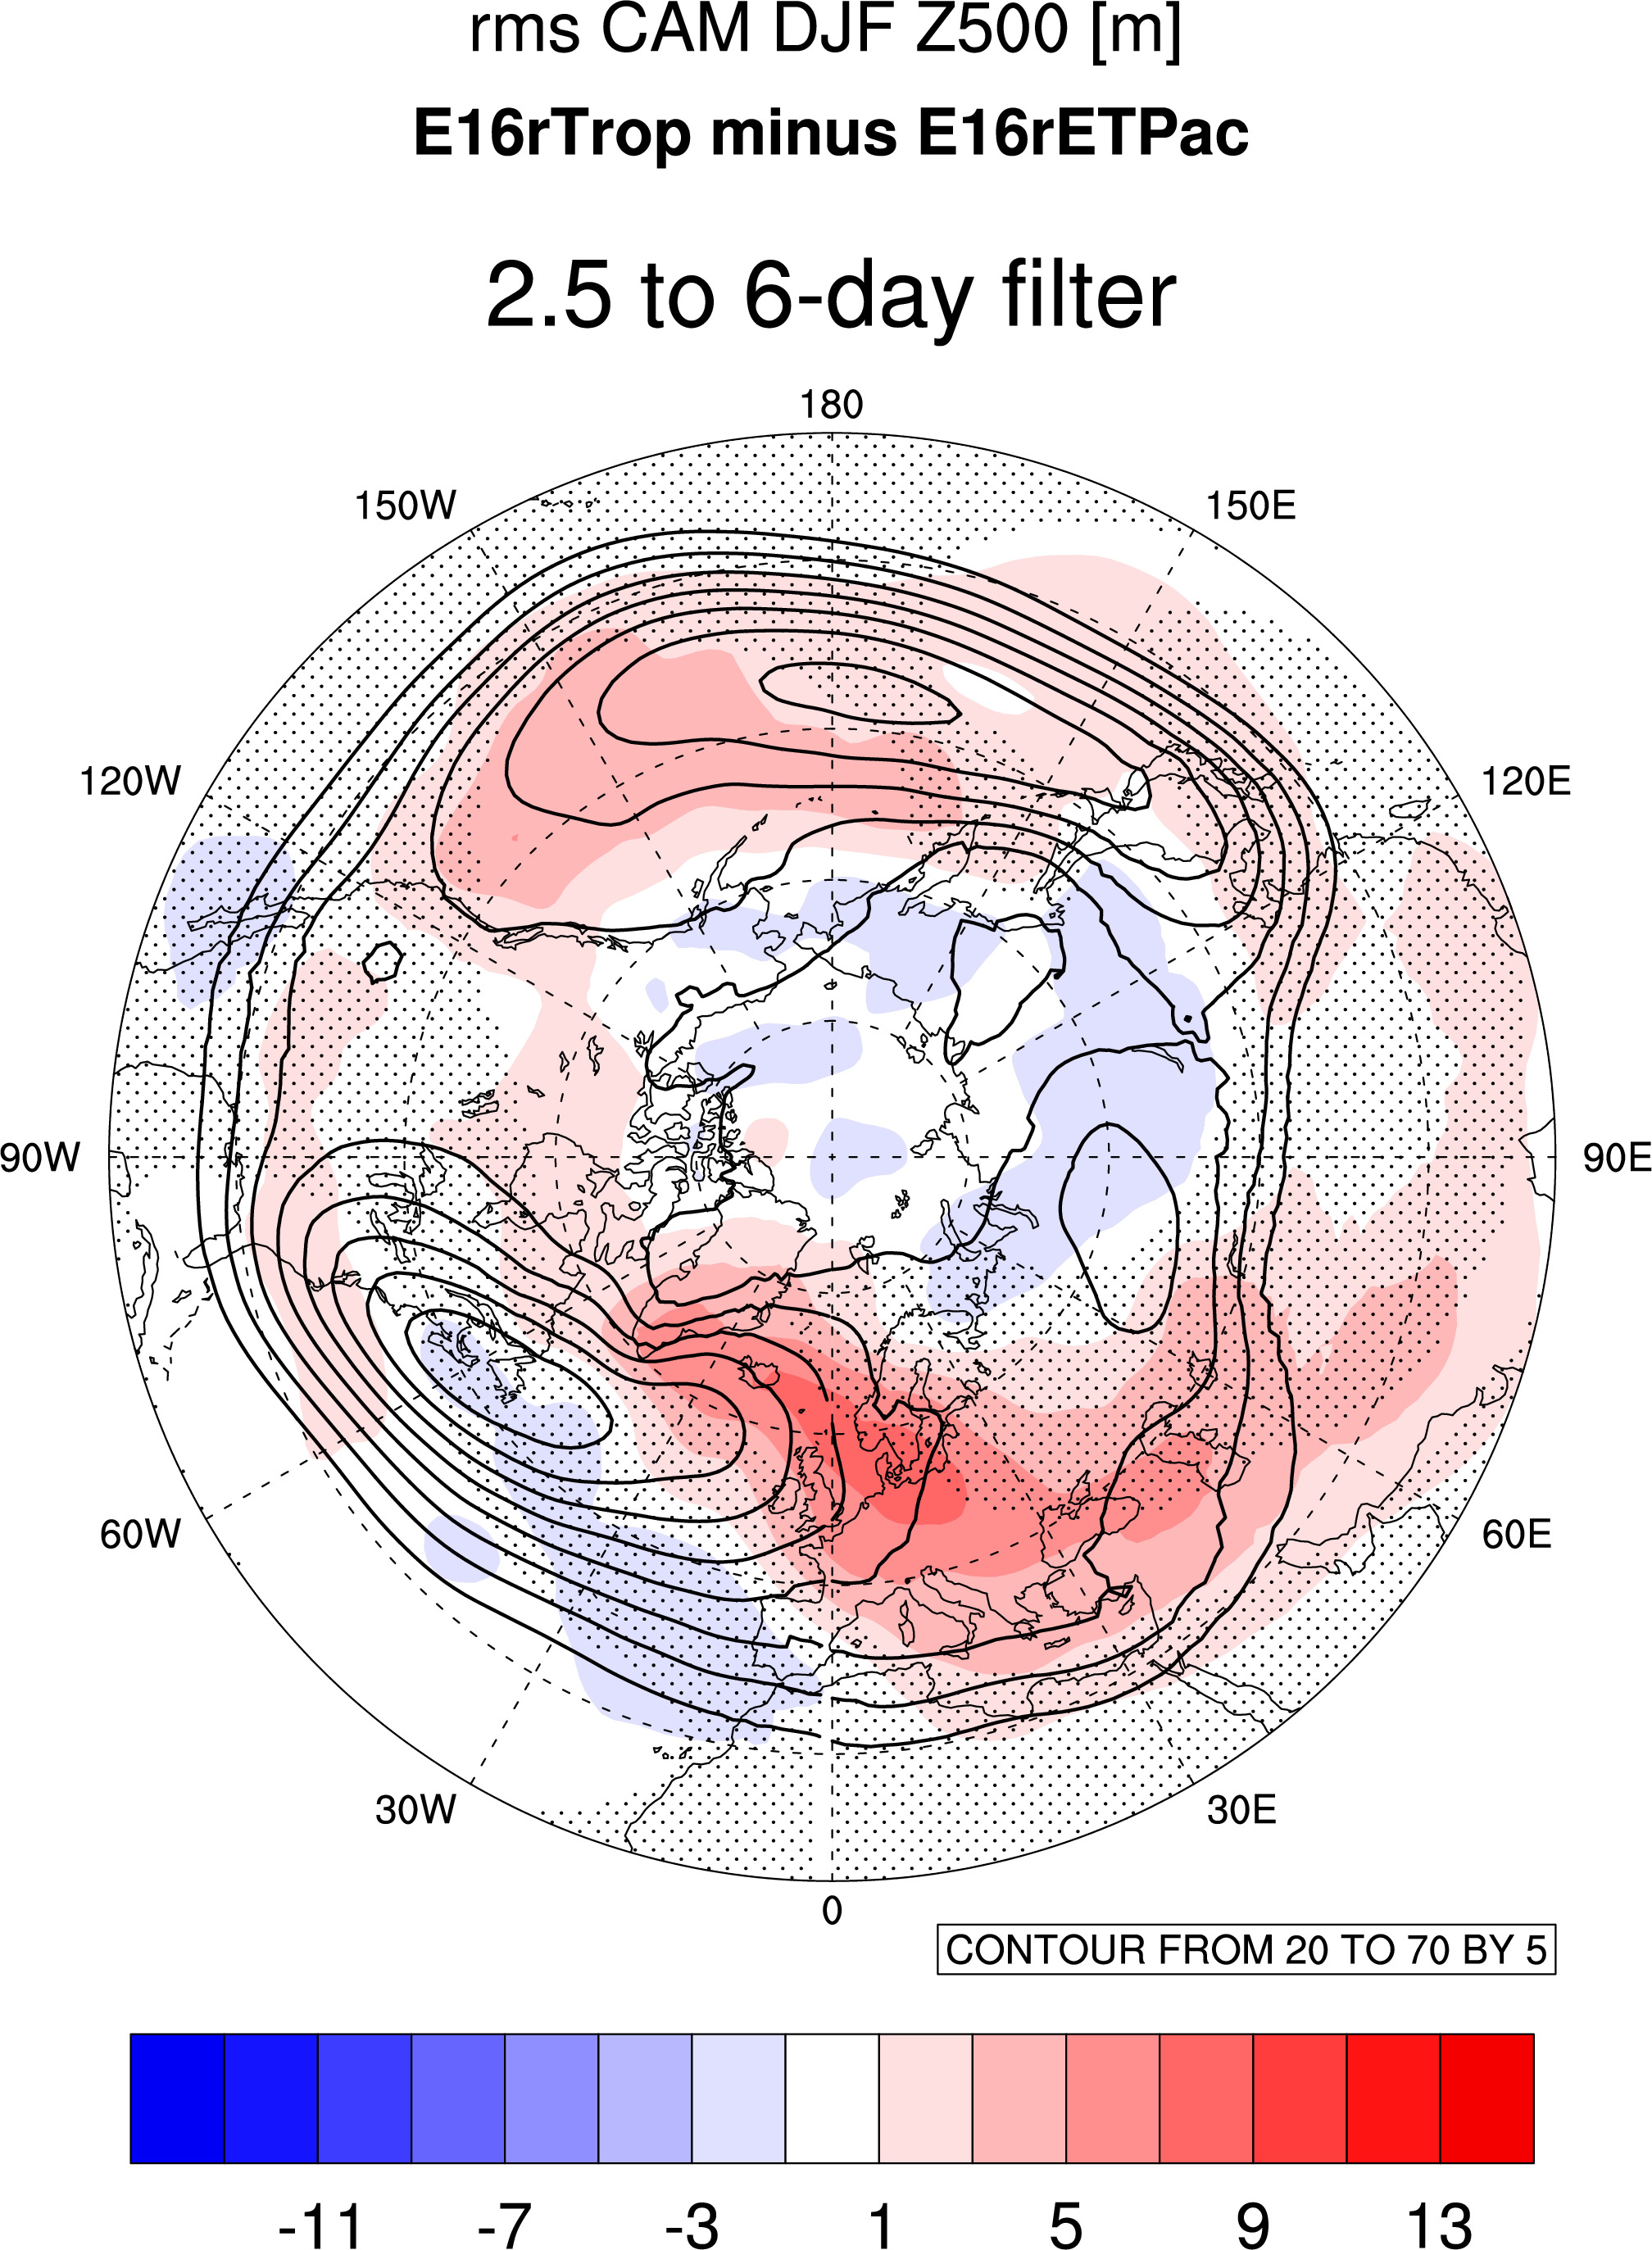
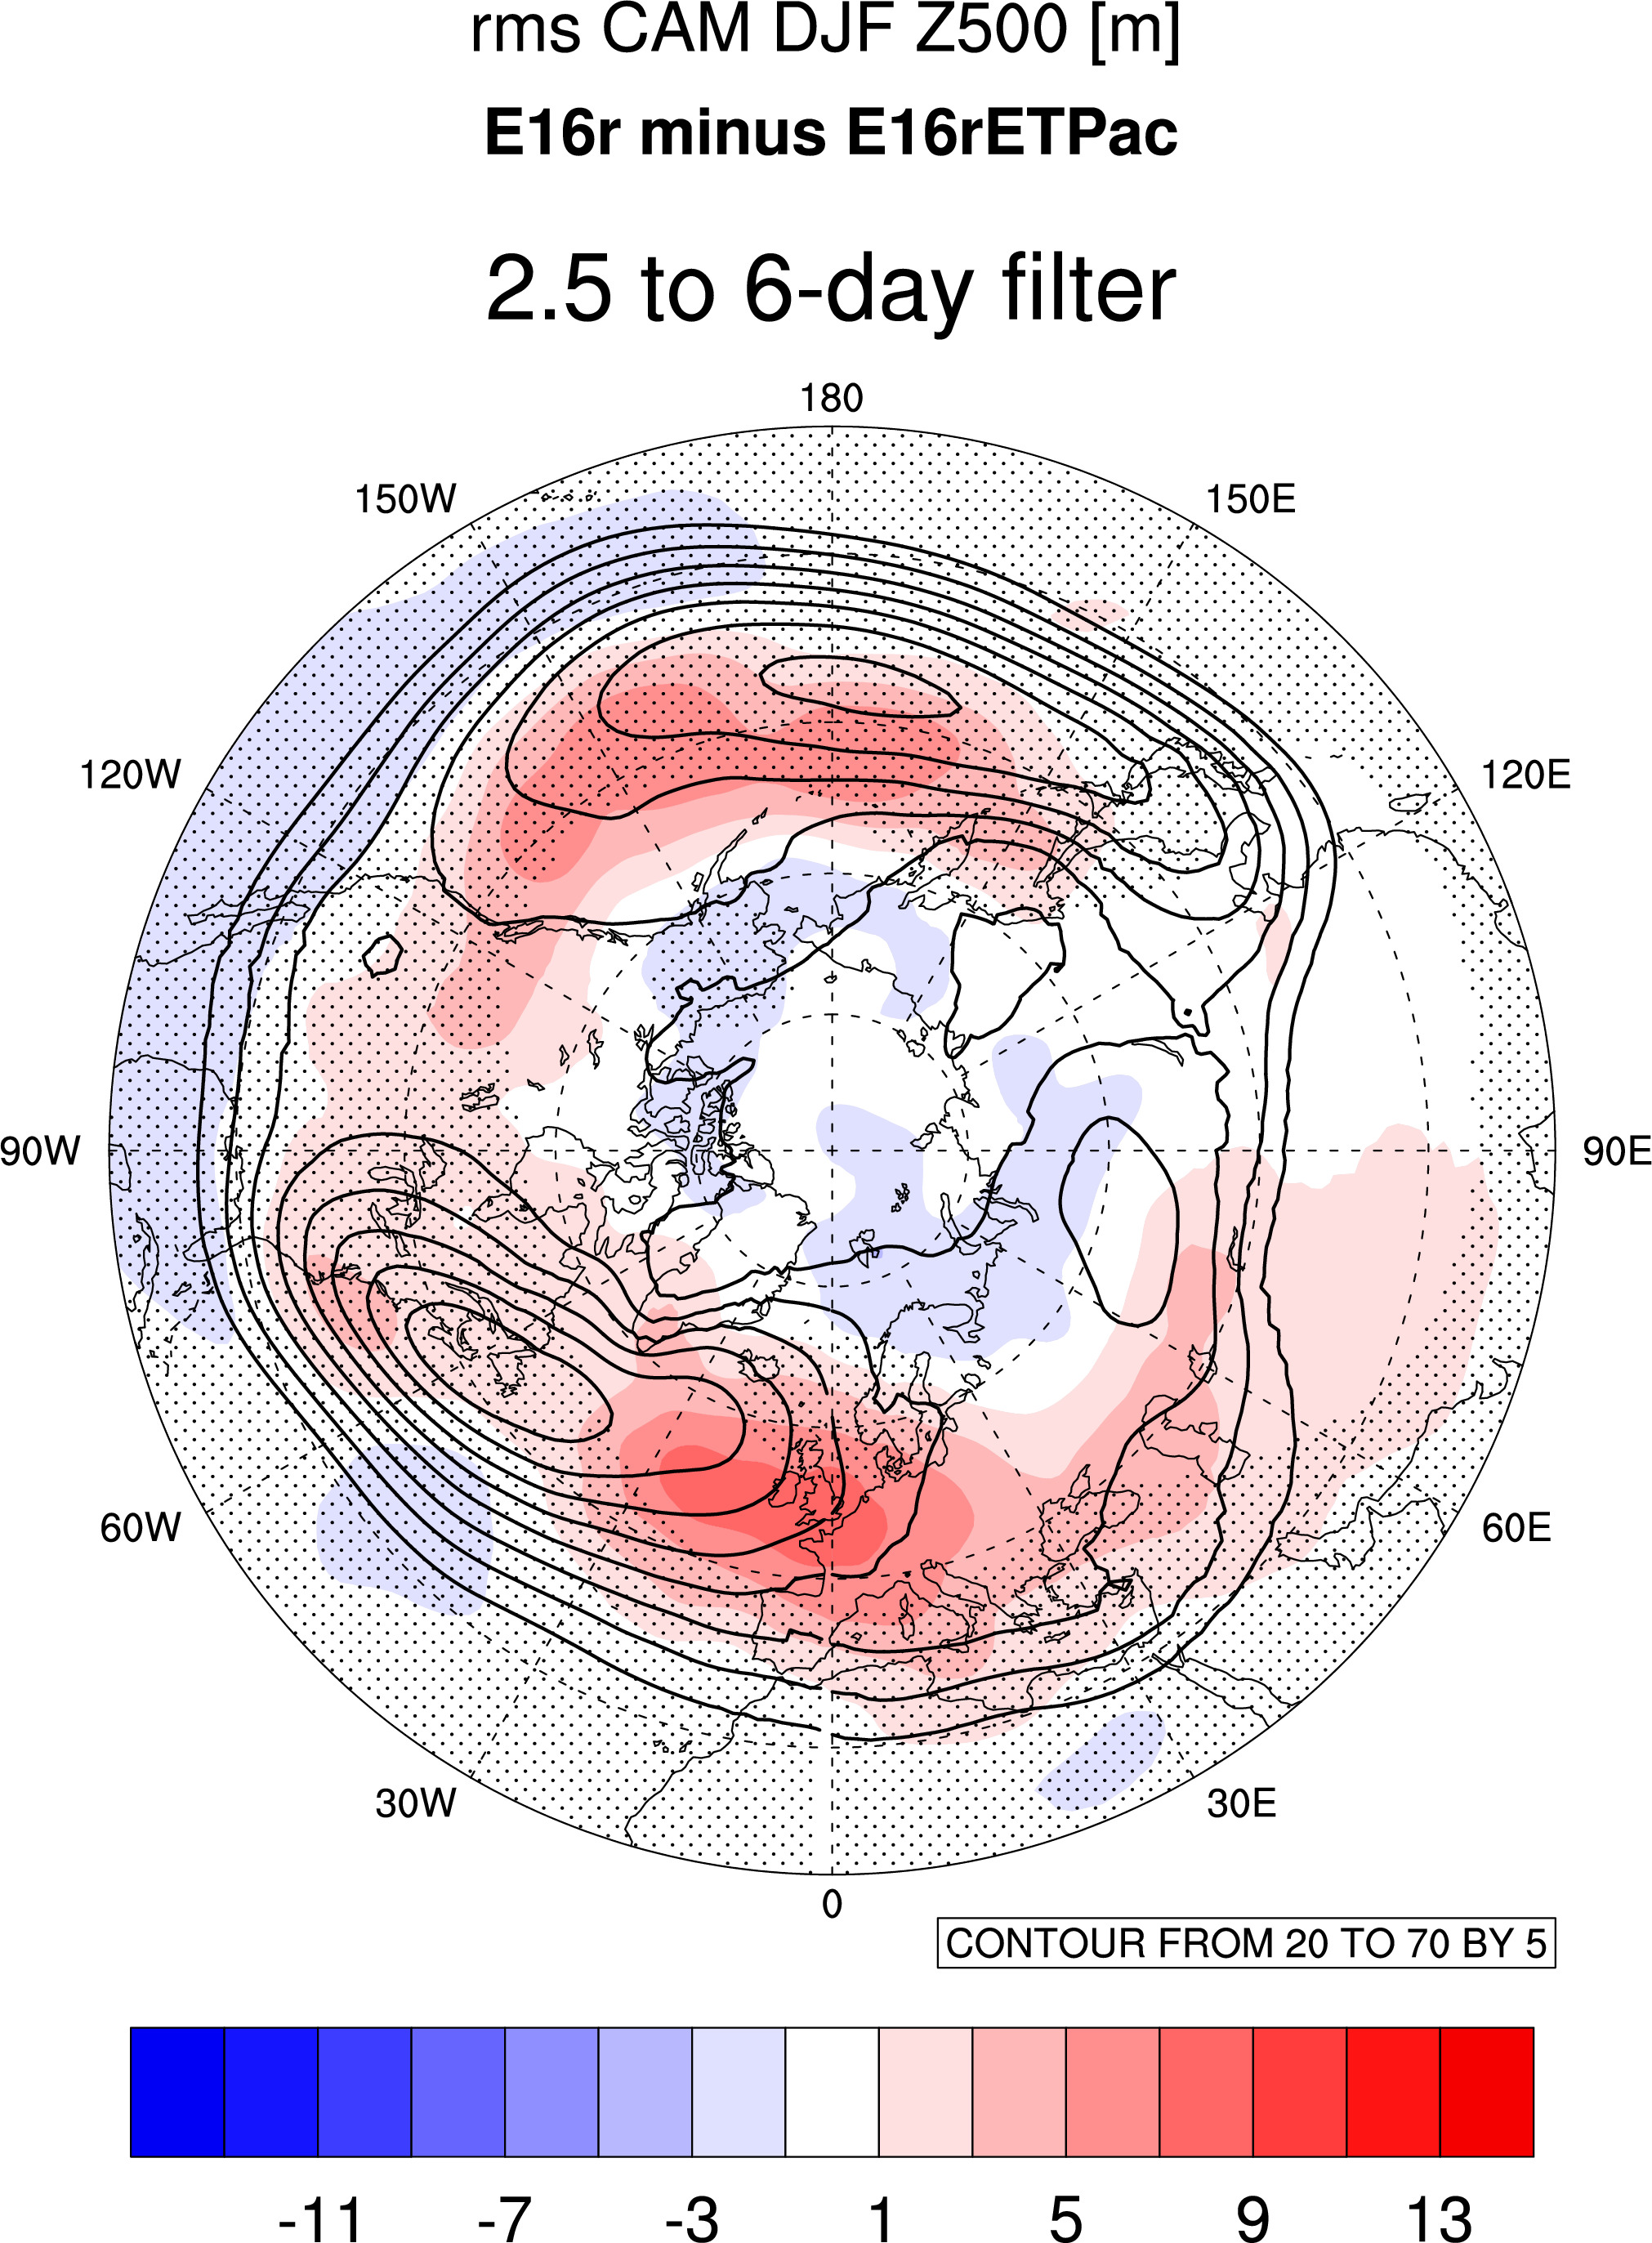
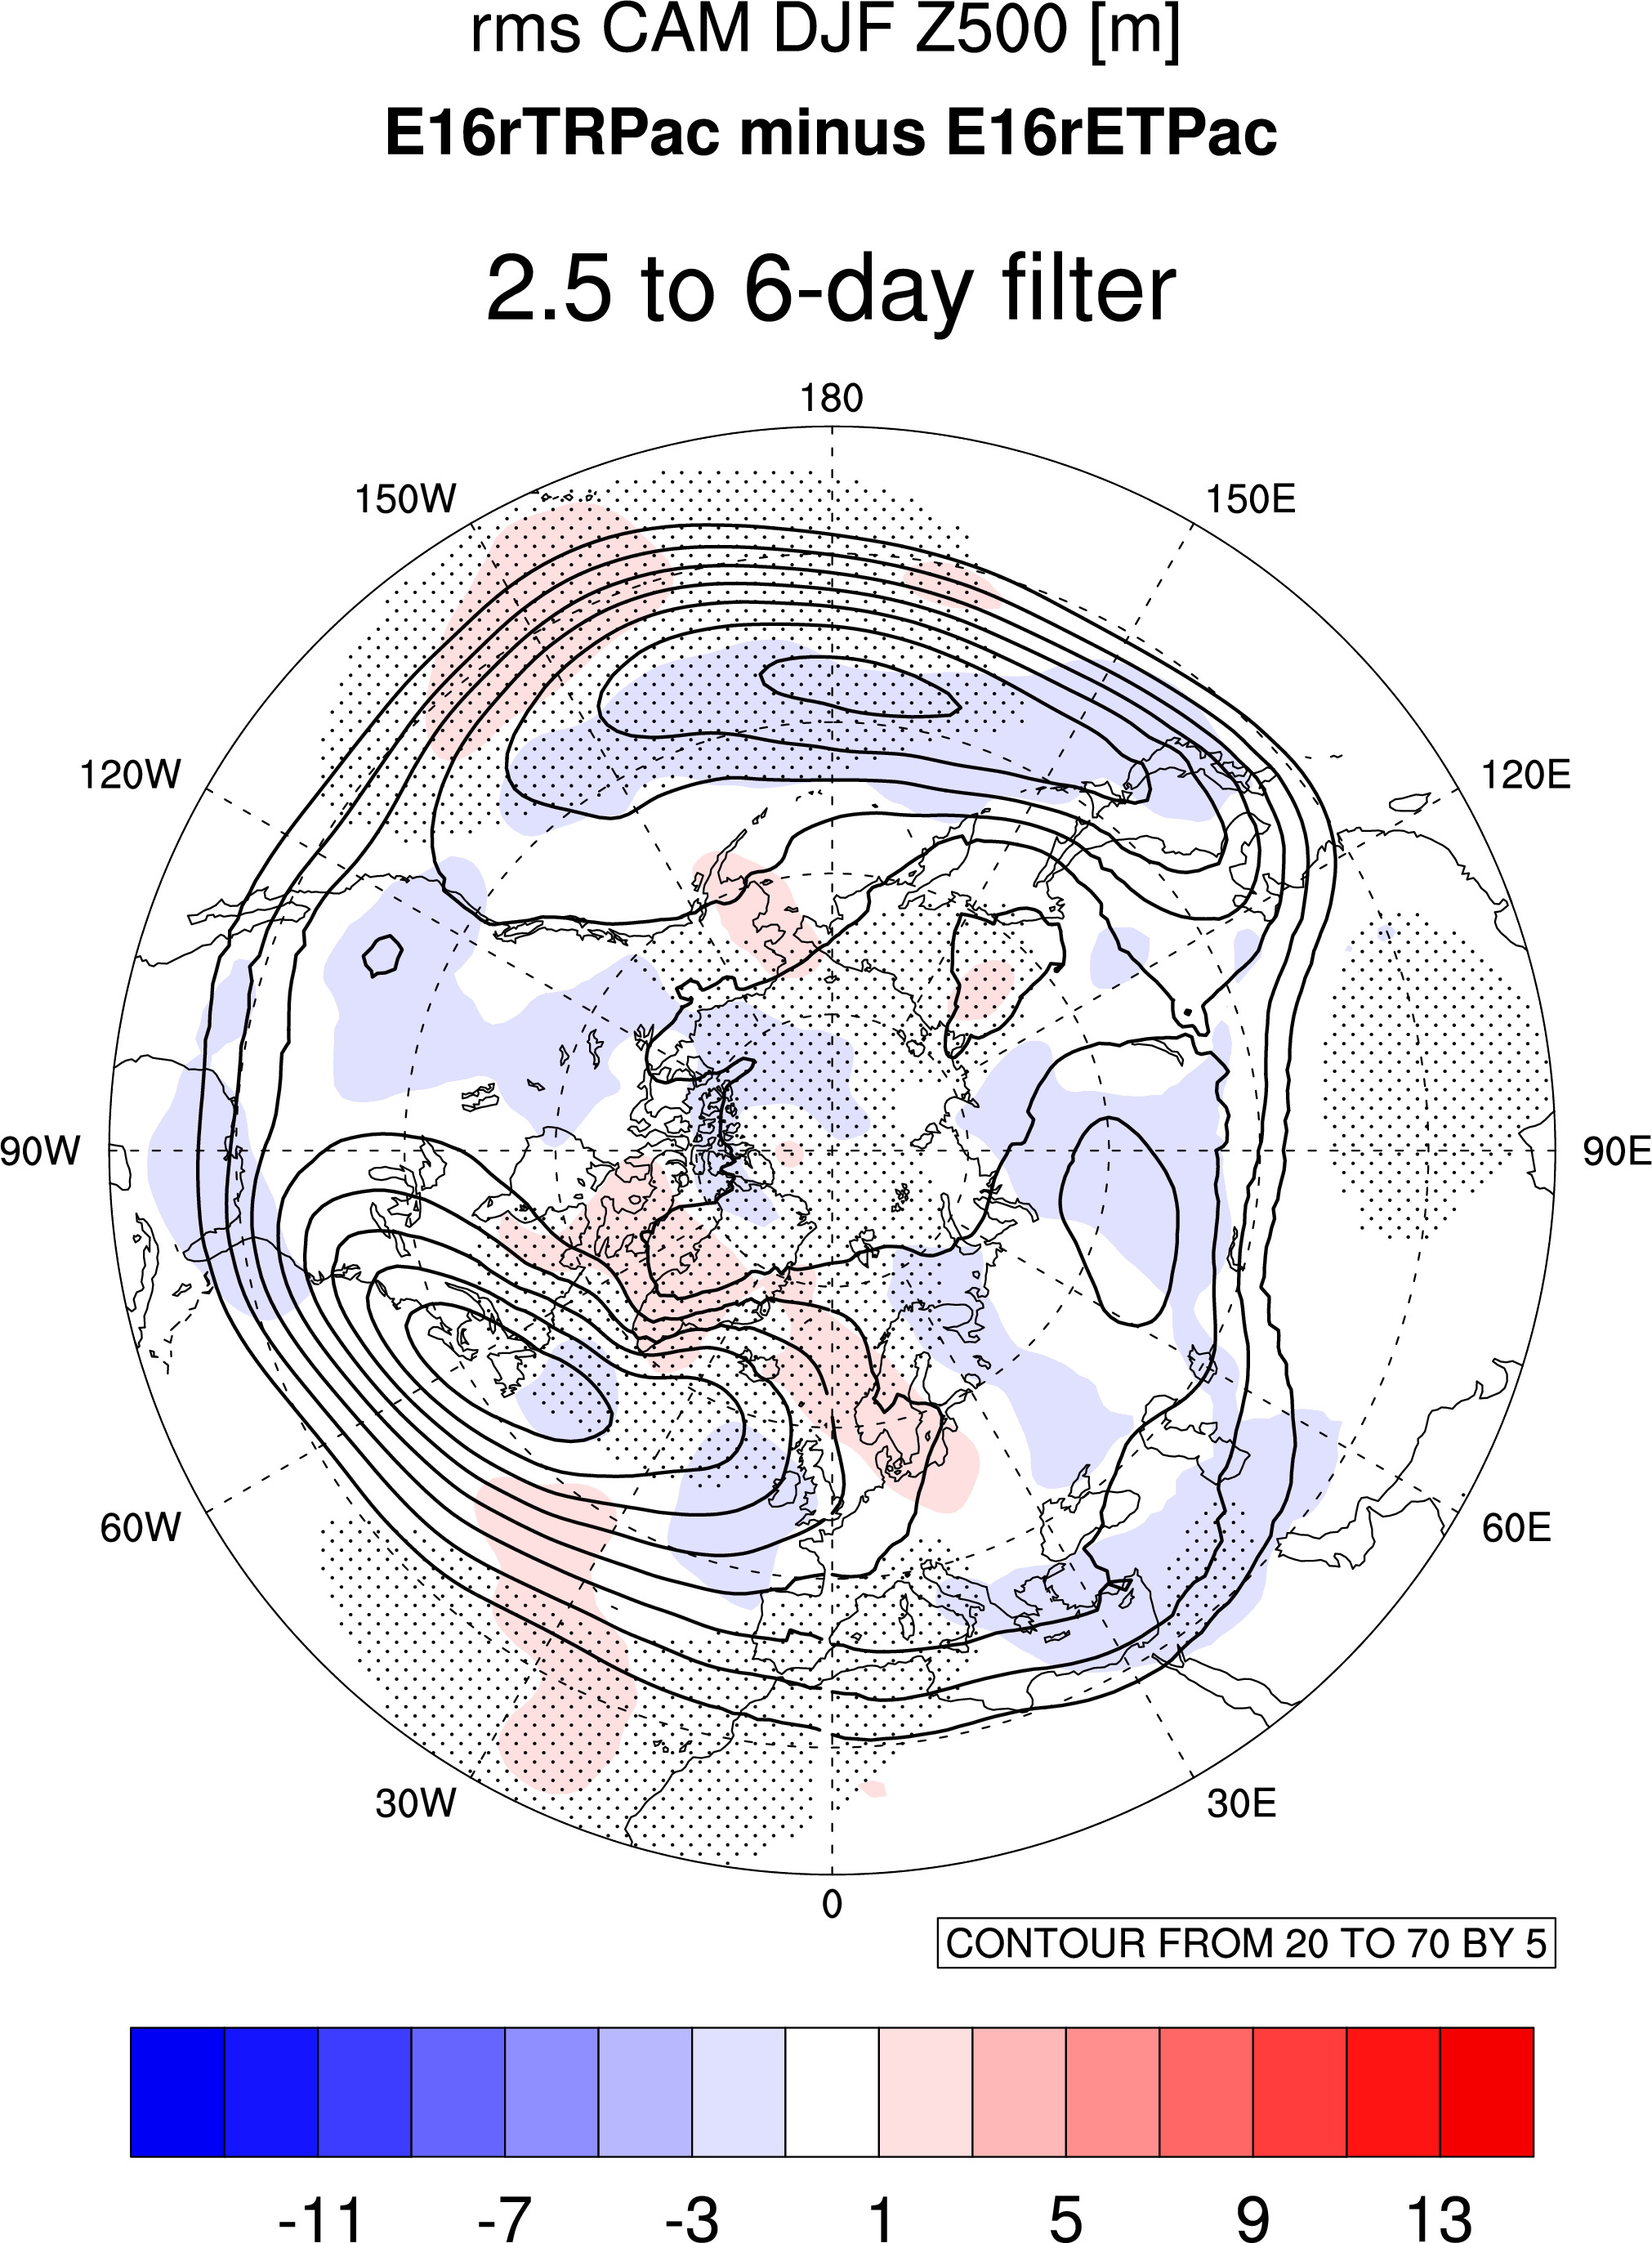
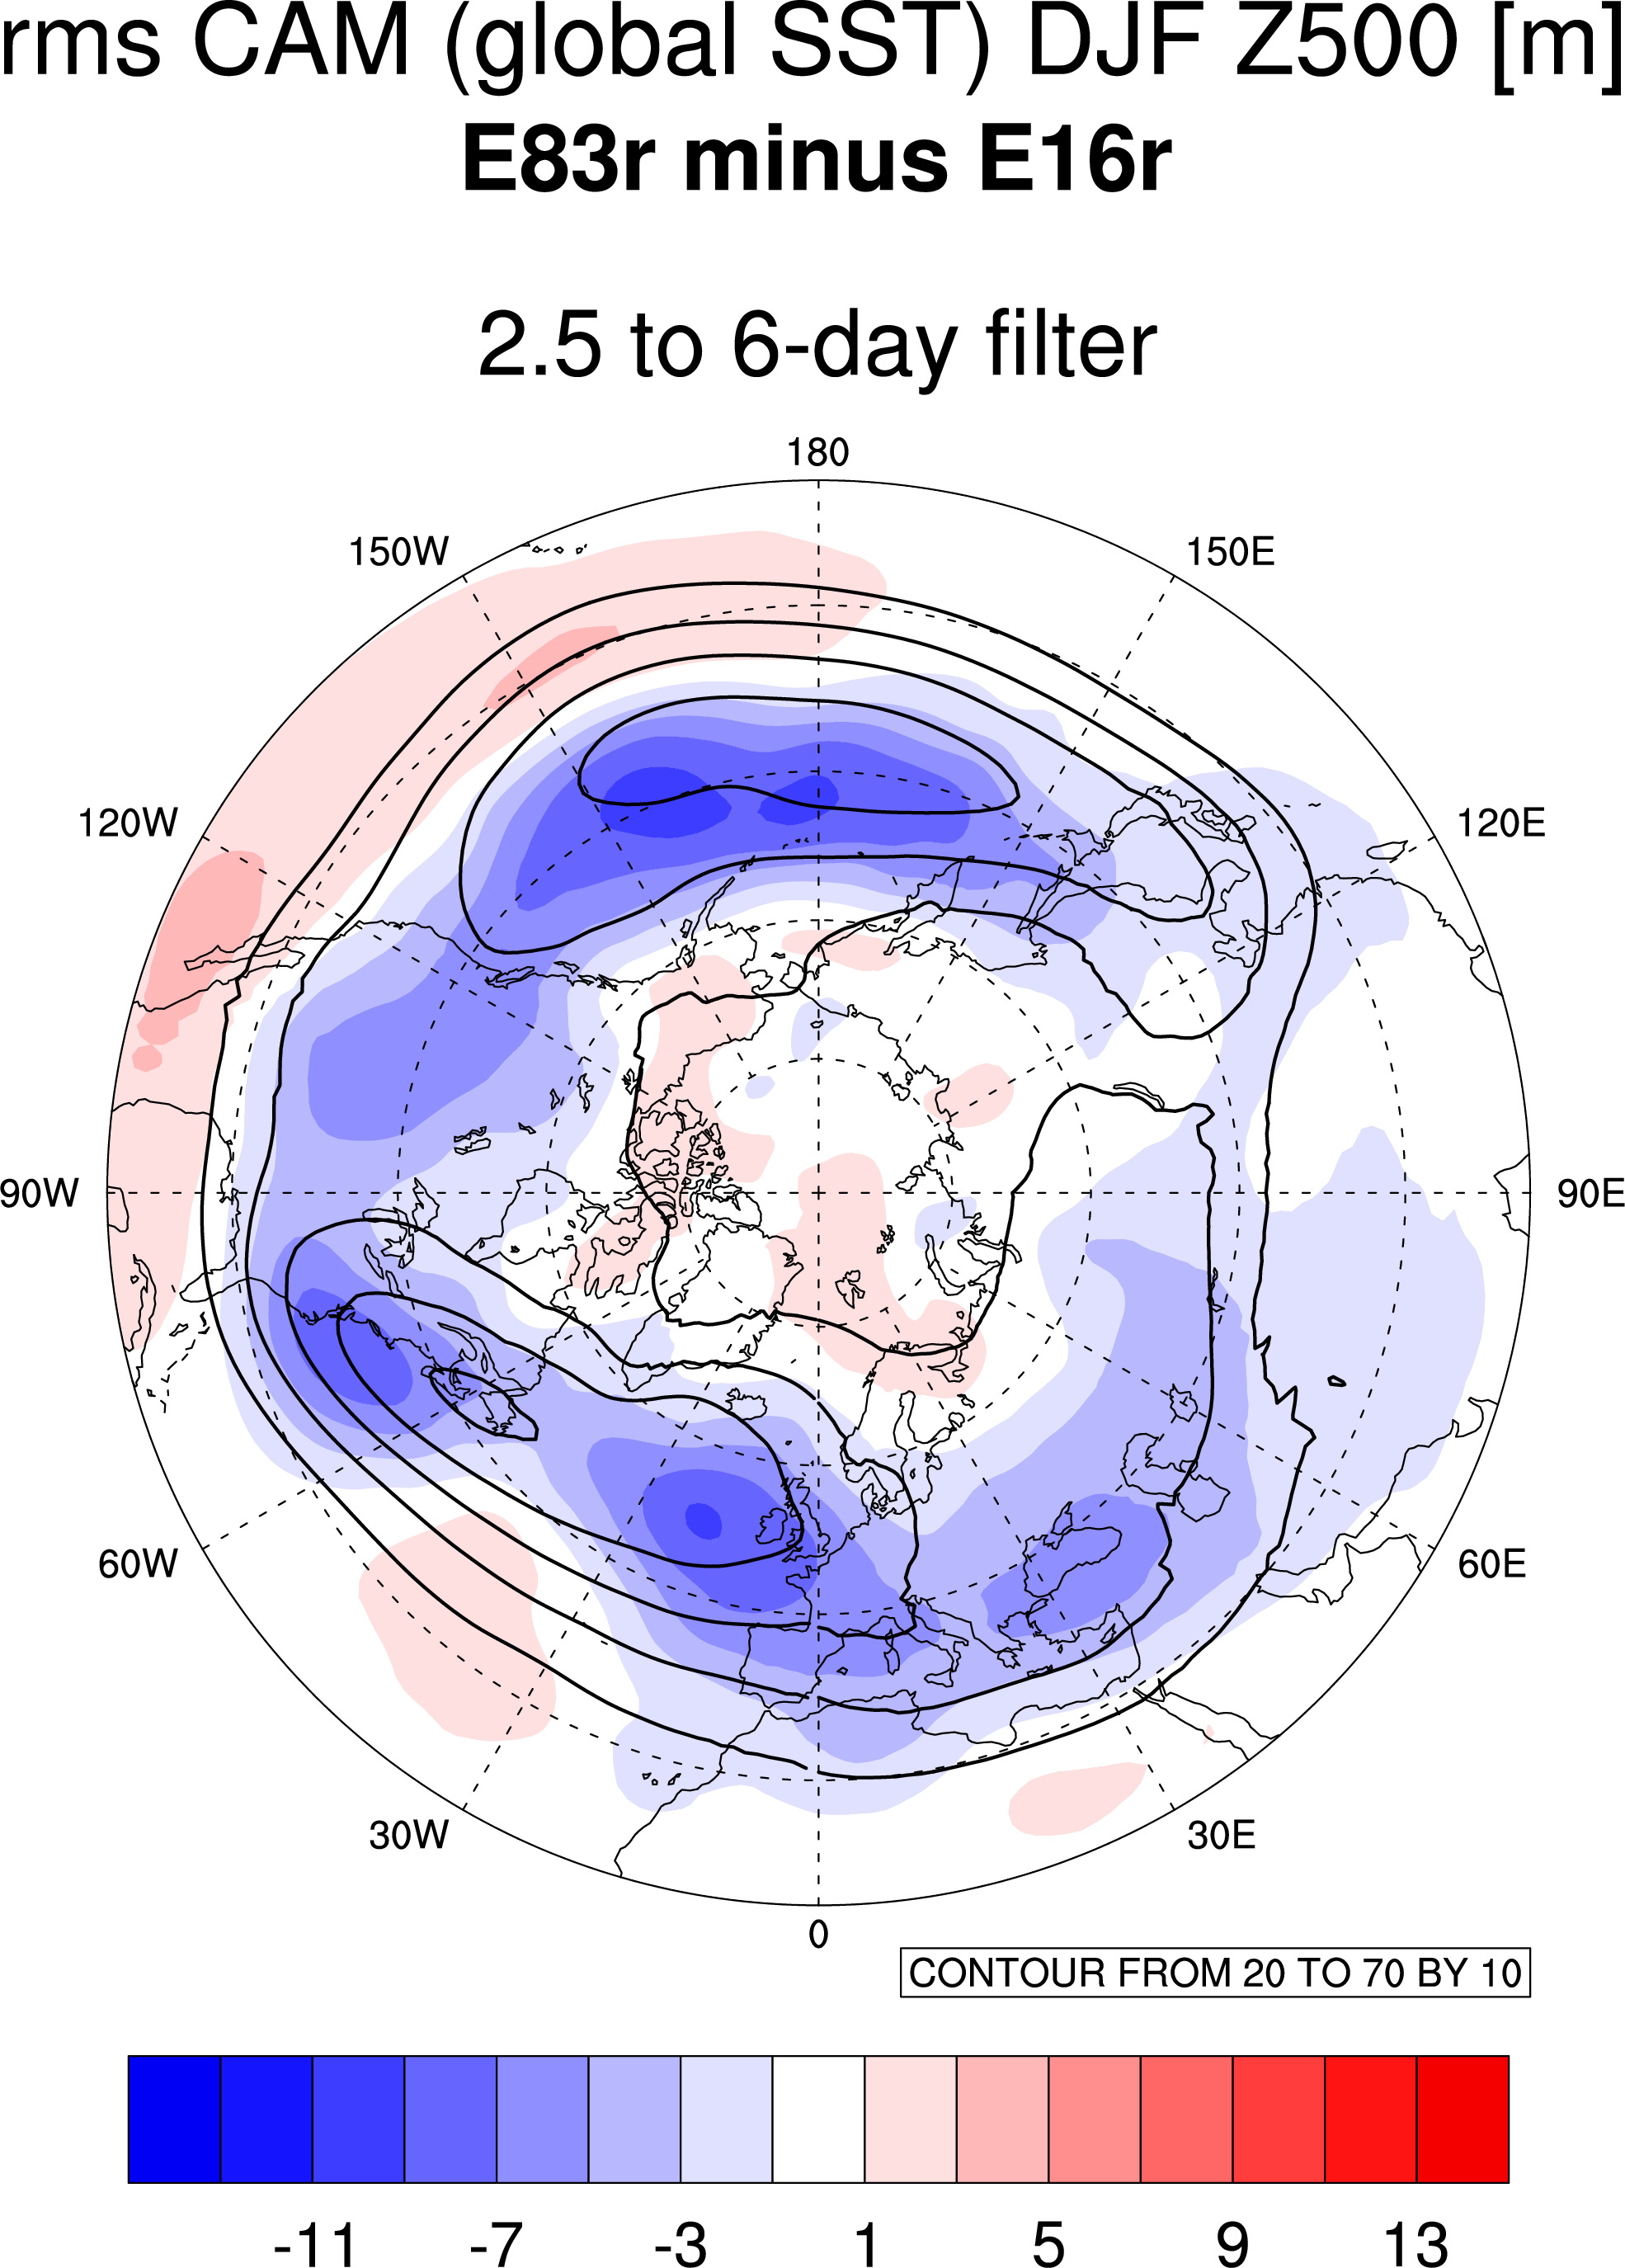
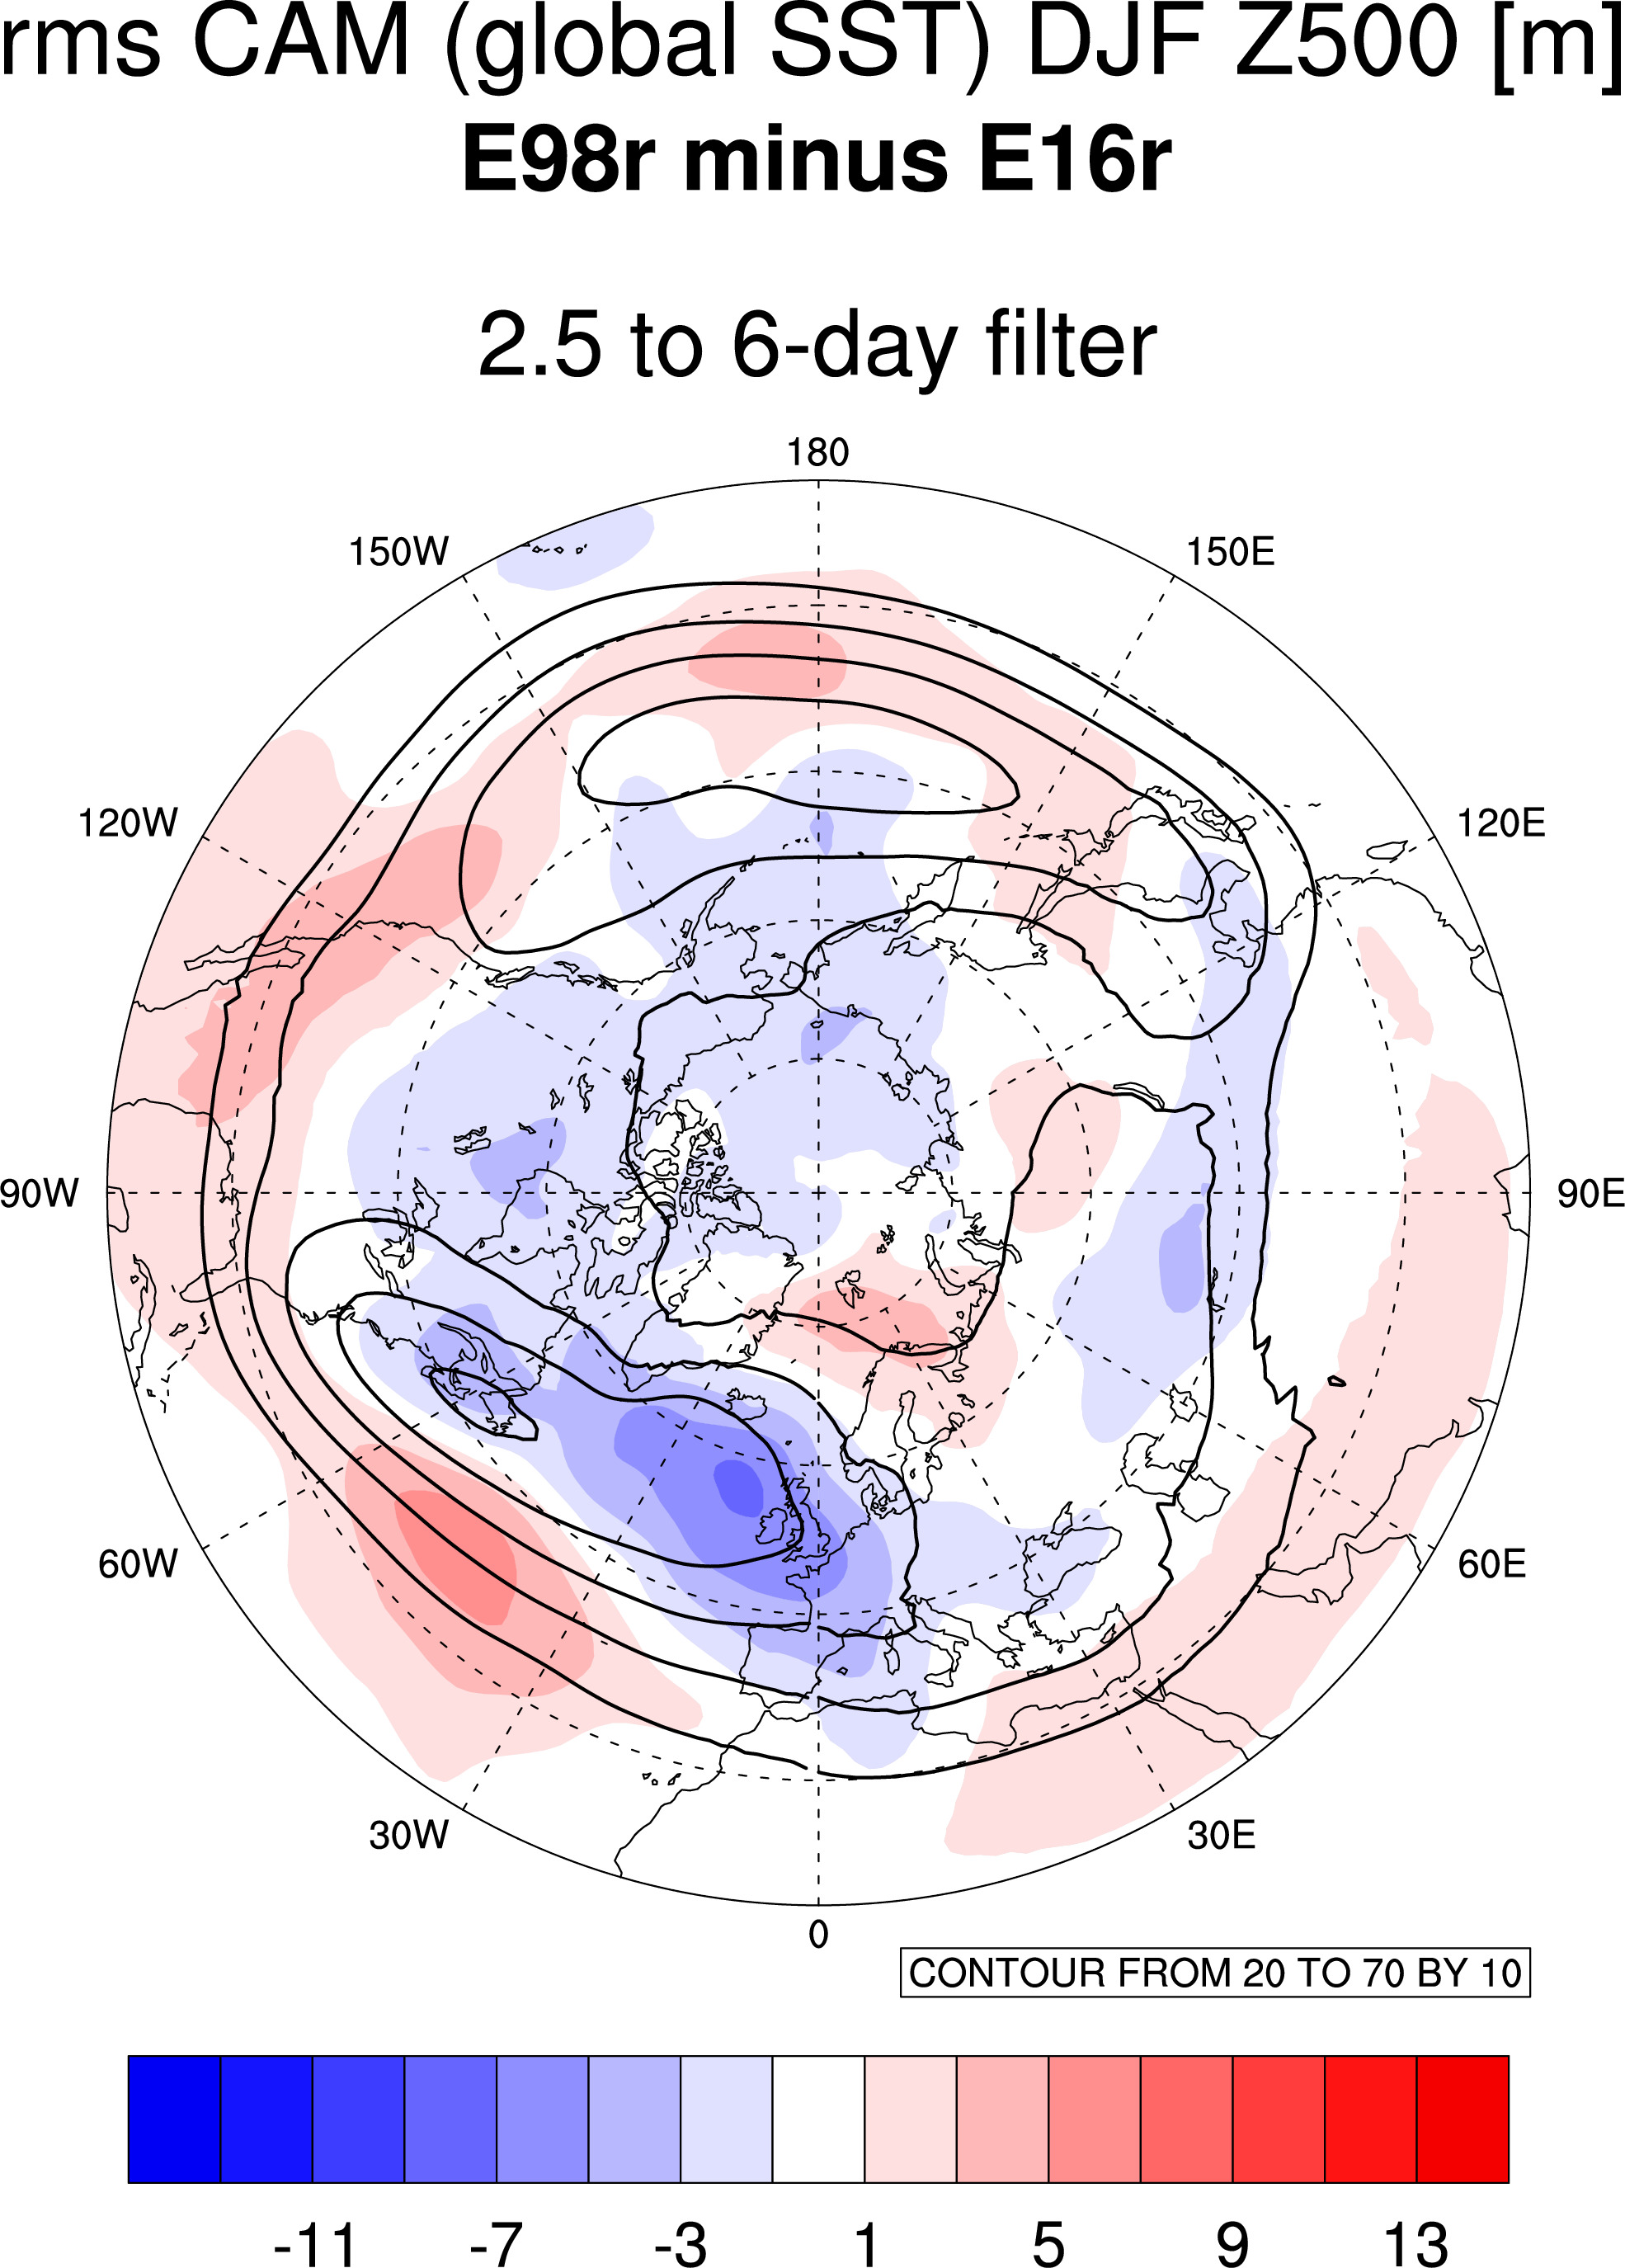
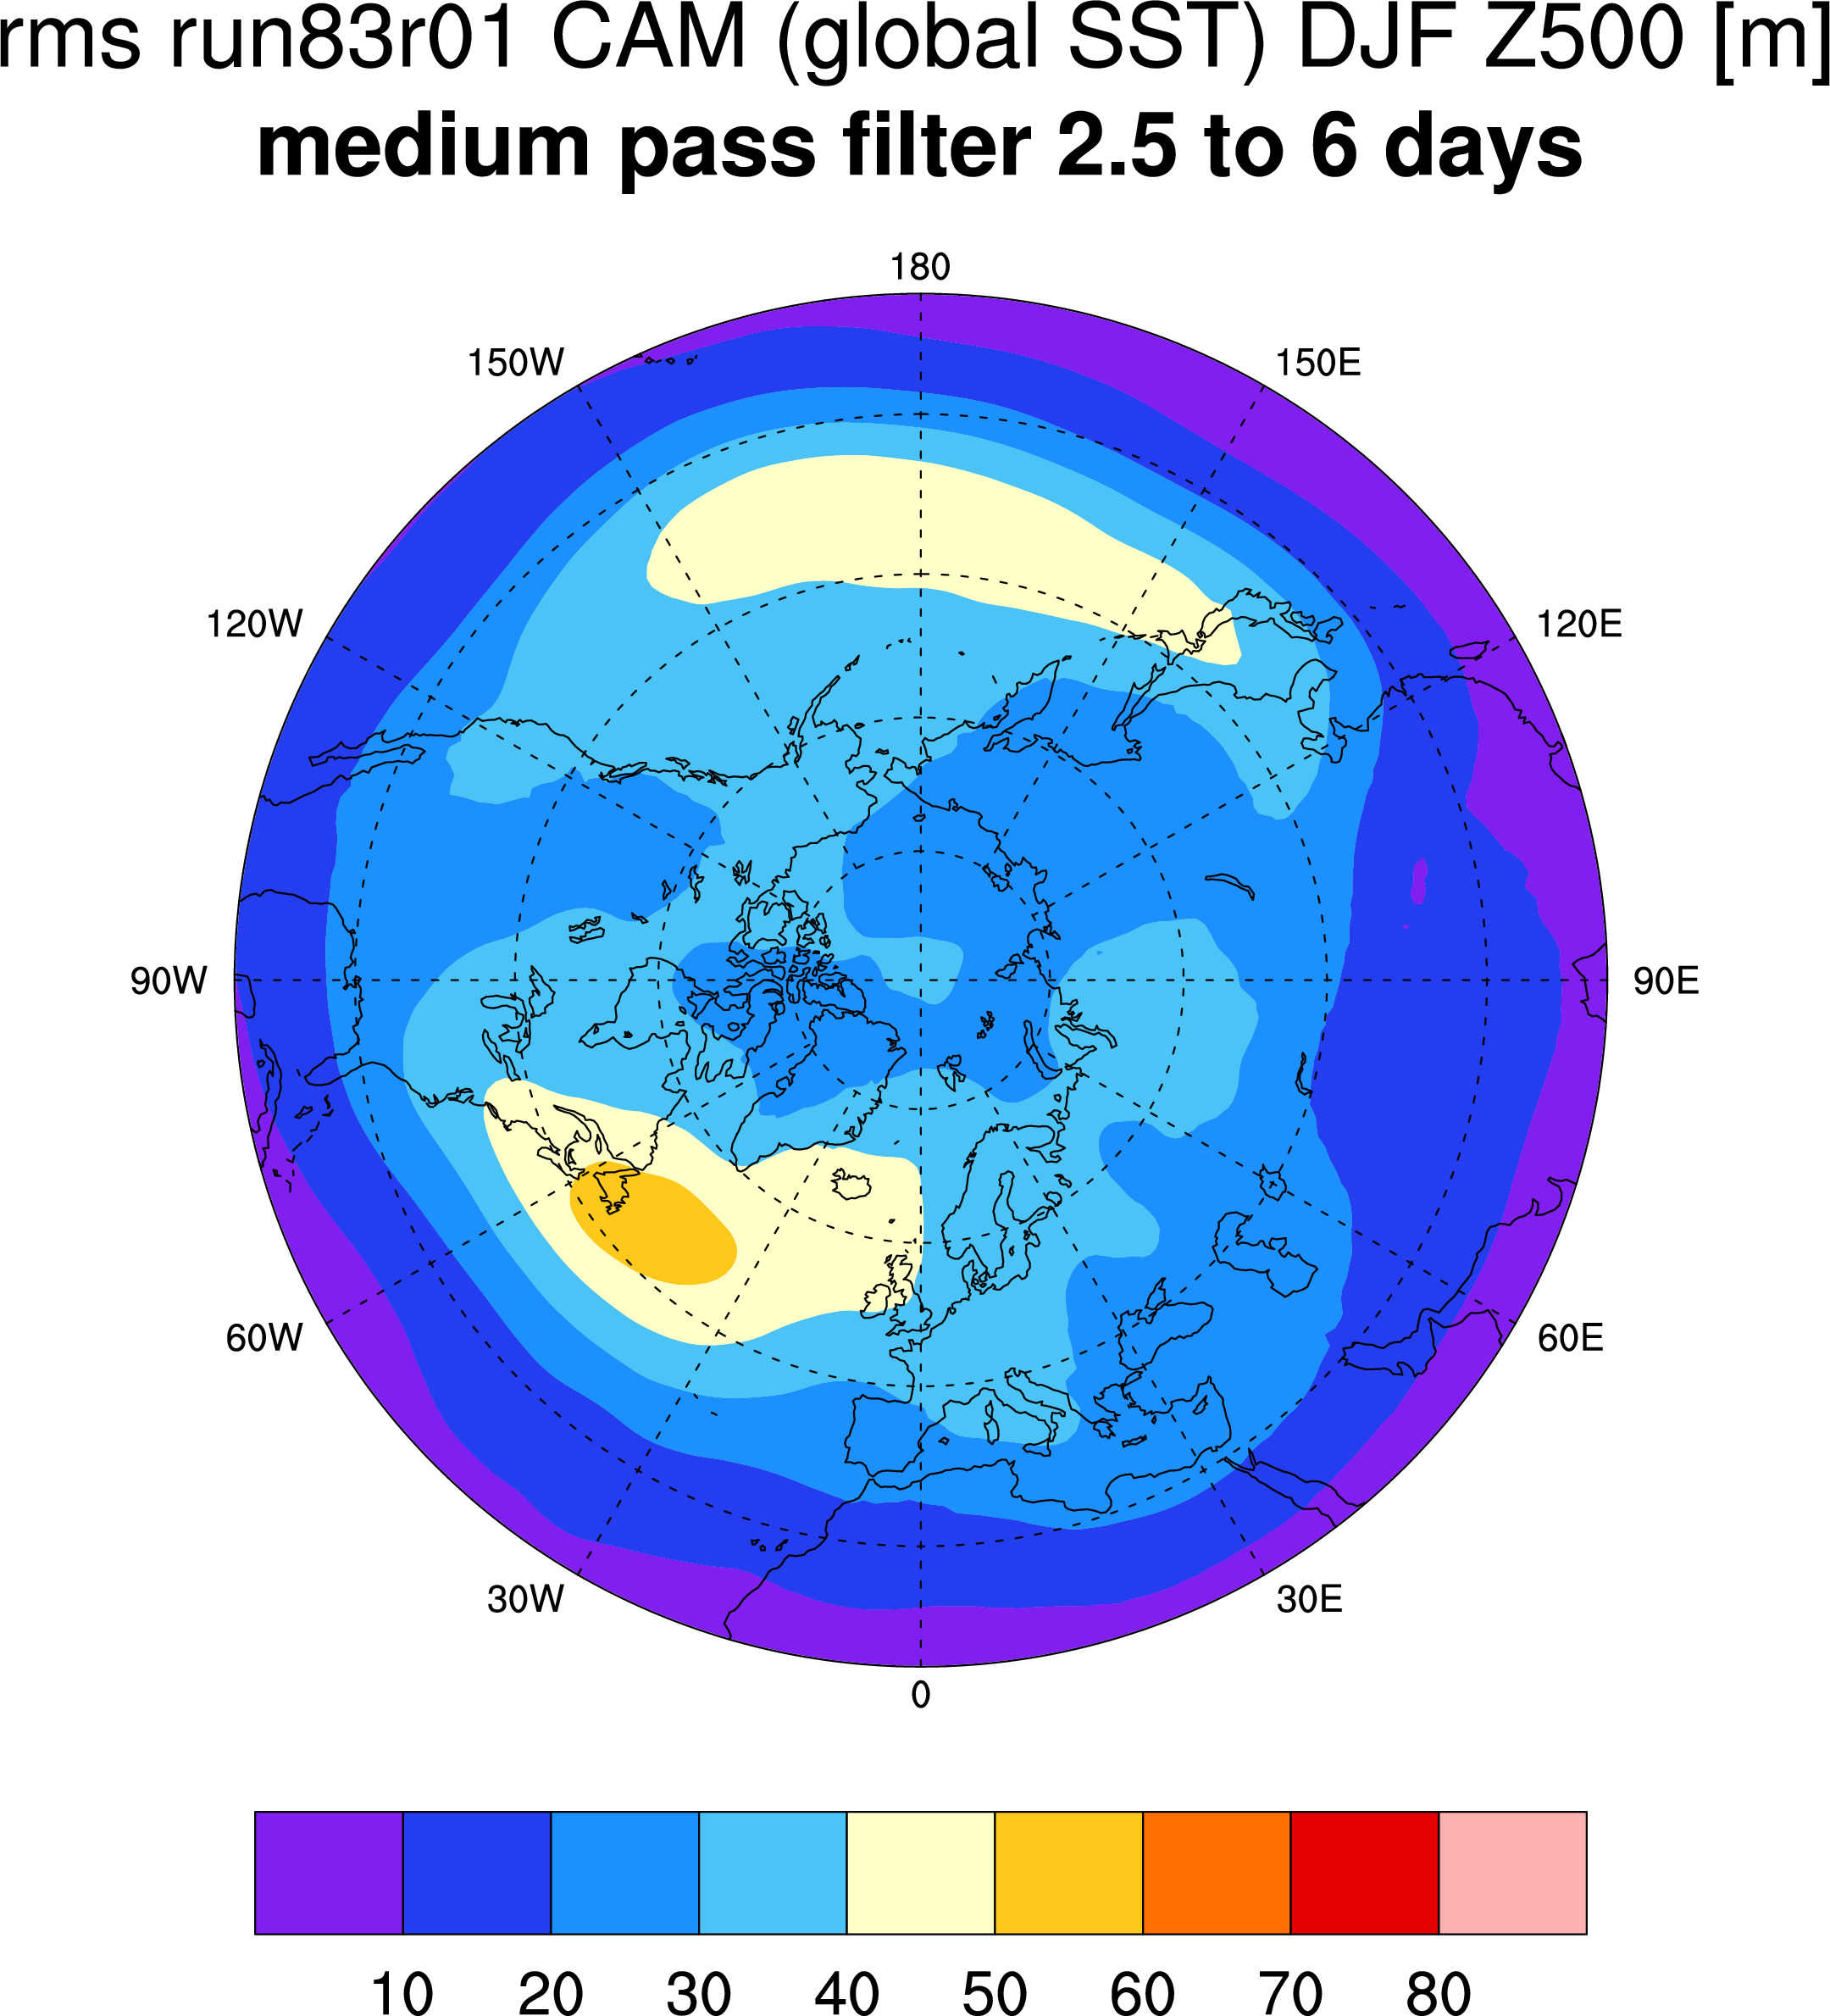
root mean square DJF Z500 from Xiao-Wei CAM ETPac case
Differences:
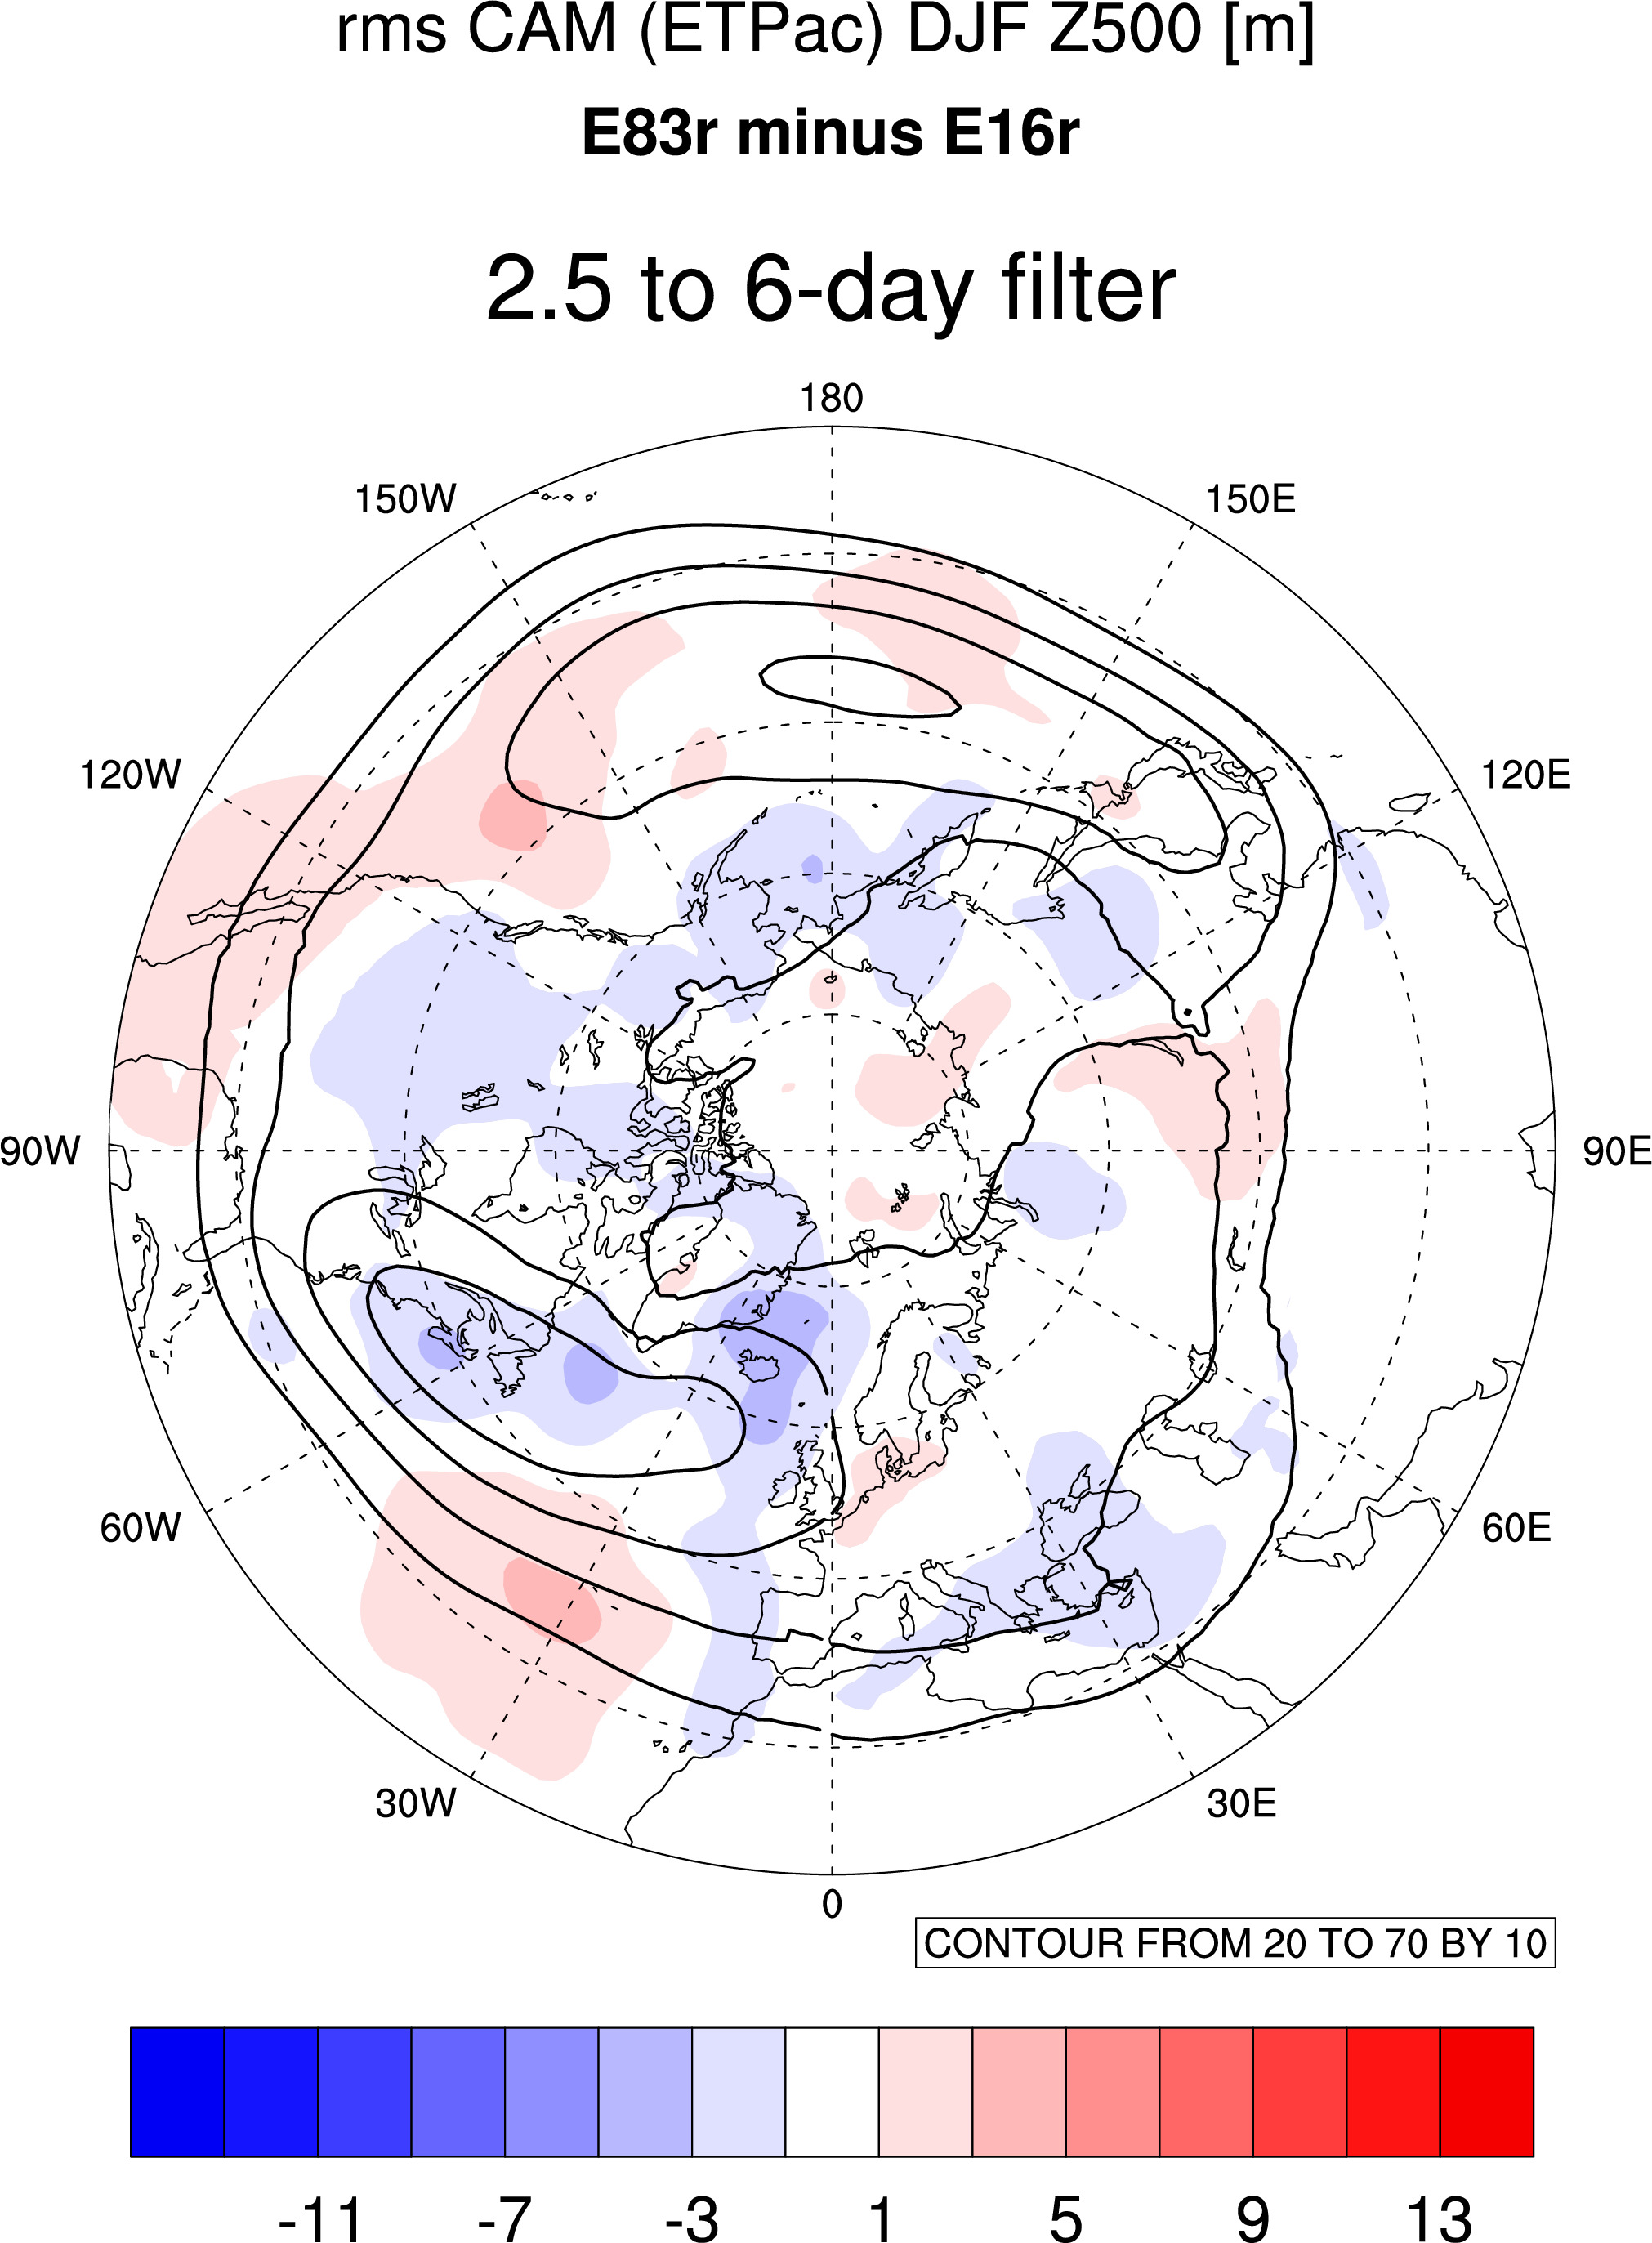
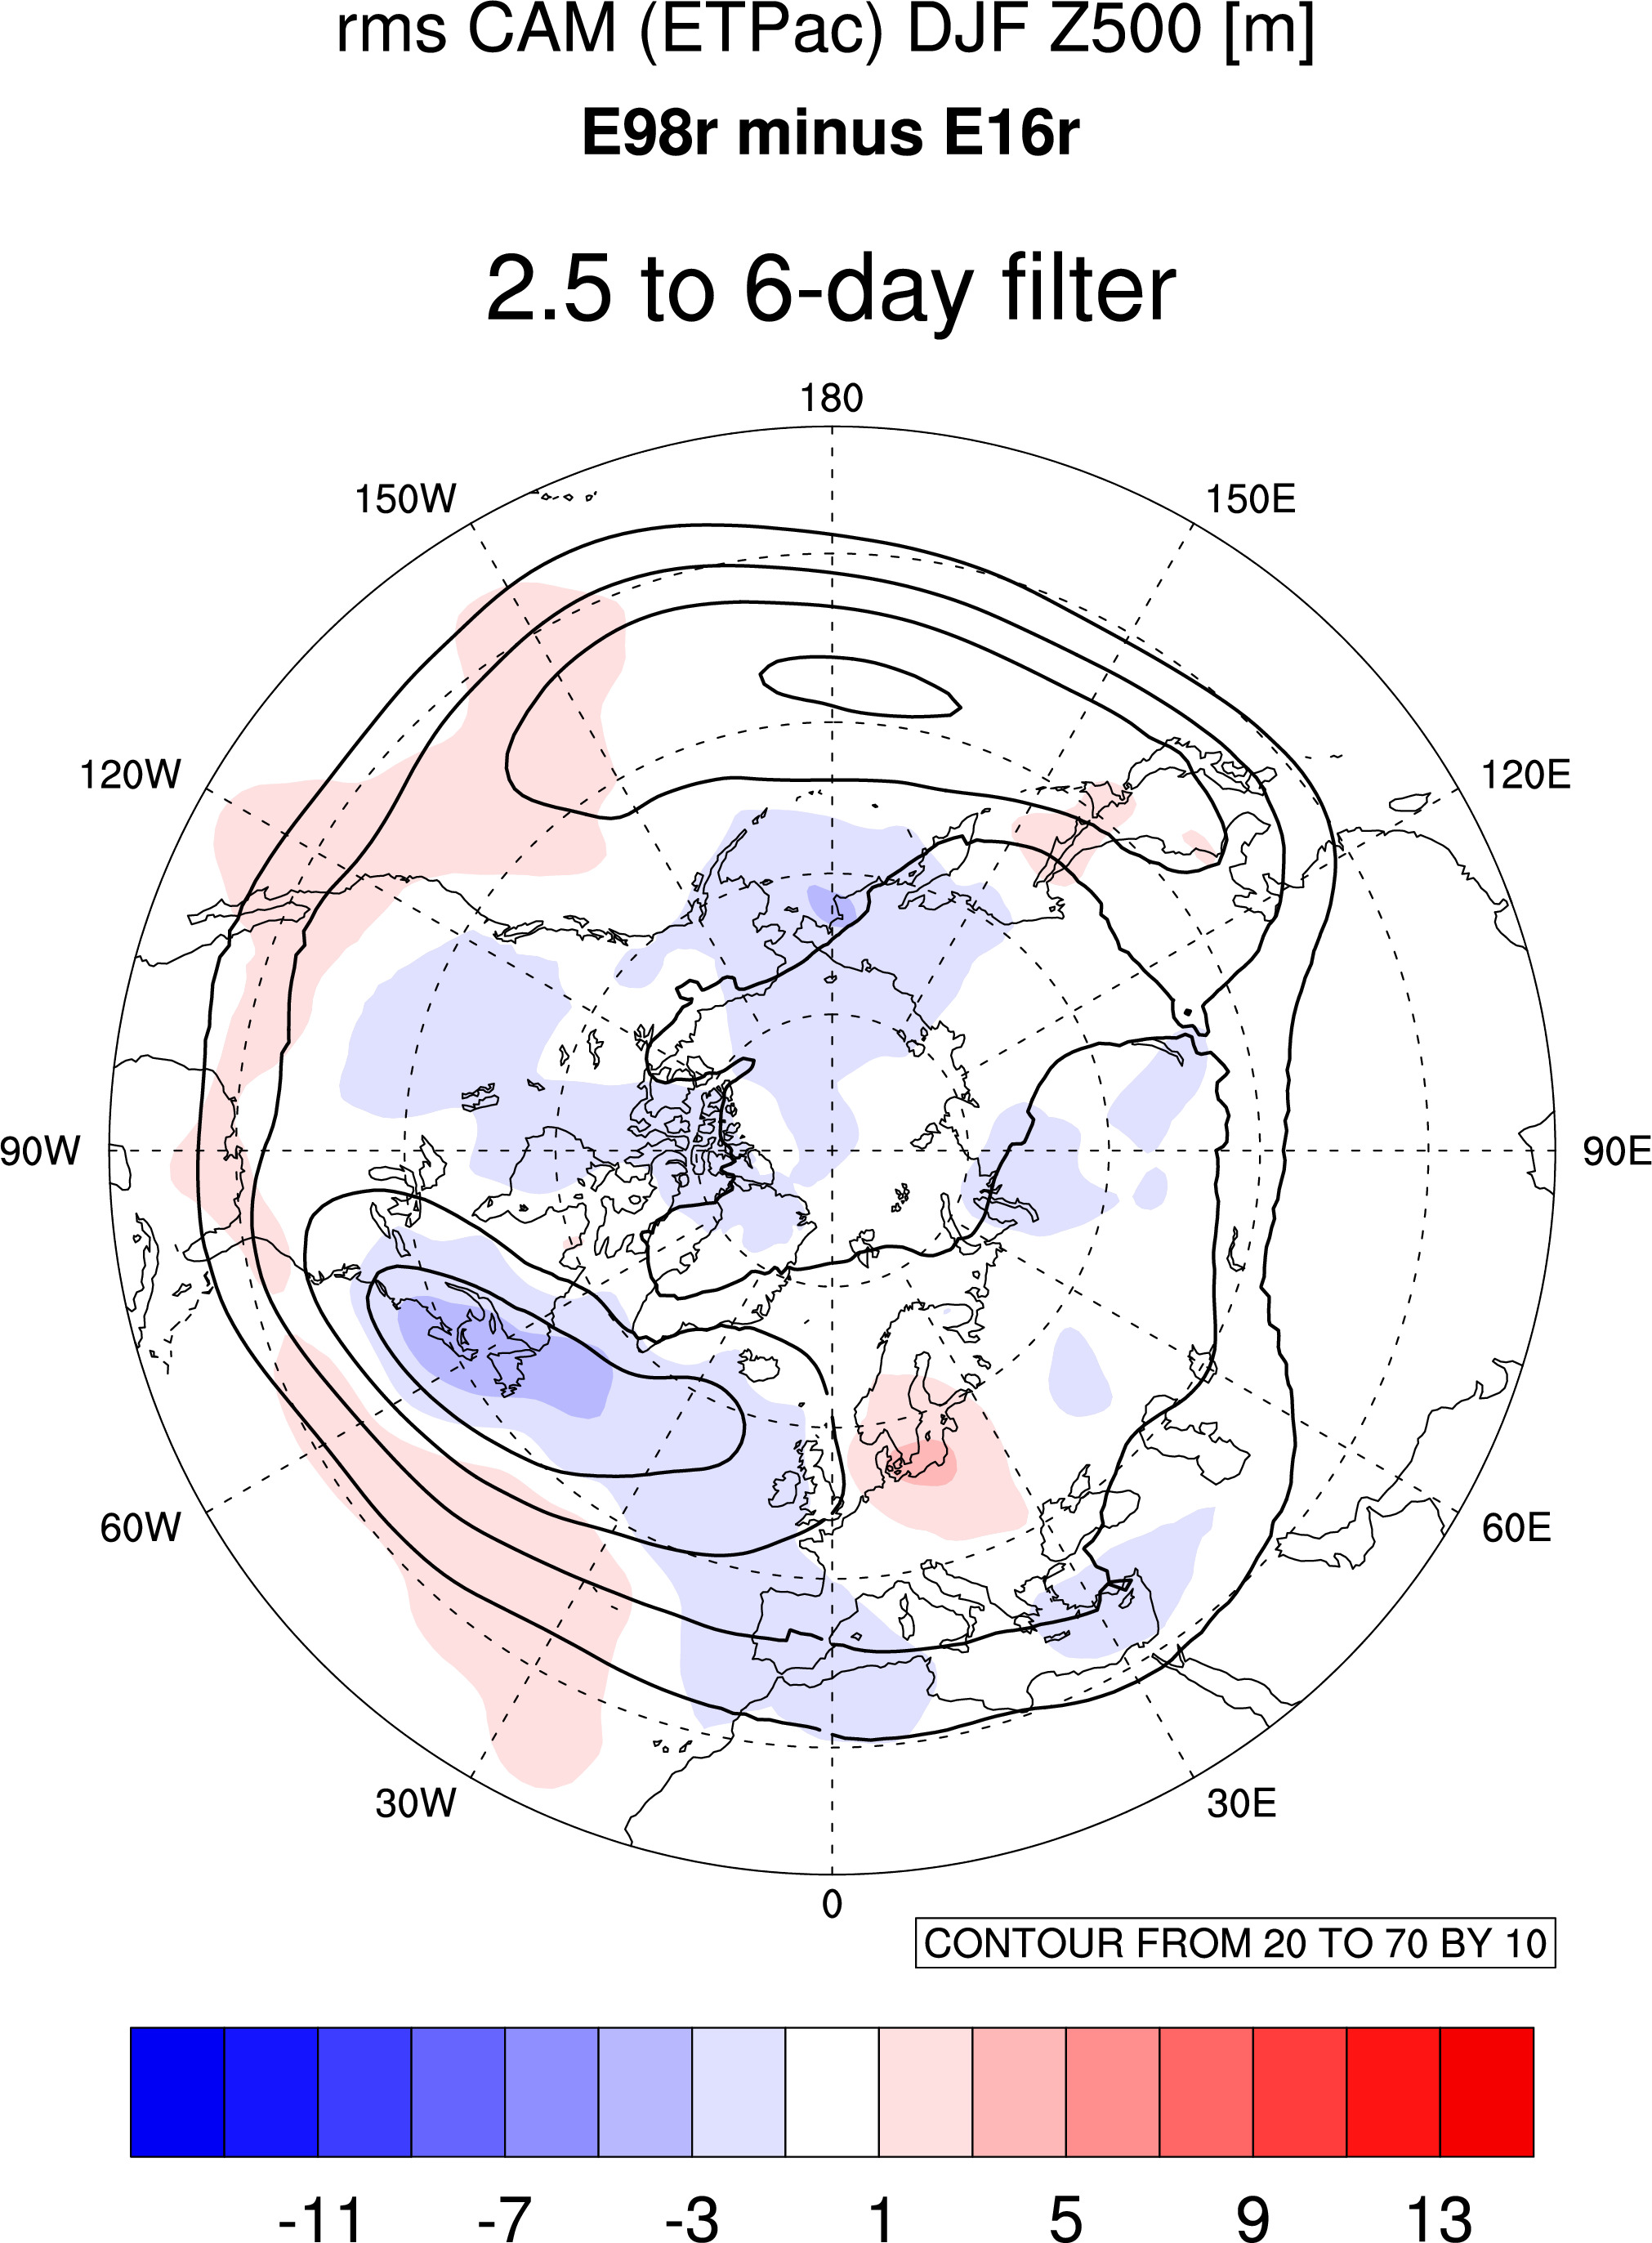
where contour lines are E16r case.
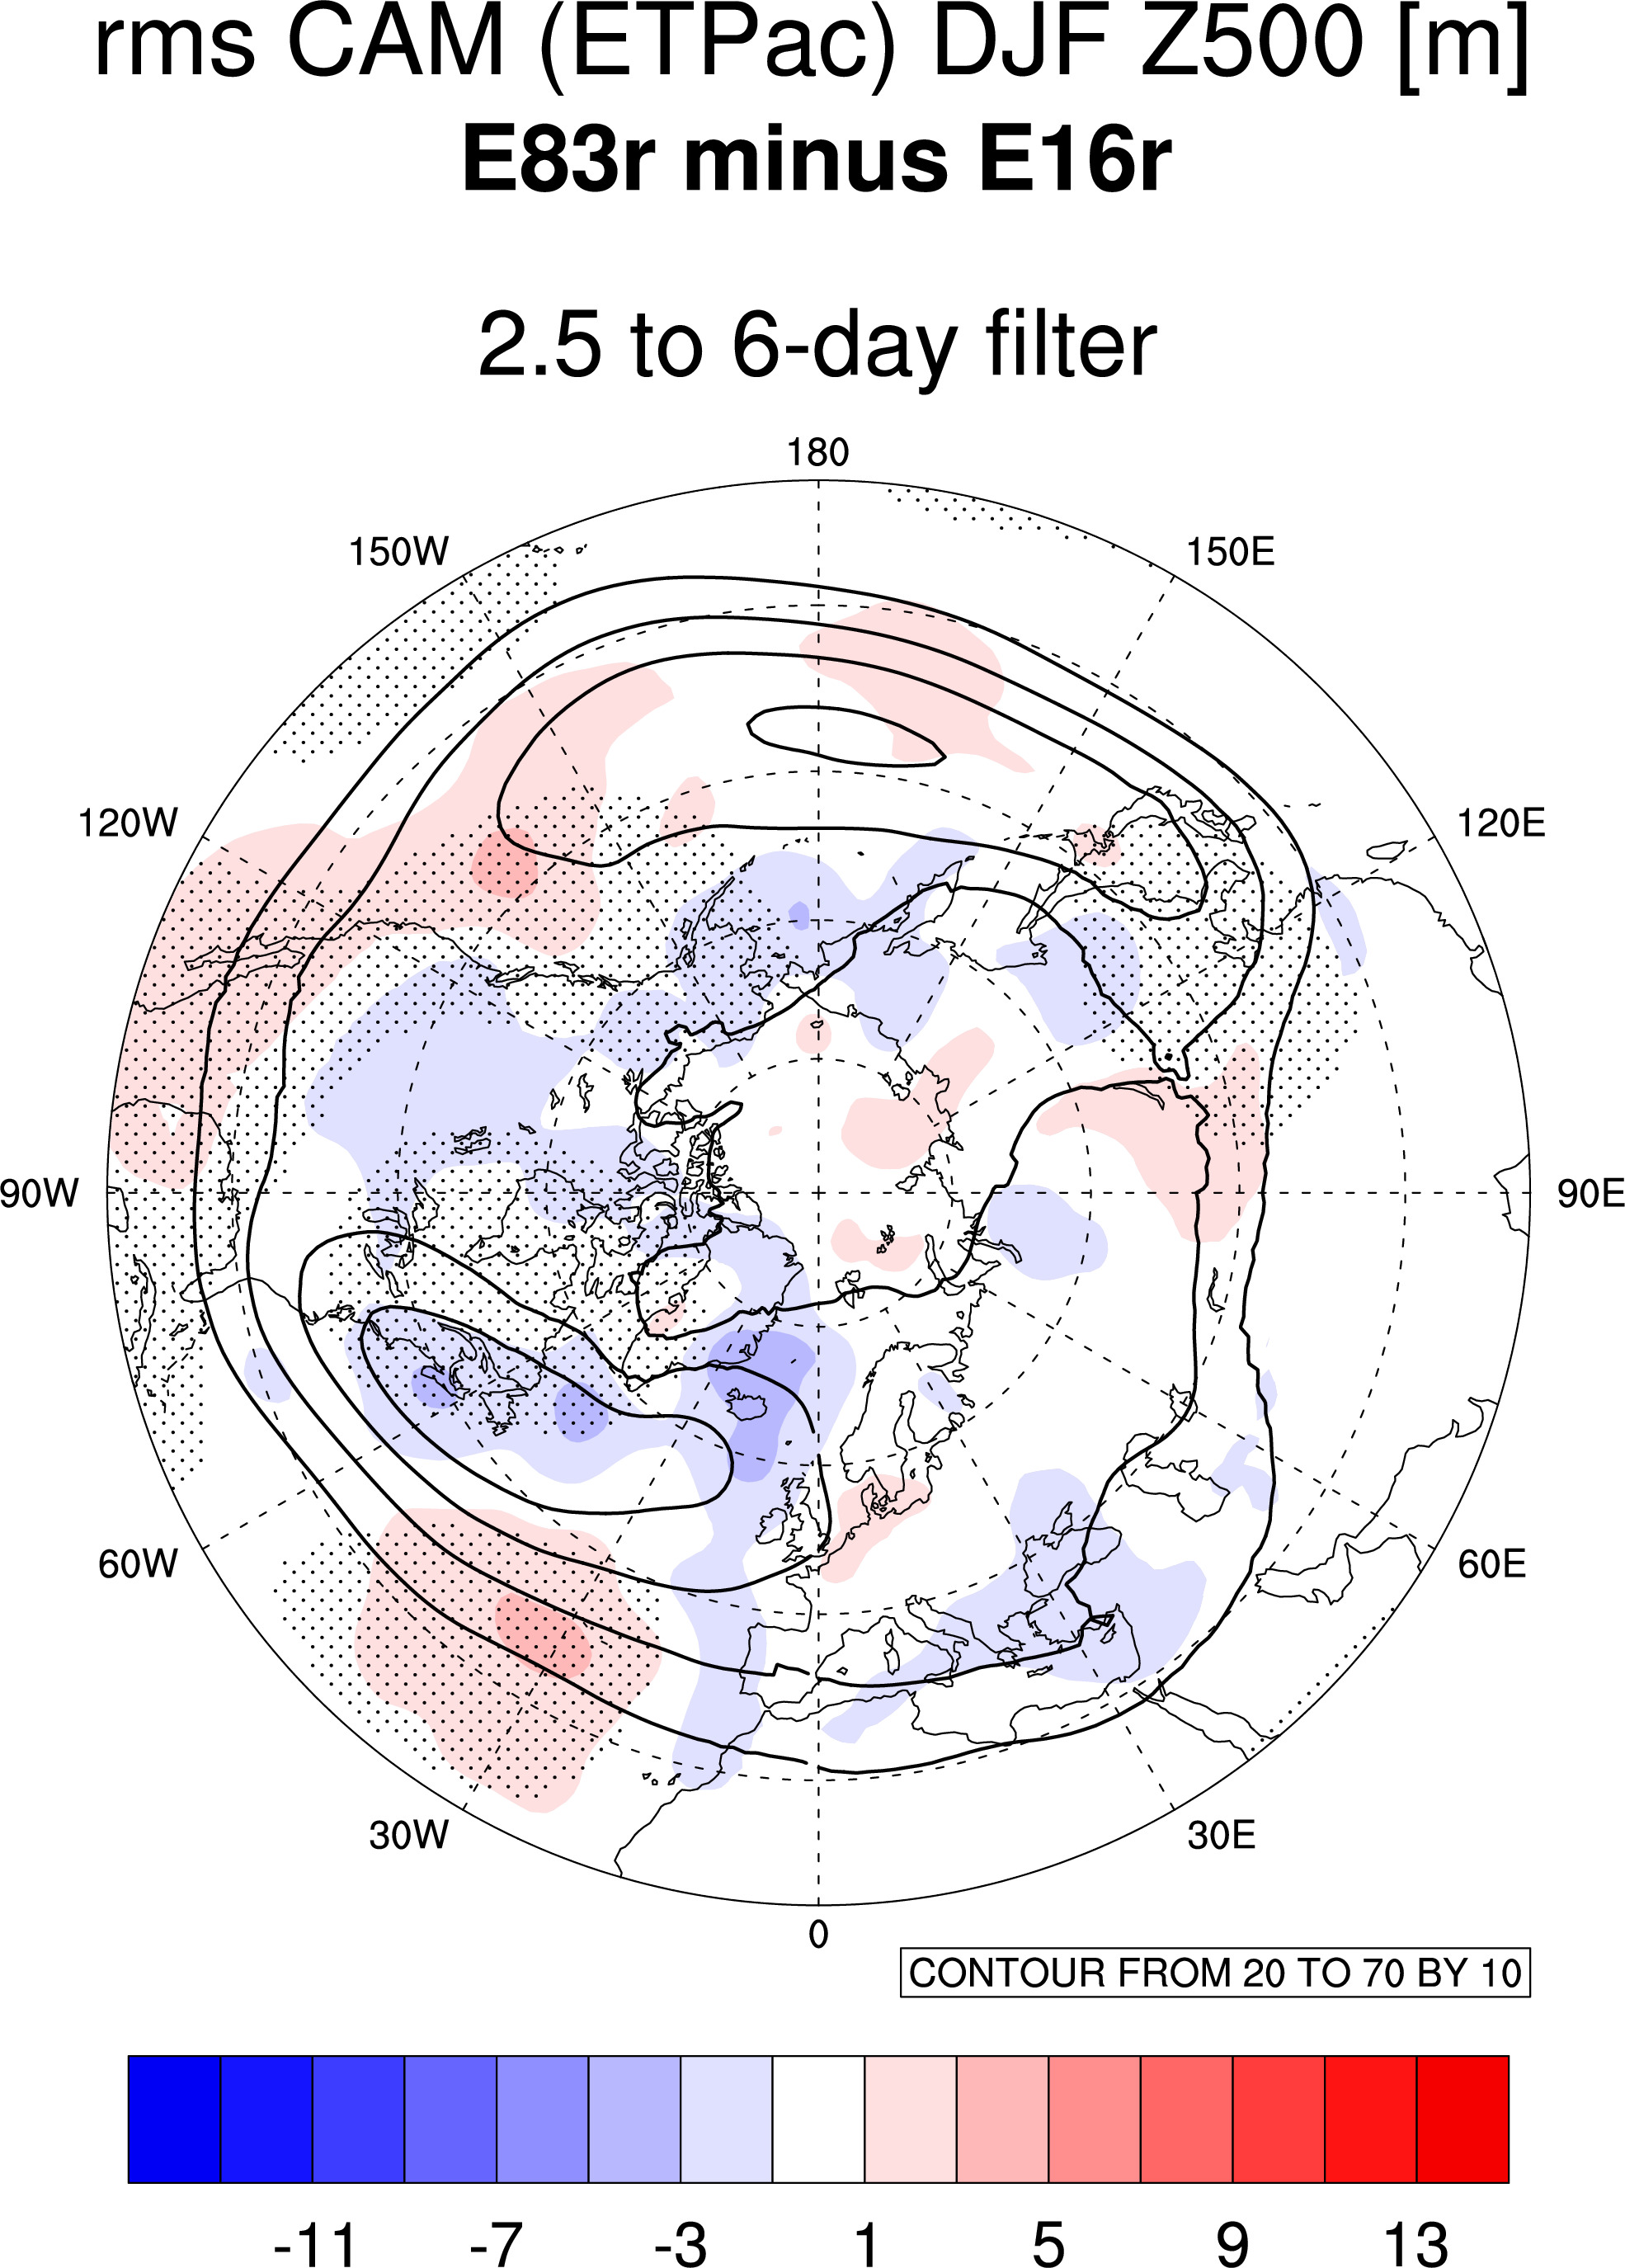
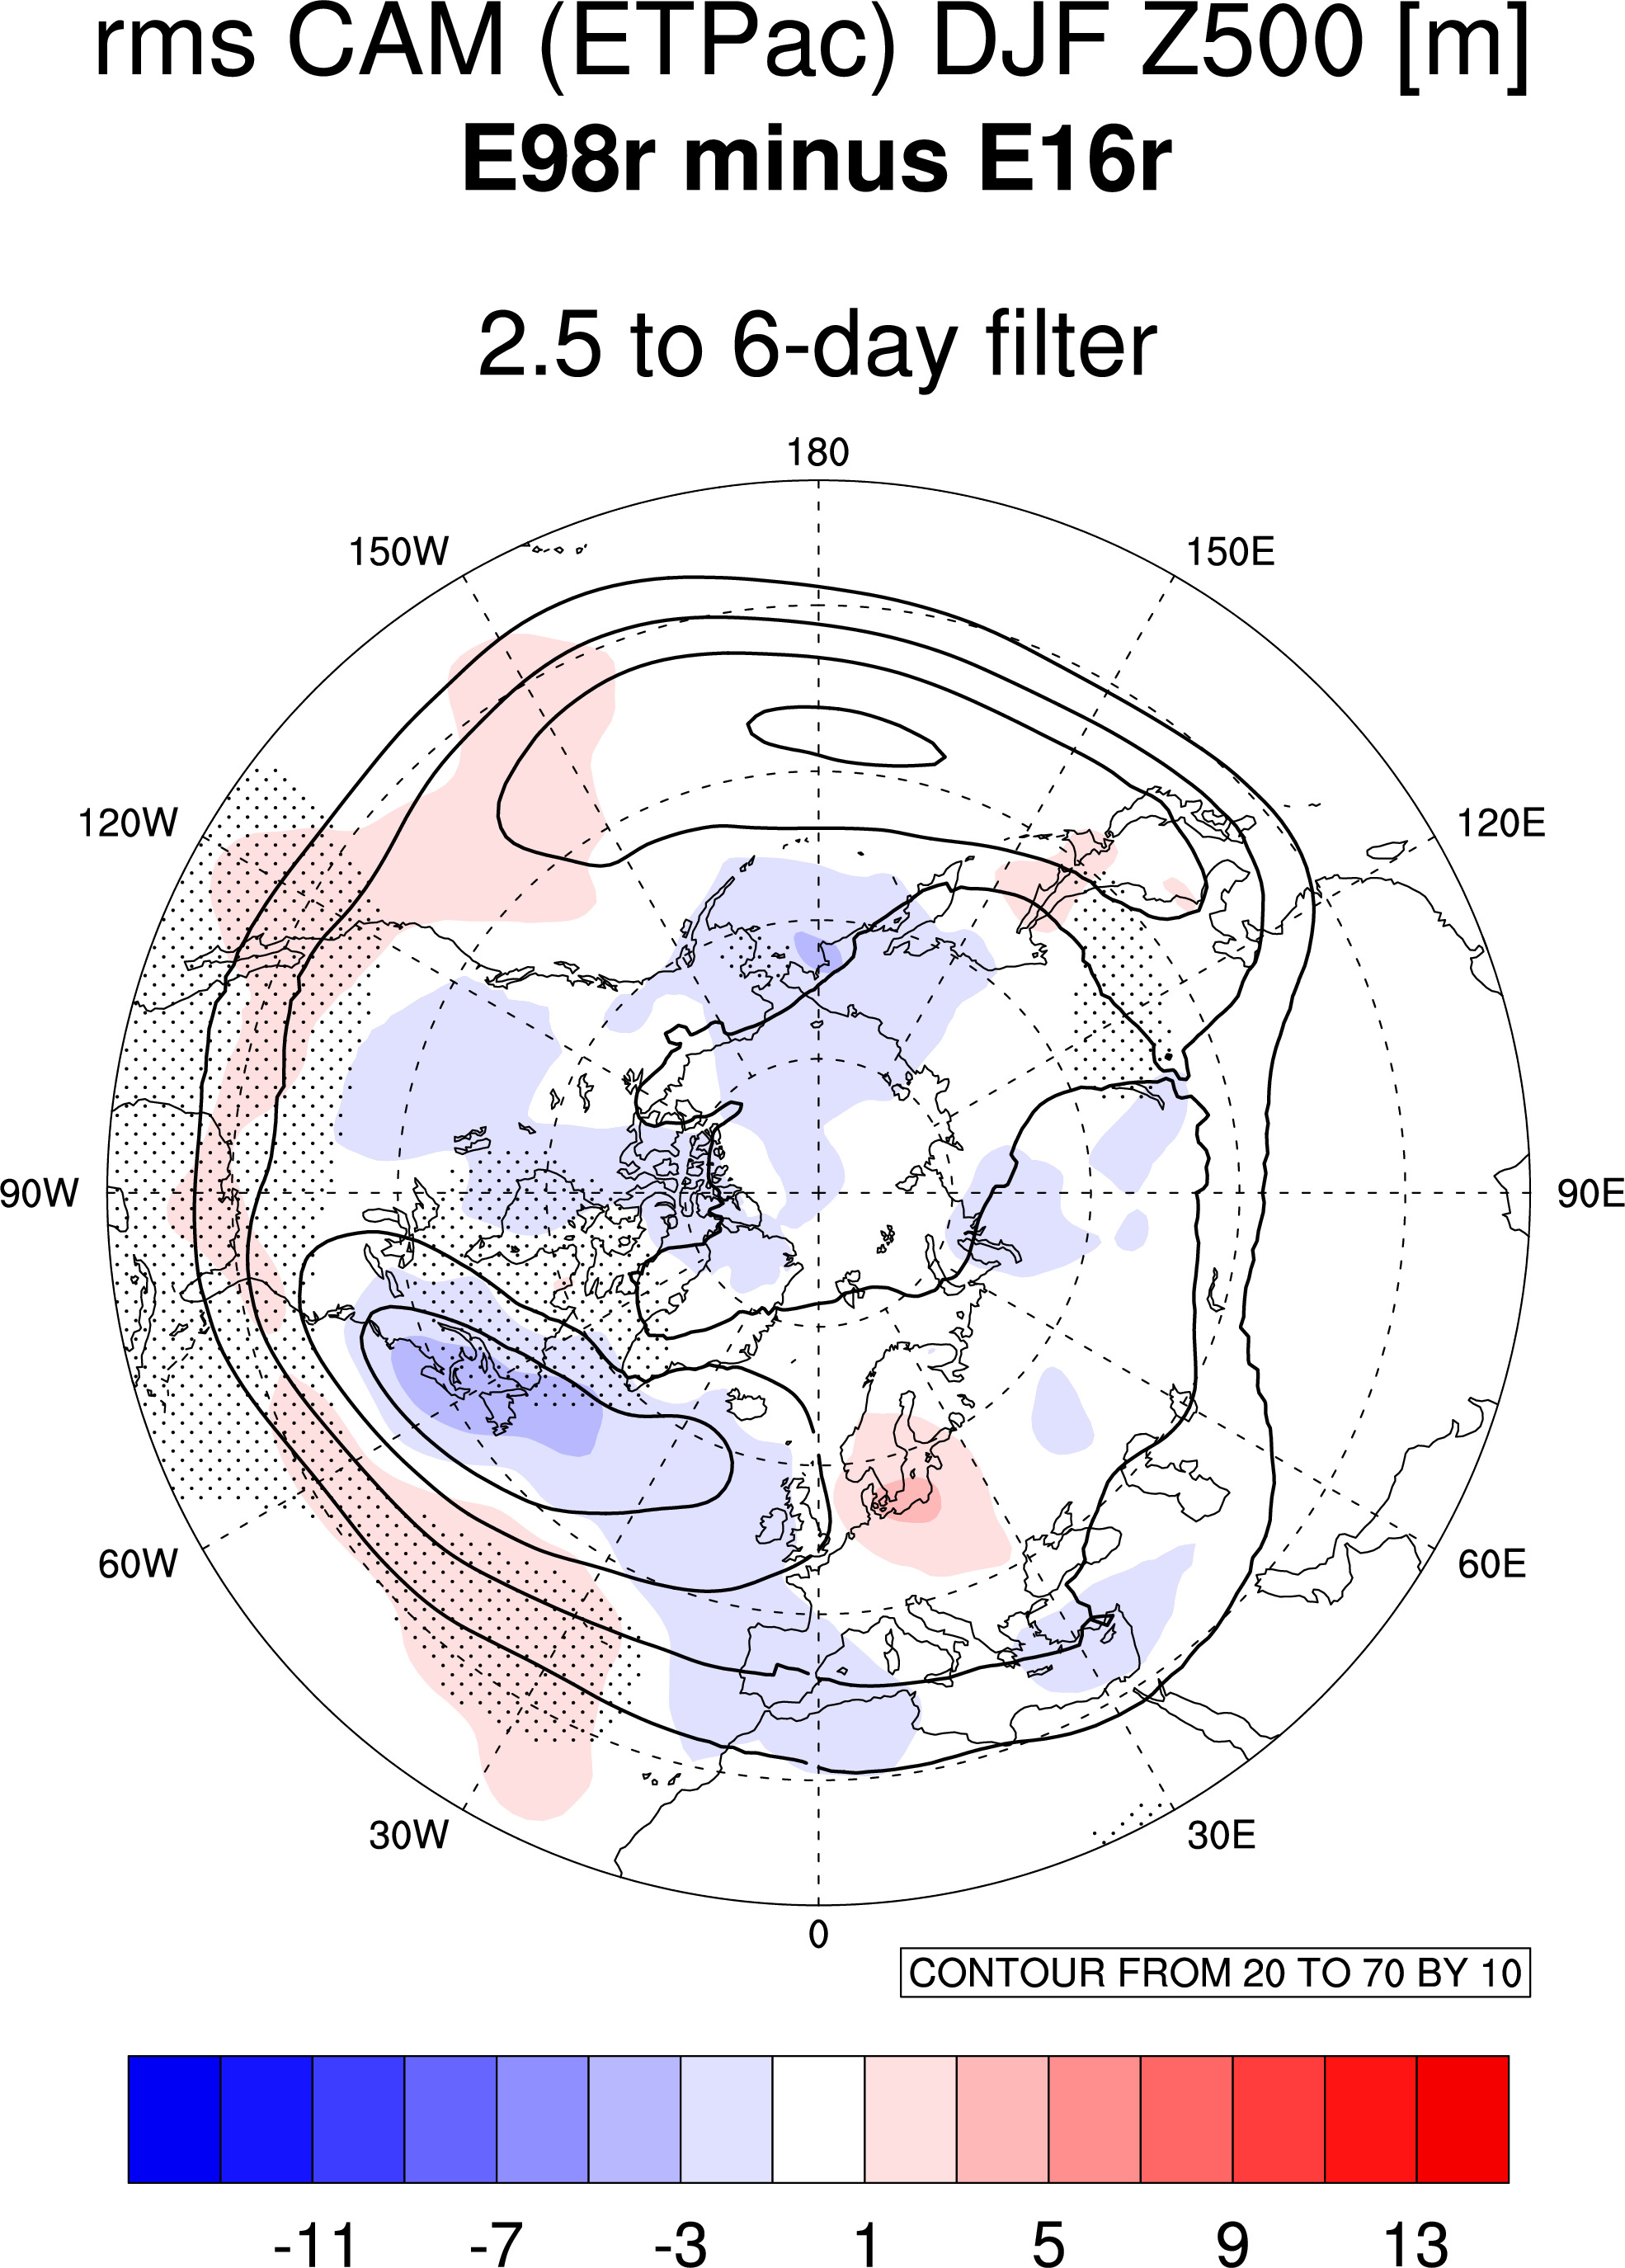
where stippling indicates 95% from t-test
-------------------------------------------------------------------
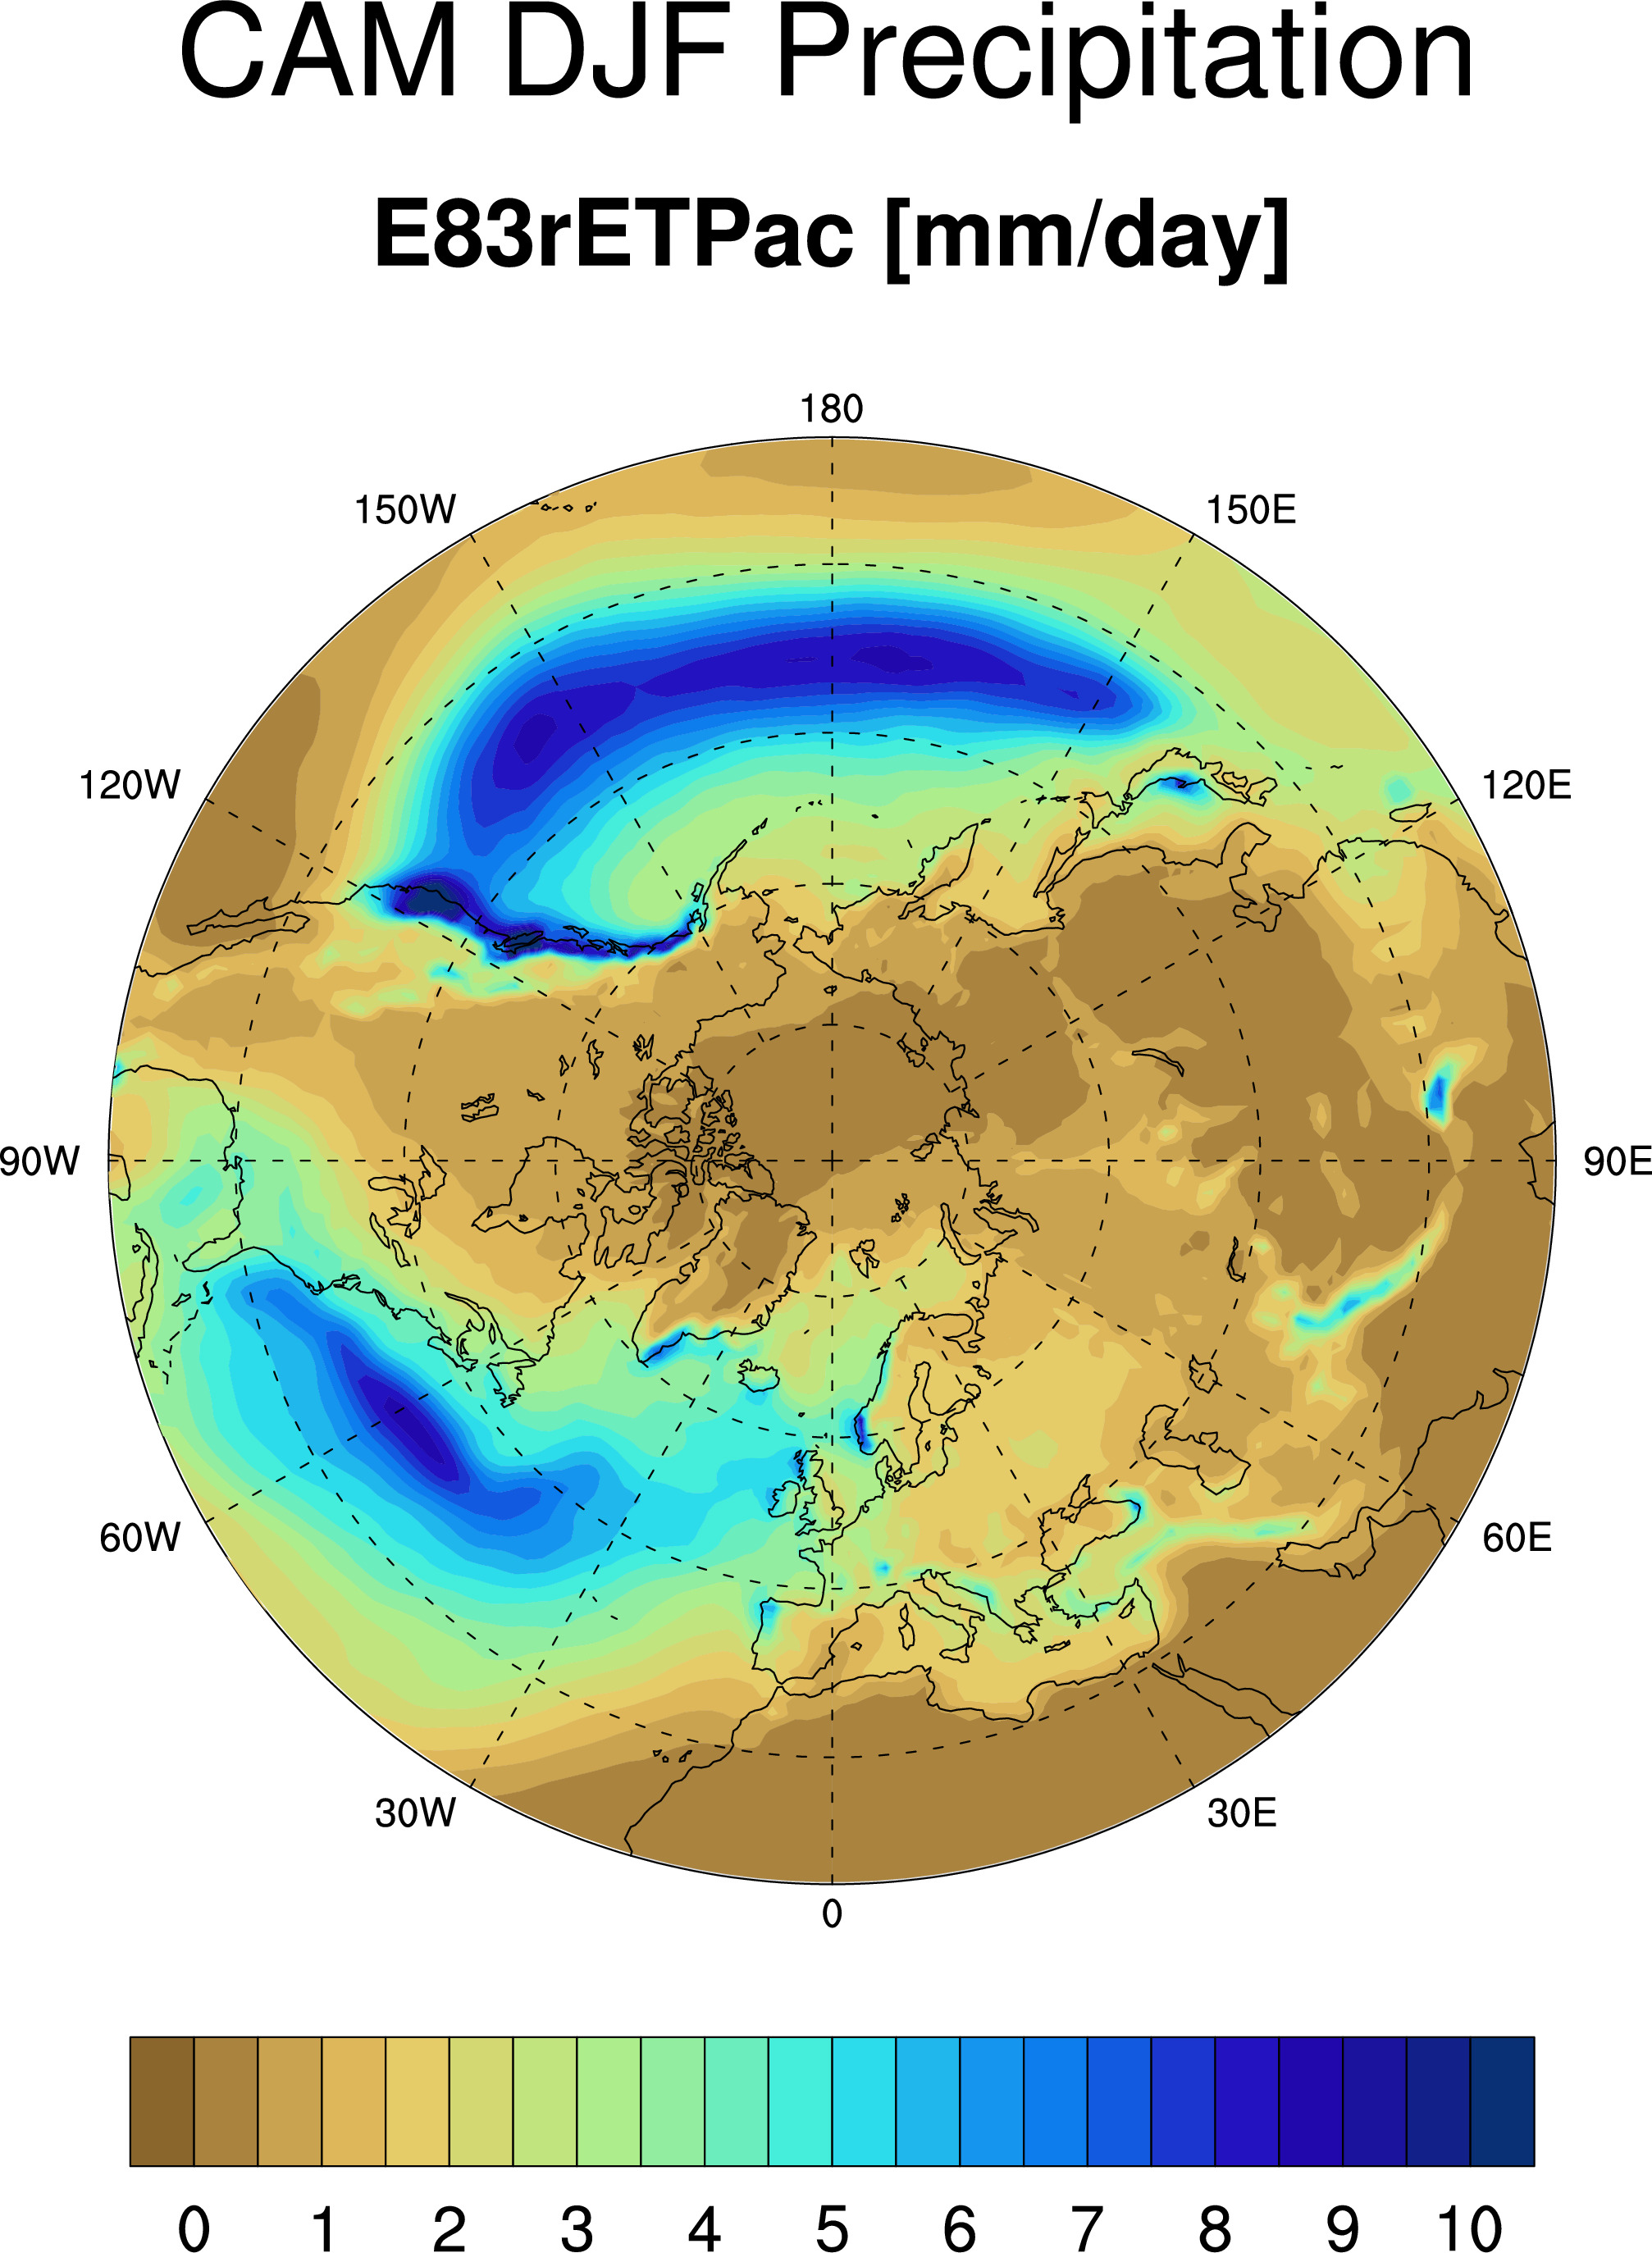
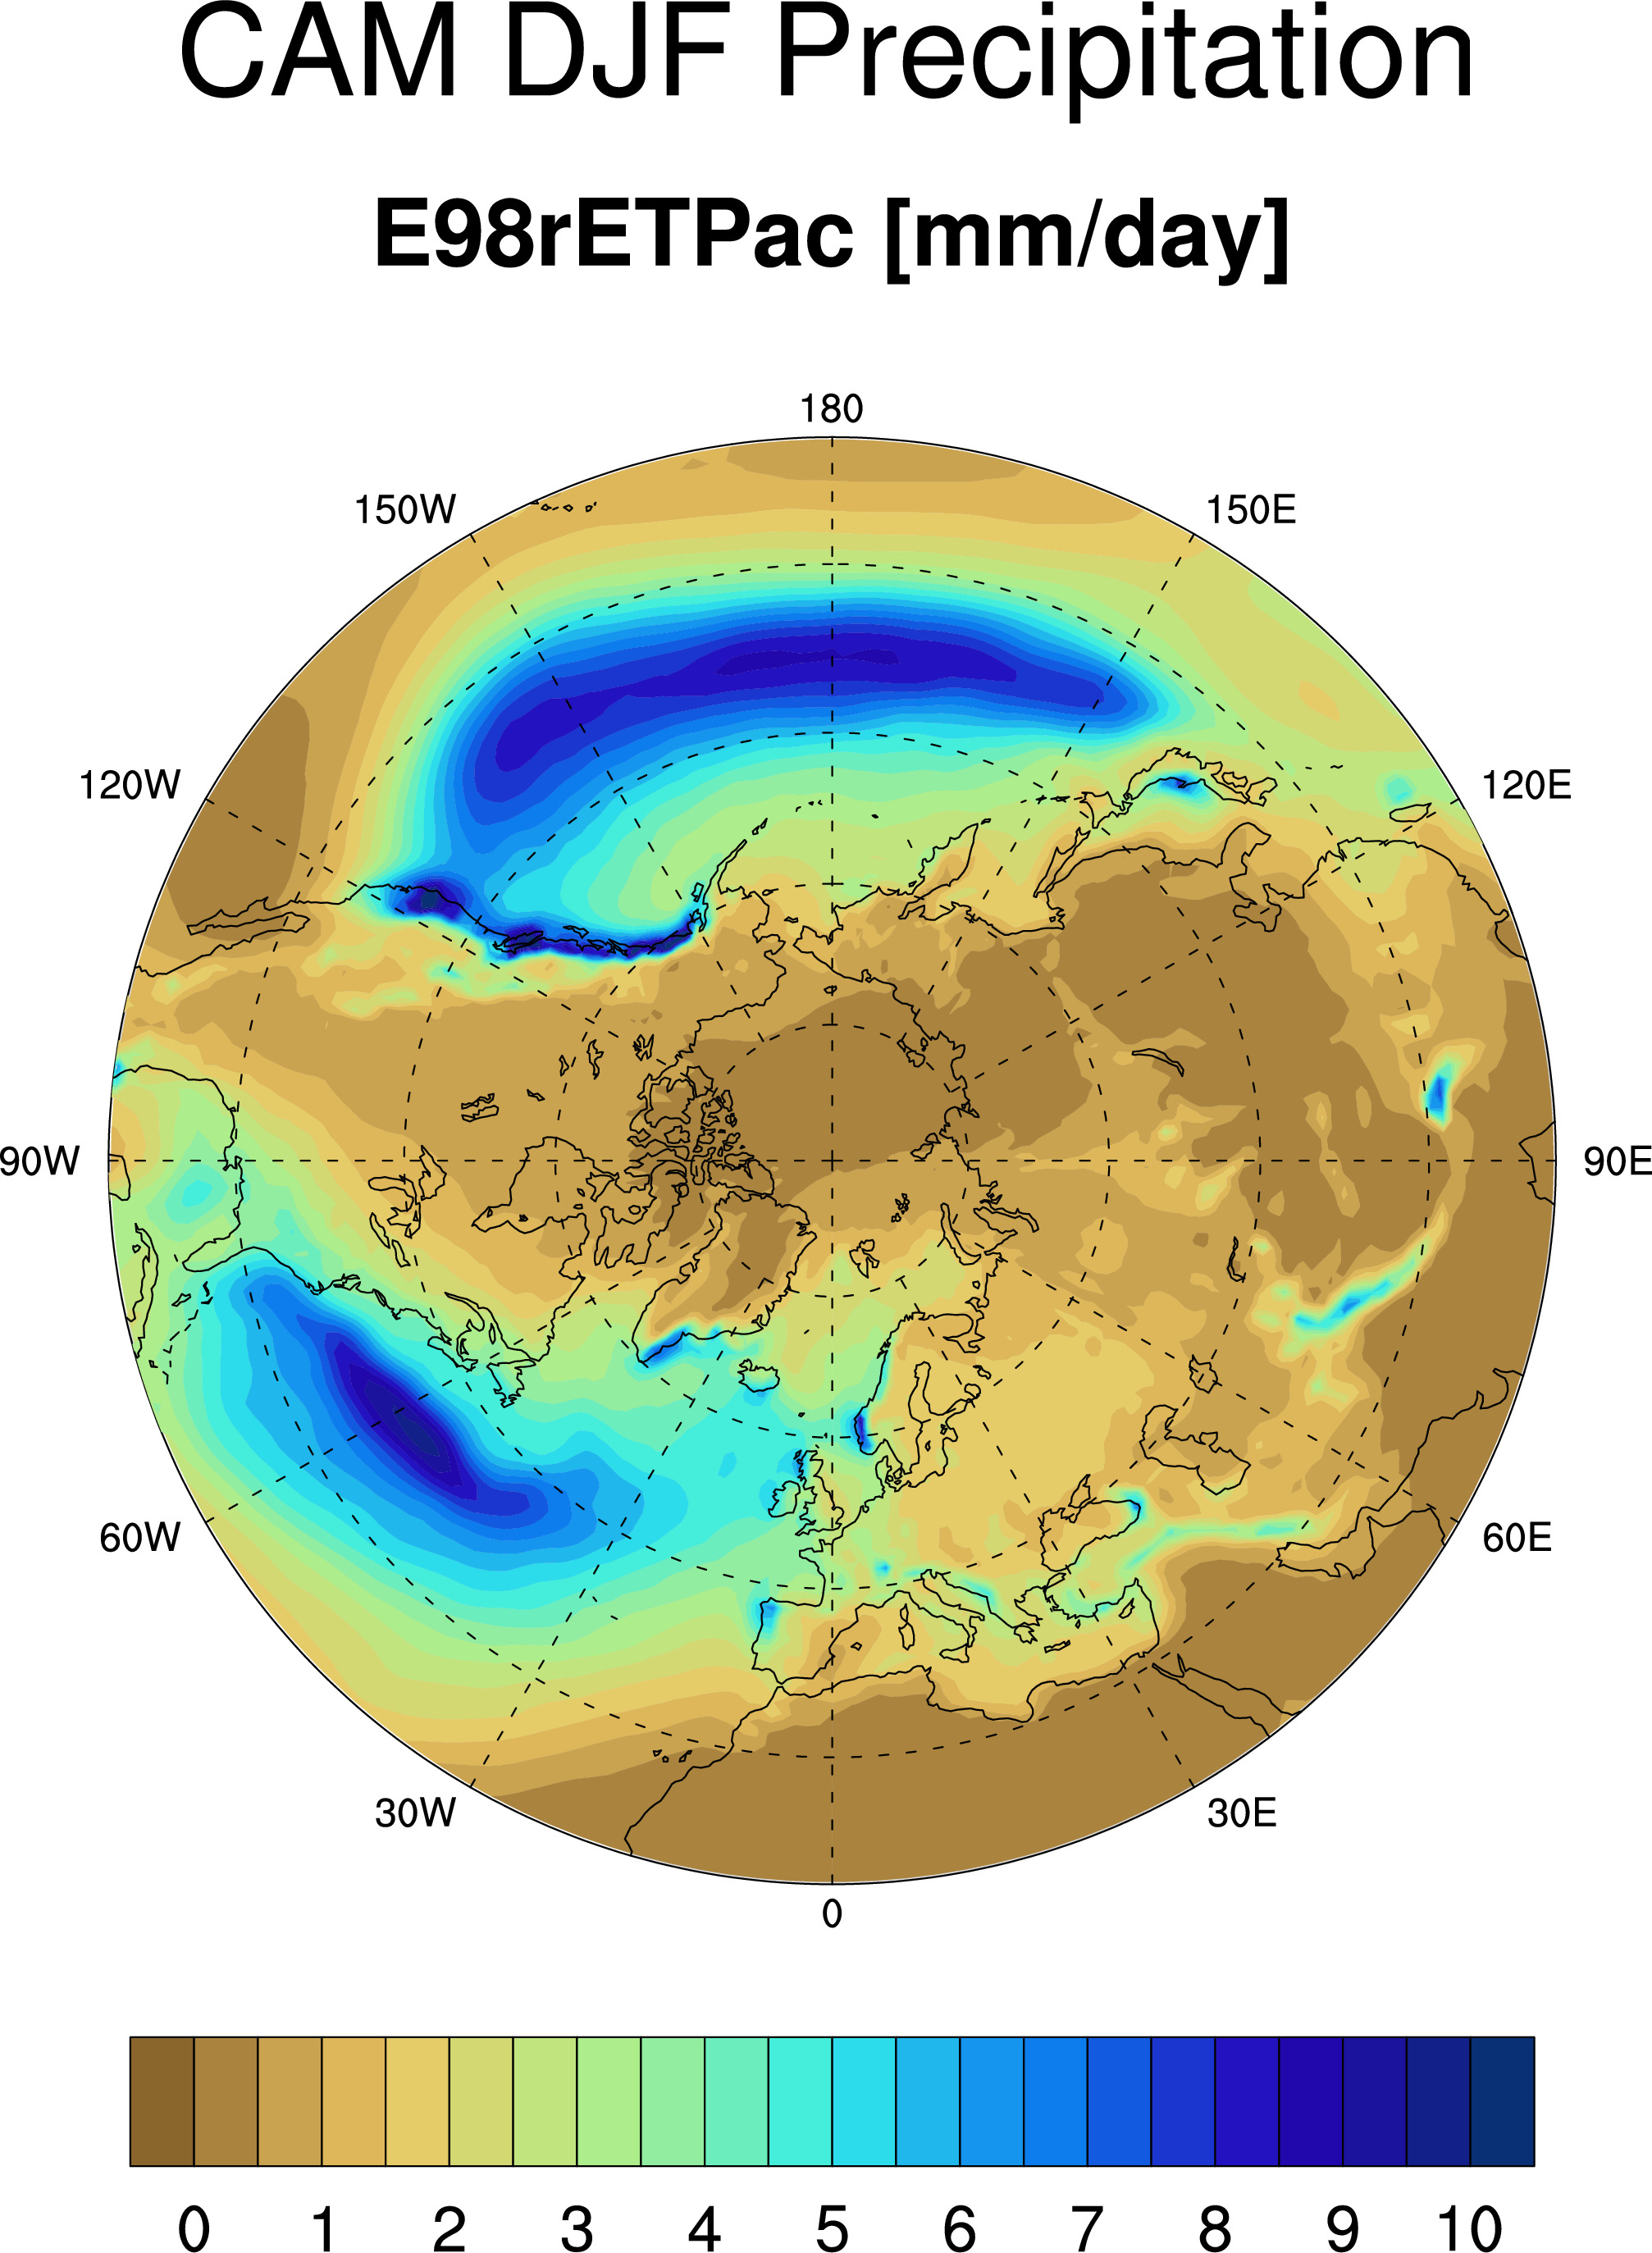
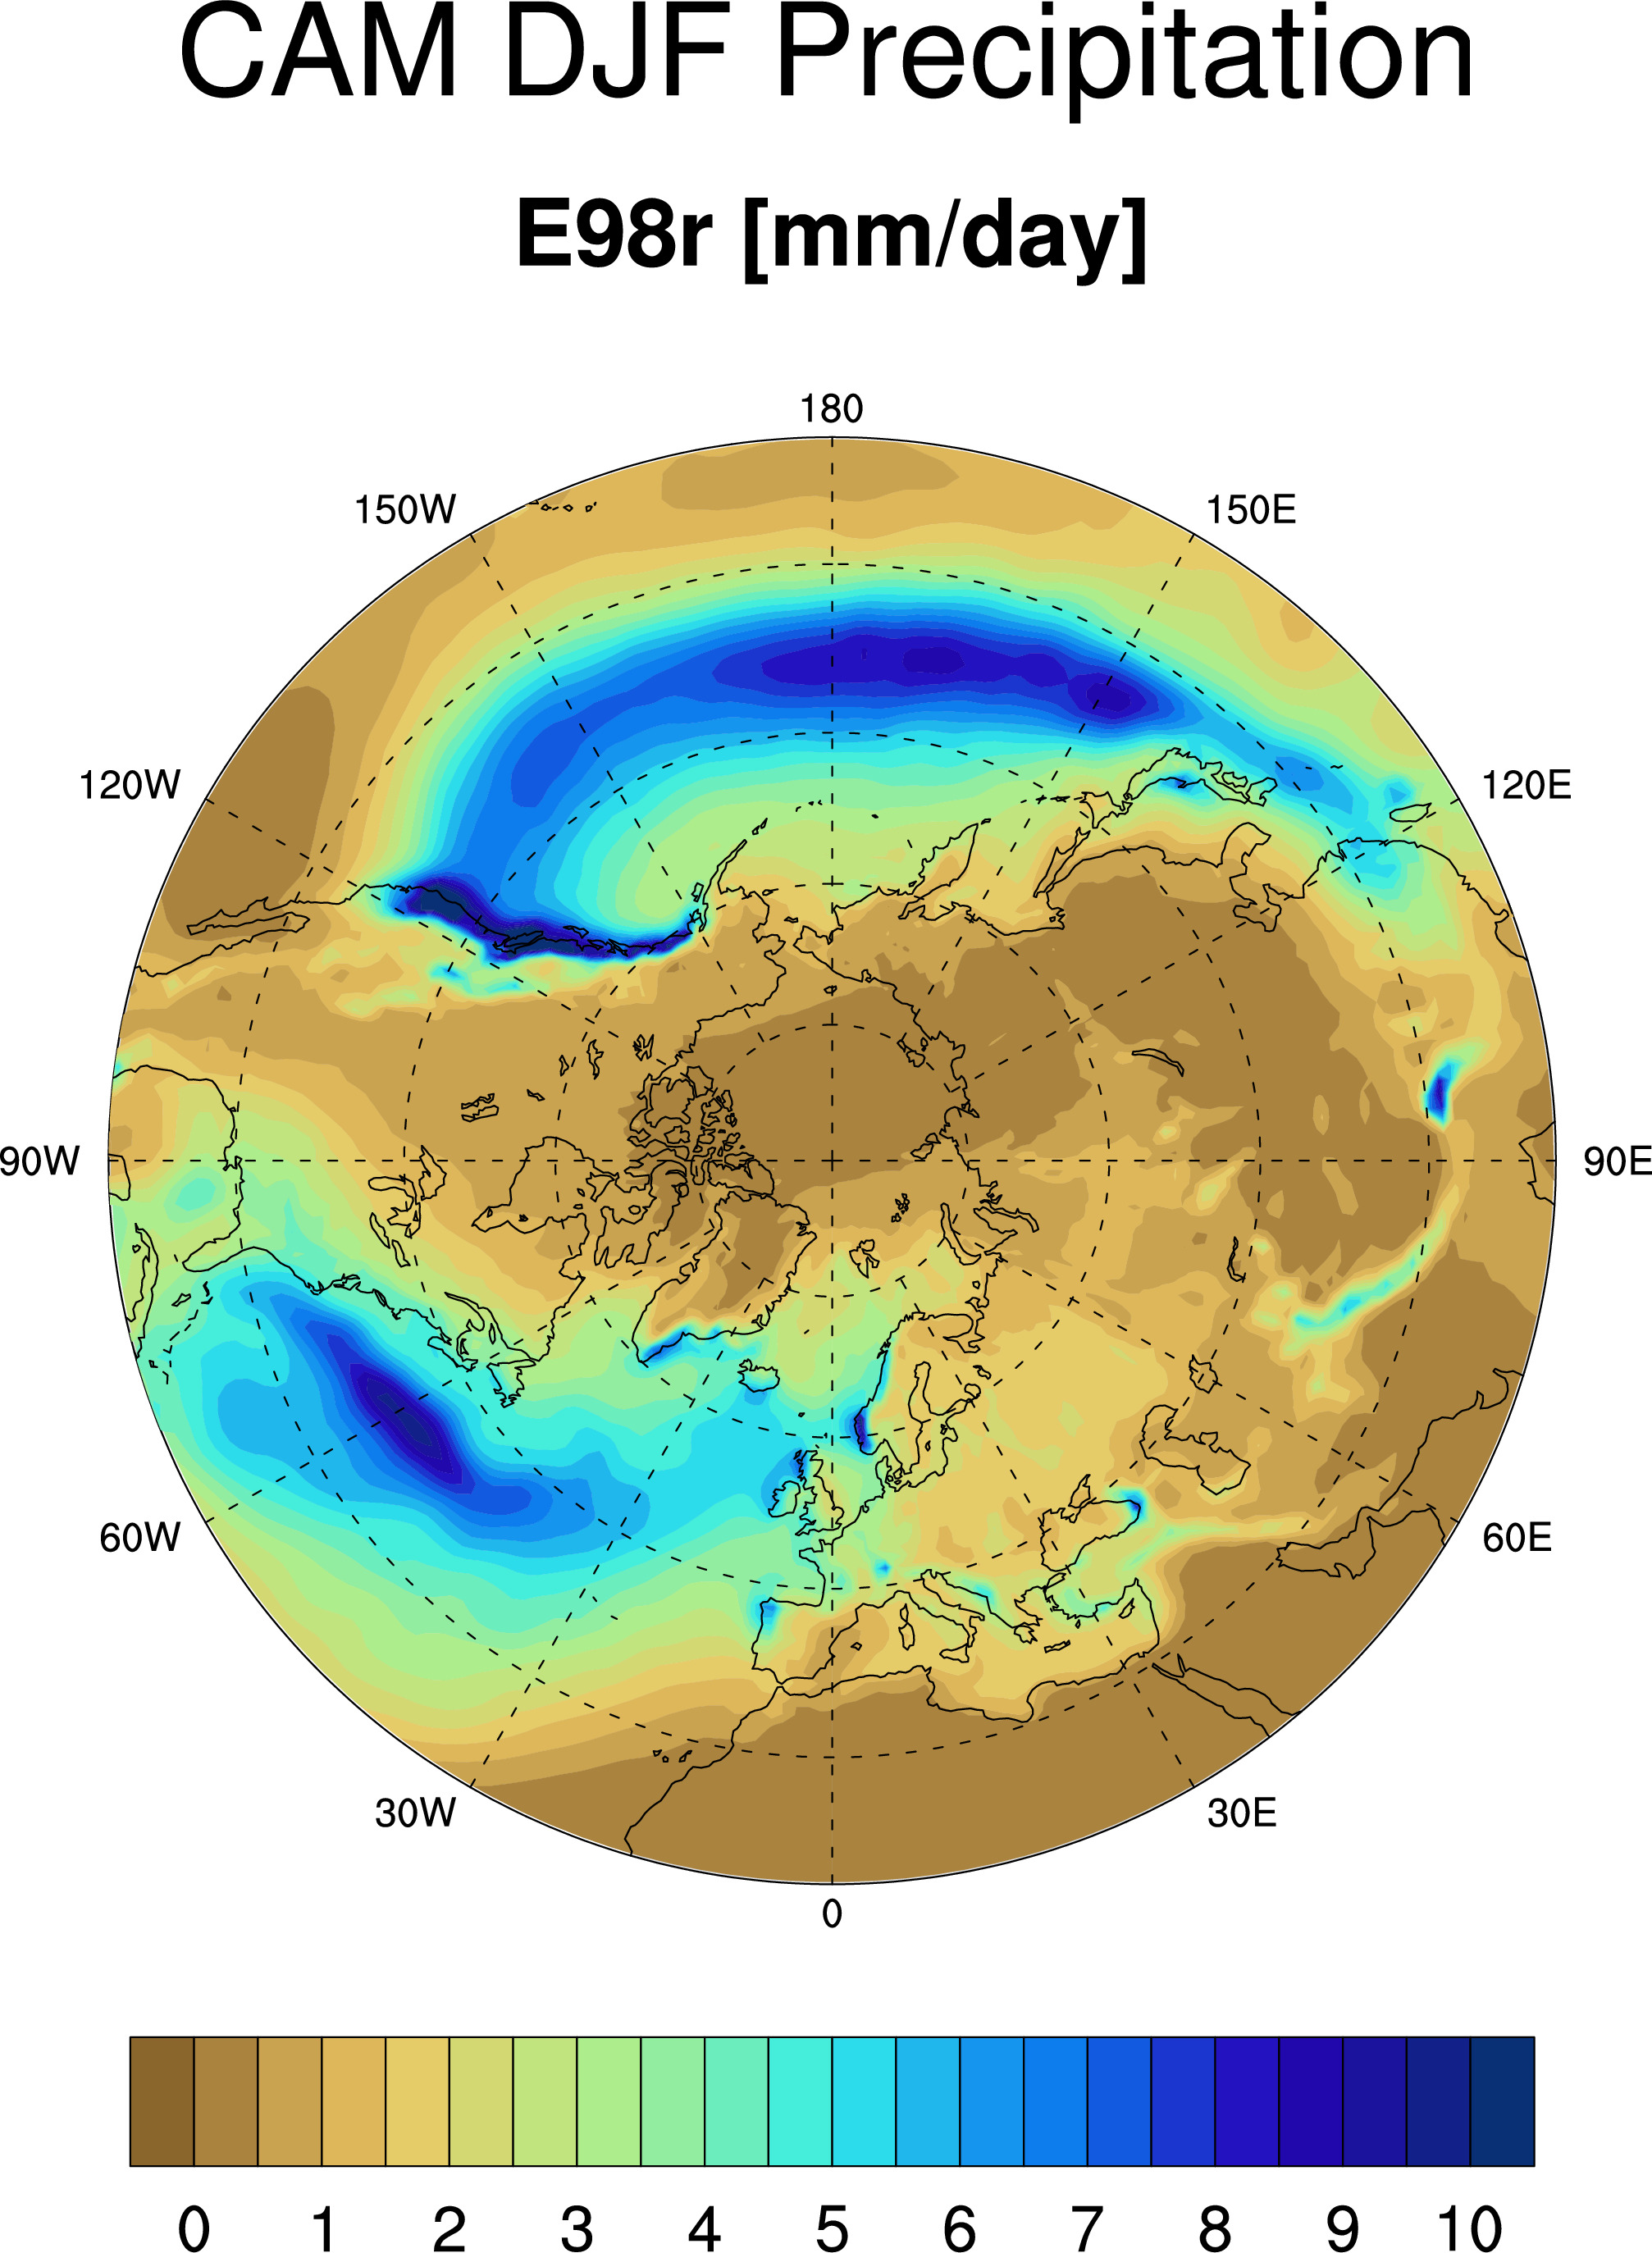
Xiao-Wei CAM E2015r case
CAM DJF Precipitation
Differences wrt to AMIP 1981-2010 CAM: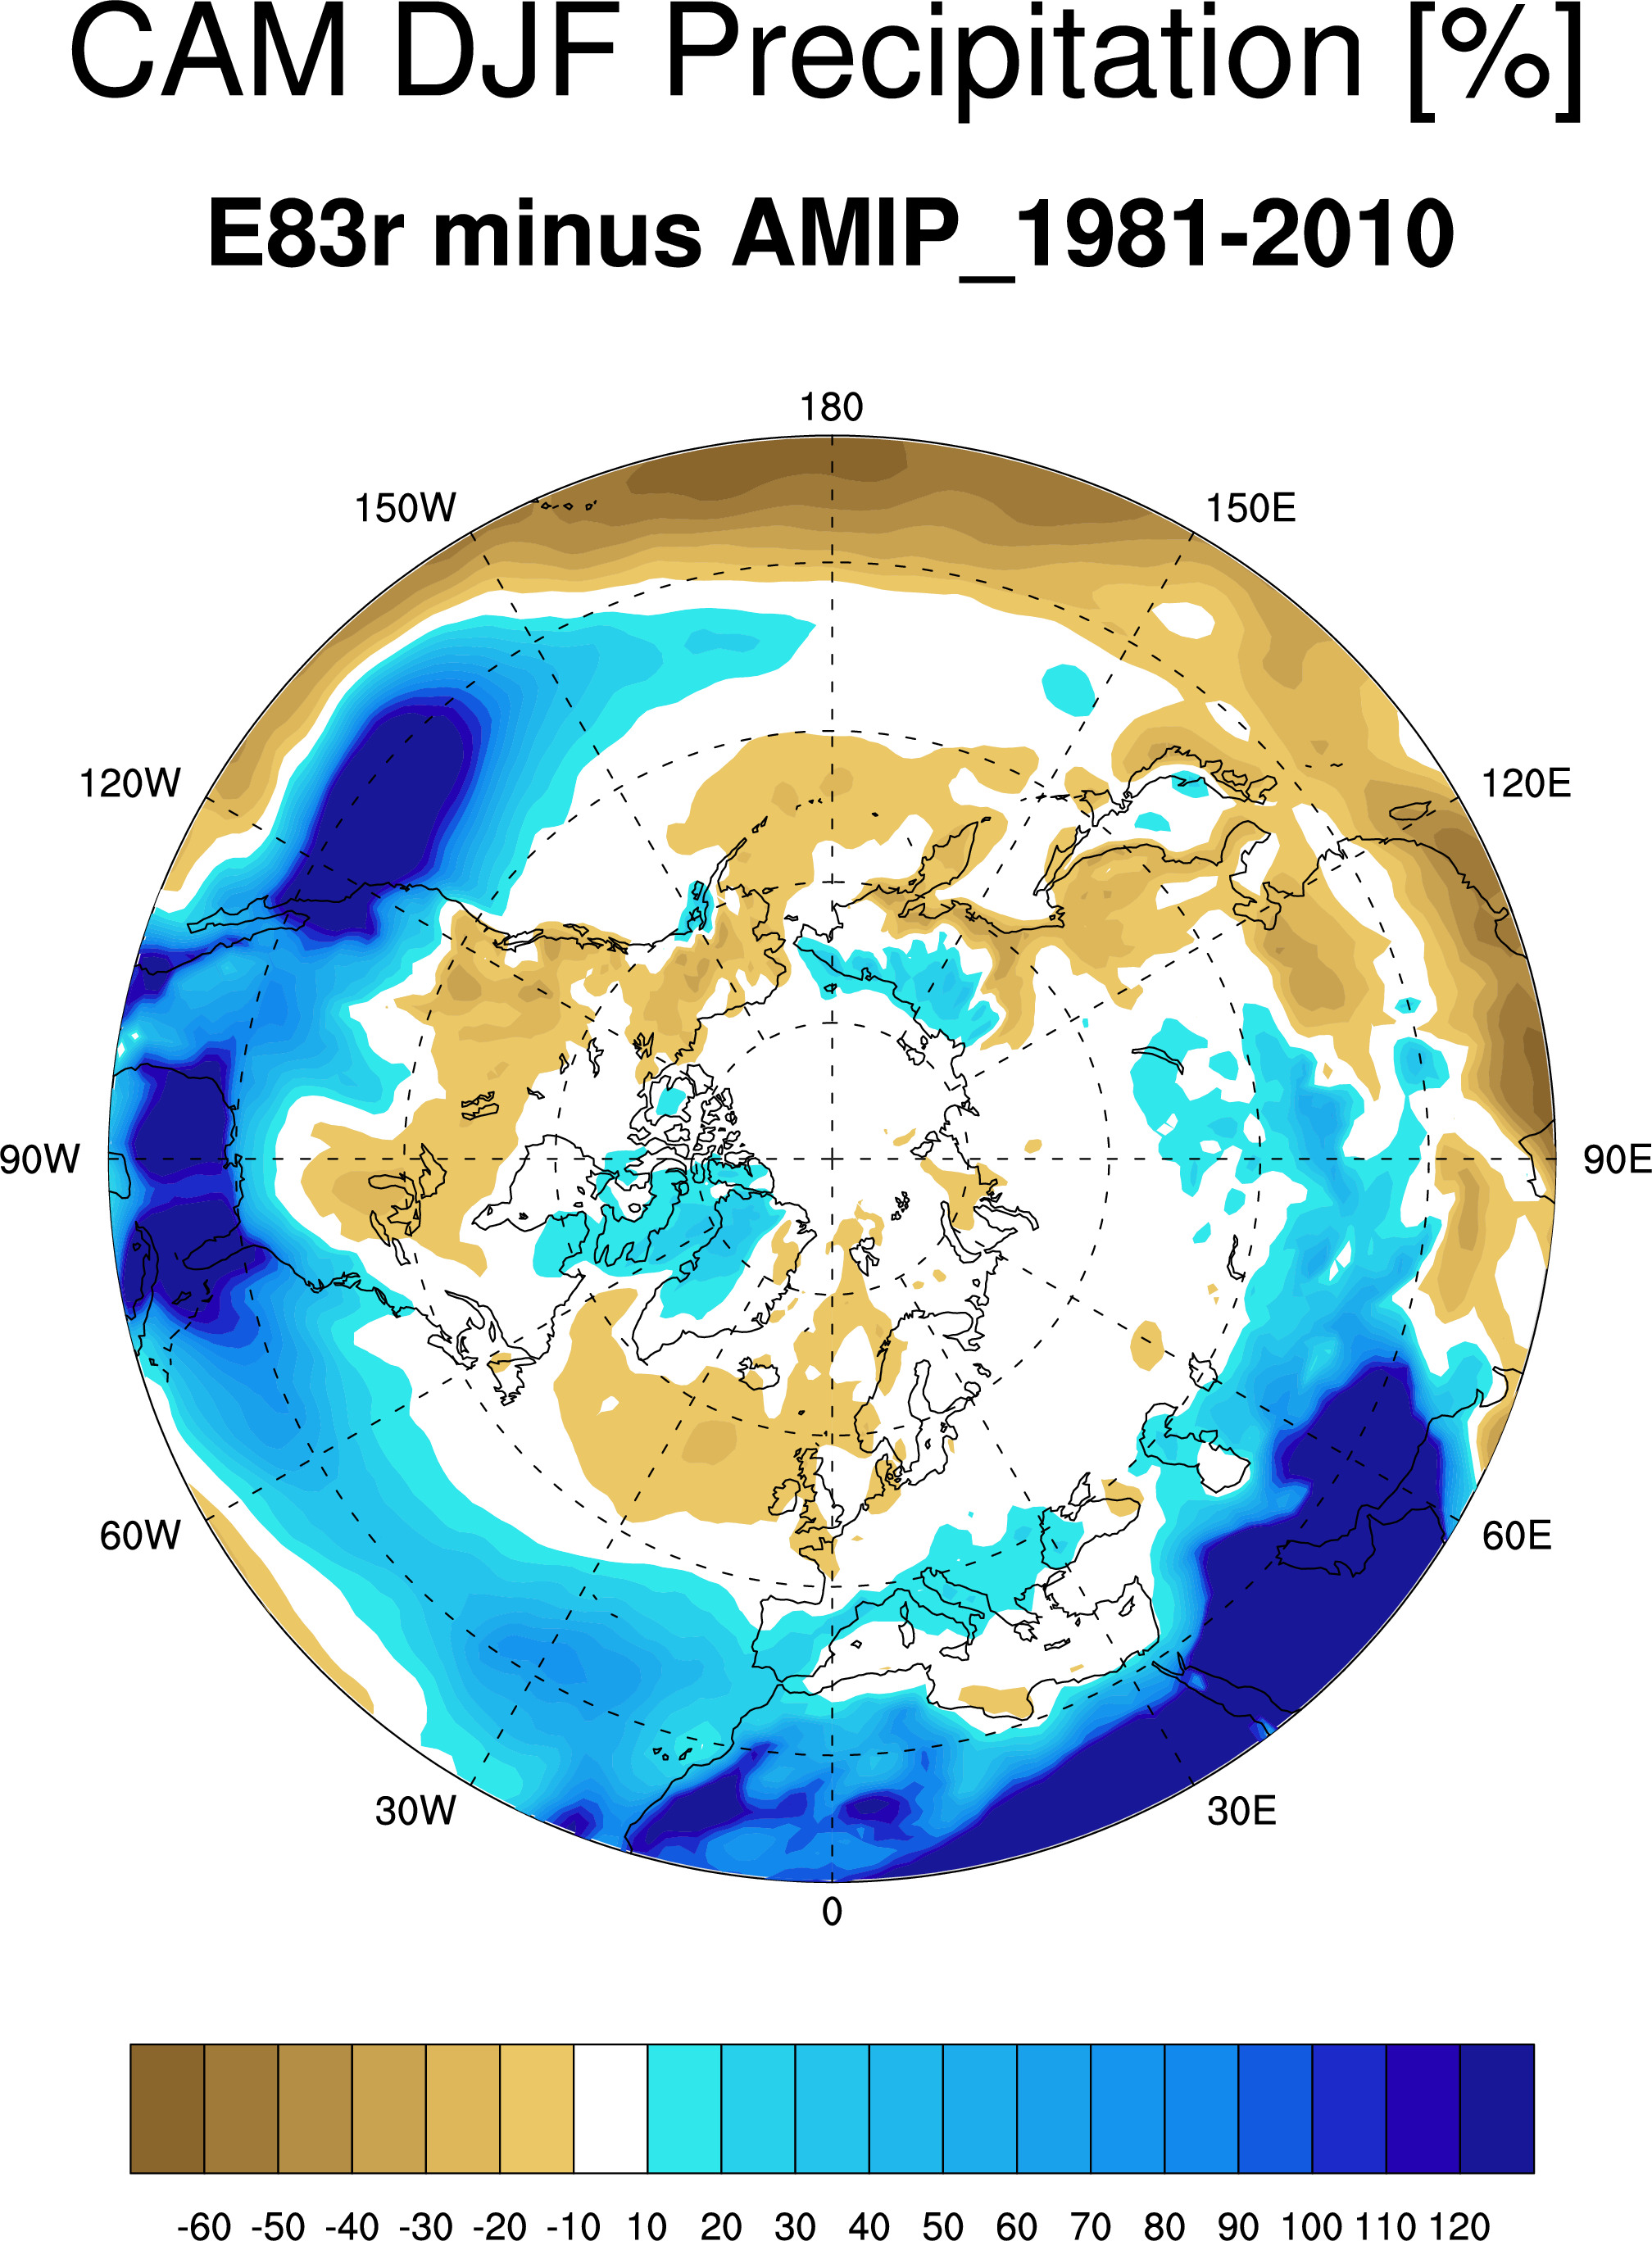
DJF mean precipitation:

-------------------------------------------------------------------
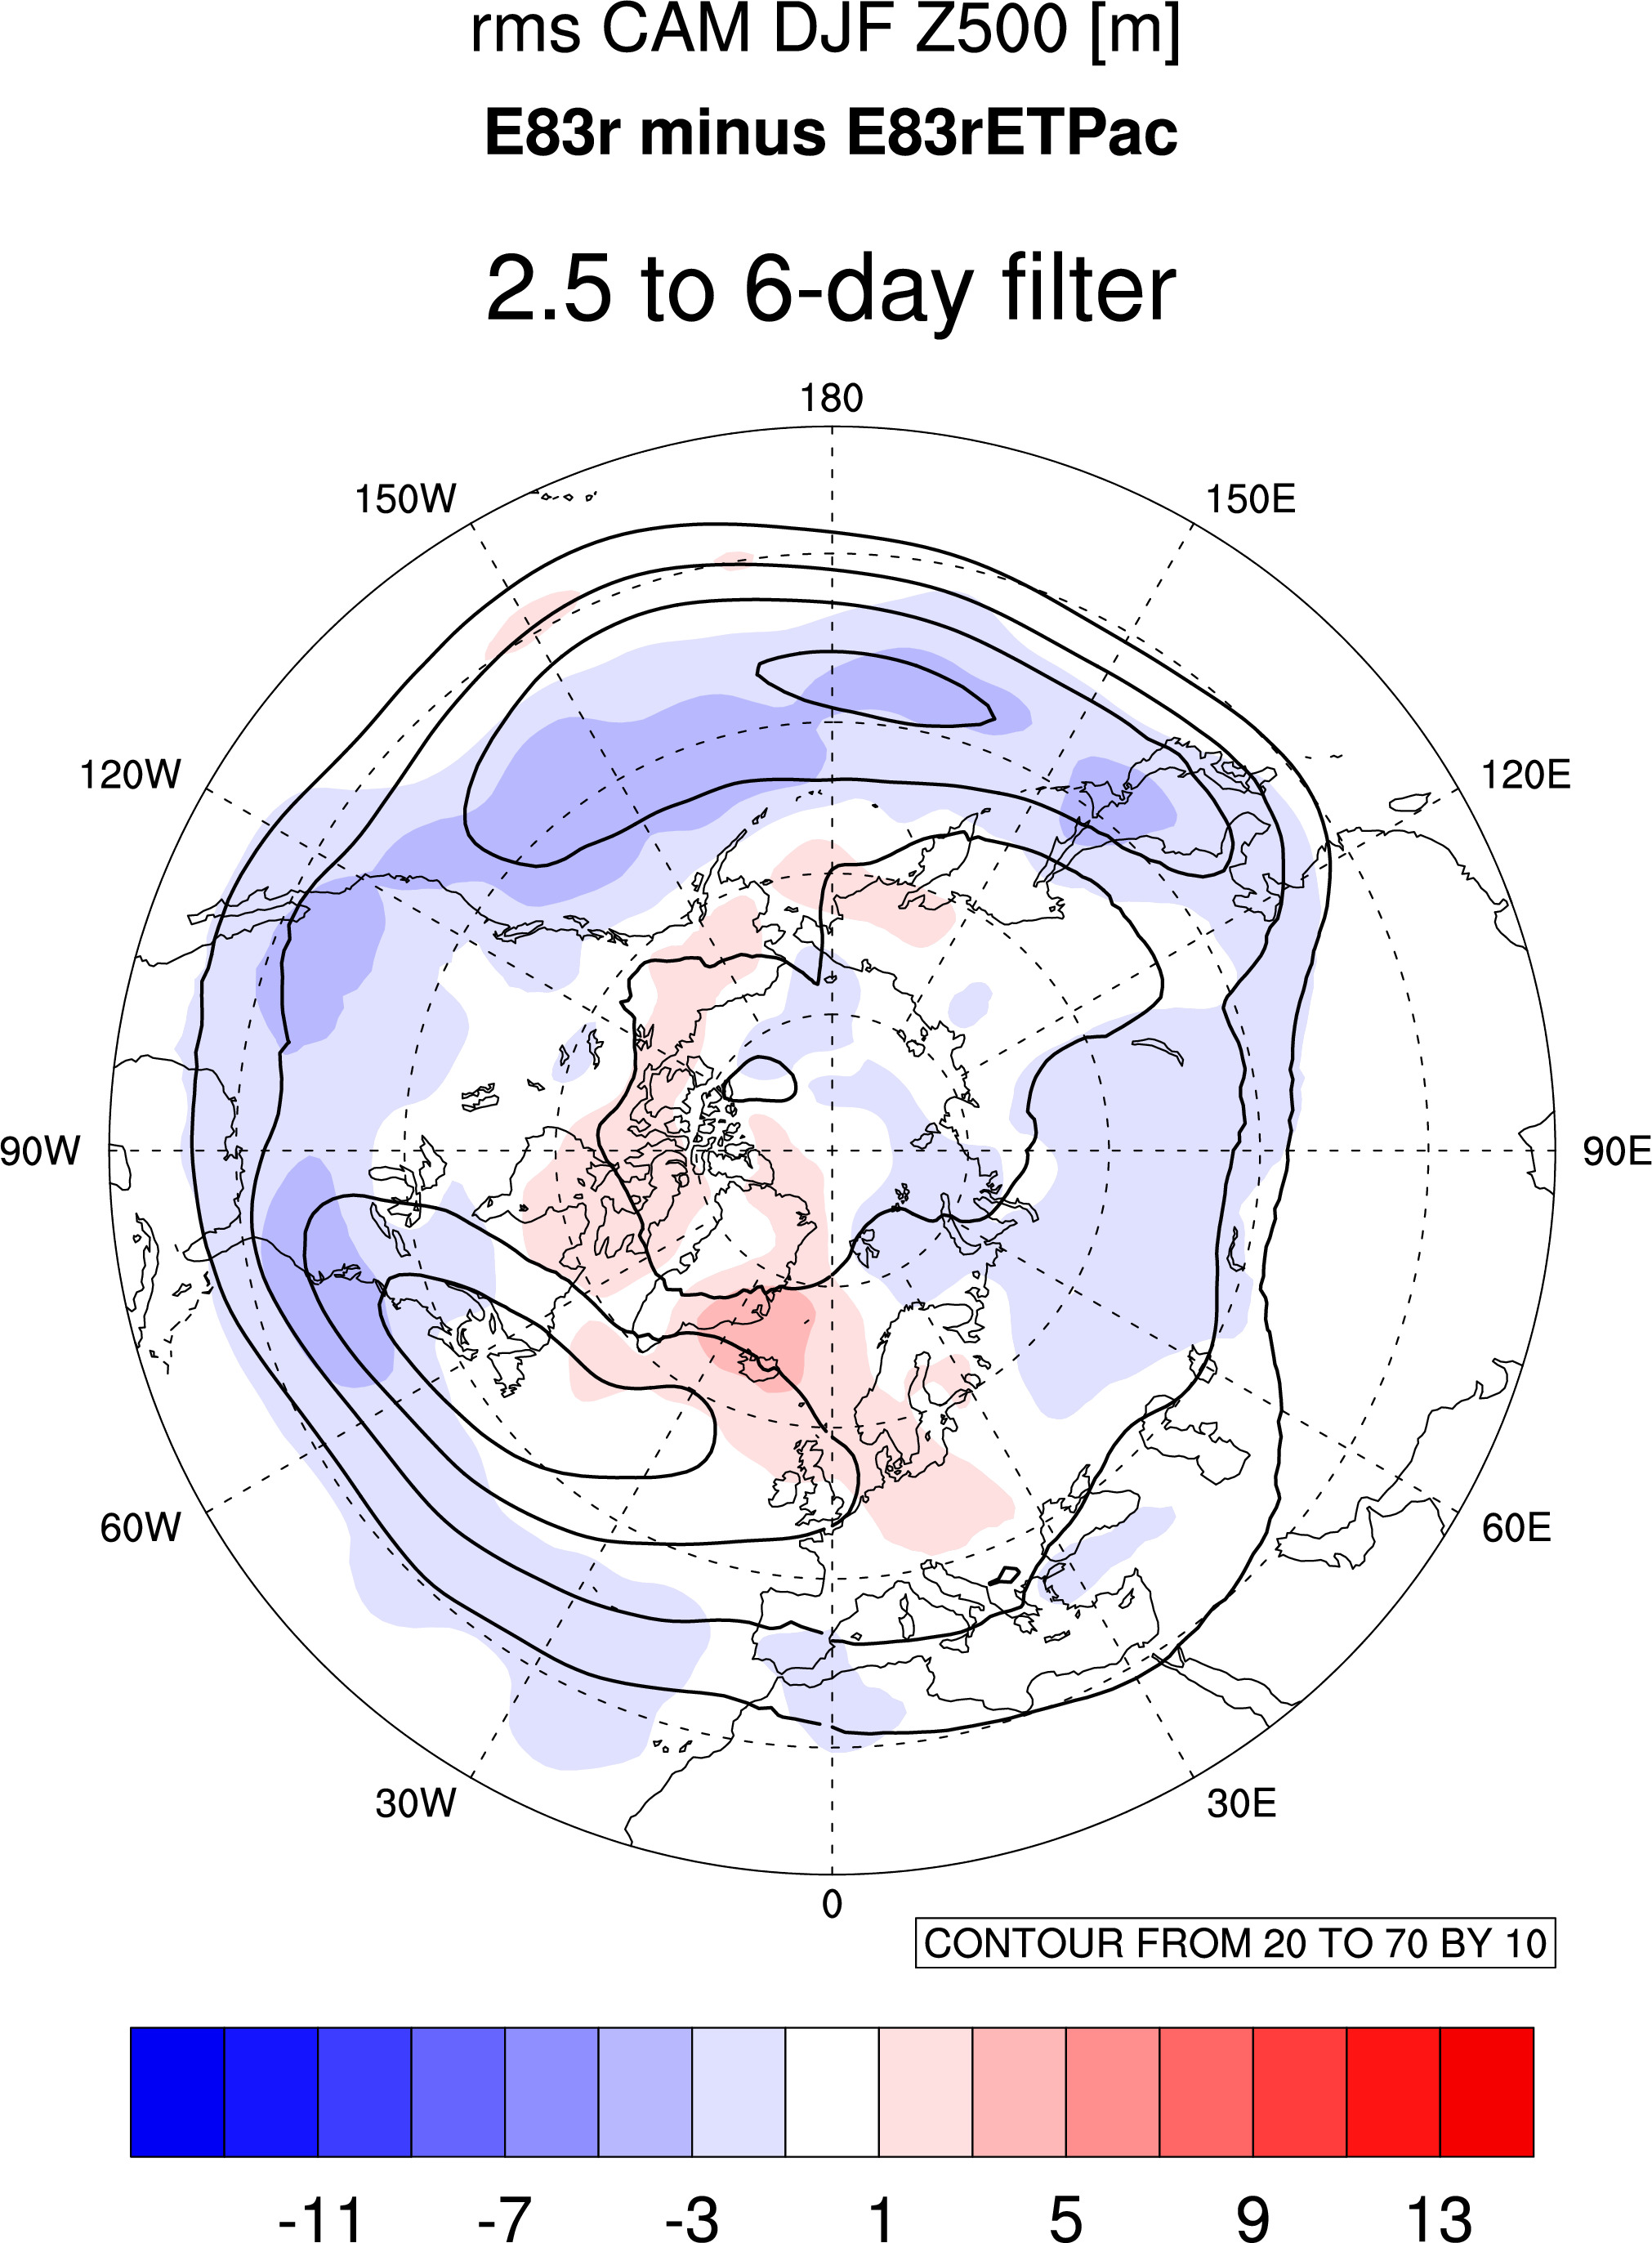
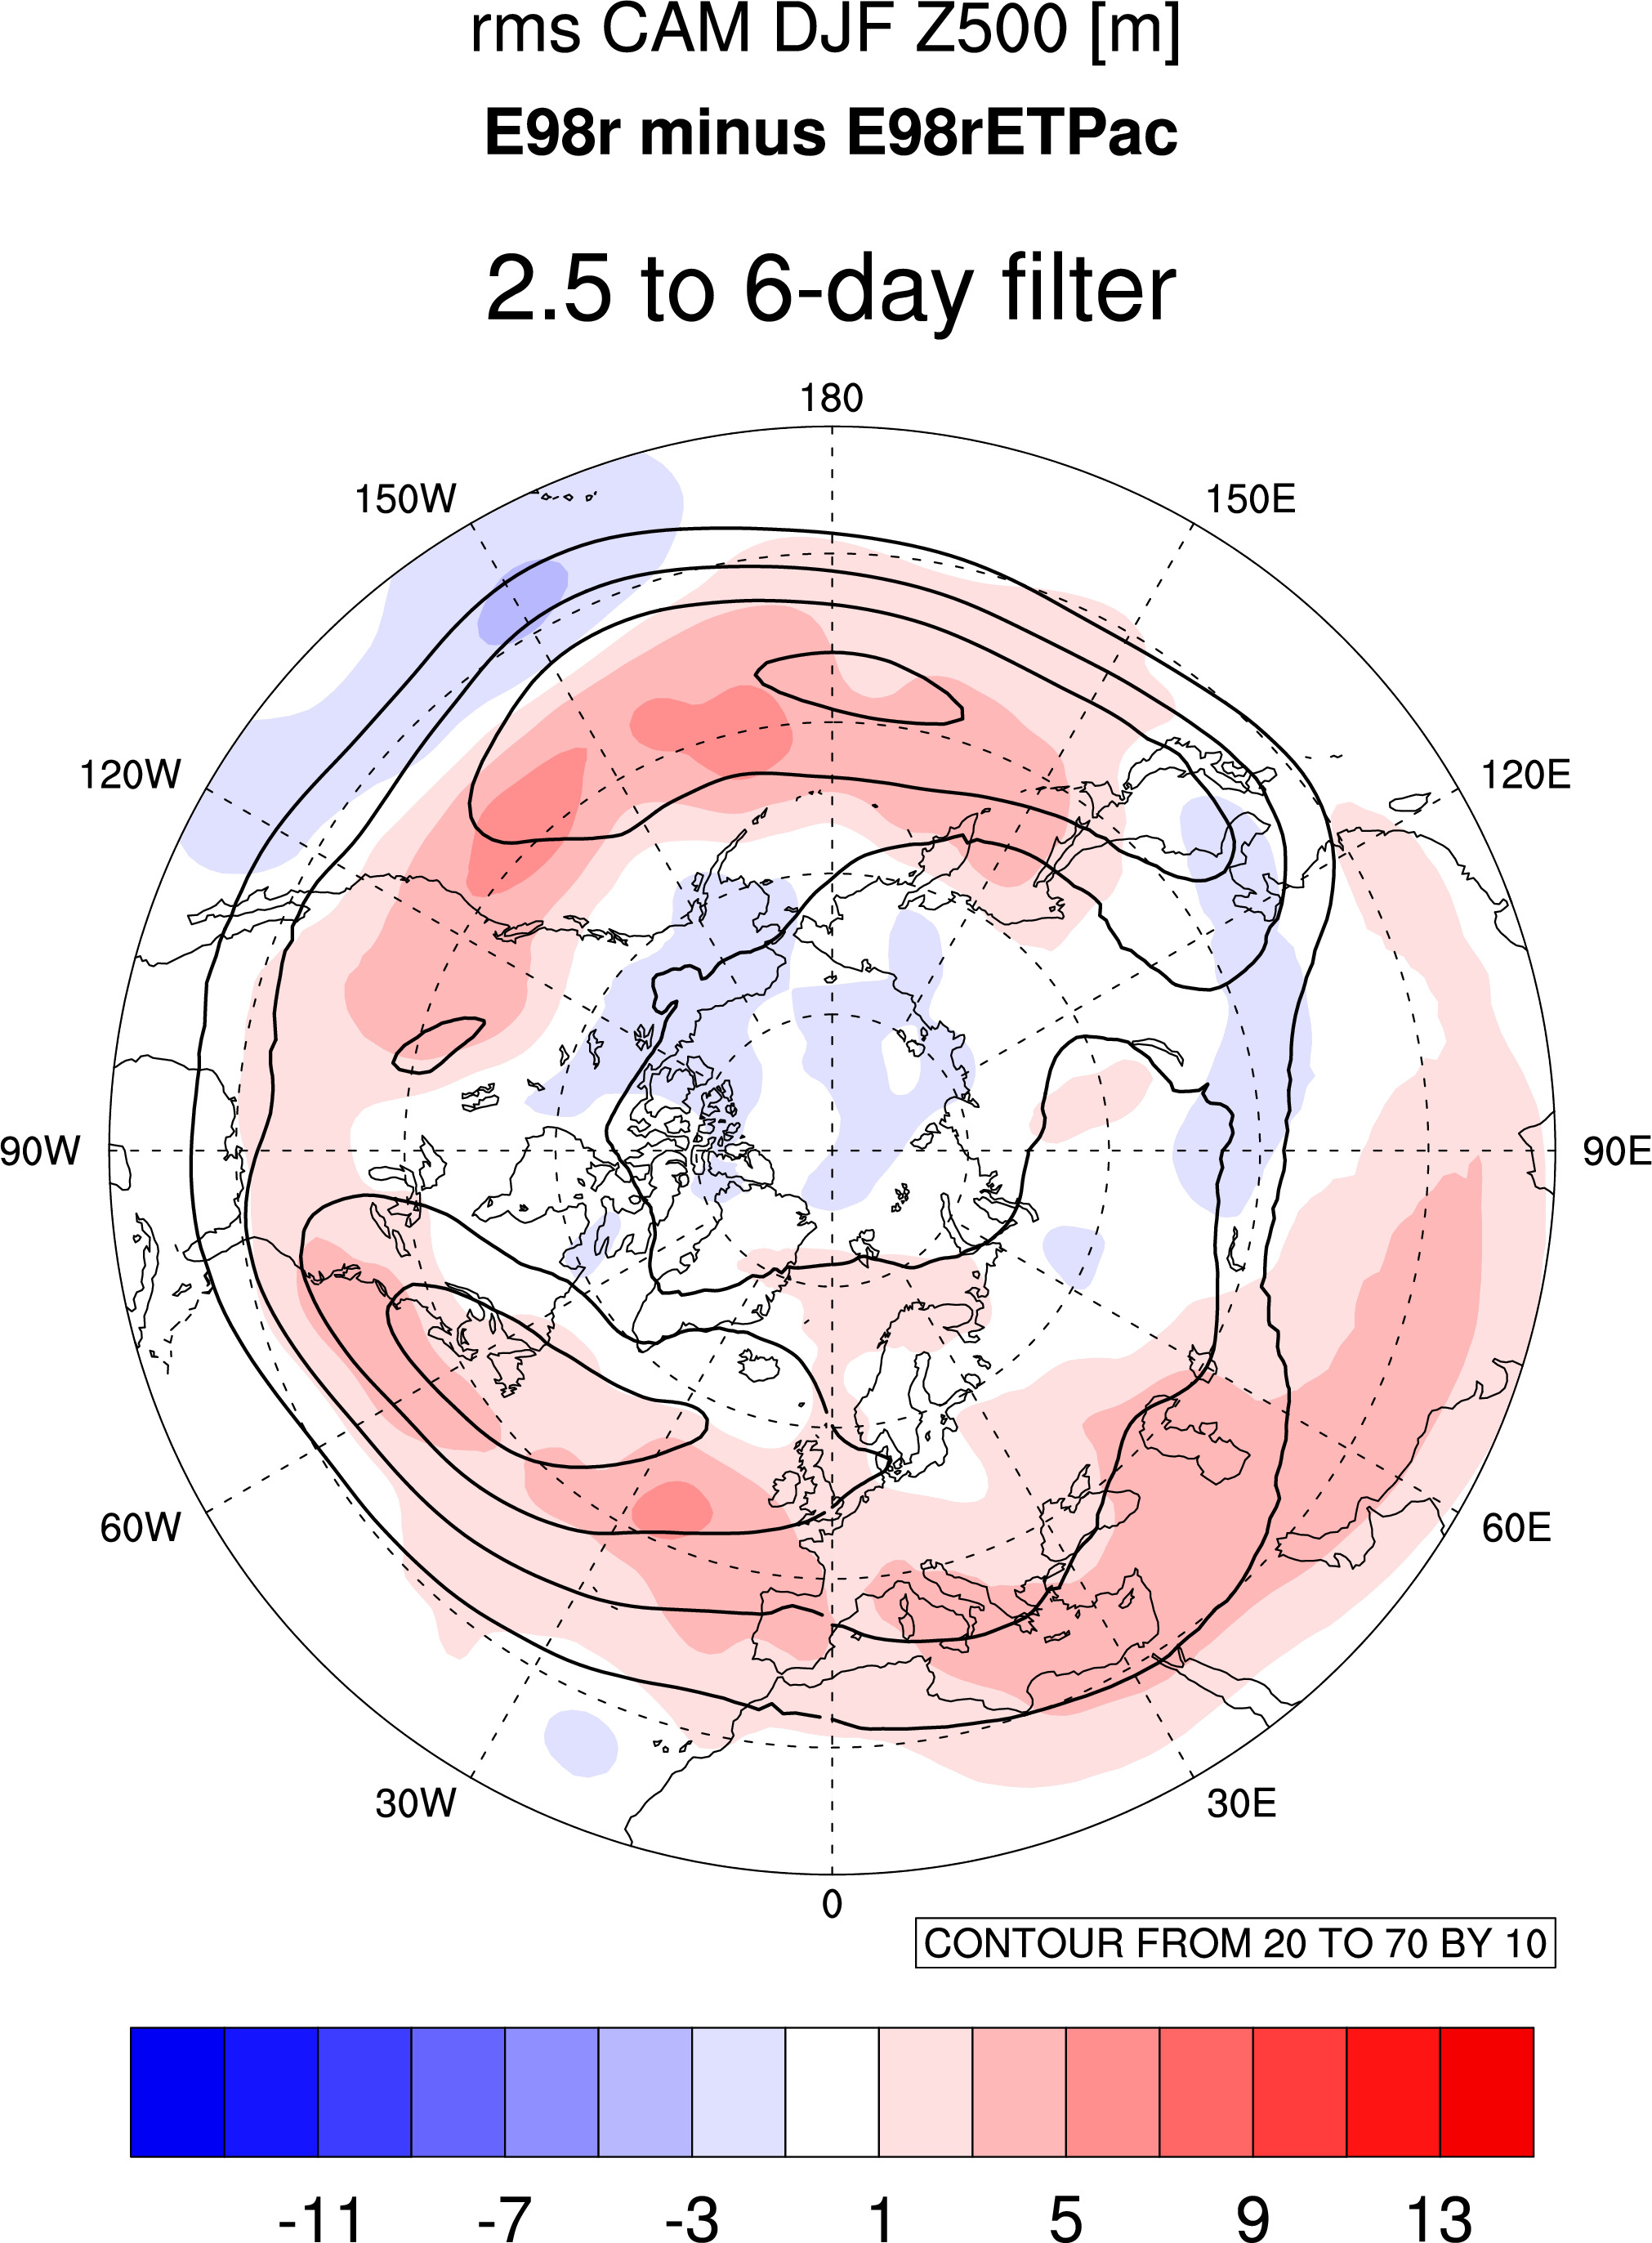
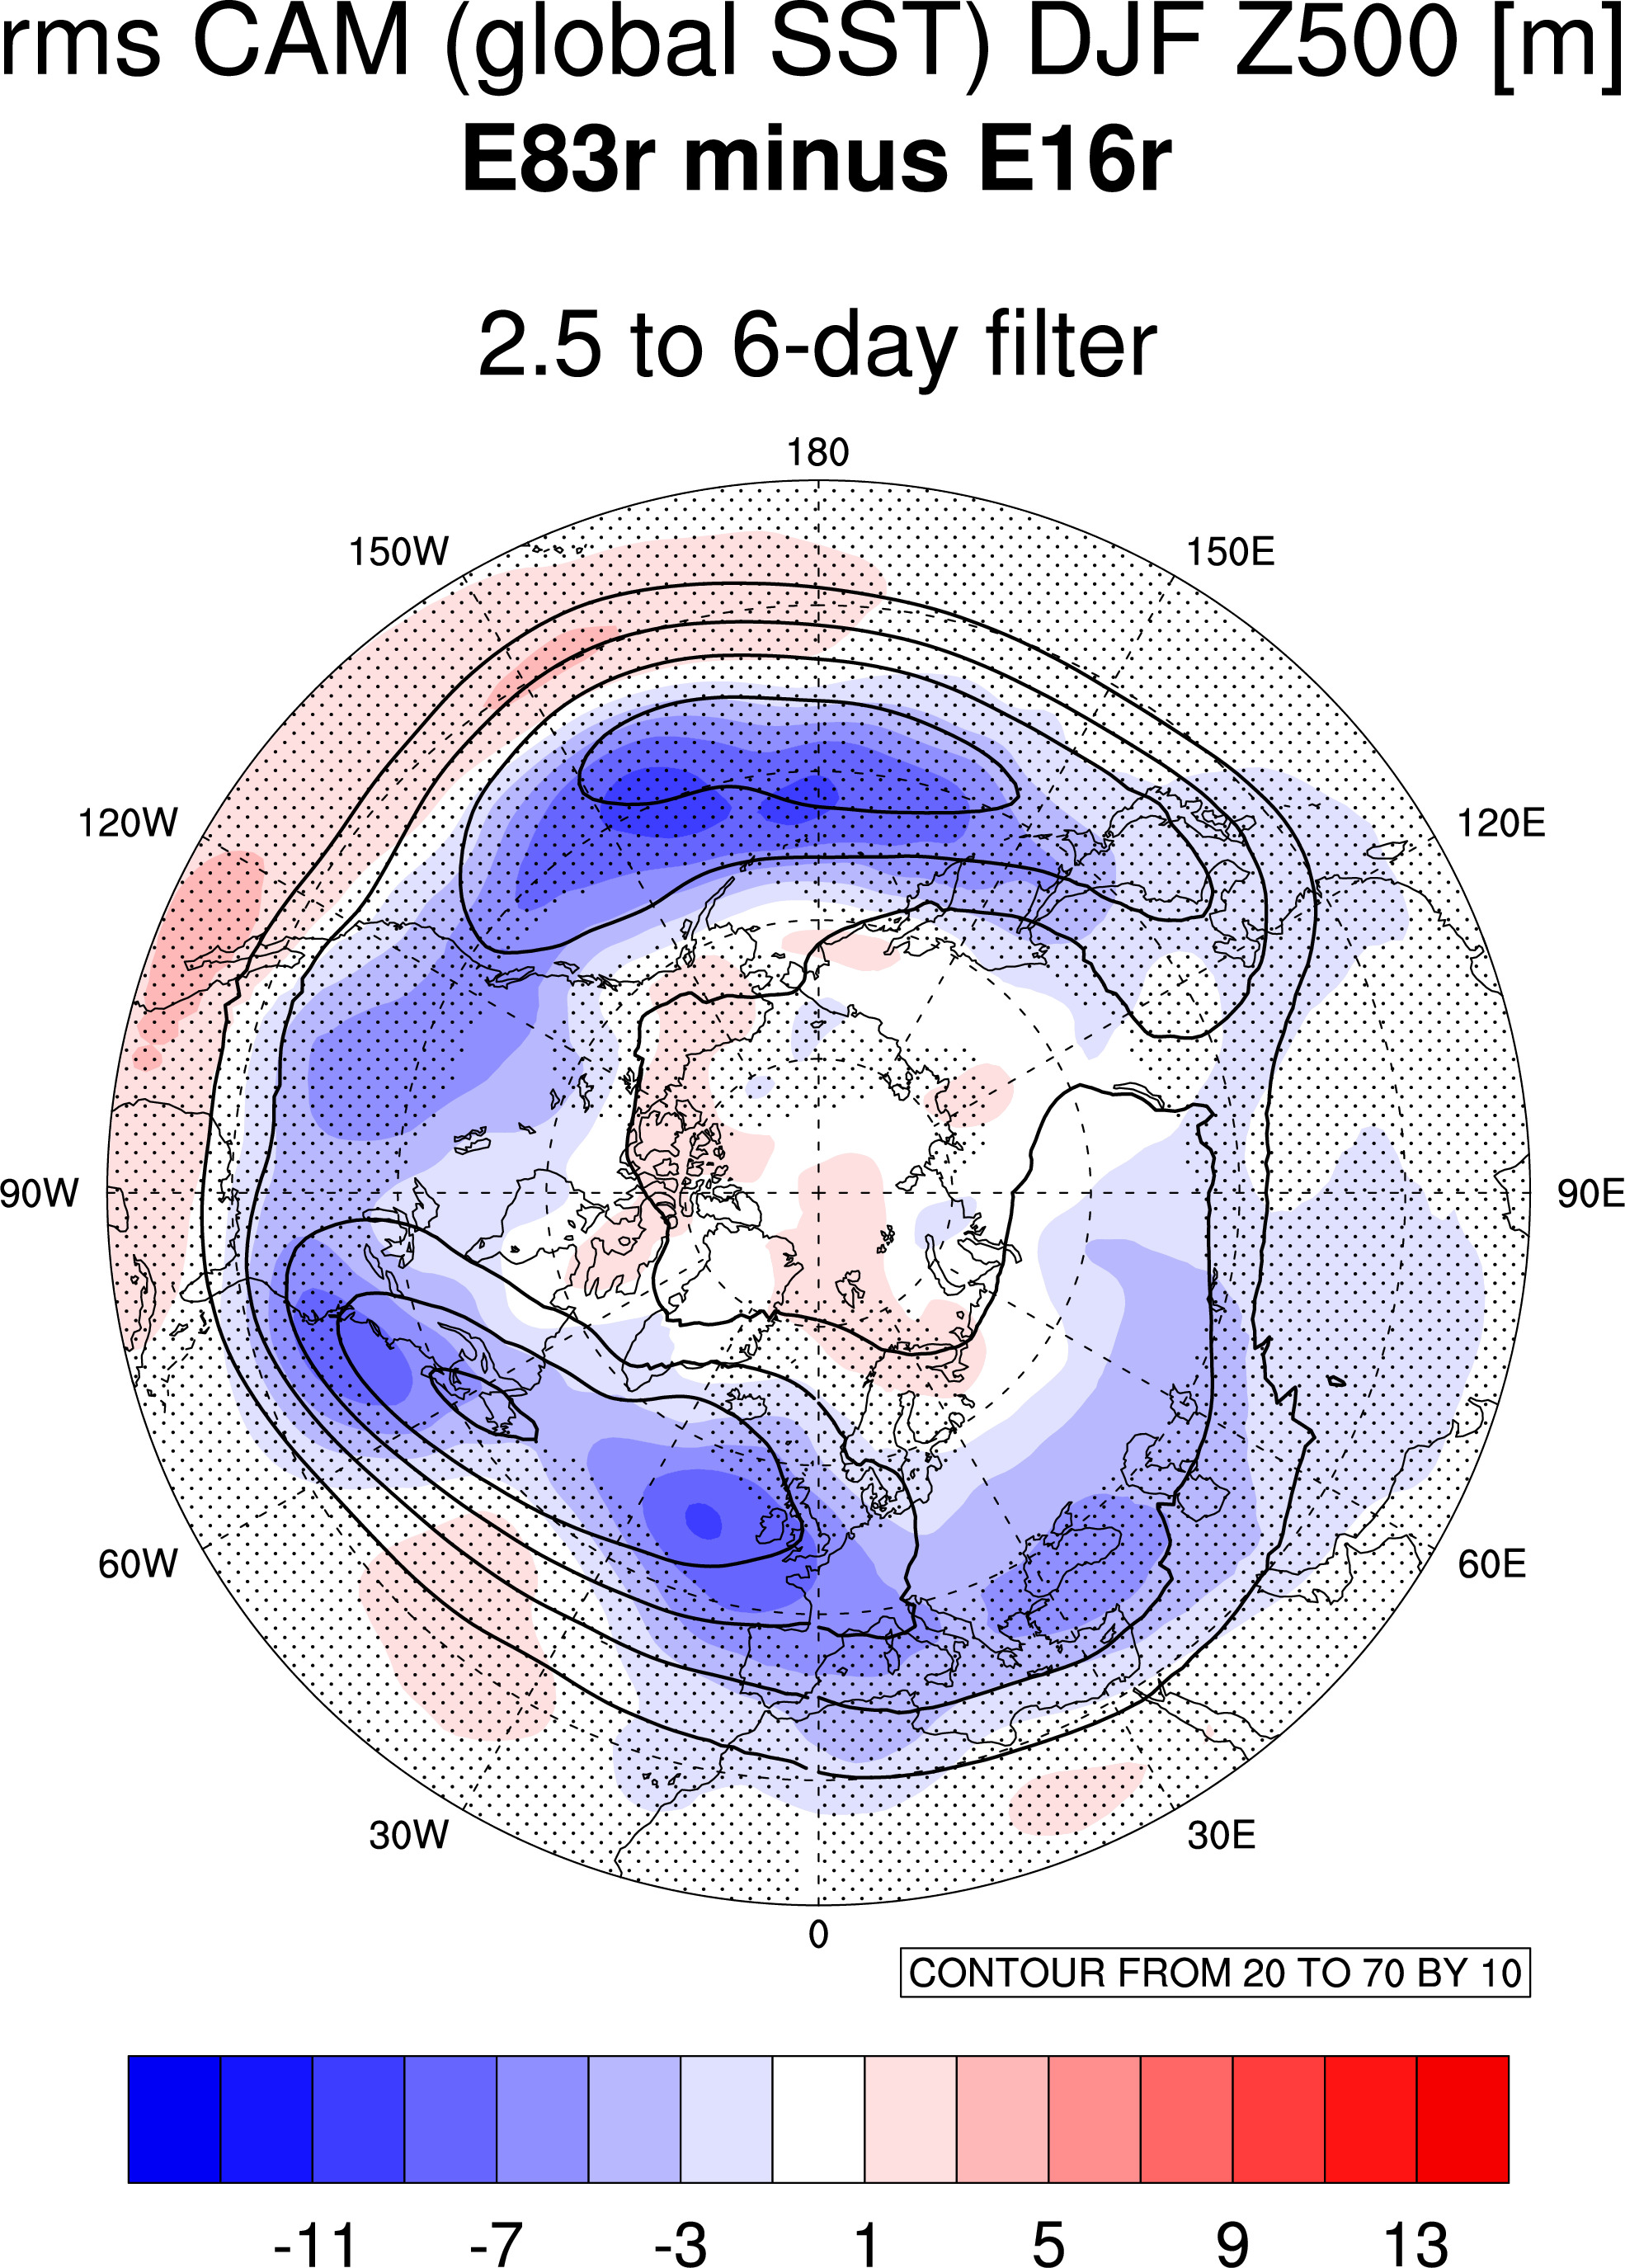
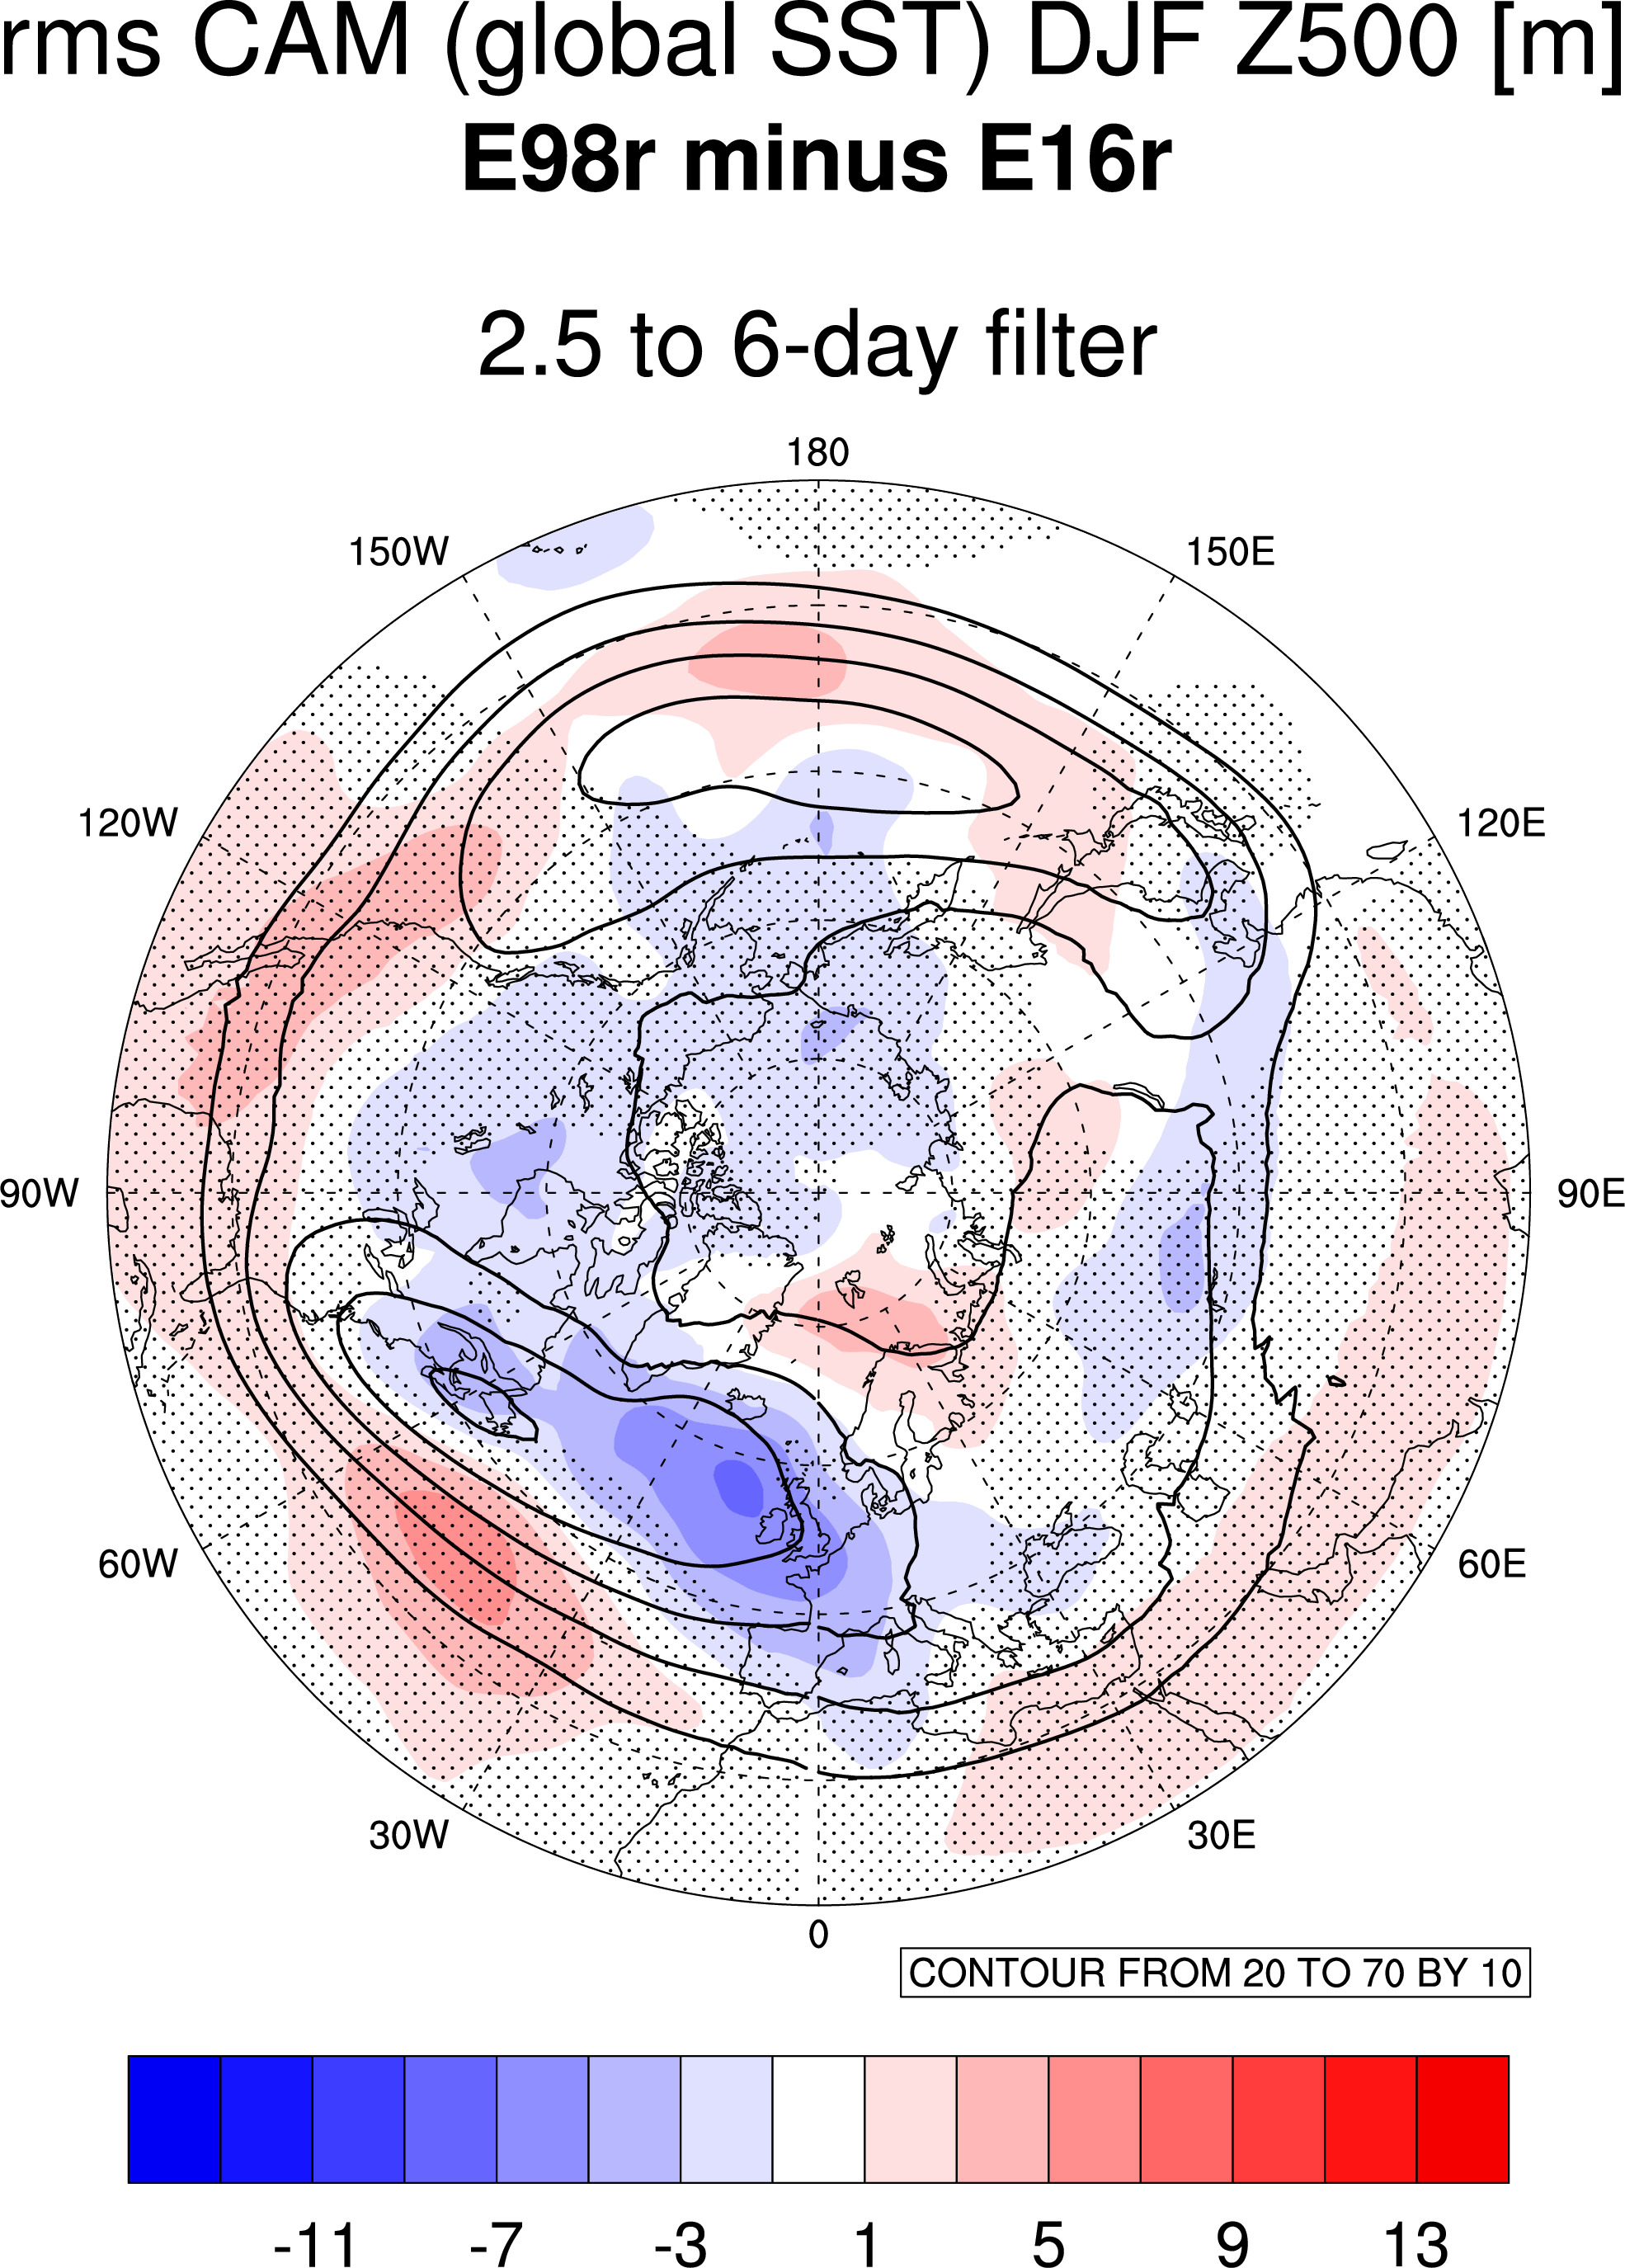
root mean square DJF Z500 from Xiao-Wei CAM
Differences:
where contour lines are E16r case.
same plots with 95% stippling (from t-test):
averaging over rms for 4 different cases:
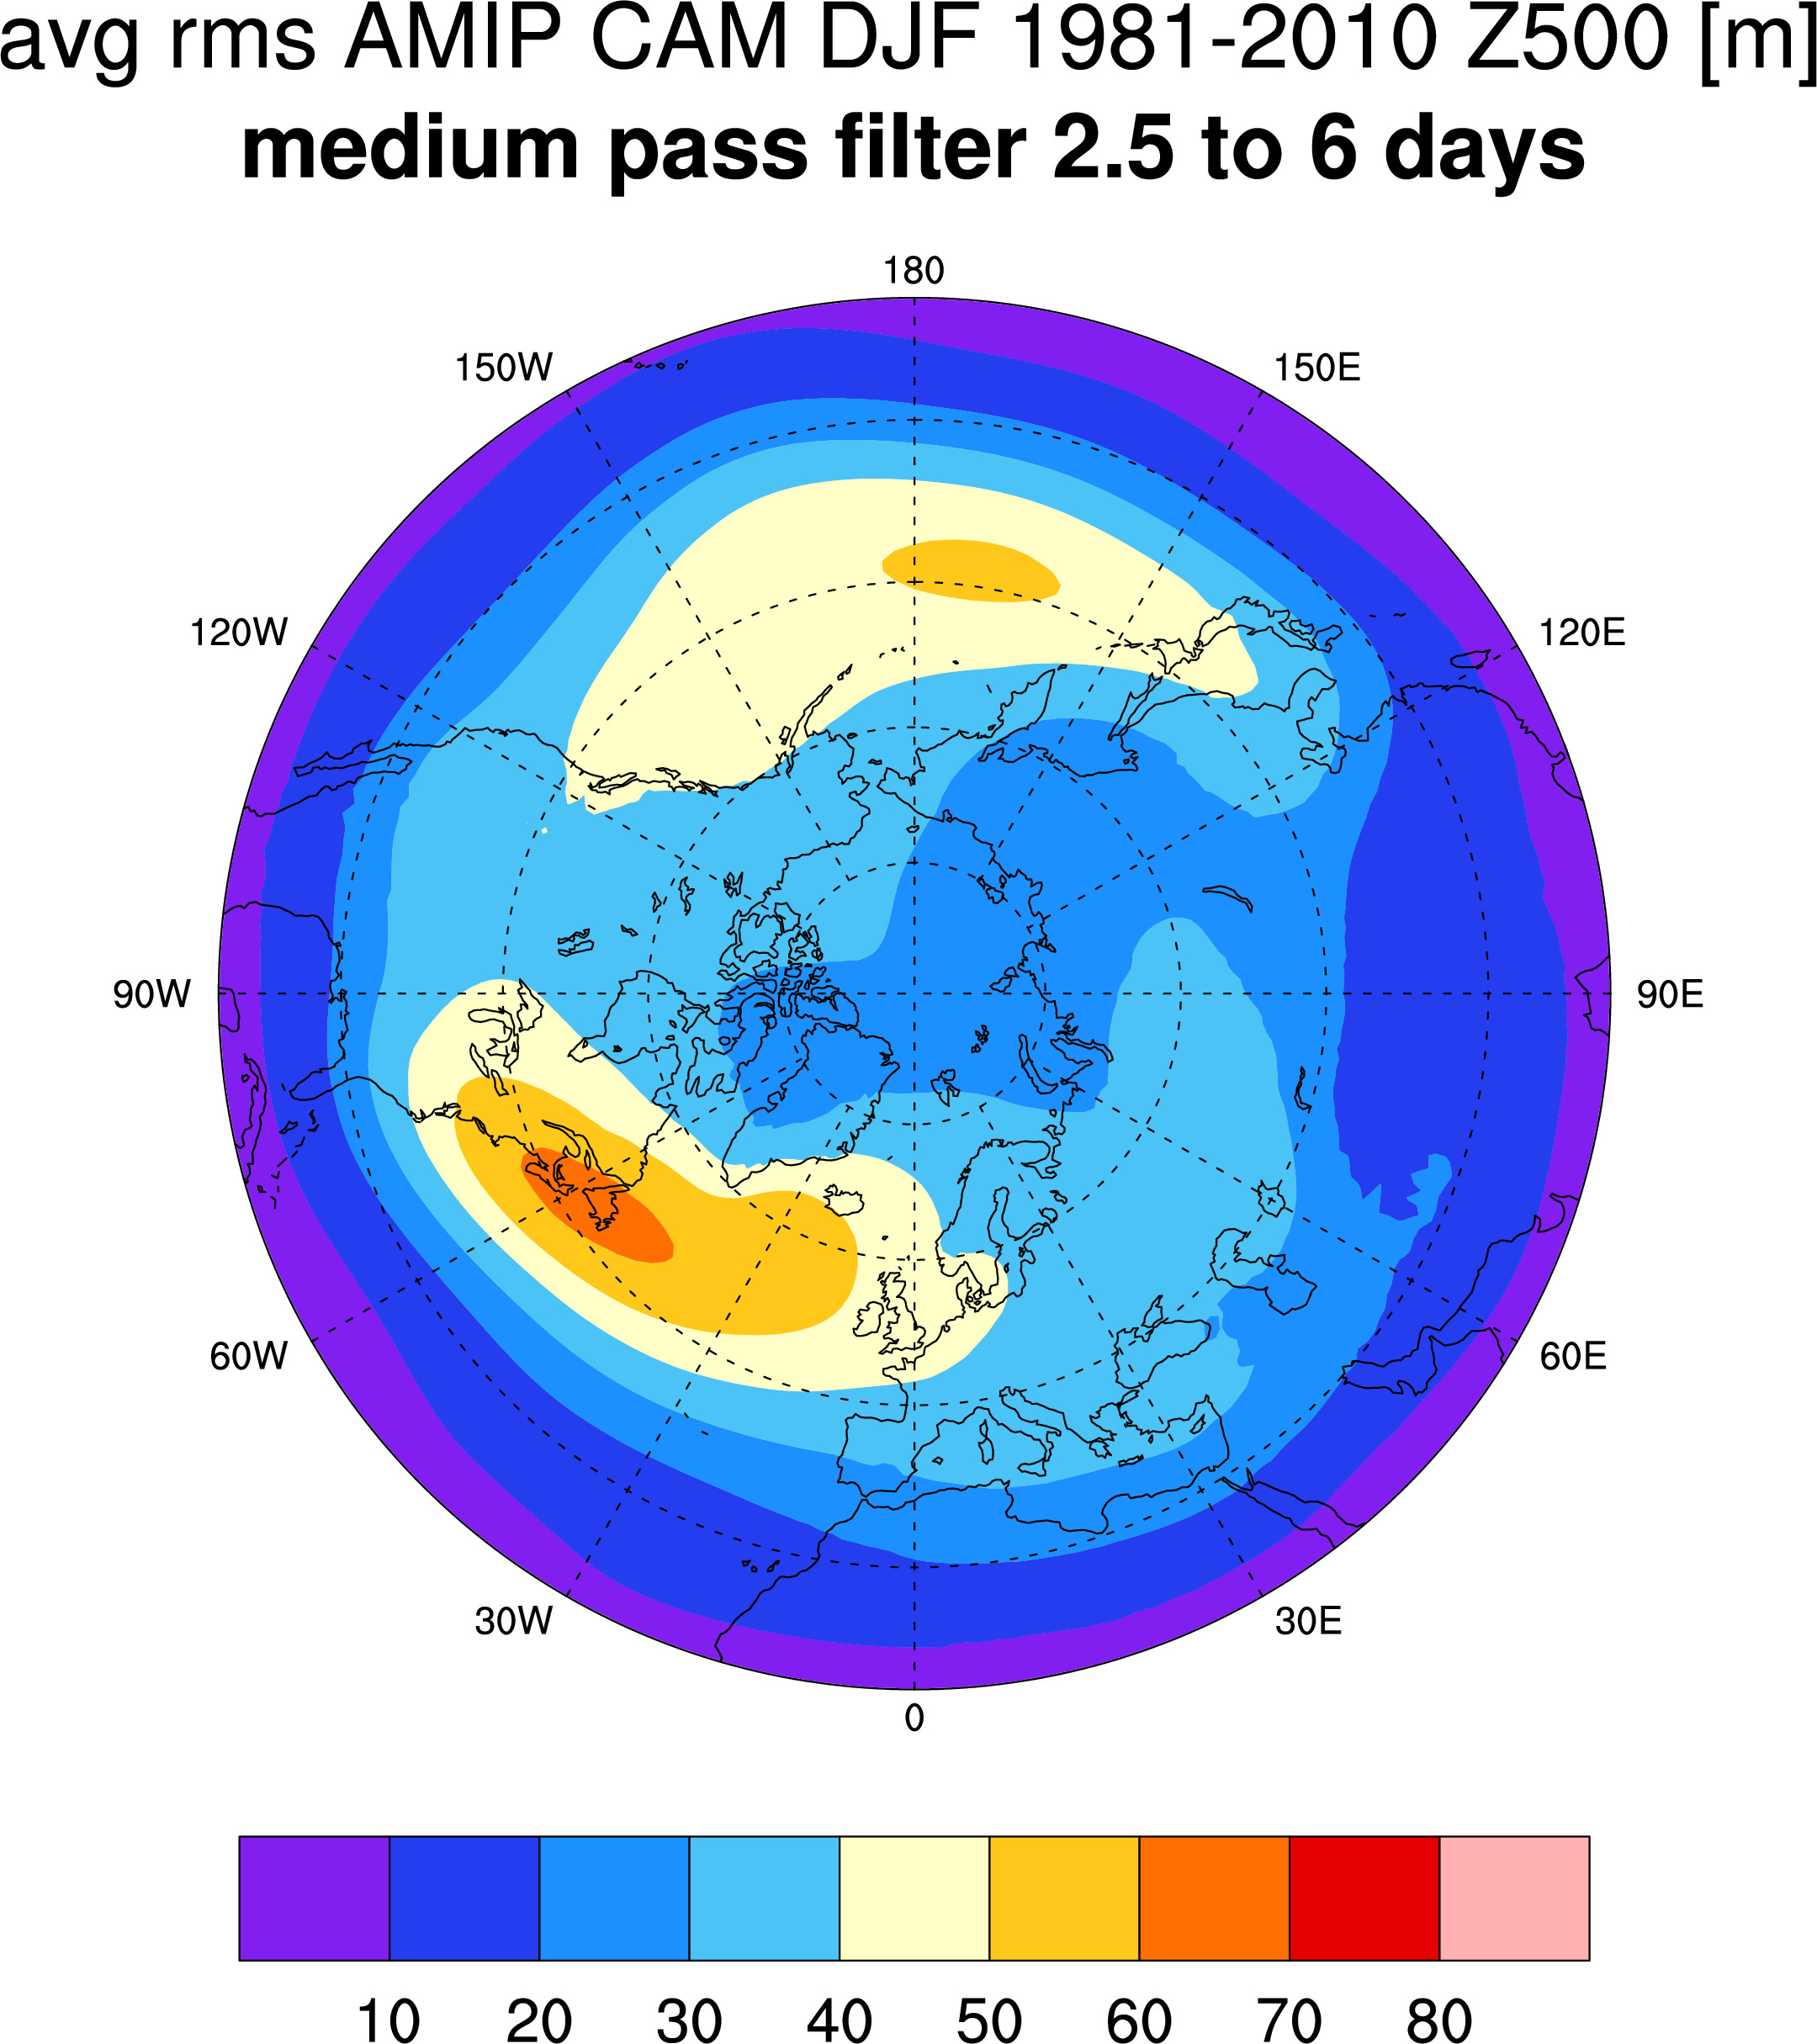
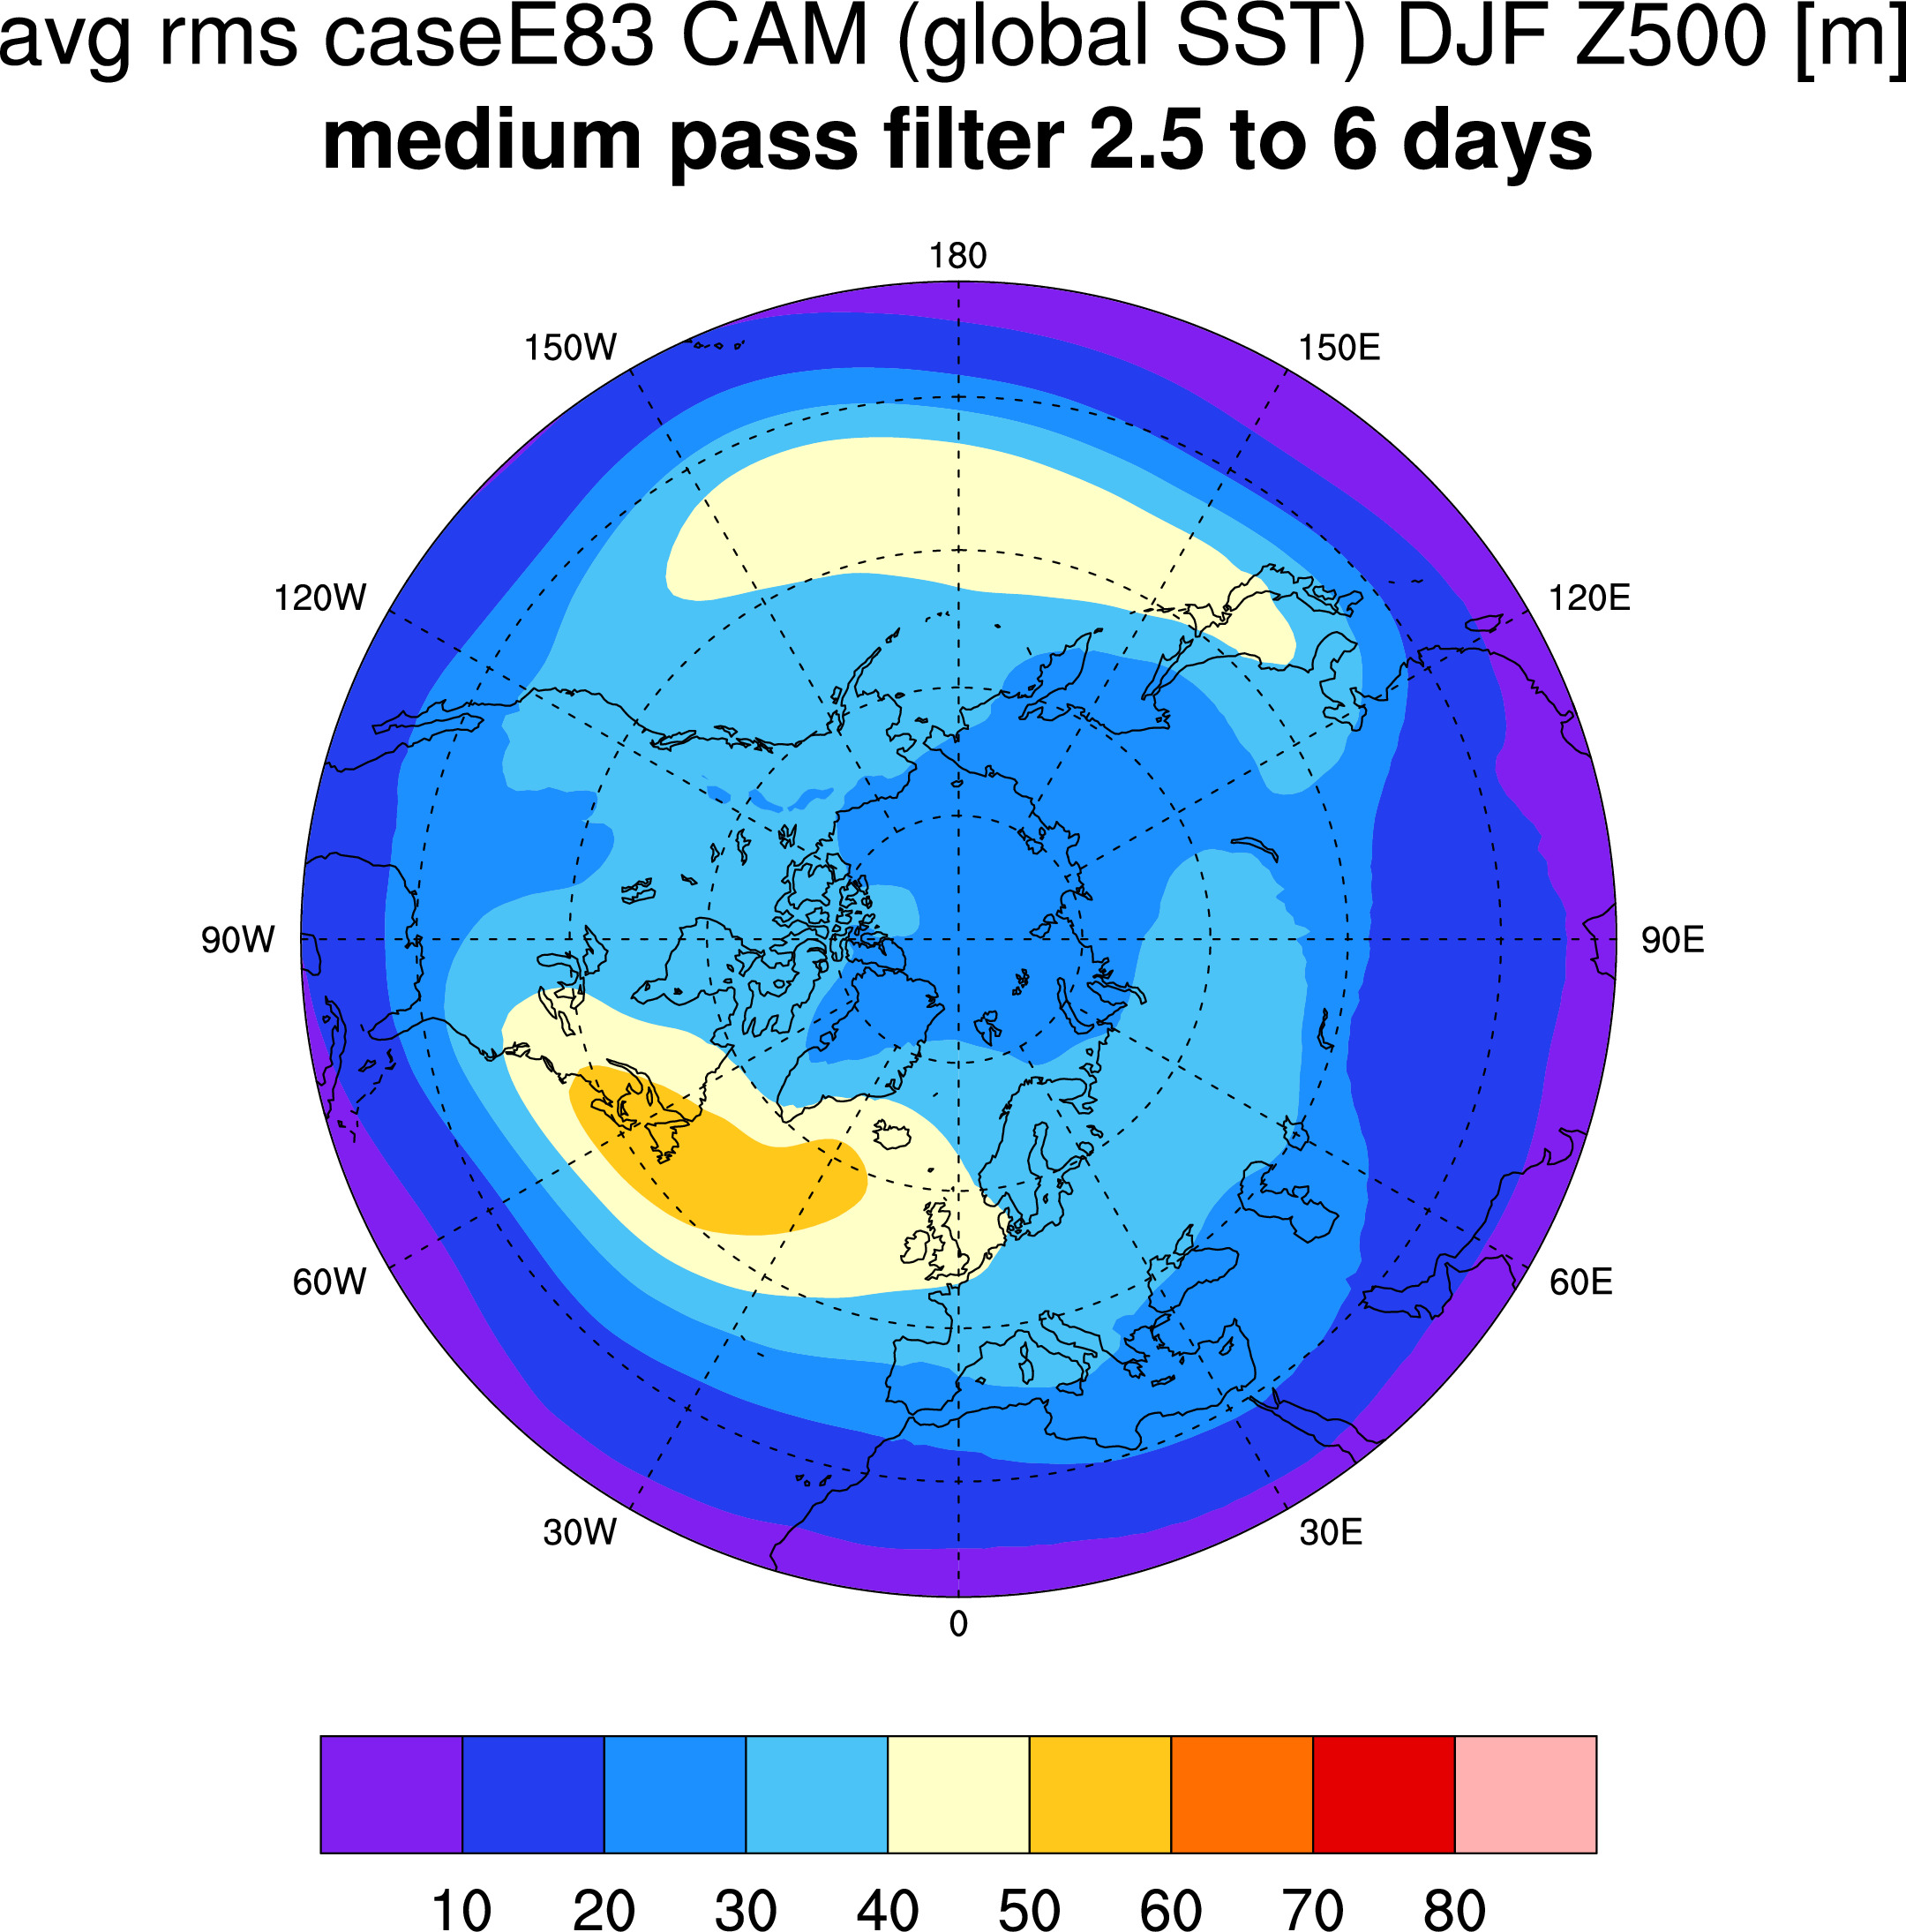
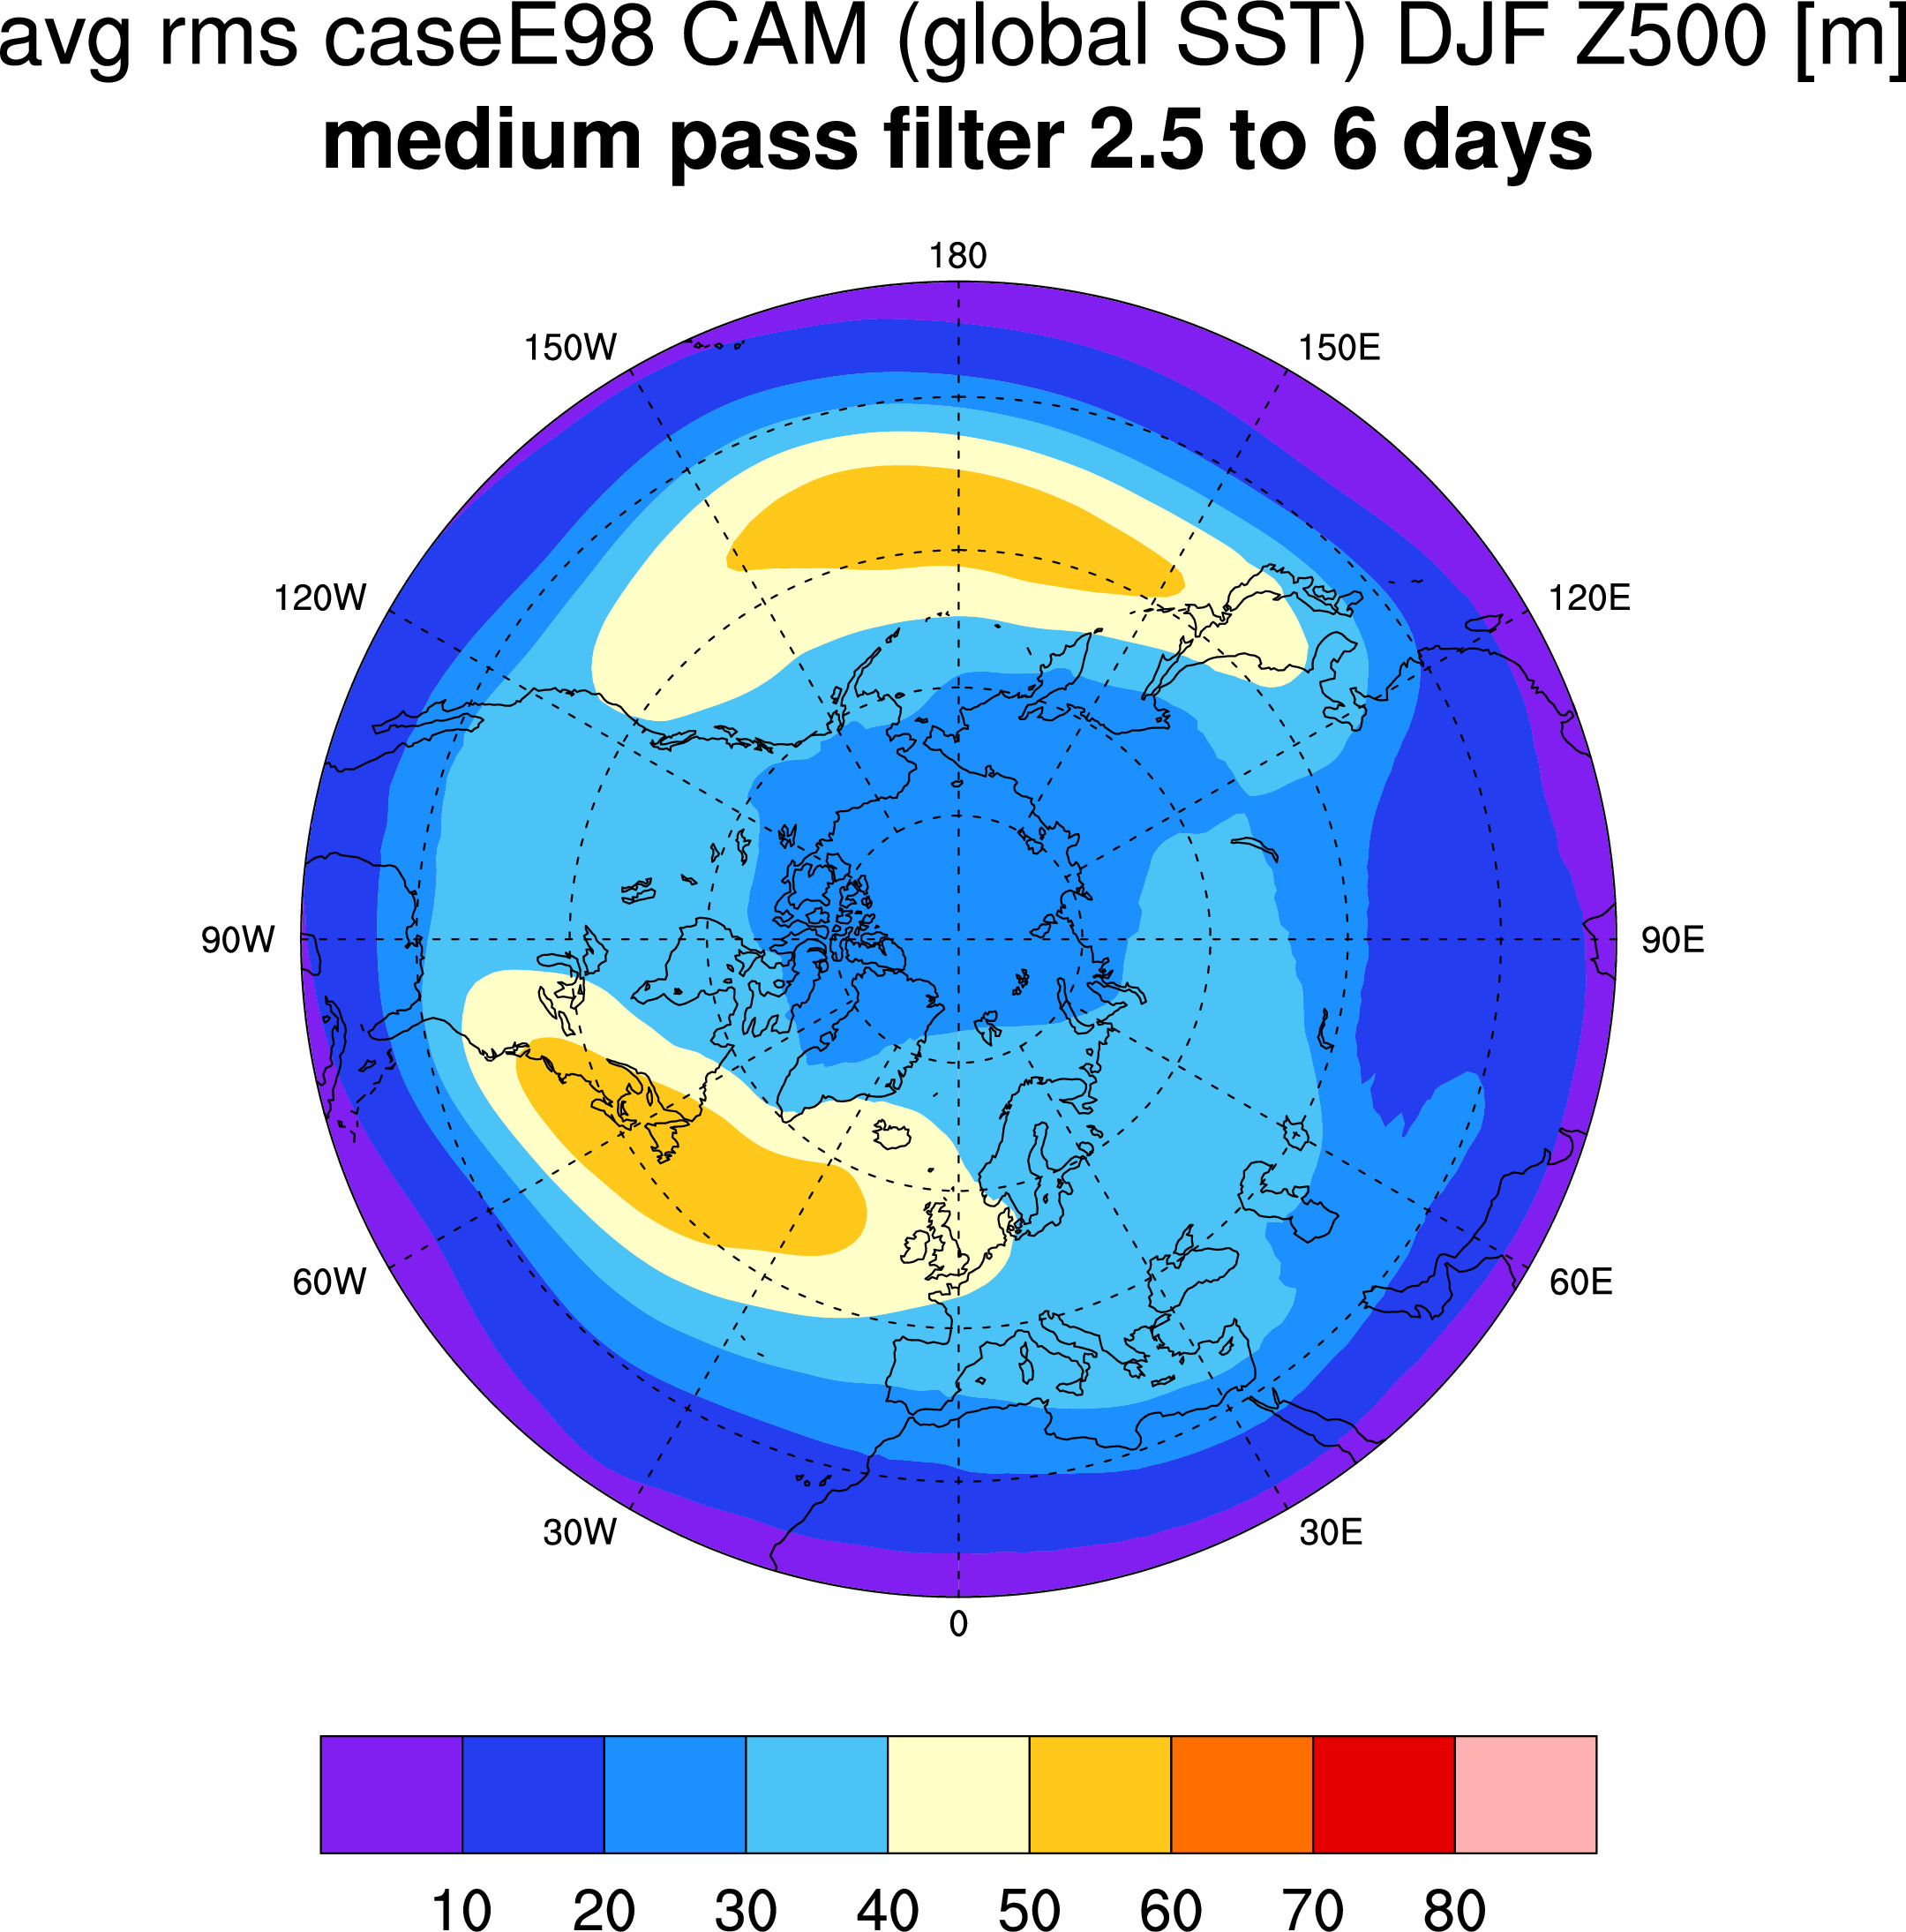
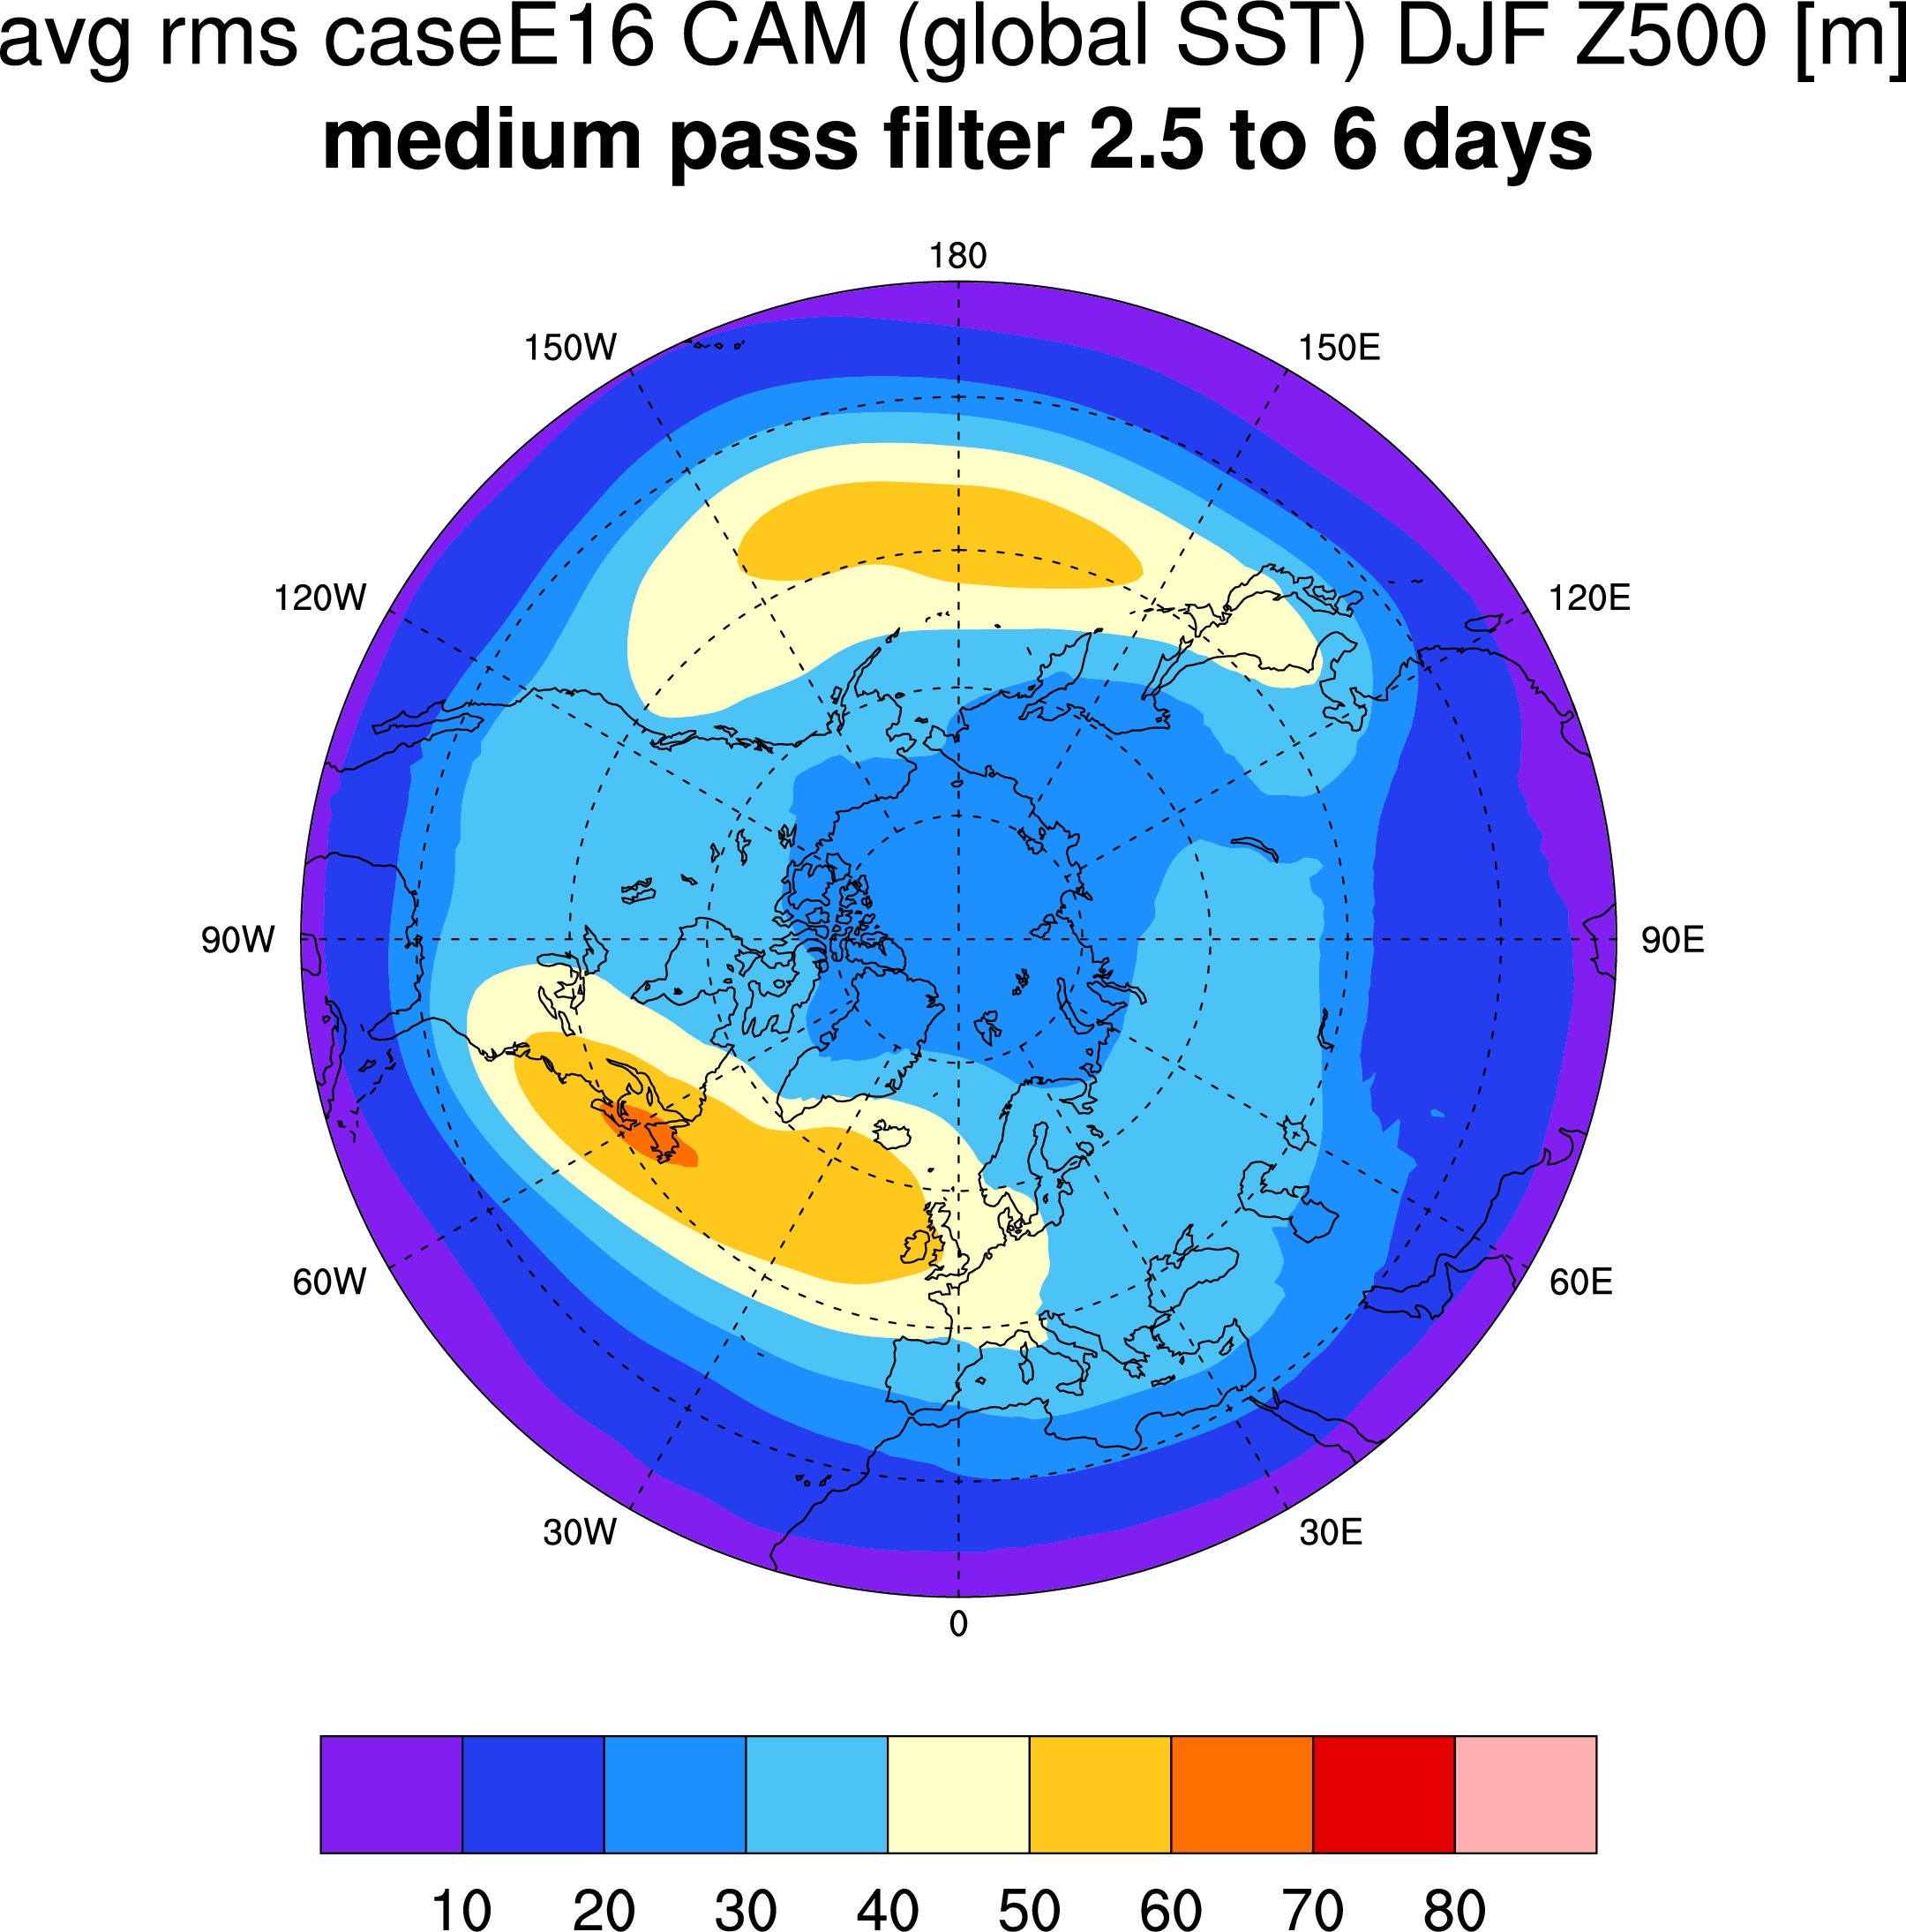
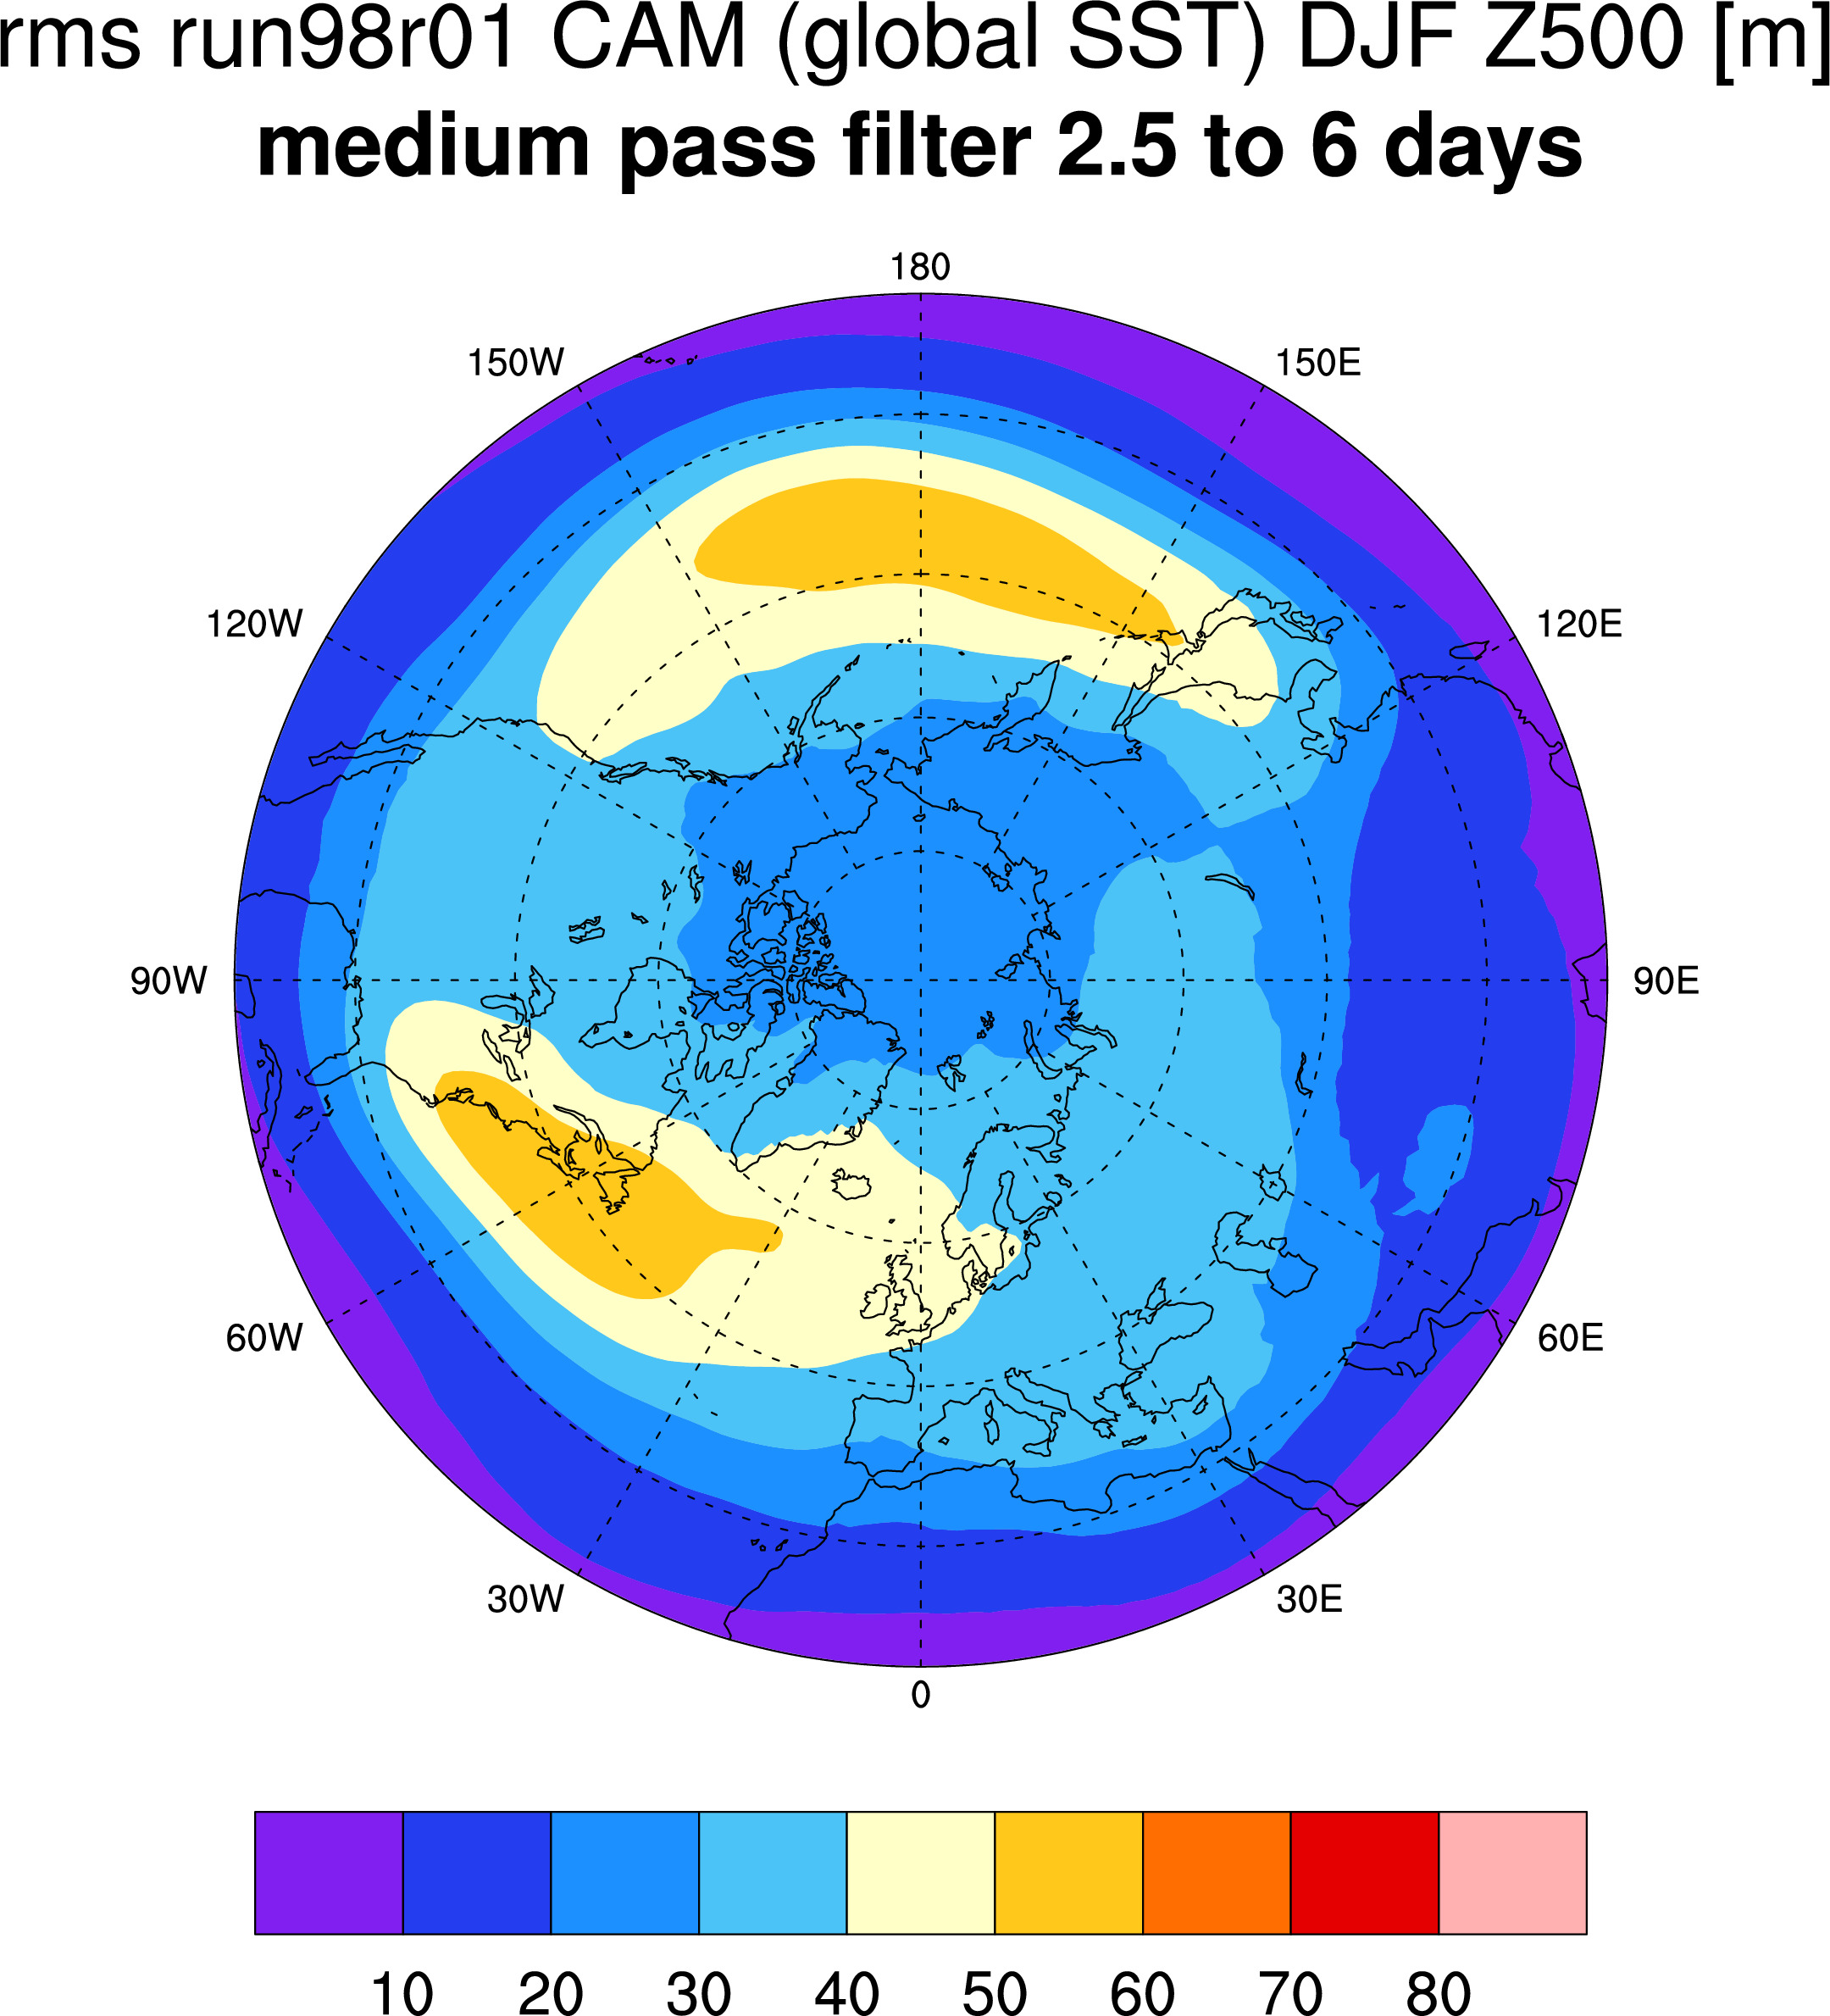
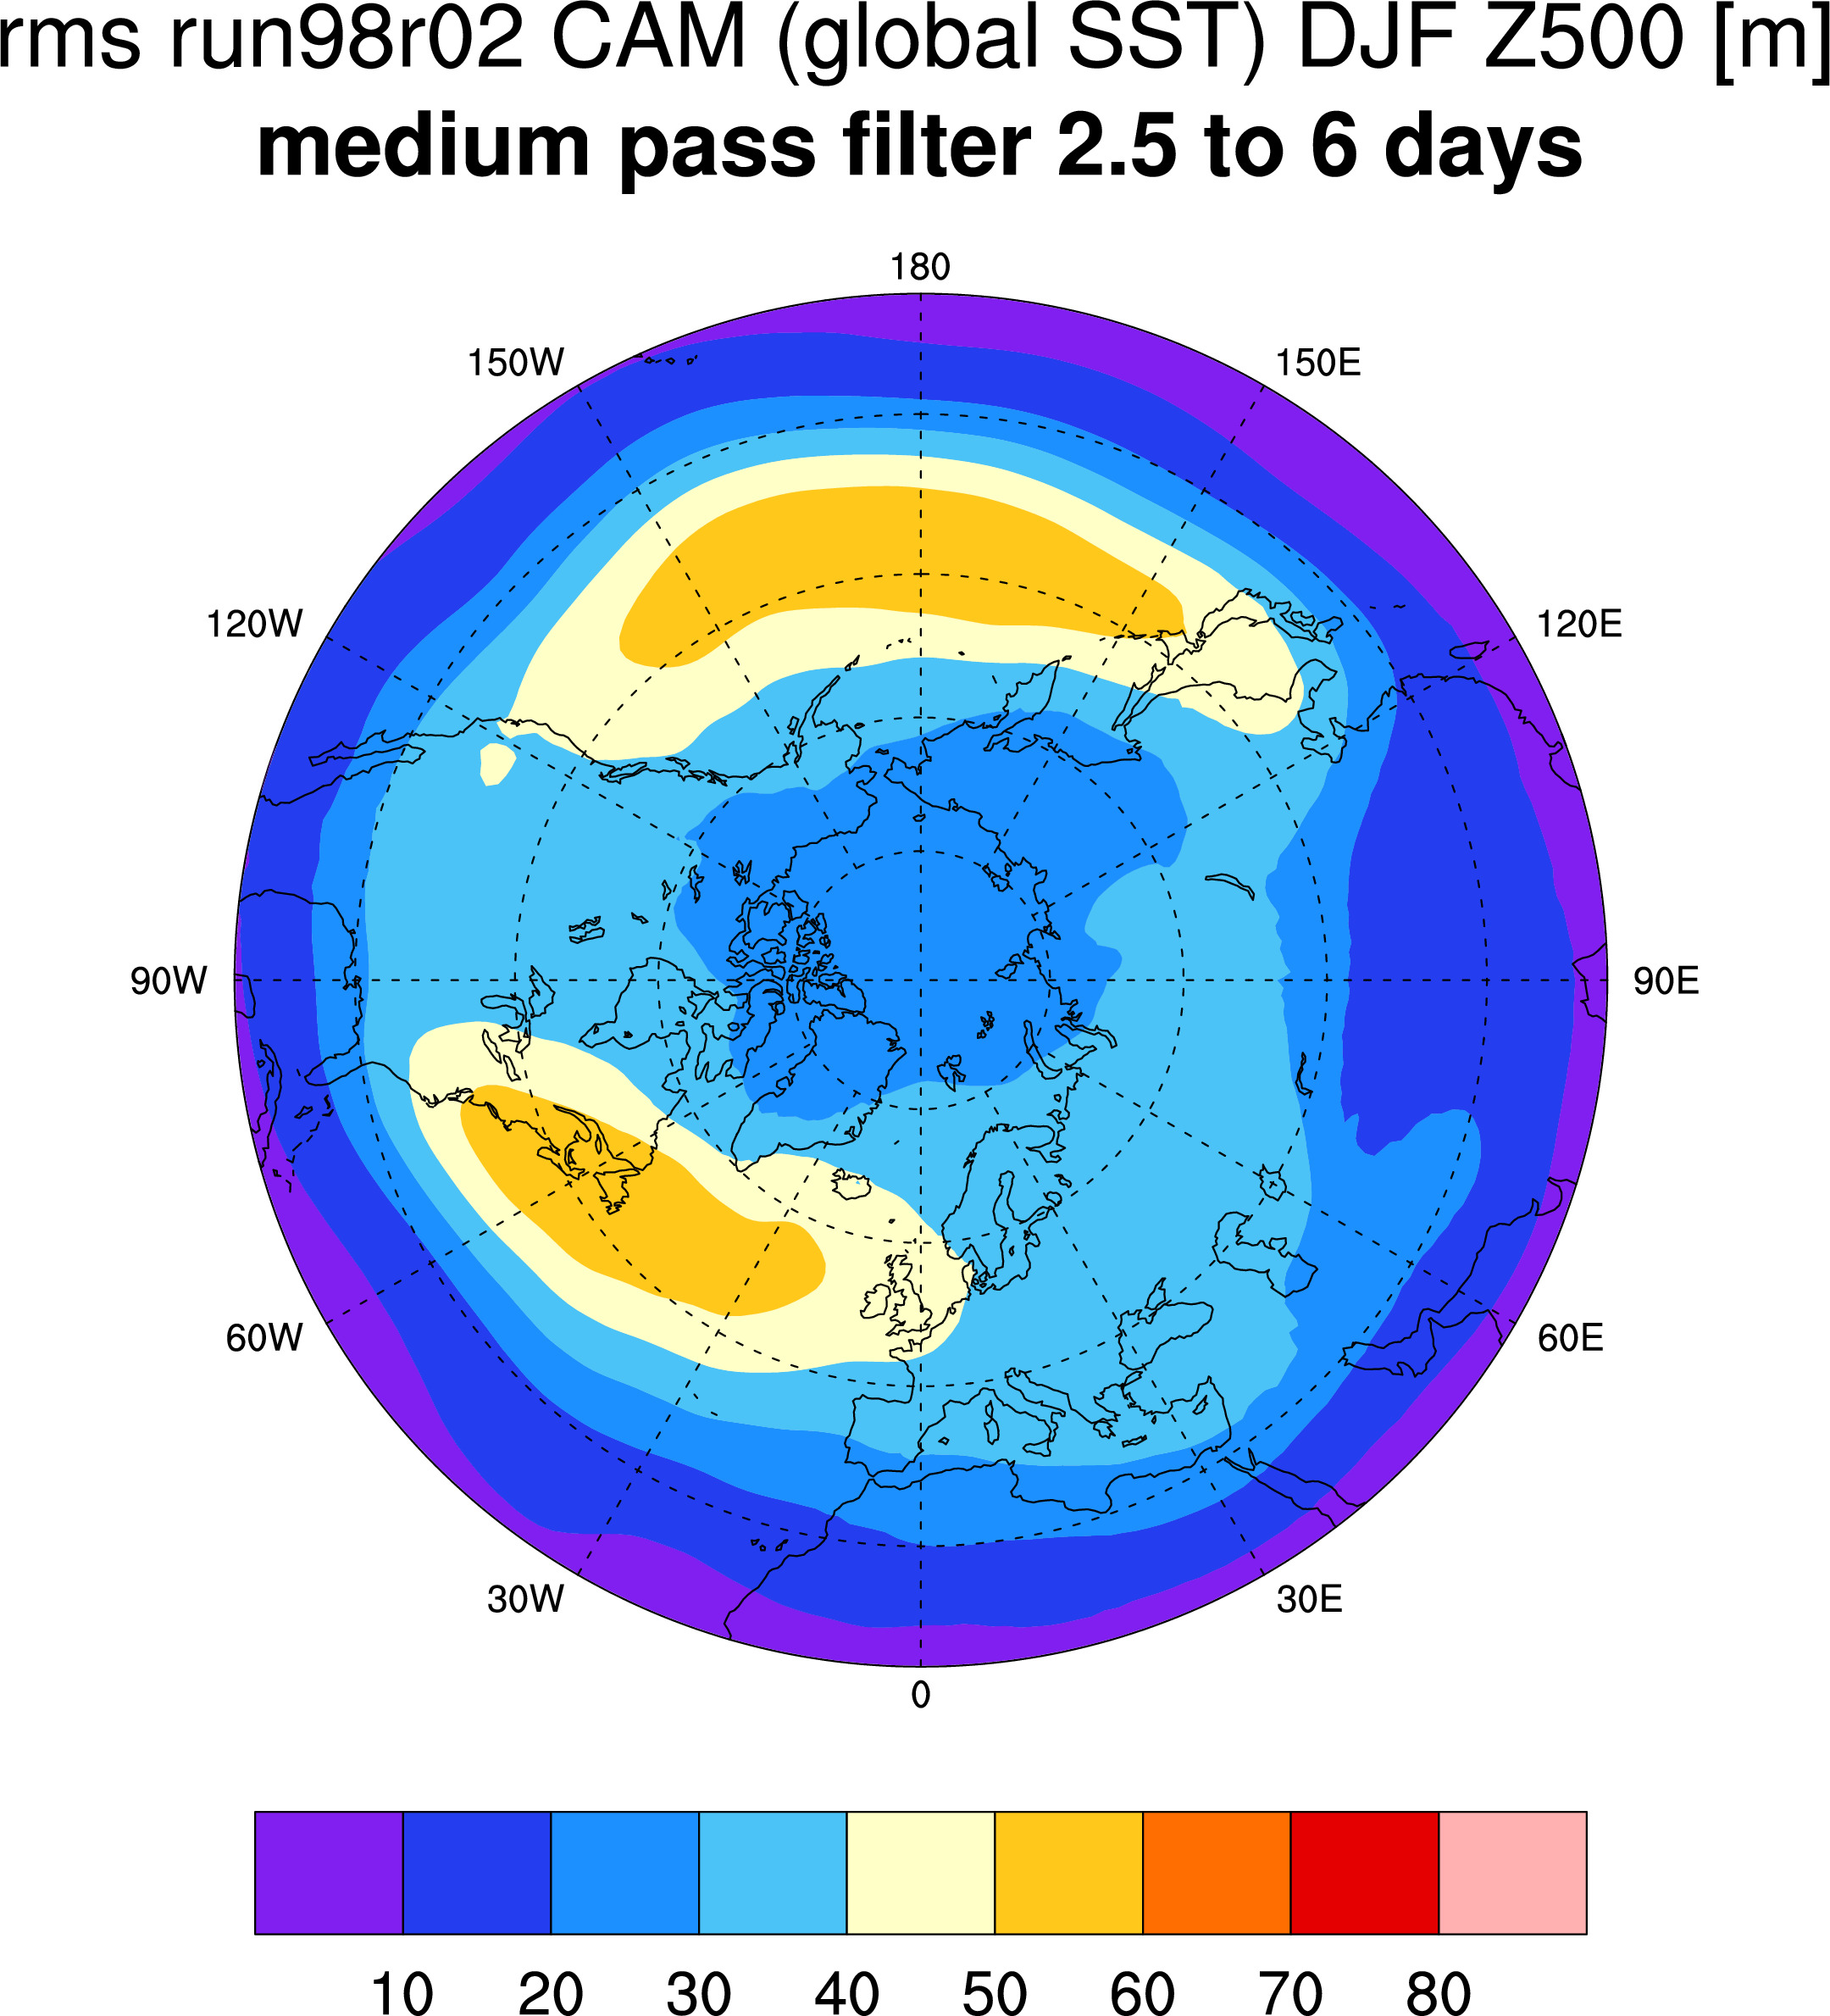
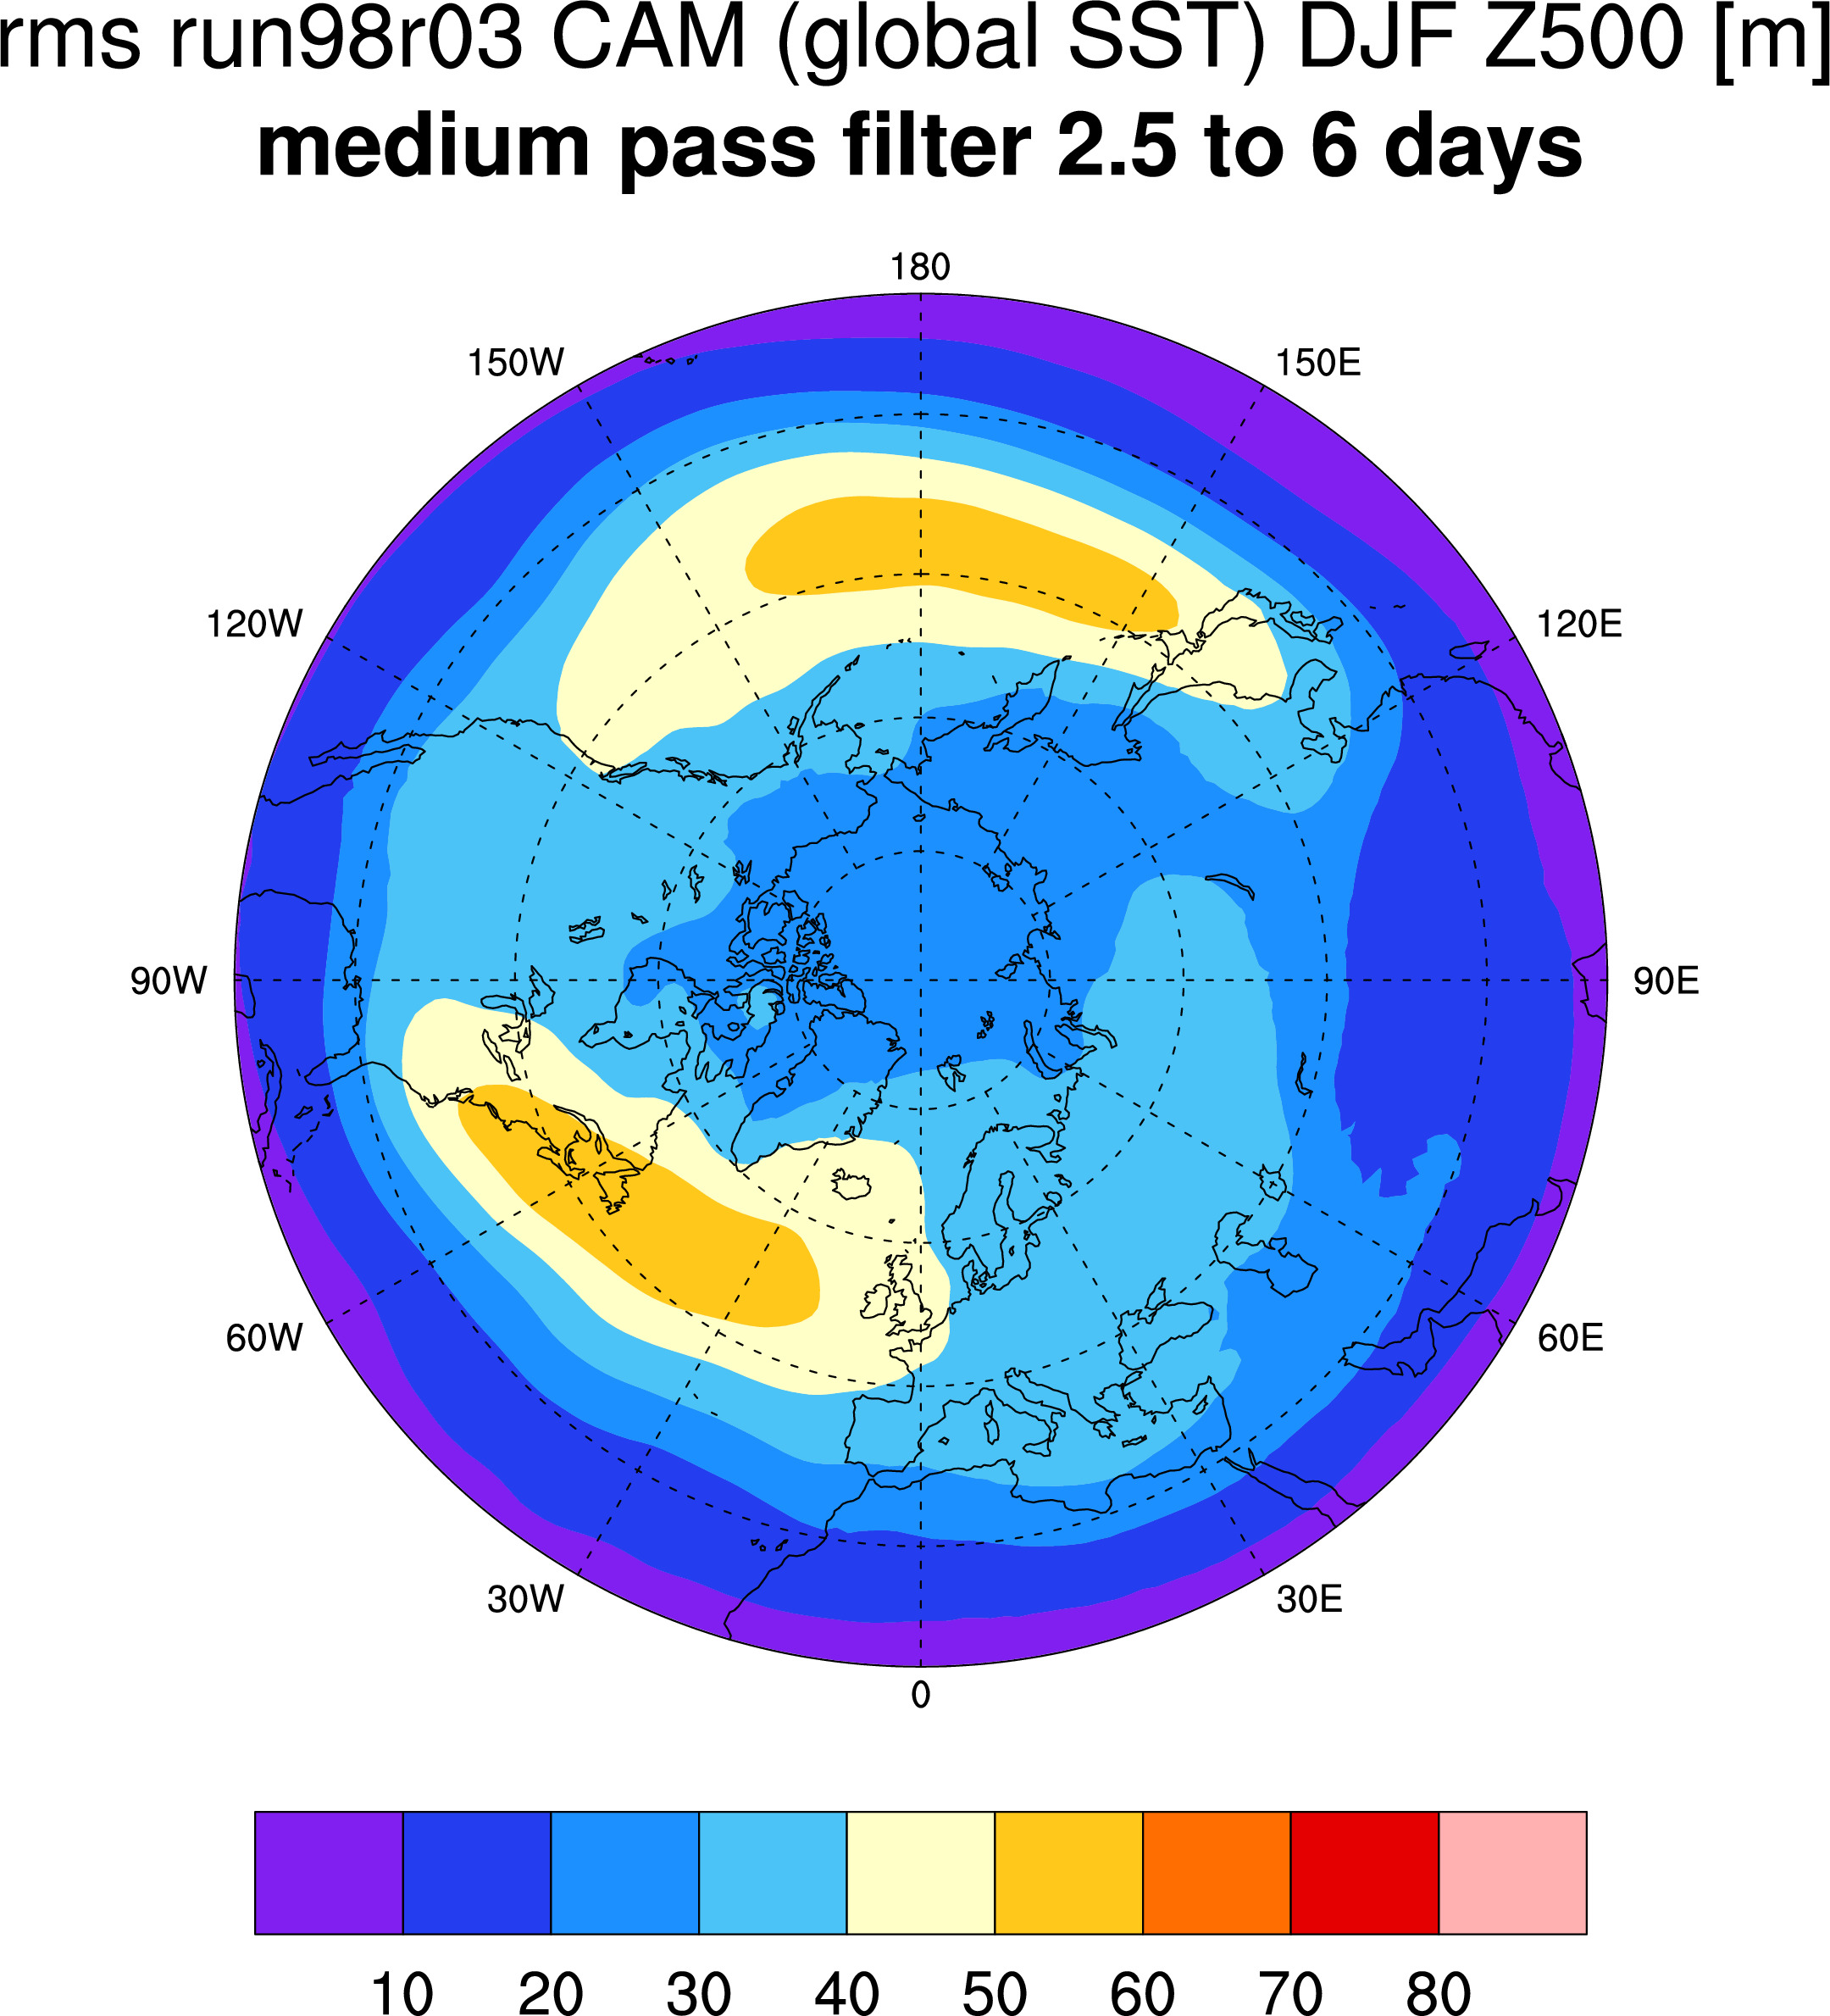
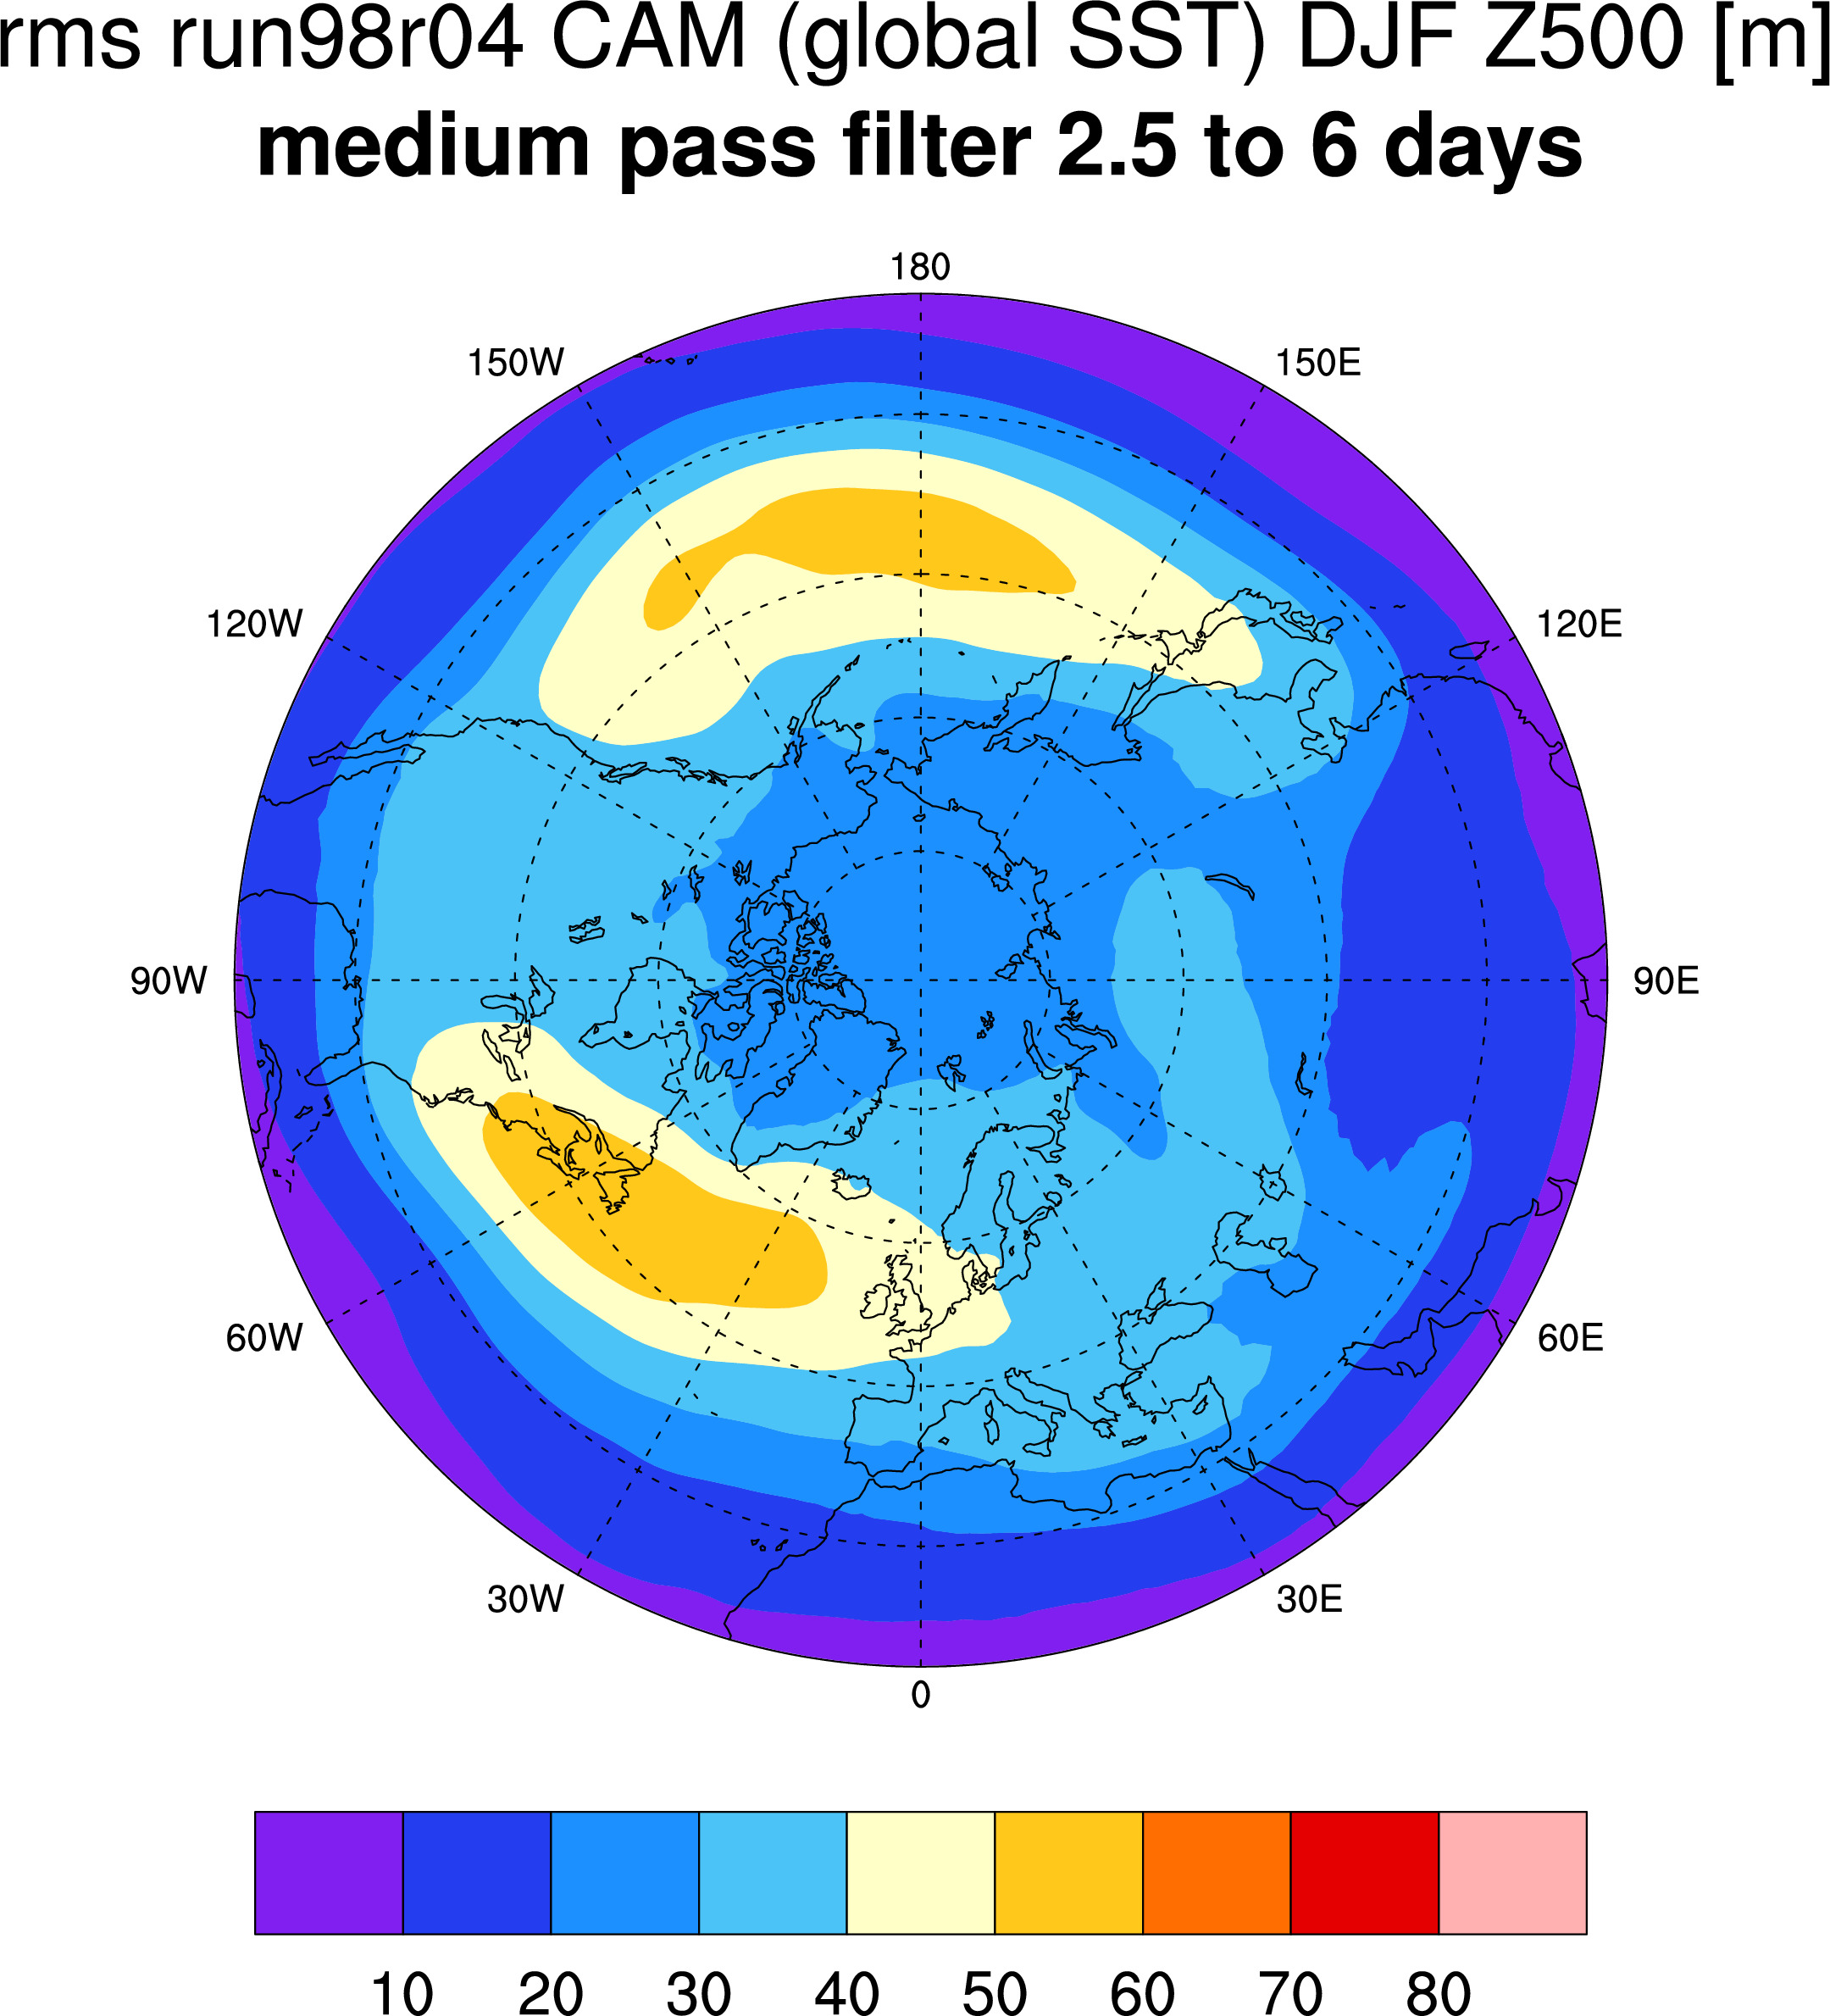
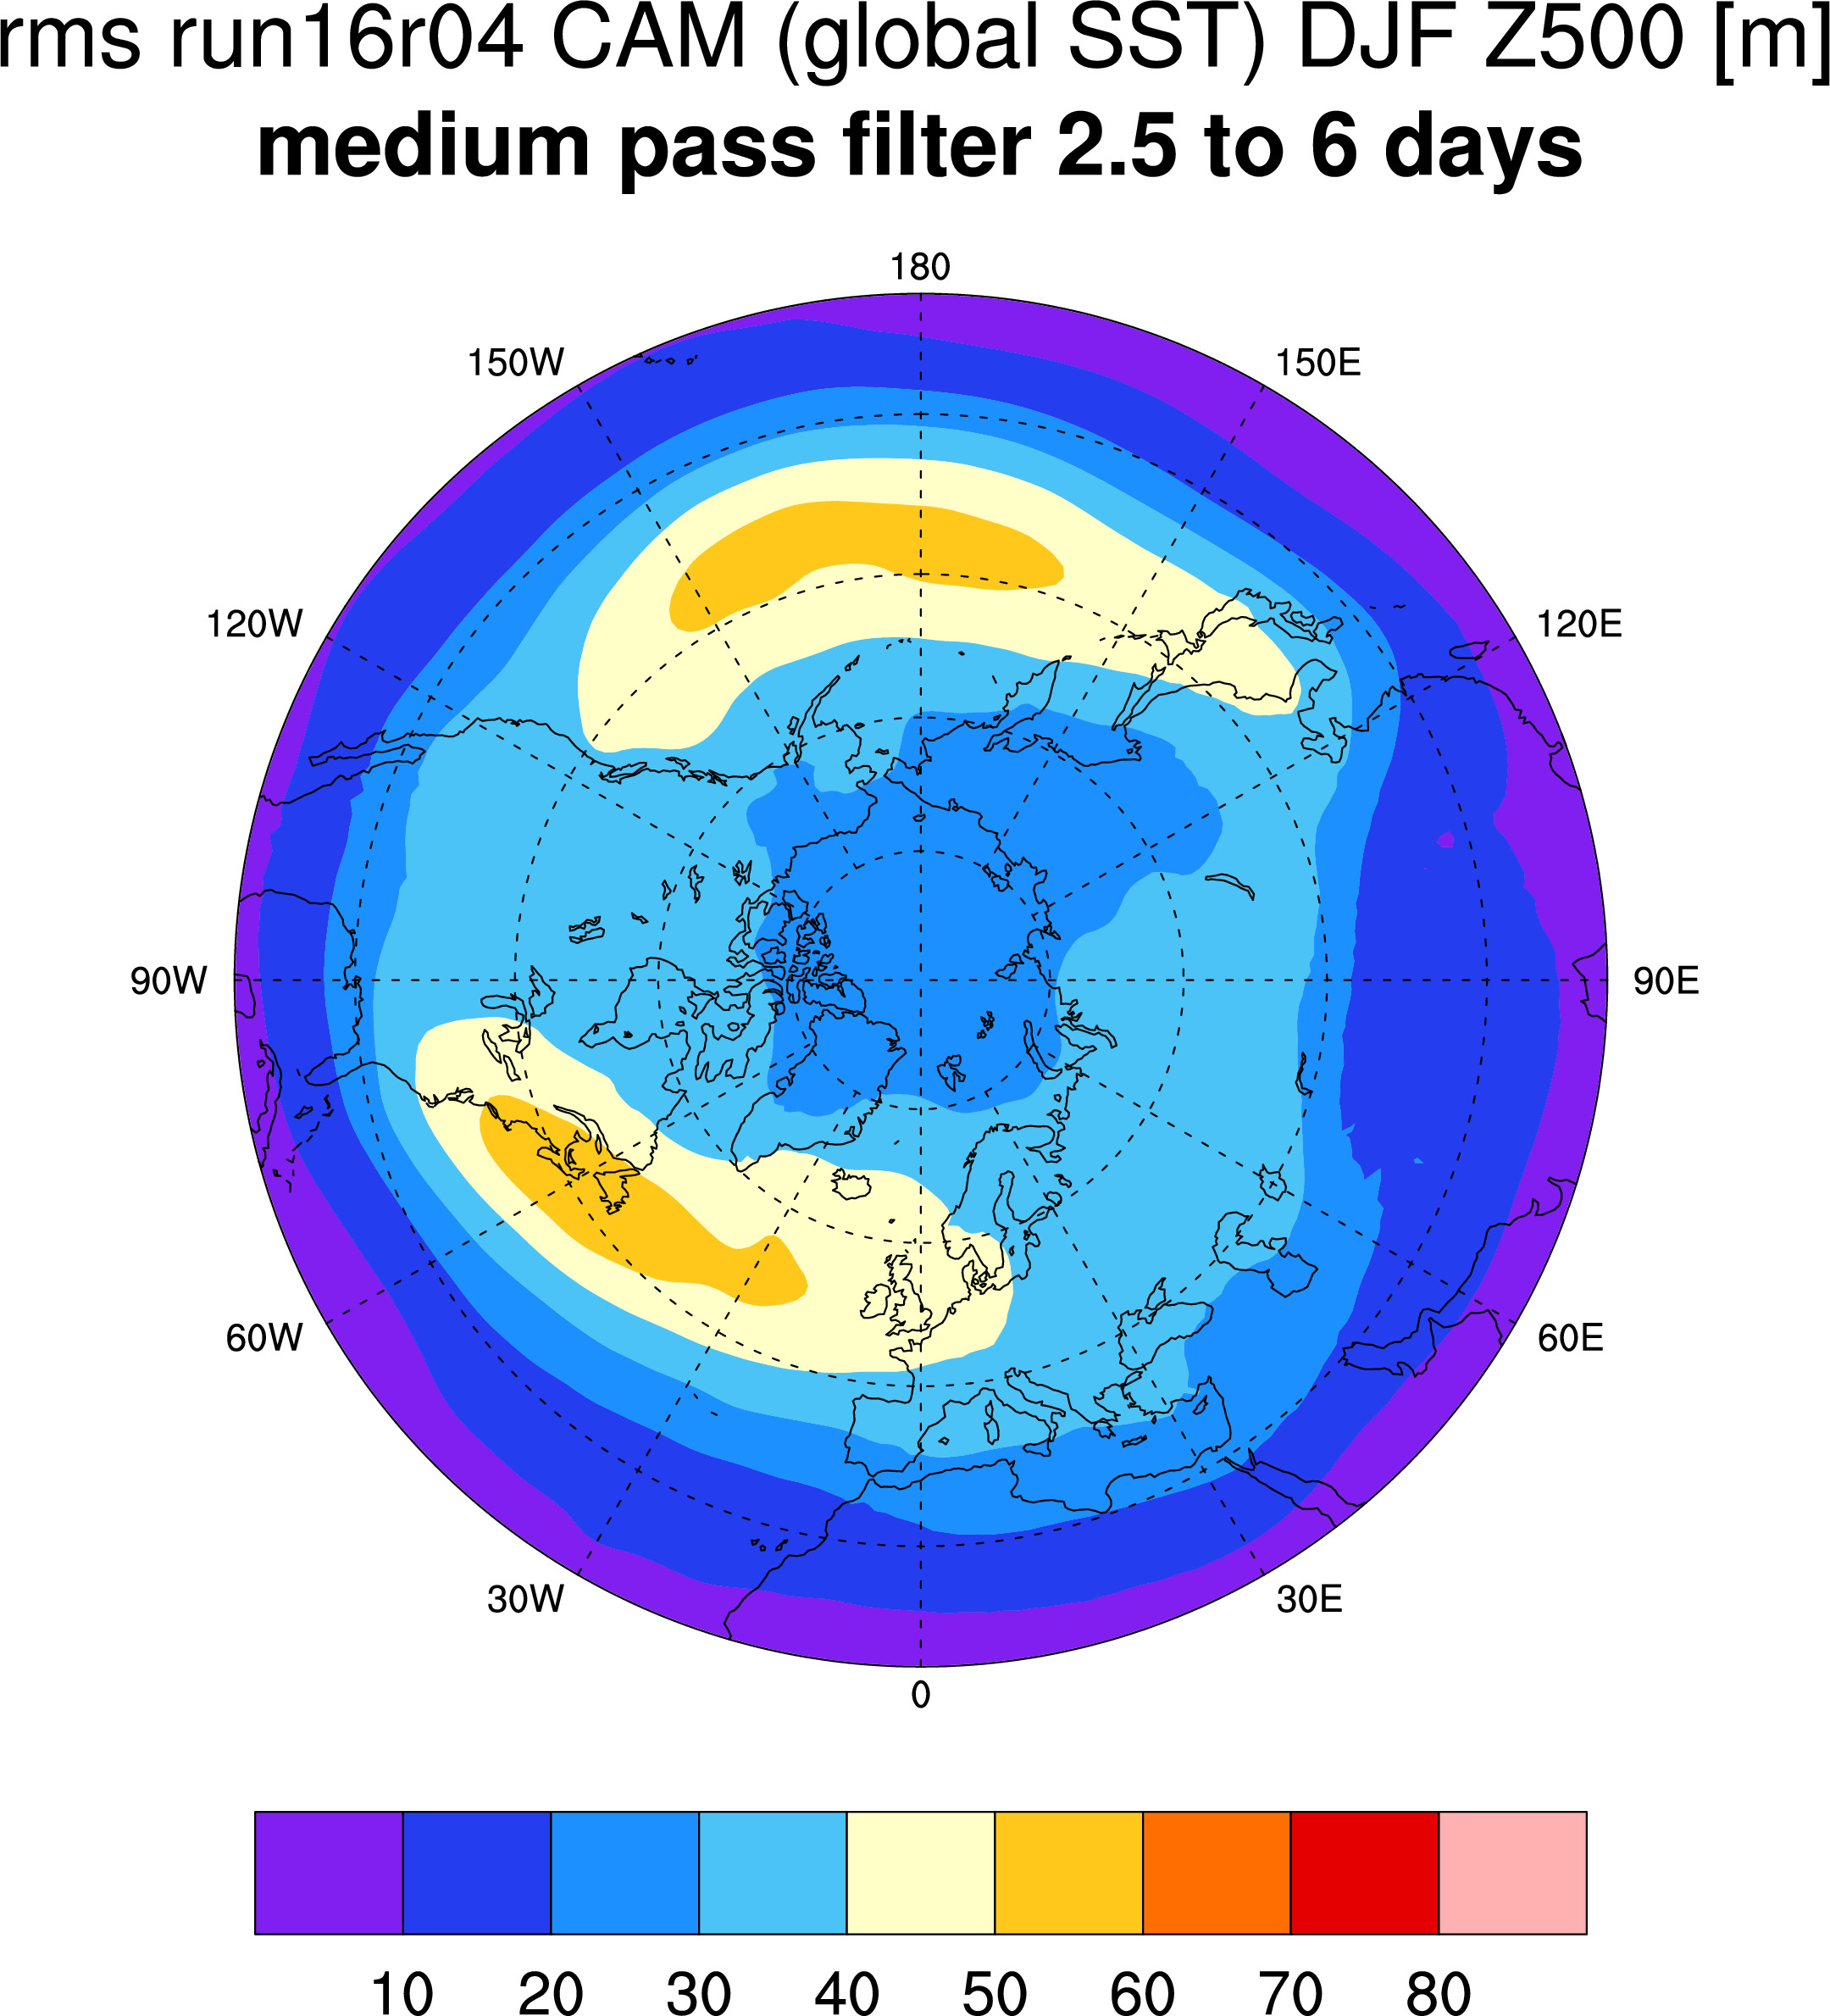
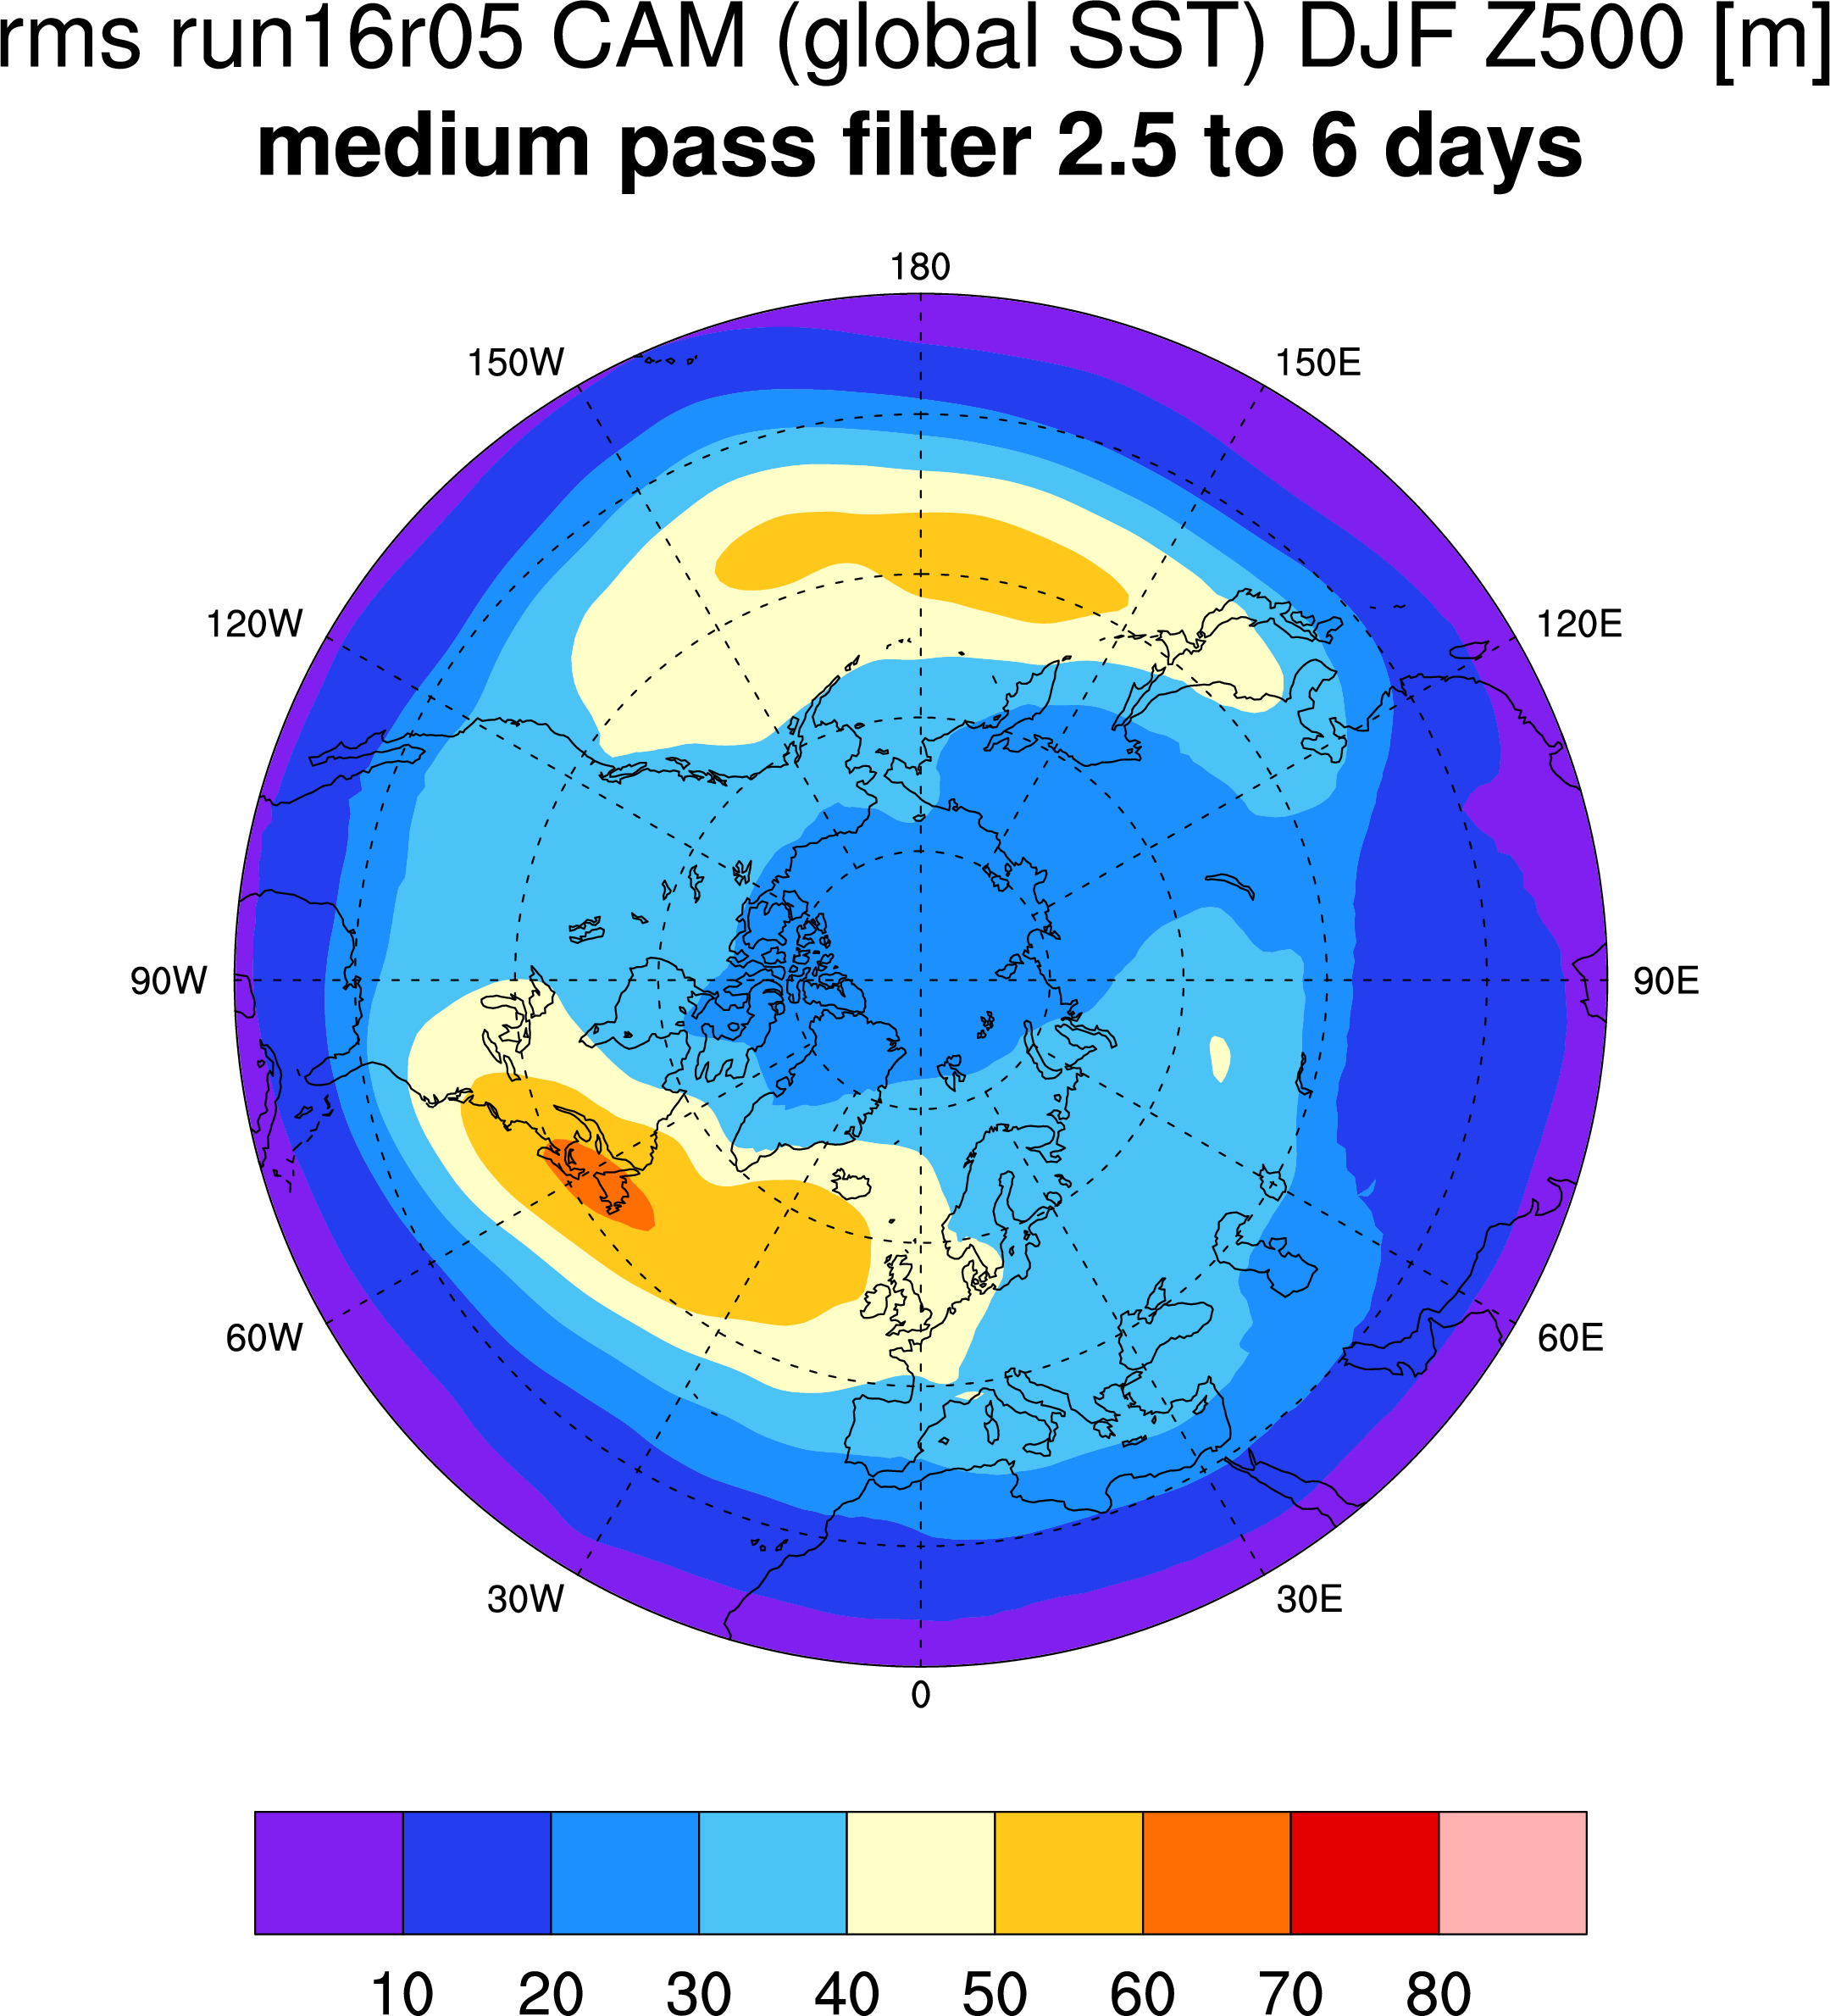
All runs 'Global SST' CAM skipping first 11 months:
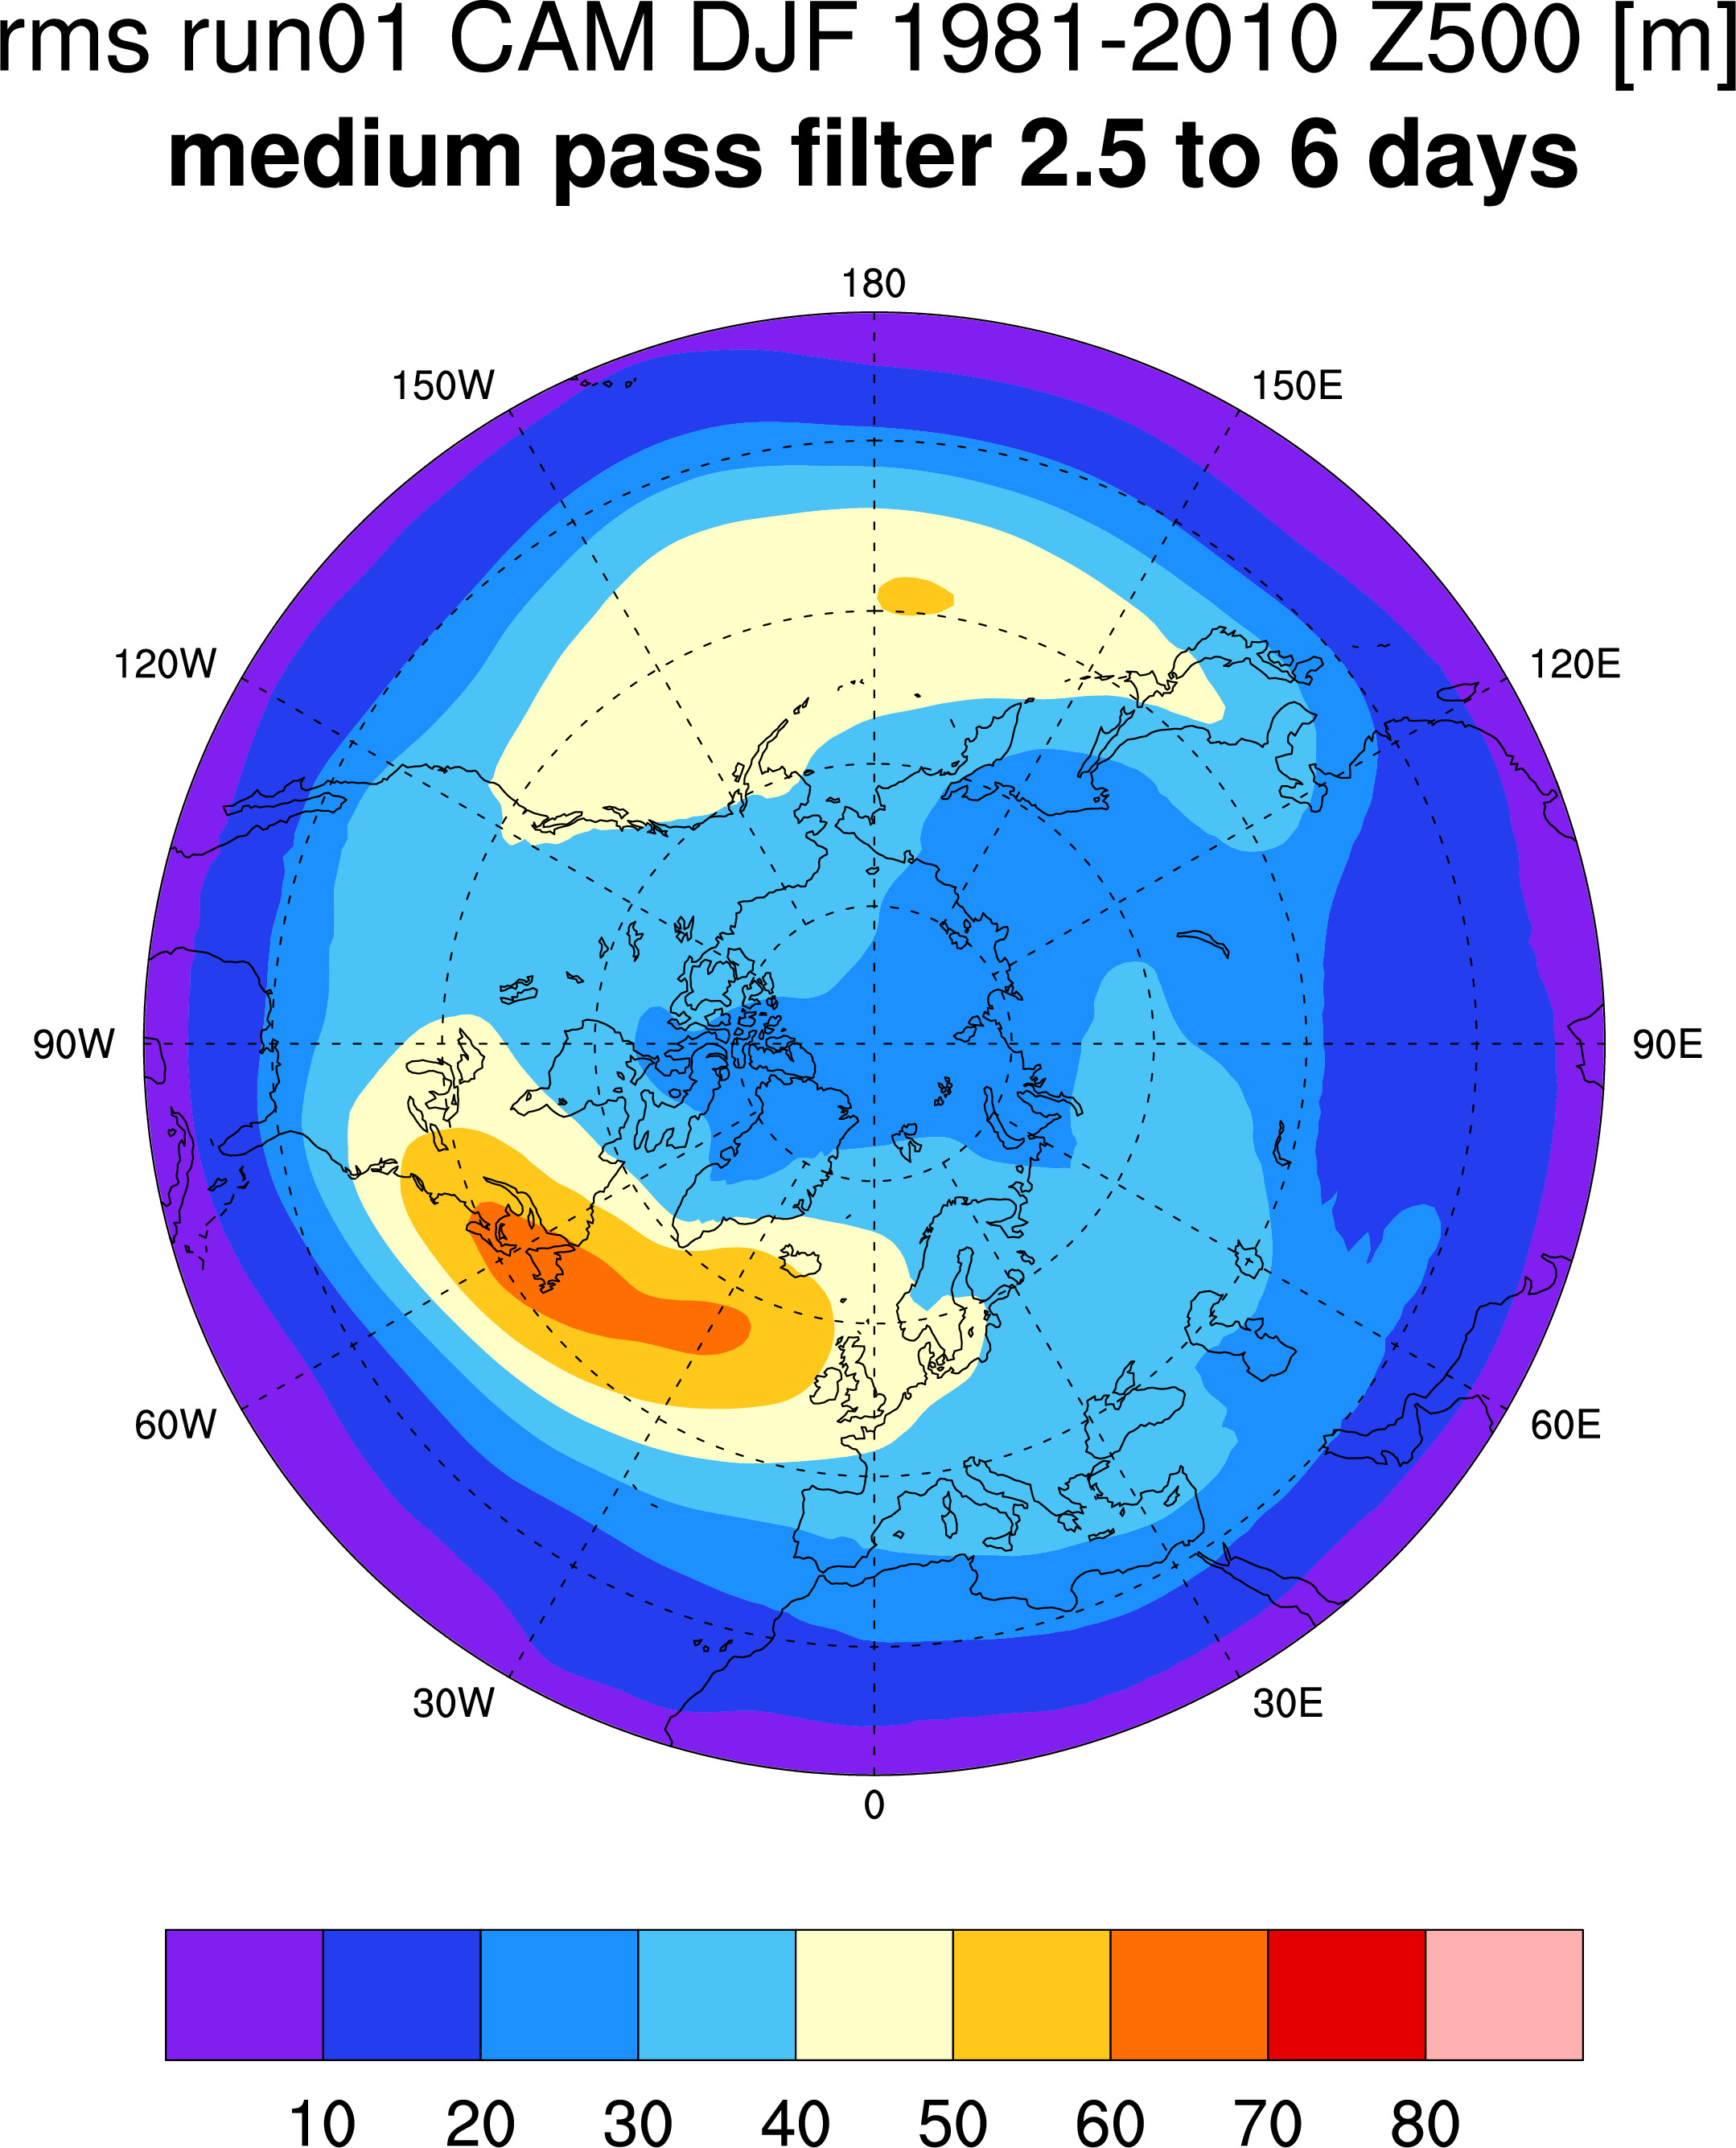
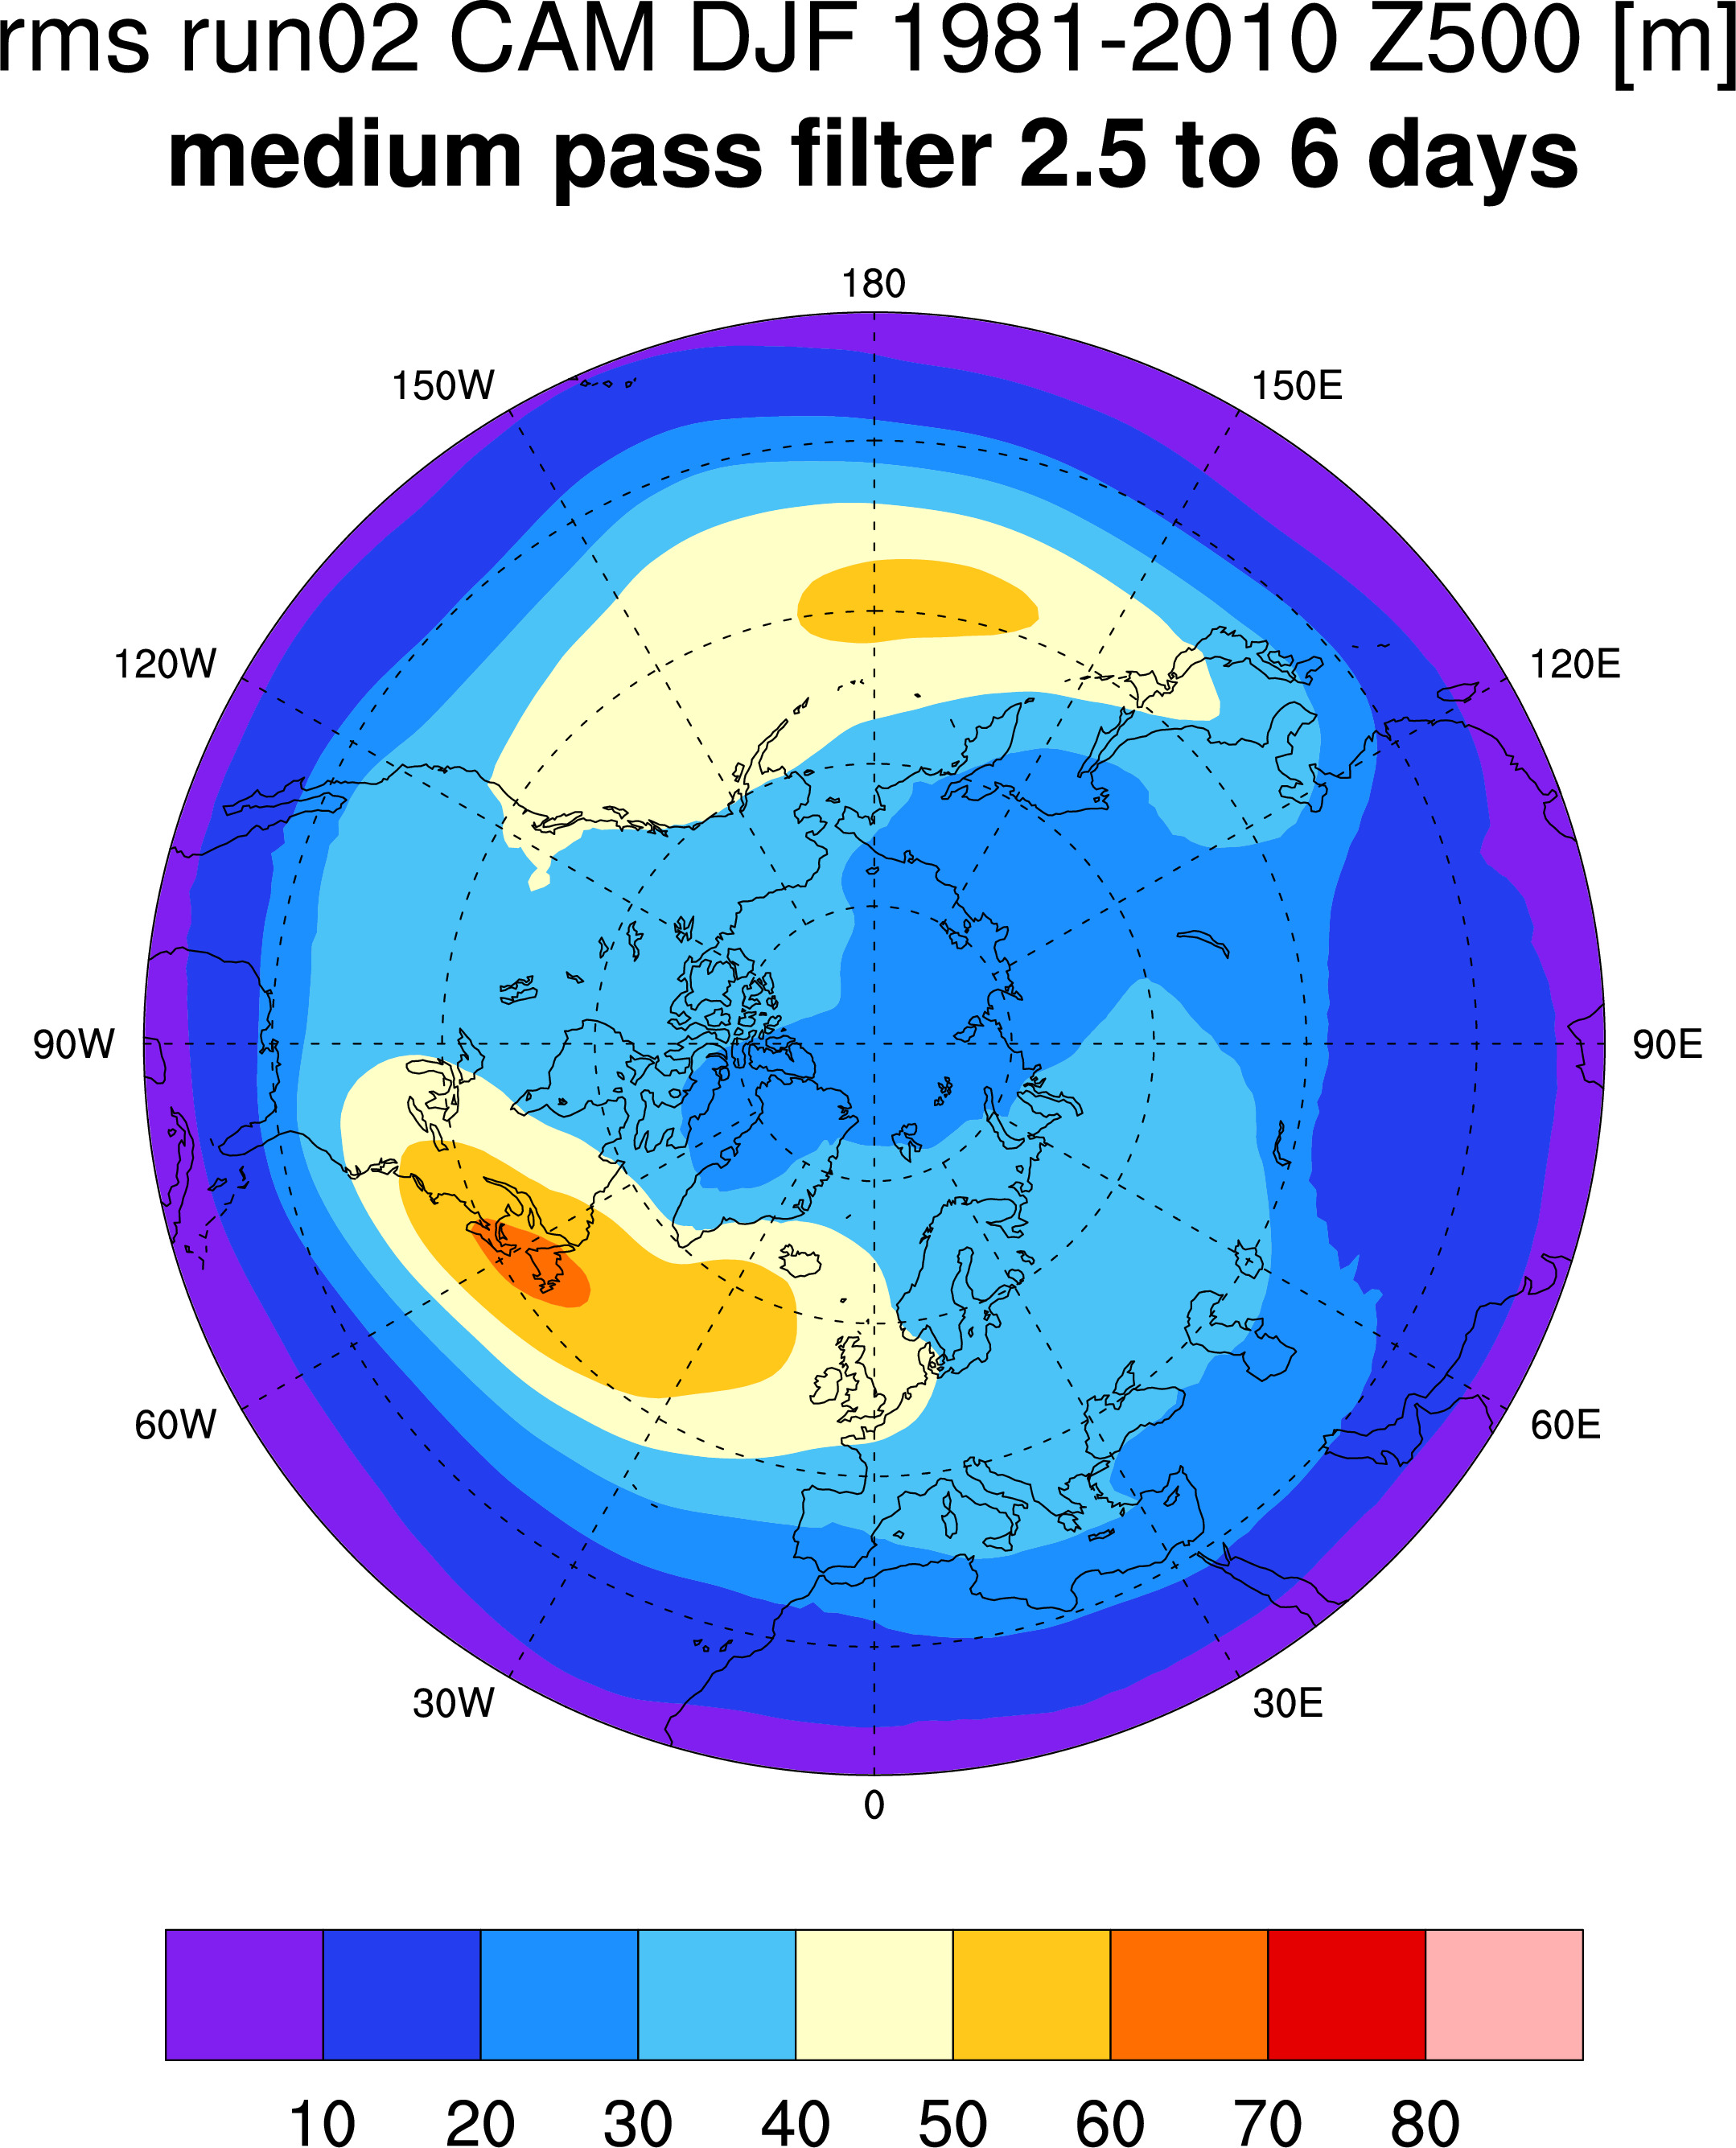
All runs Standard AMIP CAM

-------------------------------------------------------------------
AMIP individual years
DJF mean precipitation: