PSL Experimental Ramp Tool and Metric
Background
Renewable energy sources are the way of the future, and researchers at ESRL have been working to provide better weather forecasts that may help improve the efficiency of providing wind- and solar-generated power.
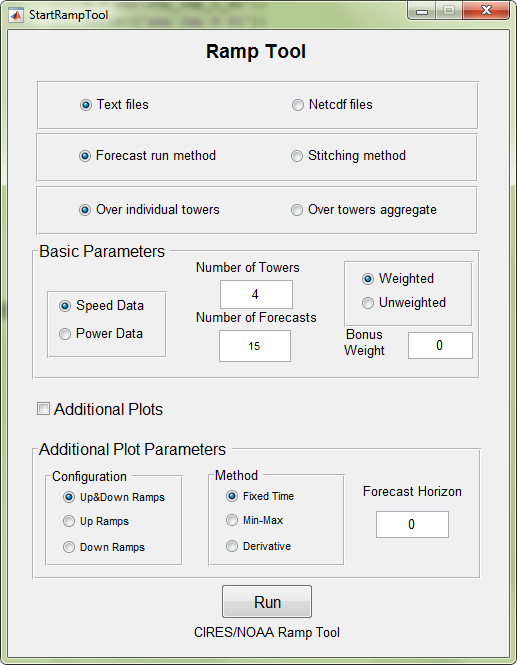
The Ramp Tool and Metric (RT&M) was developed at the Physical Sciences Laboratory in collaboration with the Department of Energy and private sector forecasting companies. It was motivated from the recognition that during relatively rare ramp events (large changes of generated wind or solar power that occur over short periods of time), it is more difficult to balance electric load with power production than during inactive periods between ramp events.
A ramp-specific metric is needed because standard metrics that do not give special consideration to ramp events may not adequately represent forecast model skill or model skill improvement. The RT&M will be used by NOAA to evaluate whether future changes being considered for NOAA forecast models, will have a positive impact on forecasting ramp events. It is also made publically available so that other parties can use it to evaluate model skill.
Details
The RT&M has three components:
- A process to identify ramp events in the time series of power. Three different ramp identification methods were applied to see if a consistent best method can be identified.
- A method for matching in time each forecast ramp event with the most appropriate observed ramp event.
- A process through which a skill score of the forecast model is determined. The skill score is calculated from a utility operator’s perspective, incorporates phase and duration errors in time as well as power amplitude errors, and recognizes that up and down ramps can have significantly different impacts on grid operation.
Since no single pair of power and time thresholds defines a ramp, and in fact some utilities may be interested in several different ramp definitions at the same time, the ramp skill metric integrates skill over a range of changes in power over different time windows. To test the RT&M we used the 13 km horizontal resolution NOAA/ESRL Rapid Refresh Numerical Model (RAP) and tall tower anemometer observations that were collected during the Wind Forecast Improvement Project (WFIP). We provide the user with this same dataset so that they can test the RT&M first, and then use it with their data appropriately organized.
 Download Ramp Tool and Metric