4.5 The South American Program
A large dataset of daily rainfall observations over South America culled from sources in several countries has allowed an examination of precipitation patterns on that continent with unprecedented spatial and temporal resolution. A comparison with rainfall estimates from other datasets that employ a combination of satellite and some gauge data has shown that the two estimates generally are within 10% of the rain gauge only estimates at 2.5 degree resolution for climatologies of a season or more. On the other hand, at some locations within the Amazon, estimates of the annual cycle of rainfall from gauge observations and outgoing longwave radiation are several months out of phase.
4.5.1 Seasonal rainfall relation with SST
Interannual variability of seasonal rainfall in the Brazilian Amazon basin has been studied in the context of its relationship to sea surface temperatures in the tropical Pacific and Atlantic oceans. Simultaneous linear correlations reveal strong relationships, but the rainfall patterns are of regional scale.
With a few exceptions, the largest (absolute) correlations between 3-month seasonal rainfall and SST are found during the season of transition between wet and dry or between dry and wet regimes. In a few cases there are large simultaneous correlations entirely within the dry season, but large correlations are never found entirely during the wet season. In the Pacific, large correlations are always confined to the eastern equatorial region, and warm SSTs are always associated with a deficit of rainfall. In the Atlantic, correlations are usually positive, and centered in the near-equatorial southern ocean.
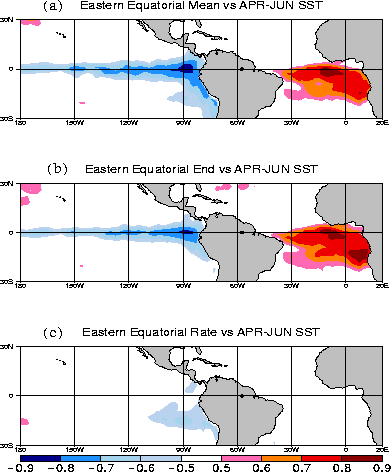
It is hypothesized that during the transition seasons an important contributor to the SST control on seasonal totals is its influence on the timing of the rainy season onset or end. That influence appears to be stronger than the SST influence on the rainy season rain rate. This is illustrated by Fig. 4.21. Figure 4.21a shows the simultaneous correlation between April-June rainfall in the eastern equatorial Amazon and SST. The area chosen for the rainfall average is somewhat unusual in that it exhibits large correlations with both proximate oceans. When the ending date of the same area average of rainfall (with a climatological ending date of 13 June) is correlated with SST (Fig. 4.21b) the pattern that emerges is similar and of the same sign, suggesting that in this region the SST role in the timing of onset plays a role in the SST relationship with seasonal total rainfall. Further, when SST is correlated with the rainy season rate of rainfall (defined as the average daily rainfall from 1 April to the annually varying end of the rainy season), only weak correlations are evident (Fig. 4.21c). Thus it appears that the most important influence of SST in determining calendar season total rainfall is through its influence on the timing of the rainy season, rather than on the intensity of rainfall during the rainy season itself.

A battery of atmospheric general circulation models presently are being tested to determine whether these models produce a realistic onset over monsoonal South America when forced by realistic and evolving SSTs. The observed skill these models exhibit in simulating seasonal anomalies over equatorial South America also is being evaluated to determine the role of model onset in contributing to that skill.
4.5.2 Intraseasonal variations in the SACZ
Mechanisms associated with subseasonal rainfall variability in the South Atlantic convergence zone (SACZ) have been examined. The SACZ arguably is the most important meteorological feature of South America, because it exhibits large variability at many time scales and its mean position passes over the most densely populated Brazilian states of São Paulo and Rio de Janeiro.
Correlations between submonthly (2-30 day band-pass filtered) OLR in the vicinity of the SACZ and 200 mb streamfunction reveal the preferred path of wave energy impinging on the SACZ to be Rossby waves from the midlatitudes of the Southern Hemisphere. Episodes of enhanced convection within the SACZ, indicated by negative OLR anomalies, occur at the leading edge of upper-level troughs propagating into the region. The corresponding pattern at 850 mb reveals that the disturbances are nearly equivalent barotropic west of South America, but tilt westward with height in the region of the SACZ. Negative low-level temperature anomalies lie to the southwest of the convection. The results are consistent with baroclinic development along an associated cold front. It also appears that the SACZ forms when the northwesterly flow associated with a low-level trough is able to tap moisture from the Amazon.
4.5.3 Climatology of extreme precipitation events
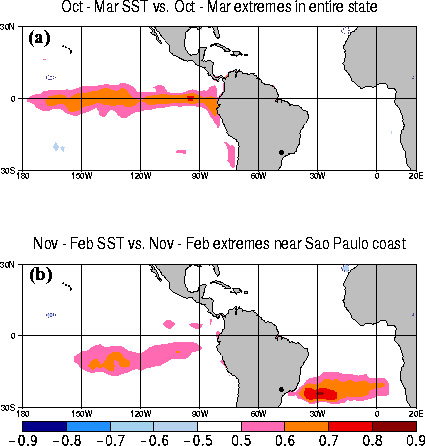
The climatology and interannual variability of heavy, or `extreme', precipitation events in the state of São Paulo, Brazil were studied. An extreme event is counted at each station when daily rainfall exceeds a certain percent of its seasonal or annual mean. It is found that they occur mainly from November-March (the season during which the SACZ is most active) and that there is a distinct interannual variation in their number. The count of extreme events is not well correlated with total seasonal precipitation. The relationship between extreme events and activity in the SACZ is therefore not obvious. From October-March, the interannual count of extreme events in the entire state is correlated positively with sea surface temperature anomalies in the equatorial Pacific from near the dateline to the west coast of South America (Fig. 4.22a). The interannual count at stations near the Atlantic coast from November-February is correlated positively with SST anomalies in the Atlantic Ocean near the latitude of São Paulo (Fig. 4.22b). In both cases the relationship between SST and mean precipitation is weak. The associations are confirmed with composites and rank correlations.
