6.2 Value added analyses and visualization tools
6.2.1 Climate Observations and Reanalysis
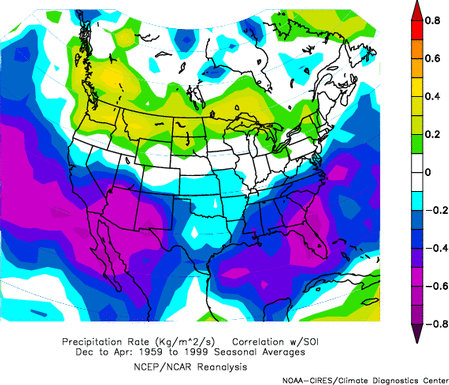
An important component of climate services is the development of visualization and analysis tools for the immediate synthesis and diagnosis of large operational climate datasets in near real time. CDC maintains a large and diverse collection of climate datasets in support of in-house research, which are also publicly available. Providing value-added access to high-quality, long-term records of observations is increasingly important to meaningfully evaluate climate system change, and to place such change in the context of natural variability. Outside users can download these data for further analysis; however, the amount of data available is often extremely large and not readily accessible without significant effort. CDC thus also provides a number of visualization and analysis tools that allow users to "test" out the data before going through the process of downloading. CDC's in-house scientific expertise provides insights into the types of questions climate researchers are investigating and the preferred WWW display and analysis tools to address these questions. A diverse number of visualization and analysis tools are available through the CDC Interactive Plotting and Analysis Pages (http://psl.noaa.gov/PublicData/web_tools.html). A subset of these visualization and analysis tools plot data, or averages of data, over different times, allow users to specify the region, variable, type of plot (mean, anomaly, long-term mean, or time-by-latitude plots for example) and various other parameters. User-specified averaging over different intervals can be applied to study the average effects of phenomena such as ENSO (e.g., Fig. 6.6), or to examine possible decadal climate changes. On shorter time scales, users can systematically analyze synoptic variability or examine the current weather/climate in greater detail by using a choice of the monthly mean compositing page, the daily compositing page, the US climate division dataset plotting page, the time section plotting page, the operational data plotting page, and the chi-corrected heating atlas. CDC also provides more sophisticated analysis tools such as a monthly correlation page, the US climate division correlation page, and a wavelet analysis page.

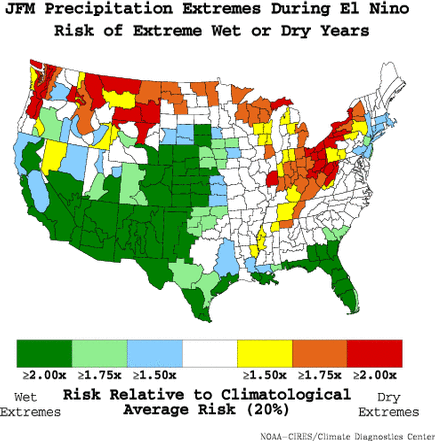
The correlation/regression analysis tools allow users to test (linear) relationships among the data and a suite of common indices of atmospheric or ocean variability (e.g., ENSO, PNA, or the AO), or a user-specified time series. The wavelet analysis tool allows users to examine the variability of some common atmospheric or user-provided time series. CDC also provides a WWW-based experimental climate services product that estimates the relative risks of extreme precipitation and temperature anomalies in relation to ENSO (e.g., the regional increased risk of extreme warm/cold or dry/wet, Fig. 6.7, http://psl.noaa.gov/Climaterisks/).

All of these WWW tools are used extensively for research, for educational purposes by teachers, and to assess current or possible future weather and climate conditions by both public and private sector decision makers (e.g., energy companies, water managers). In addition, the plots and analyses generated by these pages have been presented at a wide variety of scientific meetings and have been incorporated in books and journal articles by both CDC and non-CDC scientists. The ideas generated by users able to quickly explore the data have made the CDC WWW-based visualization and analysis tools extremely useful and have saved much time and energy for researchers both outside and inside CDC.
6.2.2 Climate Model Output
CDC has begun assembling large ensembles of climate model simulations of the 20th Century, many of which have been performed at other institutions, and making these data accessible to the research community for evaluation and intercomparisons. As part of this effort, CDC has developed a parallel set of WWW-based visualization and analysis tools to intercompare GCM simulations of climate, explore causal mechanisms for change in long-term observed records, and to establish the fidelity of model simulated climate. These WWW-based tools allow considerable user interaction and manipulation of the data using CDC computing platforms. GFDL R30 resolution model climate simulations are currently available and may be intercompared with re-analysis climatologies (http://psl.noaa.gov/gfdl). The GFDL data will be augmented to include AMIP-style simulations for 1950-1999, and runs using idealized SSTs. Also available on-line is the NCAR CCM3 AMIP climate model simulations spanning 1950-1999 with globally prescribed and tropically prescribed SSTs (http://psl.noaa.gov/Composites/CCM). In addition to generating composites, the user can perform correlation analyses of the CCM3 response to various SST forcings (e.g., Fig. 5.1) at http://psl.noaa.gov/Composites/CCM/Correlation/. Anticipated changes in computing infrastructure will permit an increasingly larger volume of climate model data to be made available on-line, and it is likely that CDC will increasingly host model data to support climate assessment research.