Get a copy of the data used in the plot
Get a CSV copy of the data used in the plot in an Excel and GIS usable format. [shapefile link information]
Get postscript version of plot
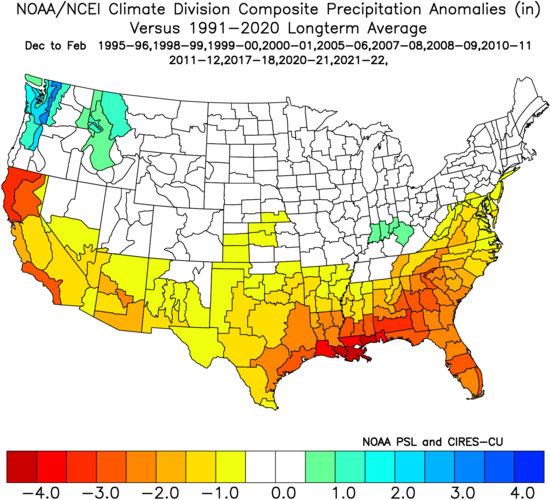
Options Selected for plot
Variable: PrecipitationType: Average Anomaly
Season: Dec to Feb
Number year(s) in composite: 12
Years in composite: 1995 1998 1999 2000 2005 2007 2008 2010 2011 2017 2020 2021
Climatology base period: 1991-2020
Contour Interval: default
White for central values: yes
Date submitted: 7/02/2024 at 23:25