Ongoing Scientific Assessment of the 2010 Western Russia Heatwave
Draft - Last Update: 3 November 2011
Disclaimer: This draft is an evolving research assessment and not a final report. Comments are welcome. For more information, contact Dr. Martin Hoerling (martin.hoerling@noaa.gov)
End-Point Sensitivity of Trend Analysis
A recent study of global surface temperature trends emphasized the importance of choice in start and end points in estimating trends ( Liebmann et al. 2010). Even for global means, trends can change dramatically by adding or subtracting years from the time series. In this additional analysis of the western Russia heat wave, we apply the methods described in Liebmann et al. in order to demonstrate the sensitivity of trend estimates to data length selection.
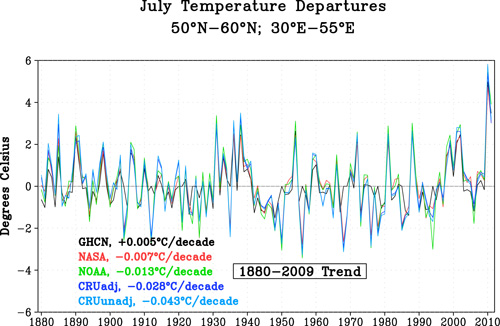
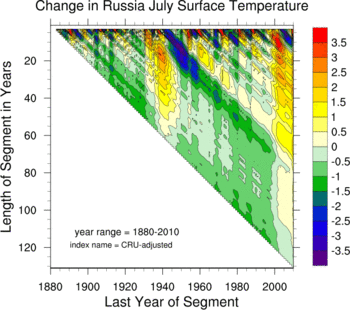
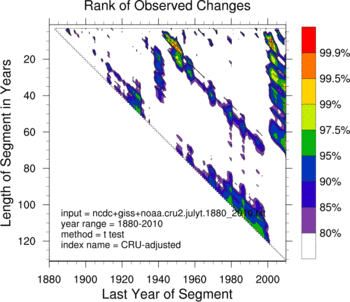
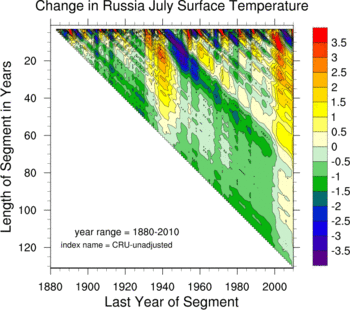
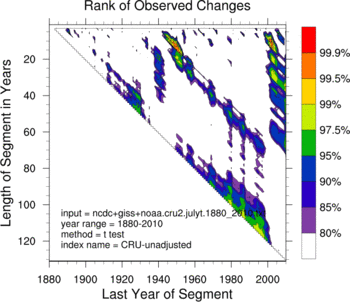
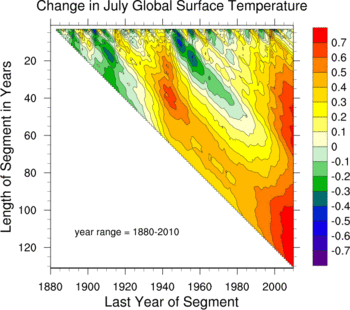
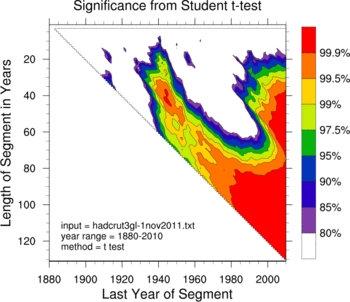
In Dole et al. (2011), the authors calculate the trend from the full 130-yr record (1880-2009) over a 10° by 25° box in Western Russia. They found no significant warming trend in July surface temperatures over this period. Figure 2 shows the 1880-2011 time series based on 5 different gridded data sets. Also indicated is the 130-yr trend values (°/decade) spanning 1880-2009, the majority of which are negative. However, the time series also reveal significant annual and decadal variability in Western Russia July surface temperatures, implying that trends computed from sub-samples of the full data set could materially differ. To assess the sensitivity of western Russian surface temperature trends to beginning and end dates, Figure 3 presents diagrams of time varying trends in July temperatures for the period 1880-2010. Here we illustrate the end-point sensitivity using the two CRU analyses, but results are similar for the other data sets as would be expected from the very strong agreemnt among the time series in Figure 2. In such plots, every possible trend longer than two years and its associated linear temperature change are calculated for the available record. Statistical significances of the trends, based on a two-sided t-test, are shown in the right side diagrams. For further details, see Liebmann, et al 2010.
This method provides the opportunity to test the following questions:
- How robust are western Russian trends to end-point selection?
- Is the recent period of warmth unique in western Russia?
- How important are data adjustments to the trend calculations?
- Are the western Russian trends representative of the global mean trends, and in particular are there indications for enhanced warming over this part of the continental interior?
The analysis uses the Hadley-CRUv3 that have been adjusted for inhomogeneities (top panels), and raw unadjusted (middle panels). Also, for comparison of the western Russian trend, the analysis has been repeated for globally averaged July surface temperature (bottom panels). We note, from our prior assessment, that these results are largely insensitive to the choice of other gridded data sets, or the use of area-averaged station data.
Regarding the posed questions above, we find the following:
- The sign and magnitudes of trends calculated during July over western Russia vary greatly with the choice of start and end dates. This is consistent with the large variability of July temperature from year -to-year, and from decade-to-decade as demonstrated in Dole et al. For calculated trends having their ending year as 2010 (which thus includes the Russian heat wave event in the trend diagnosis), there is no statistically significant warming for all trend durations greater than about 80-years.
- Statistically significant warming trends (for end years at 2010) occur over trends of duration 20 to 60 years. This largely reflects the fact that the first decade of the 21st century was a very warm decade. However, the magnitude and statistical significance of these warming trends are comparable to warming trends ending around 1940.
- The calculated regional average trends over western Russia are very similar when derived from either adjusted or unadjusted data.
- The comparison of western Russian trends with those for global temperatures reveals fundamentally different behaviors. For the longest period of 130-yr, the western Russian trend is slightly negative, compared to the strong and highly significant warming of global mean temperatures. Over this time period, the western Russian region can be seen as a relative "warming hole" compared to rising July global-mean temperatures. There is considerably less noise in the global mean temperatures, with trends longer than 56 years being highly statistically significant. In contrast, owing to much stronger variability, the western Russian trends of about 0.5°C for trends ending in 2010 and having duration greater than about 60 yrs are not statistically significant.
