Ongoing Scientific Assessment of the 2010 Western Russia Heatwave
Draft - Last Update: 3 November 2011
Disclaimer: This draft is an evolving research assessment and not a final report. Comments are welcome. For more information, contact Dr. Martin Hoerling (martin.hoerling@noaa.gov)
Assessing Trends at the Station Level
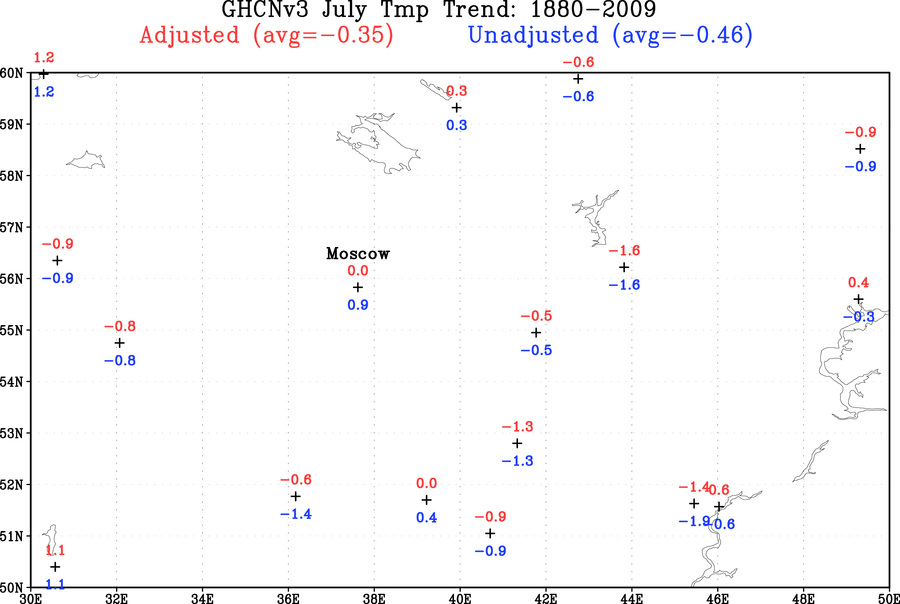
Figure. 1 The 1880-2009 linear trends in July surface air temperature
for 17 stations within a domain comprising western Russia (50�N-60�N,
30�E-50�E). For each station, two values of the total temperature change
over the 130-yr period are plotted. The lower number (blue) is based
on the raw, unadjusted data record. The upper number (red) is based on
the quality controlled data that involves removing data inhomogeneities.
The data set is the Global Historical Climatology Network monthly data
(GHCN Version3;
see http://www.ncdc.noaa.gov/ghcnm/v3.php).
The location of Moscow is noted. Also plotted is the 17-station averaged
trends for unadjusted and adjusted data sets. There are 29 stations available
in total, of which 17 were retained that have at least 90yrs of available
coverage. (Click image to expand)
|
In Dole et al. (2011), four gridded observational data sets were employed to determine the time series of western Russia surface temperatures. The data sets all spanned 1880-2009, and involved so-called homogenization in which adjustments were made to the monthly temperatures for some stations (for instance, due to relocation and/or urbanization influences). To reduce the possible effects of any adjustments, time series were computed for an area of western Russia bounded by 50�N-60�N, and 30�E-50�E, roughly representing the region of peak intensity of the 2010 heat wave. For this domain, no significant long term trend in western Russia July surface temperatures was detected. This assessment used the entire data set over the 130 year period. The question has subsequently been raised whether this assessment was appreciably affected by the manner in which the original temperatures were adjusted, as well as whether the use of Moscow alone would lead to a materially different view of how western Russia surface temperatures have been changing (e.g., Rahmstorf and Coumou, 2011).
In May 2011, the National Climate Data Center released a new version of the Global Historical Climatology Network (GHCN) dataset. This included the application of new enhanced methods for removing data inhomogeneities. Furthermore, NCDC has provided the monthly time series of surface temperatures from both the raw and adjusted data (see http://www.ncdc.noaa.gov/ghcnm/v3.php)
We have thus had the opportunity to test three questions with this new data.
- How significant is the impact of data adjustments on the estimated warming for western Russia during 1880-2009?
- Did the results of Dole et al. underestimate the long-term warming trend?
- Is a time series of Moscow surface temperature representative of a broader geographical region that experienced the heat wave of 2010?
The NCDC data indicates that 29 stations are available within the larger spatial domain over western Russia studied in Dole et al. Of these, we have used 17 that have at least a minimum of 90 years of available data during the 1880-2009 period.
For each of these, we have calculated the linear trend in July surface temperatures for the 1880-2009 period, using both the raw (unadjusted) and the adjusted (homogenized) data. The results are shown in Figure 1. The station location for Moscow is highlighted.
Regarding the questions above, we find the following:
- The impact of adjustments can be appreciable at individual stations. For instance, the raw data trend at Moscow is +0.9°C/130 yrs, but this becomes zero when using the homogenized data. However, for the average of 17 stations, there is no material difference in trends calculated from the raw versus the adjusted data, and both yield a slight cooling trend for July conditions during 1880-2009.
- The use of station data, whether adjusted or raw, yields a western Russia July surface temperature trend that is slightly cooling, consistent with results derived from 4 different gridded analyses, as summarized in the Supplemental Material of Dole et al.
- The raw time series for Moscow July surface temperatures shows warming of +0.9°C/130ys, a value that is not representative of the trend in surface temperatures averaged over the stations within the western Russian region. Figure 1 shows that the selection of any single station to define western Russia trends can be problematic, not just in magnitude but even in the sign of the temperature change.