Ongoing Scientific Assessment of the 2010 Western Russia Heatwave
Figure 1: Map of temperature anomalies averaged over the period January to June 2010. Anomalies are calculated relative to the period 1971-2000.
Source: National Climatic Data Center/NESDIS/NOAA
|
Figure 2: Map of temperature anomalies for June 2010. Anomalies are calculated relative to the period 1971-2000.
Source: National Climatic Data Center/NESDIS/NOAA
|
Preliminary Draft Report - Last Updated: 3 September 2010
From the freezer to the stove, so have gone surface temperatures over Russia in 2010. Only recently, the concerns were centered on the hardship inflicted by the previous frigid winter. The current heat wave is therefore all the more remarkable coming on the heals of anomalous cold.
Globally averaged temperatures averaged during the first 6 months of 2010 were the warmest on record (since 1880) according to analyses produced by NOAA and NASA (Figure 1). Not all areas were warm, however, and in particular most of Russia did not contribute to the record global conditions during the first half of the year.
By early summer, the anomalous temperature patterns began to change compared to prior months (Figure 2). Warmth—which was in many ways much welcomed initially—emerged over central Russia during June. These incipient warm conditions did not exert negative impacts at the time in so far as the climatological June temperatures of western Russia are about 5°C cooler than their late July peaks. It only became apparent in hindsight that the June warmth was but a mere hint of things to come.
Unusual heat commenced almost in synchronicity with the turn of the calander to July, as if orchestrated by an overzealous conductor responding to nature's seasonal cycle. The inflicted areas spanned a wide reach of western Russia, Belorussia, the Ukraine, and the Baltic nations. Through its dogged persistence, the heat wave built in intensity as summer progressed to its normally hottest weeks. By late July and early August, numerous cities witnessed a crescendo of record breaking daily readings near 40ºC, more than +10ºC warmer than what would normally have been experienced at this warmest time of year.
|
Click on a numbered paddle to display the time series for a station. Source: Climate Prediction Center NCEP/NOAA
Click here to download Google Earth KML file.
|
Figure 3: Map of temperature anomalies for July 2010. Anomalies are calculated relative to the period 1971-2000.
Source: National Climatic Data Center/NESDIS/NOAA.
|
Western Russia had become an epicenter of anomalously high temperatures in July 2010, though many other land temperatures for July were above normal including eastern North America, Europe, and China (Figure 3).
Preliminary readings suggest that Moscow's July 2010 temperatures were the warmest month during the prior 130 years. Statistical measures quantify the extreme character of this heat wave, with a greater than 4 standardized anomaly for Moscow during July. In other words, July's warmth was four times greater than the expected variability of July historical fluctuations about their long-term climatology. The heat wave continued into mid-August, breaking around 19 August according to Russian meteorologists ( http://www.msnbc.msn.com/id/38559055).
Heat stress and elevated pollution levels led to human mortality across western Russia. High temperatures, and a general absence of rainfall over western Russia led to drought conditions and widespread crop loss. Wild fires raged in the region, both over grasslands and forests, further degrading air quality.
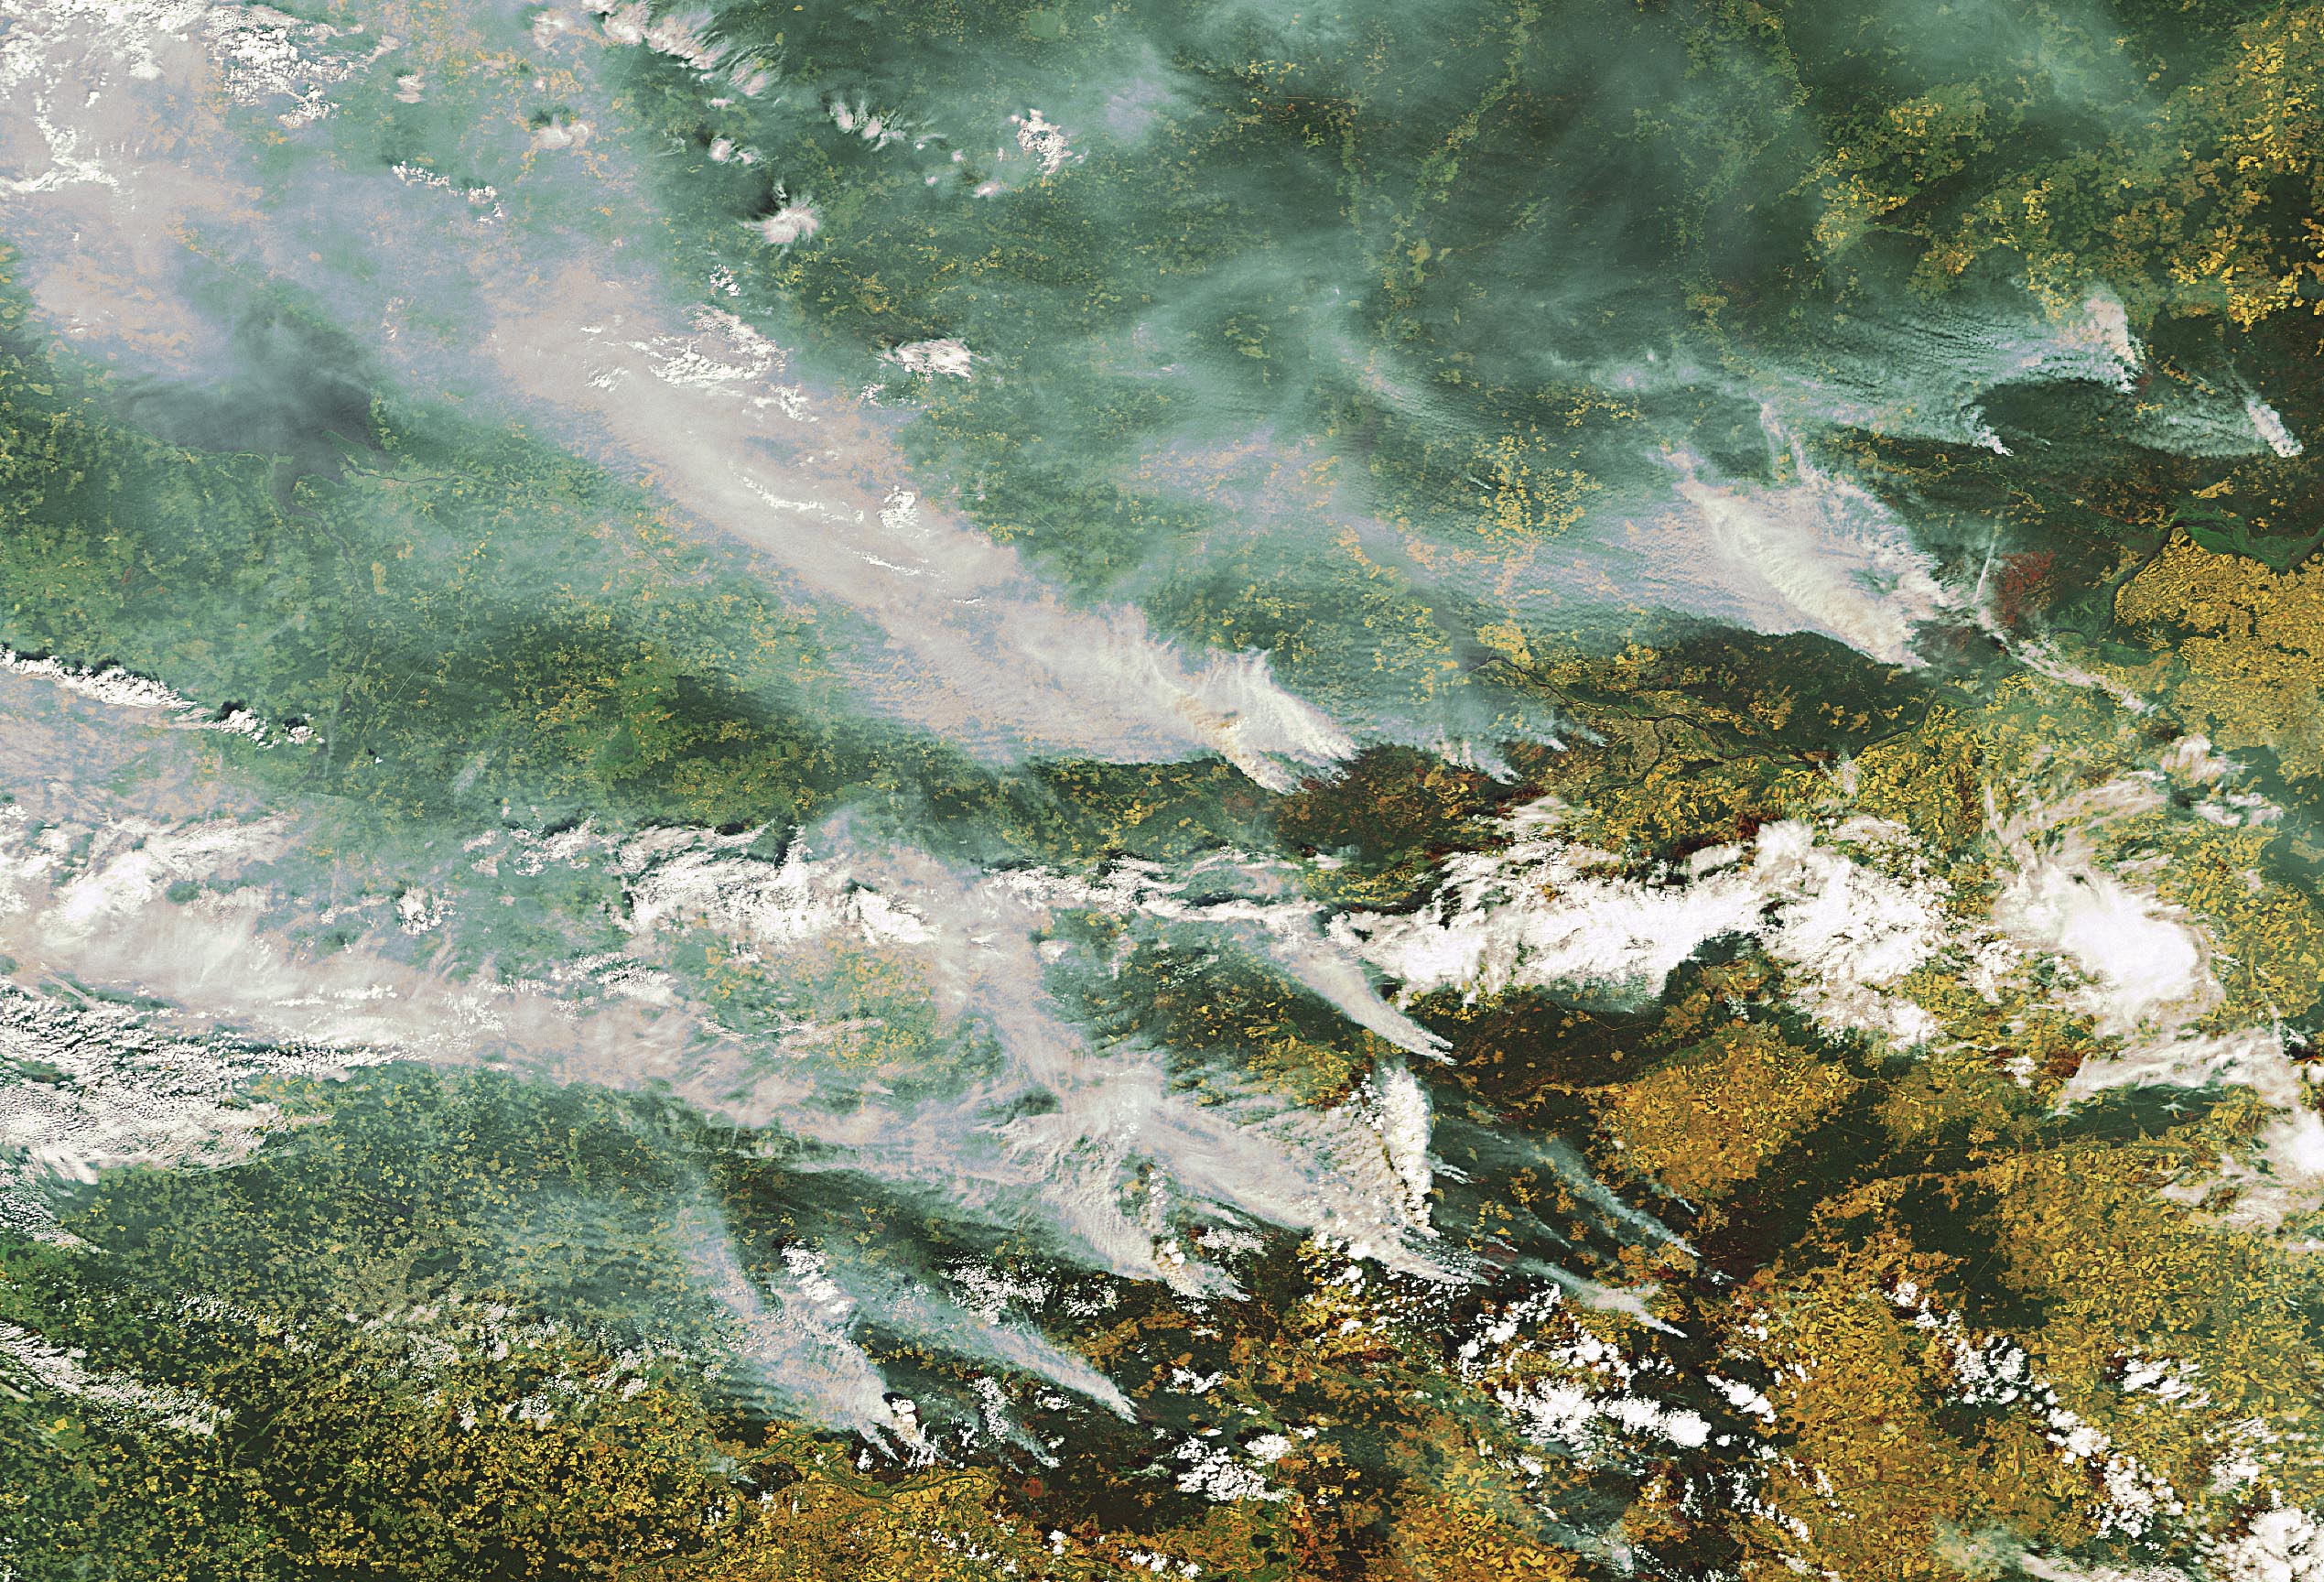
This Envisat image covering the area east of Moscow shows several large
smoke plumes originating from burning peat fields and forest fires.
Source: ESA
|
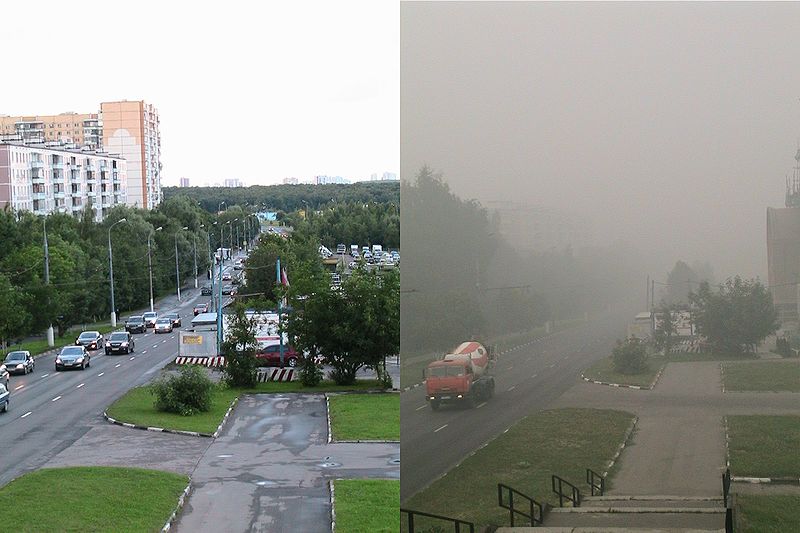
(Left) Street in Moscow, June 17th, 2010, 20:22 PM. (Right) August 7th, 2010, 17:05 PM Source:
Wikipedia 2010 Russian wildfires
|
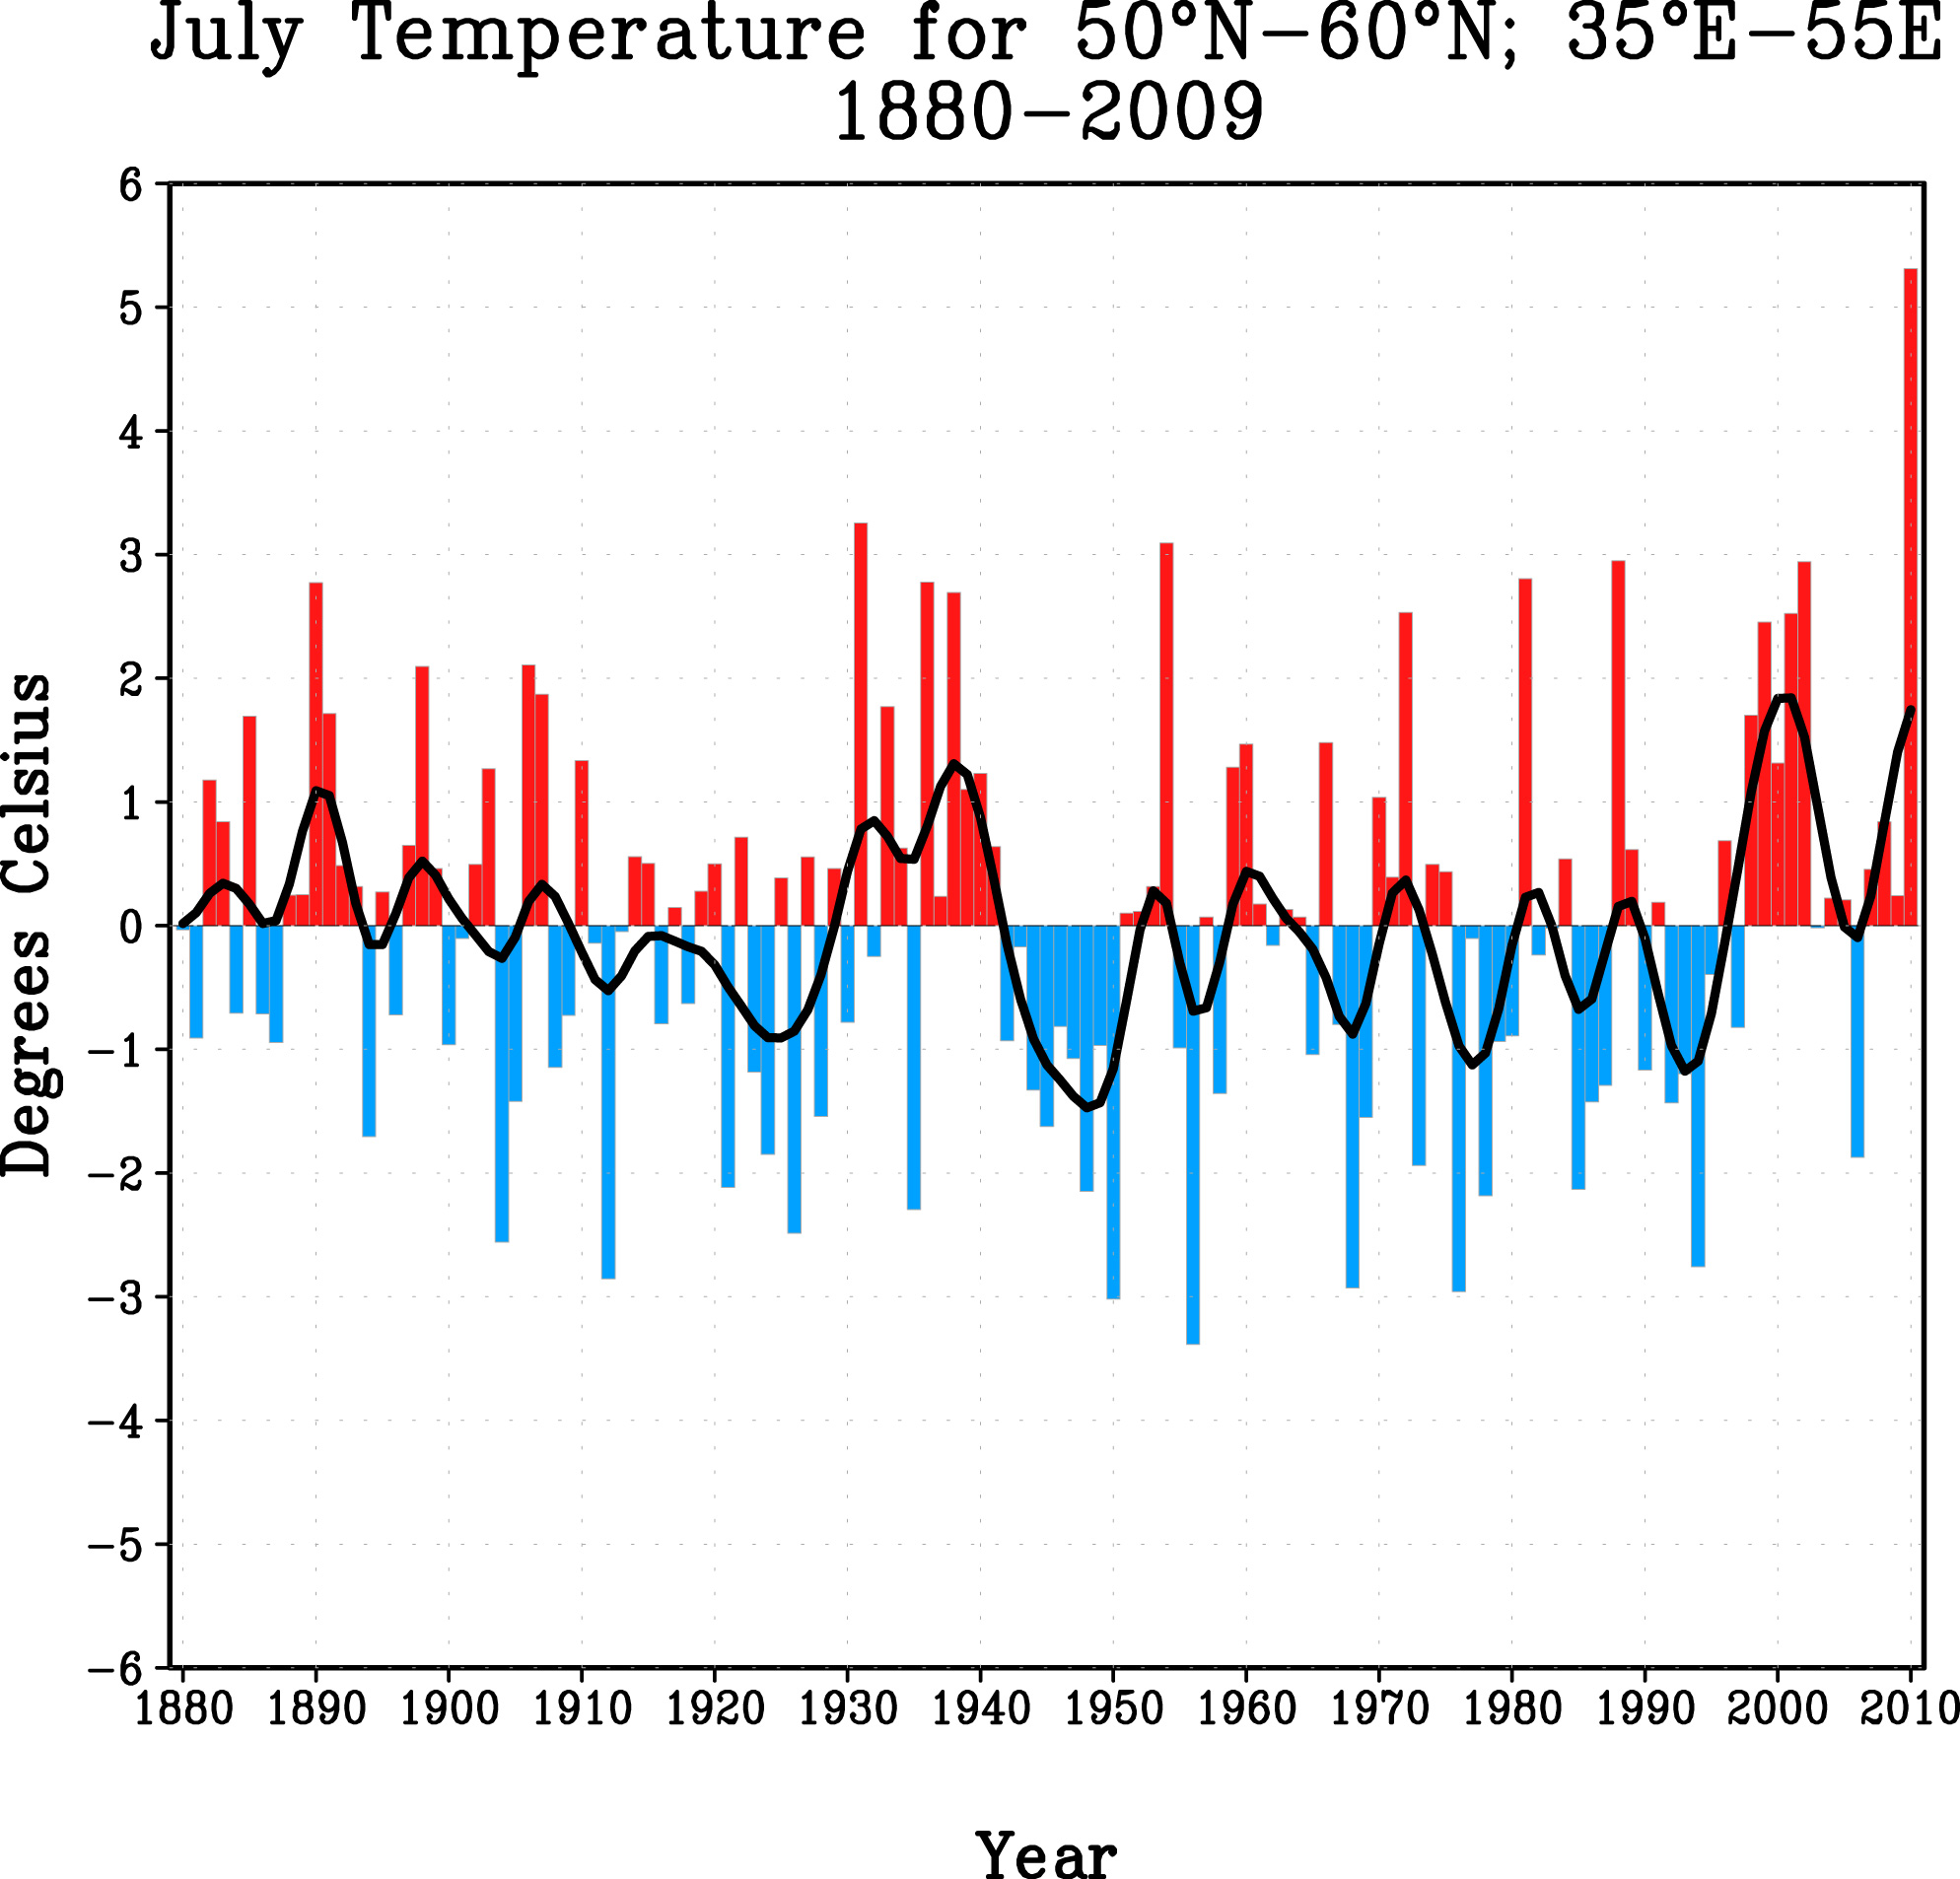
Figure 4: Time series of July near surface temperature anomalies averaged over the area
50-60N and 35-55E. Anomalies are calculated relative to the period 1880-2010.
Data source: NCDC
|
What is the historical context for the summer heat wave over western Russia? (Figure 4) During the period 1880-2009, the region's monthly July surface temperatures have experienced several very warm years of about +3ºC departures (1931 , 1955, 1981, 1988, and 2002), and comparably cold Julys having about -3ºC departure (1950, 1957, 1968, 1976, and 1994). Warm Julys alternating with cold Julys describes the typical sequence of events over western Russia during the last 130 years, with little or no discernible trend in July temperatures since 1880. Yet, the July 2010 anomalies averaged over western Russia exceeded the warmest July on record, and such an extreme event demands an explanation.
The Russian heat wave of 2010 has been an extreme and abrupt event. The July heat did not simply follow on the heals of a sequence of progressively warmer summers over recent decades, but stands out as a discrete event that is reminiscent of the often sharp year-to-year swings in this region's July surface temperatures during the last 130 years. In many ways,the heat wave is a "black swan" event in that it is well beyond the normal expectations in the instrumental record.
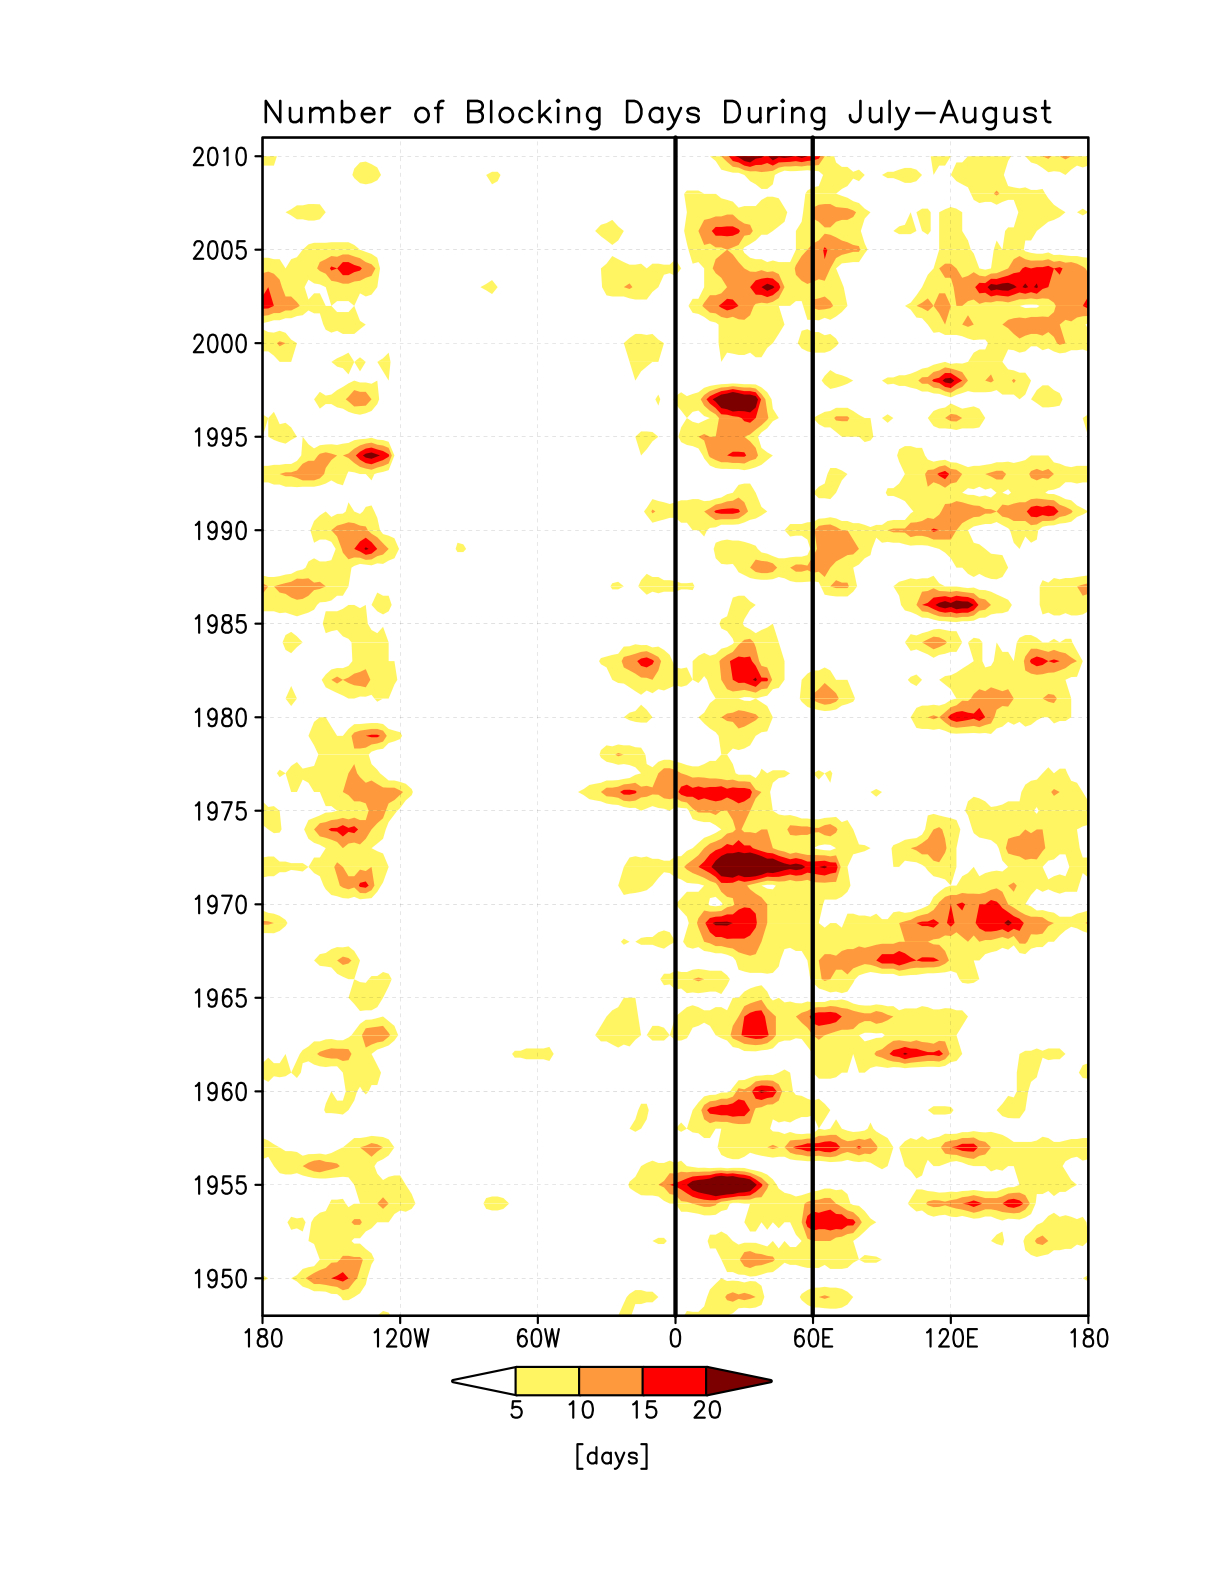
Figure 5: Hovemueller diagram of number of blocking days during July/August
as a function of longitude shown over the time period from 1948 to 2010. The frequency of blocking is determined based on daily 500 hPa heights using the approach by Tibaldi S. and F. Molteni, 1990: On the operational predictability of
blocking. Tellus 42A:343-365. Data source: NCEP/NCAR reanalysis
|
Whereas an event of this magnitude was unexpected for the summer of 2010, and indeed there was little if any advance warming from long lead seasonal forecasts, it is nonetheless important to assess the factors that may have been responsible for such an extreme heat wave. There is strong evidence that the immediate cause can be placed at the doorstep of an extreme pattern of atmospheric winds—widely referred to as blocking. In the situation of anticyclonic blocking such as developed over western Russia in early July 2010, the normal west-to-east movement of weather systems is inhibited, with the center of a blocking experiencing persistently quiescent weather.
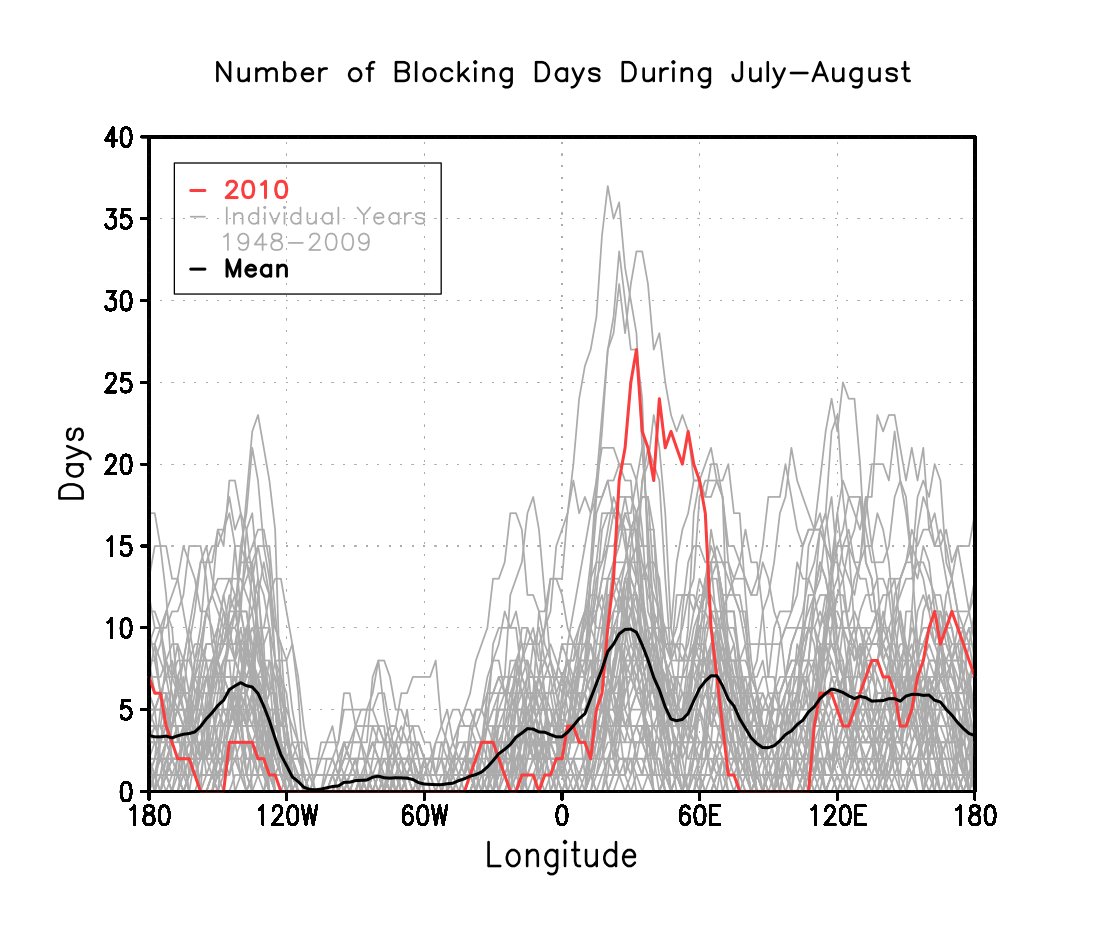
Figure 6: Number of blocking days for July/August as a function of longitude. Shown are individual years (gray) with 2010 highlighted in red, as well as average (black) over all years.
Data source: NCEP/NCAR reanalysis
|
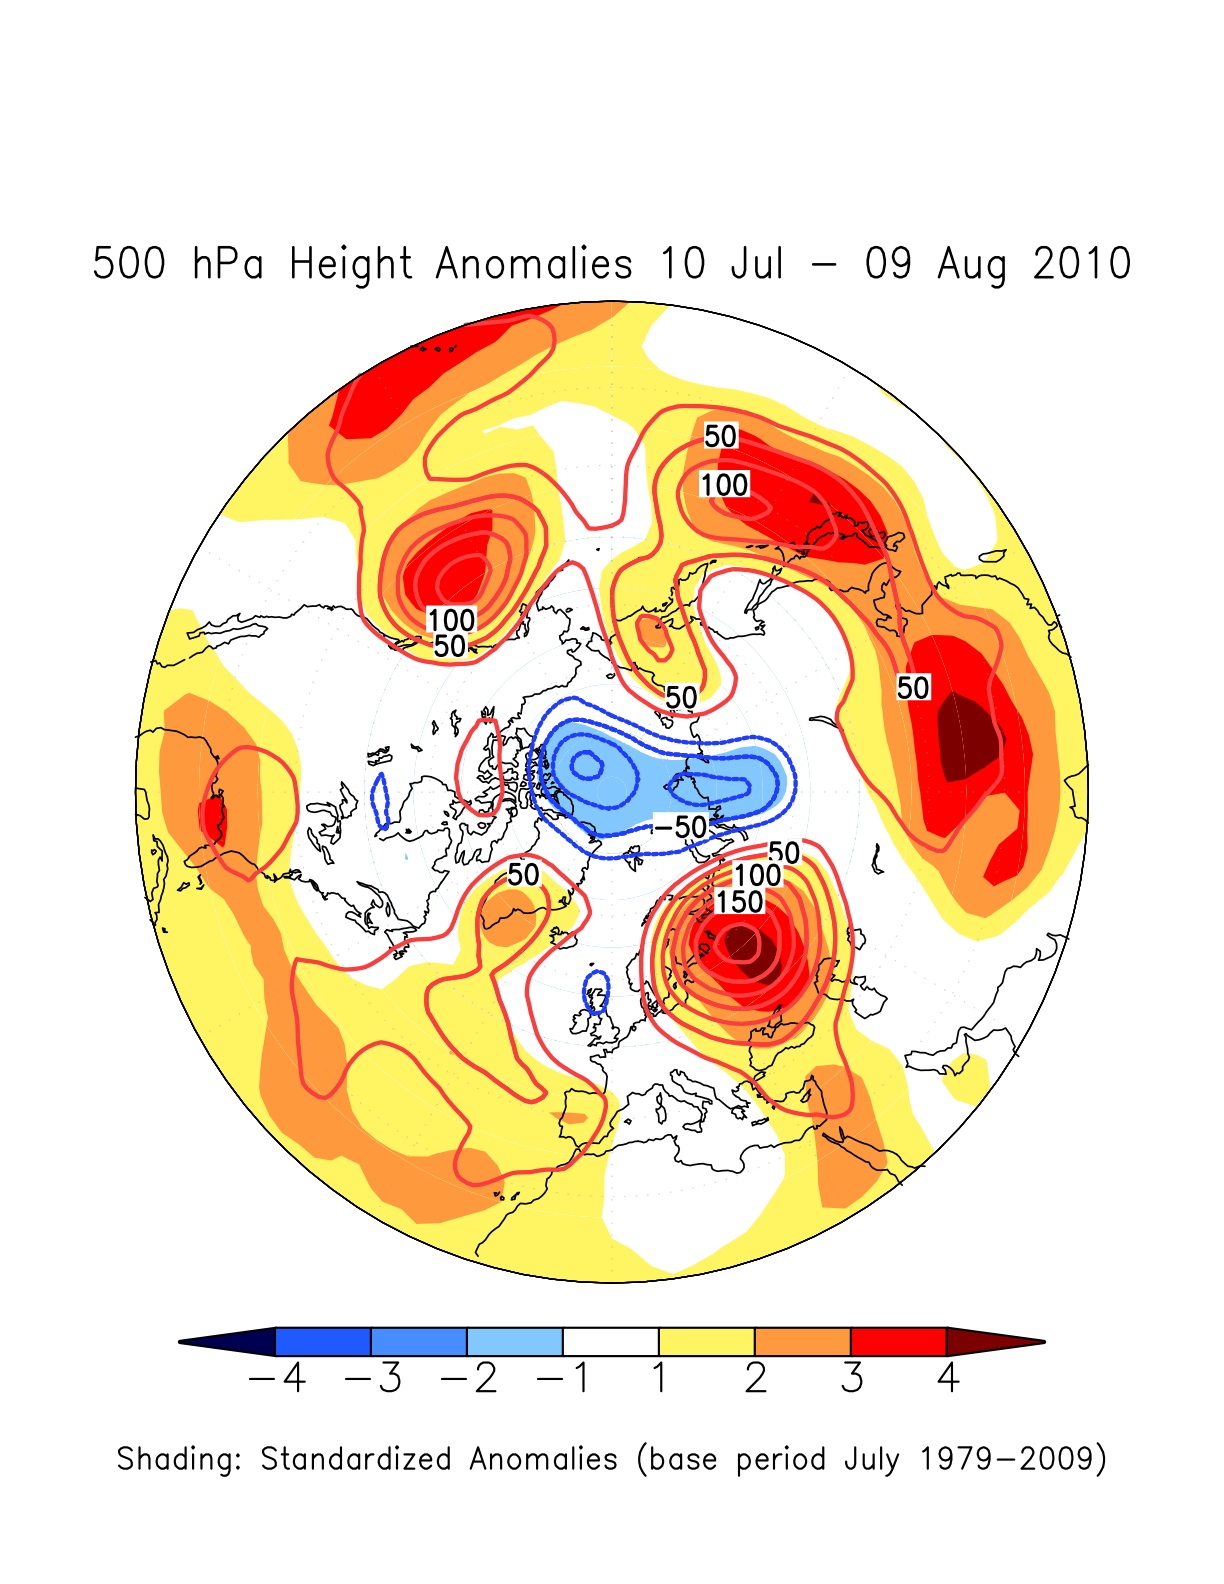
Figure 7: Northern Hemisphere map of 500 hPa height anomalies (isolines) averaged over the 31 day period 10 July to 09 August, 2010. Shading indicates anomalies normalized by standard deviation. The base period for anomalies and standard deviation is July 1979 to 2009.
Data source: NCEP/NCAR reanalysis
|
Blocks are not an uncommon occurrence over Eurasia in summer, with a episodes of July blocking in the region between 0-60ºE evident during the past half century (Figure 5). This region is vulnerable to episodes of blocking owing to physical factors related to the region's location downstream of the Atlantic westerly jet.
The sector exhibits high climatological frequency of blocking days during July/August, with an average of 10 days experiencing a blocking conditions (Figure 6). During July/August of 2010 (thru 11 August) this region experienced roughly triple its normal blocking days. The duration of this blocking event was long, and the intensity of the high pressure anomaly itself was unusually strong. The intensity of the positive 500mb height anomalies averaged over the geographic region of eastern Europe and western Russia during July/August 2010 exceeded any prior occurrence of anticyclonic blocking (Figure 7).
The strength of the height anomaly at 500mb during July/August 2010 was 4 times the standard deviation of July heights—a departure amplitude similar to that in the region's July surface temperatures. Typically, there is little persistence of the circulation pattern from July to August, although the current block that formed in early July continued with great strength through the middle of August.
The extreme surface warmth over western Russia during July and early August is mostly a product of the strong and persistent blocking high. Surface temperatures soared as a result of the combination of clear skies, sinking motion within the environment of the high pressure causing compressional heating of air, the lack of any temporary relief owing to the blocking of the typical cold fronts that cool the region intermittently in summer. Add to this scenario the cumulative effect of drought that began in early summer which caused soils to dry and plants to desiccate to wilting point , thereby causing additional surface warming via land feedbacks as the blocking condition persisted. These are all well-known and studied physical processes that have accompanied summertime blocking and heat waves in the past.
Figure 8: (Top) Map of observed surface temperature anomalies for July 2010
as an area-average of 500 hPa height anomalies (45-65N, and 25-60E).
(Bottom) Map of expected surface temperature anomalies for July 2010 based on
the historical relationship between an index of area-averaged
500 hPa height anomalies (45-65N, and 25-60E) and surface temperature
during 1900-2008. Data source: 20th century reanalysis and NCEP/NCAR reanalysis.
|
Much of the intensity of the current heat wave, and also the pattern of surface temperature conditions across Eurasia during July 2010, can be recreated from the atmospheric blocking event itself. The diagnostic procedure involves standard methods applied to the historical record of analyzed 500 mb heights and surface temperatures during the prior period of 1900-2008. The method of statistical regression is used to understand how surface temperature changes during a typical blocking occurrence over Russia during July, and is a method that can be used to infer causal relationships.
The surface temperature pattern accompanying a block consists of a localized +1 to +2ºC warming over western Russia, with somewhat weaker coolness toward the Urals (Figure 8). July 2010 was not a garden variety block, but was instead the most extreme block in the post-1900 period. While there is no analogue from which to draw an assessment of the expected impact on temperatures form such a block, one can nonetheless use the historical regression relation in order to infer the impact of this extreme July 2010 block. The process involves multiplying the regression pattern by the standardized departure of the height index observed for July 2010. The calculation offers a meaningful evaluation of the surface temperature response to the extent that the height-temperature relation is linear. The results indicate a surface warming in excess of +5ºC is expected over western Russia in response to the July 2010 blocking high, accompanied by a downstream pattern of about -3ºC coolness over the Urals and warmth of +2ºC to +3ºC over northern China, Mongolia, and northeastern Russia.
The comparison of the above reqression map with the observed temperature anomaly map for July 2010 clarifies the cause for this heat wave. The strong agreement between the July 2010 observed pattern of Eurasian surface temperatures and that pattern attributable to the impact of upper tropospheric blocking provides key evidence that the block is the immediate cause for the heat wave (and related temperature conditions over adjacent countries). Blocking events are typically of 1-2 week duration, and by contrast the 2010 situation is highly unusual in that blocking has existed over western Russia on virtually every day form the beginning of July until the middle of August. The cumulative impact of such prolonged blocking has led to the extreme nature of the surface impacts on temperature, soil conditions, and rainfall.
What has been the role of human-induced climate change in the Russian heat wave of 2010? As indicated at the beginning of this report, globally averaged surface temperatures during the first 6 months of 2010 were the warmest since about 1880 based on NOAA and NASA analyses.
Figure 9: Global monthly and 12-month running mean surface temperature anomalies relative
to 1951-1980 base period, and the Nino 3.4 index. Data extend through June 2010.
Source: Fig: 10 in Hansen, J., R. Ruedy, Mki. Sato, and K. Lo, 2010: Global surface temperature change.
Rev. Geophys., in press.
|
A time series of 12-month running mean globally averaged surface temperatures anomalies (Figure 9) from NASA data further indicates that the latest 12-month period is likely warmer than the prior record warmest year of 1998 (relative to an 1880-2009 period of analysis).
This current condition in global mean surface temperature is thus consistent with prior conclusions of the IPCC Fourth Assessment Report that "warming of the climate system is unequivocal, as is now evident from observations of increases in global average air and ocean temperatures, widespread melting of snow and ice and rising global average sea level". The IPCC Synthesis Report goes on to state that "most of the observed increase in global average temperatures since the mid-20th Century is very likely due to the observed increase in anthropogenic greenhouse gas concentrations".
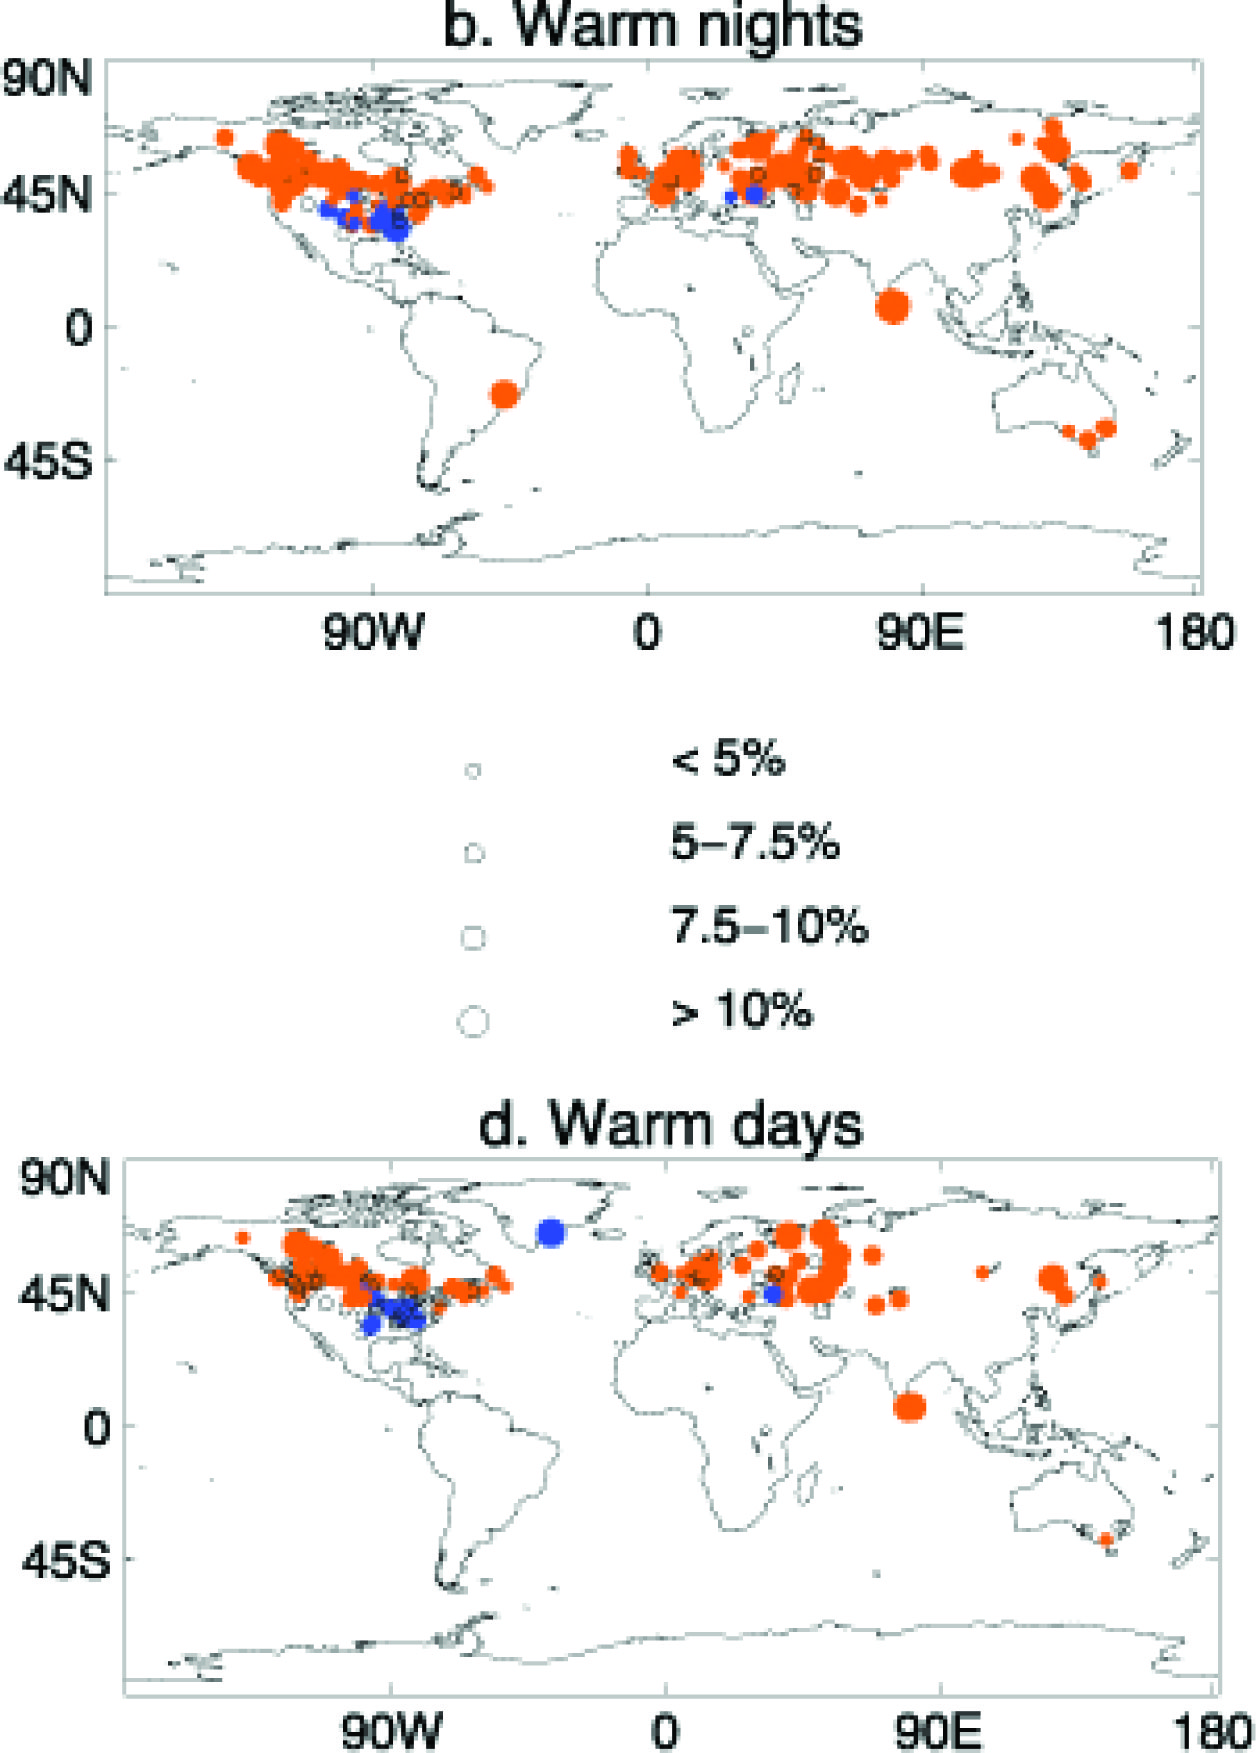
Figure 10: The 100-year trends for the percentile temperature indices for the period 1901 - 2003 for a
subset of stations with at least 80% complete data between 1901 and 2003 for (b) warm
nights, and (d) warm days. Black circles indicate a nonsignificant change. Red (blue) solid
circles indicate a significant increase (decrease) at the 5% level. Adapted from Figure 12 in Alexander,L. V., et al. (2006), Global observed changes in daily climate extremes of temperature and precipitation, J. Geophys. Res., 111, D05109, doi:10.1029/2005JD006290.
|
A comprehensive analysis of observed changes in extreme daily temperatures for the period 1901-2003 also reveals symptoms of a warming planet with a majority of stations over western Russia and eastern Europe (and also over Canada) showing significant increasing trends of warm daytime and warm nighttime temperatures (Figure 10).
Despite this strong evidence for a warming planet, greenhouse gas forcing fails to explain the 2010 heat wave over western Russia. The natural process of atmospheric blocking, and the climate impacts induced by such blocking, are the principal cause for this heat wave. It is not known whether, or to what exent, greenhouse gas emissions may affect the frequency or intensity of blocking during summer. It is important to note that observations reveal no trend in a daily frequency of July blocking over the period since 1948, nor is there an appreciable trend in the absolute values of upper tropospheric summertime heights over western Russia for the period since 1900.
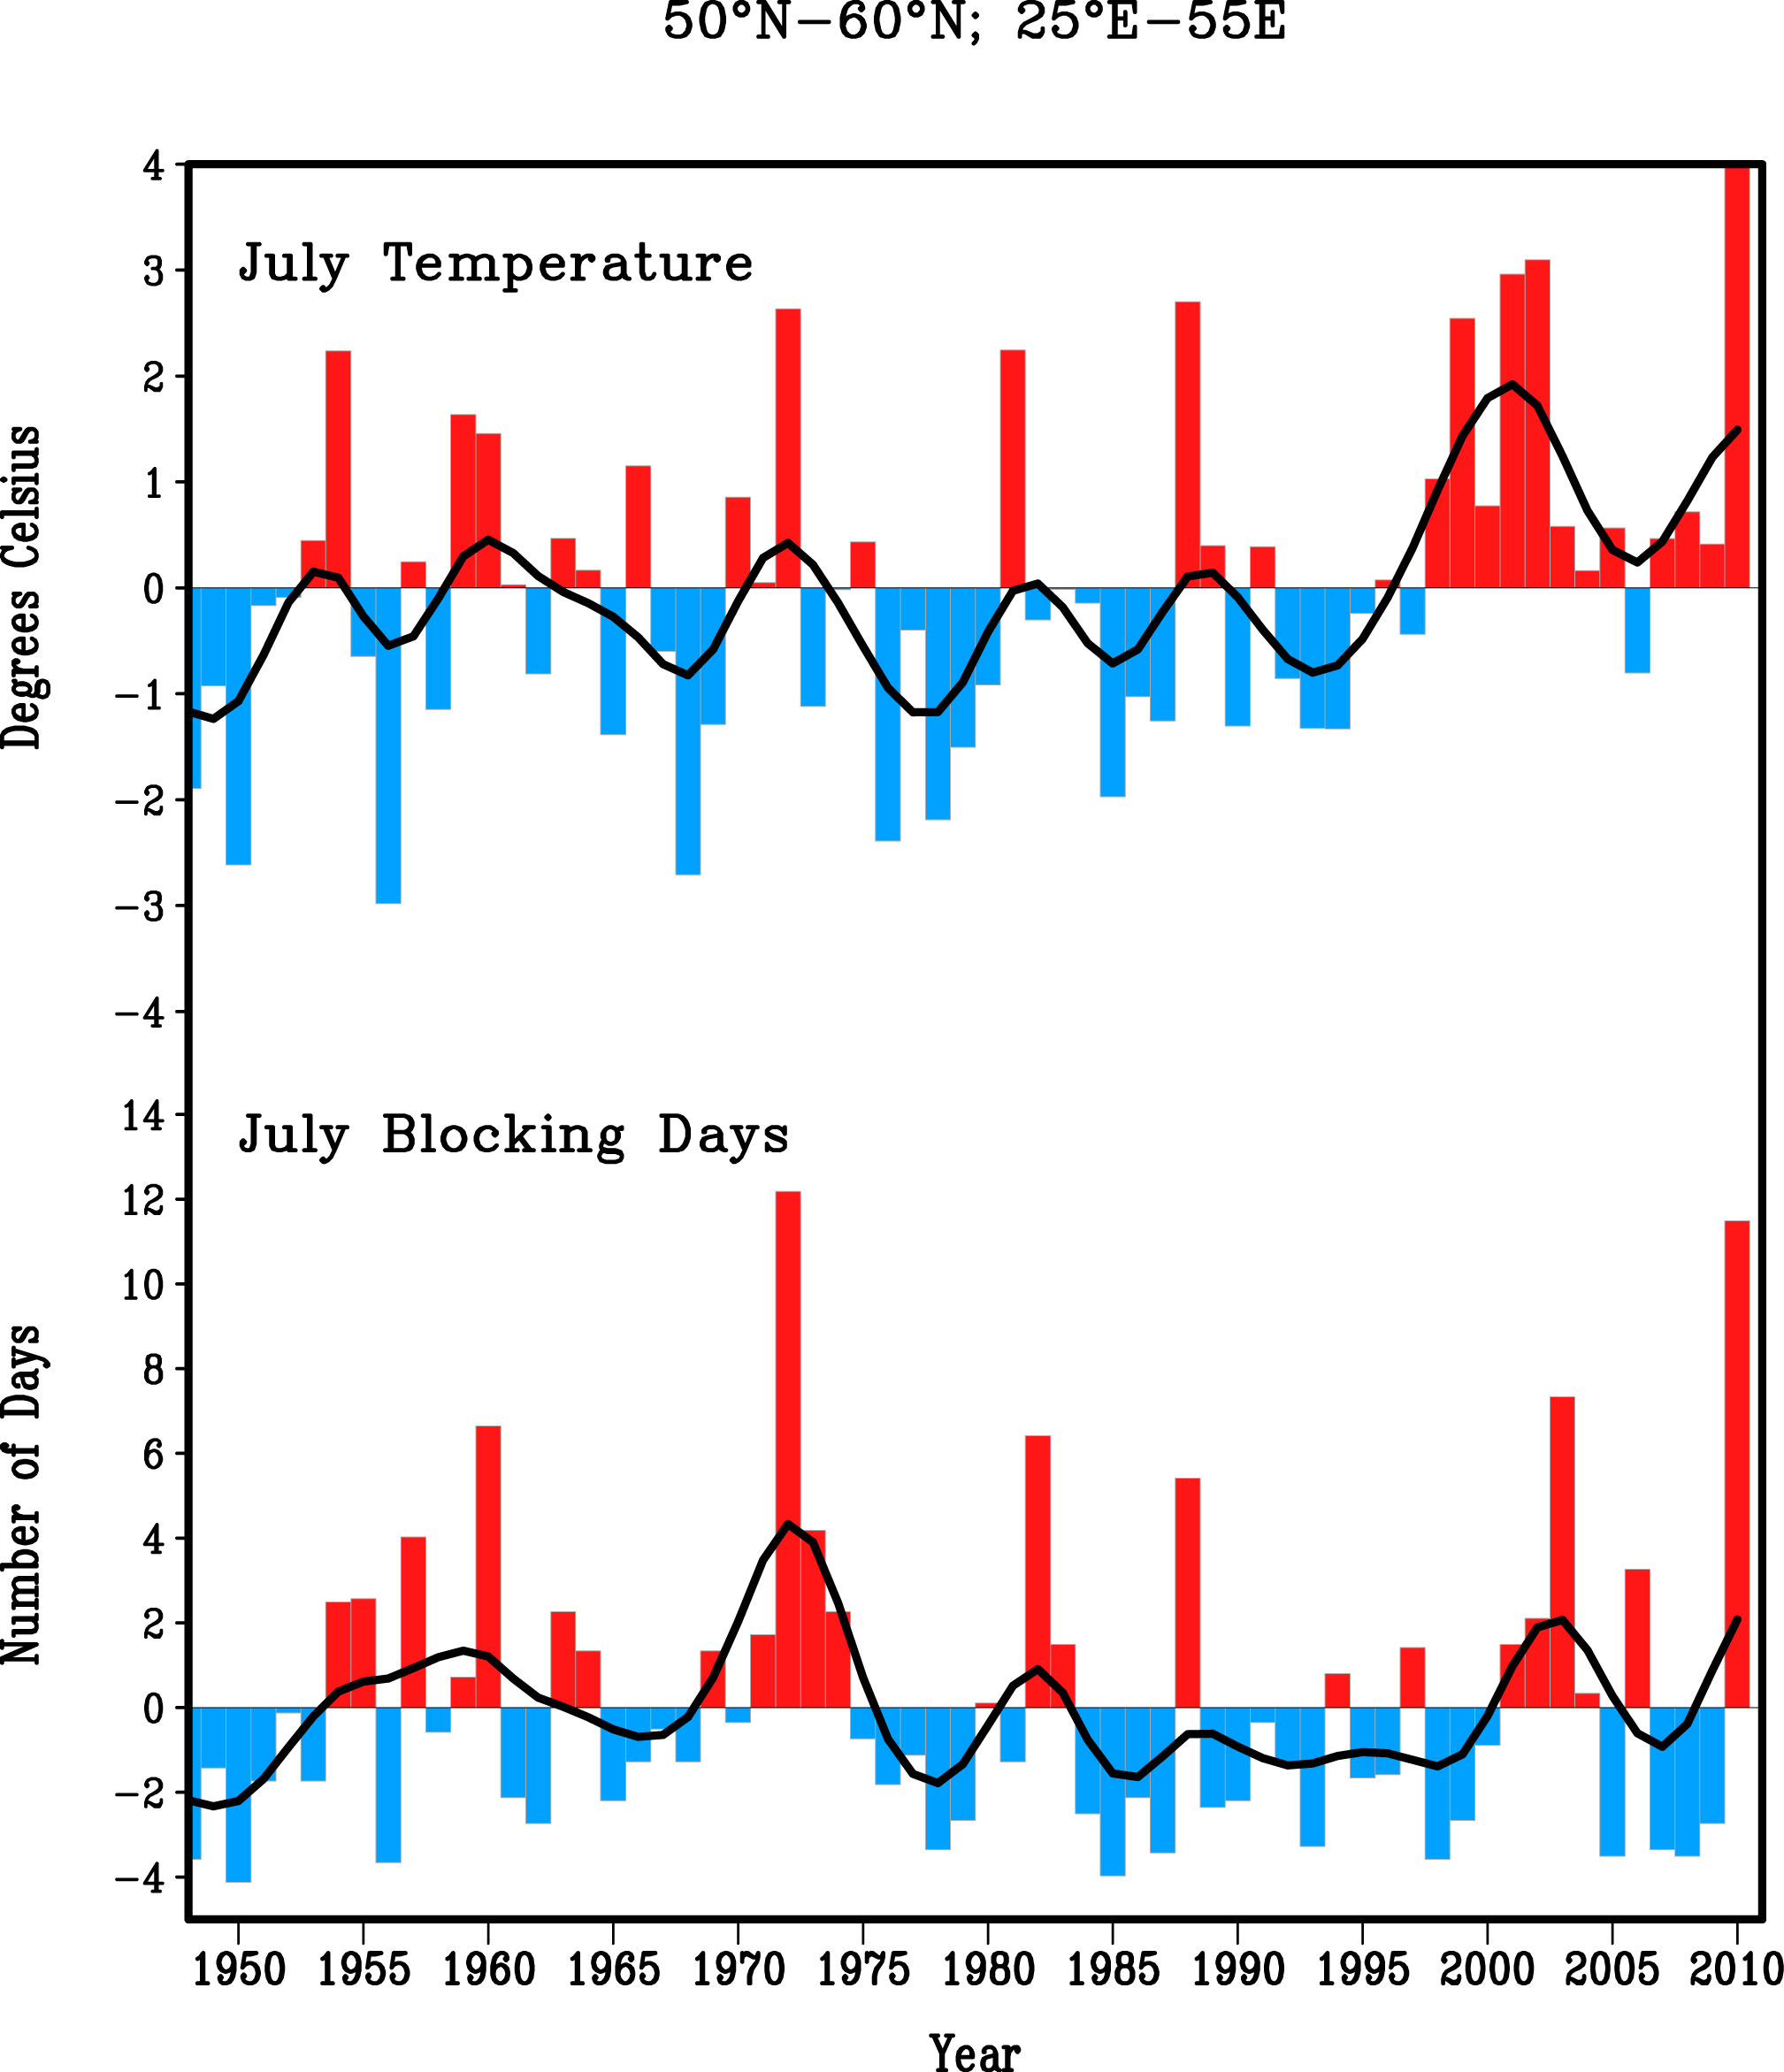
Figure 11: July time series of (top) near surface temperature anomalies averaged over the region 50-60N,
and 25-55E and (bottom) anomalies of mid-latitude blocking days averaged between 25E and 55E.
Anomalies are calculated relative to the period 1948-2010. Data source: NCEP/NCAR reanalysis
|
The indications are that the current blocking event is intrinsic to the natural variability of summer climate in this region (Figure 11), a region which has a climatological vulnerability to blocking and associated heat waves (e.g., 1960, 1972, 1988). A high index value for blocking days is not a necessary condition for high July surface temperature over western Russia—the warm summers of 1981, 1999, 2001, and 2002 did not experience an unusual number of blocking days.
A clear understanding of the causes for the 2010 Russian heat wave is important for informing decision makers and the public on whether they need to transition from a preparedness mode of precautionary responses to an adaptation mode involving investment responses and actions. Our assessment indicates that, owing to the mainly natural cause for this heat wave, it is very unlikely that a similar event will recur next summer or in the immediate future (next decade). Whereas this phenomena has been principally related to a natural extreme event, its impacts may very well forebode the impact that a projected warming of surface temperatures could have by the end of the 21st Century due to greenhouse gas increases.
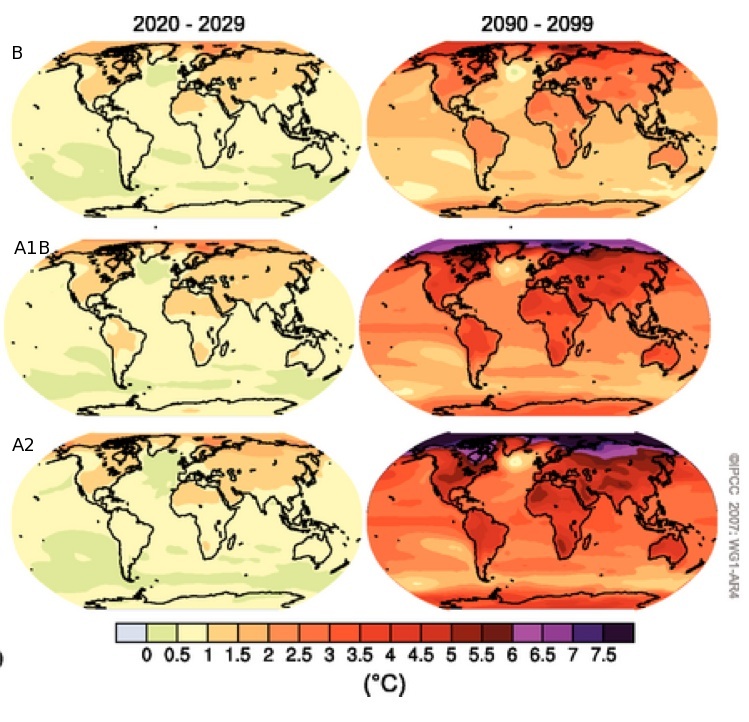
The 2007 IPCC report highlights surface temperature projections for the period 2090-2099 under a business-as-ususal scenario that reveals +5ºC to +7ºC warming warming of annually average temperatures over much of Eurasia under an aggressive A2 scenario (Figure 12).
|
Figure 12: Projected surface temperature changes for the early and late 21st century relative to the period 1980 to 1999. The left and right panels show the AOGCM multi-model average projections (ºC) for the B1 (top), A1B (middle) and A2 (bottom) SRES scenarios averaged over the decades 2020 to 2029 (centre) and 2090 to 2099 (right). Adapted from Figure TS.28 in Solomon, S., and Coauthors: Technical Summary. In: Climate Change 2007: The Physical Science Basis. Contribution of Working Group I to the Fourth Assessment Report of the Intergovernmental Panel on Climate Change [Solomon, S., D. Qin, M. Manning, Z. Chen, M. Marquis, K.B. Averyt, M. Tignor and H.L. Miller (eds.)]. Cambridge University Press, Cambridge, United Kingdom and New York, NY, USA. |
As we learn from our 2010 experience what a sustained heat wave of +5ºC to+10ºC implies for human health, water resources, and agricultural productivity, a more meaningful appreciation for the potential consequences of the projected climate changes will emerge. It is clear that the random occurrence of a summertime block in the presence of the projected changes in future surface temperature would produce heat waves materially more severe than the 2010 event.
Disclaimer: This draft is an evolving research assessment and not a final report. Comments are welcome. For further information, contact Dr. Martin Hoerling (martin.hoerling@noaa.gov)