20th Century Reanalysis V2
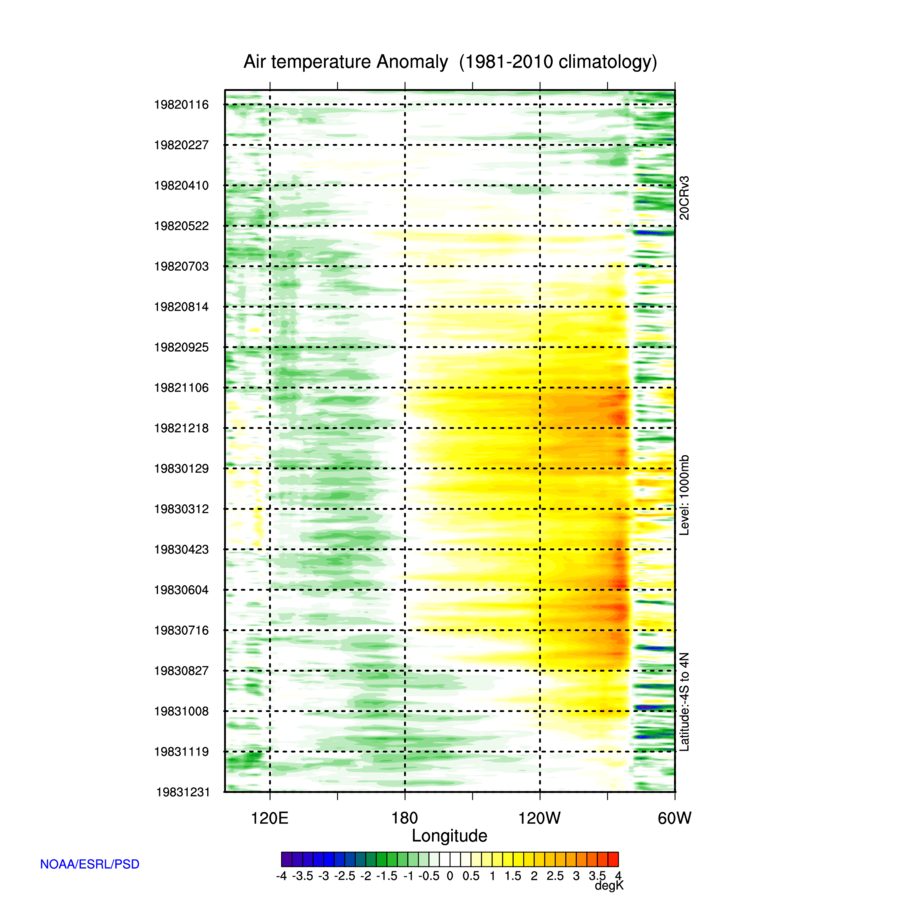
This plot shows a timexlongitude of air temperature anomalies averaged over 4S to 4N for the tropical Pacific area for 1982-3.
Options to produce plot are using the Time-Section Plotting Page
- Select: variable: air temperature
- Select: level: 1000mb
- Select: start: Jan 1 1982
- Select: end: Dec 13 1983
- Select: dataset: 20CRV3
- Select: statistic: Anomaly
- Select: plot type: timeXlongitude
- Select: latitude: 4 to -4
- Select: postscript: no
- Select: interval: .25
- Select: Range: -4 to 4
- Select: Scale 100