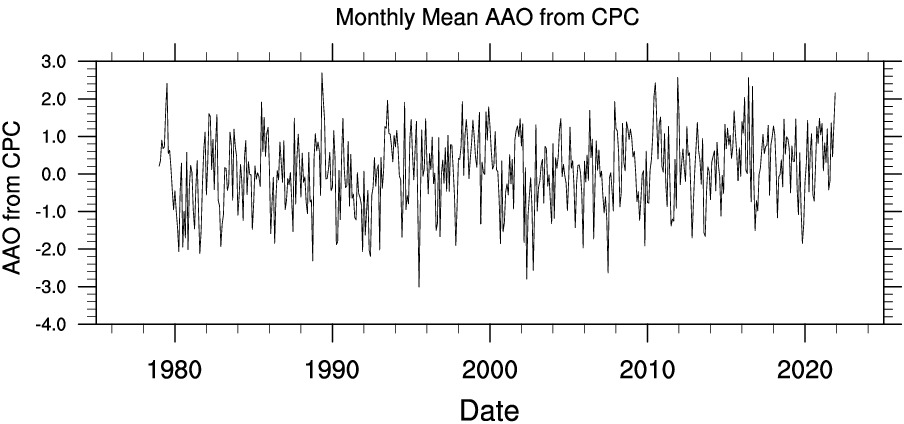
Antarctic Oscillation (AAO) Monthly Time-series (from CPC)
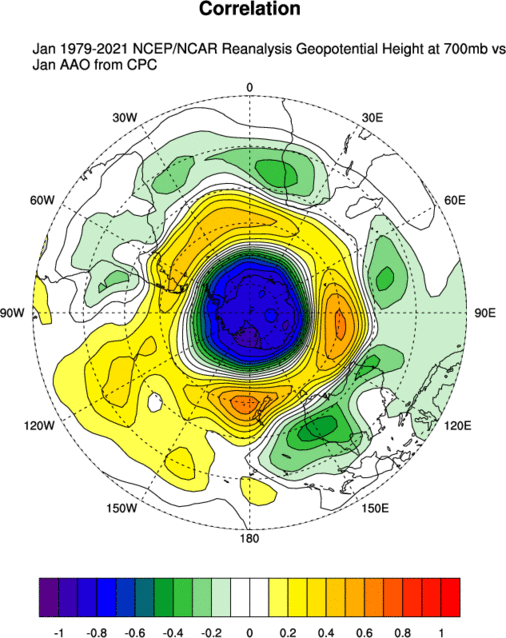
Pattern of Antarctic Variability obtained by calculating EOF's of 700mb geopotential height poleward of 20°S.

Describe plot

link to page that created plot with options selected (optional)
-
The loading pattern of AAO is defined as the first leading mode from the EOF analysis of monthly mean height anomalies at 700-hPa (SH). Note that year-round monthly mean anomaly data has been used to obtain the loading patterns. Since the AAO has the largest variability during the cold season (variance of AAO), the loading patterns primarily capture characteristics of the cold season patterns.
Monthly AAO indices are constructed by projecting the monthly mean 700-hPa height anomalies onto the leading EOF mode. The time series is normalized by the standard deviation of the monthly index (1979-2000 base period).
Temporal Coverage
- Monthly values: 1979/01 to present
- Update Status: Monthly
Data Notes
- Units: degC
- Missing data value: -99.0
Time-series List
Usage Restrictions
- None
Caveats
- None
Related Time-series
Links
Analysis pages
Original Source
- Index is calculated at NOAA/CPC NOAA CPC's AAO webpage (CPC
Time-series source dataset(s)
- NCEP/Reanalysis