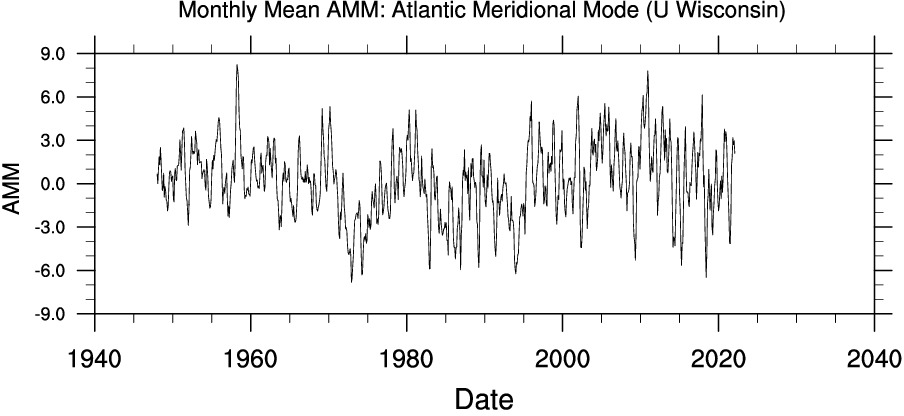
Atlantic Meridional Mode SST Index (AMM) Monthly Time-series
Describes meridional variability in the tropical Atlantic Ocean.

From Chiang and Vimont (2004):
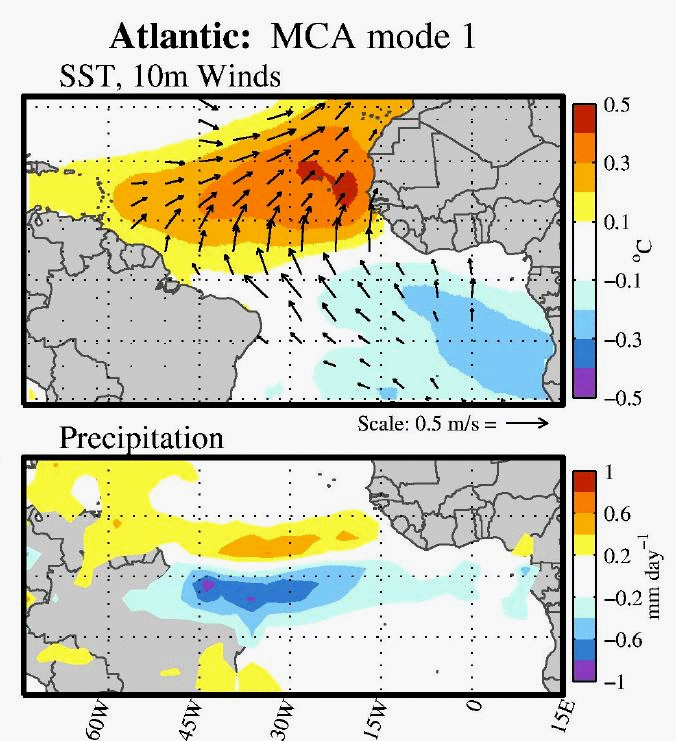
Spatial properties of the leading MCA mode 1 in the Atlantic. (top) Regression maps of the MCA leading mode SST normalized expansion coefficients on SST and 10-m wind vectors. Wind vectors are plotted where the geometric sum of their correlation coefficients exceeds 0.27 (the 95% confidence level). (bottom) Same as (a), (b) but for precipitation (mm day21). In general, shaded regions in all panels exceed the 95% confidence level.

Times-series from the WRIT Time-series Plotting Tool (center this)
Description
The mode describes the meridional variability in the tropical Atlantic Ocean. A similar mode but for the Atlantic is available.Temporal Coverage
- Monthly values: 1948/01 to present
- Update Status: Monthly
Data Notes
- Units: degC
- Missing data value: -99.0
Get Data
Time-series List
Source, citation and related Information.
Related Time-series
Links
Original Source
- Index is calculated at the U Wisconsin by Prof Dan Vimont.
Time-series source dataset(s)
- Input data for the mode calculation is the NCEP/NCAR Reanalysis.
Citation
- Chiang, J. C. H. and D. J. Vimont, 2004: Analagous meridional modes of atmosphere-ocean variability in the tropical Pacific and tropical Atlantic. J. Climate, 17 (21), 4143–4158.
References
- 2004 Chiang, J. C. H., and D. J. Vimont: Analogous meridional modes of atmosphere-ocean variability in the tropical Atlantic and tropical Pacific. J. Climate,17(21), 4143-4158.