Arctic Oscillation (AO) Index: CPC

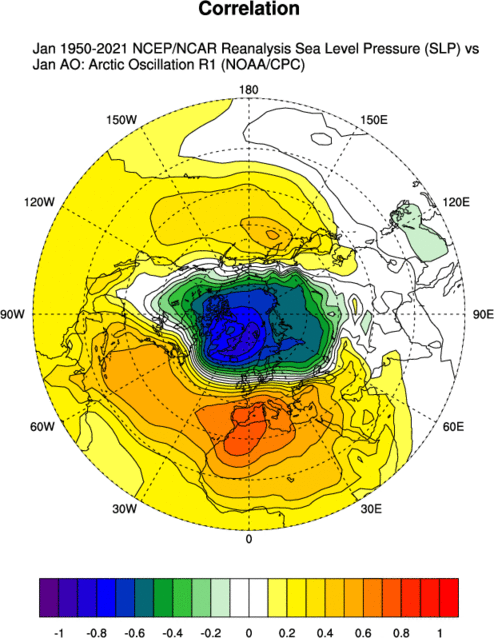
Correlation AO with SLP.

- The loading pattern of the AO is defined by NOAA/CPC as the leading mode of Empirical Orthogonal Function (EOF) analysis of monthly mean 1000mb height during 1979-2000 period.
Temporal Coverage
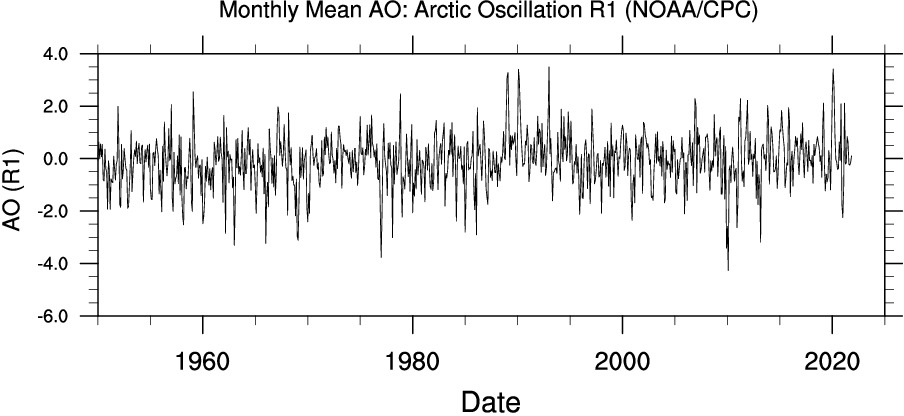
- Monthly values: 1950/01 to present
- Update Status: Monthly
Data Notes
- Units: mb
- Missing data value: -99.0
Time-series List
- AO (CPC): Standard PSL Format, CSV, Netcdf (What is standard format?)
Usage Restrictions
- None
Caveats
- None
Related Time-series
Links
- CPC Telconnetion webpage
Analysis pages
- WRIT correlation
- WRIT time-series
Original Source
- Data is from NOAA/CPC at http://www.cpc.ncep.noaa.gov/products/precip/CWlink/daily_ao_index/ao_index.html
Time-series source dataset(s)
- Input data for the mode calculation is the NCEP/NCAR Reanalysis 1000mb geopotential height.