NASA Global Average Temperature & SST Anomalies (Station + SST) (GLBSST)
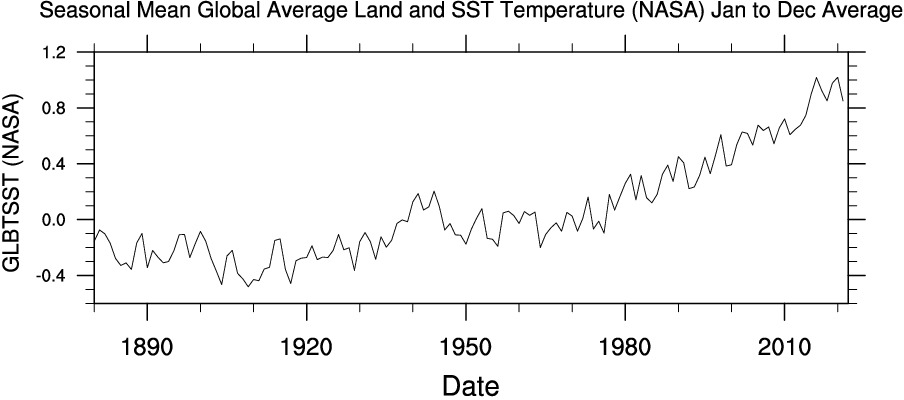
Global Average Temperature anomalies over land and ocean.

From WRIT Correlation page
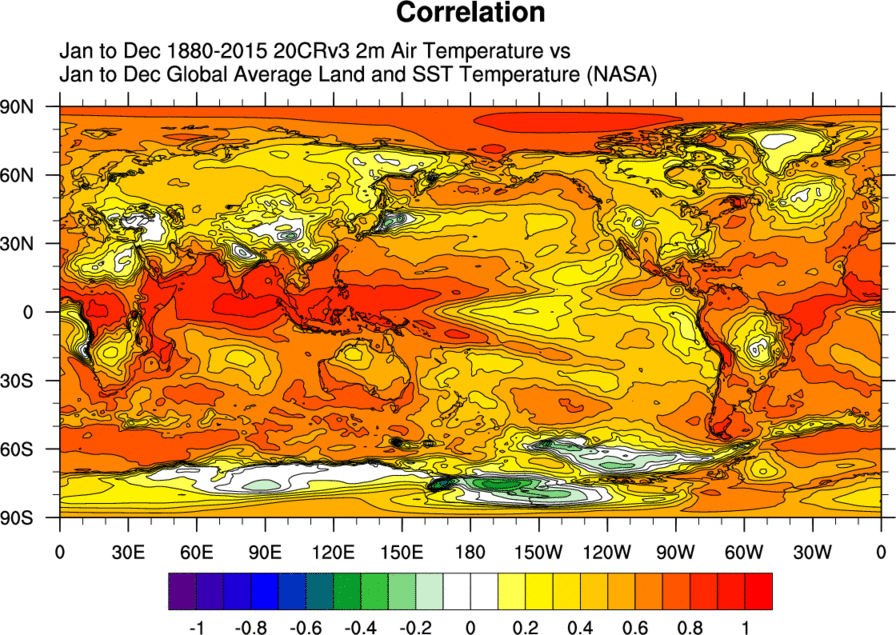
Map is correlation of annual GLBSST time-series with Annual 2mT from the 20CRV3 for 1880-2015.
- GLOBAL Land-Ocean Temperature Index in .01 C base period: 1951-1980 using GHCN 1880-01/2005 + SST: 1880-11/1981 HadISST1 12/1982-01/2005 Reynolds v2 using elimination of outliers and homogeneity adjustment
Temporal Coverage
- Monthly values: 1980/01 to near present
- Update Status: Monthly
Data Notes
- Units: degC
- Missing data value: -9999.0
Time Series Links
Usage Restrictions
- None
Caveats
- None
Analysis pages
Original Source
- Data is from NASA at Original format
Time series source dataset(s)
- Input data for the mode calculation is the NASA GISTEMP.
