NASA Global Average Temperature Anomalies (Station only) GLBTS
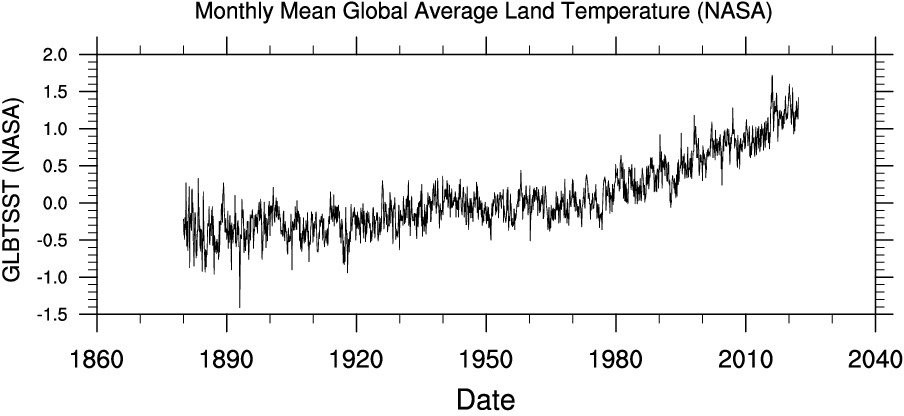
Global Average Temperature anomalies over land from the NASA GISTEMP Dataset.

From WRIT Correlation page
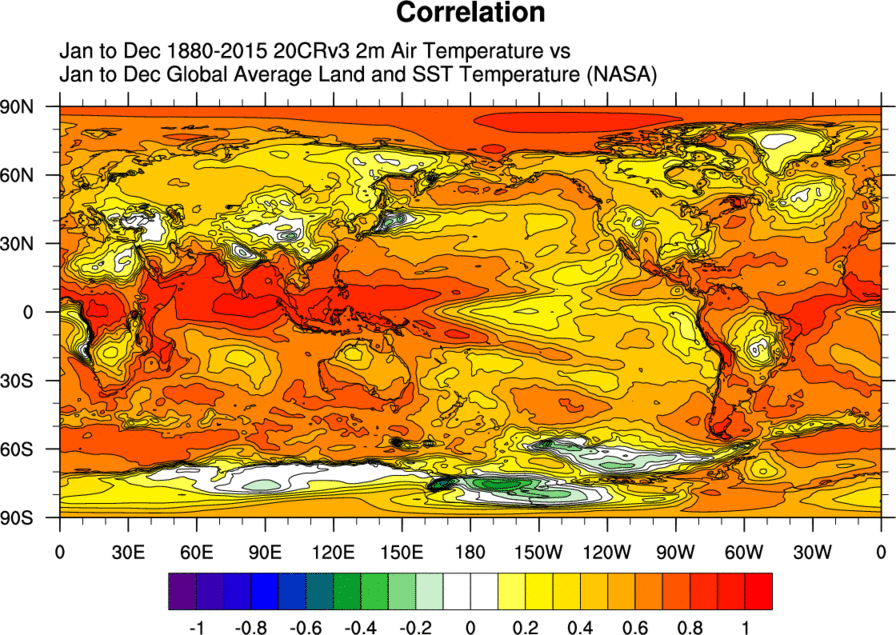
Map is correlation of annual GLBTS time-series with Annual 2mT from the 20CRV3 for 1880-2015.
- GLOBAL Land Temperature Index in .01 C base period: 1951-1980 using GHCN 1880-01/2022.
Temporal Coverage
- Monthly values: 1880/01 to near present
- Update Status: Monthly
Data Notes
- Units: degC
- Missing data value: 9999.0
Time Series Links
Usage Restrictions
- None
Caveats
- None
Analysis pages
Original Source
- Data is from NASA at Original format
Time series source dataset(s)
- Input data for the mode calculation is the NASA GISTEMP.
Citation
- GISTEMP Team, 2022: GISS Surface Temperature Analysis (GISTEMP), version 4. NASA Goddard Institute for Space Studies. Dataset accessed 20YY-MM-DD at https://data.giss.nasa.gov/gistemp/.
