Pacific Decadal Oscillation
Describes SST variability in the north Pacific Ocean.

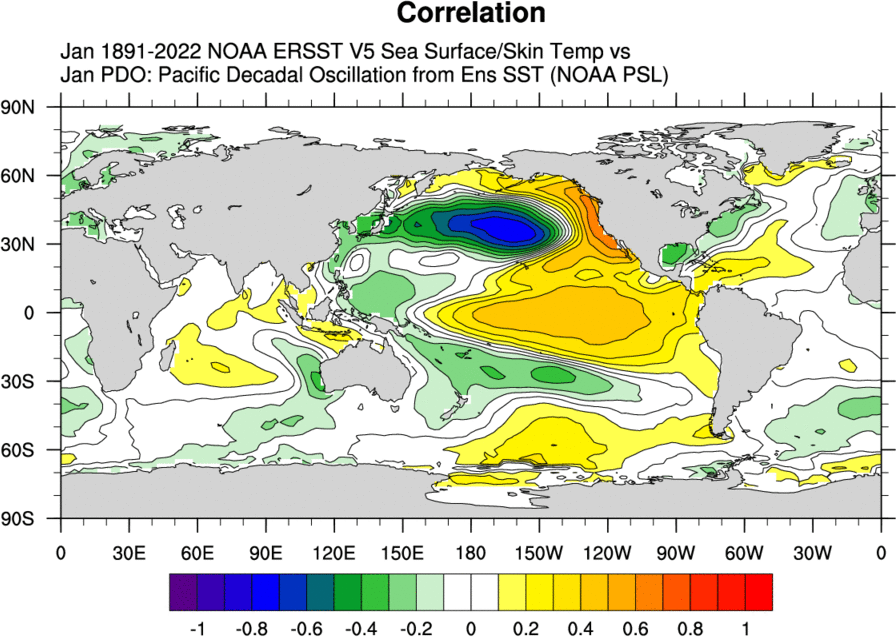
Correlation of the PDO from the NOAA/PSL with NOAA ERSST V5 for January.

link to page that created plot with options selected (optional)
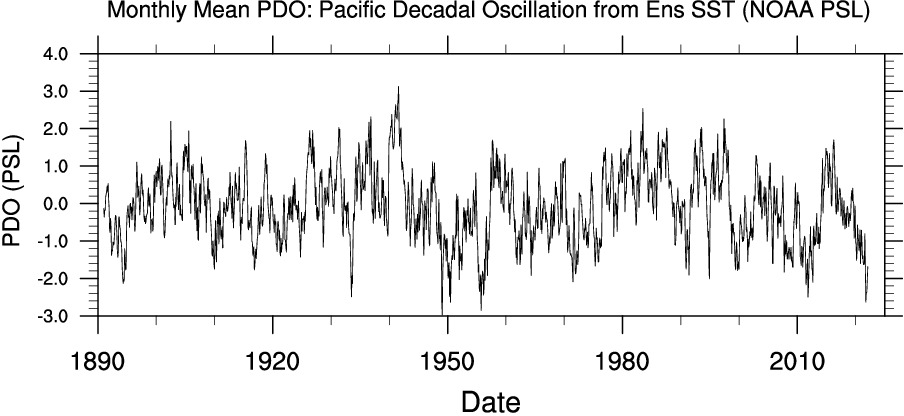
- Ensemble mean PDO from the COBE SST, NOAA ERSST V5, and HadISST1.1 SST datasets. PDO is defined as the leading EOF of monthly SSTA in the North Pacific, between 20N-70N. SST monthly climatology is removed and then the global mean is removed. Climo is 1920-2014. ;
Temporal Coverage
- Monthly values: 1891/01 to present
- Update Status: Monthly
Data Notes
- Units: degC
- Missing data value: -9.90
Time-series List
- PDO (PSL): Standard PSL Format, CSV, Netcdf (What is standard format?)
Usage Restrictions
- None
Caveats
- None
Analysis pages
- WRIT correlation
- WRIT time-series
Original Source
- NOAA/PSL
Time-series source dataset(s)
- Input data for the mode calculation is the COBE SST, NOAA ERSST V5, and HadISST1.1
References
- Newman, M., M. A. Alexander, T. R. Ault, K. M. Cobb, C. Deser, E. Di Lorenzo, N. Mantua, A. J. Miller, S. Minobe, H. Nakamura, N. Schneider, D. J. Vimont, A. S. Phillips, J. D. Scott and C. A. Smith (June 2016): The Pacific Decadal Oscillation, Revisited. J. Climate, 29 (12), 4399-4427, https://doi.org/10.1175/JCLI-D-15-0508.1.