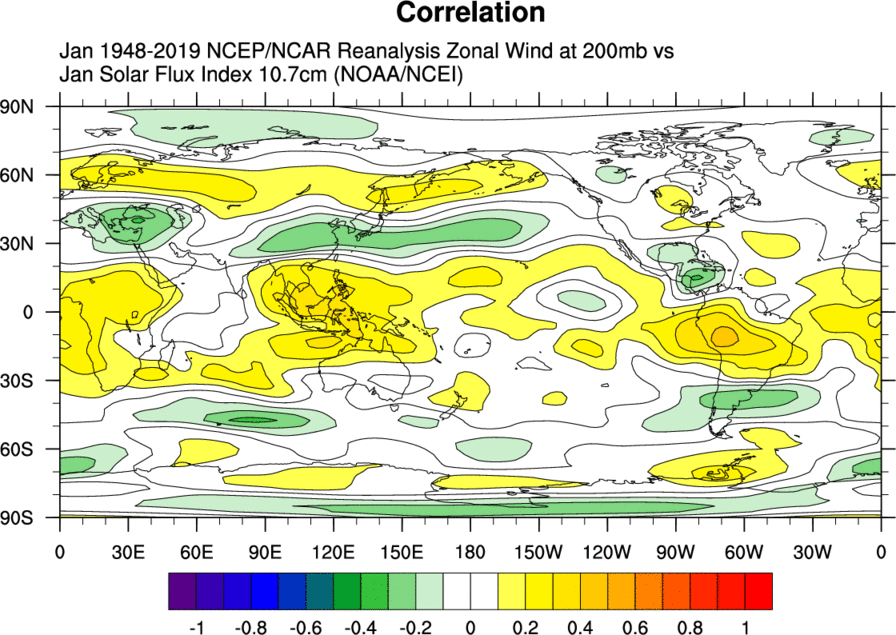
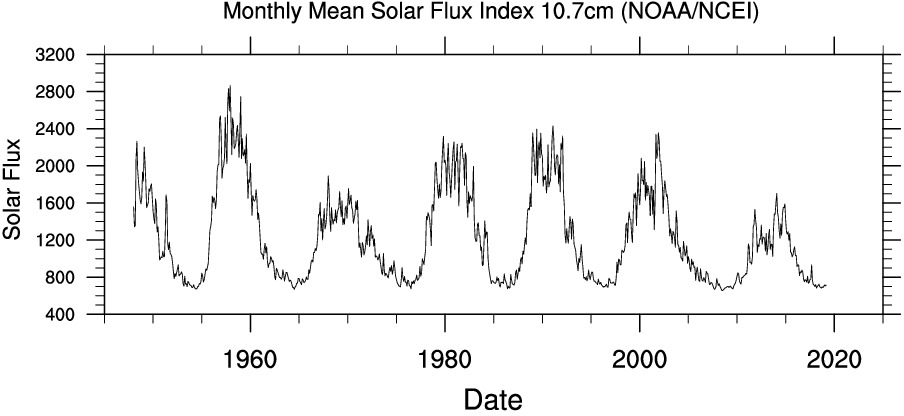
Solar Flux (10.7cm)
- Nino 1+2 is the area averaged anomalies over the Nino 1+2 region (SSTs are averaged over the NINO1 and NINO2 regions 0-10°South;90°West-80°West) using a climatology of 1981-2010. Map of ENSO regions.
Temporal Coverage
- Monthly values: 1870/01 to present
- Update Status: Monthly
Data Notes
- Units: degC
- Missing data value: -99.99
Time-series List
- Solar Flux: Standard PSL Format, CSV, NetCDF (What is standard format?)
Usage Restrictions
- None
Caveats
- None
Related Time-series
- Nino 3.4
Links
- https://www.spaceweather.ca/forecast-prevision/solar-solaire/solarflux/sx-en.php
Analysis pages
Original Source
- Index is available here.
- Older values are from NCEI via FTP ftp://ftp.ngdc.noaa.gov/STP/space-weather/solar-data/solar-features/solar-radio/noontime-flux/penticton/penticton_observed/listings/listing_drao_noontime-flux-observed_monthly.txt.
Time-series source dataset(s)
- Input is from solar measurements.
References
Citation
- The 10.7cm Solar Flux Data are provided as a service by the National Research Council of Canada". They would appreciate a preprint or at least a reference if you use the data (URL is http://www.drao.nrc.ca/index_eng.shtml.

