Overview of Oceans and Marine Ecosystems Tool
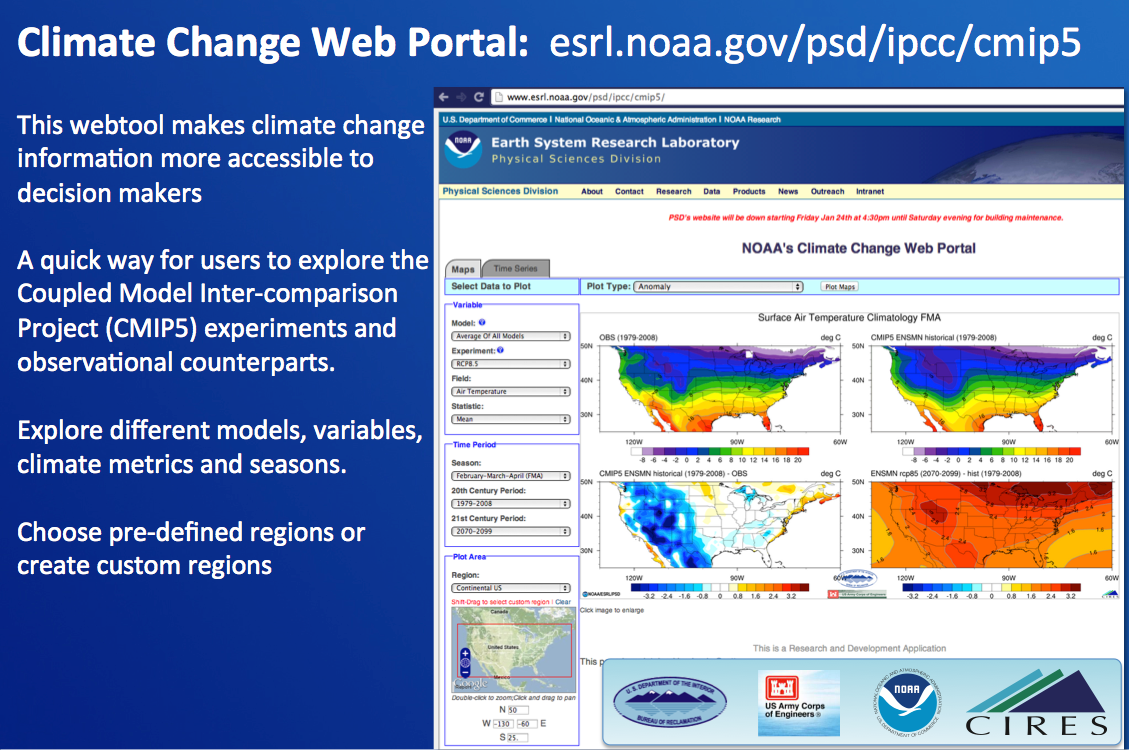
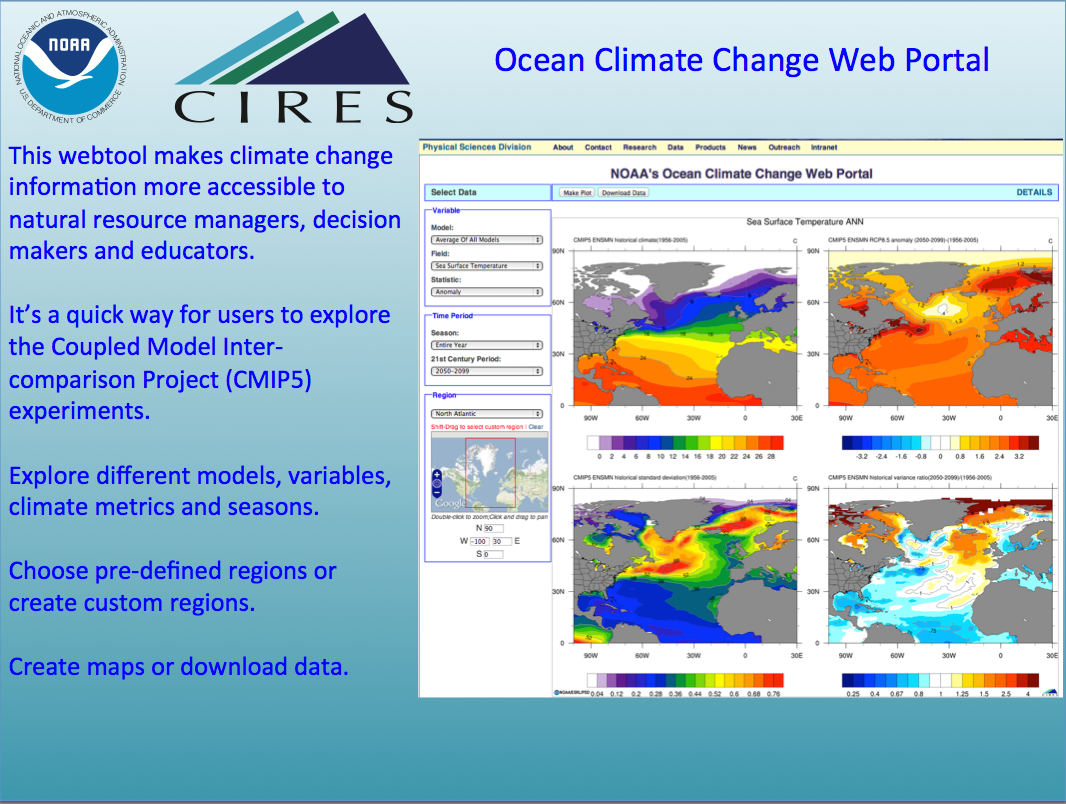
This is an experimental web-tool designed to explore changes projected in the oceans by coupled climate models' CMIP5 experiments (historical and RCP8.5 or RCP4.5).
Variables
Current variables available are sea surface temperature, sea surface salinity, sea surface pH, near-surface air temperature, and precipitation. Temperature, salinity and ocean currents at depth will be available in the near future.
Air temperature and precipitation are represented by 35 models. Sea surface temperature and salinity are represented by 25 models. pH is represented by 11 models.
All data has been interpolated to a 1 degree by 1 degree grid to facilitate inter-comparison. Atmospheric grids were interpolated bilinearly, while oceanic grids were interpolated by a natural neighbor method.
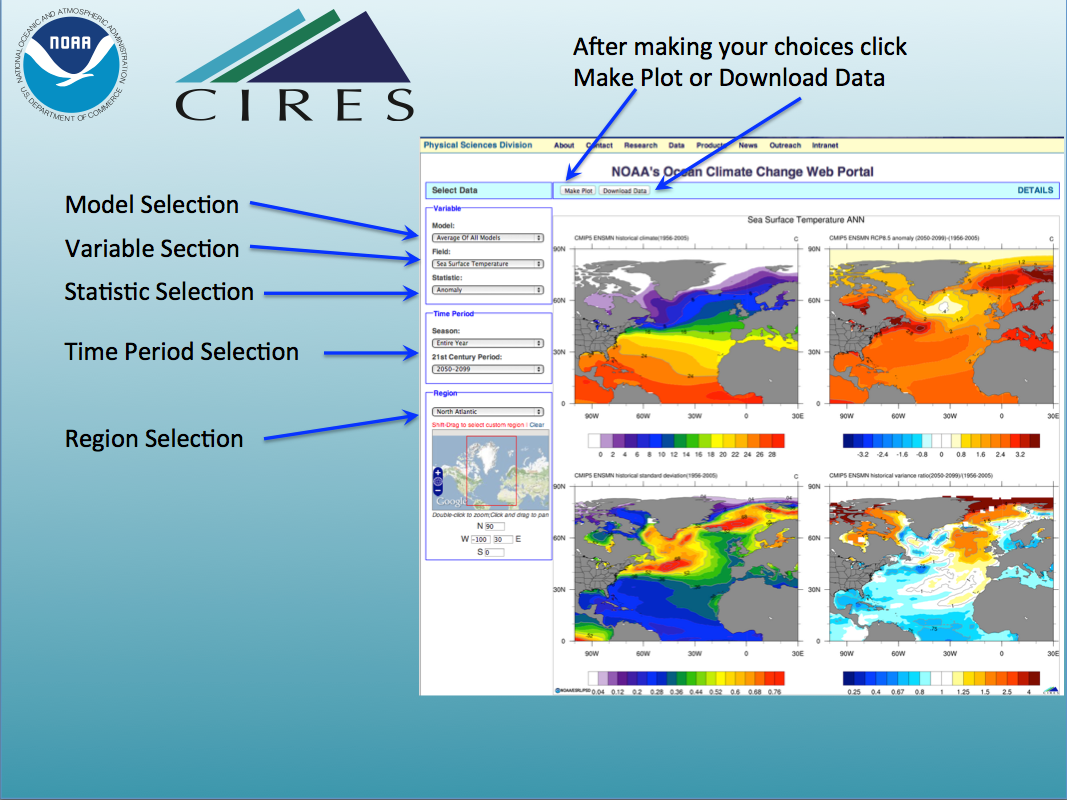
Basic Options
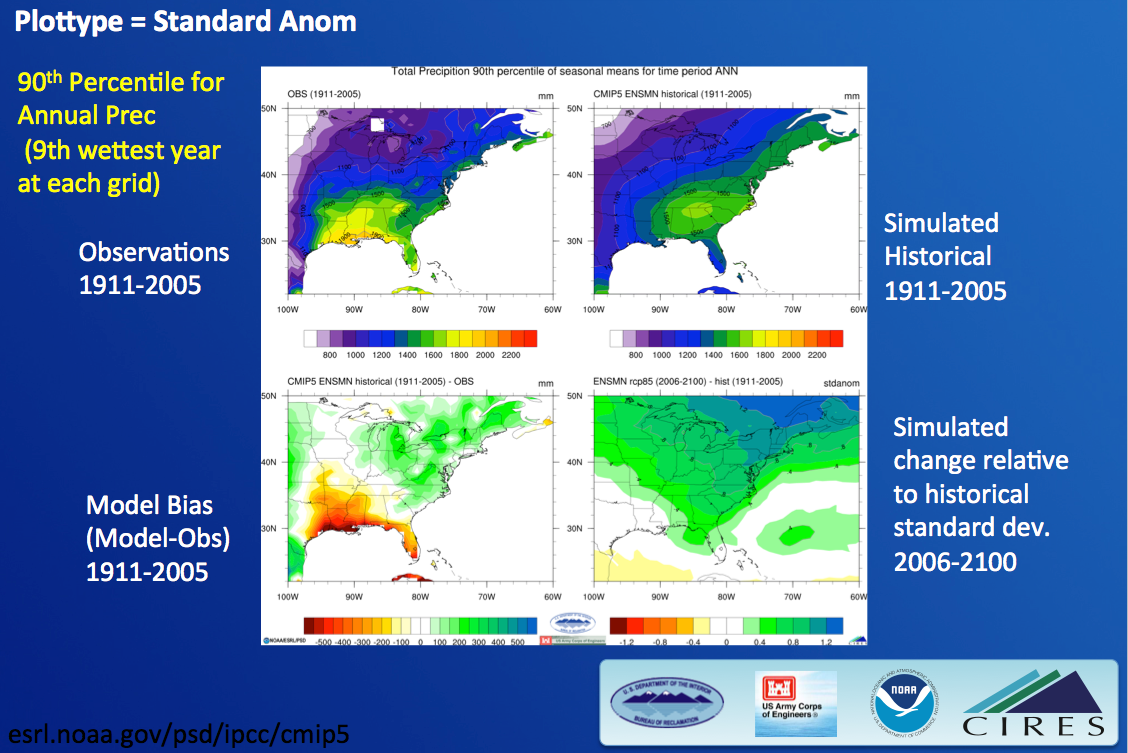
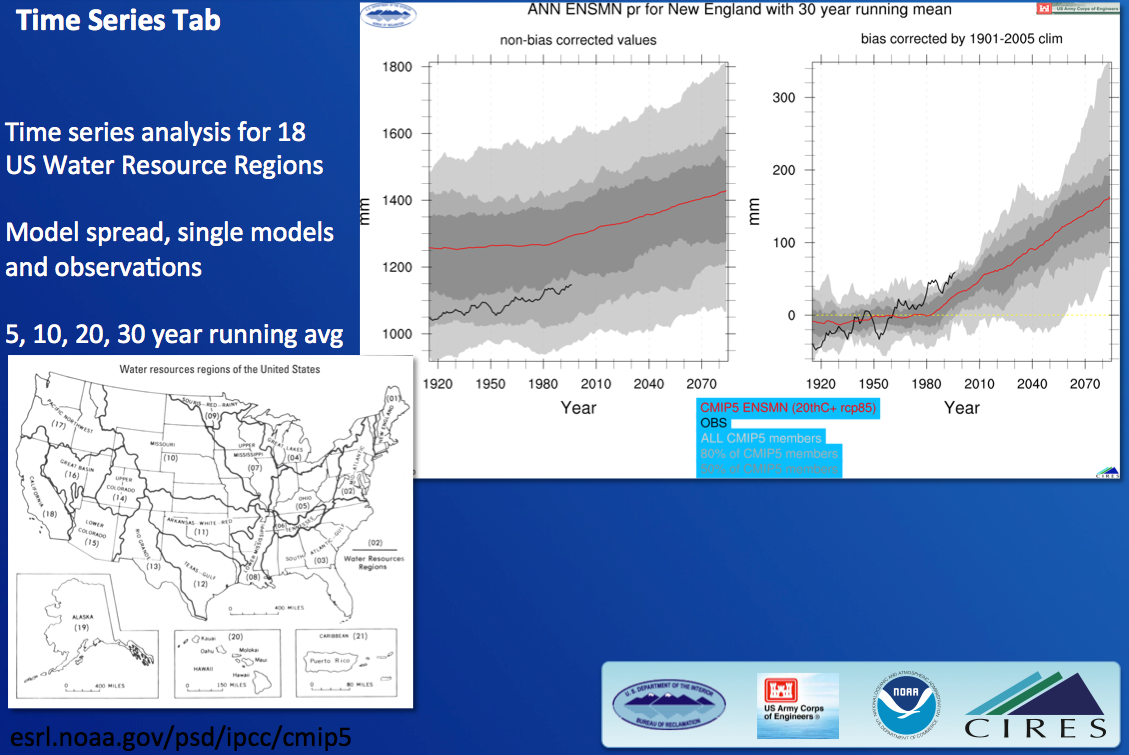
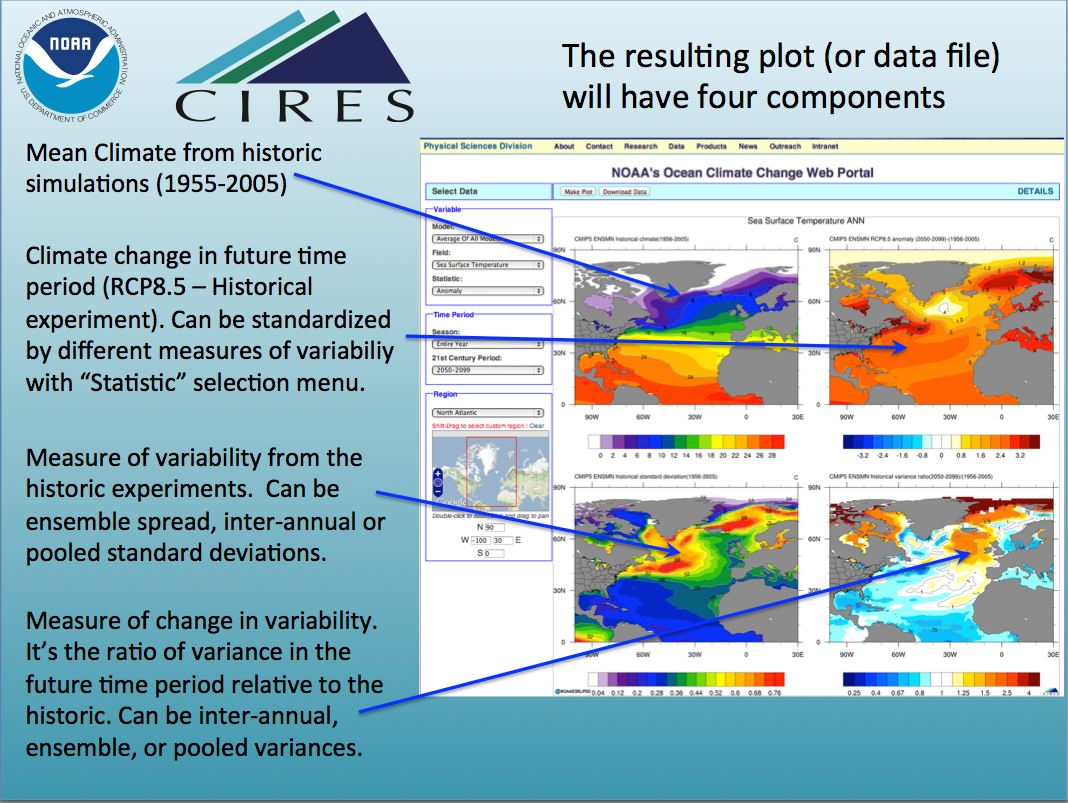
Users can select individual models or an average of all models. There are also choices to be made for season, 21st century time period, and region. Depending on what statistic is chosen, a 4-panel plot will be created. The upper left panel will show the climate from the historical experiment for the period 1956-2005. The upper right will show a measure (depending on statistic chosen) of the change in climate from the historical reference period to the 21st century time period (RCP8.5 or RCP4.5 experiment). The lower left panel will show some measure (depending on statistic chosen) of the variability in the historical reference period. Lastly, the lower right panel will show some measure of the change in variability of the 21st century period relative to the historical period.
Statistic Options
There are 4 different options for statistics: anomaly, standard anomaly (average of historical standard deviation), standard anomaly (ensemble standard deviation), and standard anomaly (pooled historical standard deviation).
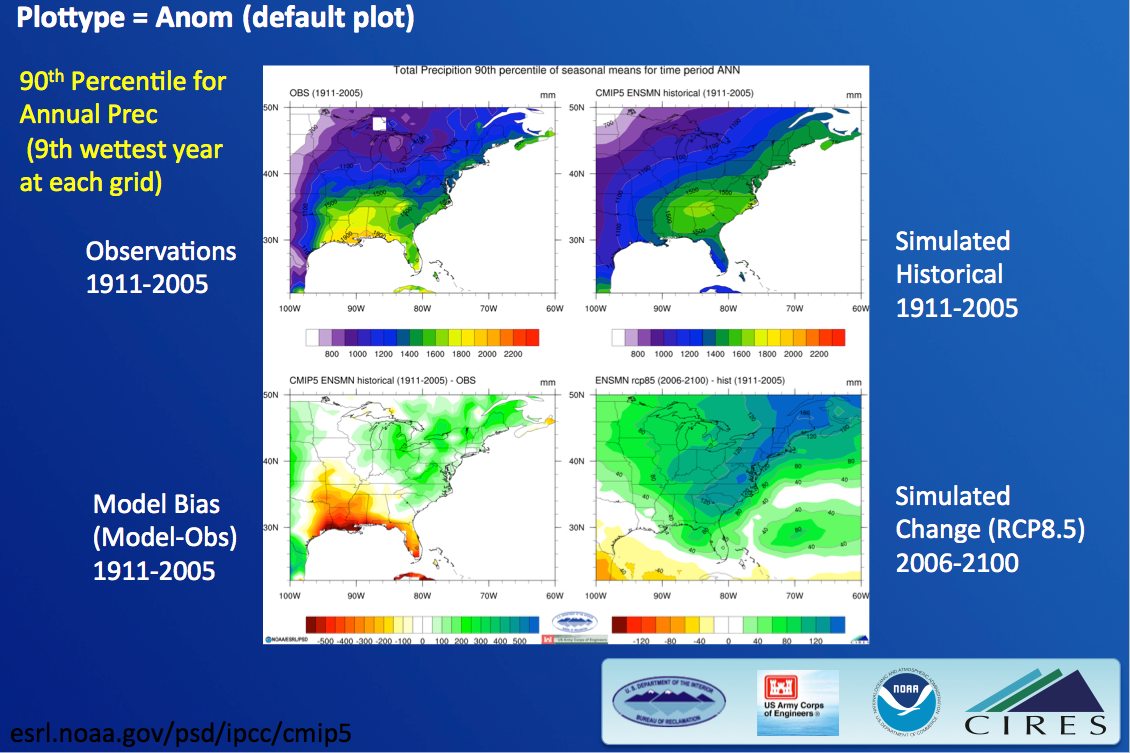
- Anomaly: If the user selects "Anomaly" as the statistic: The climate change panel (upper right) will show the difference in the mean climate in the future time period (RCP8.5 or RCP4.5) compared to the historical reference period. The climate variability panel (lower left) will show the average inter-annual (de-trended) standard deviation for the historical reference period (1956-2005) (or just a single model's historical variability). The change in variability (lower right panel) is expressed as a ratio of the de-trended variance (average or single model) in the future, divided by the past.
- Standard Anomaly (average historical): If the user selects "Standard Anomaly (average historical)" as the statistic: The climate change panel (upper right) will show the difference in the mean climate in the future time period (RCP8.5 or RCP4.5) compared to the historical reference period, but the anomalies will be standardized (normalized) by the de-trended inter-annual standard deviation in the historical period (average of all the models or single model). The two bottom panels will be the same as when "anomaly" is selected. The climate variability panel (lower left) will show the average inter-annual (de-trended) standard deviation for the historical reference period (1956-2005) (or just a single model's historical variability). The change in variability (lower right panel) is expressed as a ratio of the de-trended variance (average or single model) in the future, divided by the past.
The last two options for standardizing by the ensemble spread or the pooled standard deviation apply only when "average of all the models" is chosen. If a single model is chosen with these options, the plot will revert to the "Standard Anomaly" version above.
- Standard Anomaly (ensemble spread): If "standard anomaly (ensemble spread)" is chosen as the statistic: The anomalies will be standardized by the standard deviation of the mean climate (for the historical period) of all the models. The lower left panel will show this ensemble standard deviation and the lower right panel will show the variance ratio of the ensemble spread in future, divided by the past.
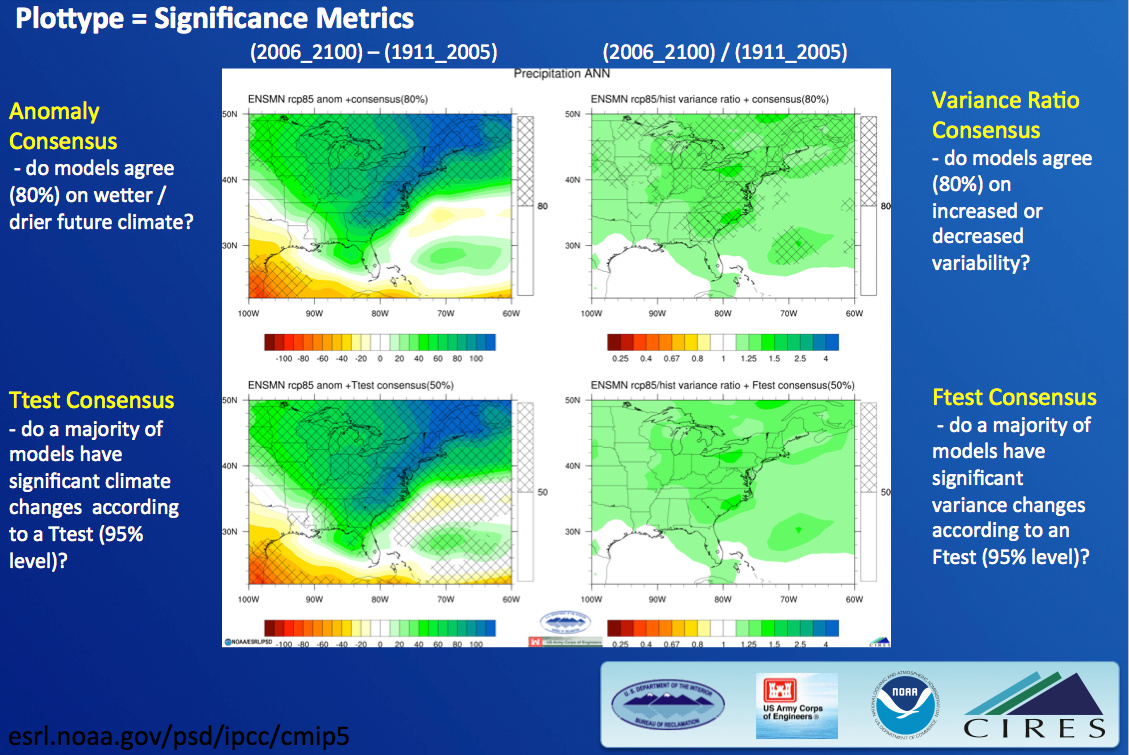
- Standard Anomaly (pooled historical): If "standard anomaly (pooled historical)" is chosen as the statistic: The anomalies will be standardized by the pooled historical standard deviation. Here, seasonal or annual means from each model have their models' climate and trends removed and all the anomalies for each model and year are pooled together and the standard deviation is computed. This standard deviation is shown in the lower left panel. The pooled variance ratios are shown in the lower right panel. Also an fTest for significance at the 99% level is indicated by the hatching. Given the large sample size created by pooling (50years times number of models), changes in variance ratios on the order of 10-20% are significant (number of models ranges from 11-35 depending on variable selected).