Lesley L. Smith – Re. Fire Weather
All plots preliminary.
Re. Fire Weather and Vapor Pressure Deficit Prediction
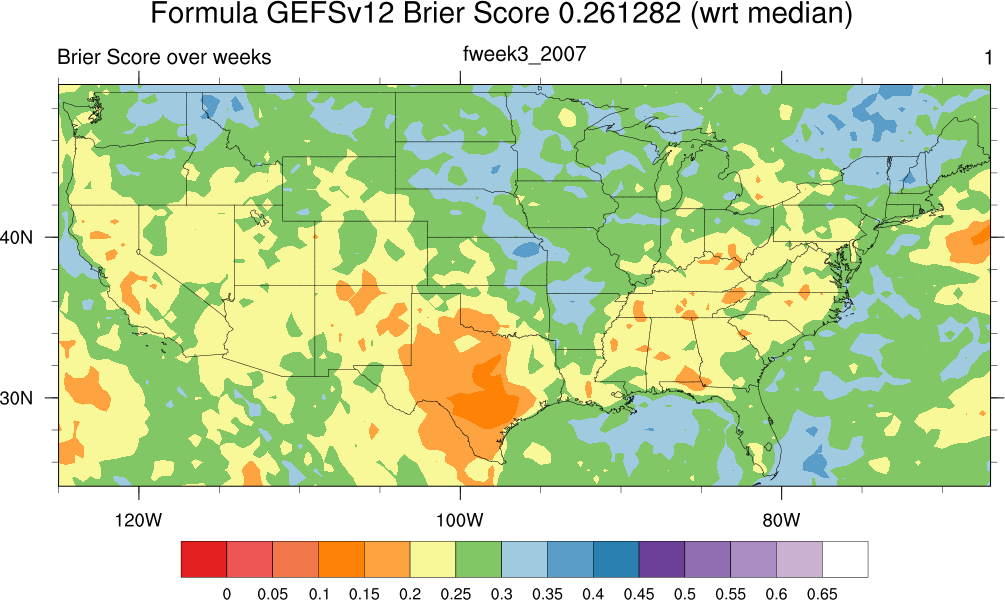
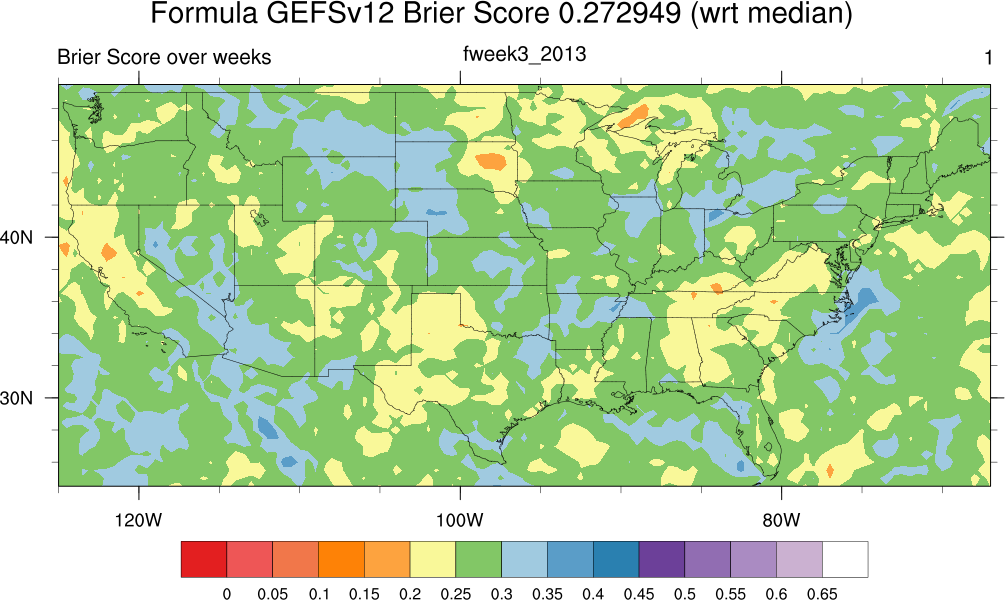
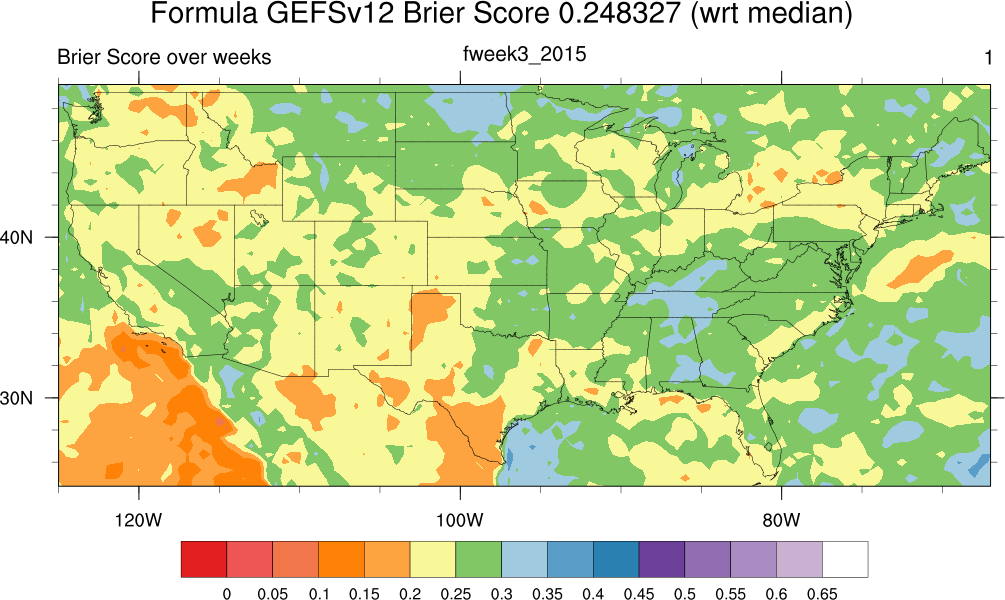
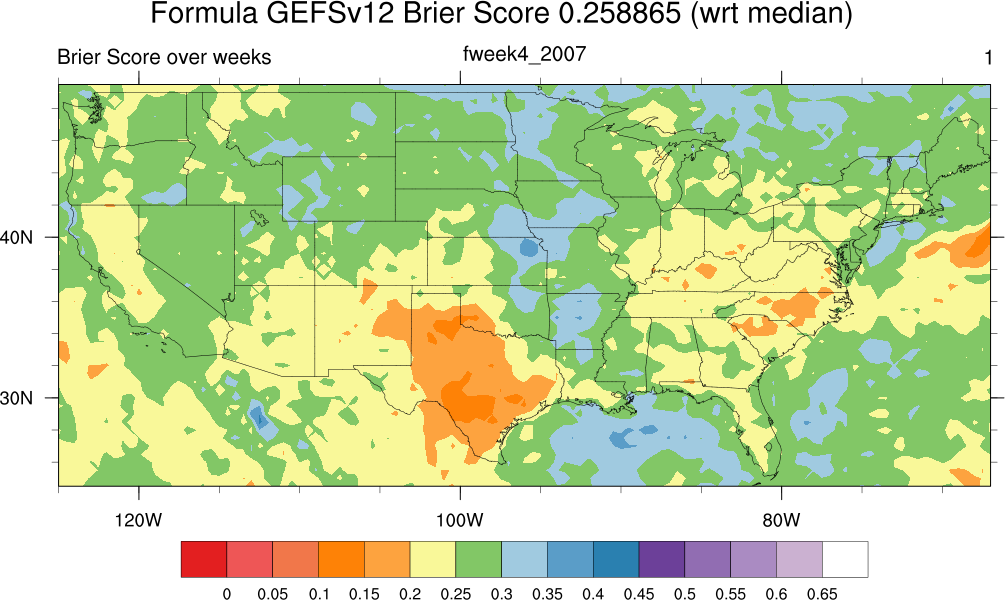
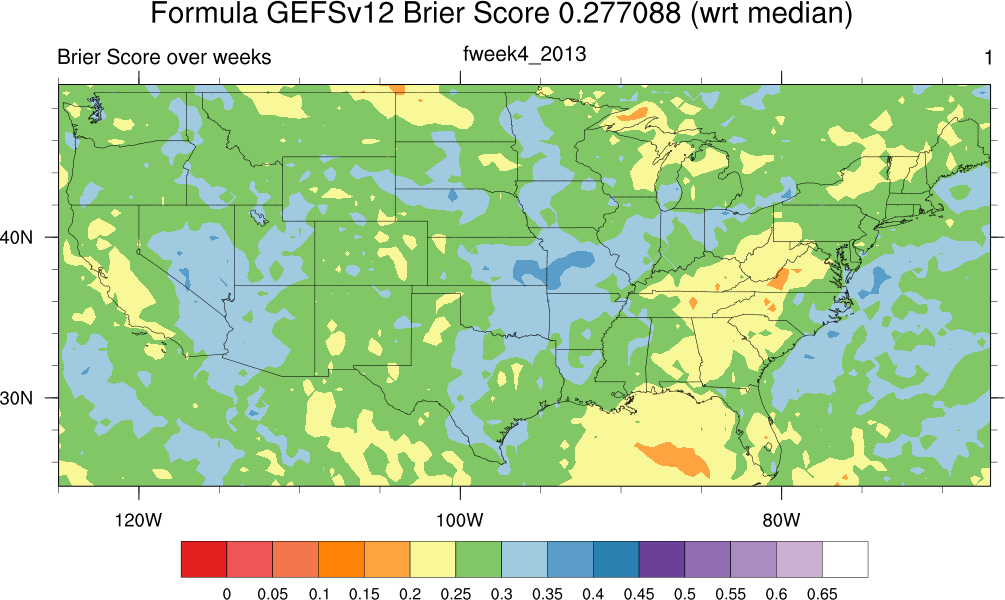
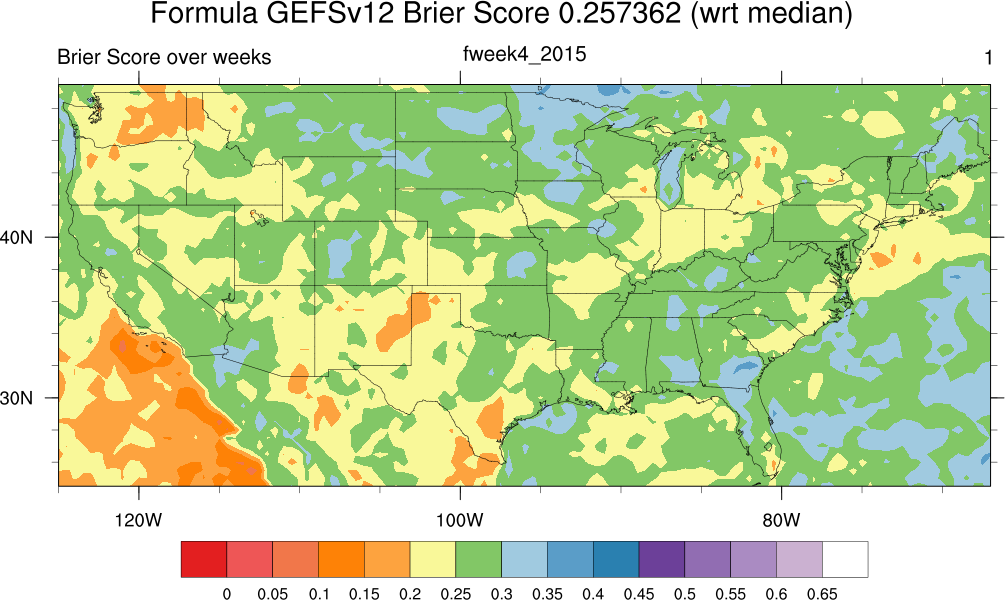
GEFSv12 Reforecast Formula Results
Annual Brier Scores wrt ERA5 median (left), Brier Skill Scores wrt ERA5 median (right)
Forecast_Week3


Forecast_Week4


Sample GEFSv12 Reforecast VPD (via formula) Medians 2000-2019 Forecast_Week3


All GEFSv12 Reforecast VPD (via formula) Medians 2000-2019 Forecast_Week3 here.
Sample GEFSv12 Reforecast VPD (via formula) Medians 2000-2019 Forecast_Week4


All GEFSv12 Reforecast VPD (via formula) Medians 2000-2019 Forecast_Week4 here.
VPD Prediction Preliminary Weekly ML Results (using GEFSv12 Reforecast Fields):
As of ~June 18, 2025 new ML Results
Brier Scores ConUS (Recall smaller is better for Brier Scores.)
| ConUS Brier Scores wrt to medians | ||||||
| 'model' | 2007 | 2013 | 2015 | '07,'13,'15 | ||
| ERA5 | 0.25 | 0.25 | 0.25 | 0.25 | ||
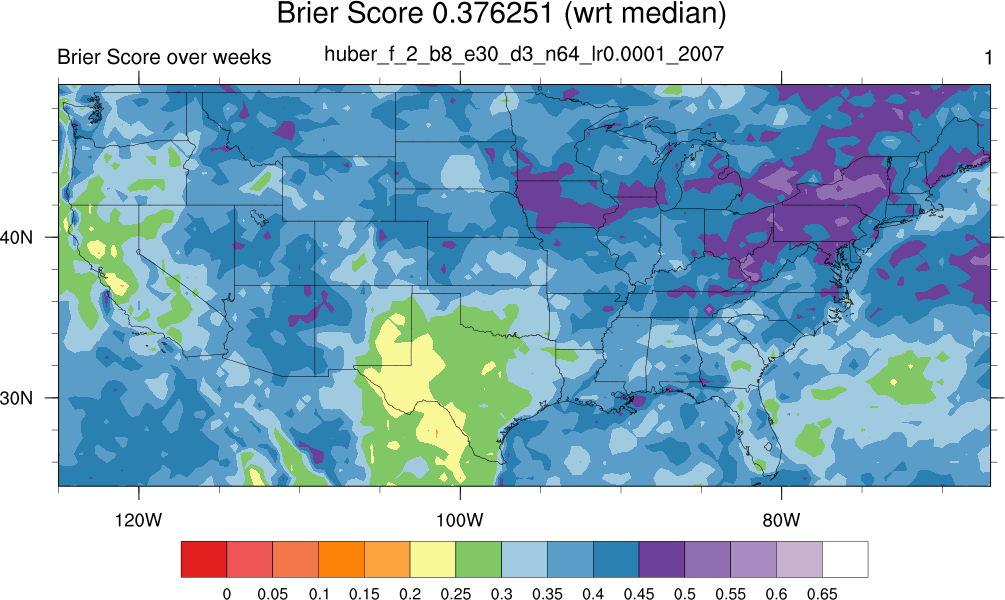
| 2_b8_e30_d3 | 0.376251 | 0.374815 | 0.331634 | 0.360625 | ||
| 2_b8_e30_d4 | 0.3756 | 0.364194 | 0.328073 | 0.355658 | ||
| 2_b8_e50_d3 | 0.36062 | 0.368766 | 0.324143 | 0.351023 | ||
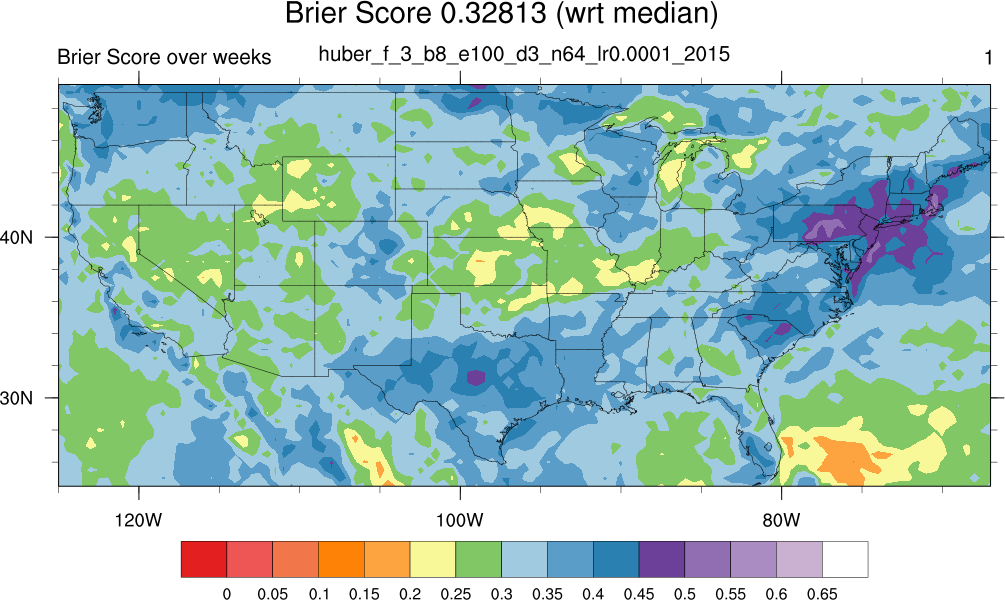
| 3_b8_e100_d3 | 0.368484 | 0.368336 | 0.32813 | 0.354863 | ||
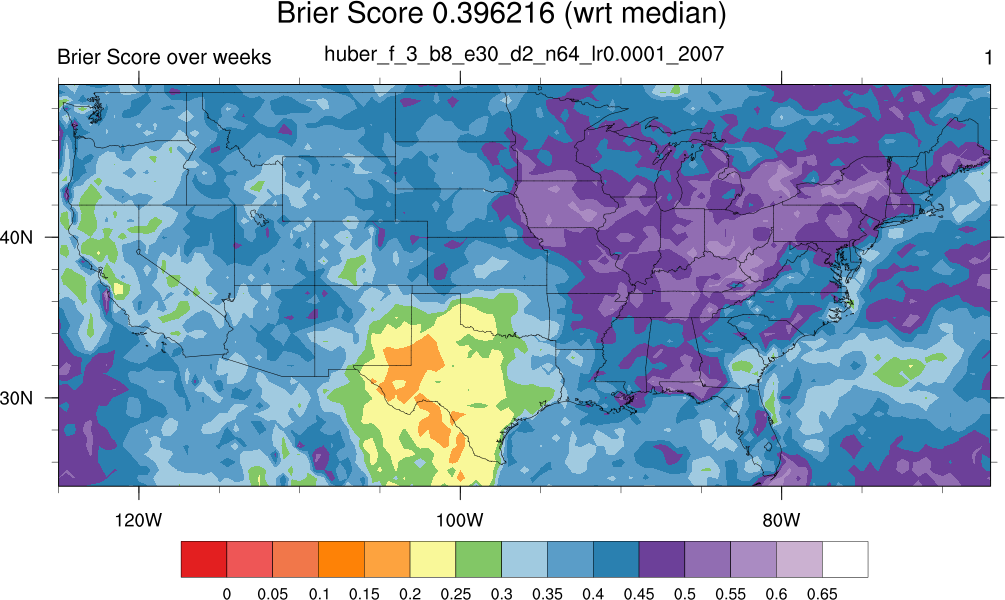
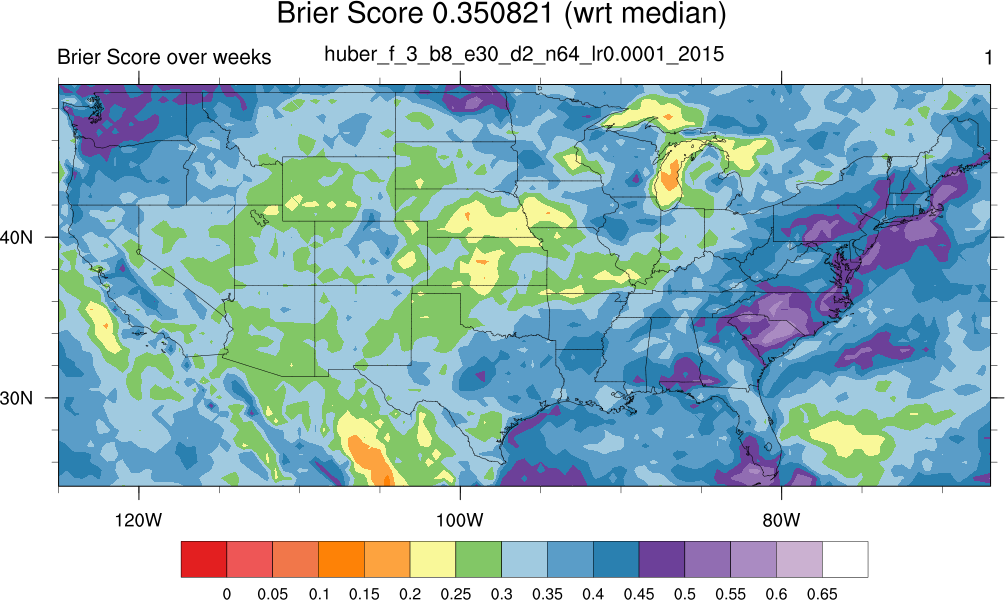
| 3_b8_e30_d2 | 0.396216 | 0.376473 | 0.350821 | 0.374026 | ||
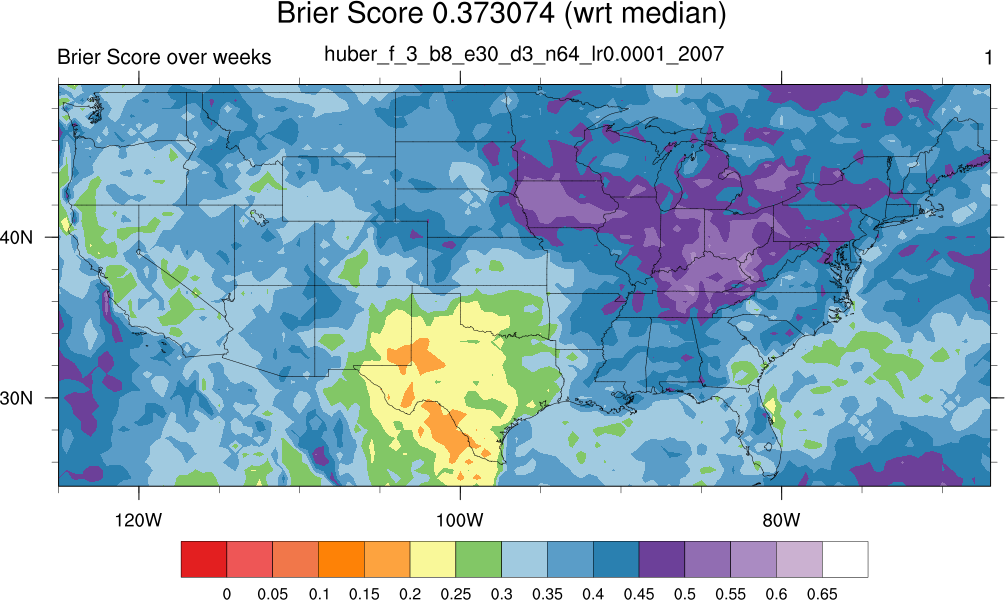
| 3_b8_e30_d3 | 0.373074 | 0.365901 | 0.323276 | 0.354058 | ||
Brier Skill Scores ConUS: (Recall bigger is better for Brier Skill Scores)
| ConUS Brier Skill Scores wrt ERA5 medians | ||||||
| model & ERA5 | 2007 | 2013 | 2015 | '07,'13,'15 | ||
| 2_b8_e30_d3 | -0.505004 | -0.49926 | -0.326534 | -0.442499 | ||
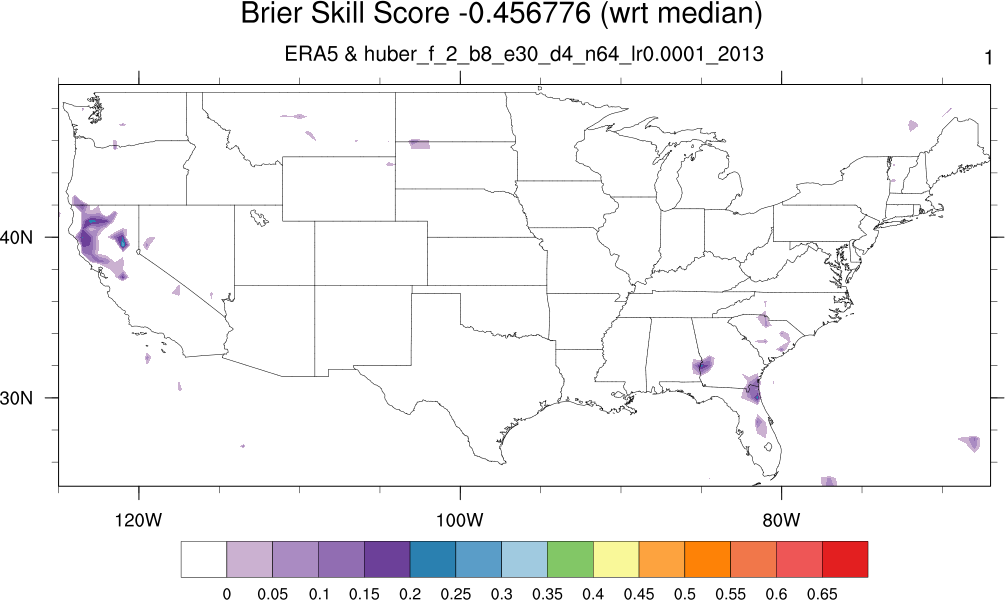
| 2_b8_e30_d4 | -0.502399 | -0.456776 | -0.312293 | -0.422632 | ||
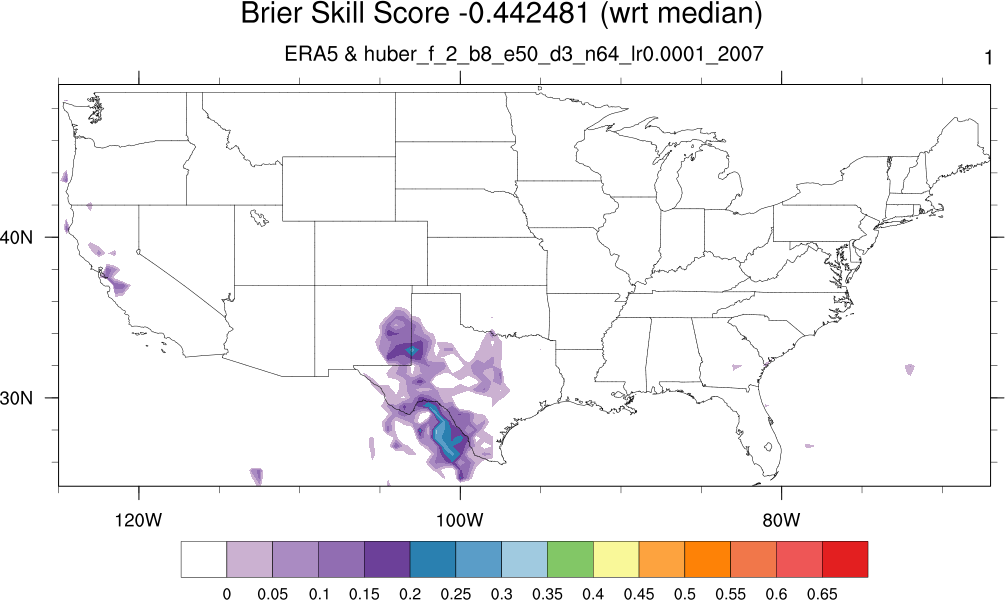
| 2_b8_e50_d3 | -0.442481 | -0.475064 | -0.296571 | -0.404093 | ||
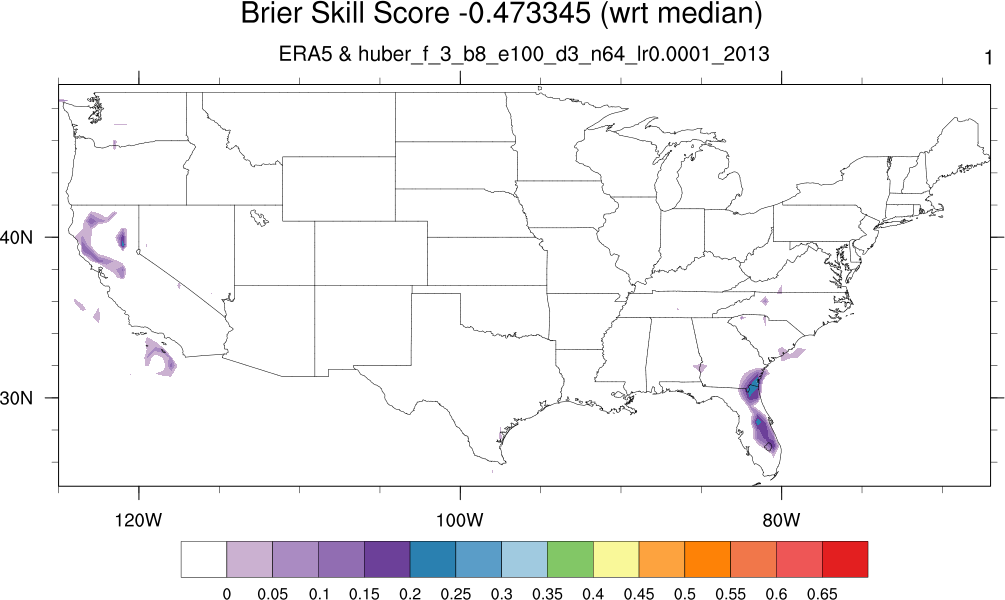
| 3_b8_e100_d3 | -0.473935 | -0.473345 | -0.312518 | -0.419451 | ||
| 3_b8_e30_d2 | -0.584865 | -0.505891 | -0.403286 | -0.496102 | ||
| 3_b8_e30_d3 | -0.492296 | -0.463603 | -0.293105 | -0.416232 | ||
Brier Scores wrt median (left), Brier Skill Scores wrt median (right)
huber_f_2_b8_e30_d3_n64_lr0.0001
2007, 2013, 2015 together


Annual


huber_f_2_b8_e30_d4_n64_lr0.0001
2007, 2013, 2015 together


Annual


huber_f_2_b8_e50_d3_n64_lr0.0001
2007, 2013, 2015 together


Annual


huber_f_3_b8_e100_d3_n64_lr0.0001
2007, 2013, 2015 together
Annual


huber_f_3_b8_e30_d2_n64_lr0.0001
2007, 2013, 2015 together


Annual


huber_f_3_b8_e30_d3_n64_lr0.0001
2007, 2013, 2015 together


Annual


As of ~May 7, 2025 ML Results
Re. Results wrt ERA5 medians:
Brier Scores Western US ocean mask (Recall smaller is better for Brier Scores.)
| W US no ocean Brier Scores wrt to medians | ||||||
| 'model' | 2007 | 2015 | 2007&2015 | JJA 2007&2015 | SON 2007&2015 | Dec 2007&2015 |
| ERA5 | 0.25 | 0.25 | 0.25 | 0.25 | 0.25 | 0.25 |
| 2_huber_d3_lneg4 | 0.3419425 | 0.275556 | 0.3087403 | 0.3991948 | 0.2740875 | 0.4669099 |
| 2_d2_lneg4 | 0.3262246 | 0.2797429 | 0.3029811 | 0.3898132 | 0.2799153 | 0.4907988 |
| 2_d3_lneg3 | 0.3295423 | 0.2897149 | 0.3096128 | 0.4238406 | 0.2690236 | 0.4976424 |
| 2_d3_lneg4 | 0.3325066 | 0.2888968 | 0.3106851 | 0.394838 | 0.2766225 | 0.4949397 |
| 2_d3_lneg5 | 0.3244863 | 0.2794827 | 0.3019622 | 0.3973457 | 0.2498438 | 0.4884303 |
| 3_huber_d3_lneg4 | 0.3140458 | 0.281599 | 0.2977996 | 0.3622578 | 0.280235 | 0.4798047 |
| 3_d3_lneg4 | 0.3359029 | 0.2740139 | 0.3049297 | 0.398564 | 0.2756201 | 0.501361 |
Brier Skill Scores Western US ocean mask: (Recall bigger is better for Brier Skill Scores)
| W US no ocean Brier Skill Scores wrt ERA5 medians | ||||||
| model & ERA5 | 2007 | 2015 | 2007&2015 | JJA 2007&2015 | SON 2007&2015 | Dec 2007&2015 |
| 2_huber_d3_lneg4 | -0.569209 | -0.2645584 | -0.4168408 | -0.8319457 | -0.2578151 | -1.142697 |
| 2_d2_lneg4 | -0.4970779 | -0.2837684 | -0.3904113 | -0.7888921 | -0.2845596 | -1.252326 |
| 2_d3_lneg3 | -0.5123031 | -0.3295312 | -0.4208443 | -0.9450476 | -0.2345767 | -1.283731 |
| 2_d3_lneg4 | -0.5259067 | -0.3257767 | -0.4257655 | -0.8119515 | -0.2694486 | -1.271328 |
| 2_d3_lneg5 | -0.4891007 | -0.2825743 | -0.385735 | -0.8234597 | -0.1465584 | -1.241456 |
| 3_huber_d3_lneg4 | -0.441188 | -0.2922863 | -0.3666326 | -0.662438 | -0.286027 | -1.201872 |
| 3_d3_lneg4 | -0.5414923 | -0.2574778 | -0.3993533 | -0.8290507 | -0.2648486 | -1.300797 |
Brier Scores ConUS (Recall smaller is better for Brier Scores.)
| ConUS Brier Scores wrt to medians | ||||||
| 'model' | 2007 | 2015 | 2007&2015 | JJA 2007&2015 | SON 2007&2015 | Dec 2007&2015 |
| ERA5 | 0.25 | 0.25 | 0.25 | 0.25 | 0.25 | 0.25 |
| 2_huber_d3_lneg4 | 0.384096 | 0.330623 | 0.357532 | 0.394482 | 0.323358 | 0.411429 |
| 2_d2_lneg4 | 0.374851 | 0.334863 | 0.355093 | 0.385687 | 0.3302 | 0.425289 |
| 2_d3_lneg3 | 0.387253 | 0.340304 | 0.364036 | 0.413329 | 0.32696 | 0.435745 |
| 2_d3_lneg4 | 0.385553 | 0.342858 | 0.364381 | 0.395219 | 0.324659 | 0.433058 |
| 2_d3_lneg5 | 0.377254 | 0.343569 | 0.360616 | 0.377328 | 0.332283 | 0.449319 |
| 3_huber_d3_lneg4 | 0.373182 | 0.340447 | 0.357095 | 0.386078 | 0.3299 | 0.412178 |
| 3_d3_lneg4 | 0.389623 | 0.328477 | 0.359195 | 0.398371 | 0.323156 | 0.442922 |
Brier Skill Scores ConUS: (Recall bigger is better for Brier Skill Scores)
| ConUS Brier Skill Scores wrt ERA5 medians | ||||||
| model & ERA5 | 2007 | 2015 | 2007&2015 | JJA 2007&2015 | SON 2007&2015 | Dec 2007&2015 |
| 2_huber_d3_lneg4 | -0.536383 | -0.322494 | -0.430129 | -0.577926 | -0.29343 | -0.645716 |
| 2_d2_lneg4 | -0.499402 | -0.339452 | -0.420371 | -0.542749 | -0.320802 | -0.701154 |
| 2_d3_lneg3 | -0.549012 | -0.361215 | -0.456143 | -0.653317 | -0.307841 | -0.742982 |
| 2_d3_lneg4 | -0.542212 | -0.371432 | -0.457524 | -0.580877 | -0.298635 | -0.732233 |
| 2_d3_lneg5 | -0.509016 | -0.374274 | -0.442465 | -0.509312 | -0.329131 | -0.797278 |
| 3_huber_d3_lneg4 | -0.492727 | -0.36179 | -0.428379 | -0.544314 | -0.319602 | -0.648714 |
| 3_d3_lneg4 | -0.558491 | -0.313906 | -0.436779 | -0.593485 | -0.292625 | -0.77169 |
Re. Results wrt ERA5 upper terciles:
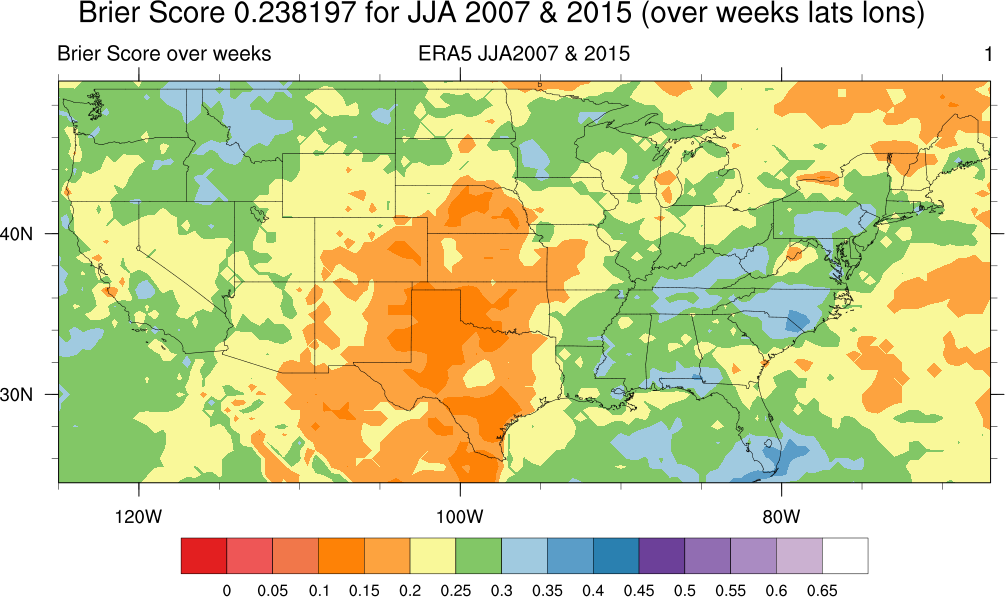
Brier Scores, where the ML predicted probabilities are computed with respect to the ERA5 2000-2019 upper terciles,
and the actual outcomes are computed with respect to the specific ERA5 VPD value for that week.
(Recall smaller is better for Brier Scores.)
| ConUS Brier Scores wrt to upper terciles | ||||||
| 'model' | 2007 | 2015 | 2007&2015 | JJA 2007&2015 | SON 2007&2015 | Dec 2007&2015 |
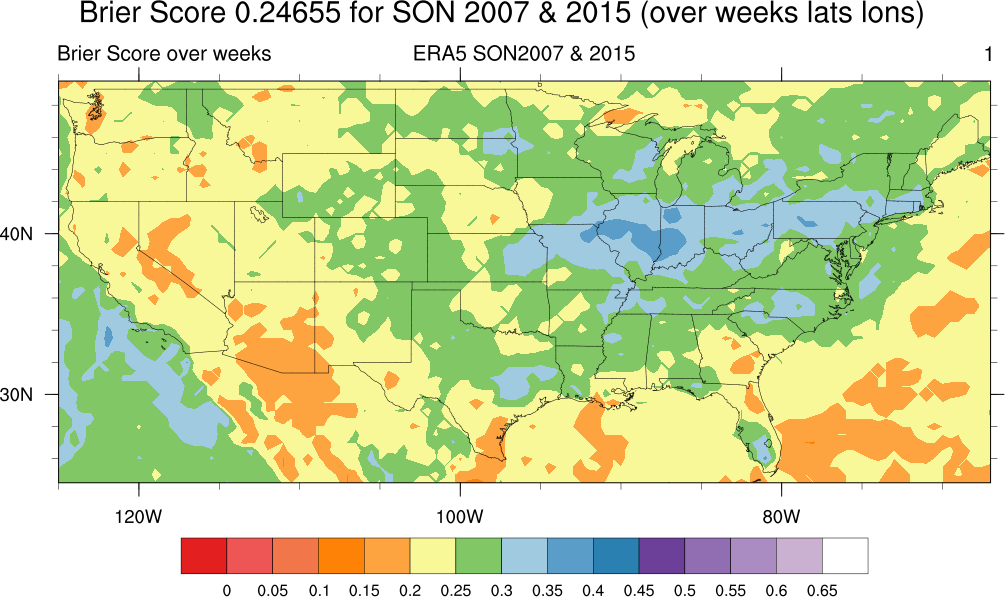
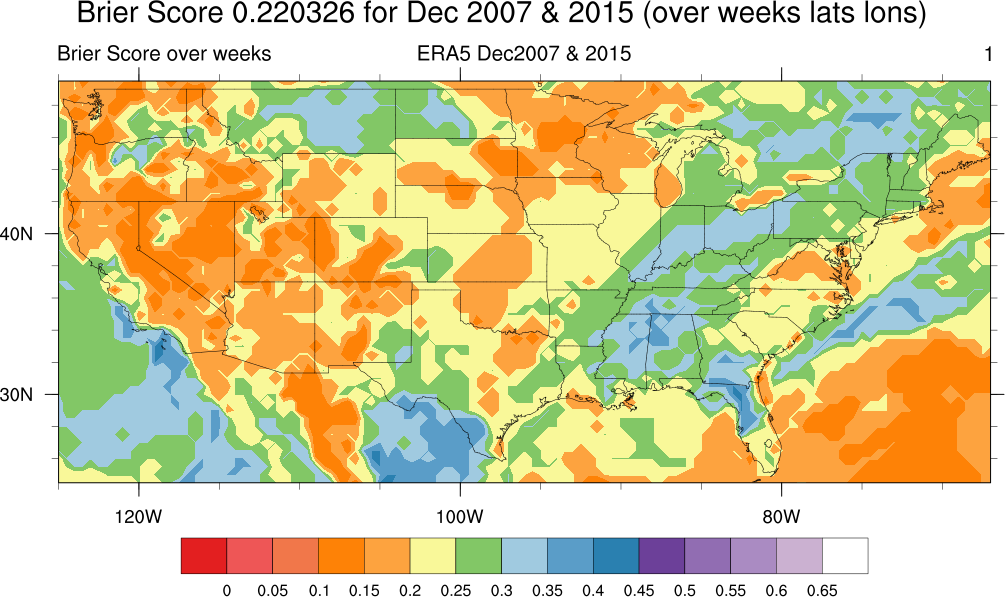
| ERA5 | 0.237383 | 0.238319 | 0.237347 | 0.238197 | 0.24655 | 0.220326 |
| 2_huber_d3_lneg4 | 0.373475 | 0.319109 | 0.346503 | 0.332551 | 0.312885 | 0.479503 |
| 2_d2_lneg4 | 0.364567 | 0.32929 | 0.347203 | 0.325249 | 0.315754 | 0.496478 |
| 2_d3_lneg3 | 0.382758 | 0.333295 | 0.358289 | 0.339416 | 0.323866 | 0.517063 |
| 2_d3_lneg4 | 0.37944 | 0.334871 | 0.357435 | 0.328859 | 0.319809 | 0.502395 |
| 2_d3_lneg5 | 0.37219 | 0.340625 | 0.356606 | 0.323132 | 0.320929 | 0.520473 |
| 3_huber_d3_lneg4 | 0.360221 | 0.329171 | 0.344986 | 0.322452 | 0.323774 | 0.467168 |
| 3_d3_lneg4 | 0.385019 | 0.322363 | 0.353904 | 0.335768 | 0.315455 | 0.521186 |
Brier Skill Scores: (Recall bigger is better for Brier Skill Scores)
| ConUS Brier Skill Scores wrt ERA5 high terciles | ||||||
| model & ERA5 | 2007 | 2015 | 2007&2015 | JJA 2007&2015 | SON 2007&2015 | Dec 2007&2015 |
| 2_huber_d3_lneg4 | -0.608556 | -0.365247 | -0.490641 | -0.396117 | -0.269054 | -1.17633 |
| 2_d2_lneg4 | -0.566436 | -0.387571 | -0.481142 | -0.365459 | -0.280689 | -1.25338 |
| 2_d3_lneg3 | -0.635313 | -0.403437 | -0.523291 | -0.424937 | -0.313592 | -1.34681 |
| 2_d3_lneg4 | -0.62199 | -0.41251 | -0.521205 | -0.380615 | -0.297134 | -1.28023 |
| 2_d3_lneg5 | -0.599689 | -0.427974 | -0.517673 | -0.356572 | -0.301676 | -1.36228 |
| 3_huber_d3_lneg4 | -0.56295 | -0.429798 | -0.501385 | -0.353719 | -0.313218 | -1.12035 |
| 3_d3_lneg4 | -0.651208 | -0.397291 | -0.529088 | -0.409622 | -0.279477 | -1.36552 |
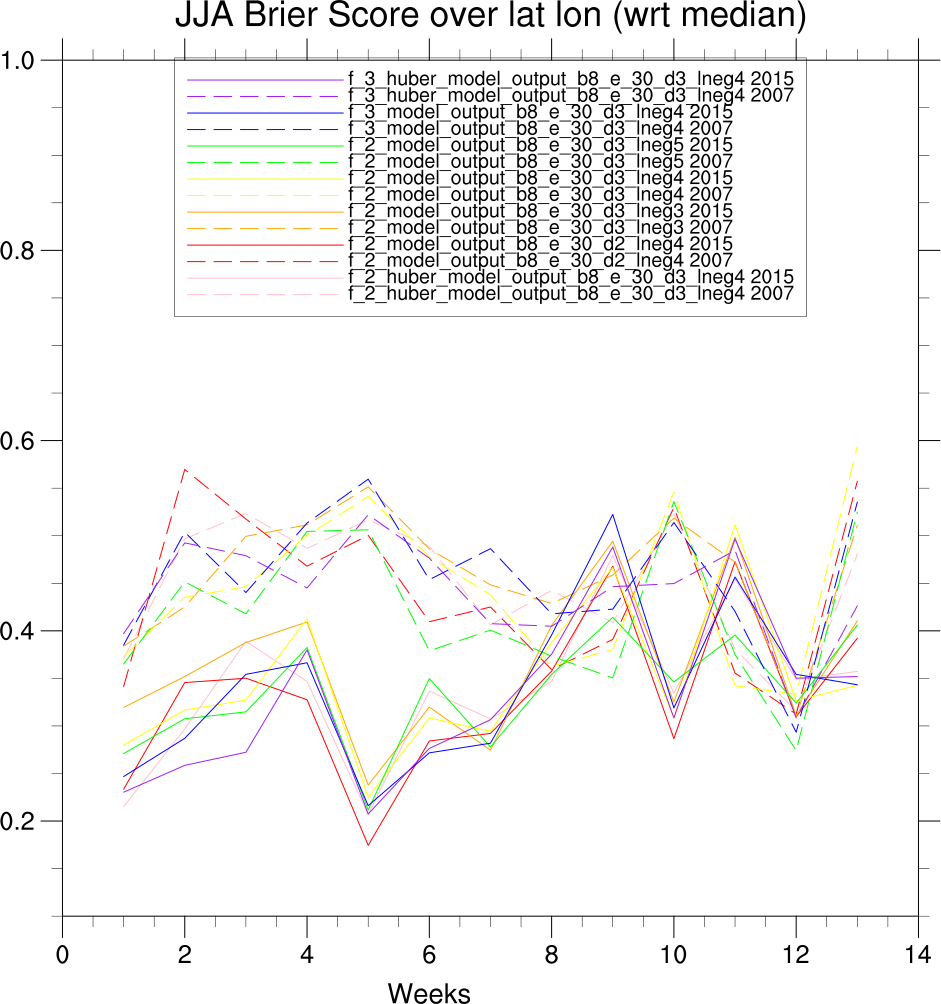
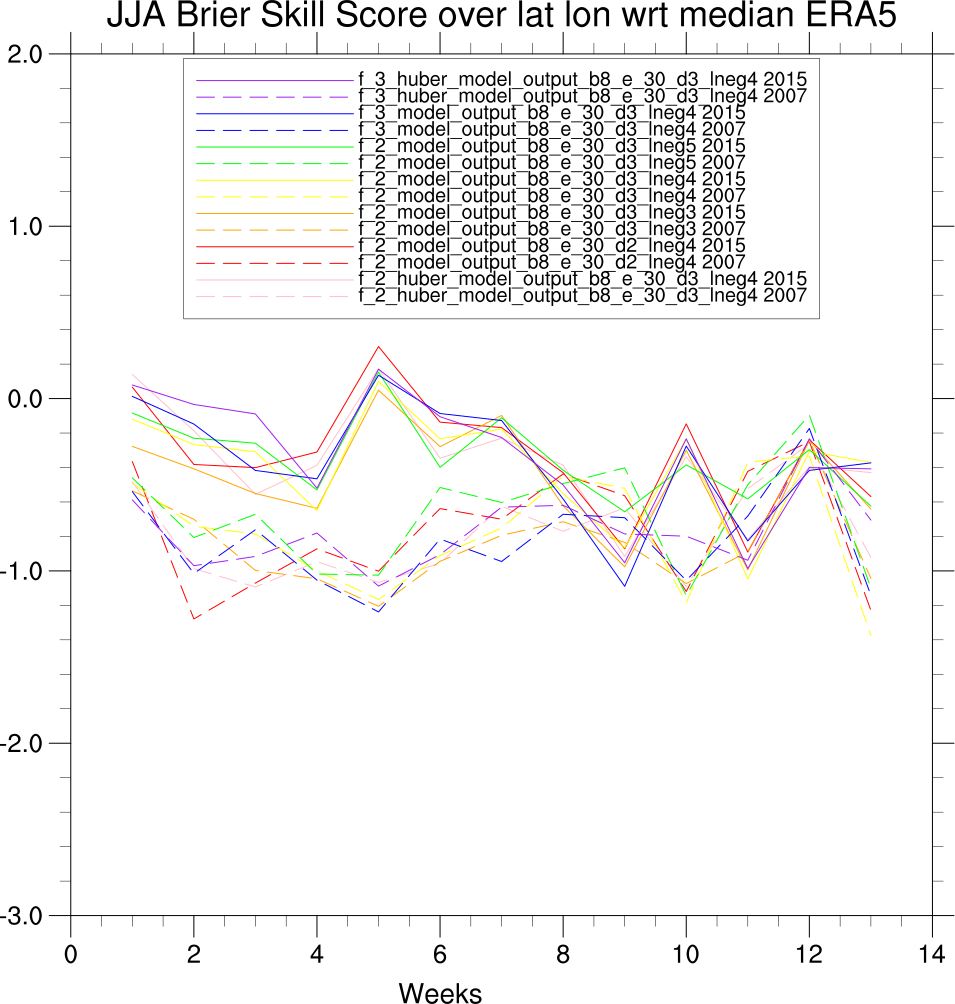
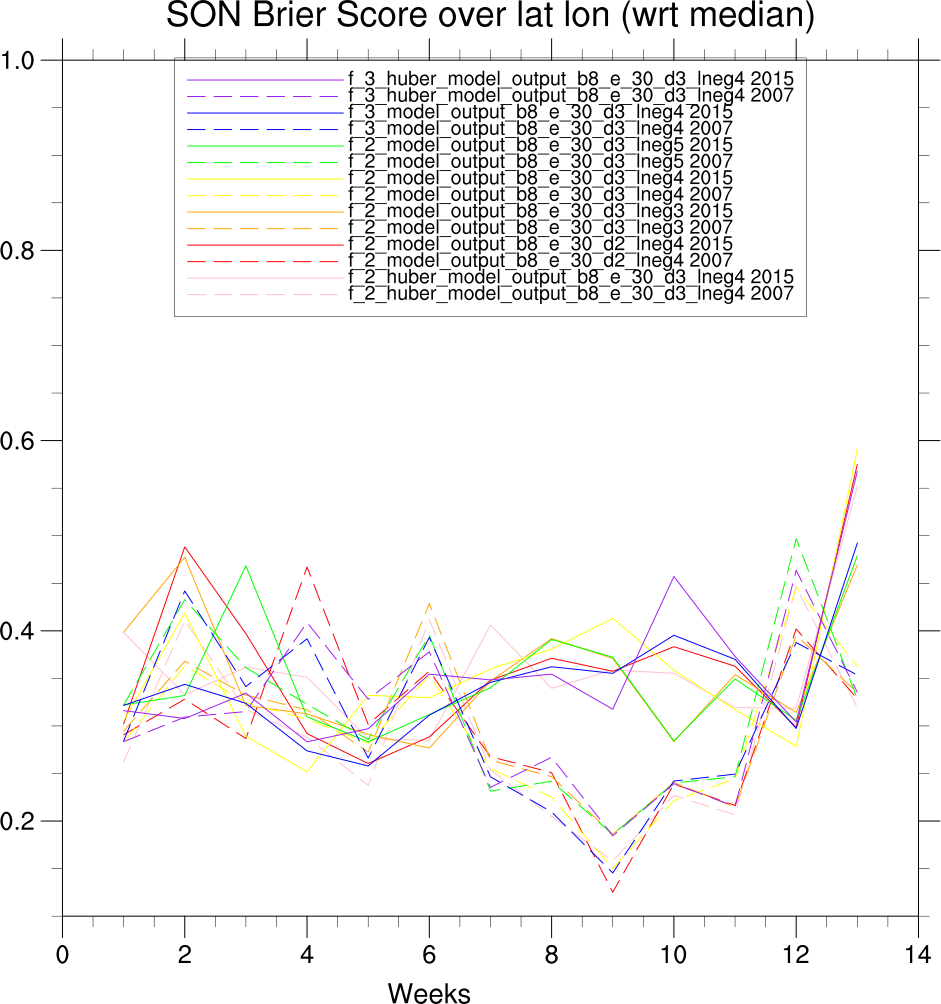
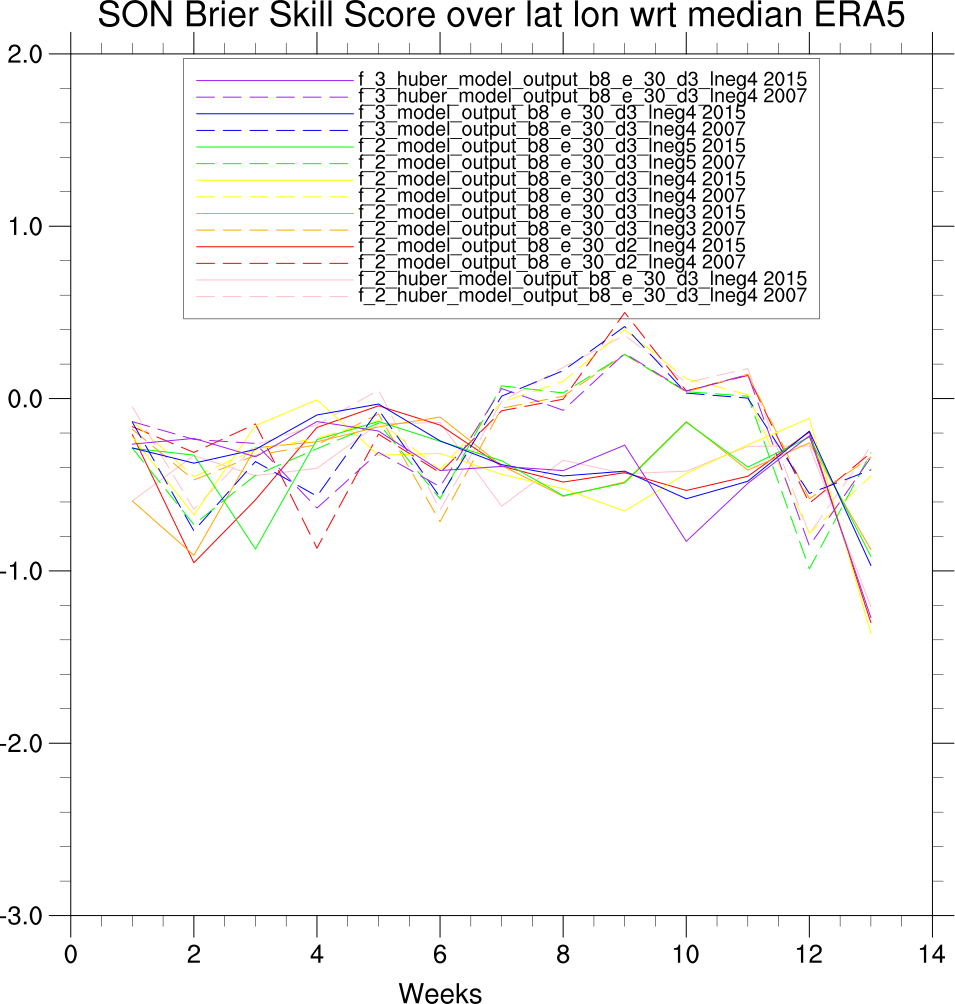
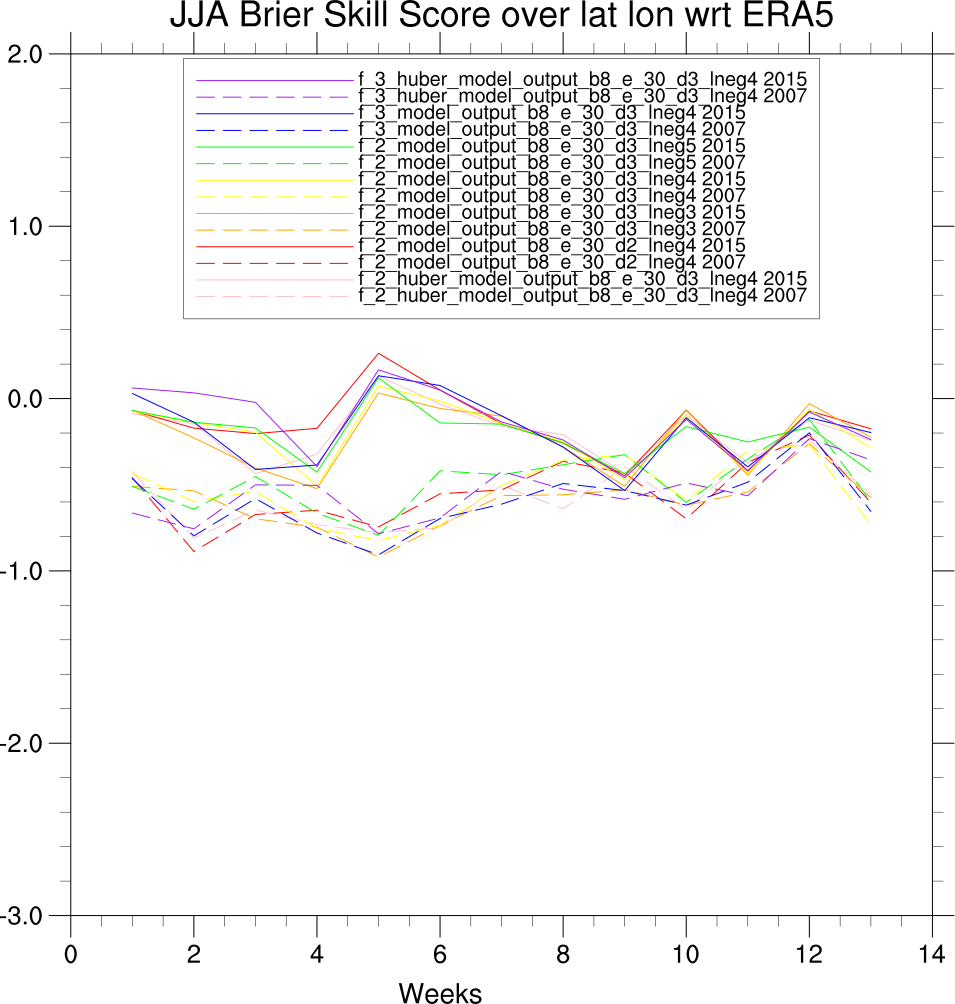
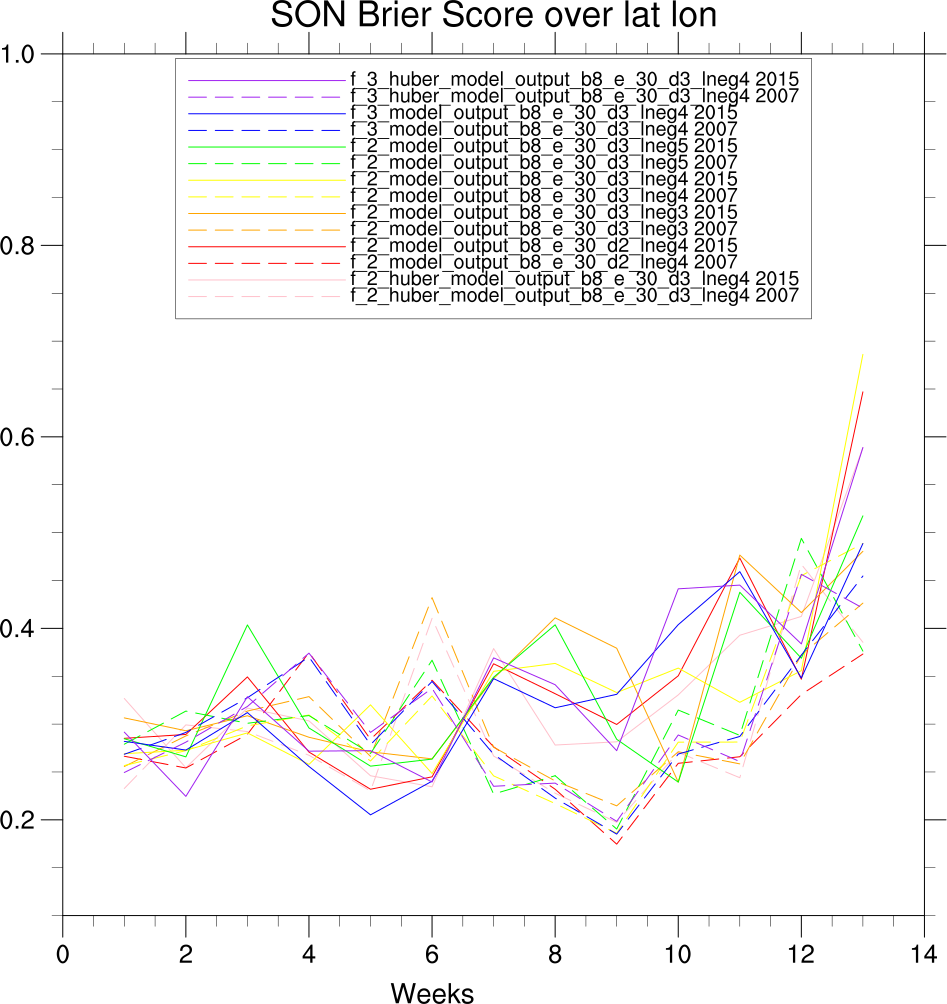
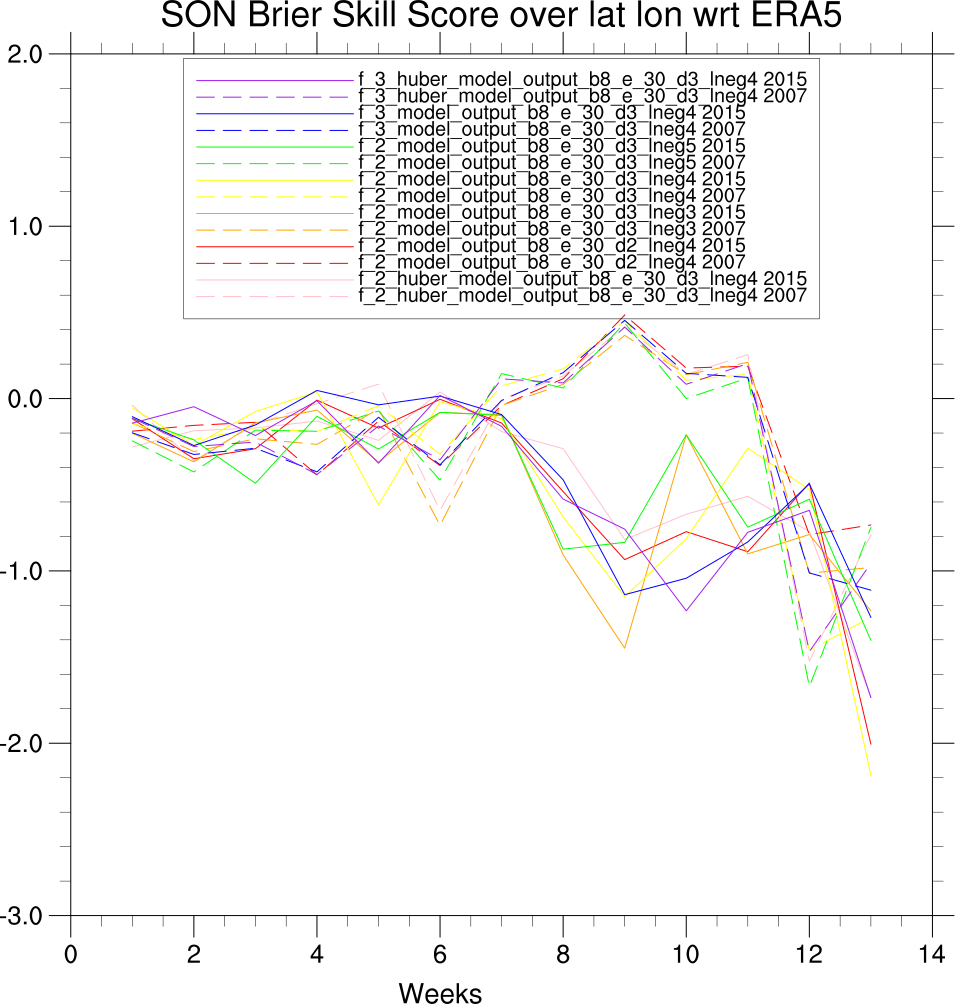
Seasonal Brier Score Timeseries (left) and Brier Skill Score wrt ERA5 medians Timeseries (right)
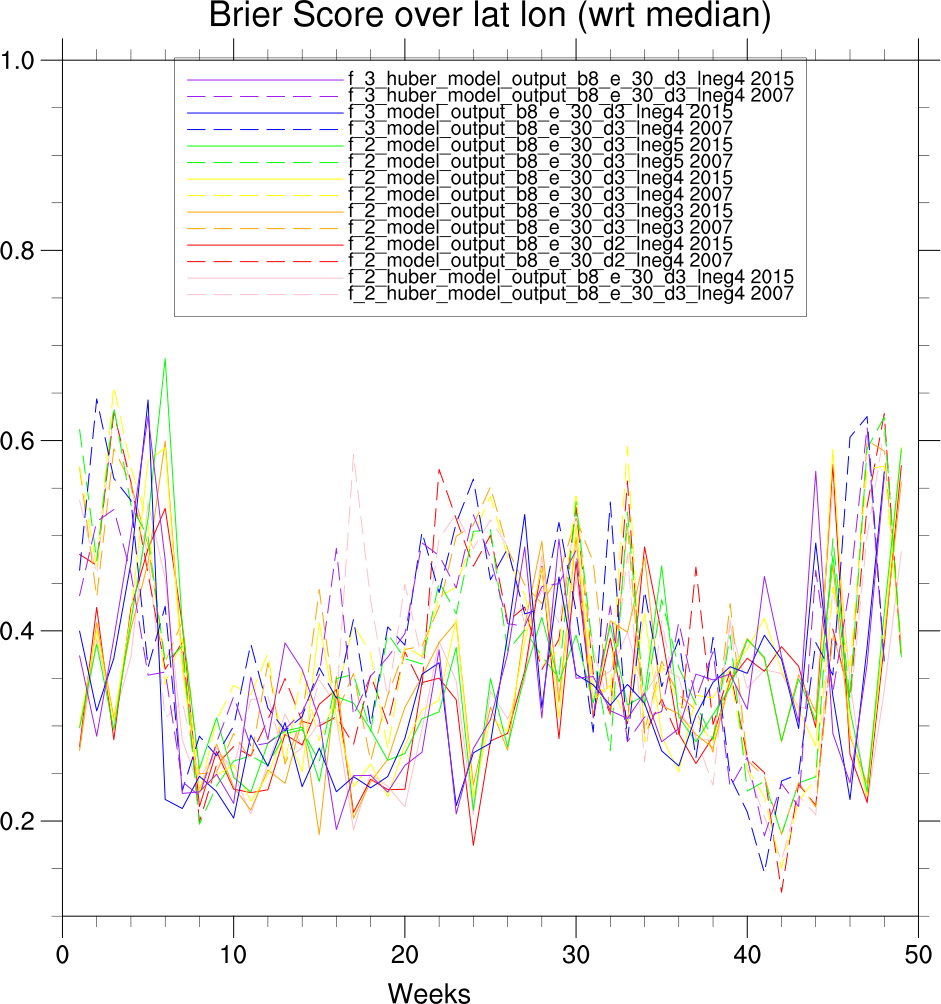
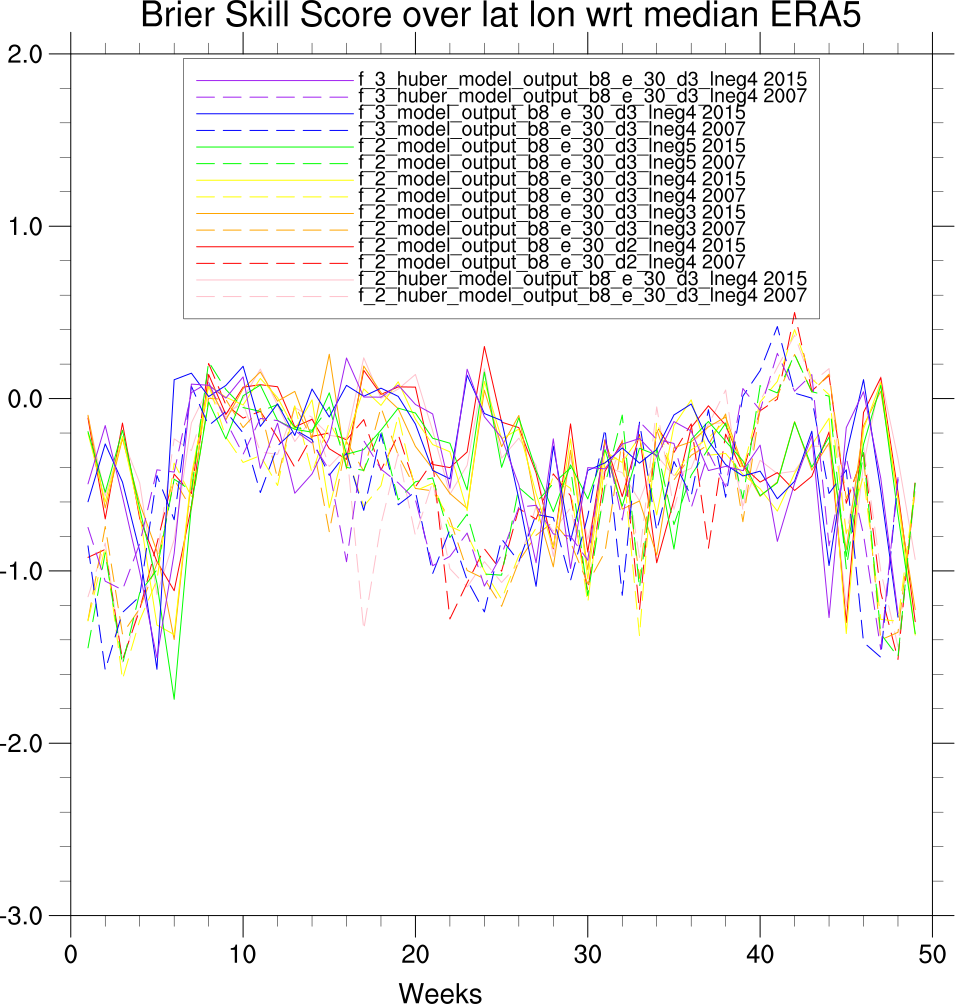
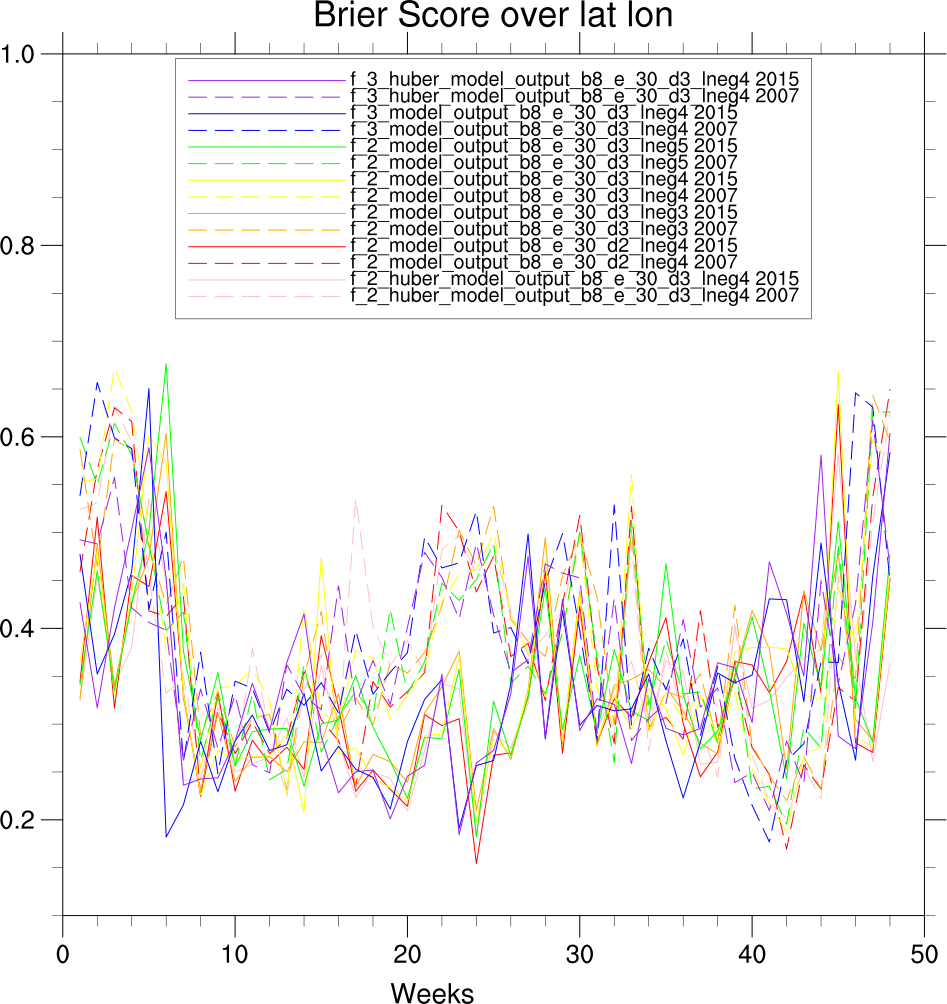
Annual Brier Score Timeseries (left) and Brier Skill Score Timeseries wrt ERA5 medians (right)
Seasonal Brier Score Timeseries (left) and Brier Skill Score wrt ERA5 medians Timeseries (right)
Annual Brier Score Timeseries (left) and Brier Skill Score Timeseries wrt ERA5 medians (right)
Seasonal Brier Score Timeseries (left) and Brier Skill Score wrt ERA5 high terciles Timeseries (right)

Annual Brier Score Timeseries (left) and Brier Skill Score Timeseries wrt ERA5 high terciles (right)
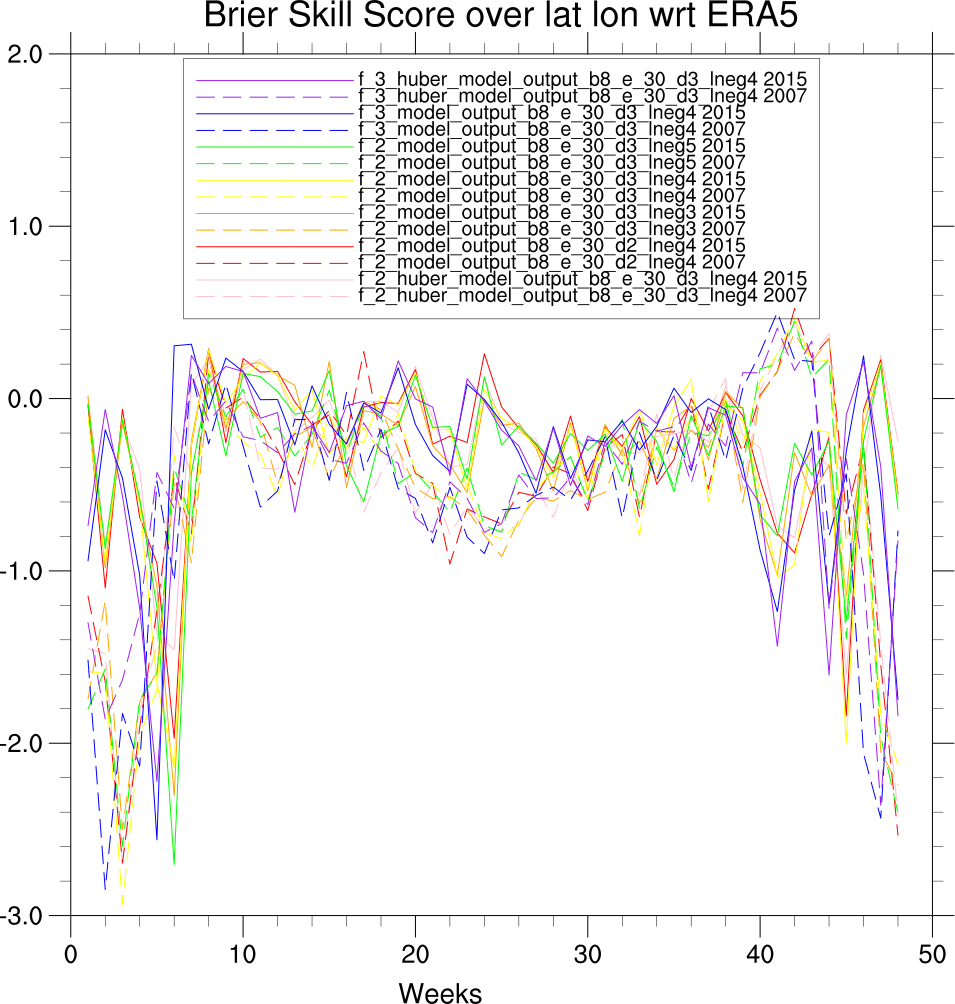
Seasonal Brier Score Timeseries (left) and Brier Skill Score wrt ERA5 high terciles Timeseries (right)
Annual Brier Score Timeseries (left) and Brier Skill Score Timeseries wrt ERA5 high terciles (right)
ML Brier Results map plots wrt to ERA5 medians were moved to individual model pages below.
ML Brier Results map plots wrt to ERA5 high terciles were moved to individual model pages below.
f_2_huber_model_output_b8_e_30_d3_lneg4 Results
f_2_model_output_b8_e_30_d2_lneg4 Results
f_2_model_output_b8_e_30_d3_lneg3 Results
f_2_model_output_b8_e_30_d3_lneg4 Results
f_2_model_output_b8_e_30_d3_lneg5 Results
f_3_huber_model_output_b8_e_30_d3_lneg4 Results
f_3_model_output_b8_e_30_d3_lneg4 Results
For Reference, Weekly: (all via formula)
2007_ERA5_VPD 2015_ERA5_VPD 2007_Reforecast_VPD 2015_Reforecast_VPD
Week1 GEFSv12_Reforecast minus ERA5 (all via formula)
Diffs_Week1_2007_Reforecast_ERA5_VPD Diffs_Week1_2015_Reforecast_ERA5_VPD
Results from ~April 23, 2025 here
Results from ~April 9, 2025 here
ECMWF Reanalysis (ERA5) Data
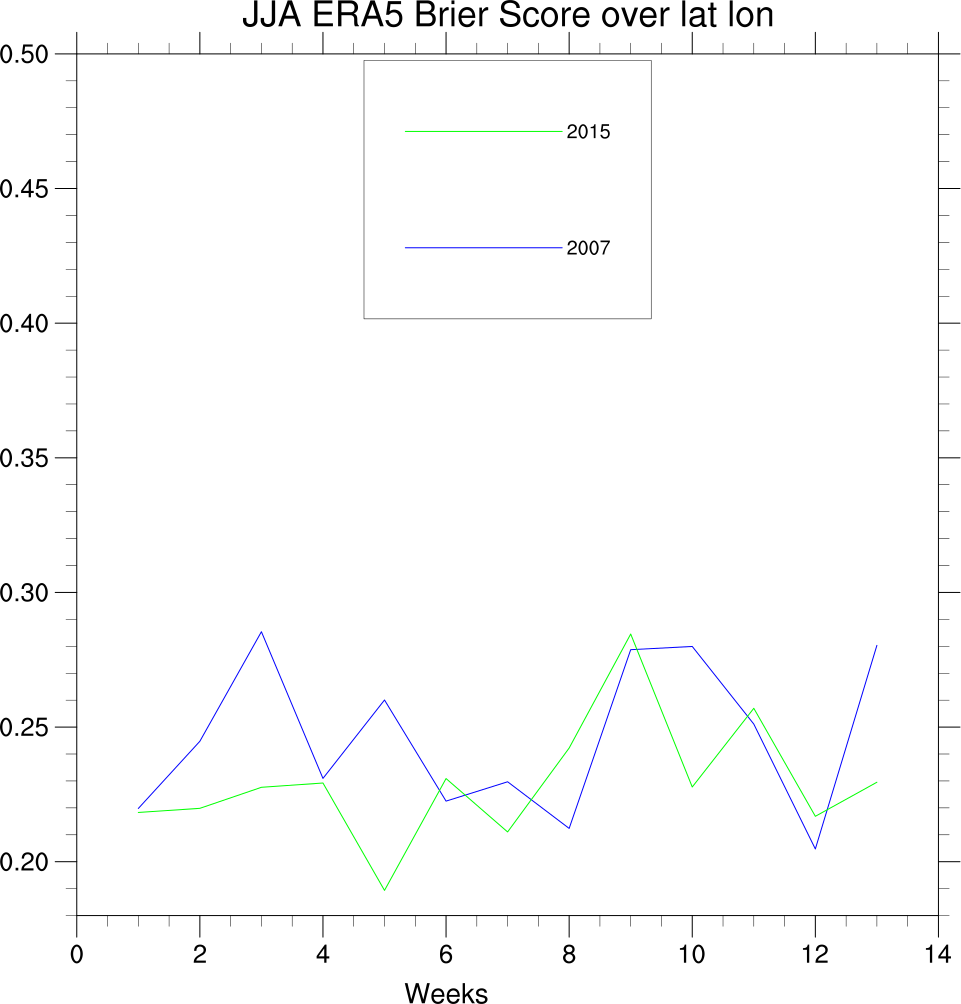
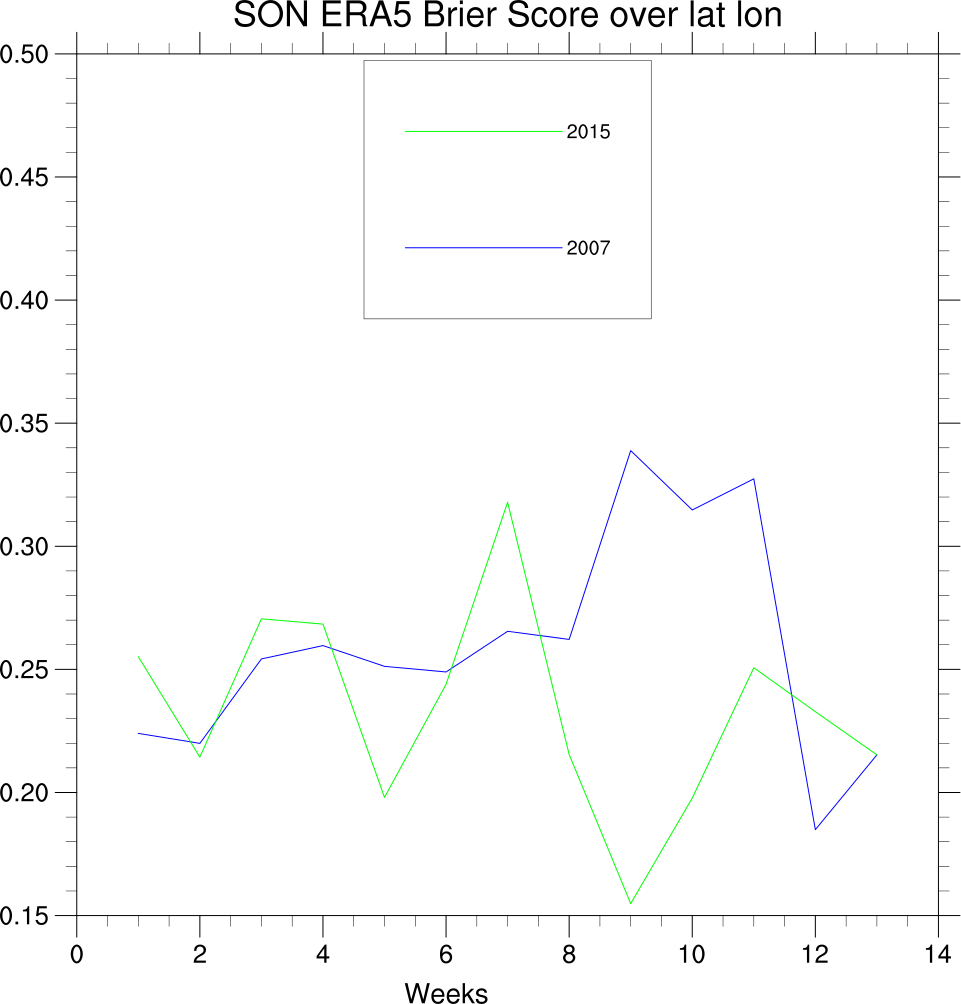
Brier Score Timeseries wrt high terciles
Seasonal JJA & SON for 2007 & 2015 wrt high terciles
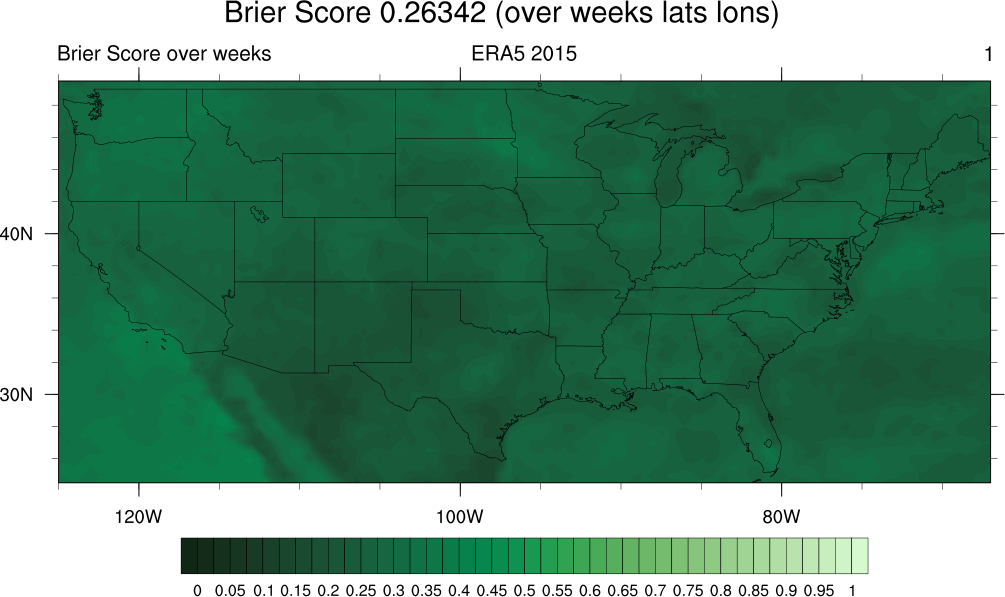
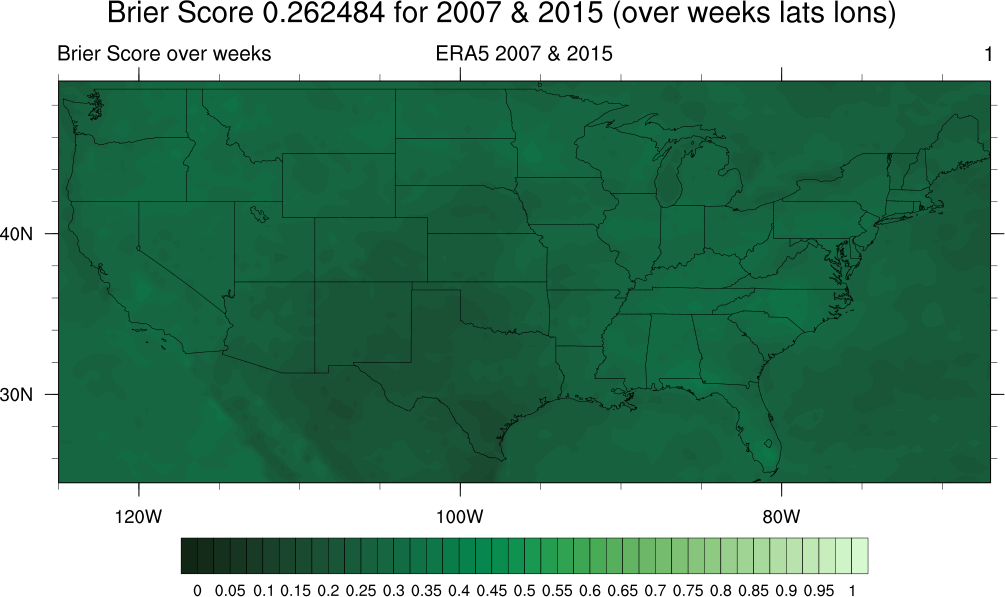
Annual wrt high terciles

Brier Score Maps wrt to high terciles
Seasonal JJA & SON for 2007 & 2015 wrt high terciles
Monthly Dec for 2007 & 2015 wrt high terciles
Annual wrt high terciles

Sample ERA5 VPD High Terciles 2000-2019:
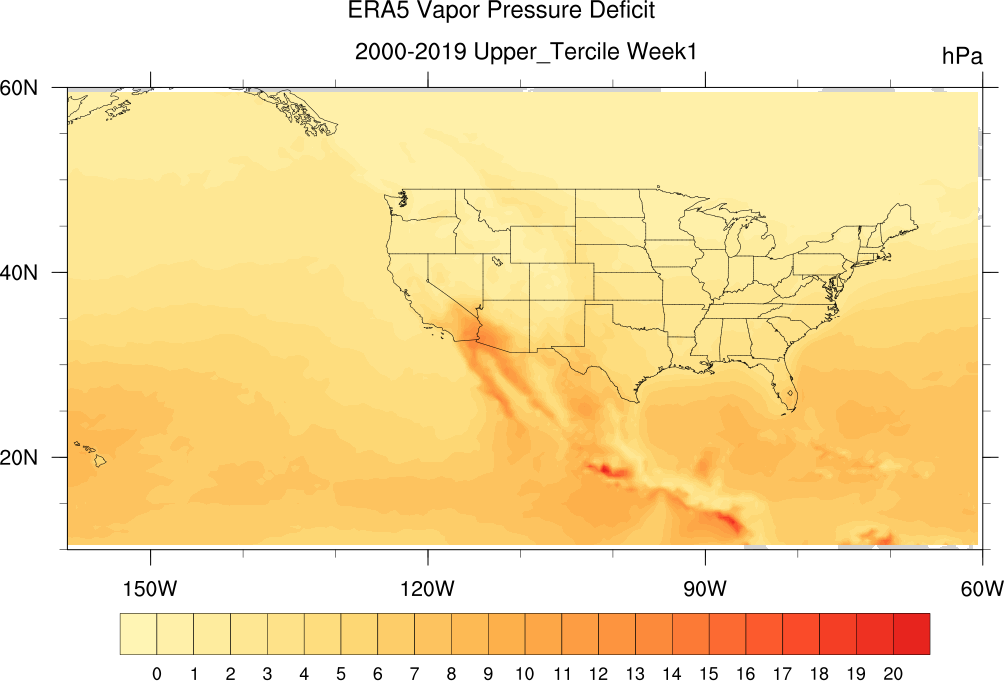
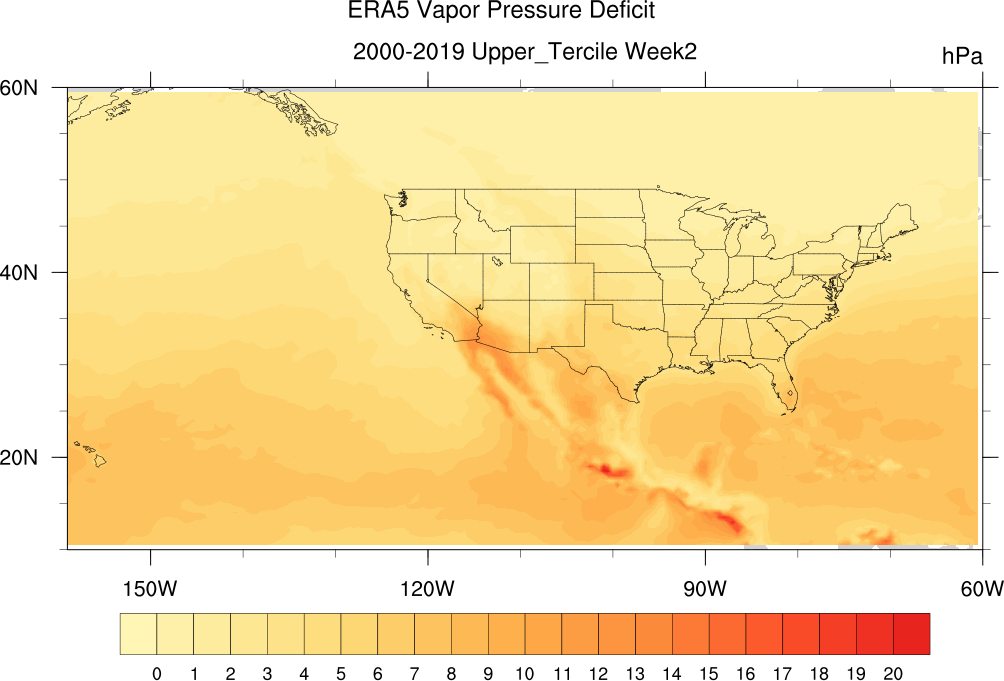
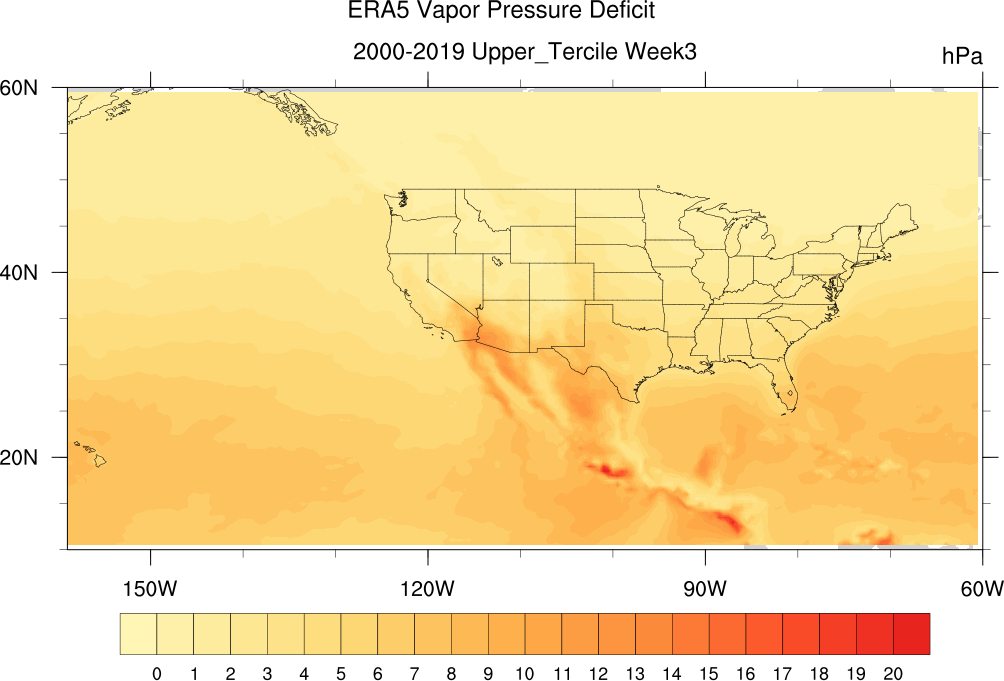
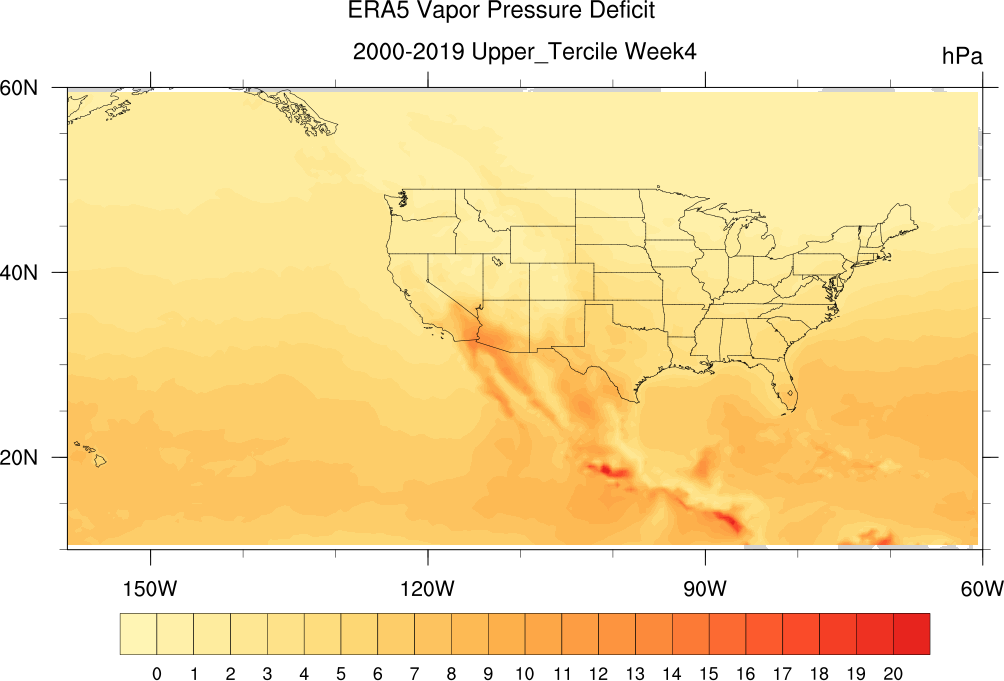
ERA5 VPD High Terciles all weeks here.
ERA5 VPD Medians all weeks here.
ERA5 VPD Sample Weekly Climatologies 2000-2019:
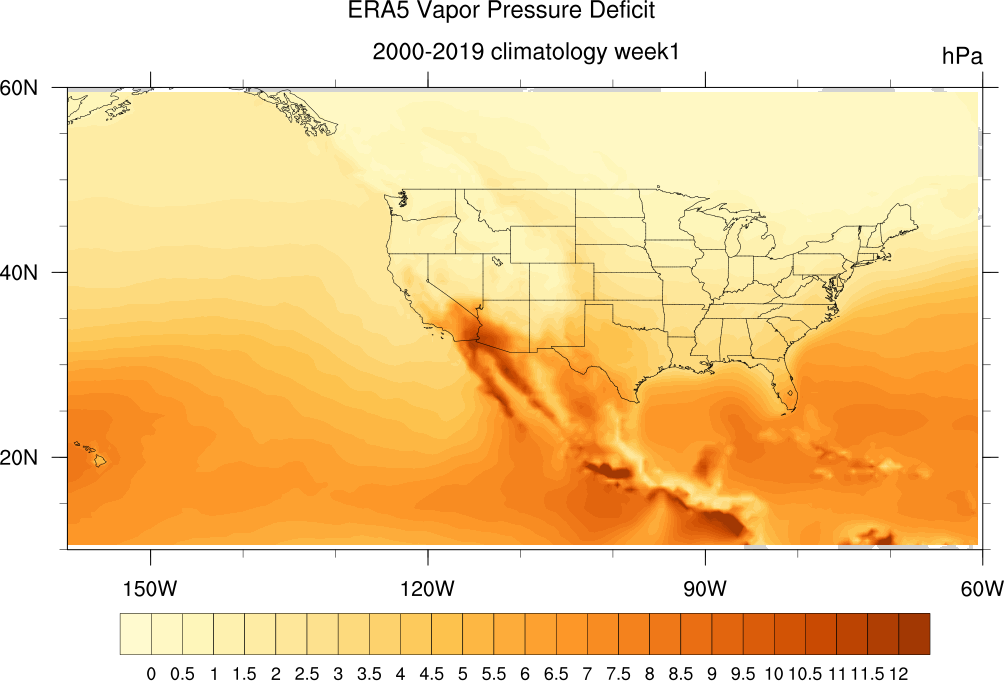
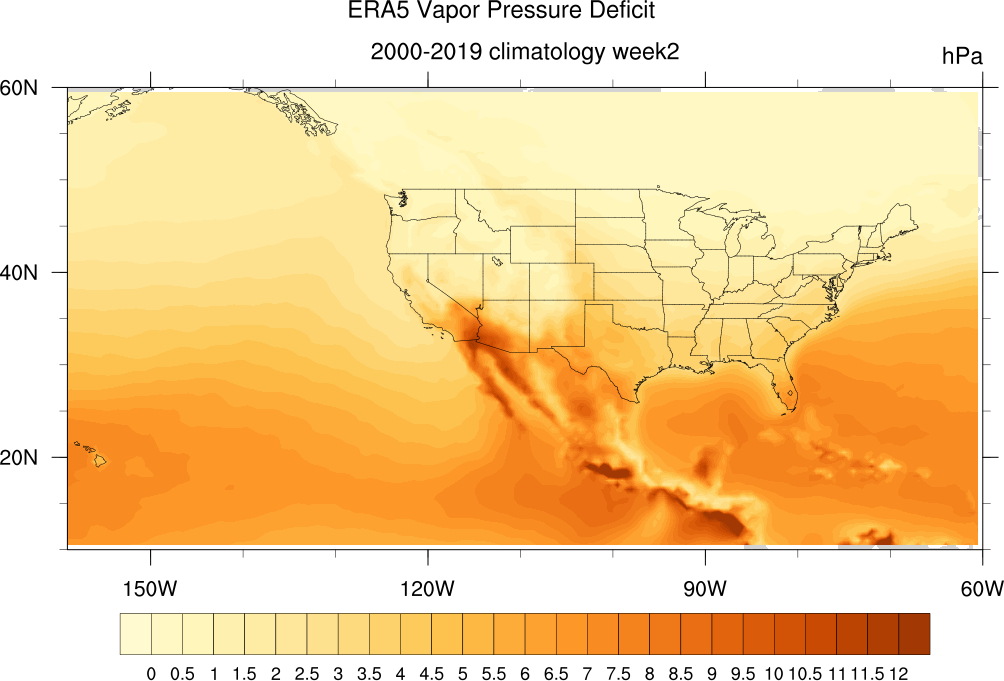
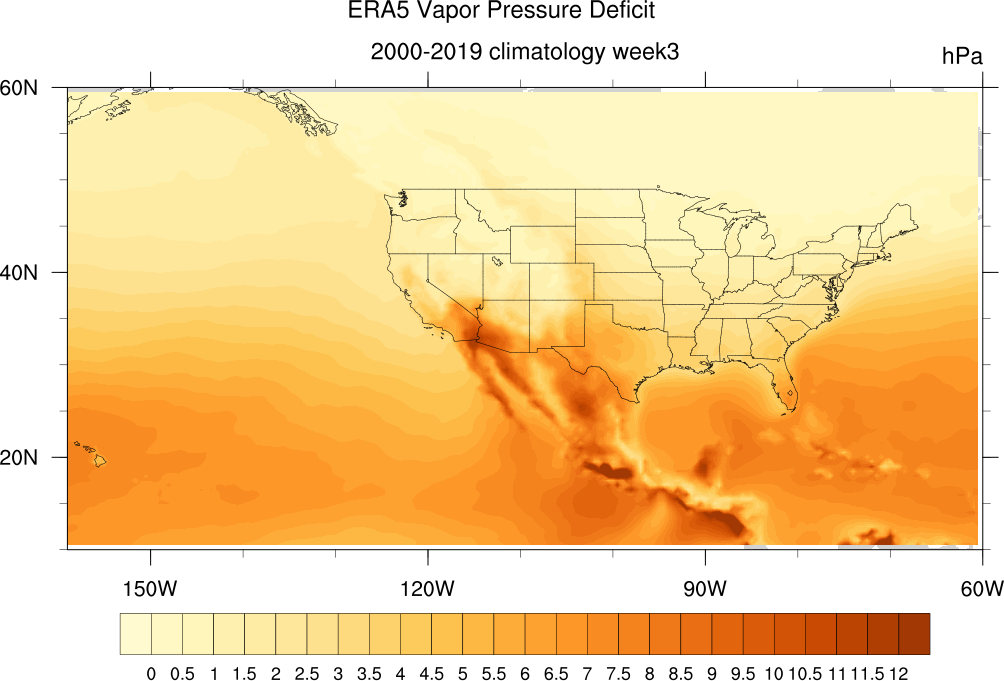
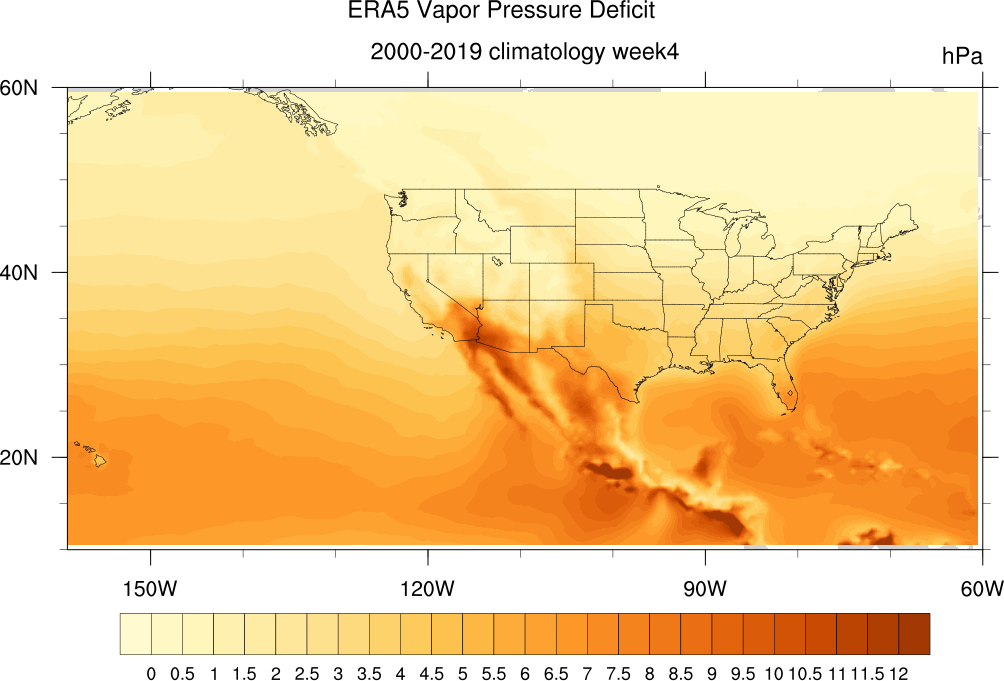
ERA5 VPD Weekly Climatologies all weeks here.
ERA5 VPD Sample Weekly Anomalies 2000:
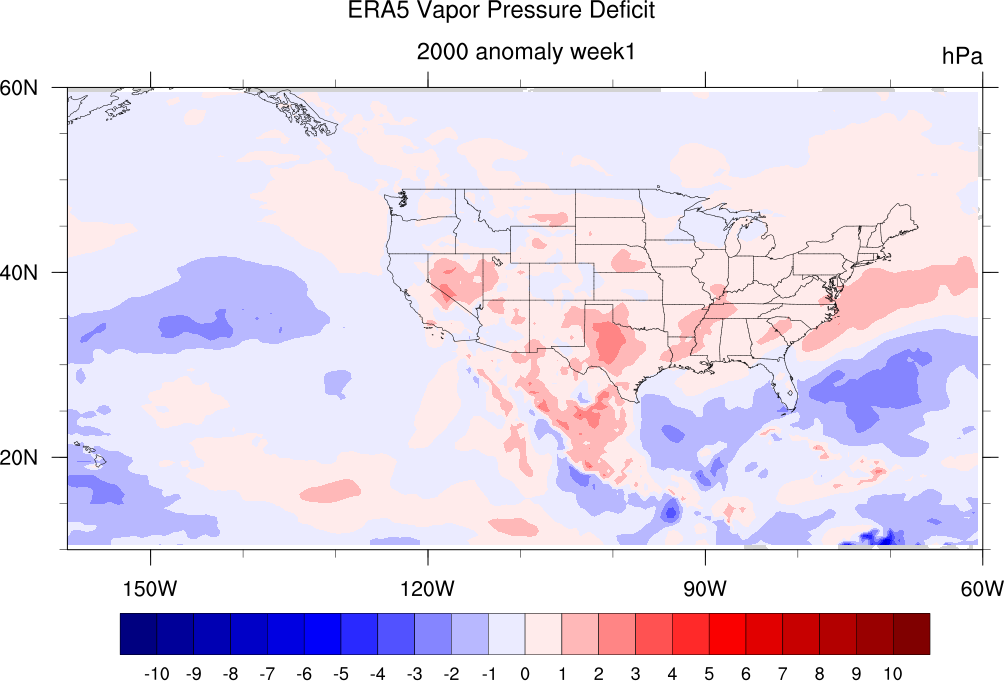
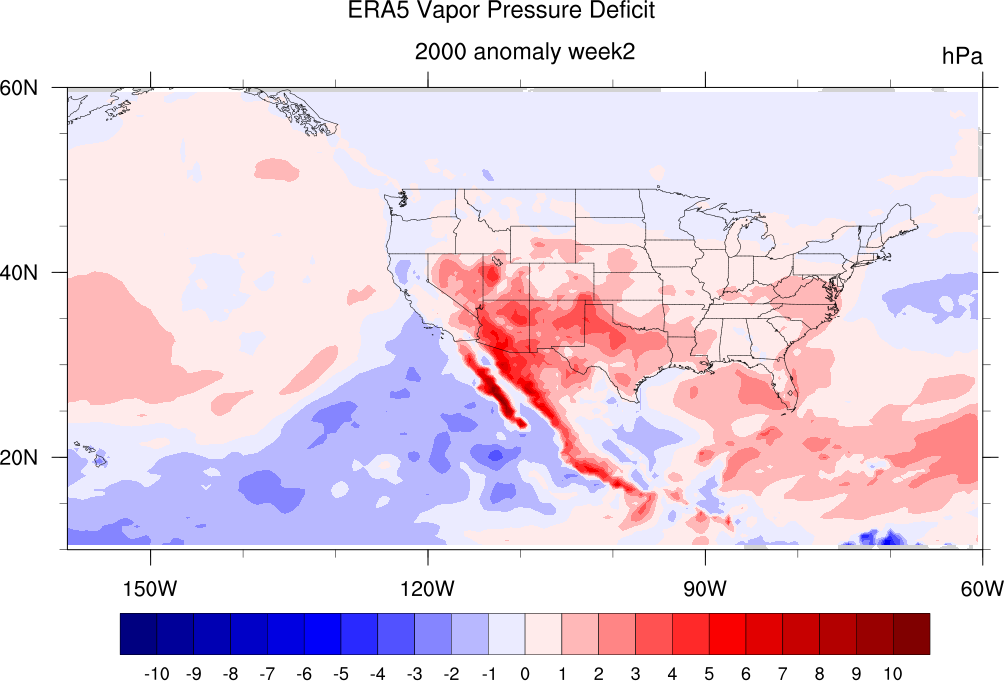
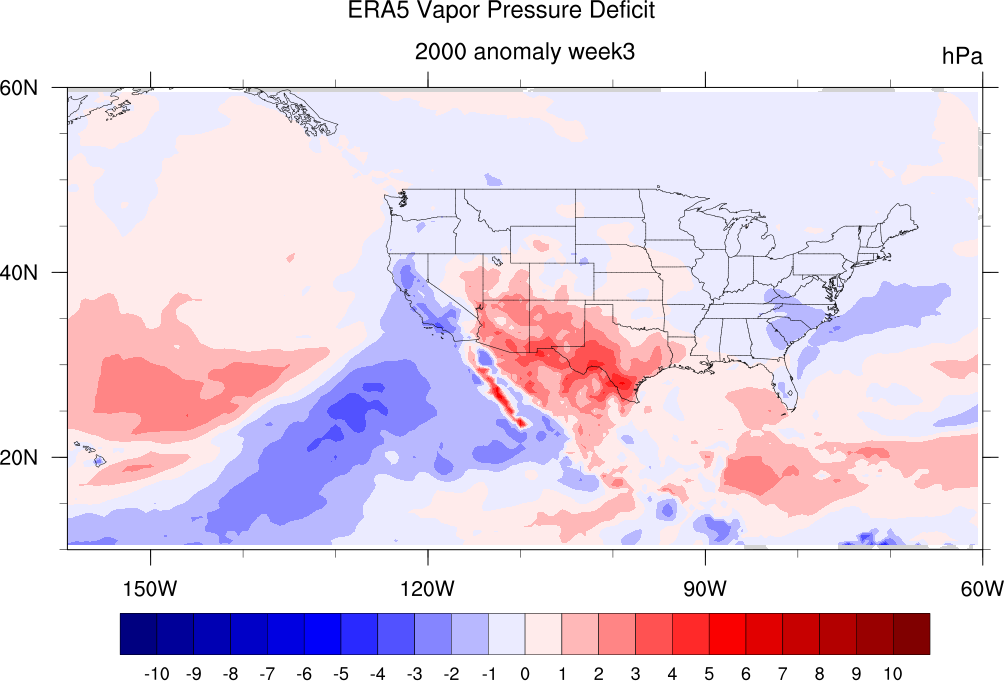
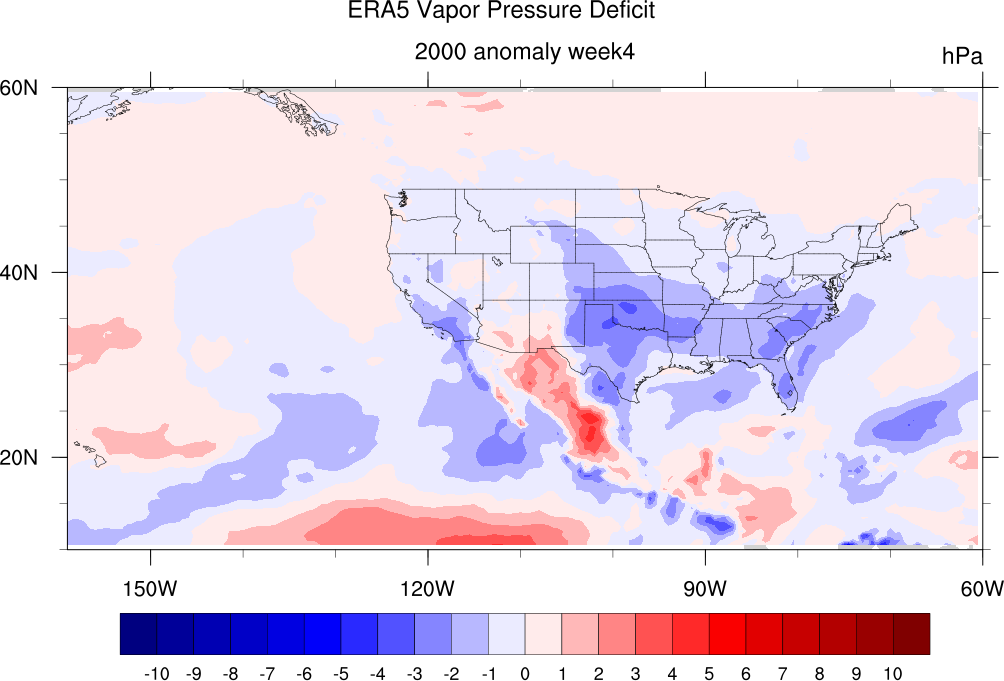
ERA5 VPD Weekly Anomalies all years here.
Older ERA5 VPD plots here.
GEFSv12 ReForecast Data
Downloaded GEFSv12 ReForecast Data includes Precipitation, Geopotential_Height at 200mb, 850mb, and surface,
Precipitable_Water, Soil Moisture, Specific Humidity at 200mb, 850mb, Temperature at 200mb, 850mb, and 2-meters, Zonal & Meridional Winds at 200mb, 850mb, Upward Longwave Radiation Flux, Snow Depth Water Equivalent.
Calculated ReForecast GEFSv12 Data includes Wind Speed at 200mb, 850mb, dew point temperature (via relative humidity), vapor pressure deficit
Note each ReForecast has one initiatiation Date with 00Z initiation time; each ReForecast has 11 ensemble members; each ReForecast has 140 6-hour-forecast increments.
Below are links to plots of weekly min, max, and mean for weeks 1,2,3,4 (where statistics performed over forecast_hours) for ensemble means and standard_deviations for various dates.
20000105
20000112
20000119
20000126
20000202
20000209
20000216
More dates available upon request.
GEFSv12 Forecast Data
GEFSv12 Forecast sample 20250202 VPD movie here
Downloaded Realtime GEFSv12 Forecast Data includes Precipitation, Dewpoint_Temperature, Geopotential_Height at 200mb, 850mb, and surface,
Precipitable_Water, Soil Moisture, Specific Humidity at 200mb, 850mb, Temperature at 200mb, 850mb, and 2-meters, Zonal & Meridional Winds at 200mb, 850mb, Upward Longwave Radiation Flux, Snow Depth Water Equivalent.
Calculated Realtime GEFSv12 Data includes Wind Speed at 200mb, 850mb, and Vapor Pressure Deficit.
Note each Forecast has one initiatiation Date with 00Z initiation time; each Forecast has 31 ensemble members; each Forecast has 140 6-hour-forecast increments.
Below are links to plots of weekly min, max, and mean for weeks 1,2,3,4 (where statistics performed over forecast_hours) for ensemble means and standard_deviations for various dates. Lag-0 cross-correlations with VPD are also performed (over all forecast_hours).
20250101
20250108
20250115
20250122
20250129
20250205
20250212
20250219
20250226
20250305
20250312
20250319
20250326
20250402
20250409
20250416
20250423
20250430
20250507
20250514
20250521
20250528
20250604
20250611
New plots added in realtime as data becomes available.