Lesley L. Smith – US Extreme Precipitation
All plots preliminary. Right click to see bigger versions.
Back to main US Extreme Precip page here.
New Most recent plots first.
Observations Extreme Precipitation Climatologies
Station Data (with extrapolation to ~0.25o x 0.25o)


Station Data (with extrapolation)


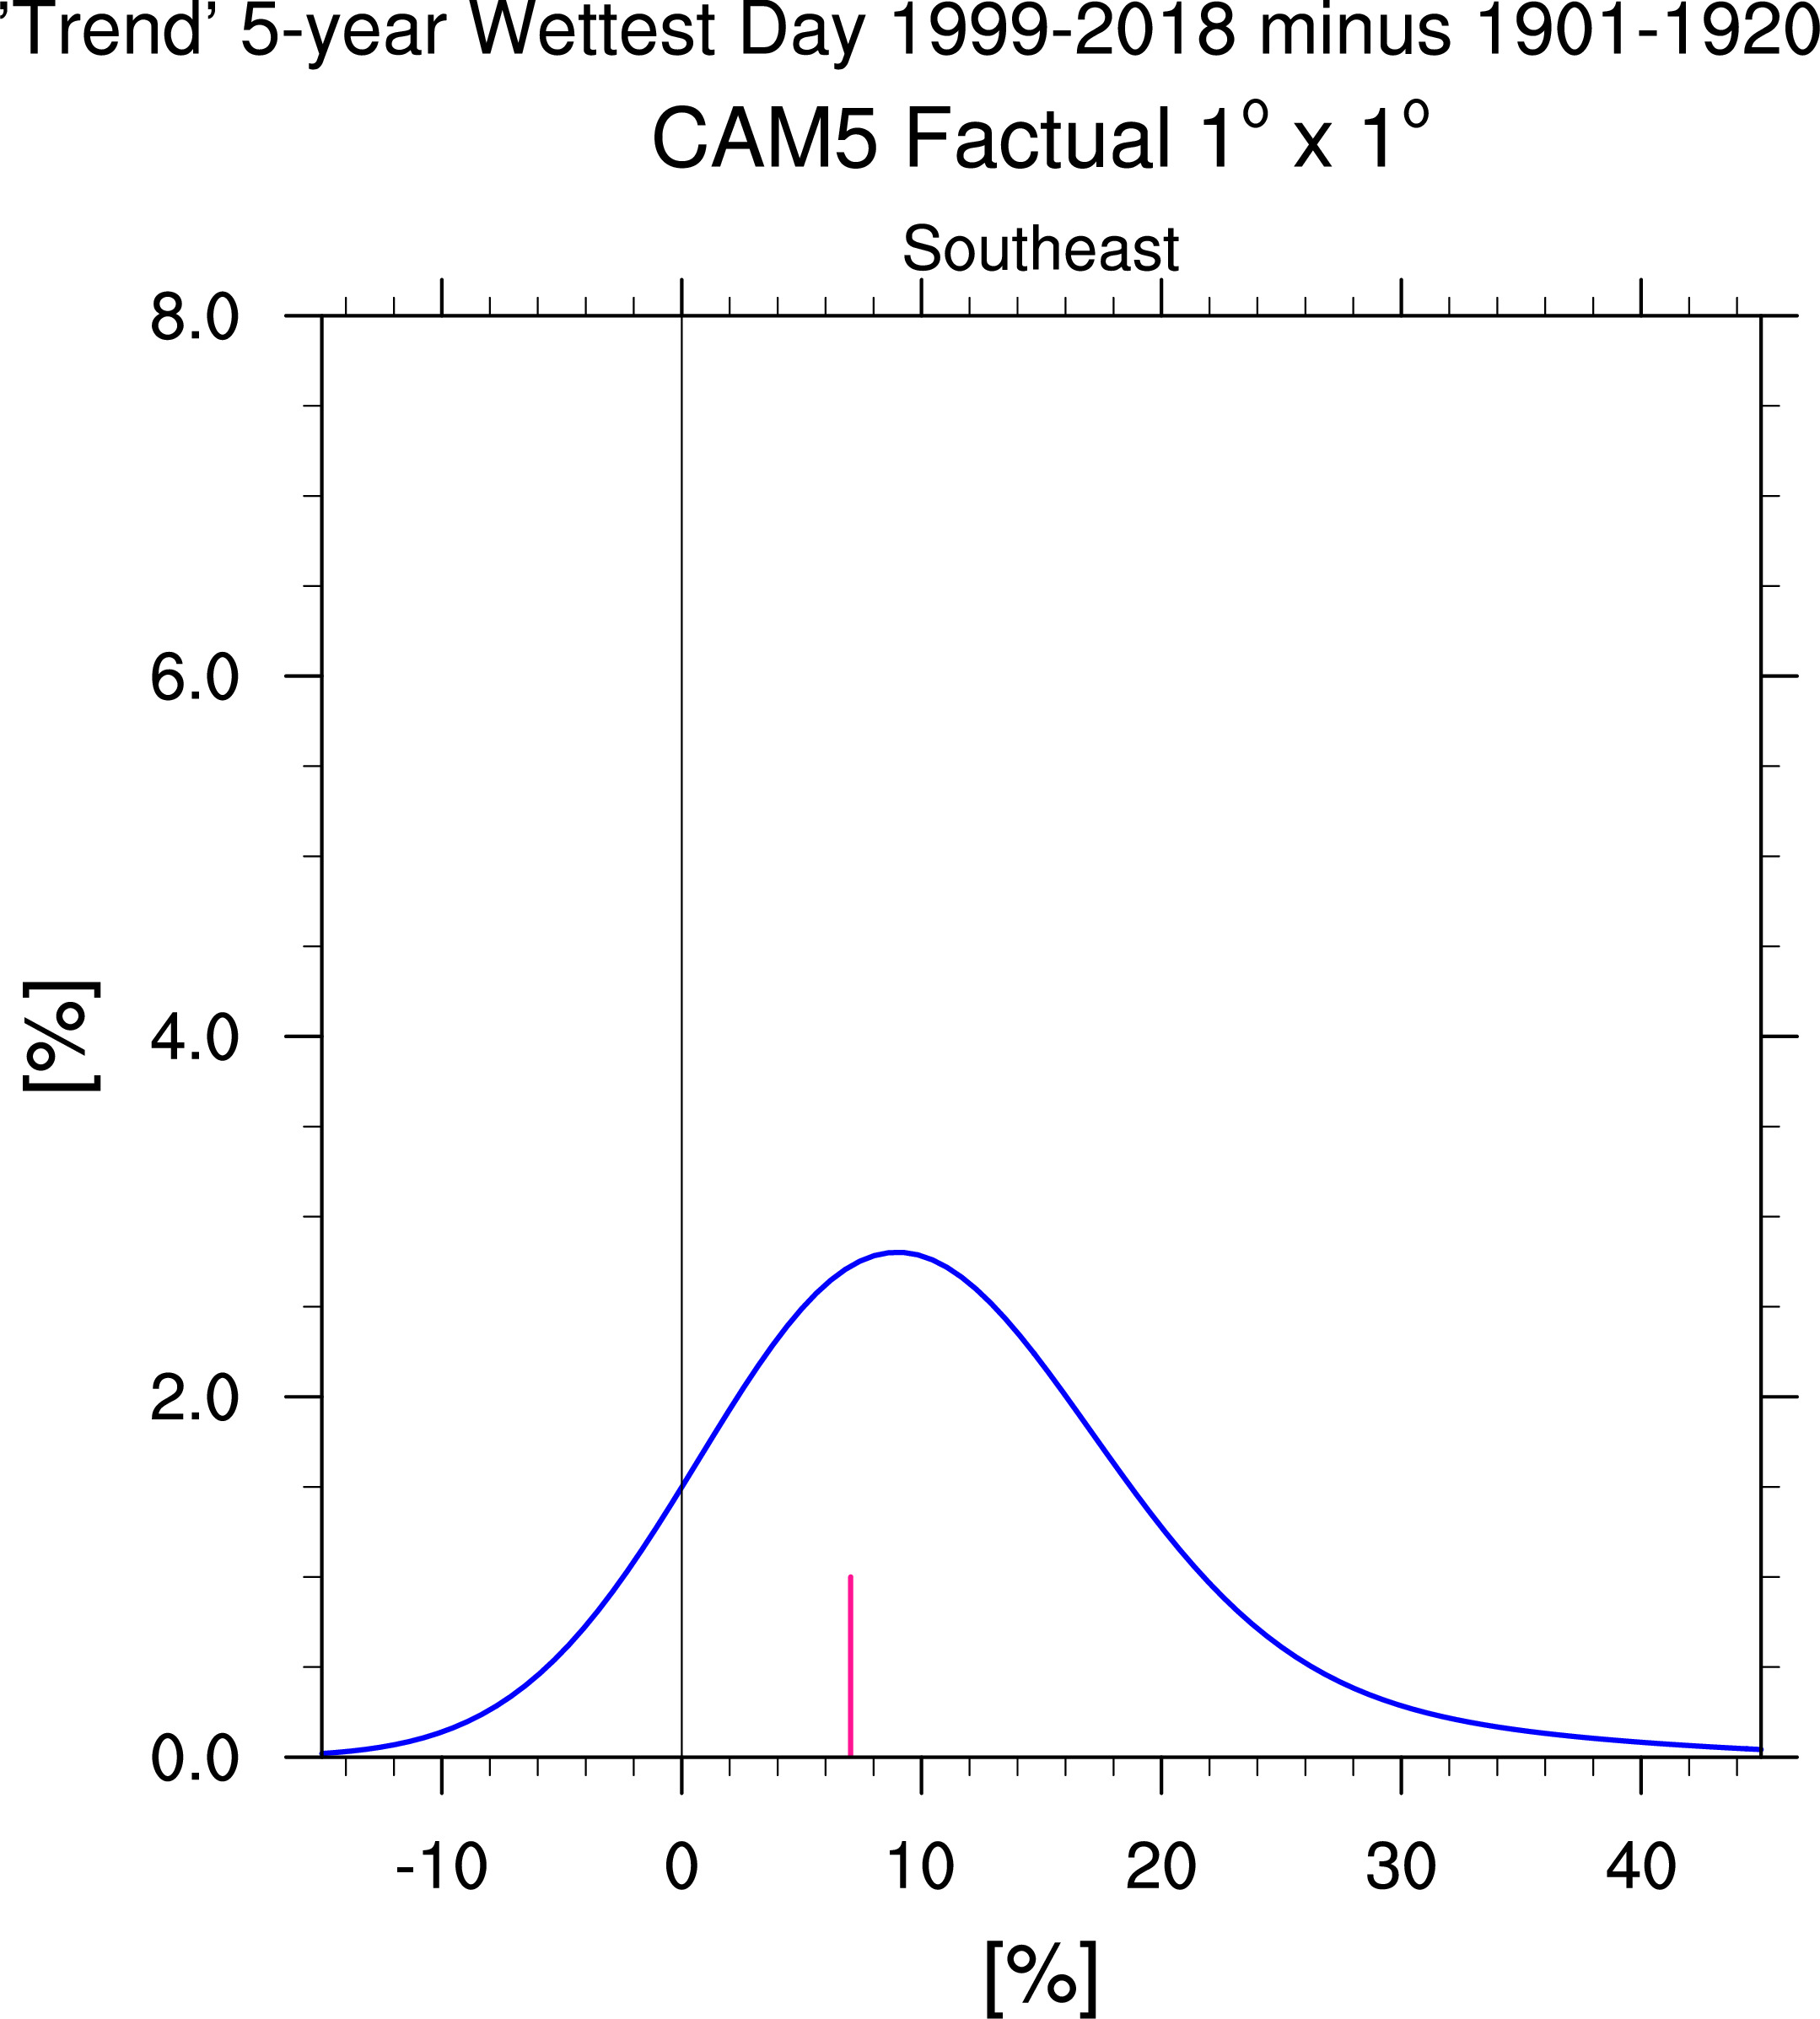
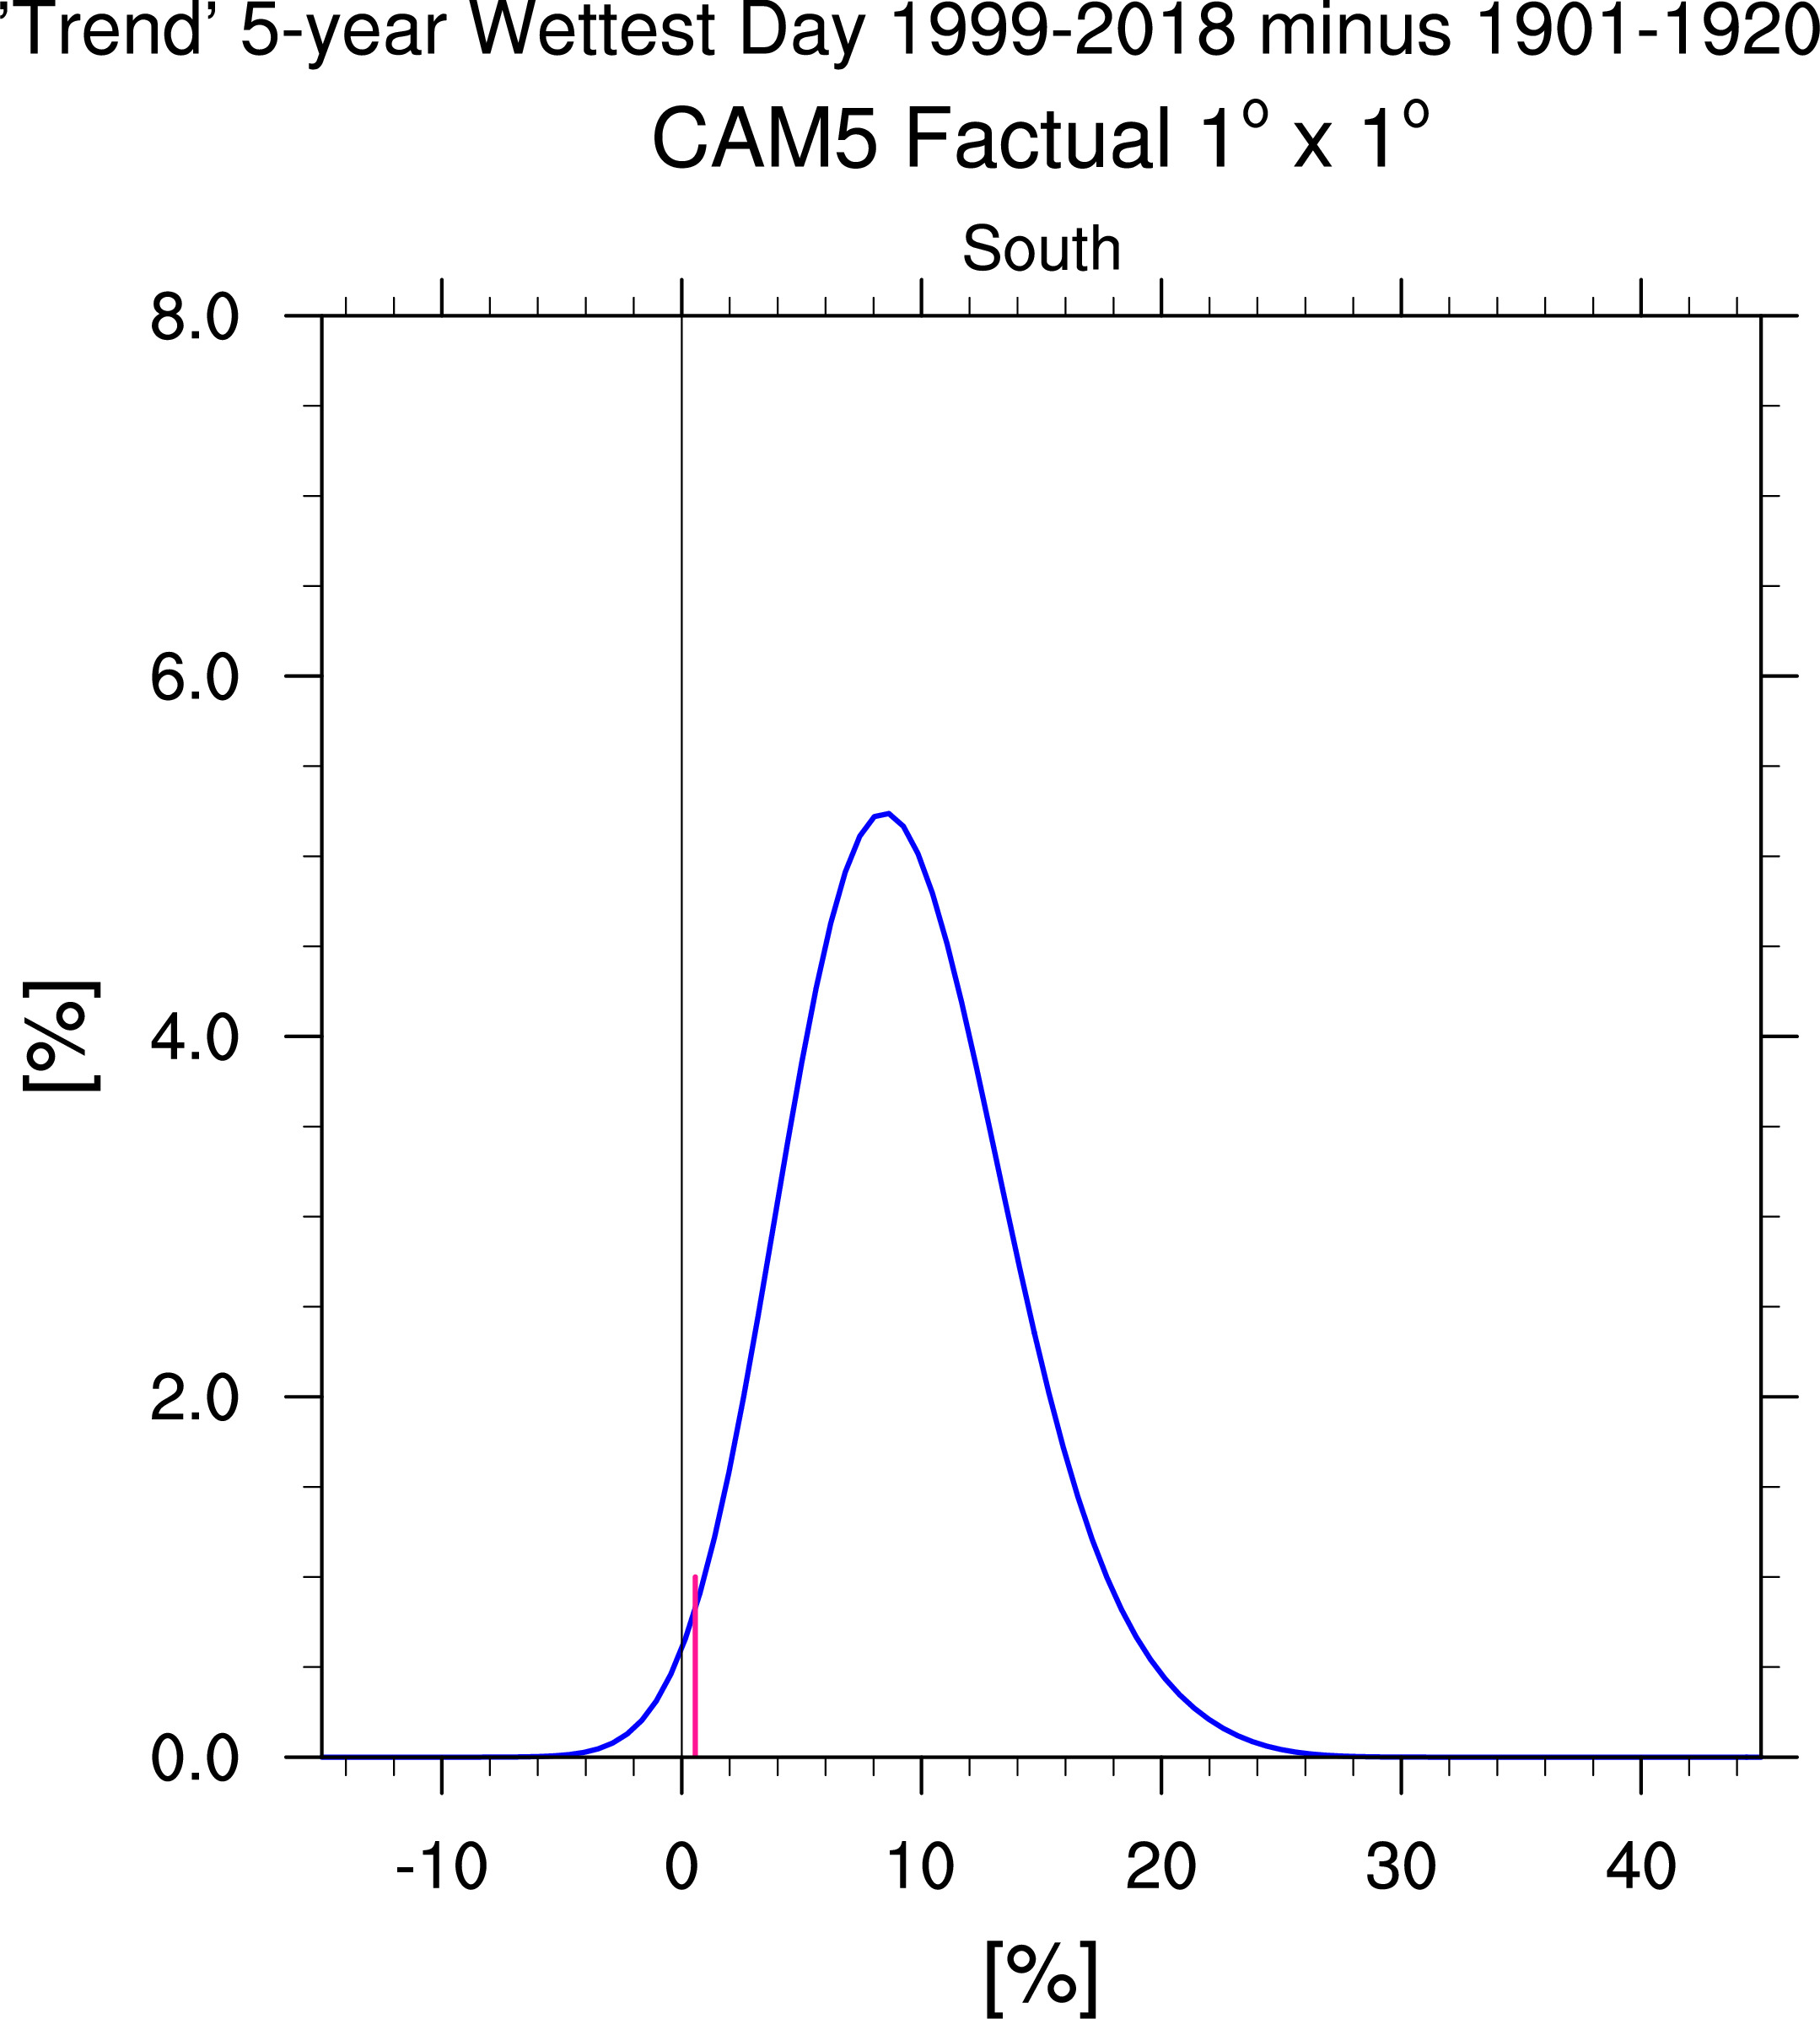
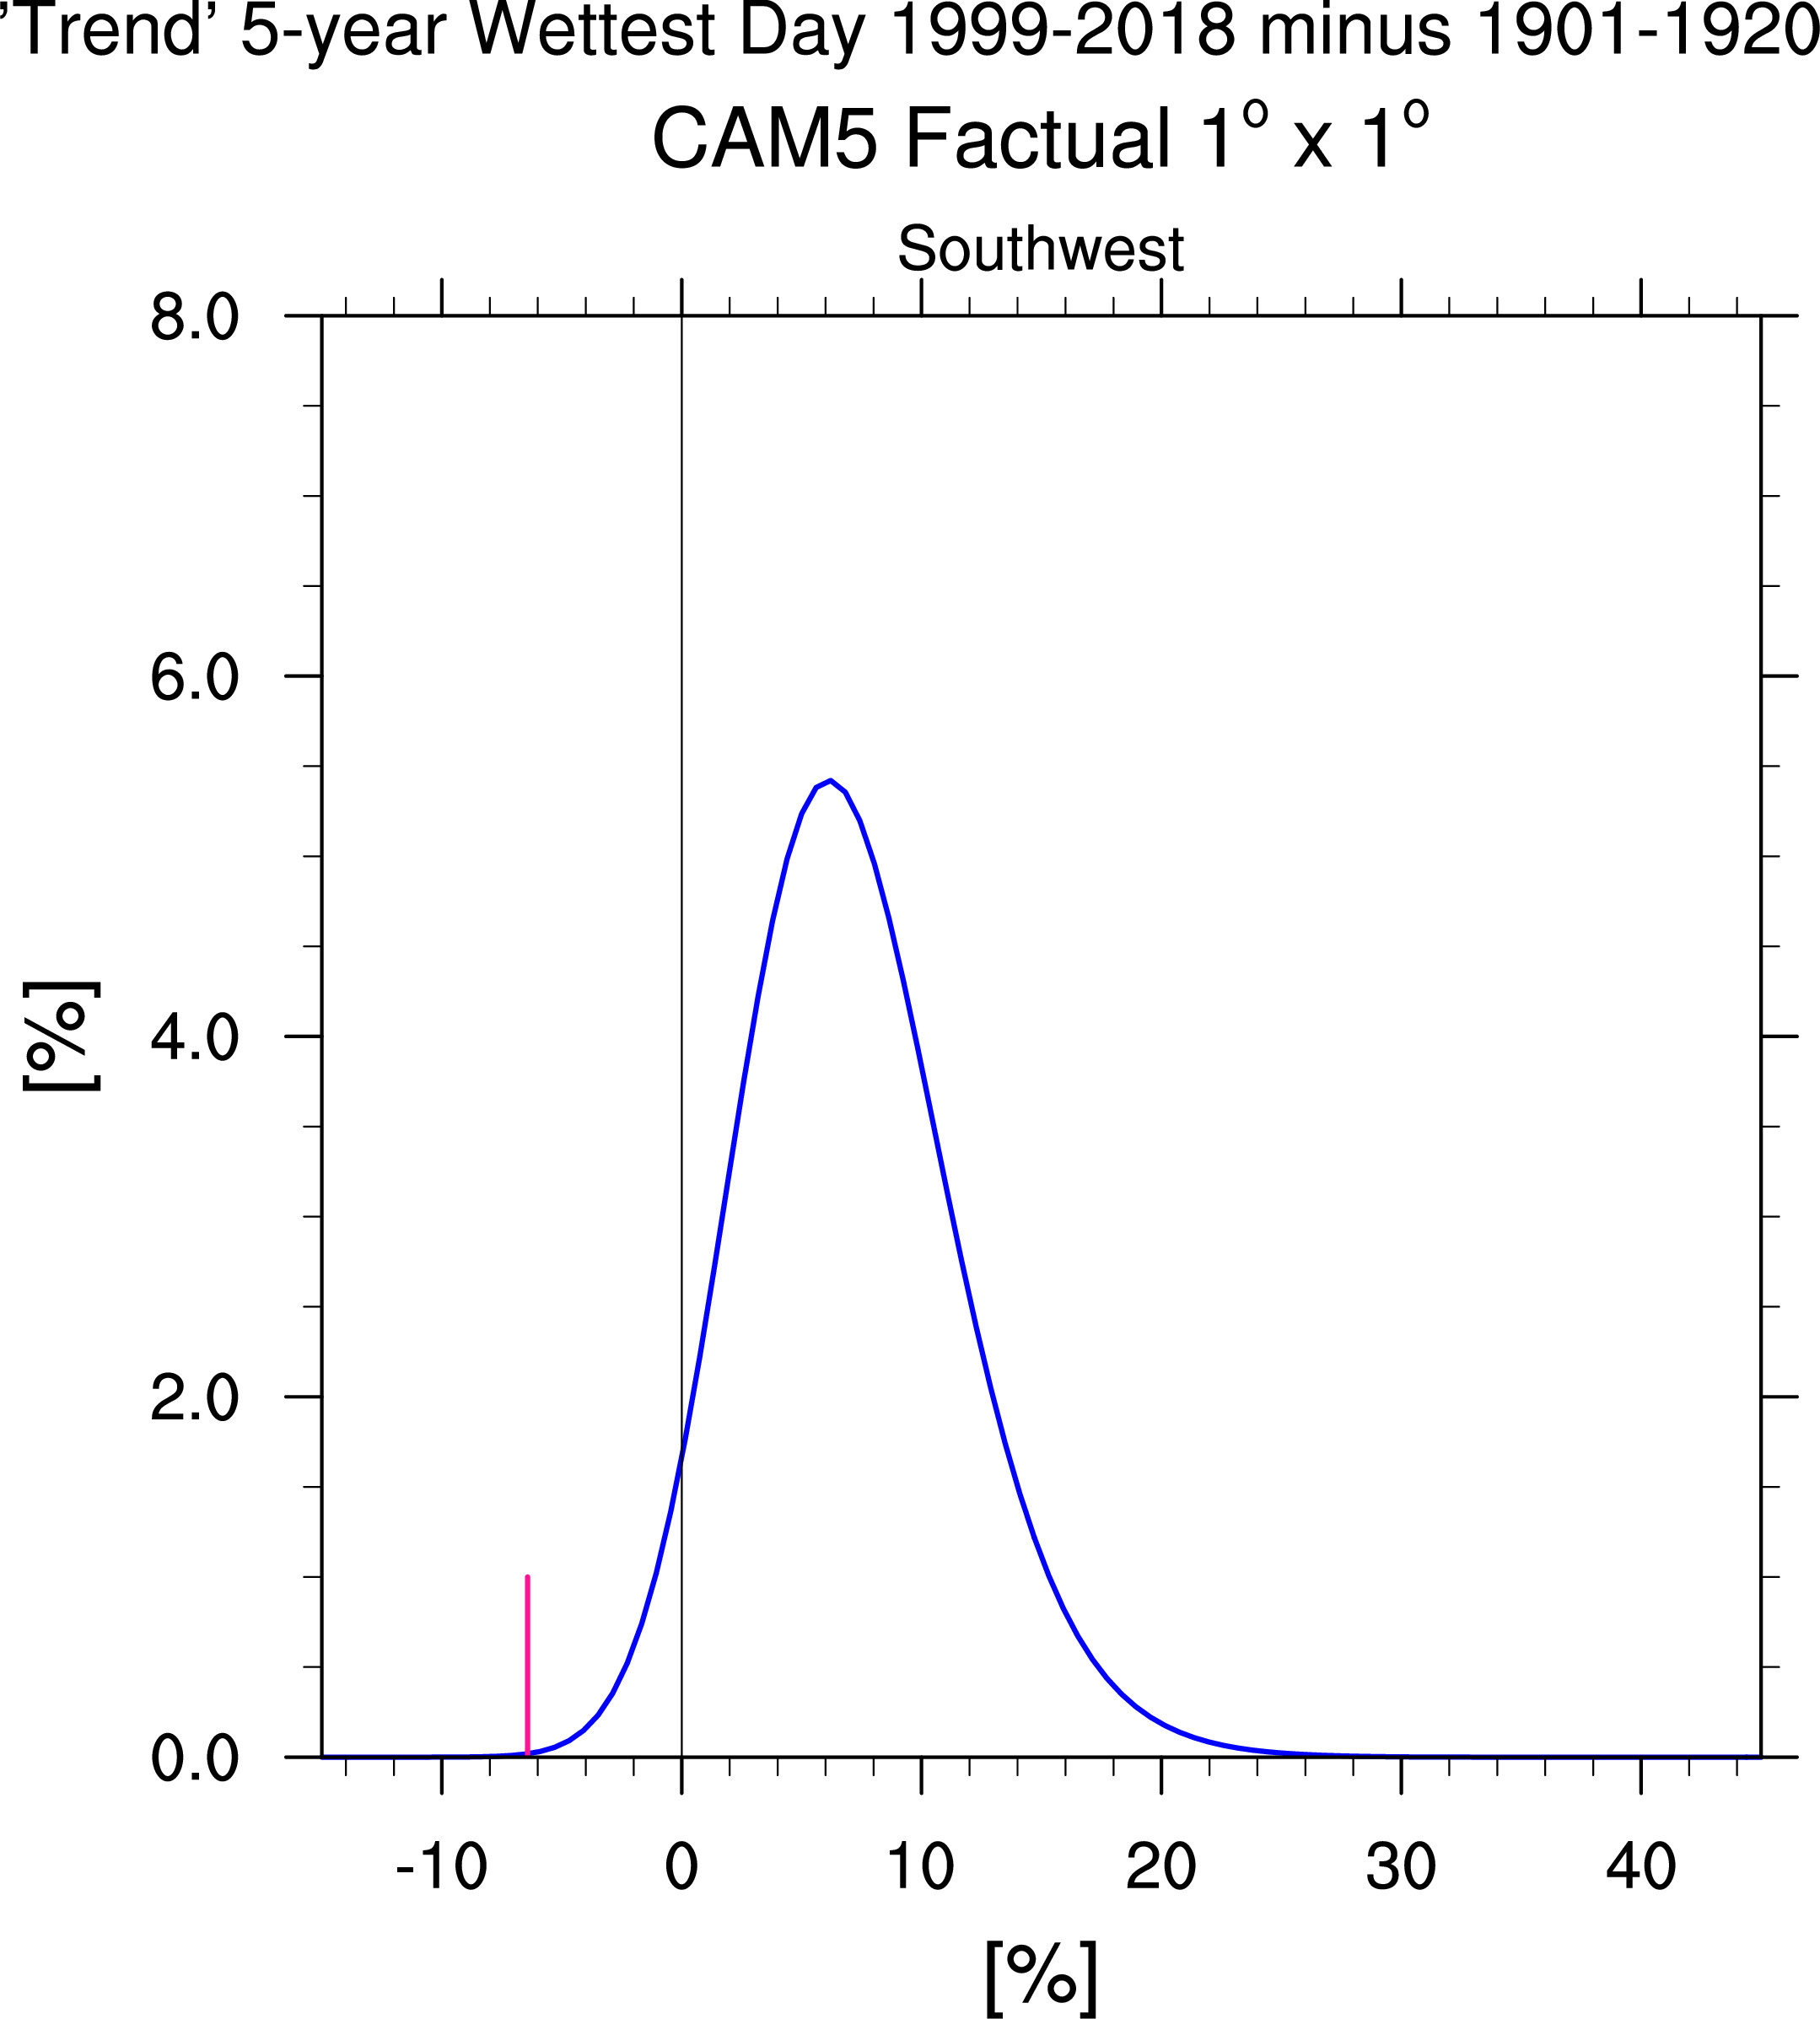
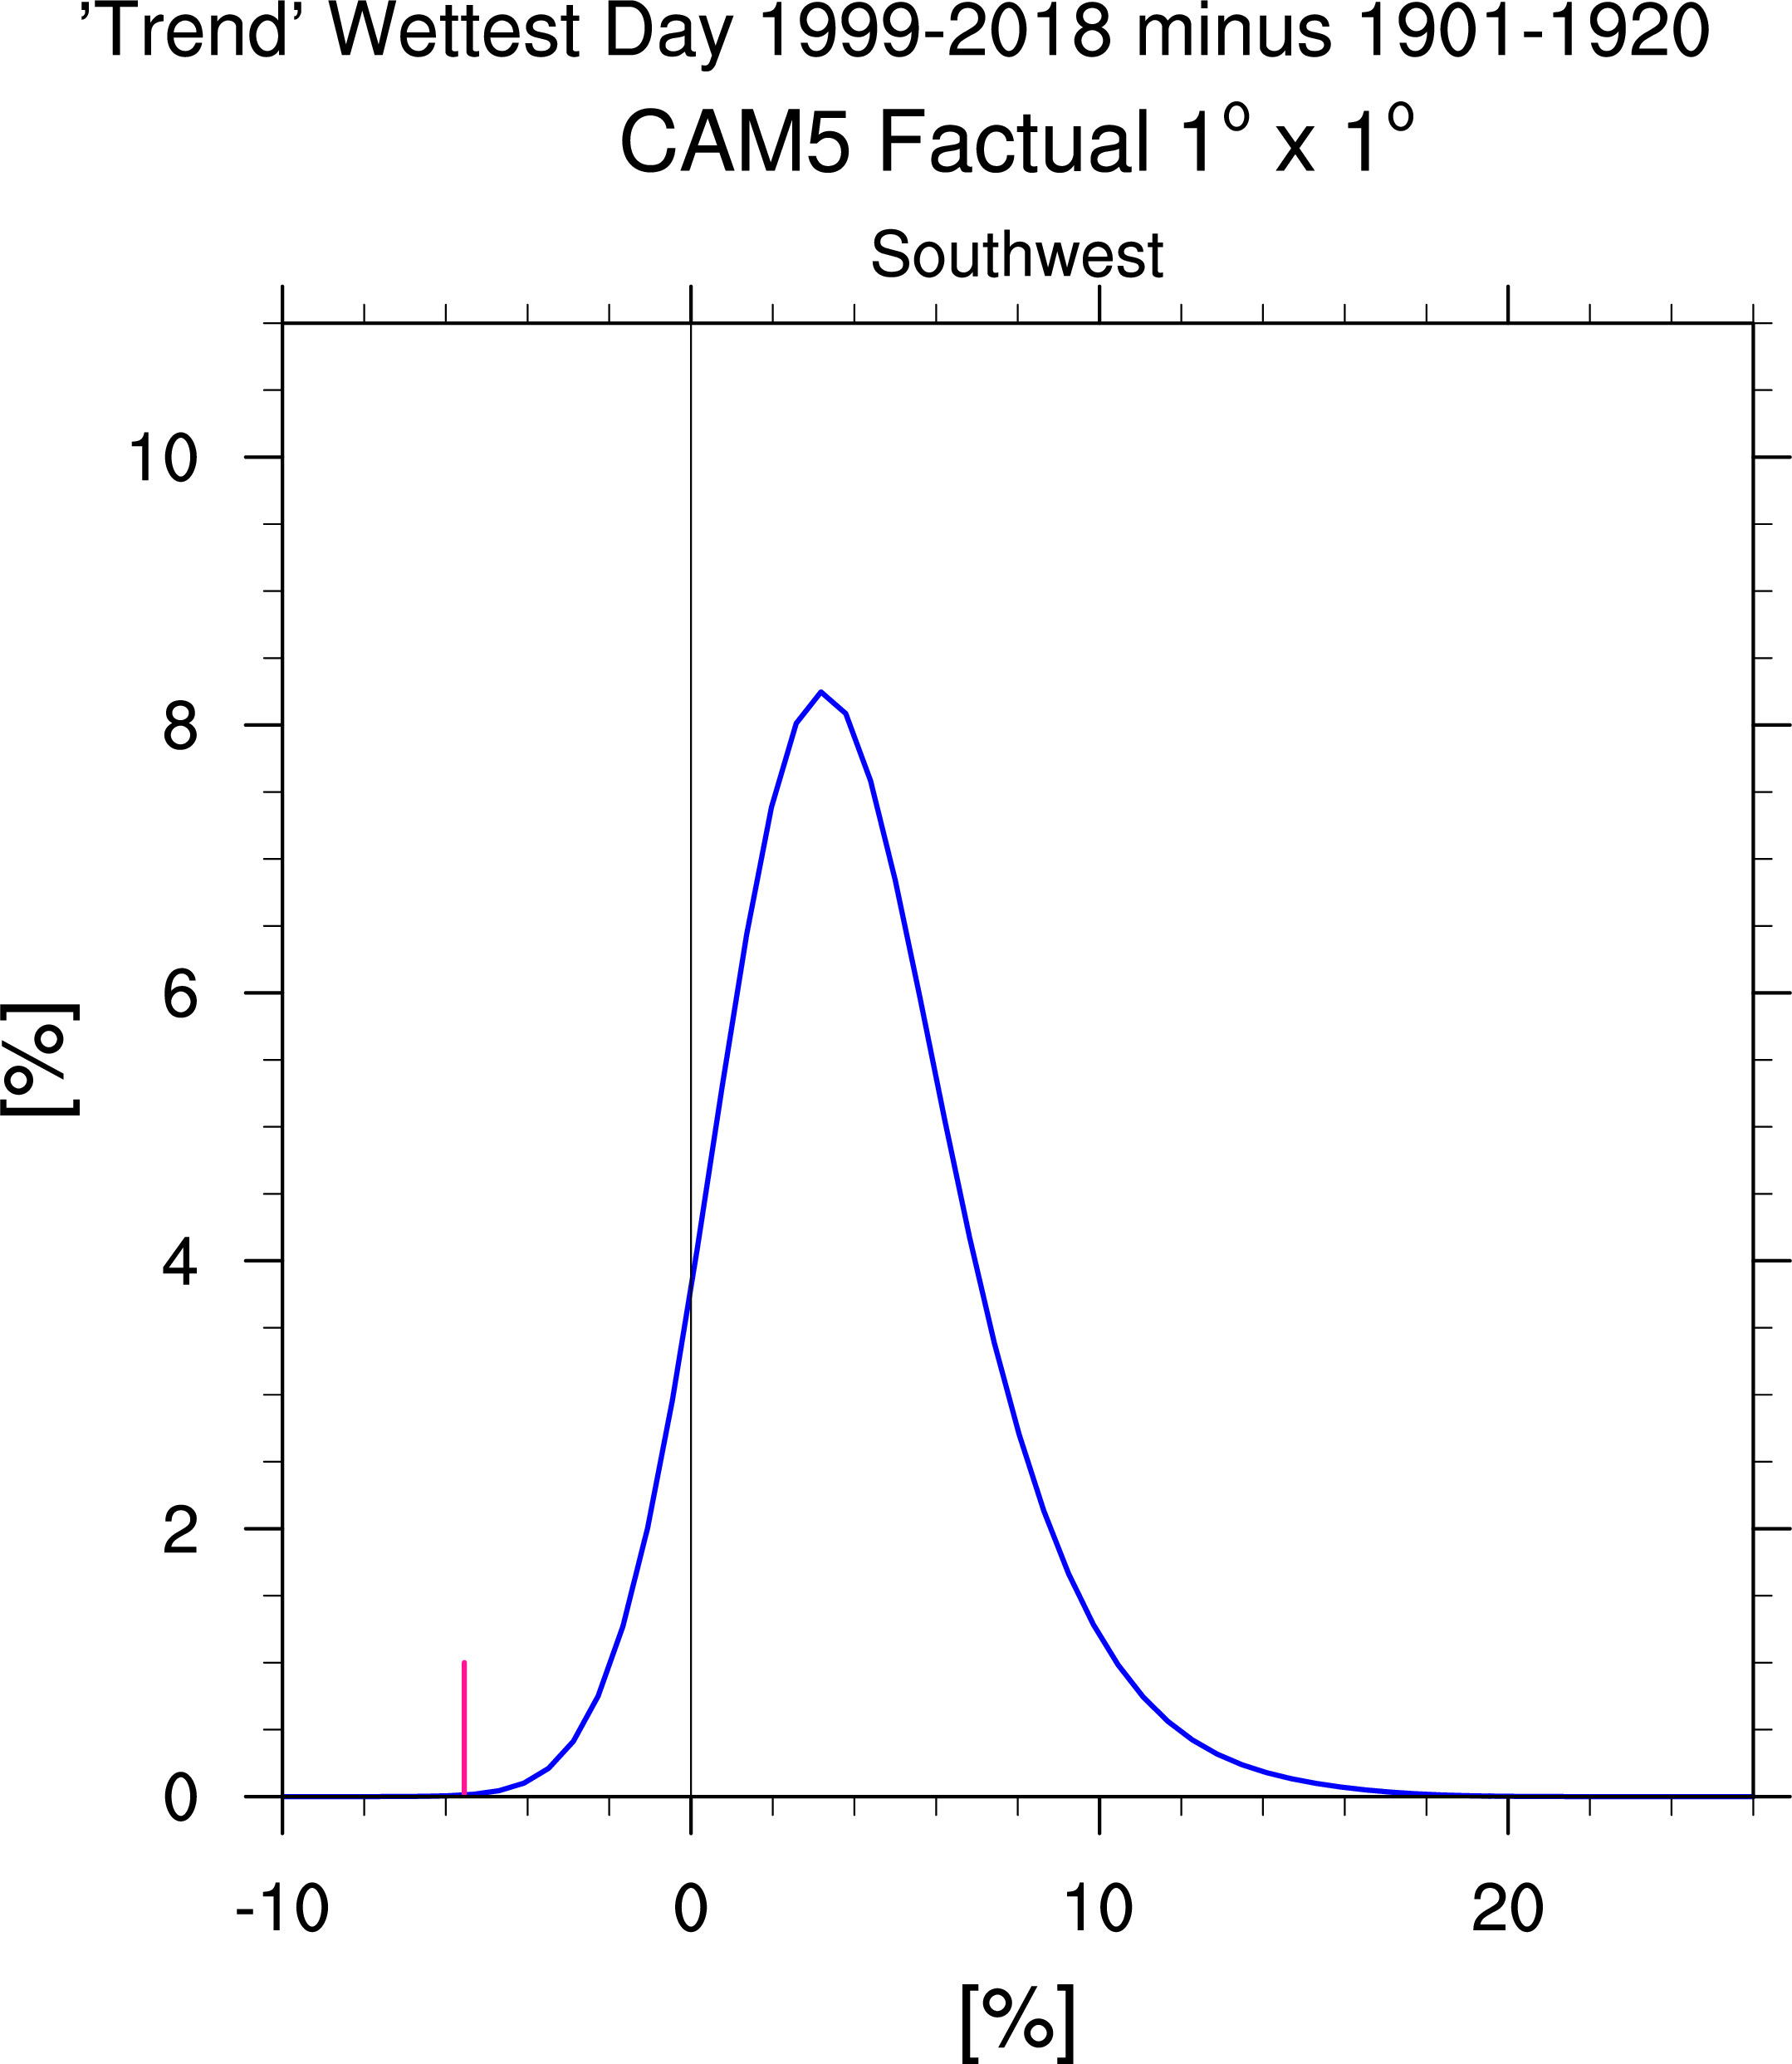
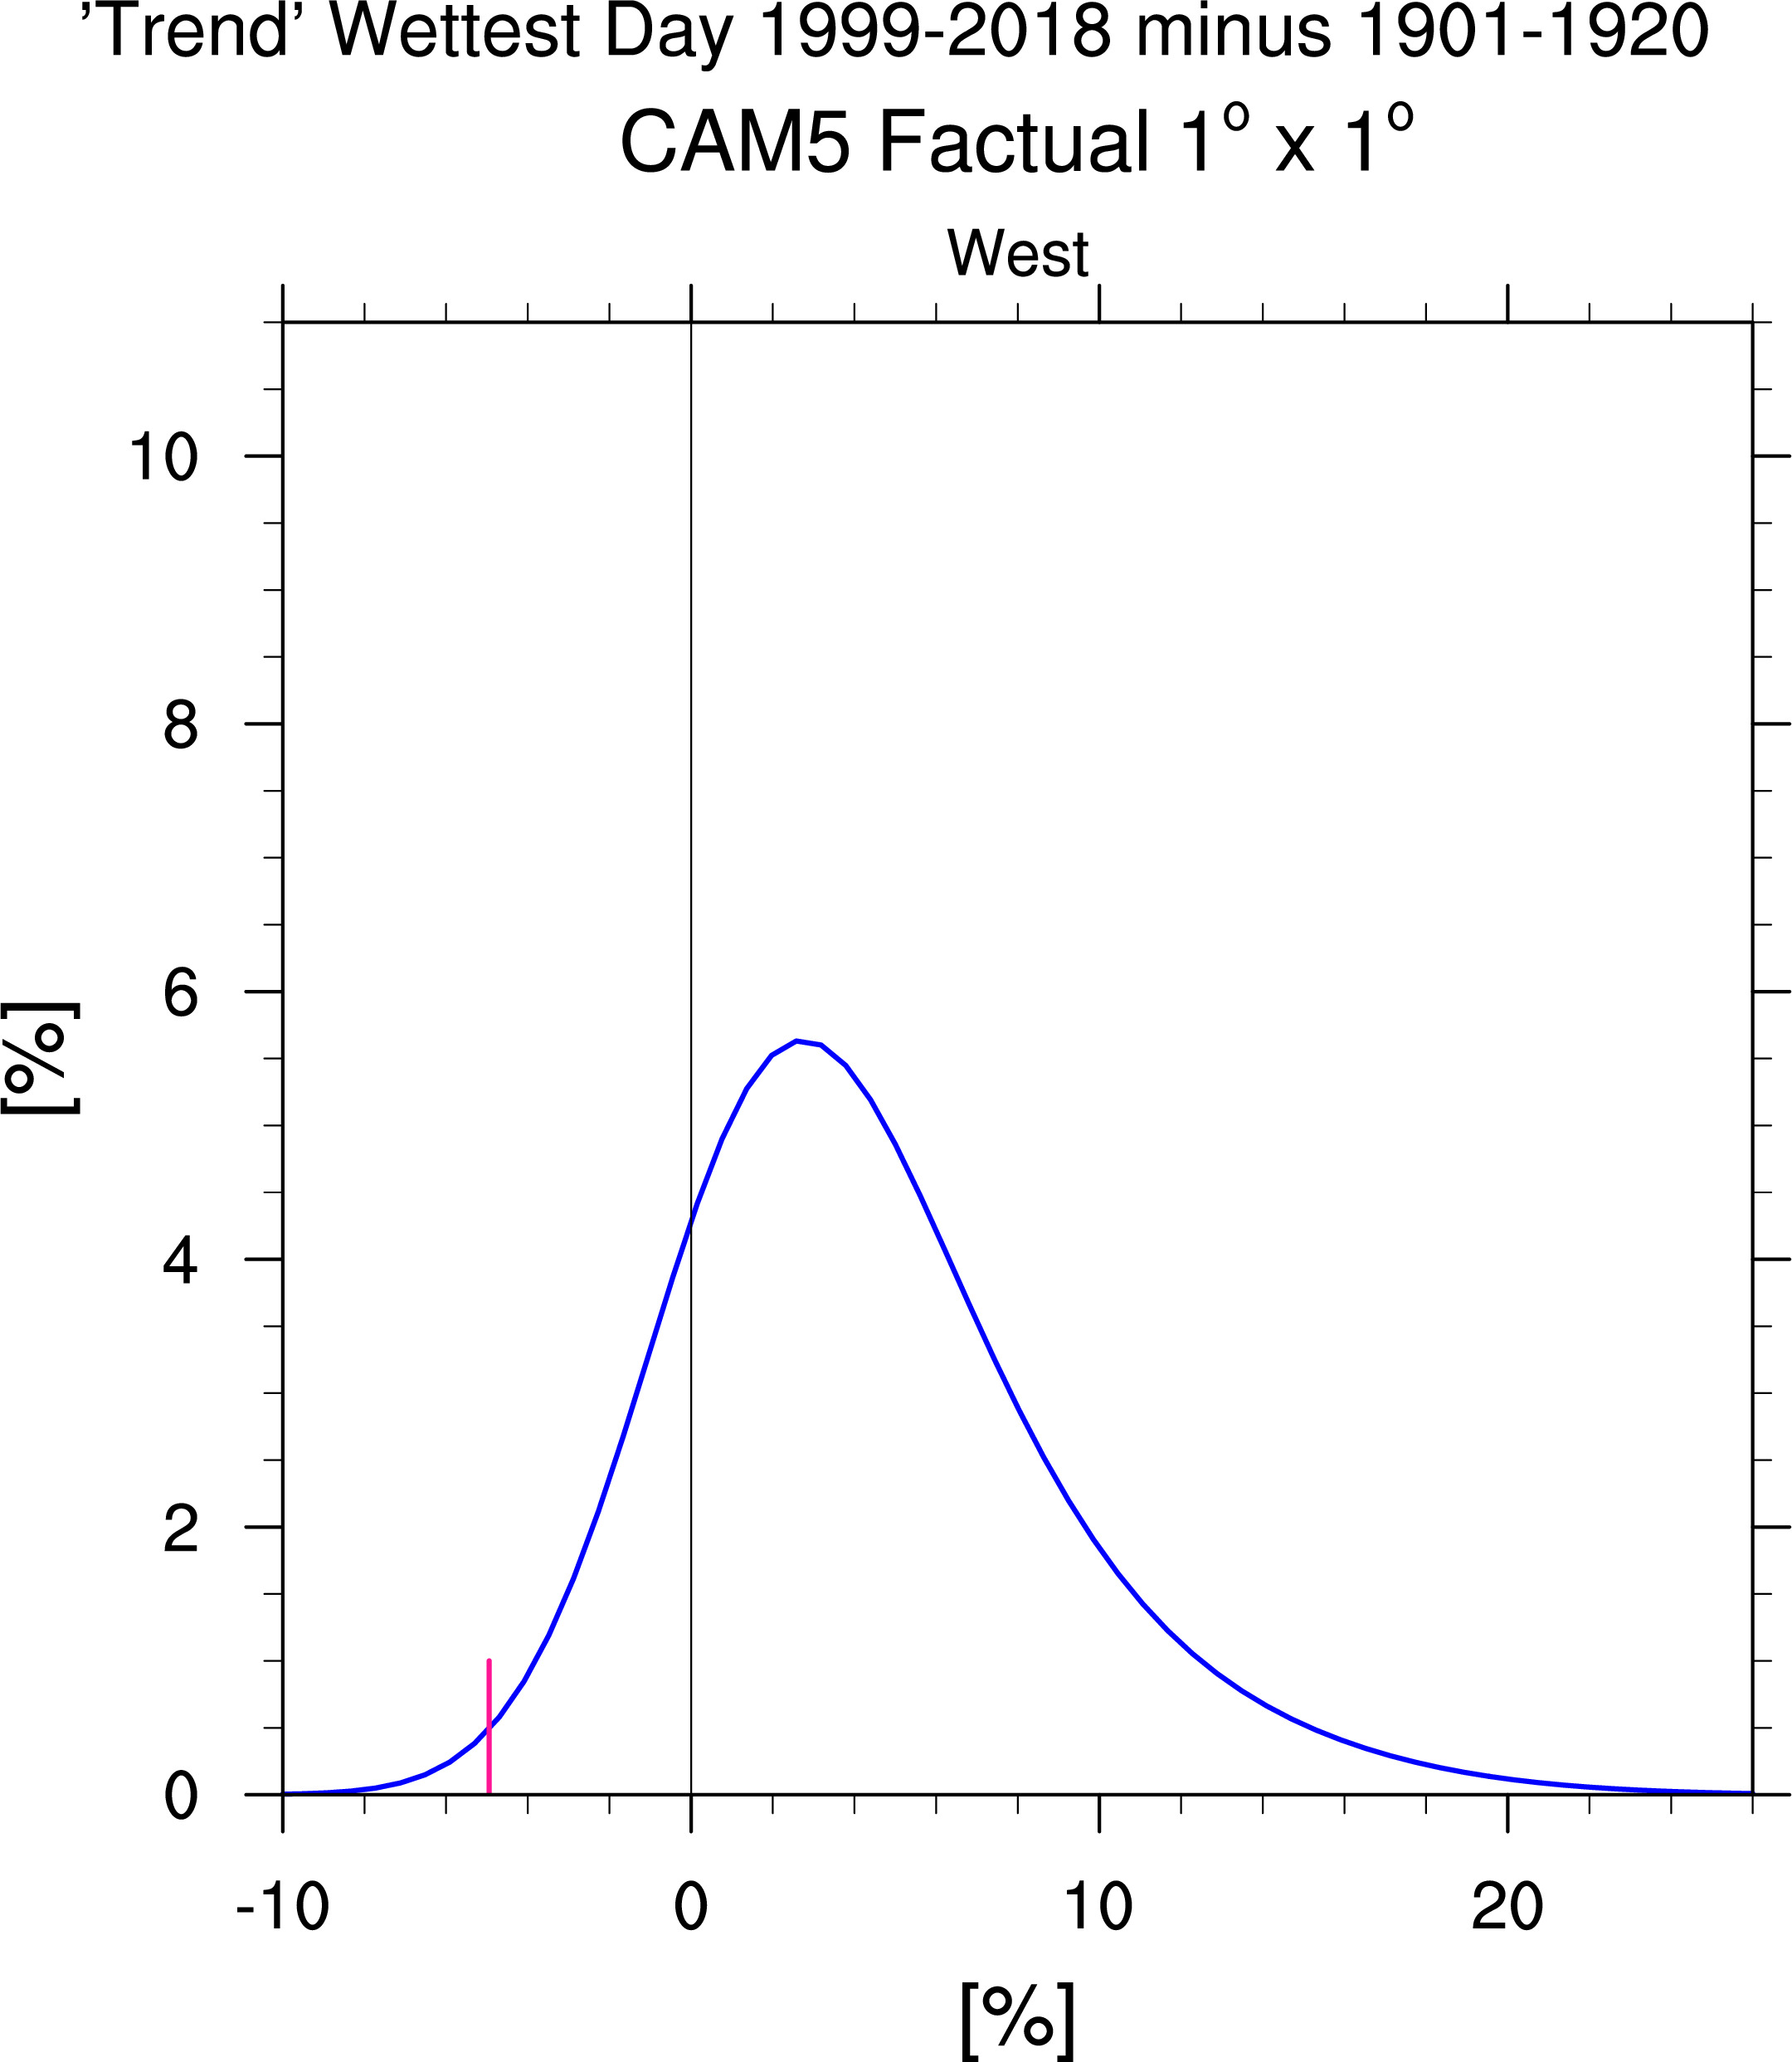
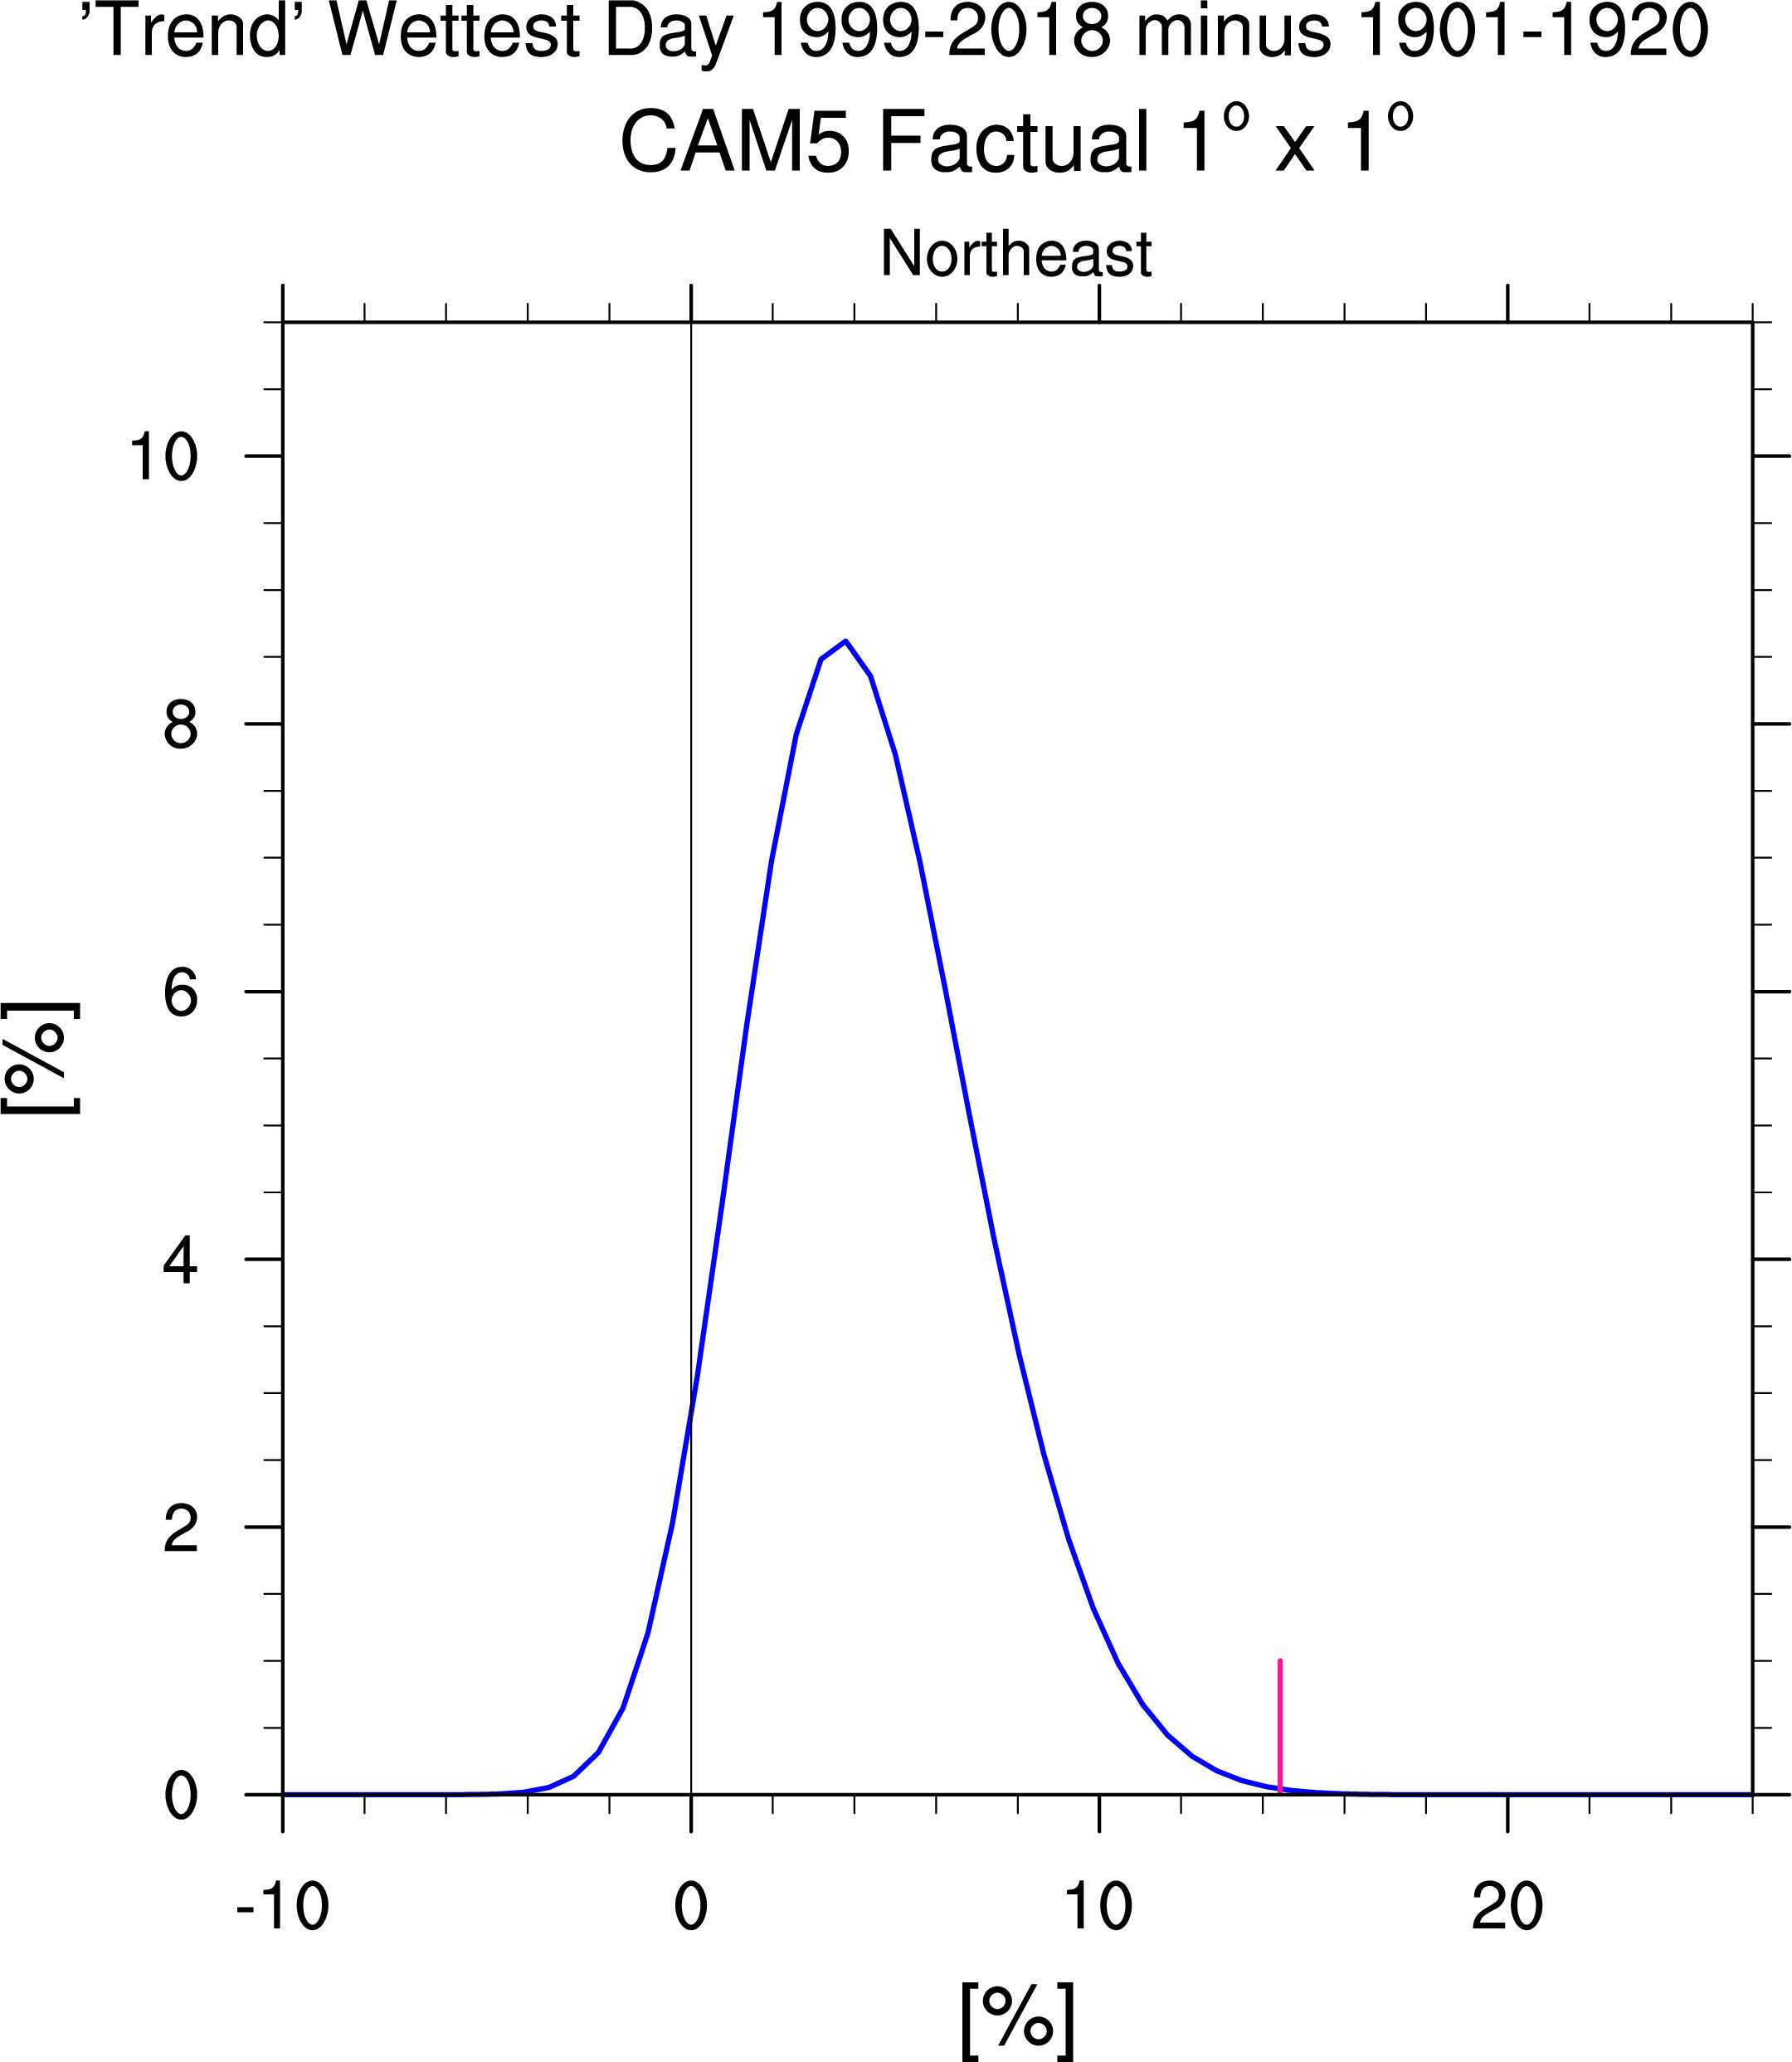
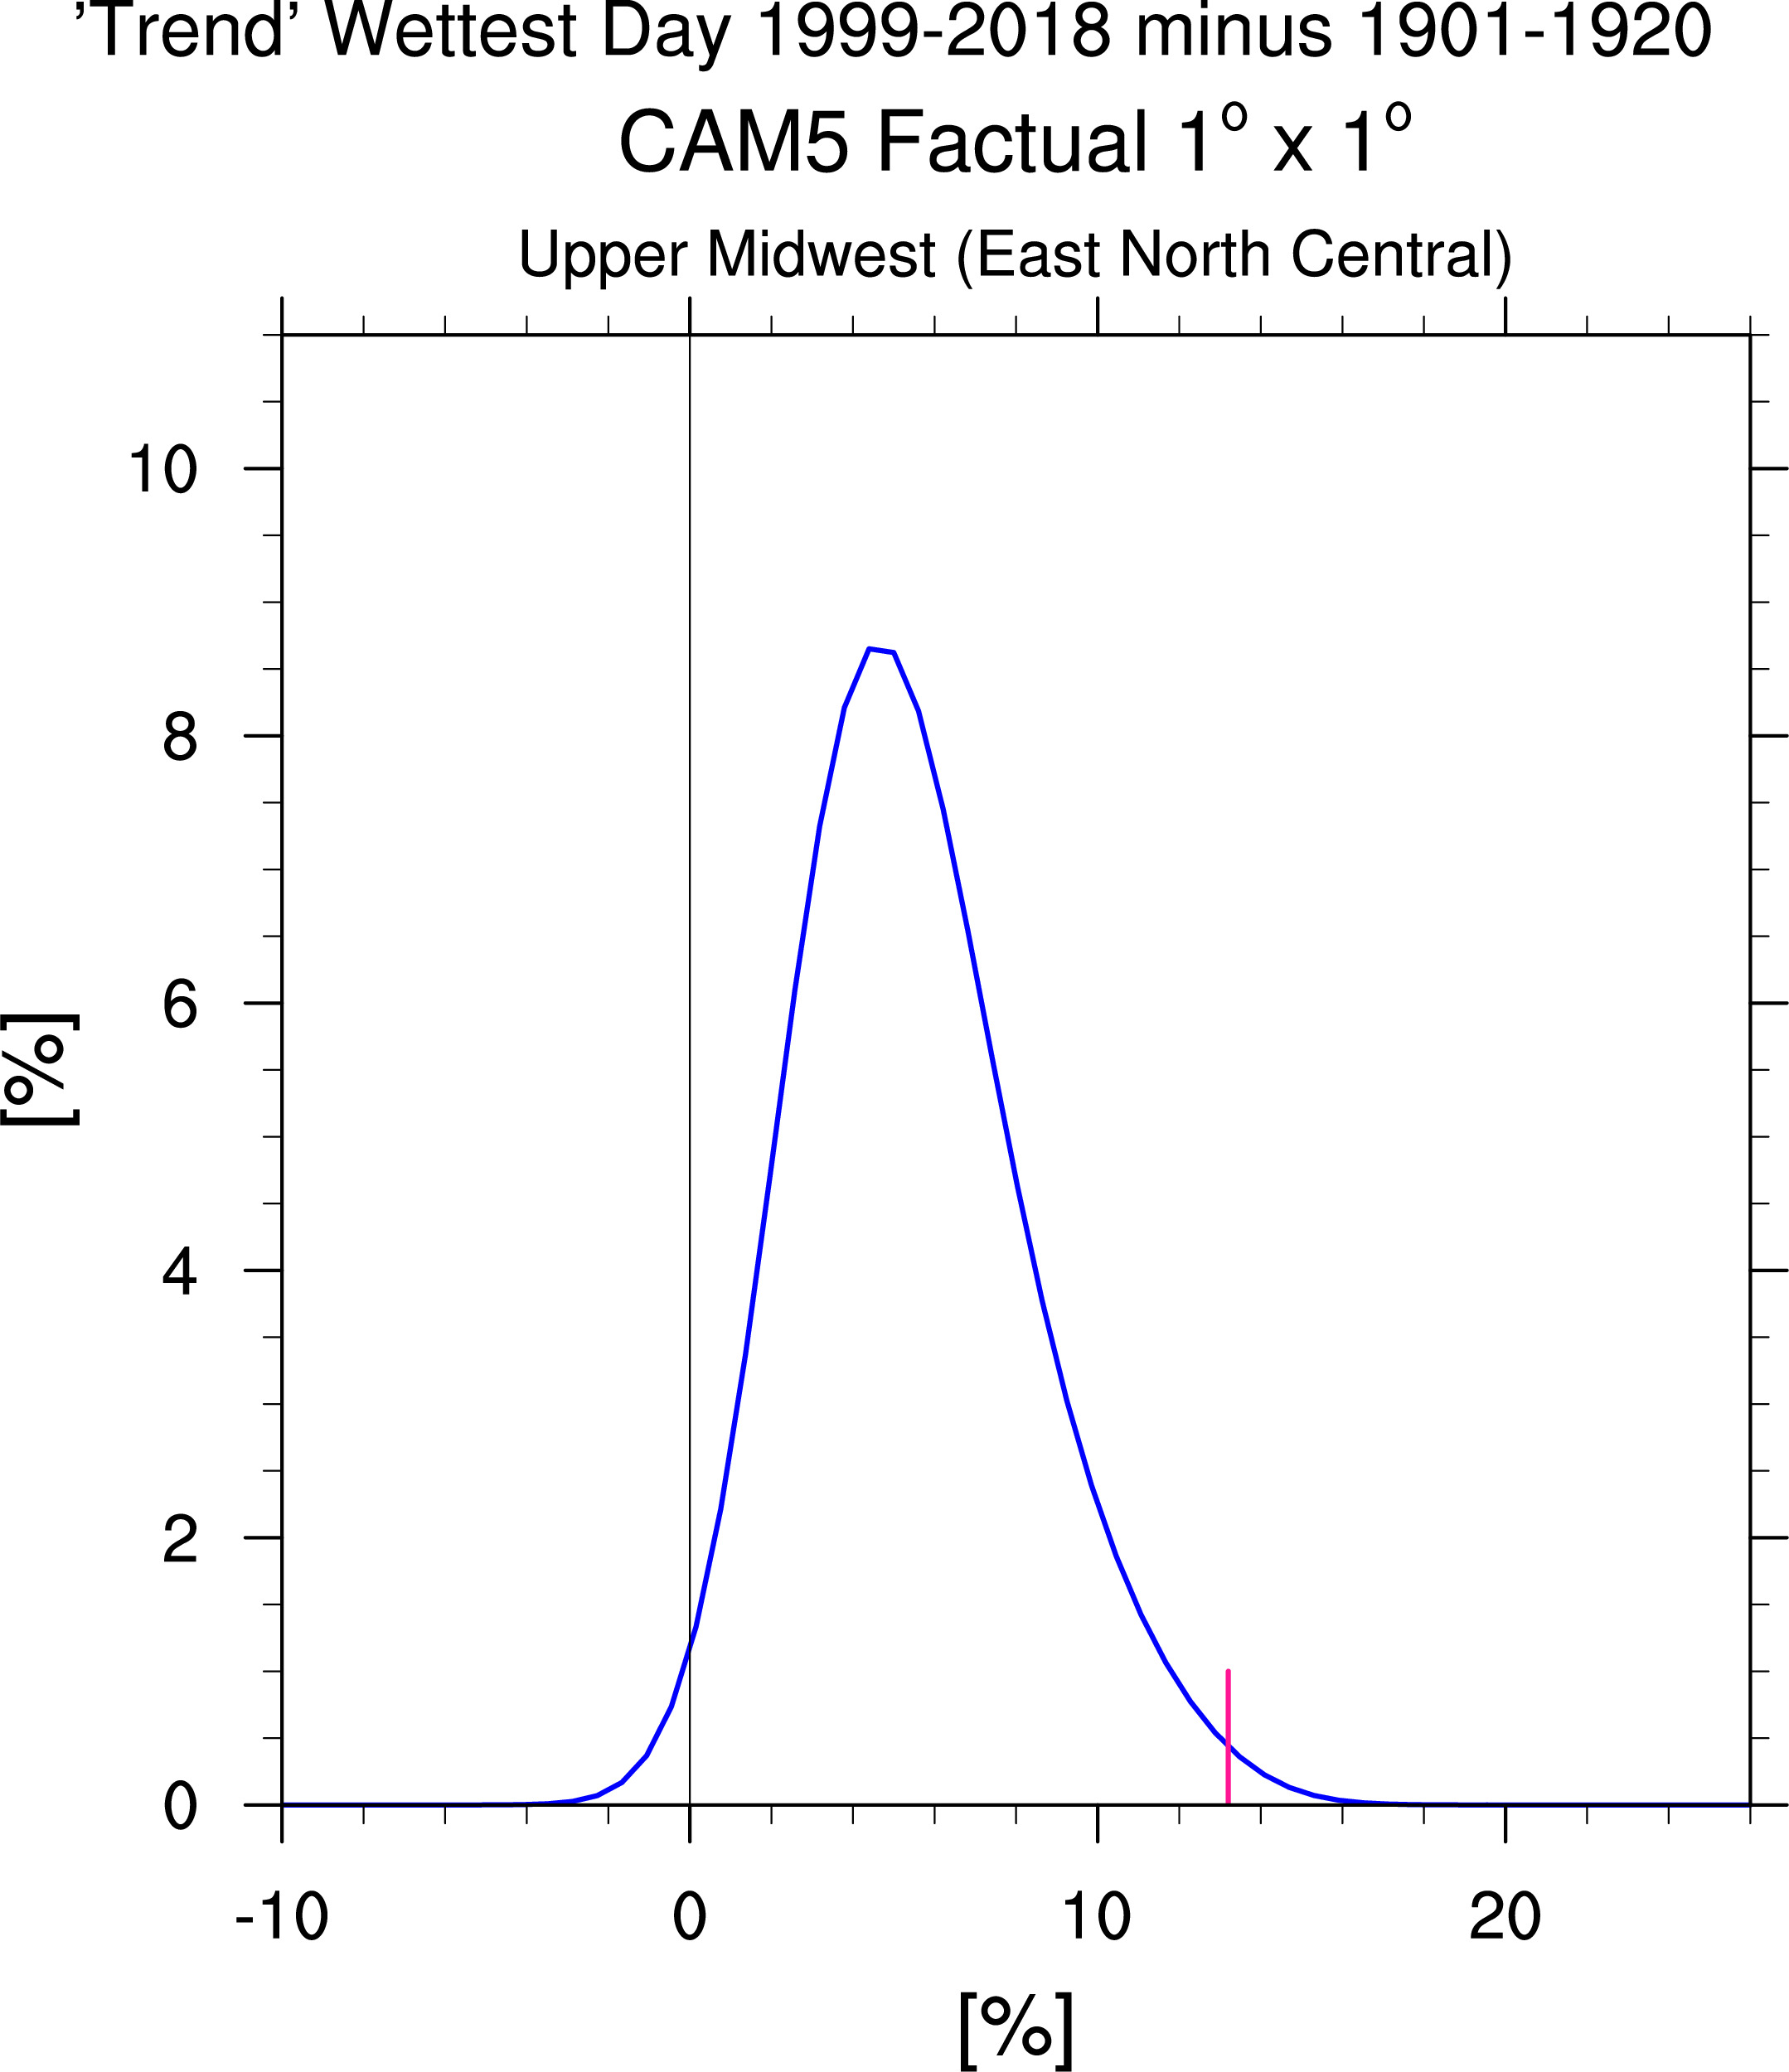
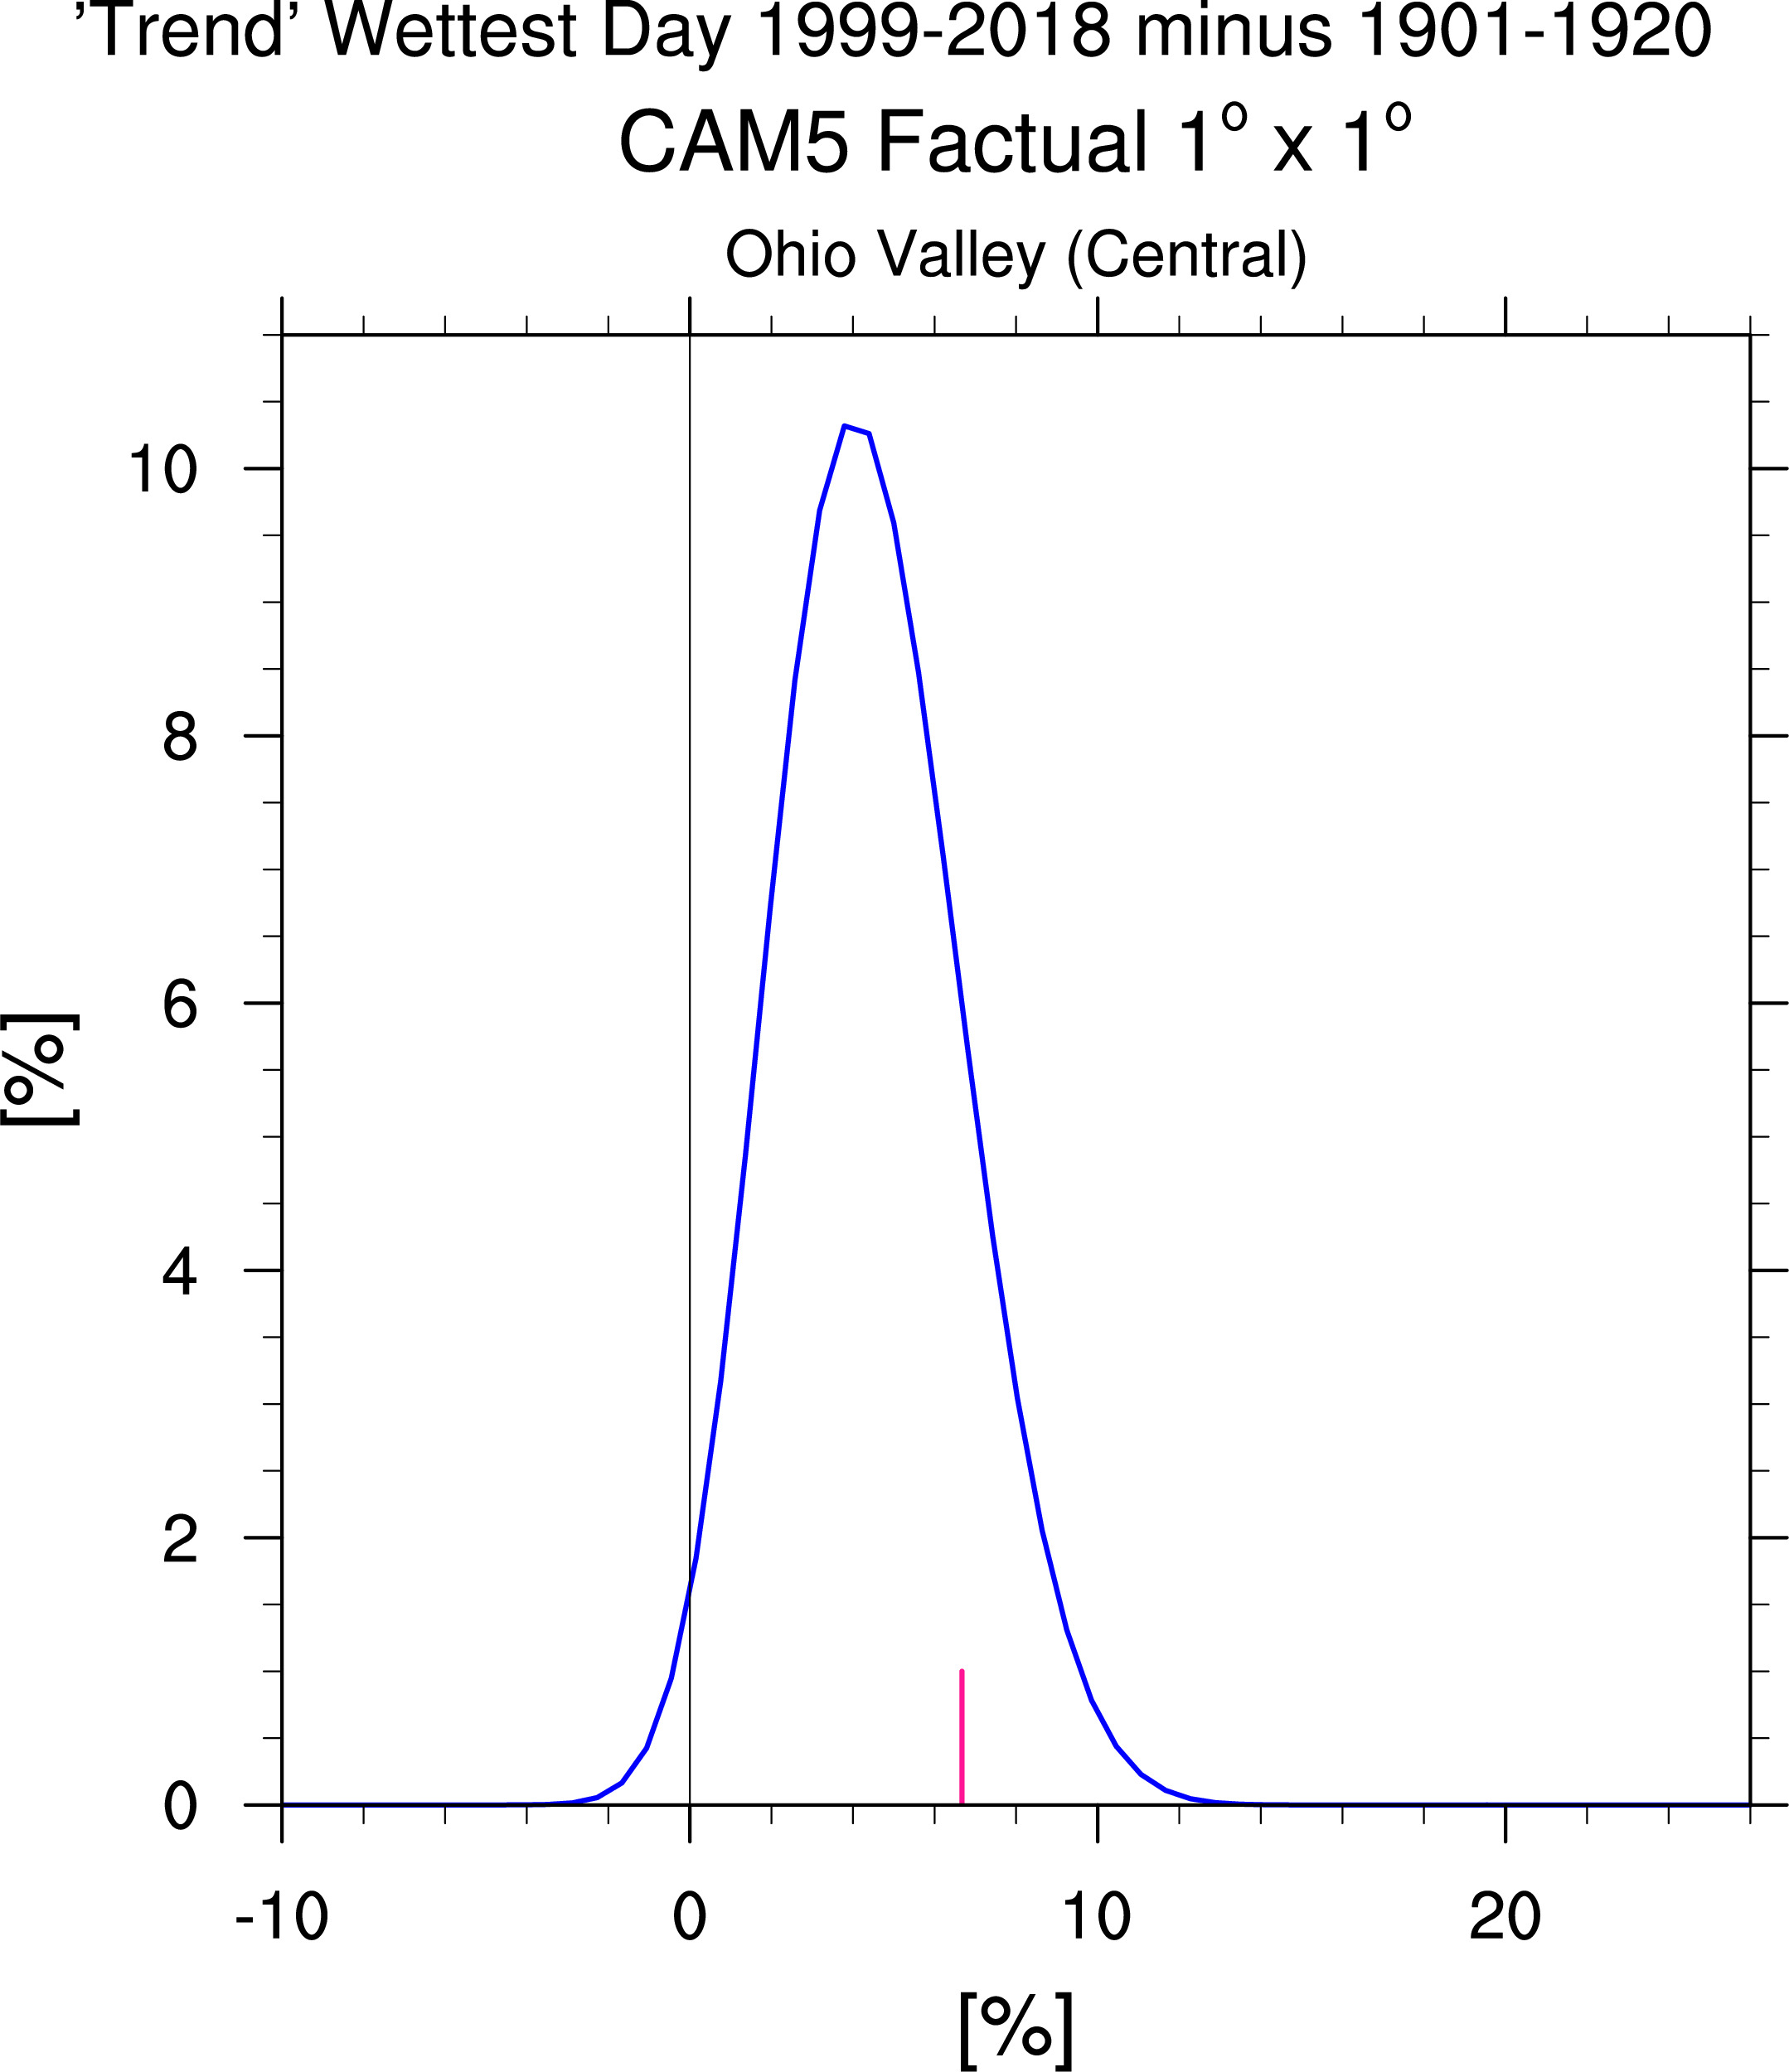
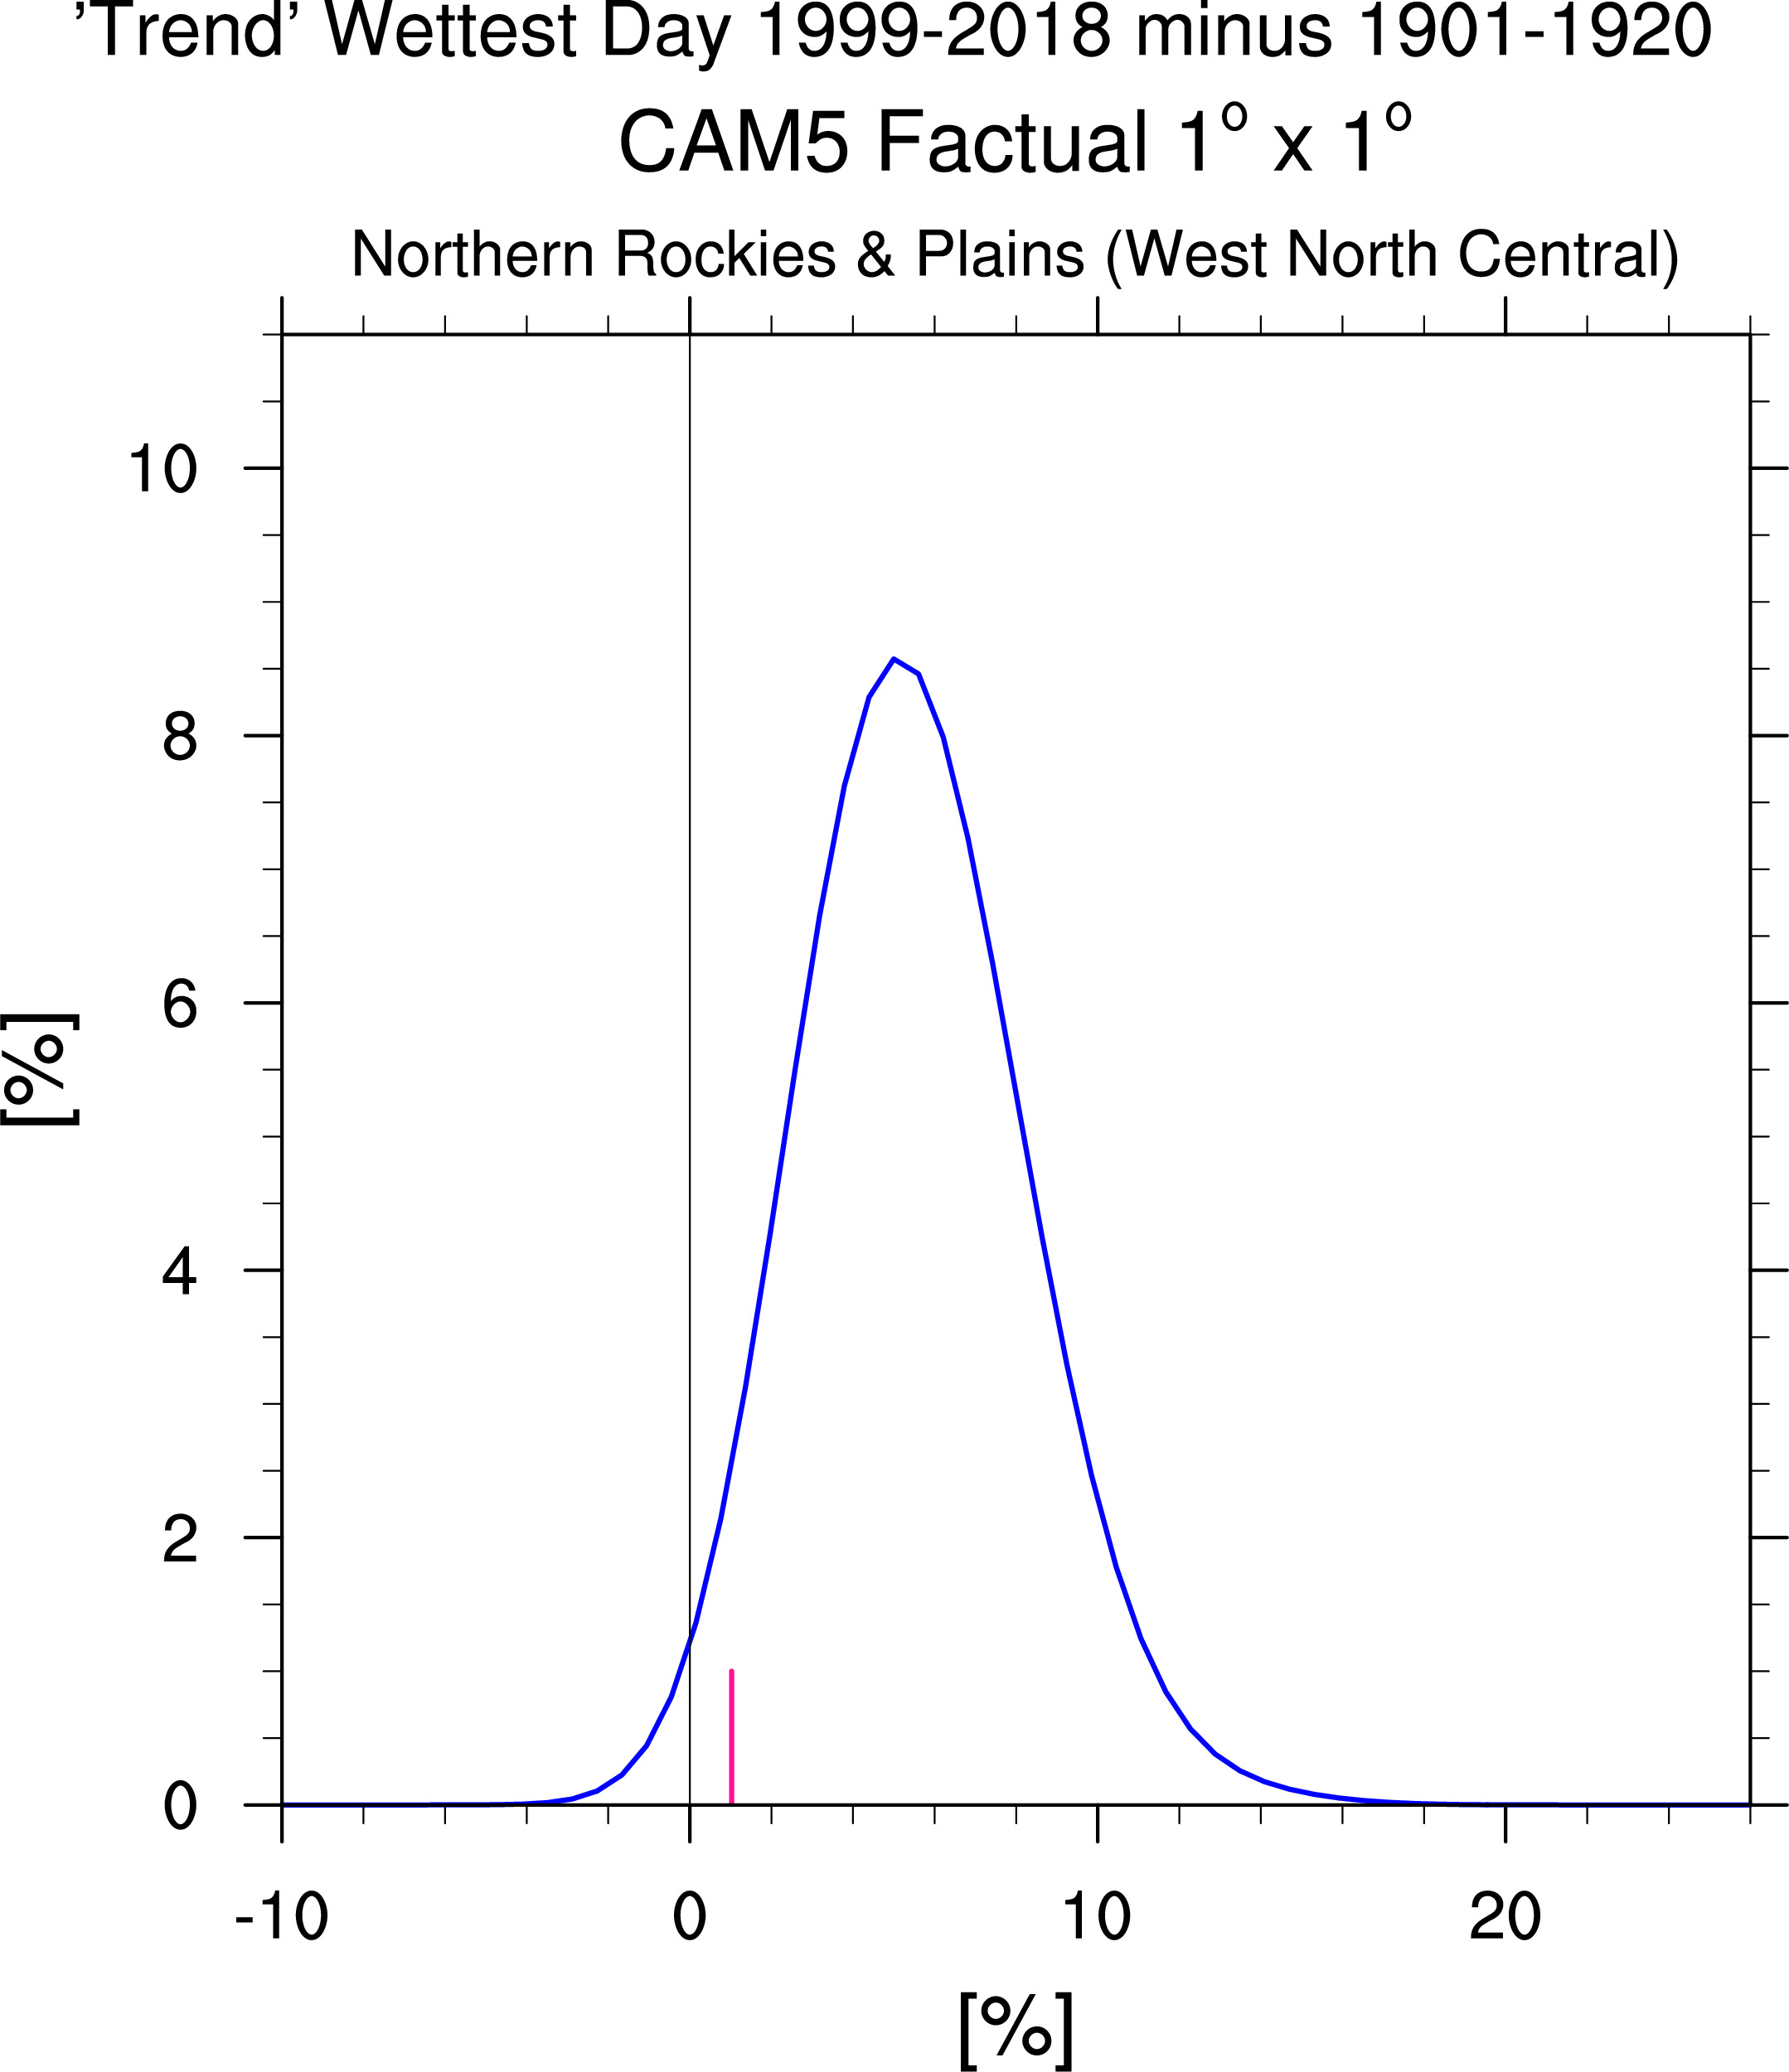
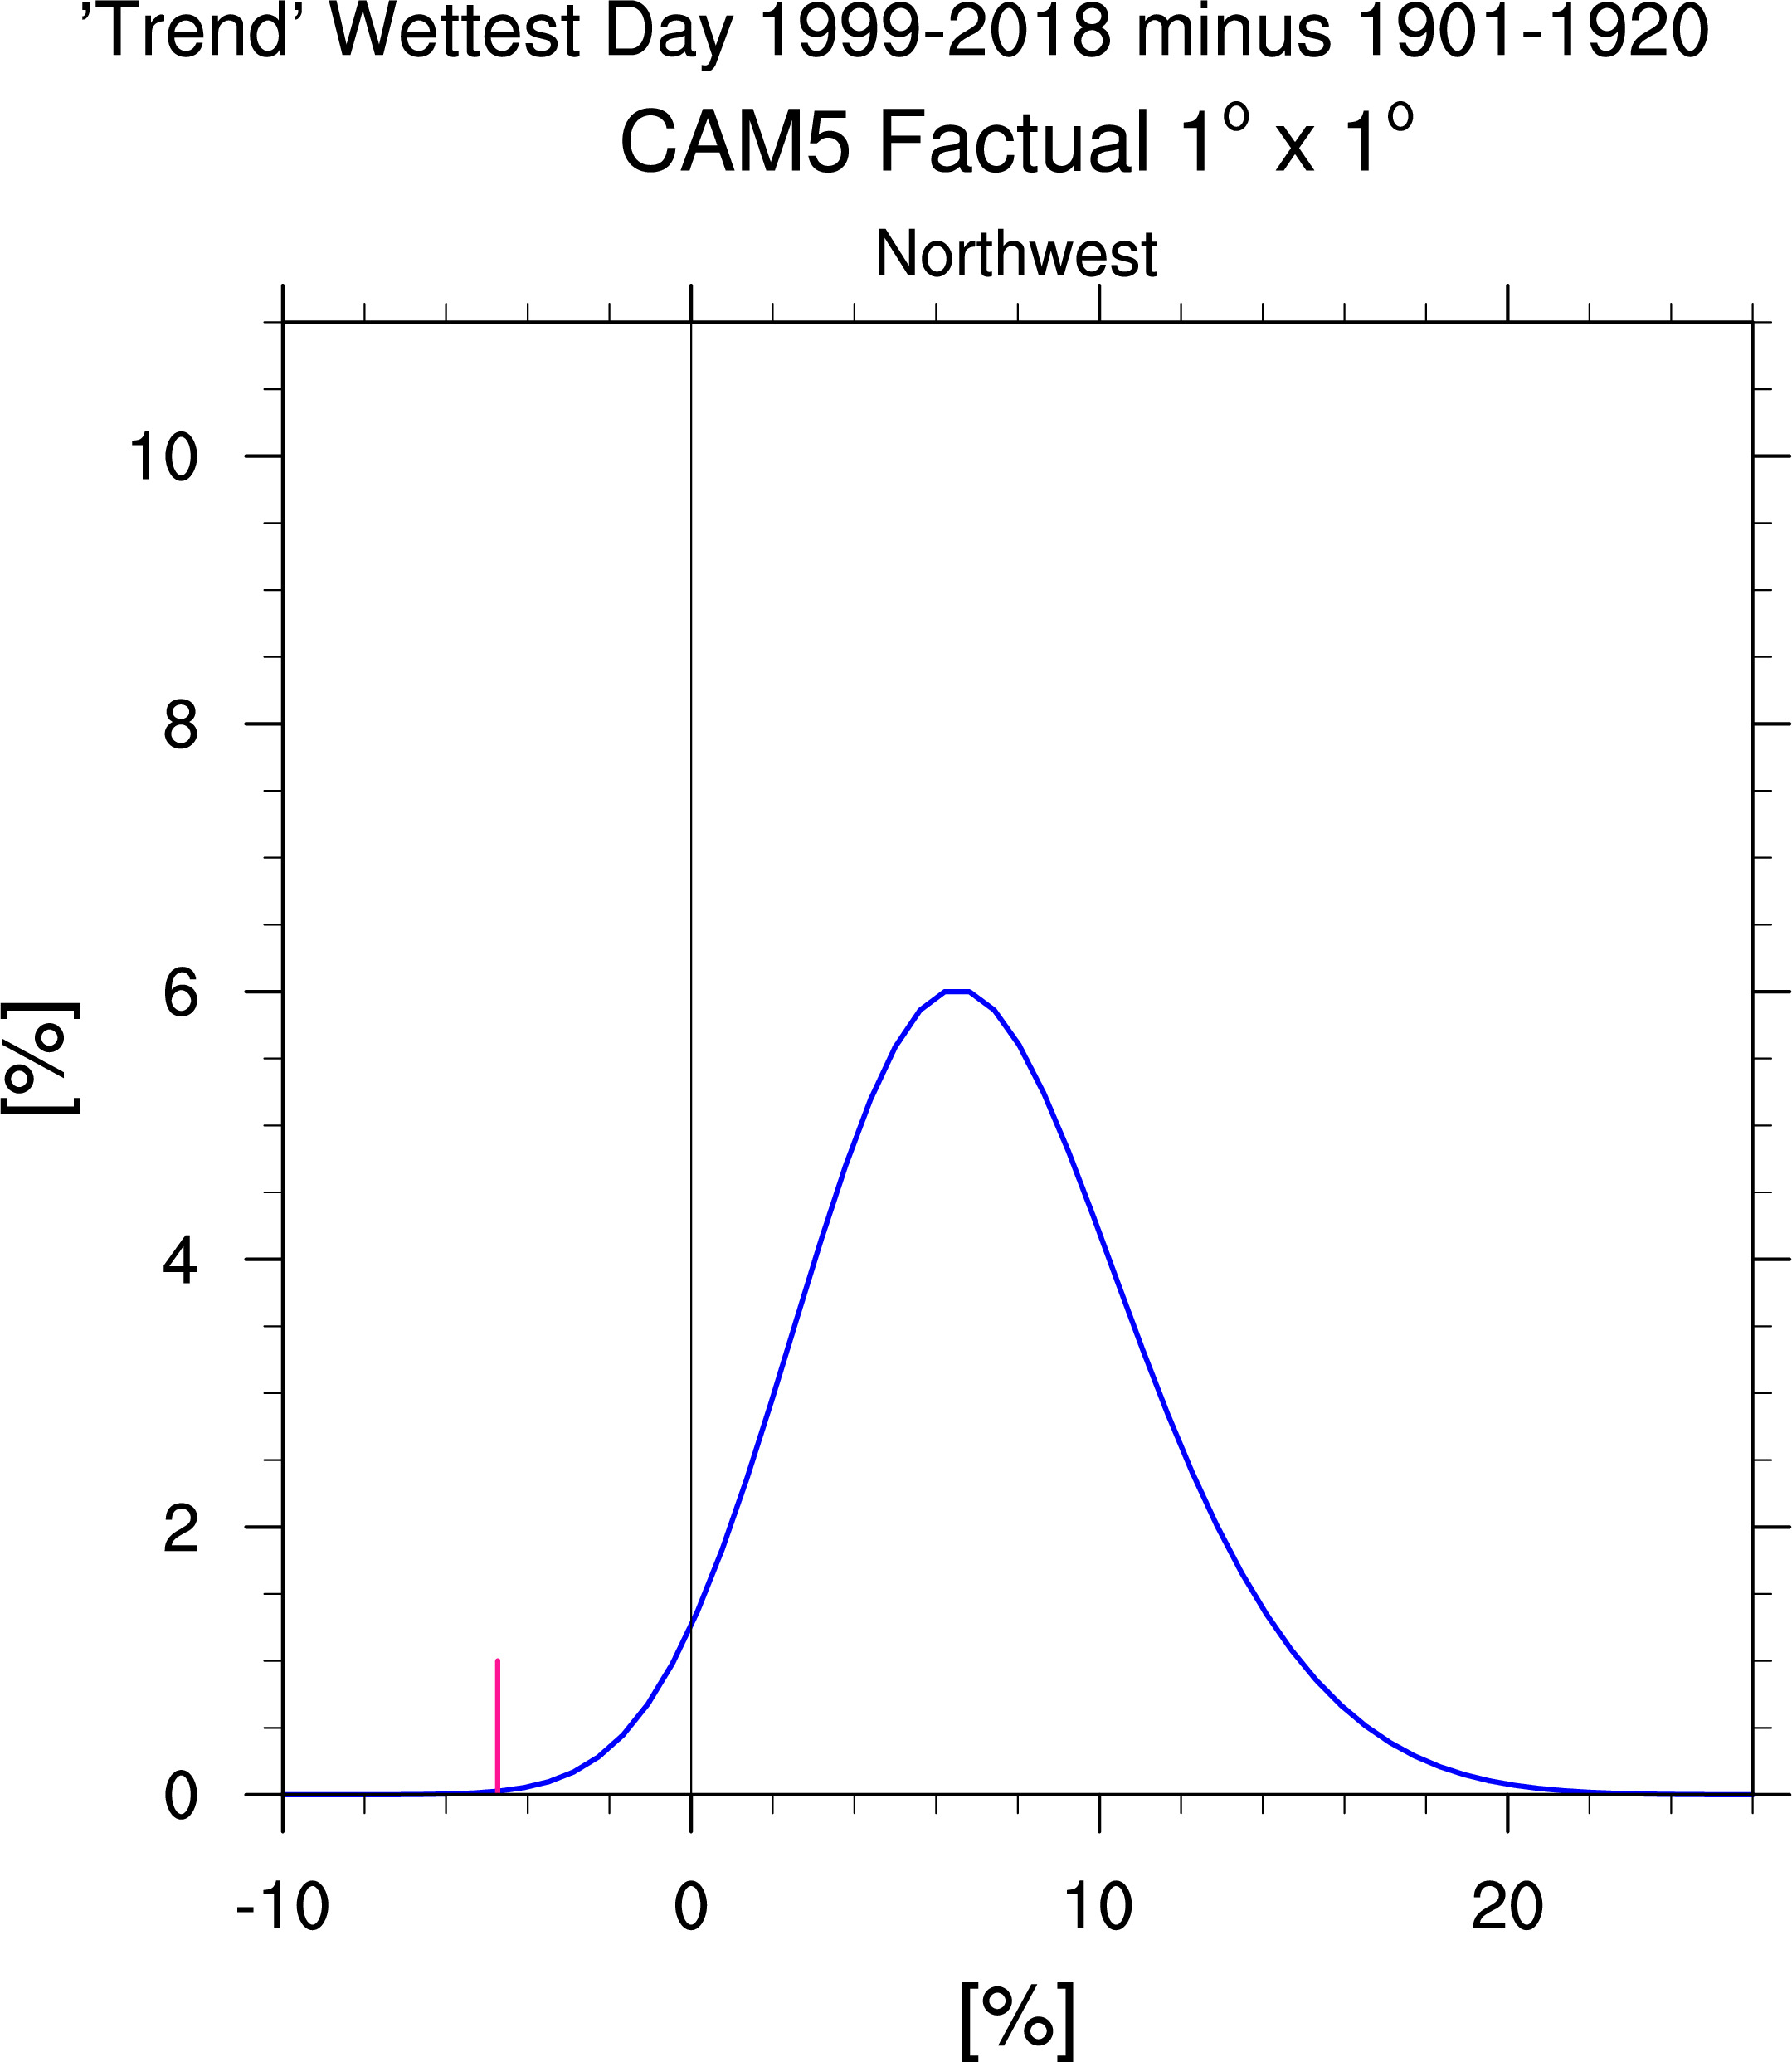
APA CAM5 1o x 1o 1901-1920 versus 1999-2018
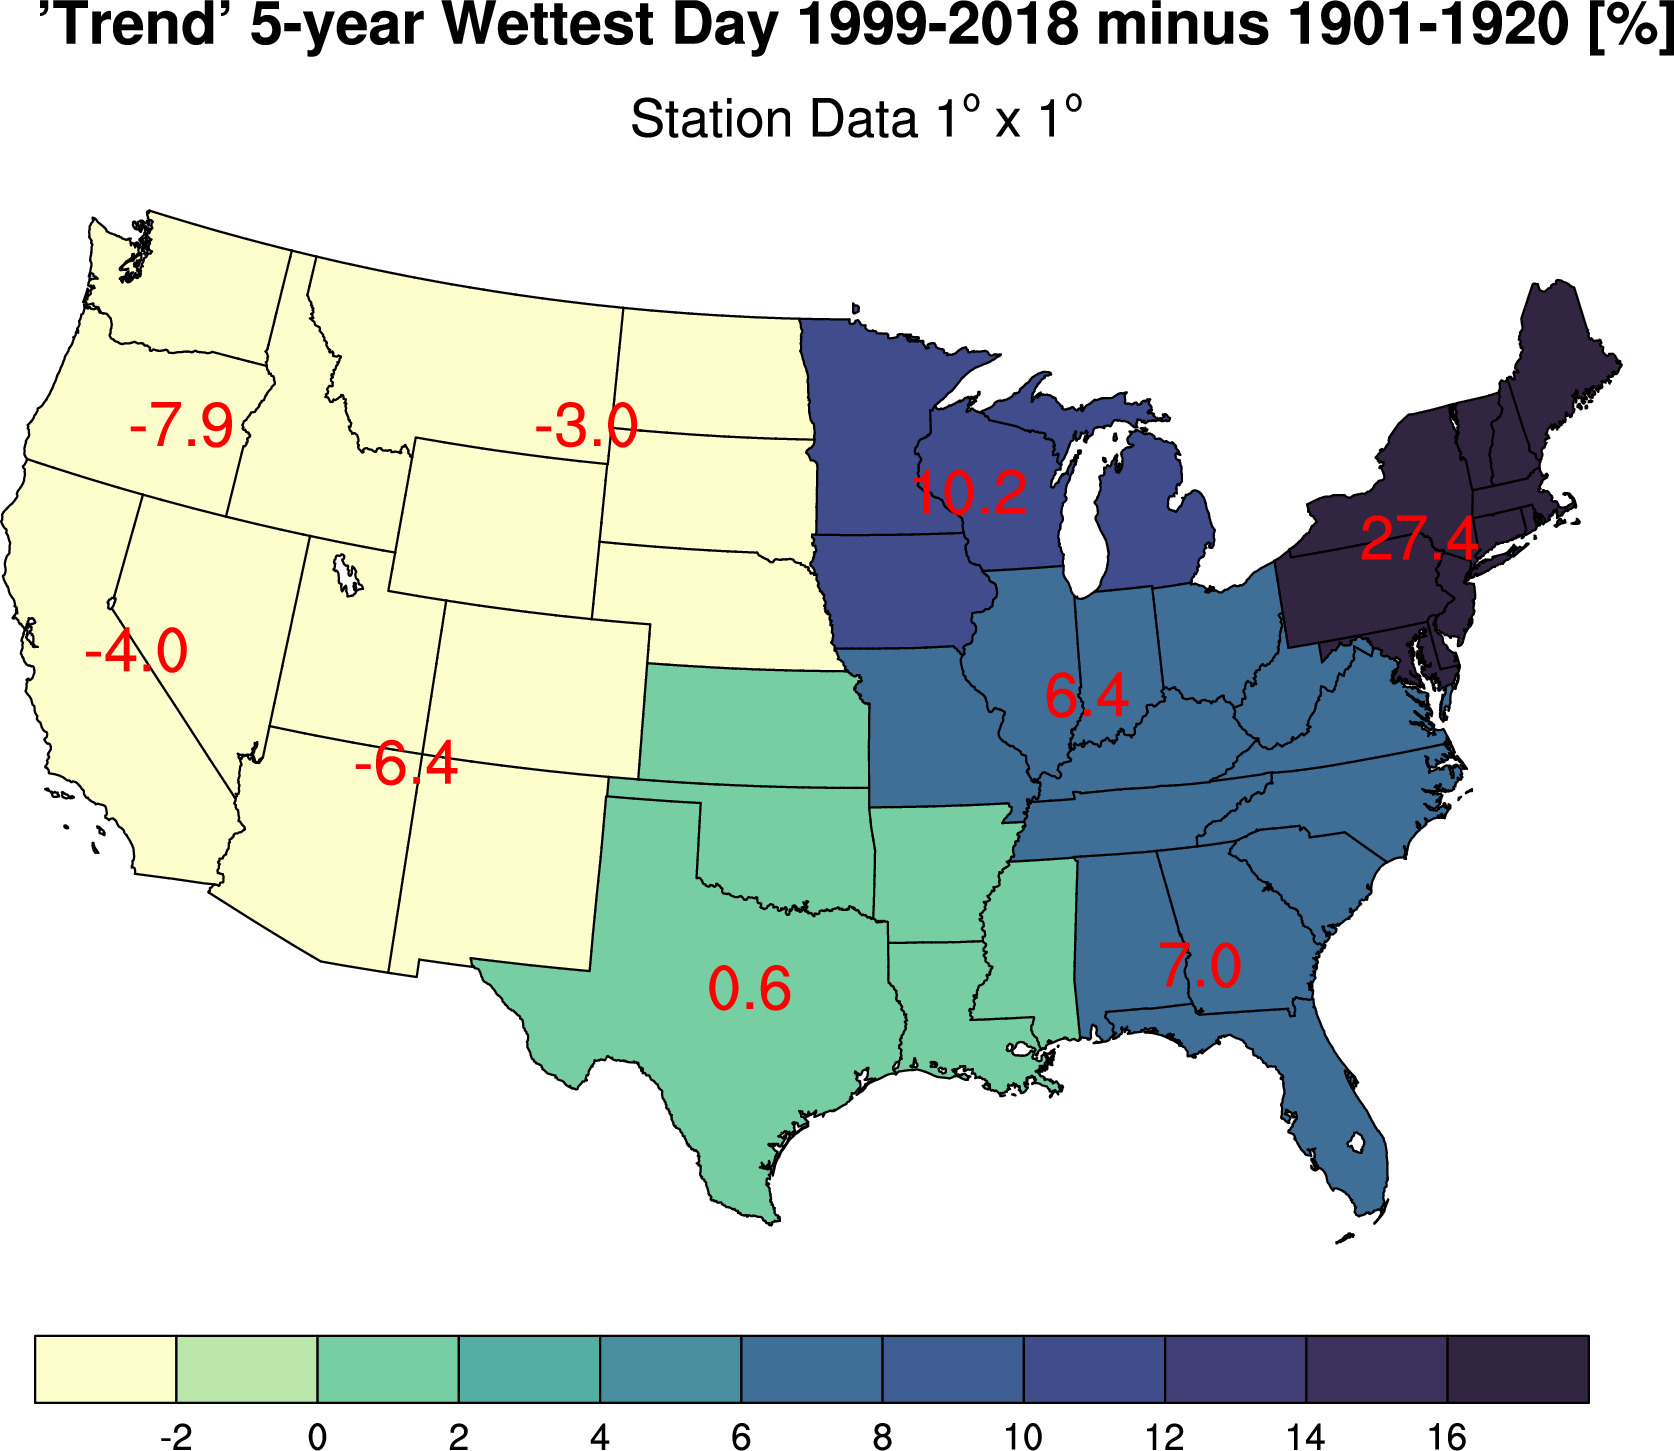
Below average of 4 5-year maximas for two periods (diffs give 'trends')
Below pink line is Station Data 'trend' for region
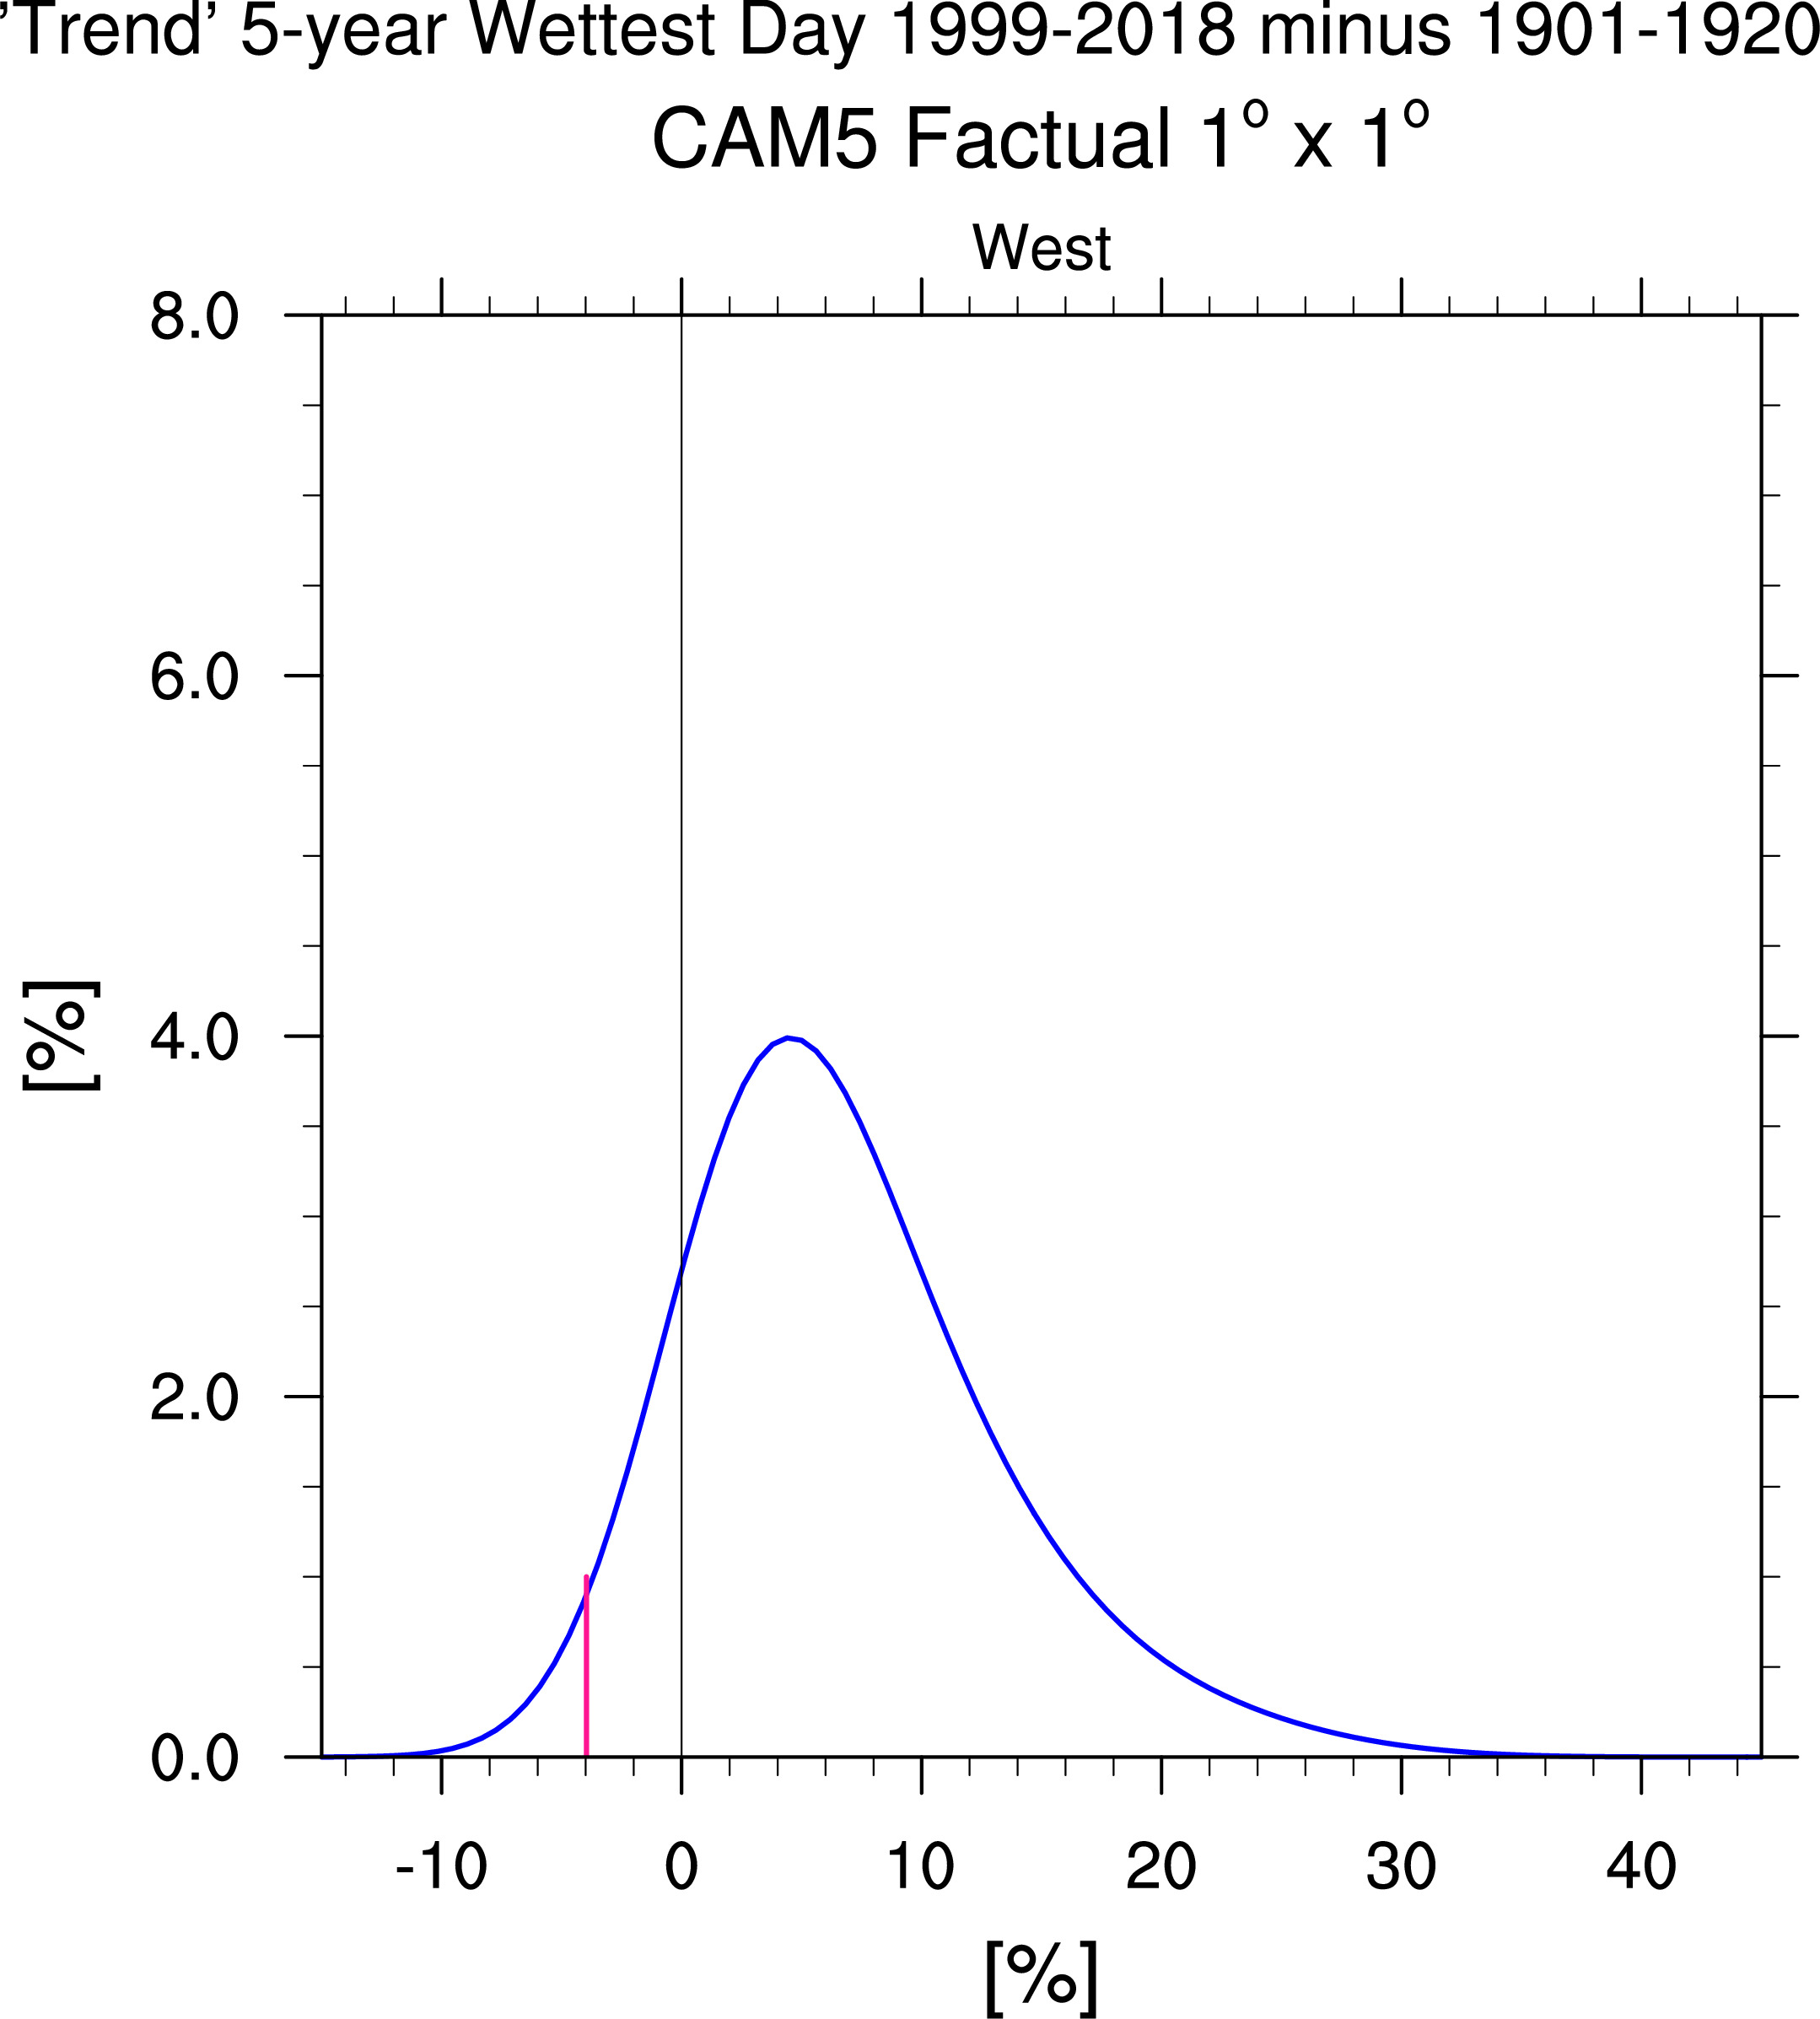
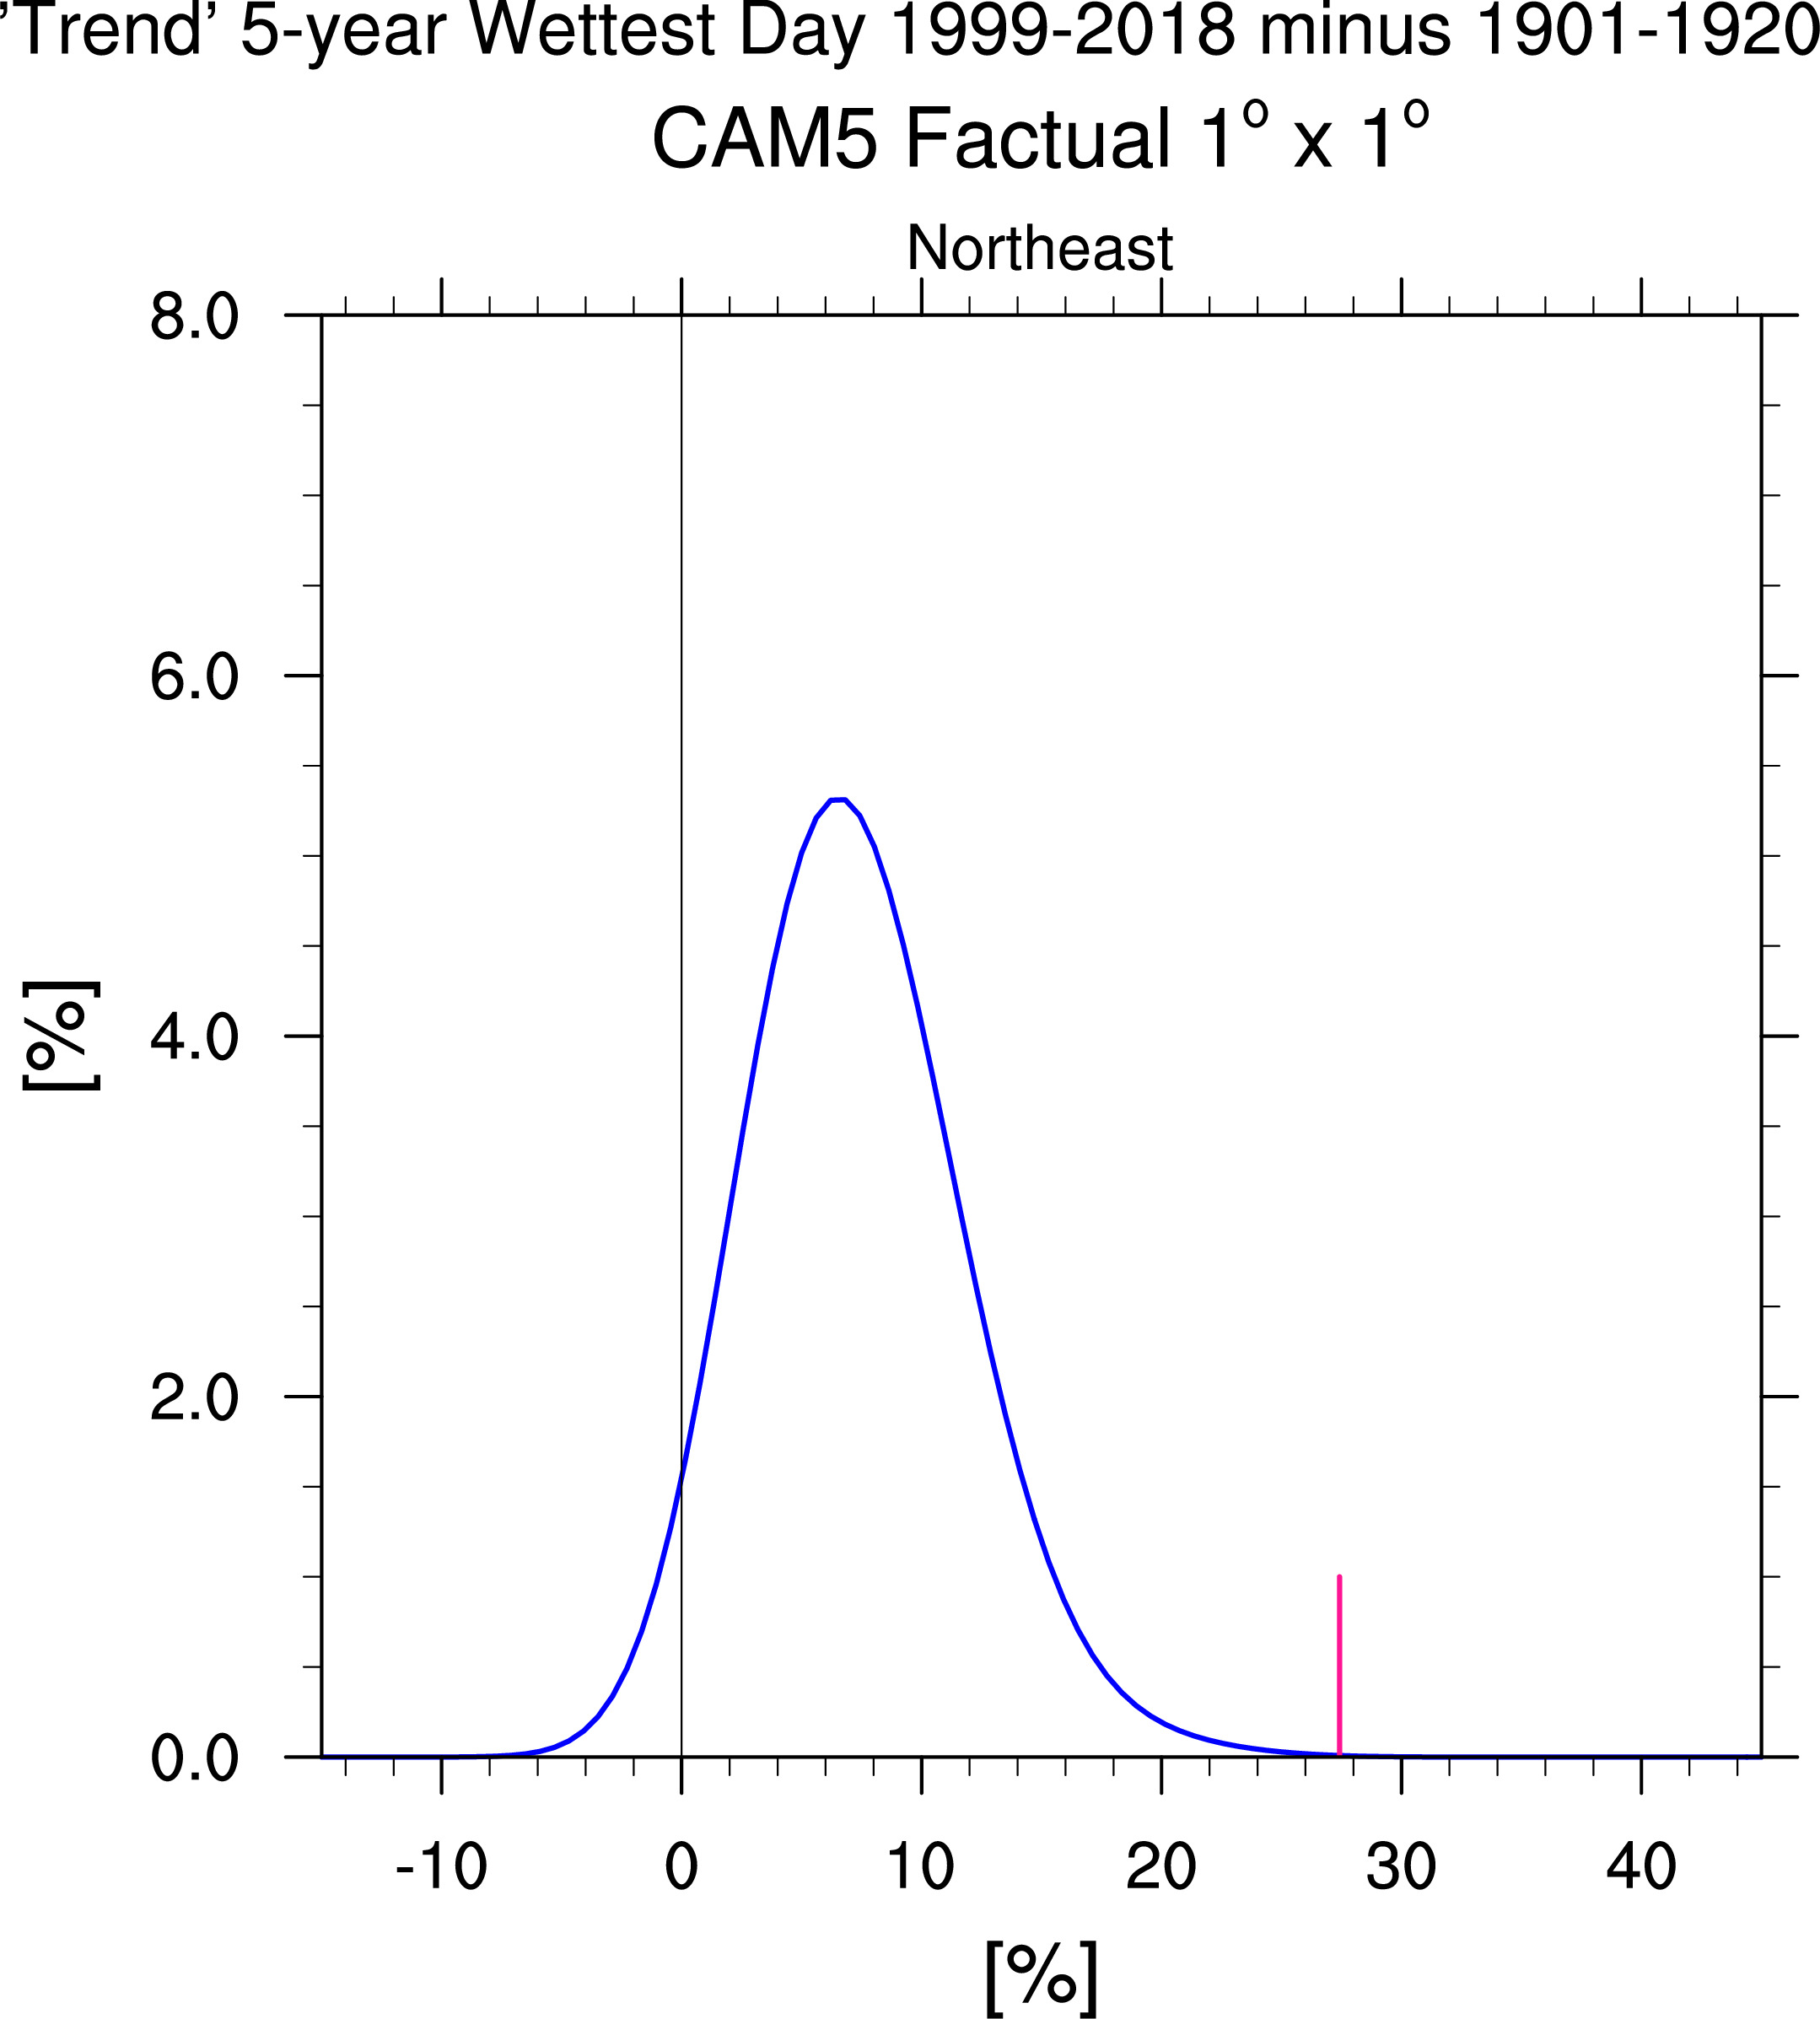
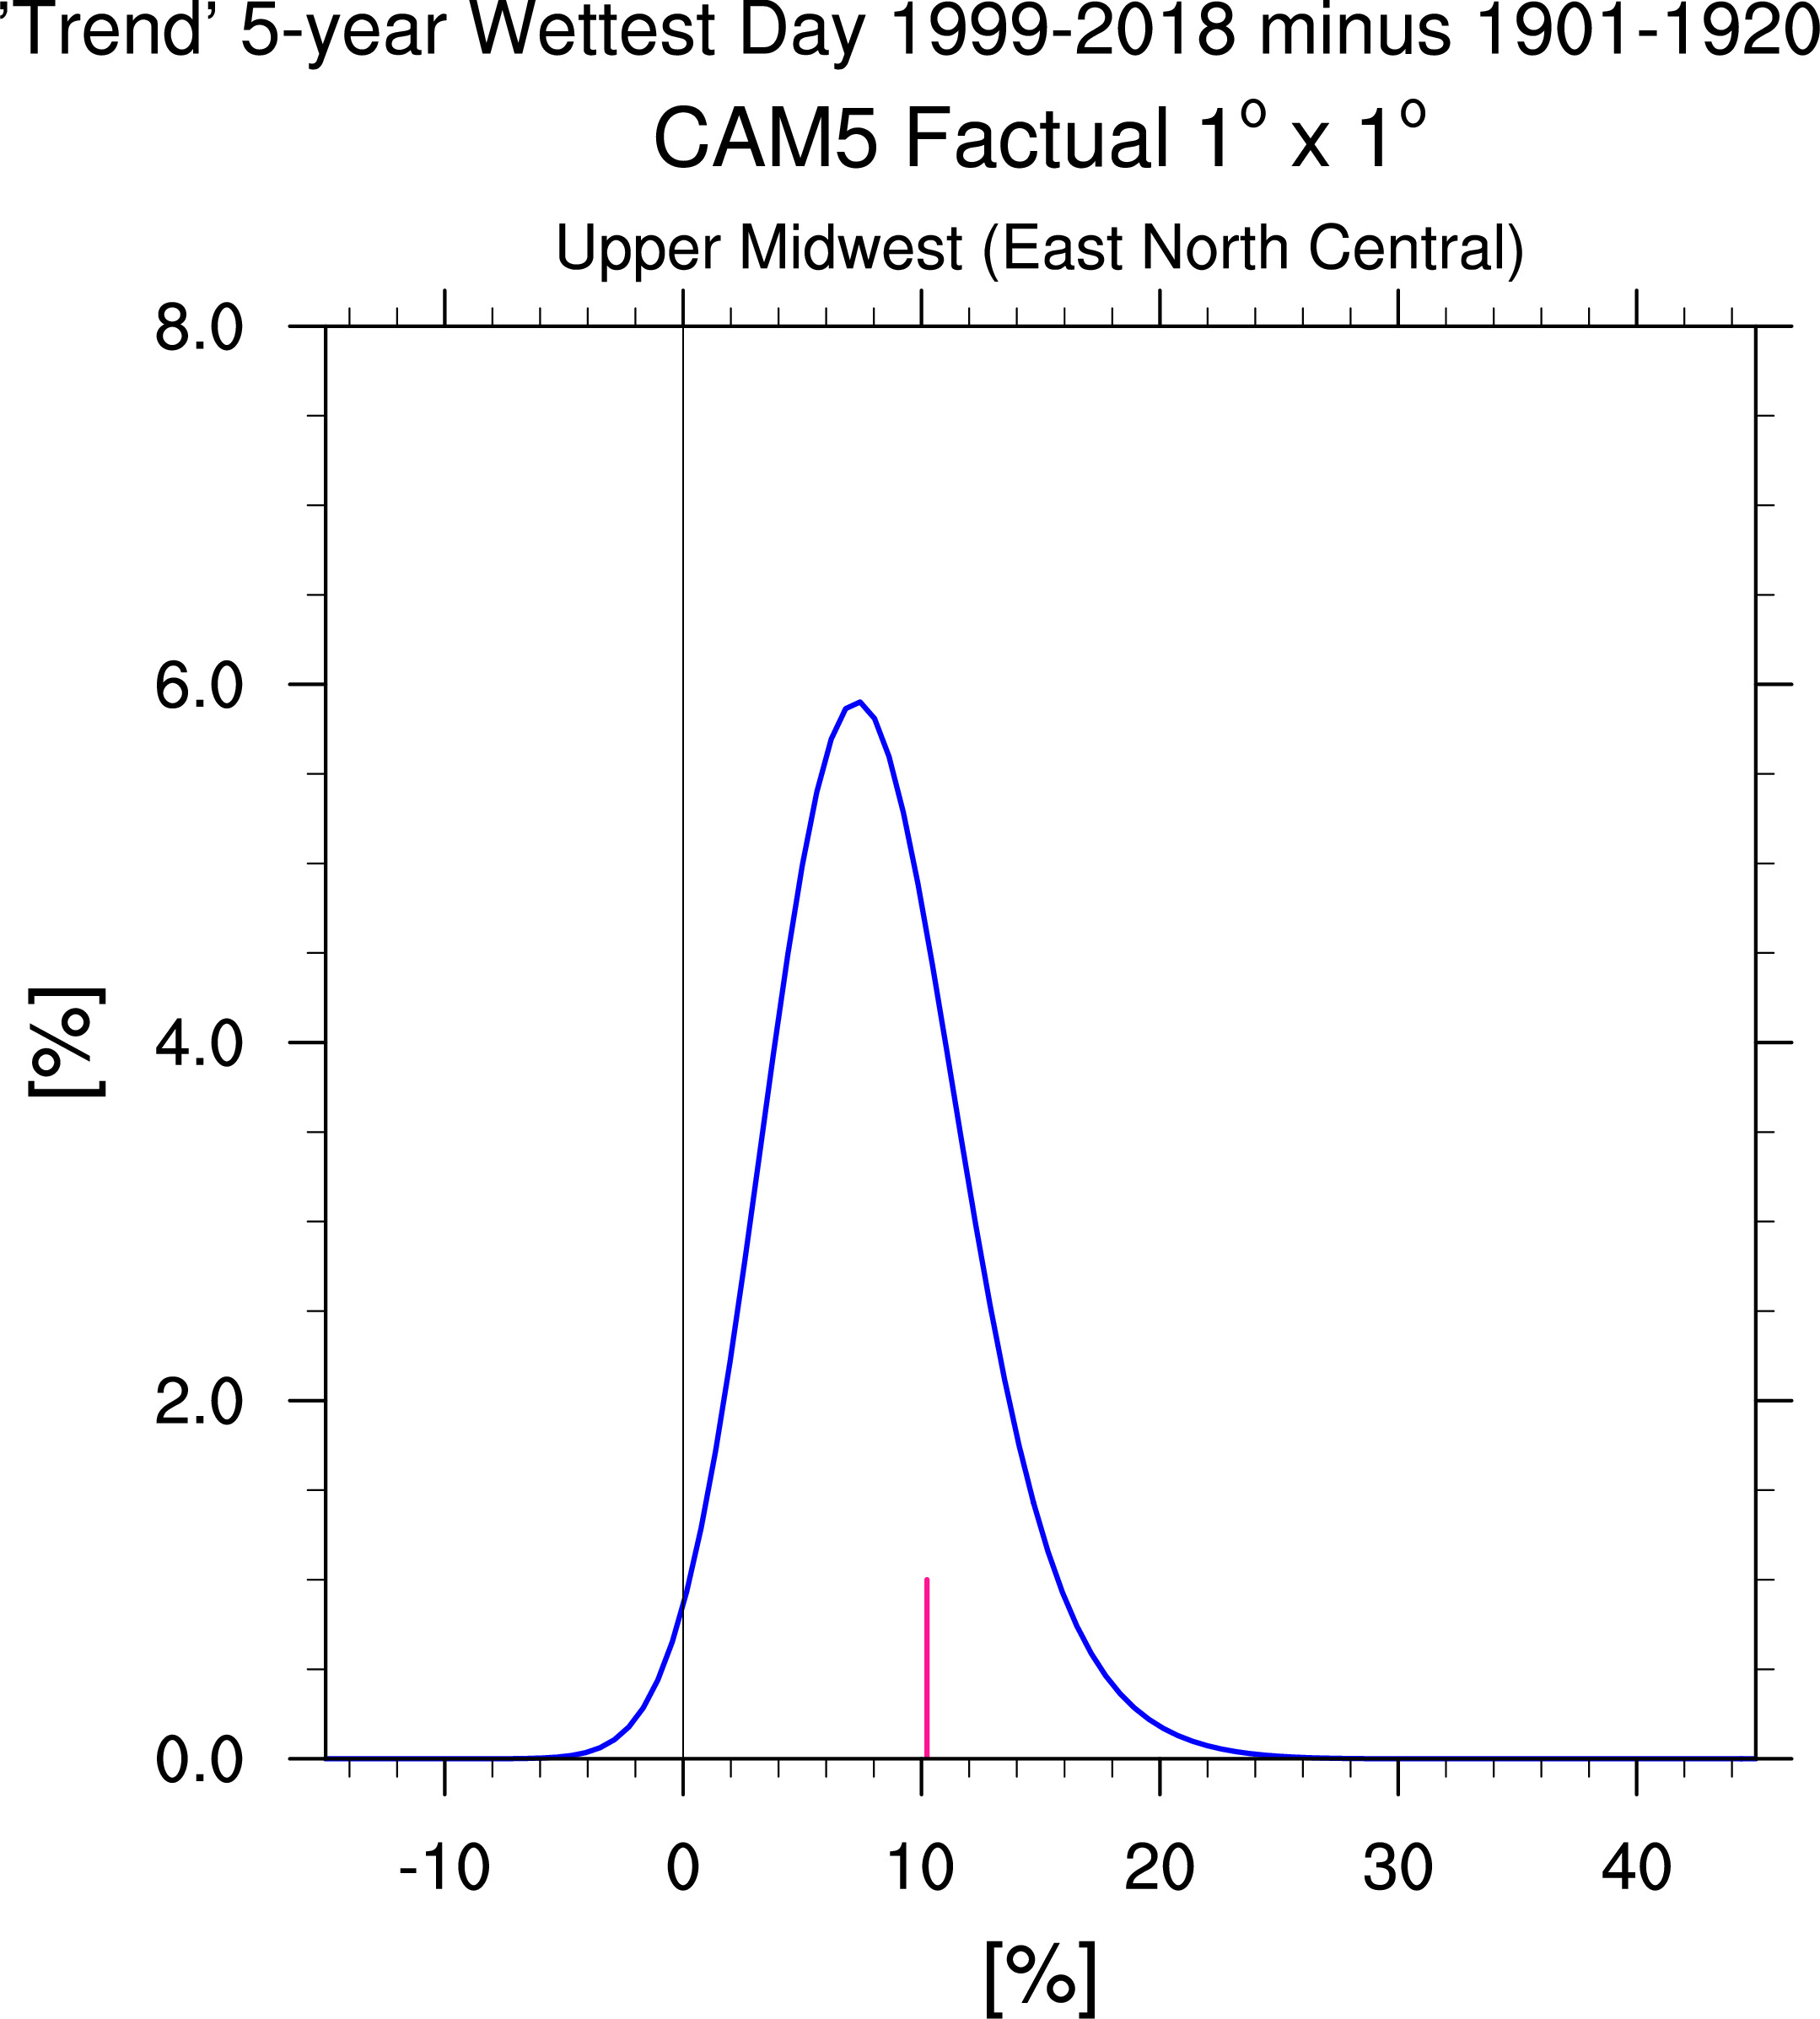
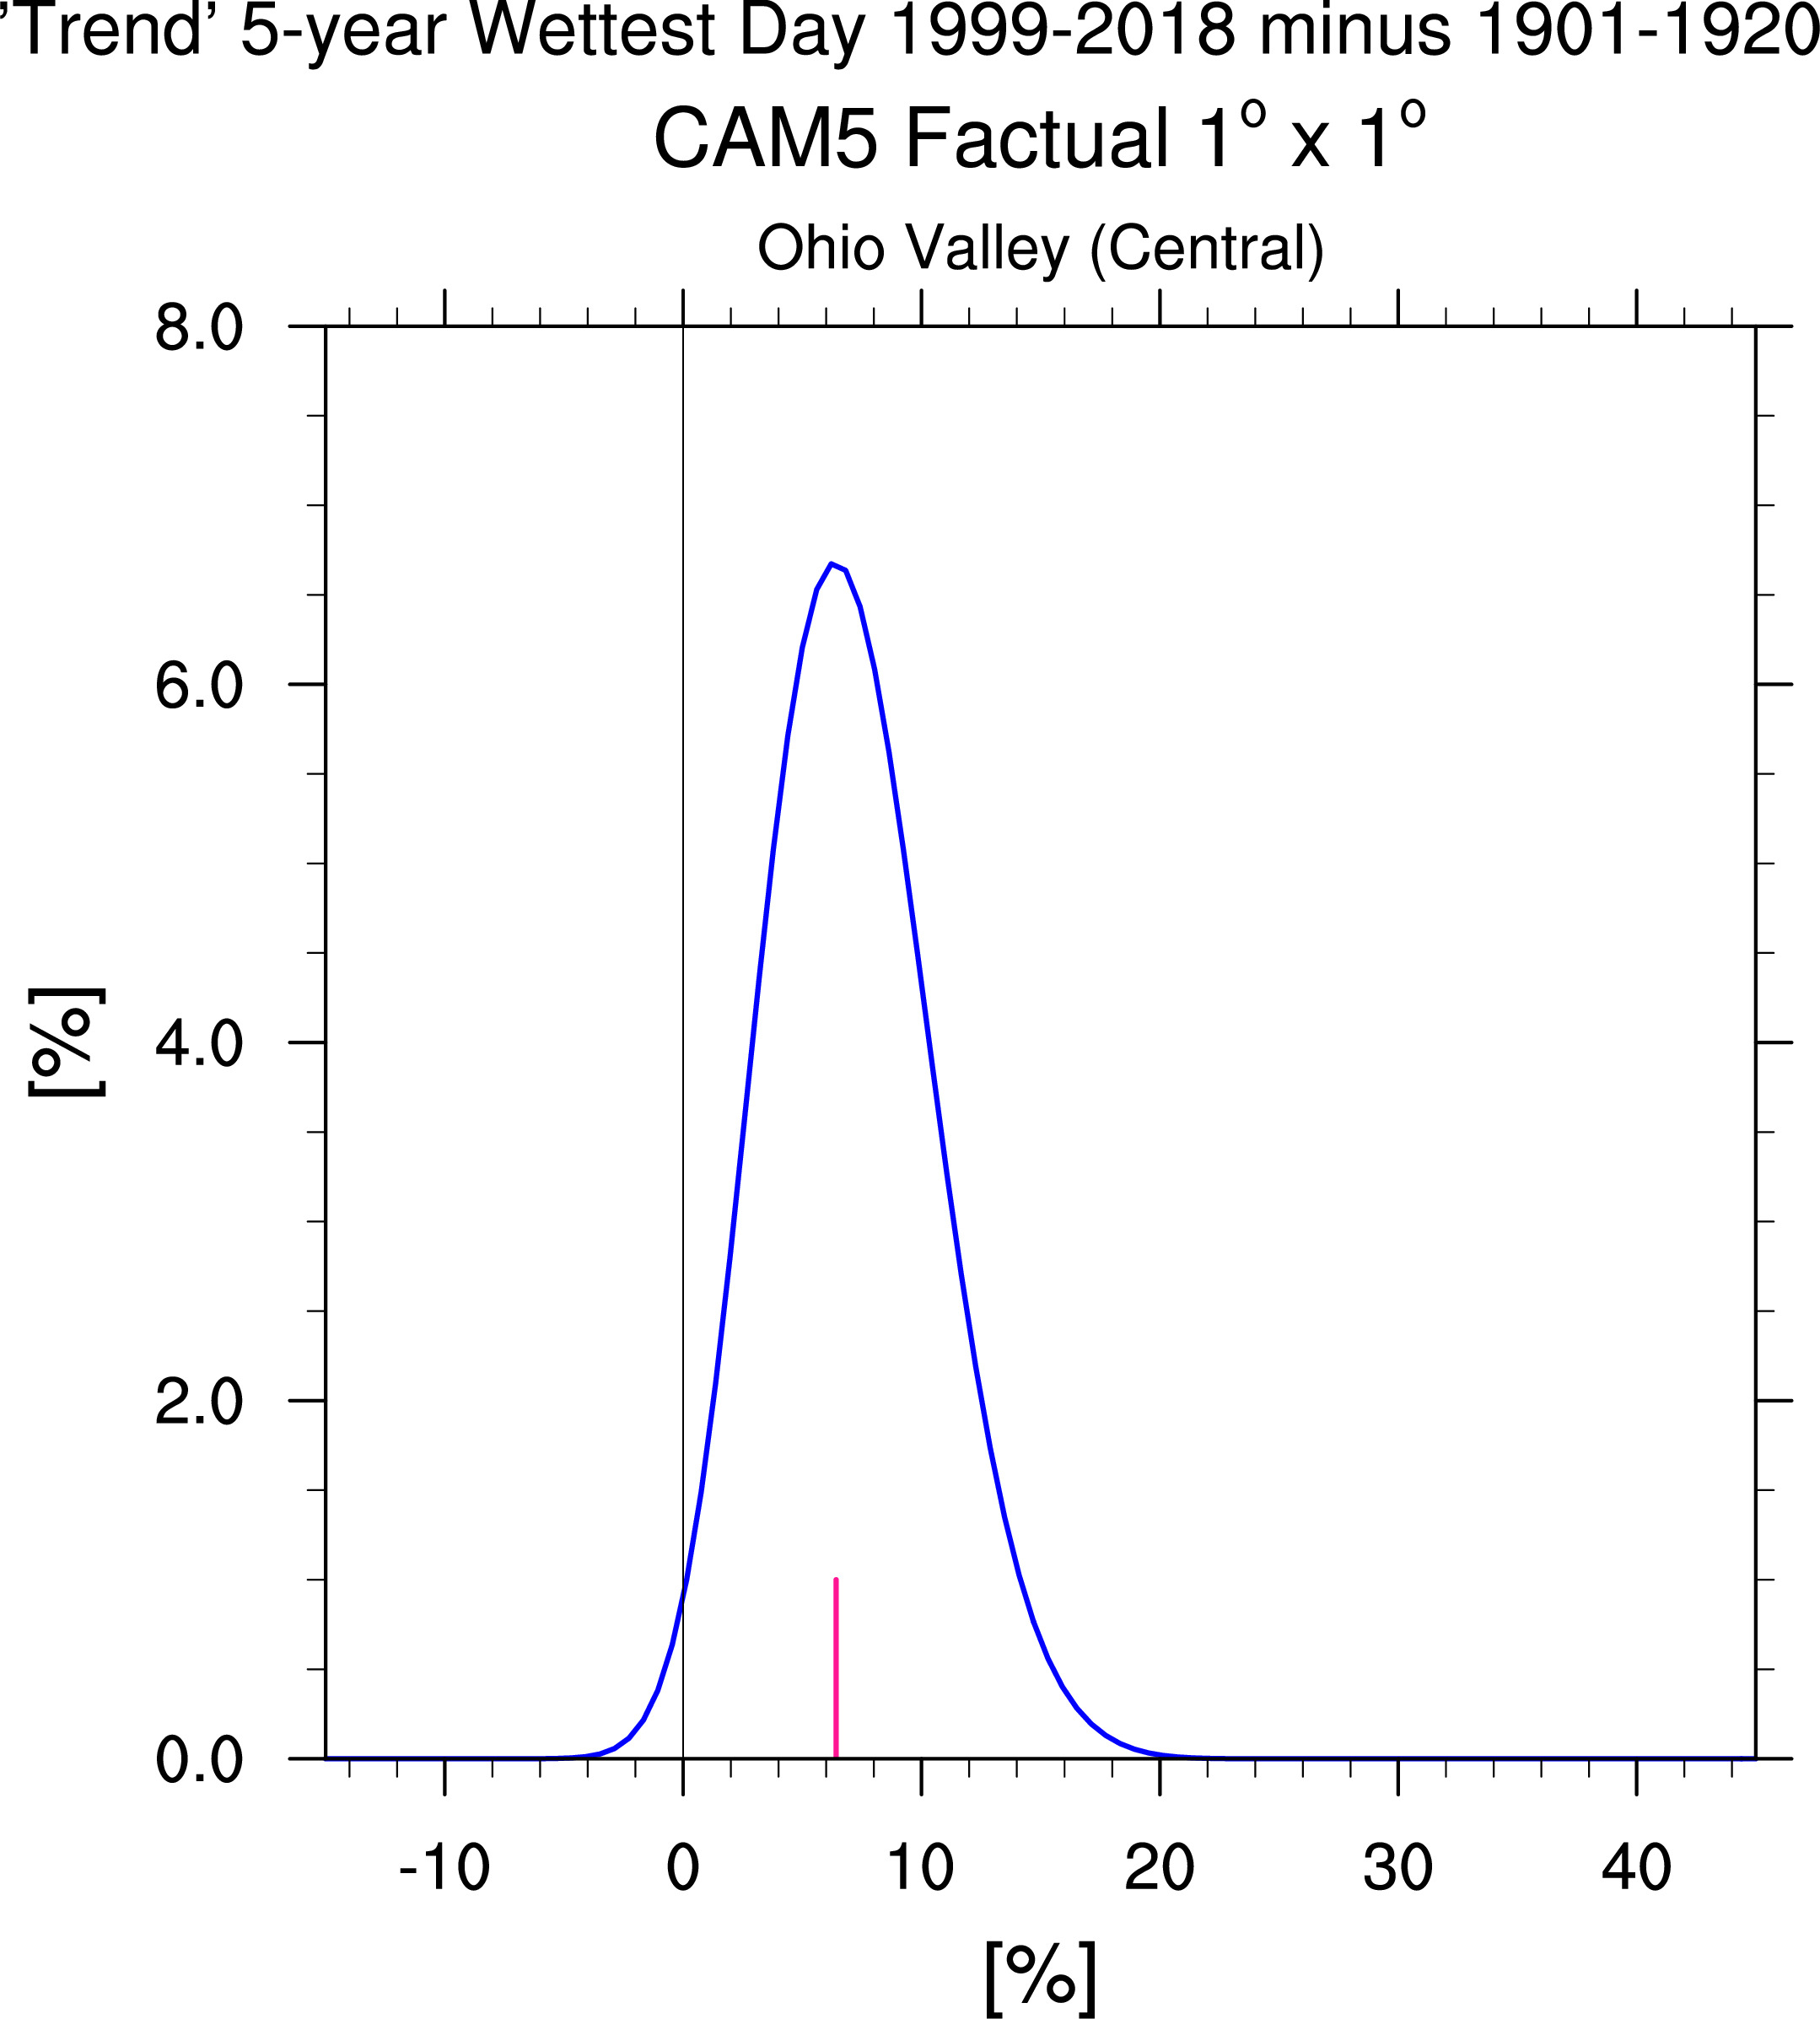
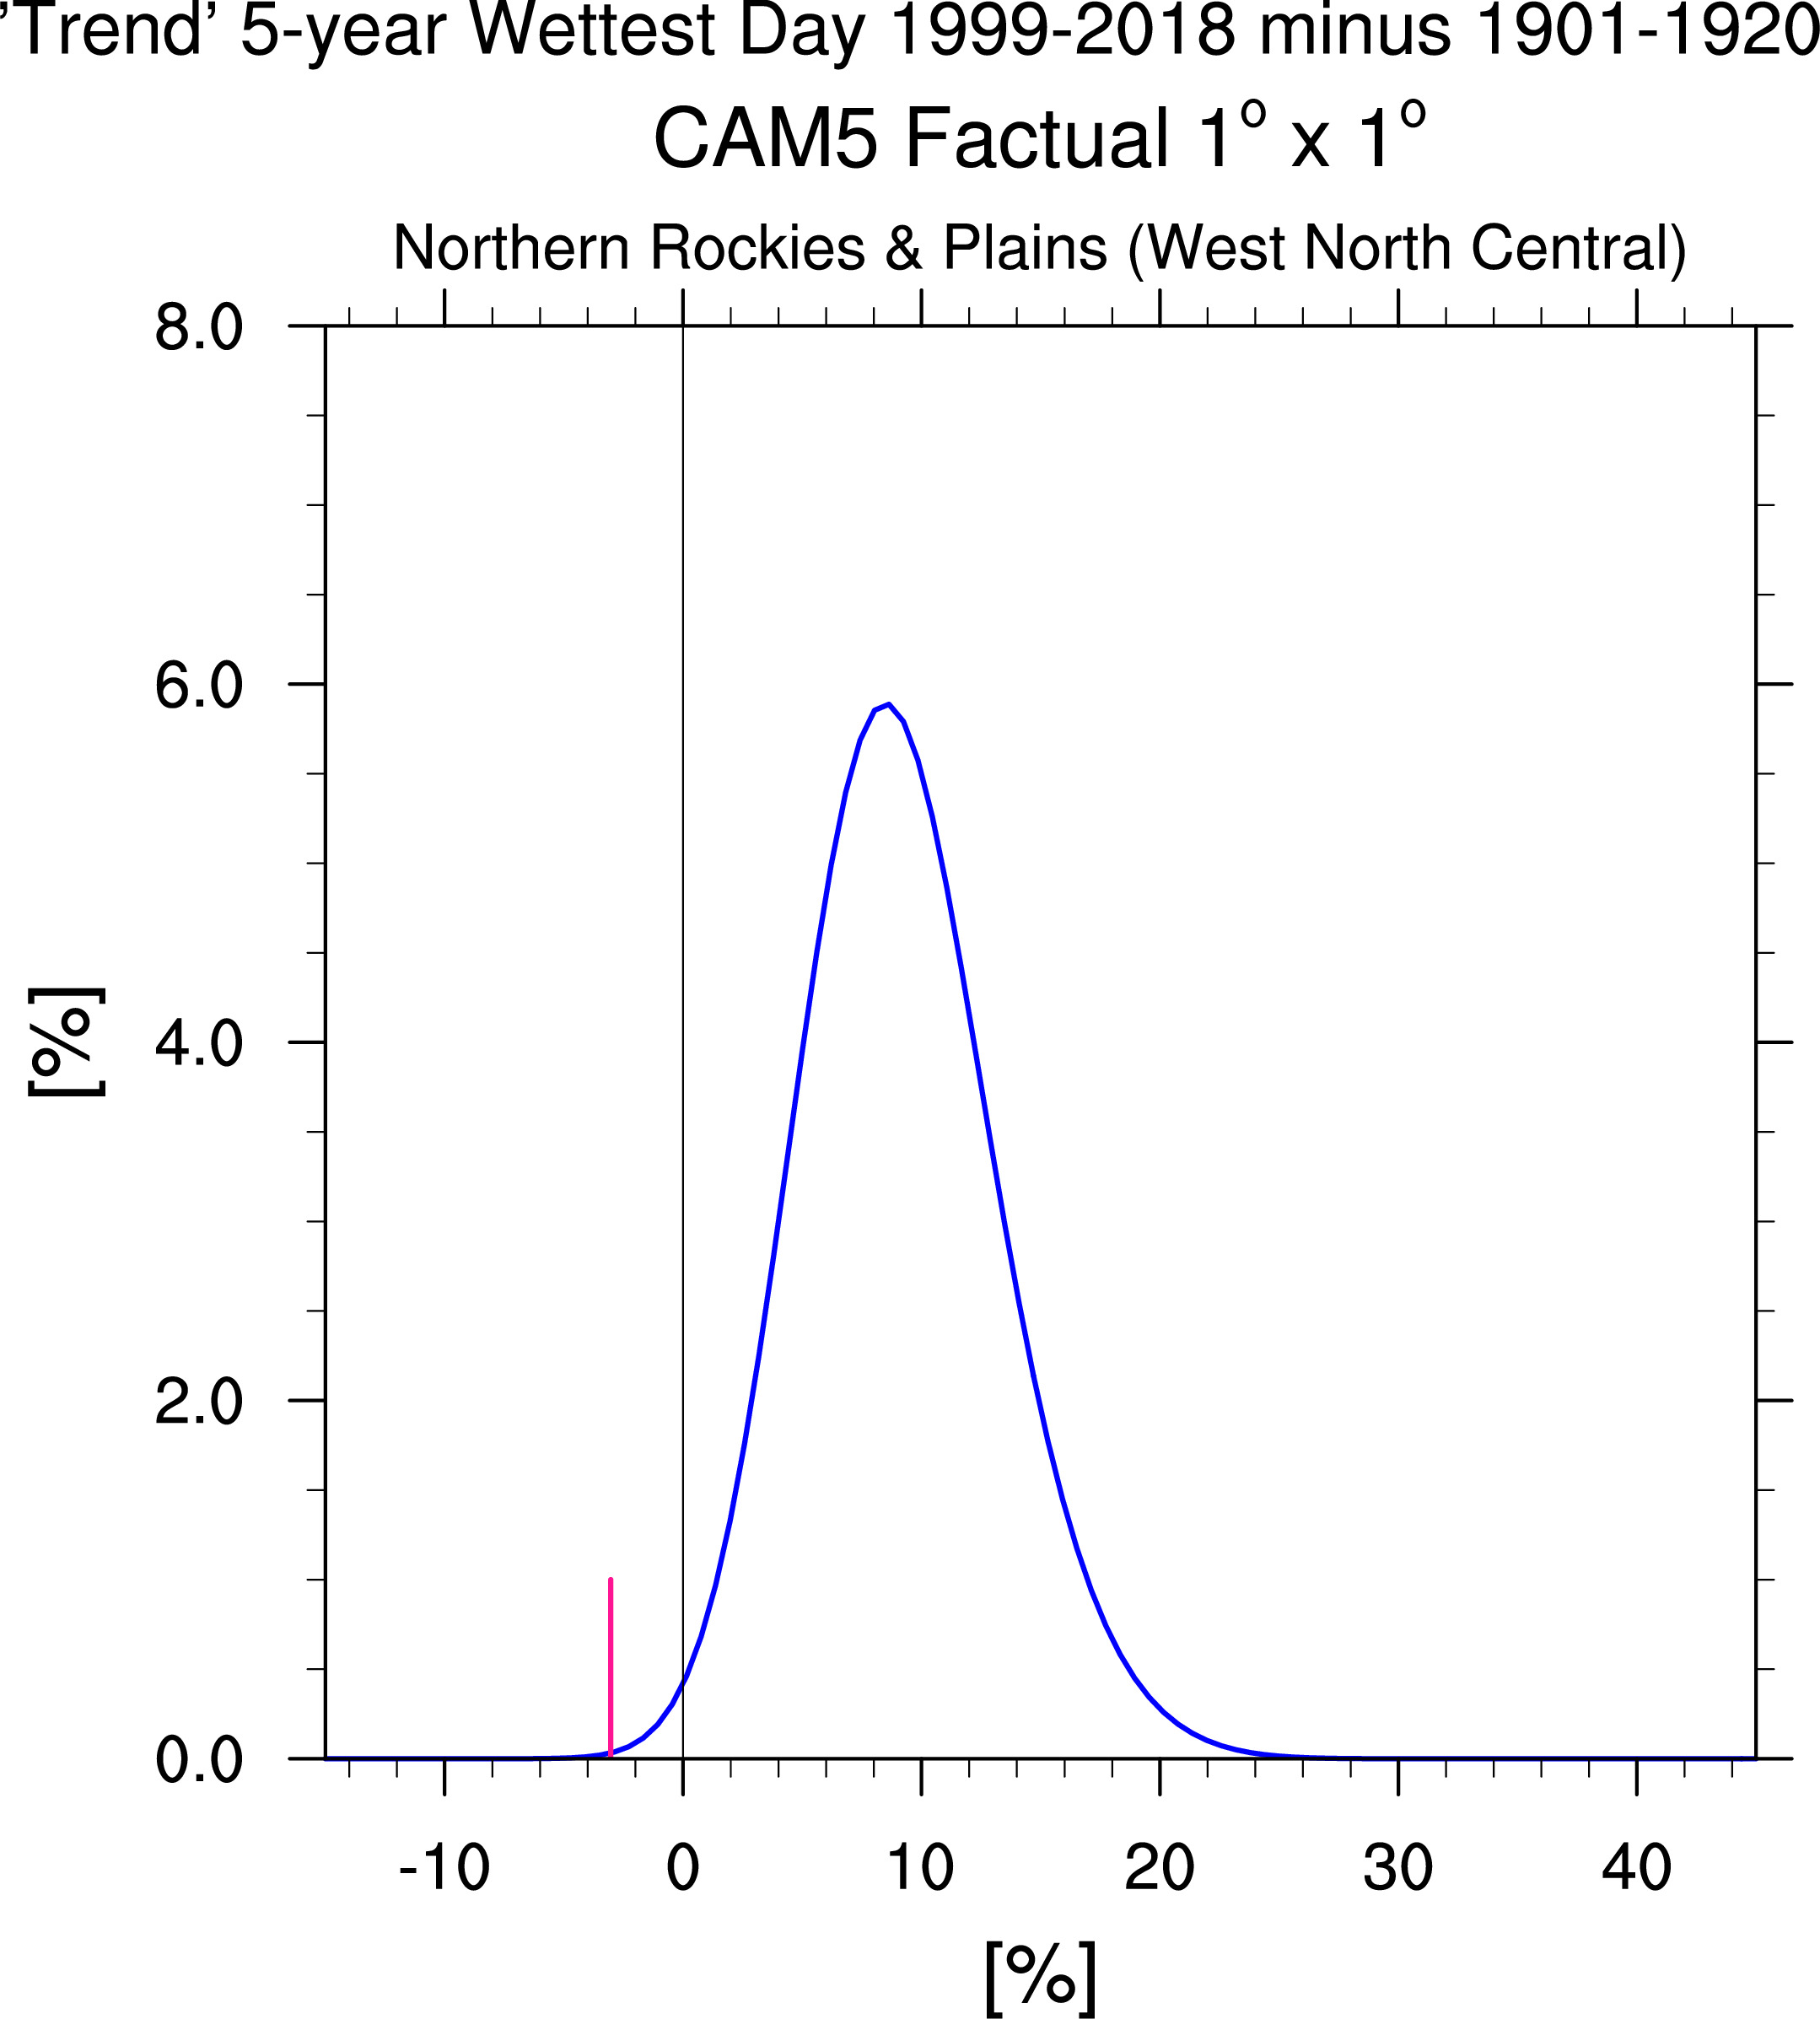
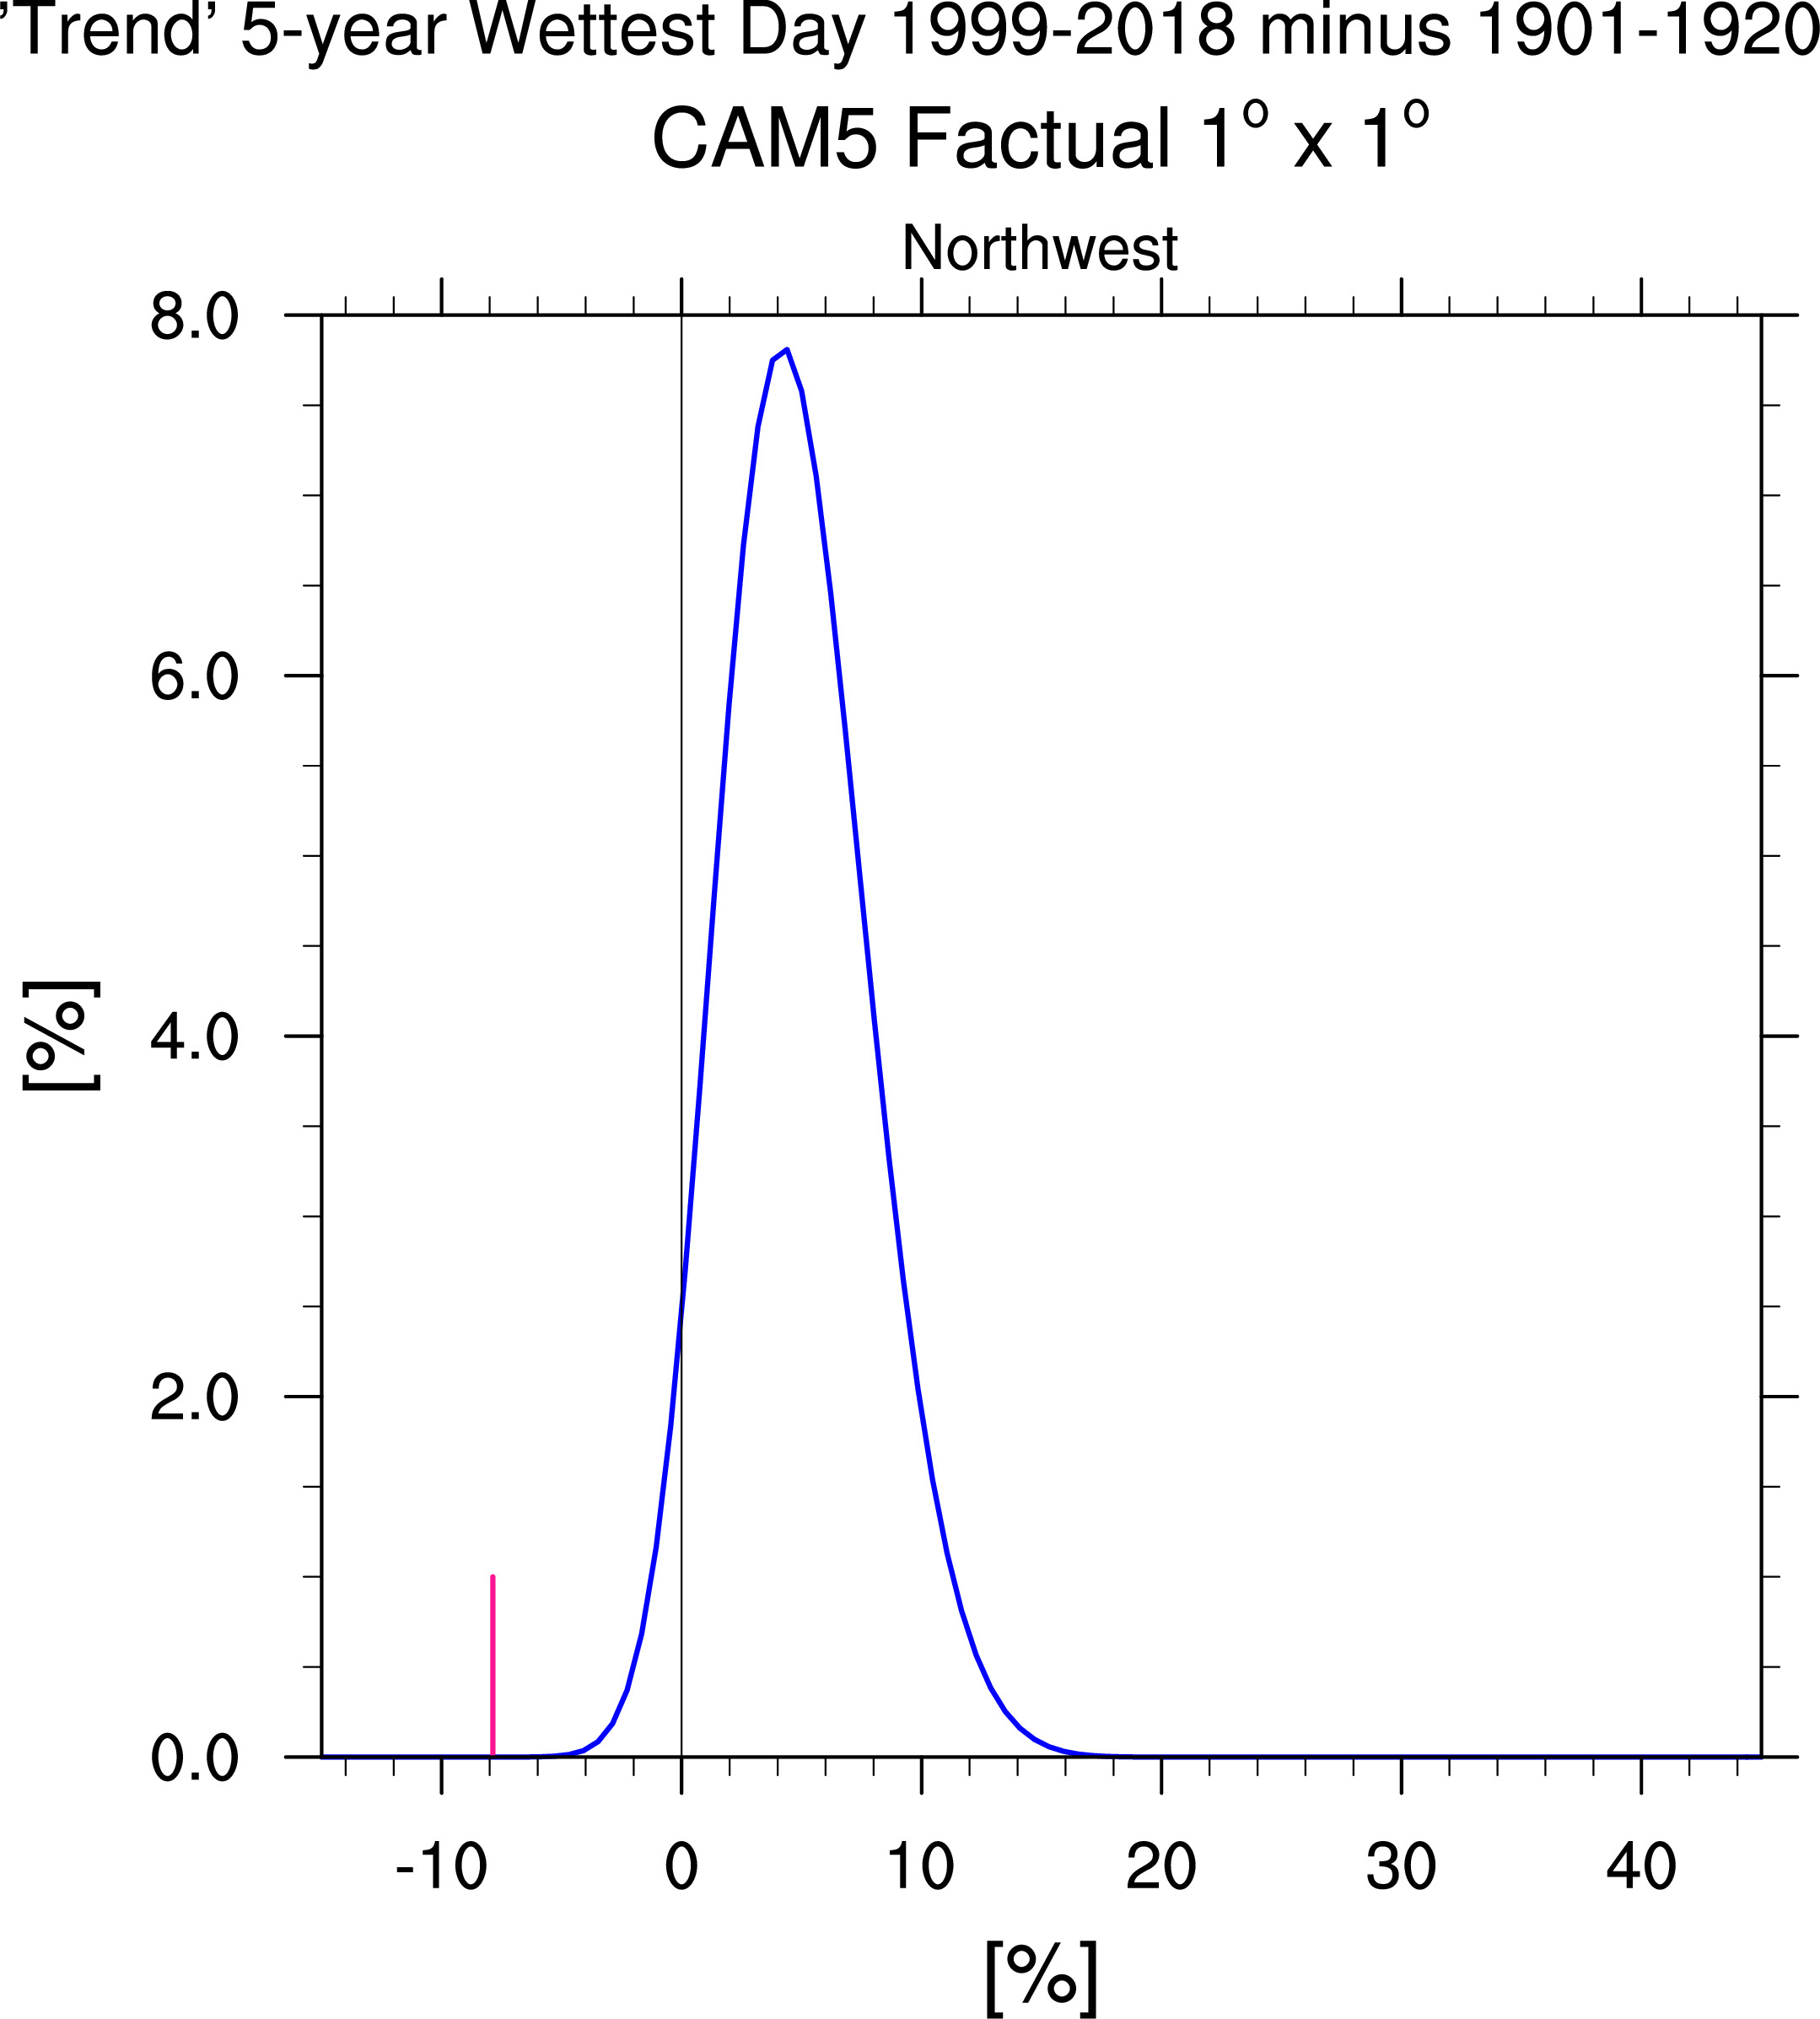
Climate Superdivision Map (right) shows precipitation corresponding to maximum frequency in pdfs above
below left sample map

![]()
movie of all maps here
Below average of 20 annual maximas for two periods (diffs give 'trends')
Below pink line is Station Data 'trend' for region
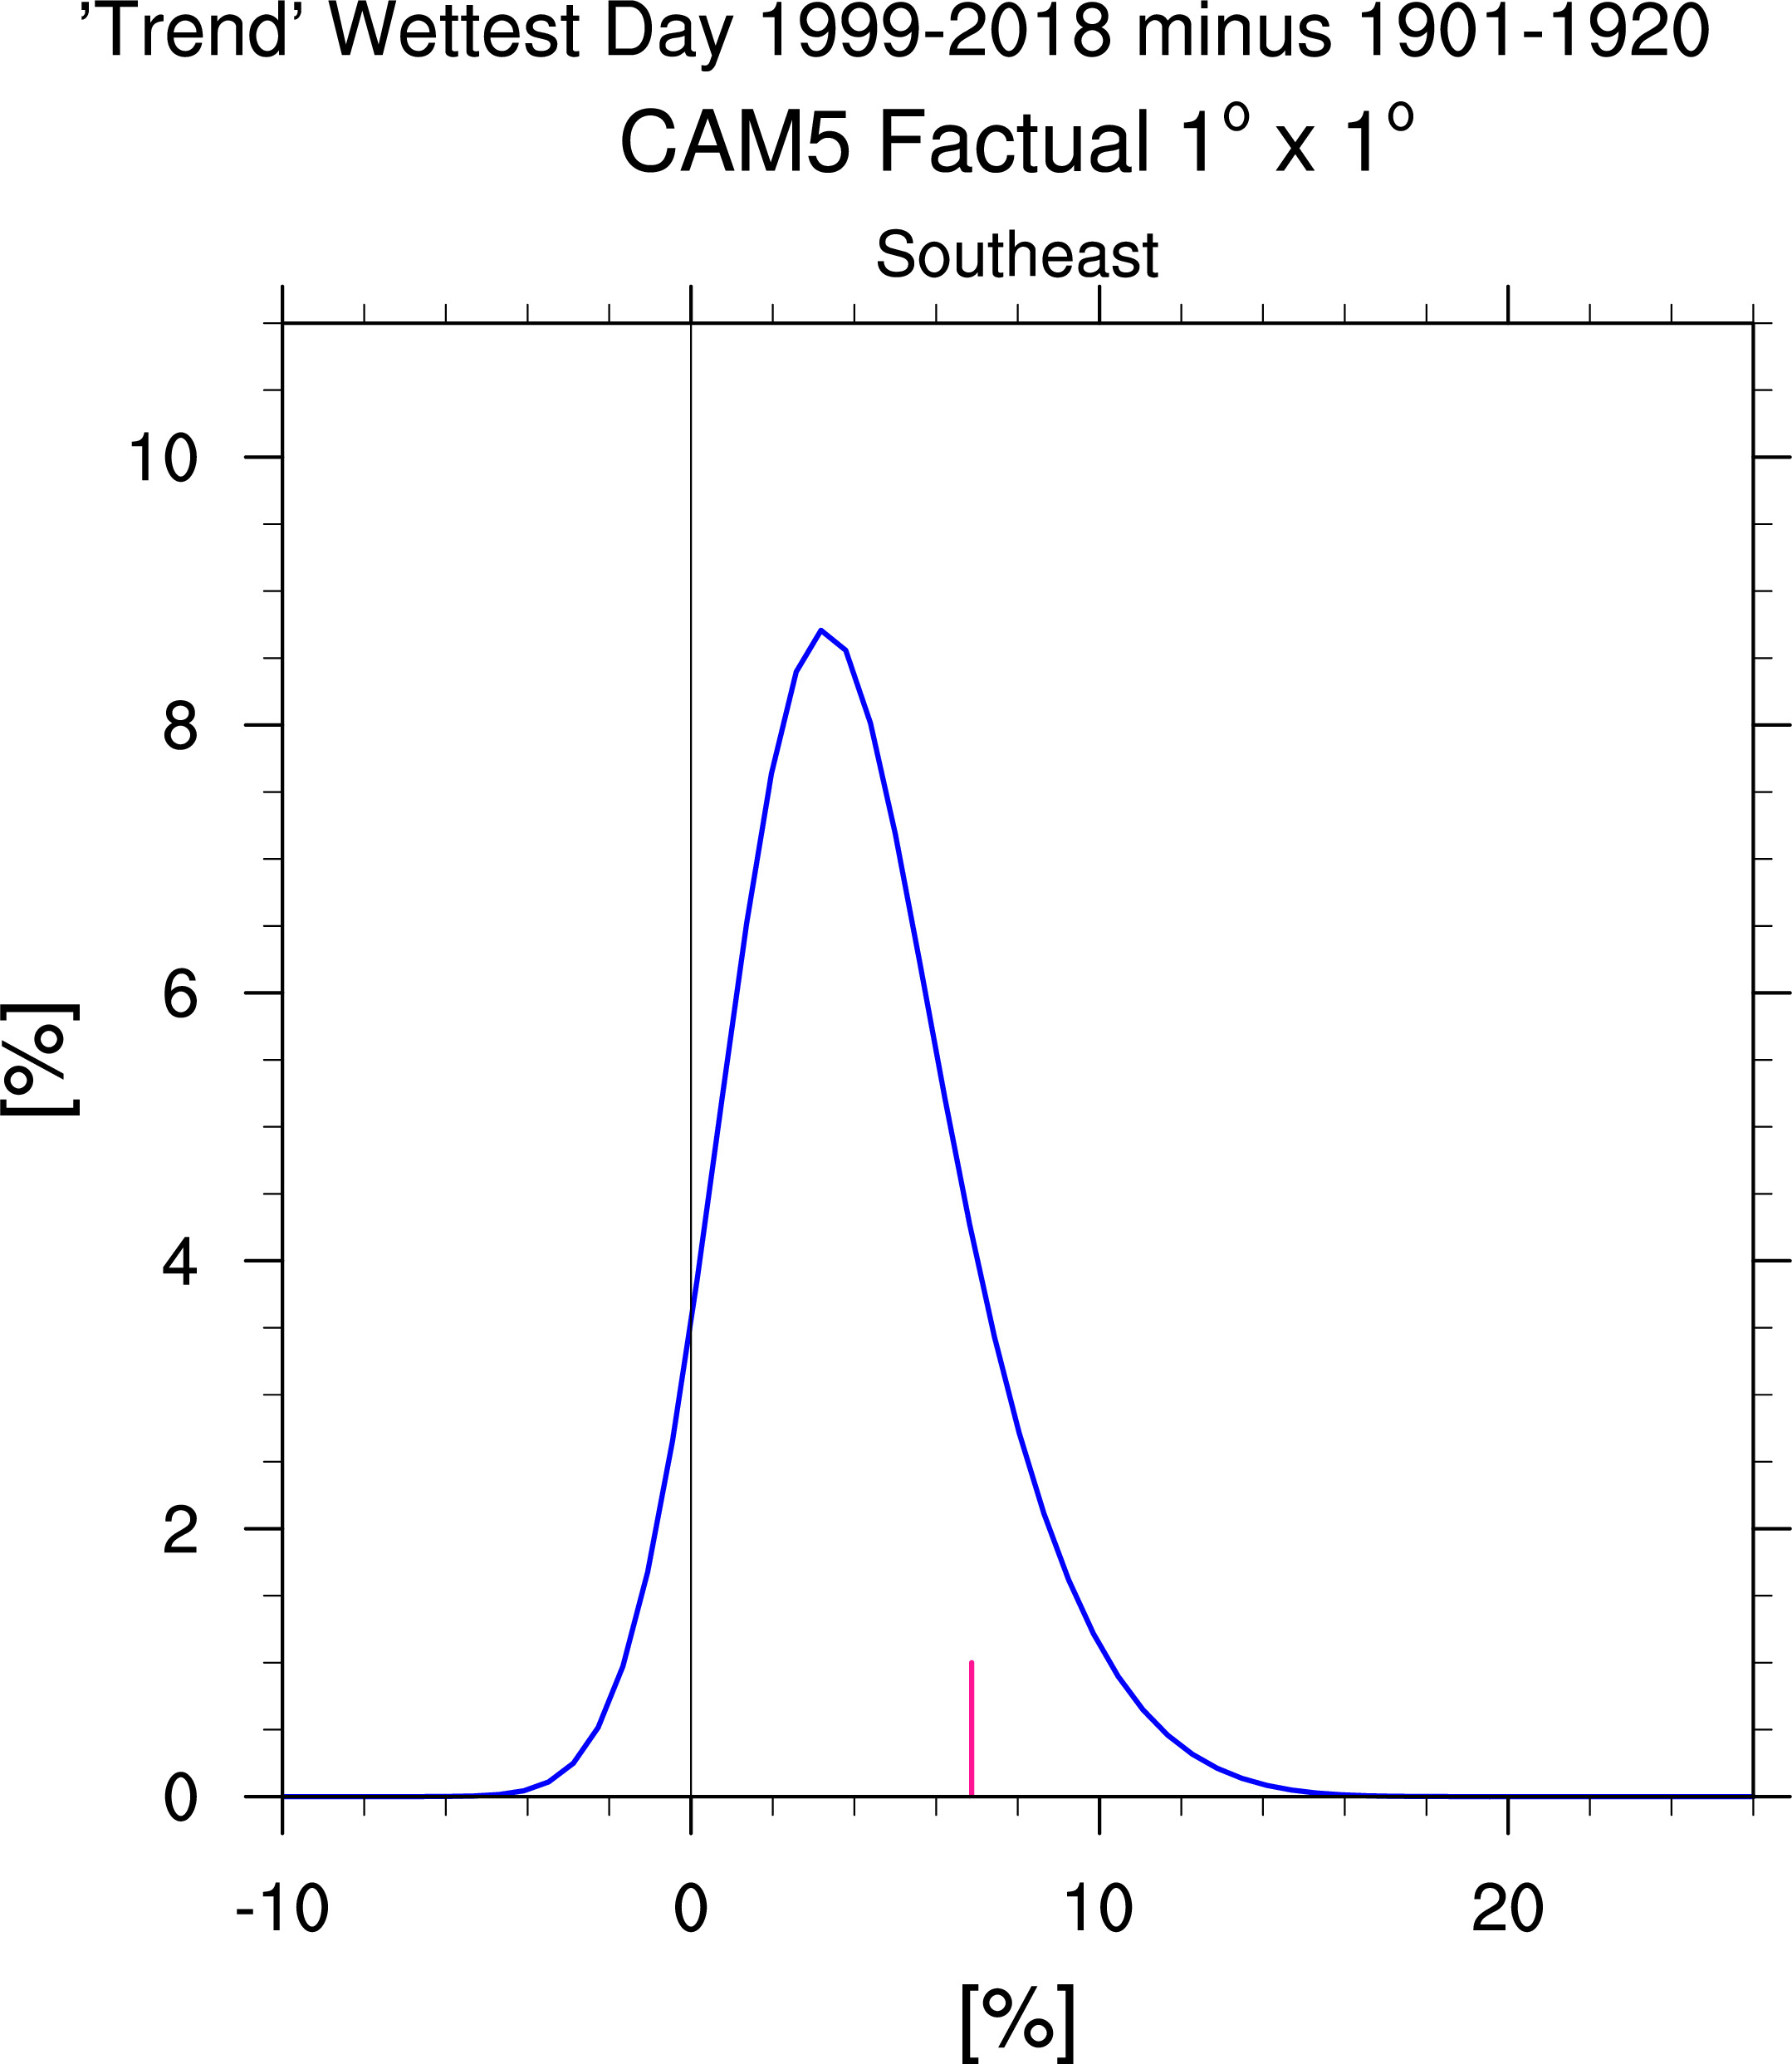
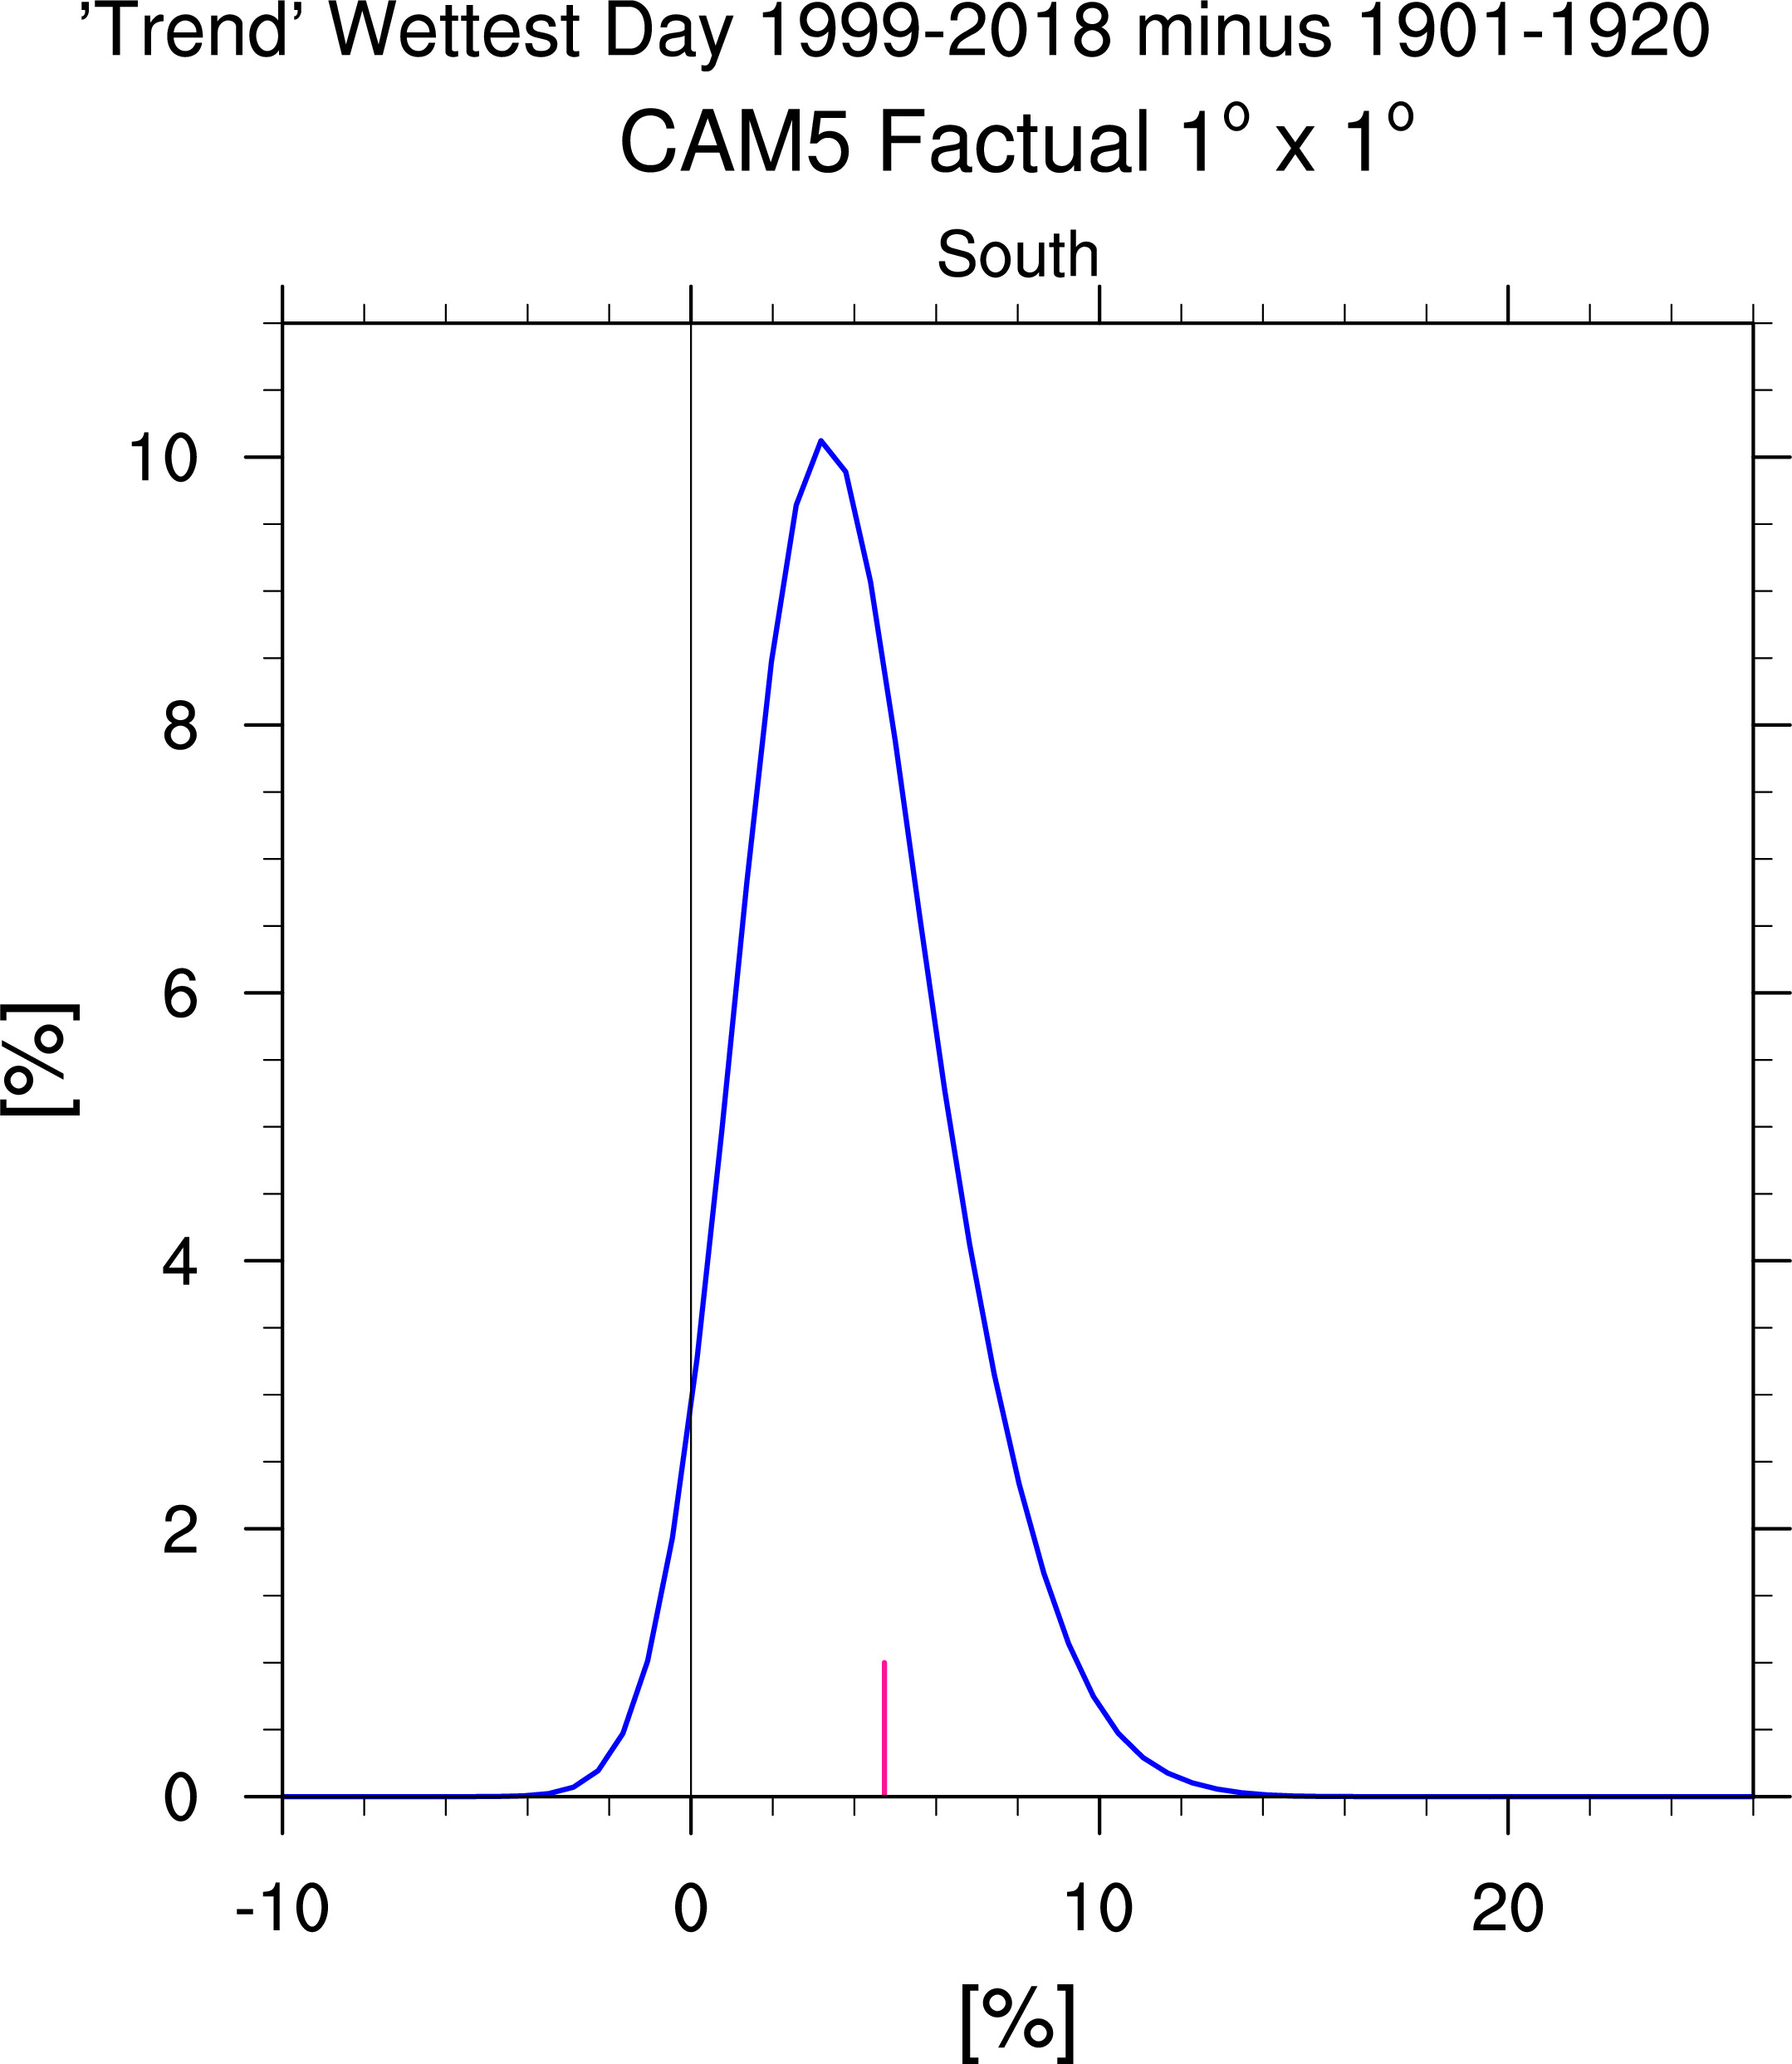
Climate Superdivision Map (right) shows precipitation corresponding to maximum frequency in pdfs above
below left sample map

![]()
movie of all maps here
-----------------------------------------------------------------------------------------------------------------------
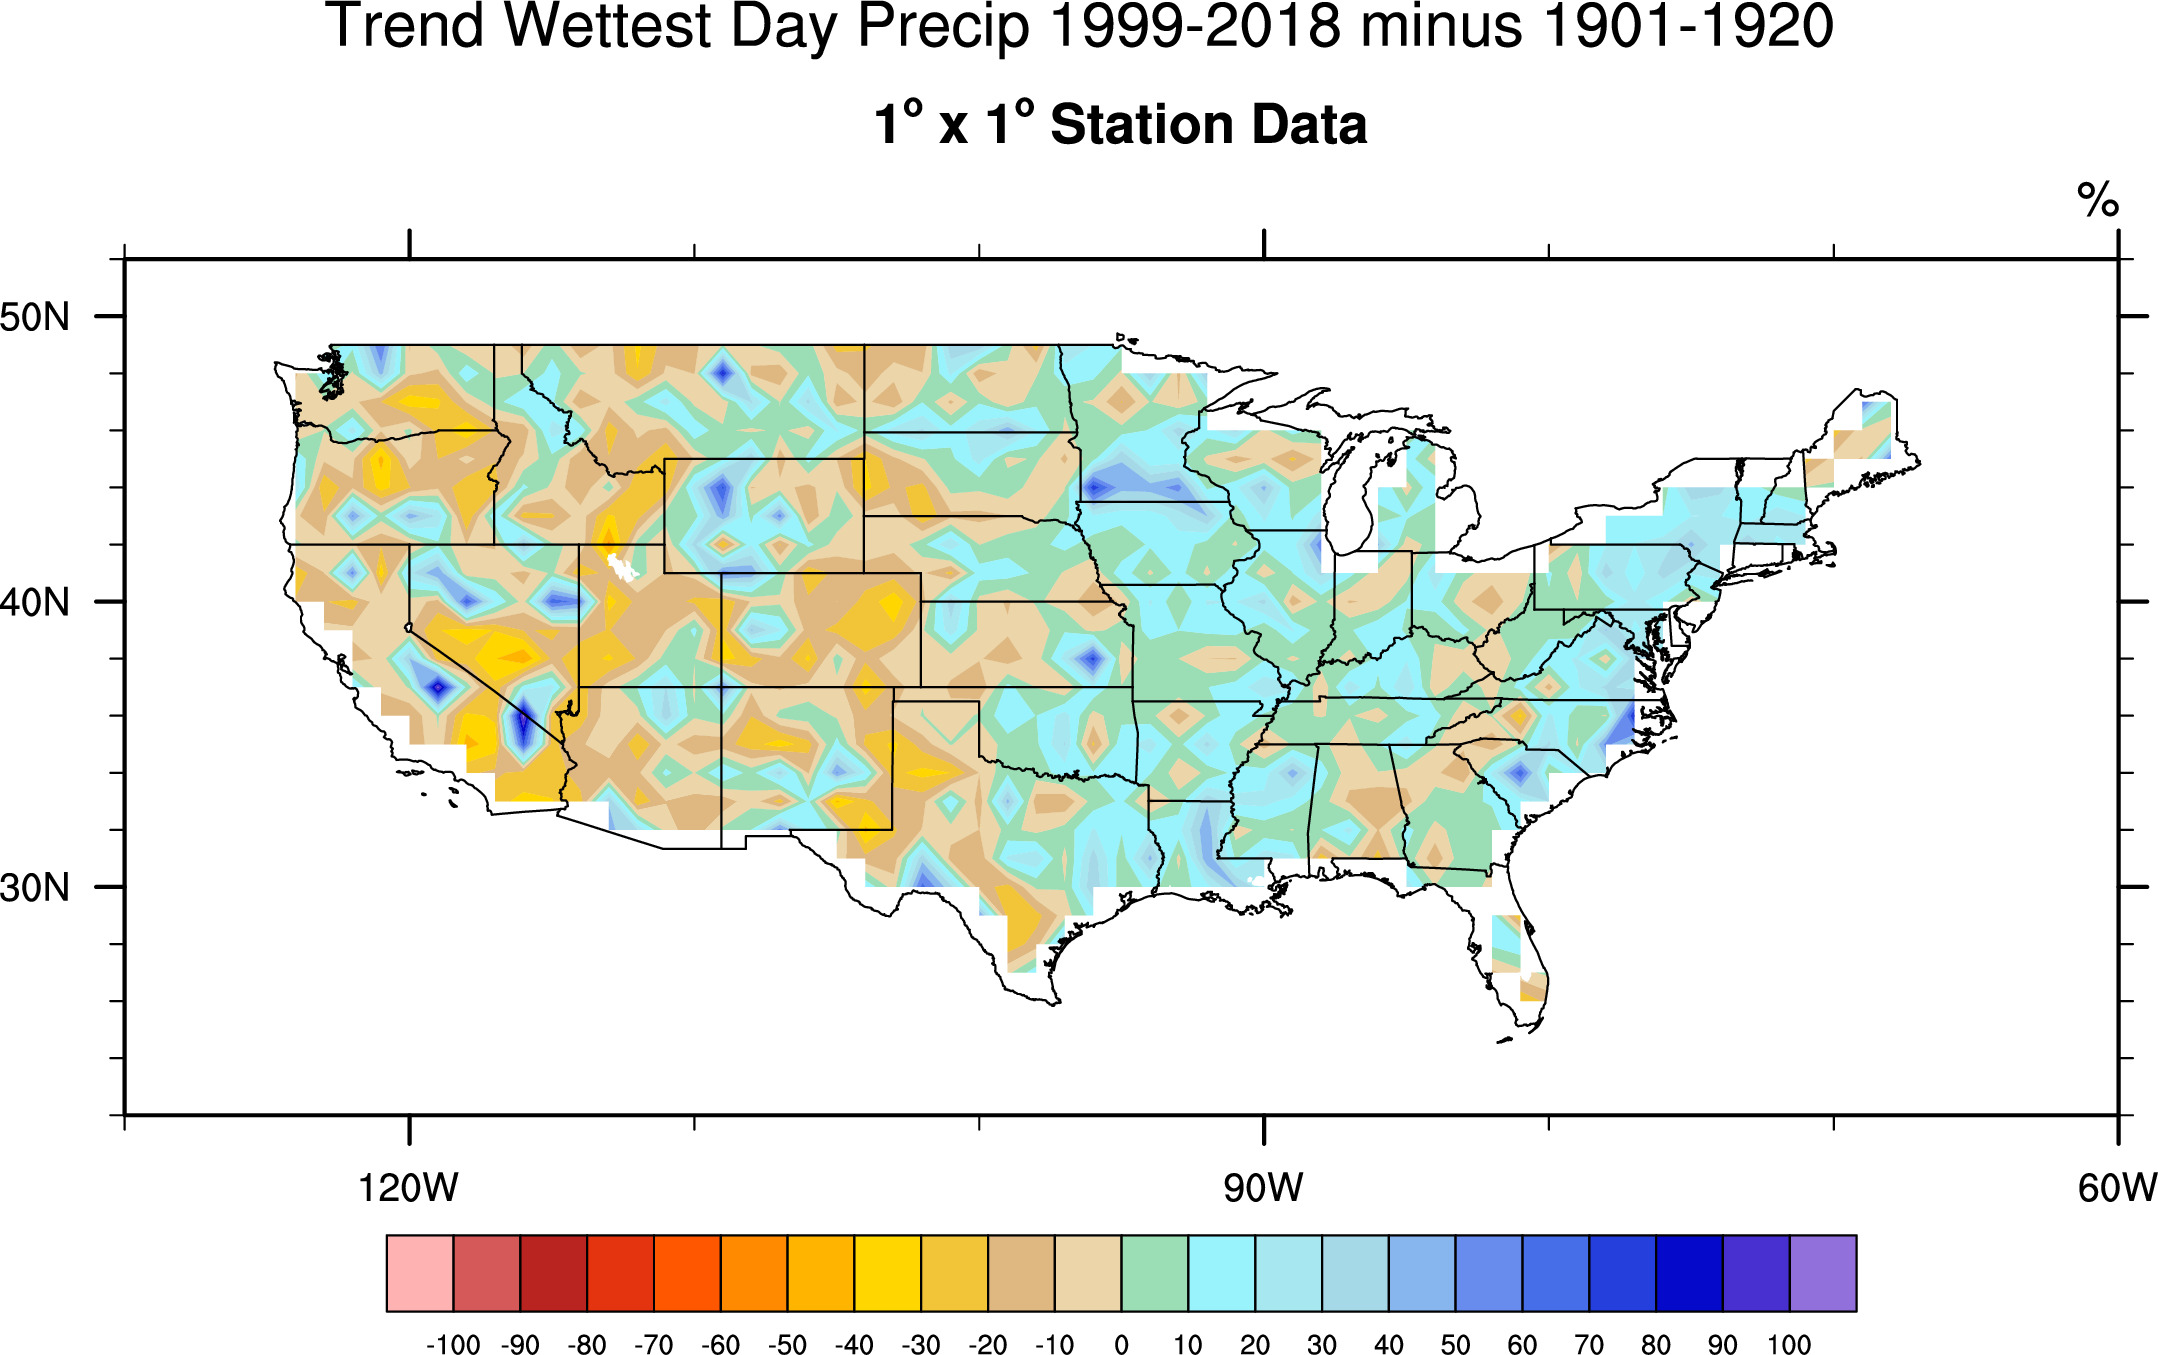
Station Data
1901-1920 versus 1999-2018
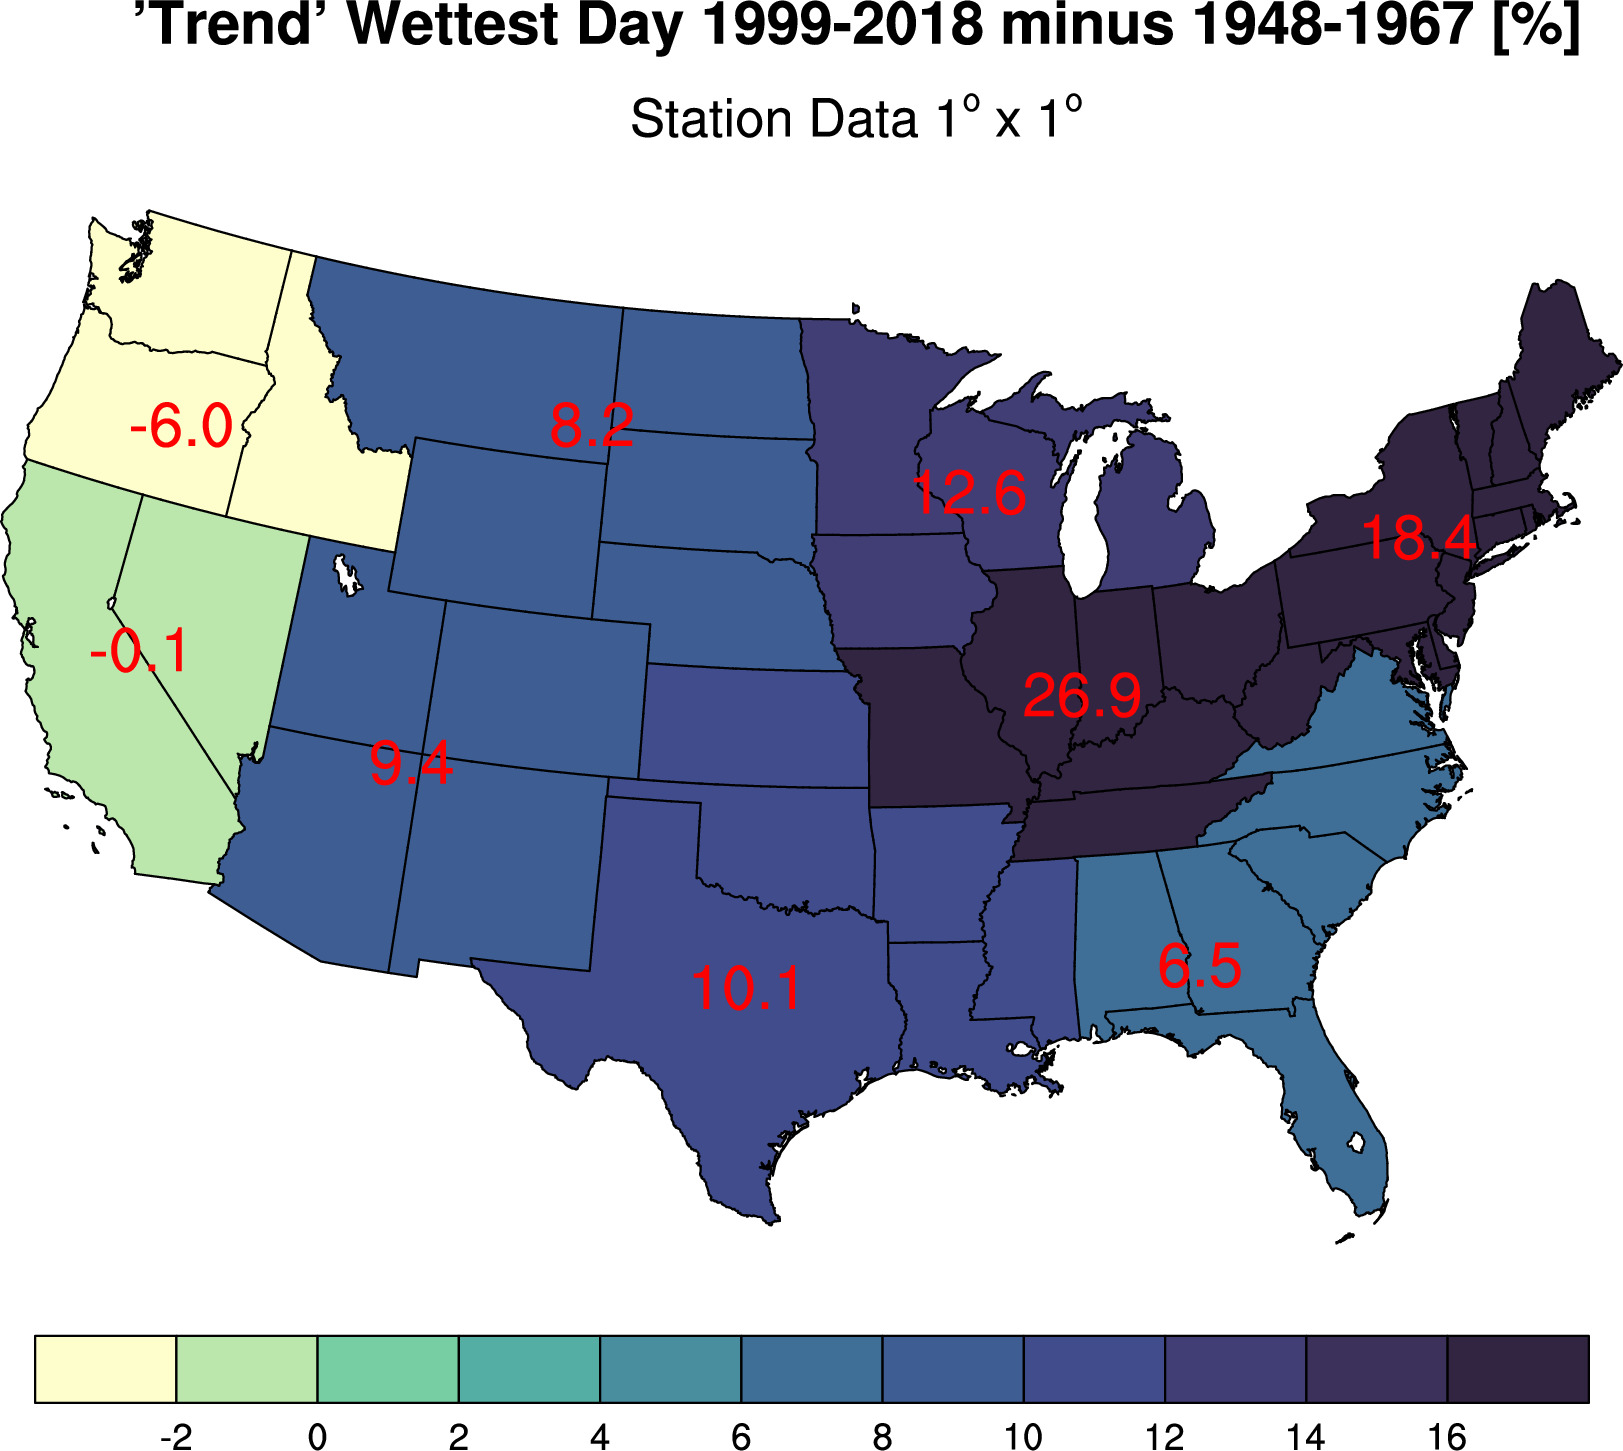
Climate Superdivision Map (right) shows precipitation corresponding to superdivision area average of precip on left


1948-1967 versus 1999-2018


--------------------
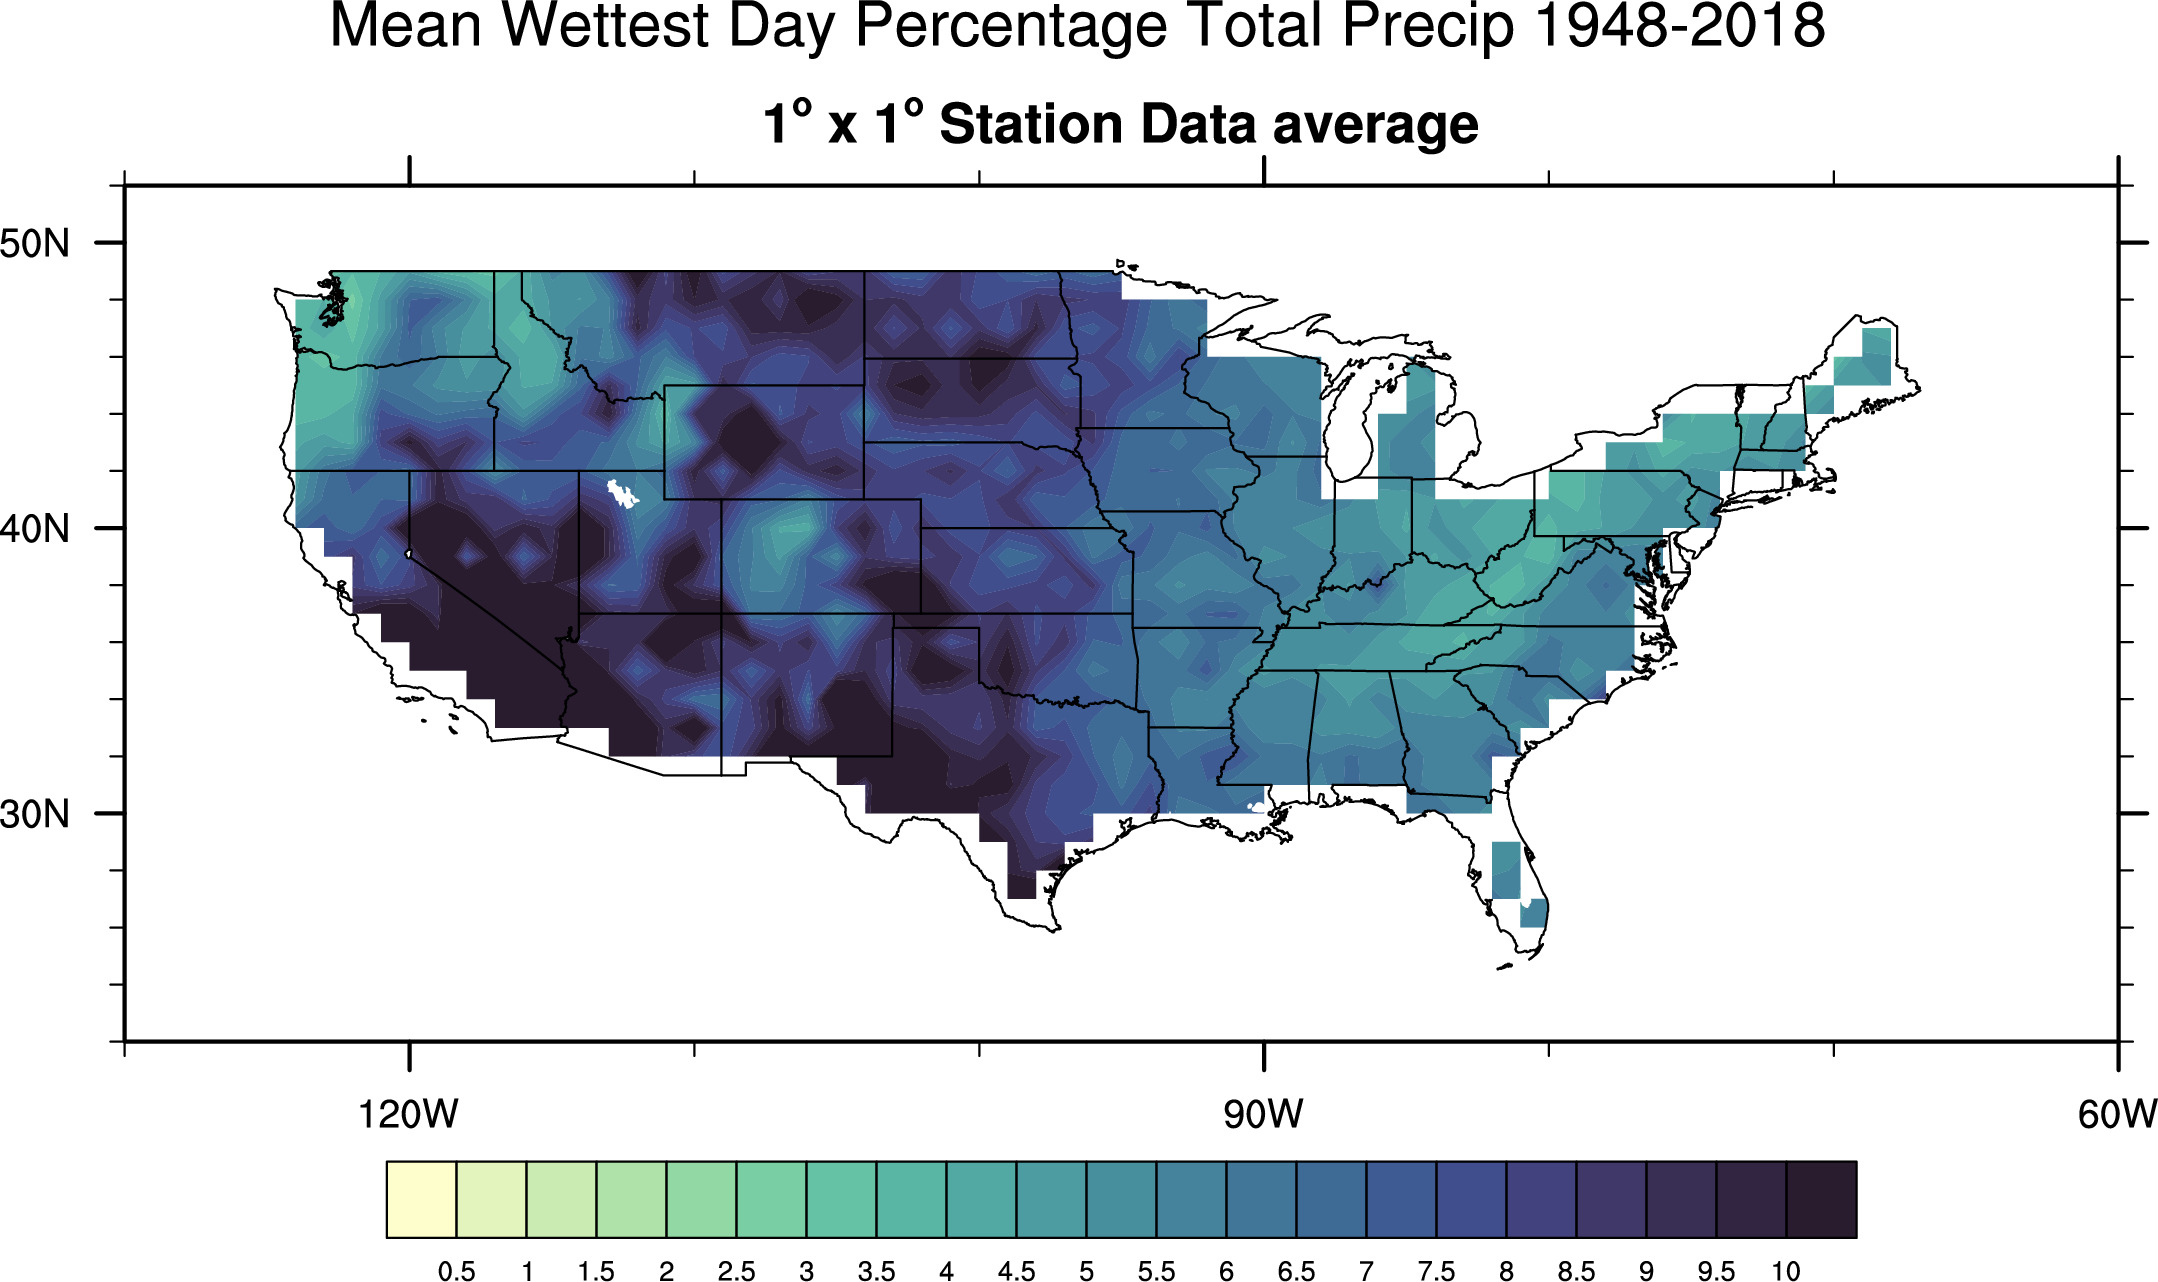
Climatology & Trend (from slope of best-fit line) heaviest precip 1948-2018
Station Data 1948-2018

Station Data 1901-2018


--------------------
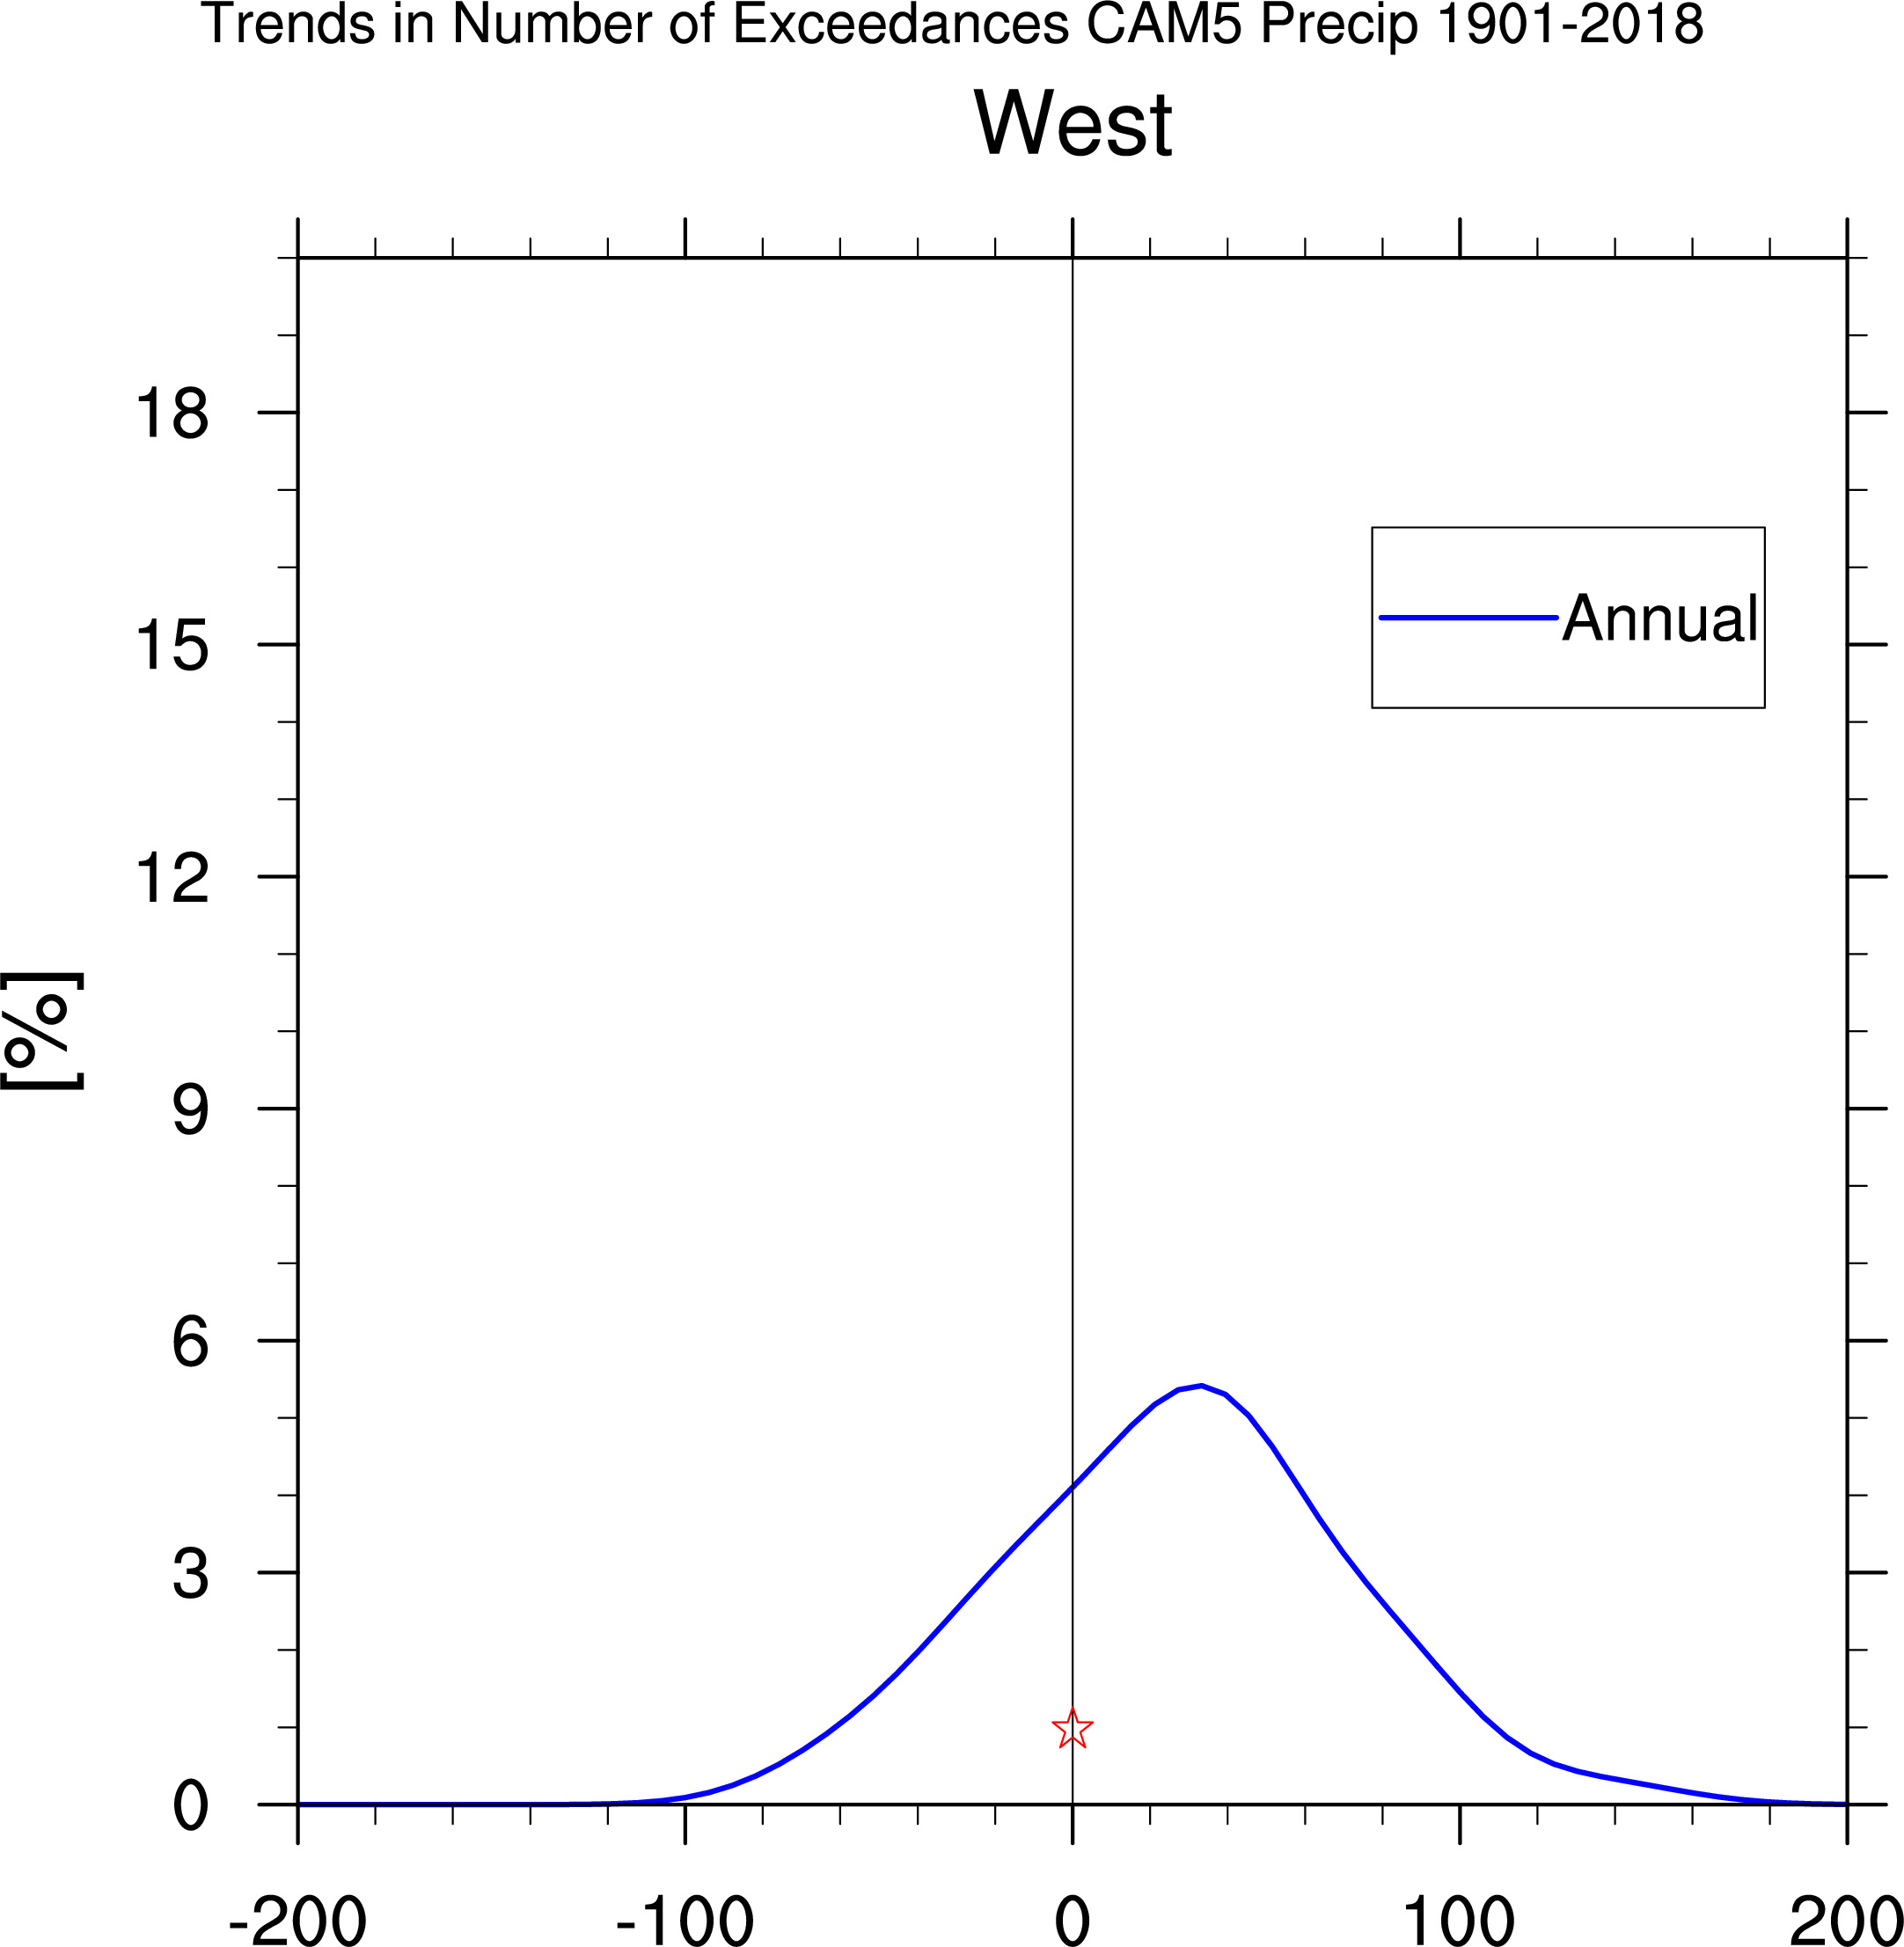
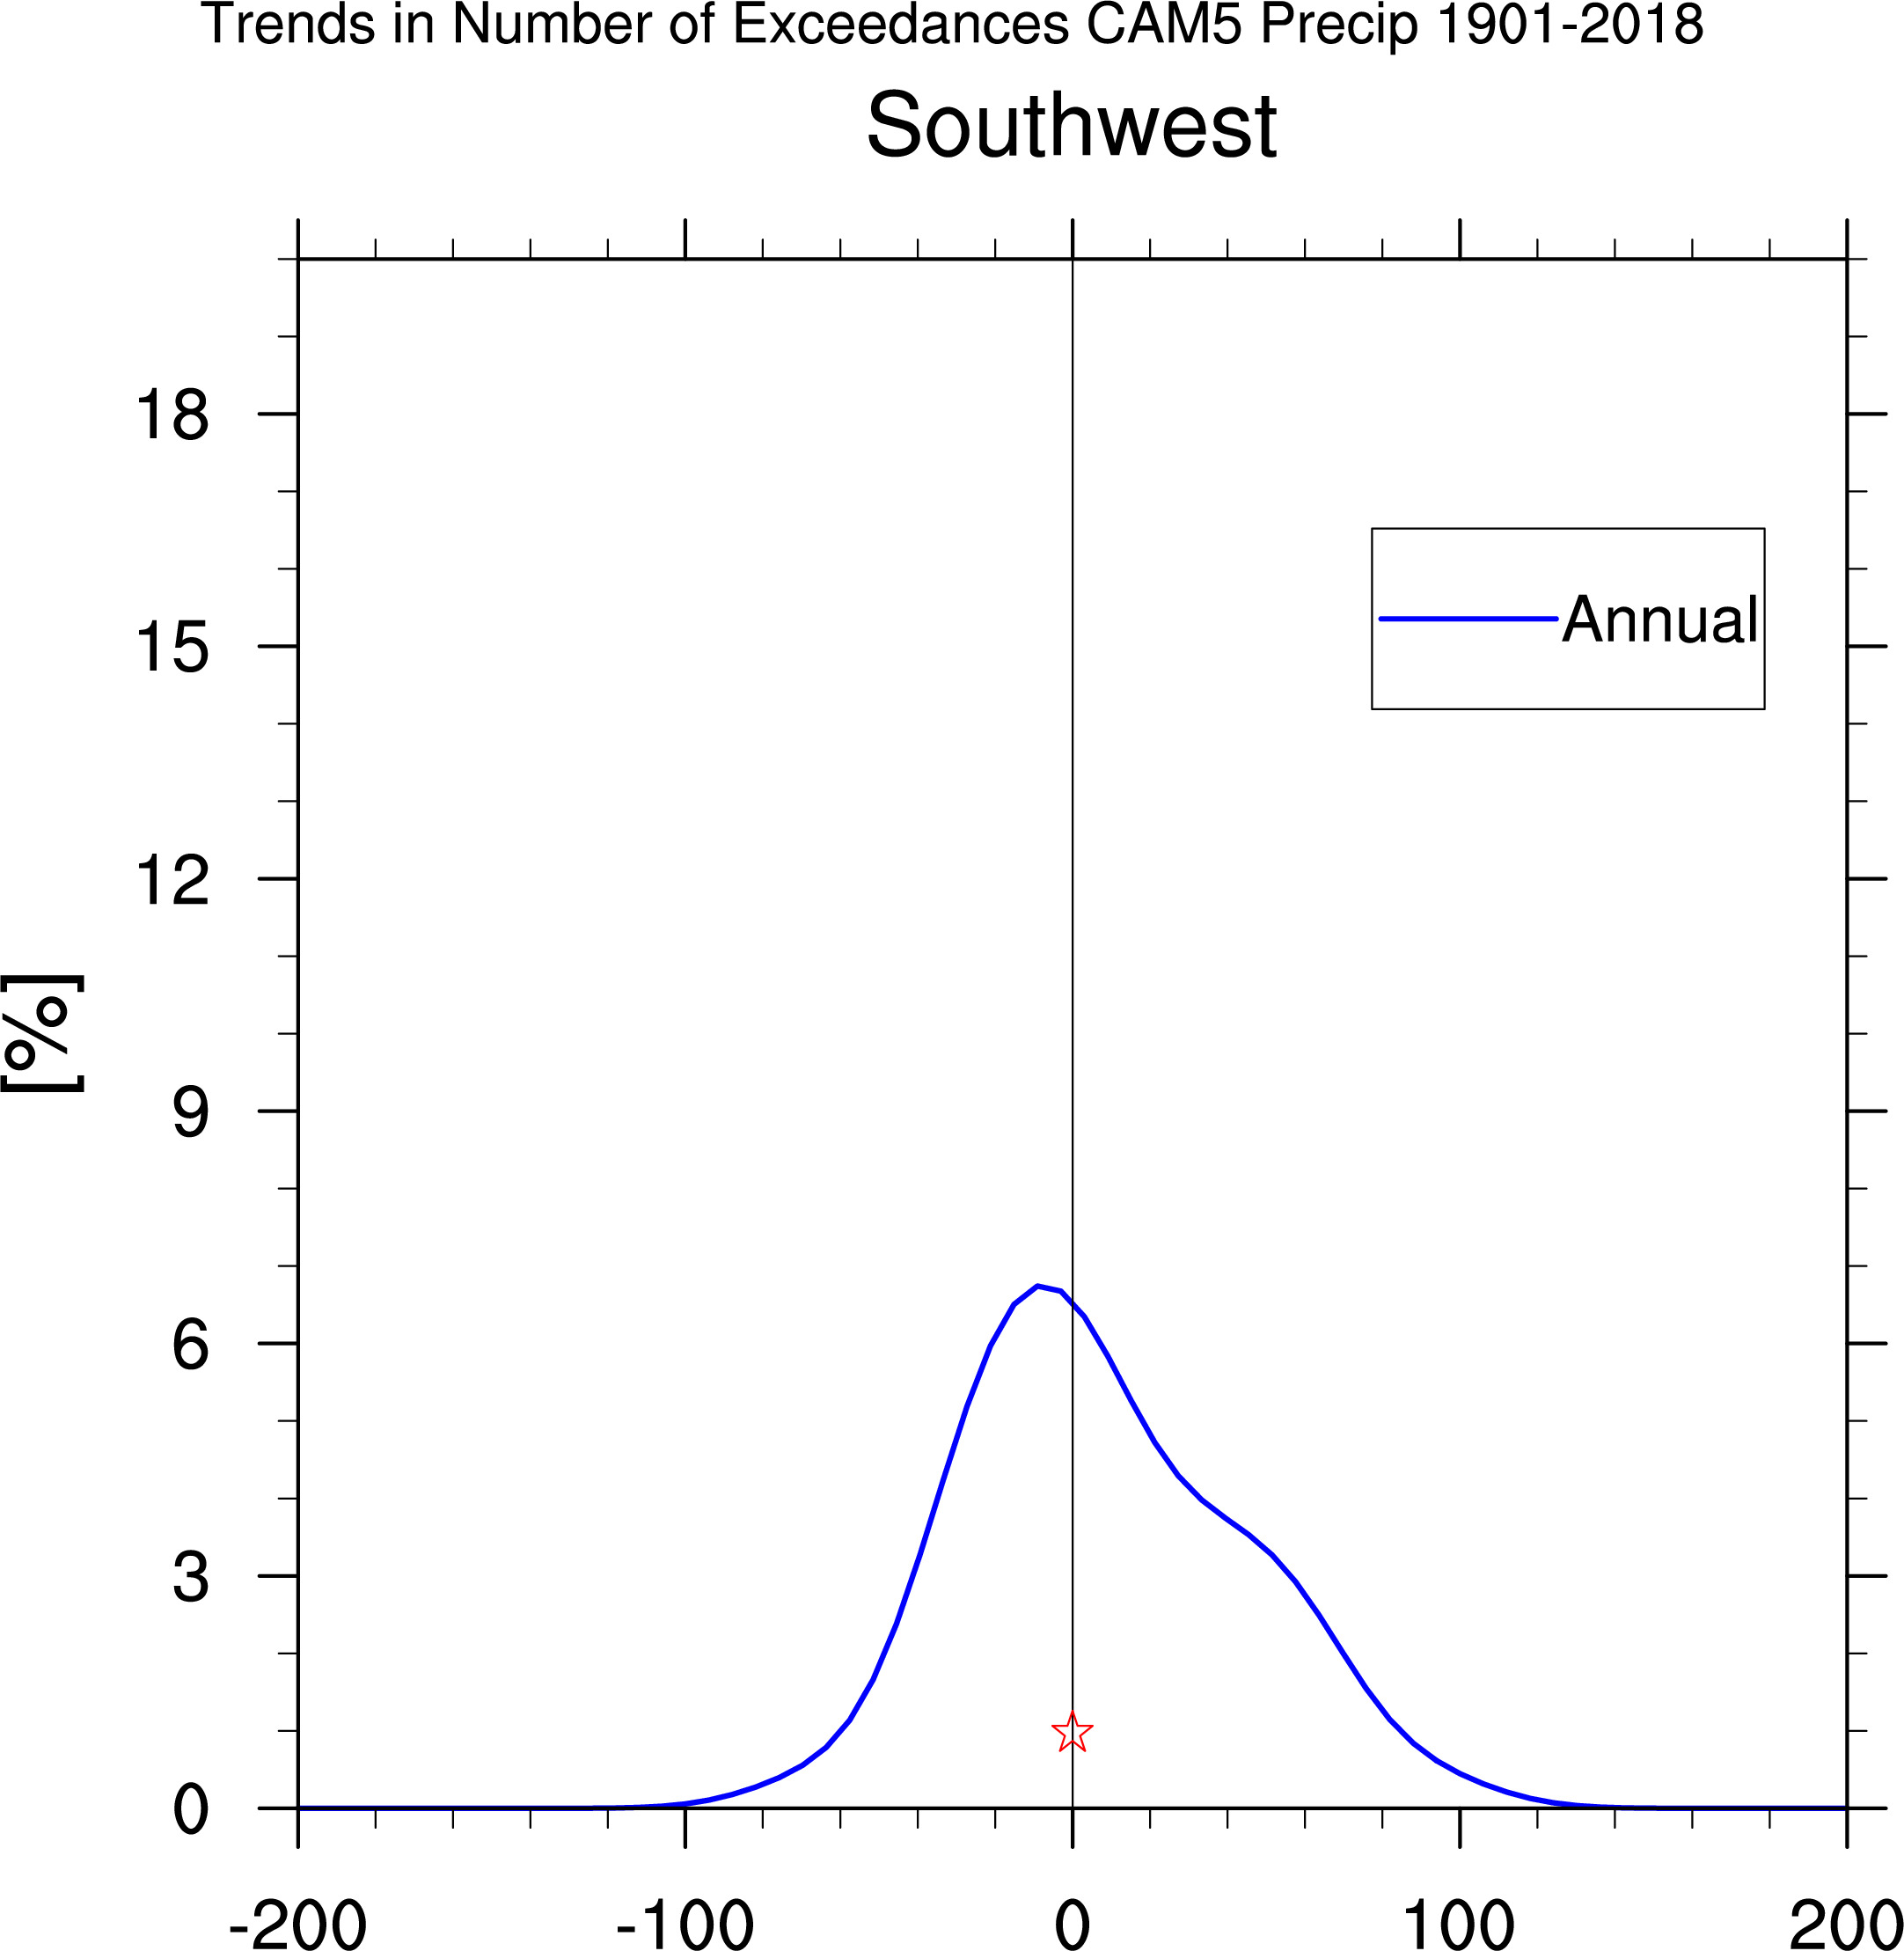
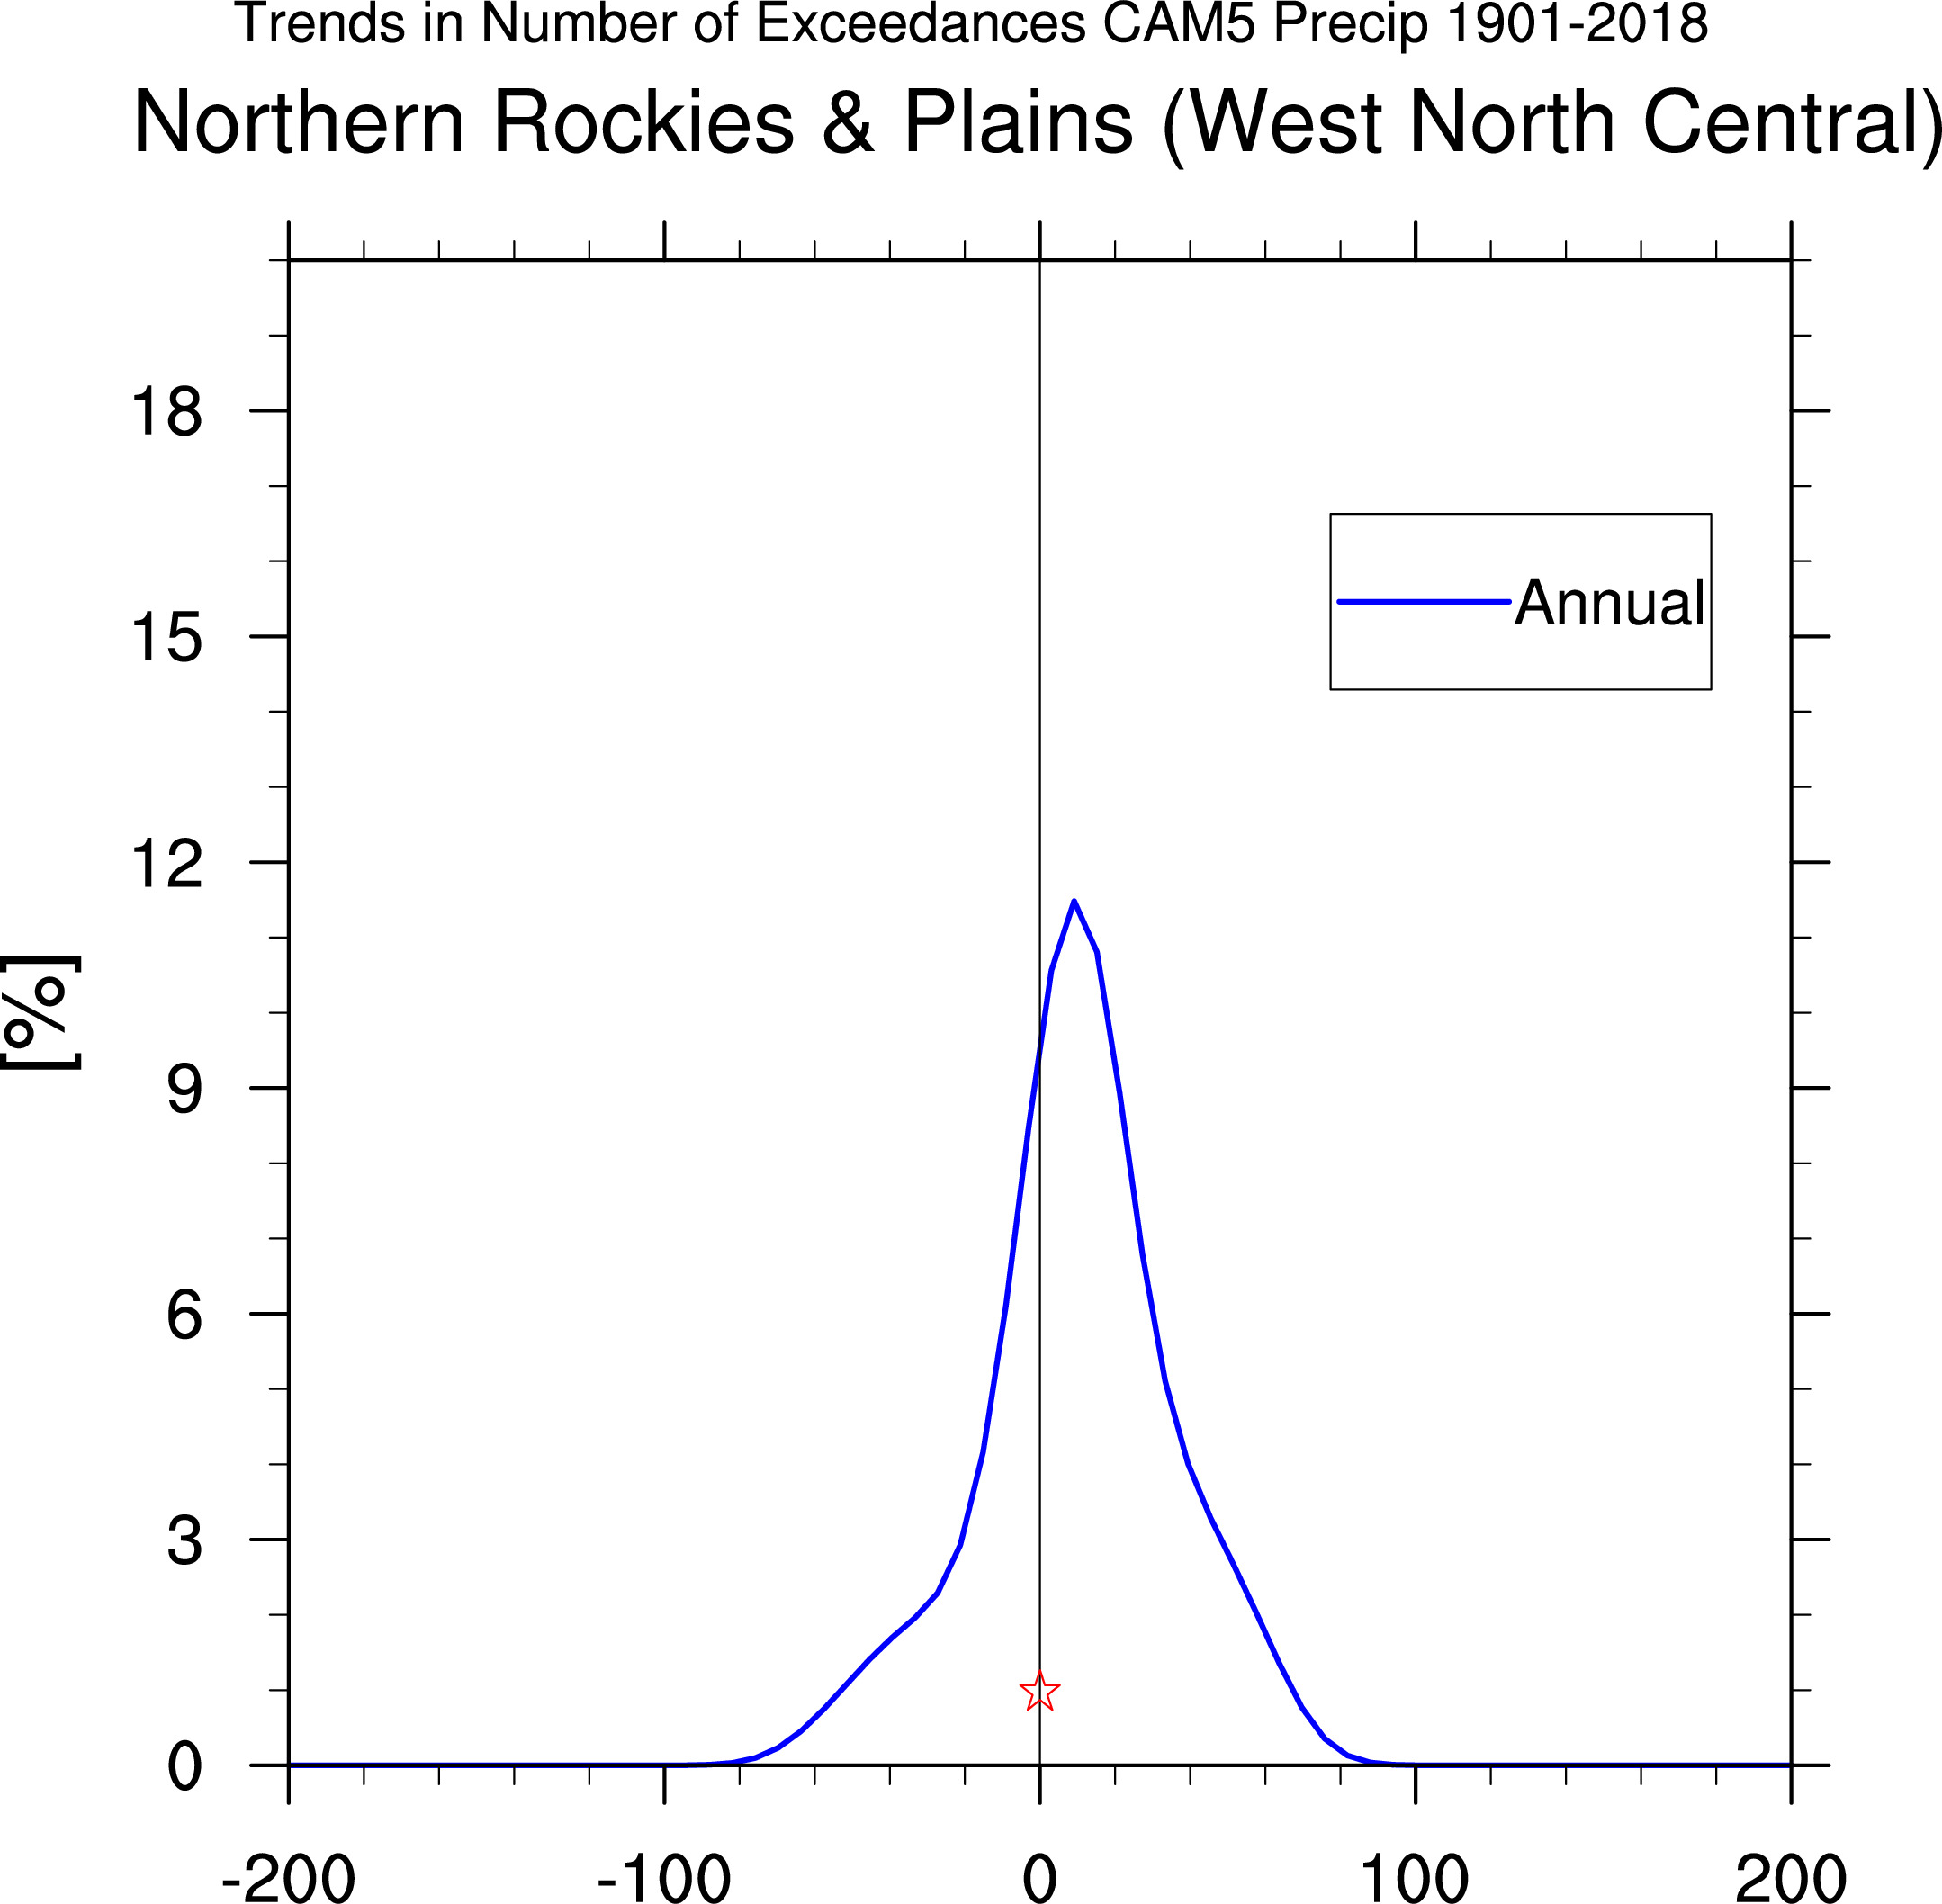
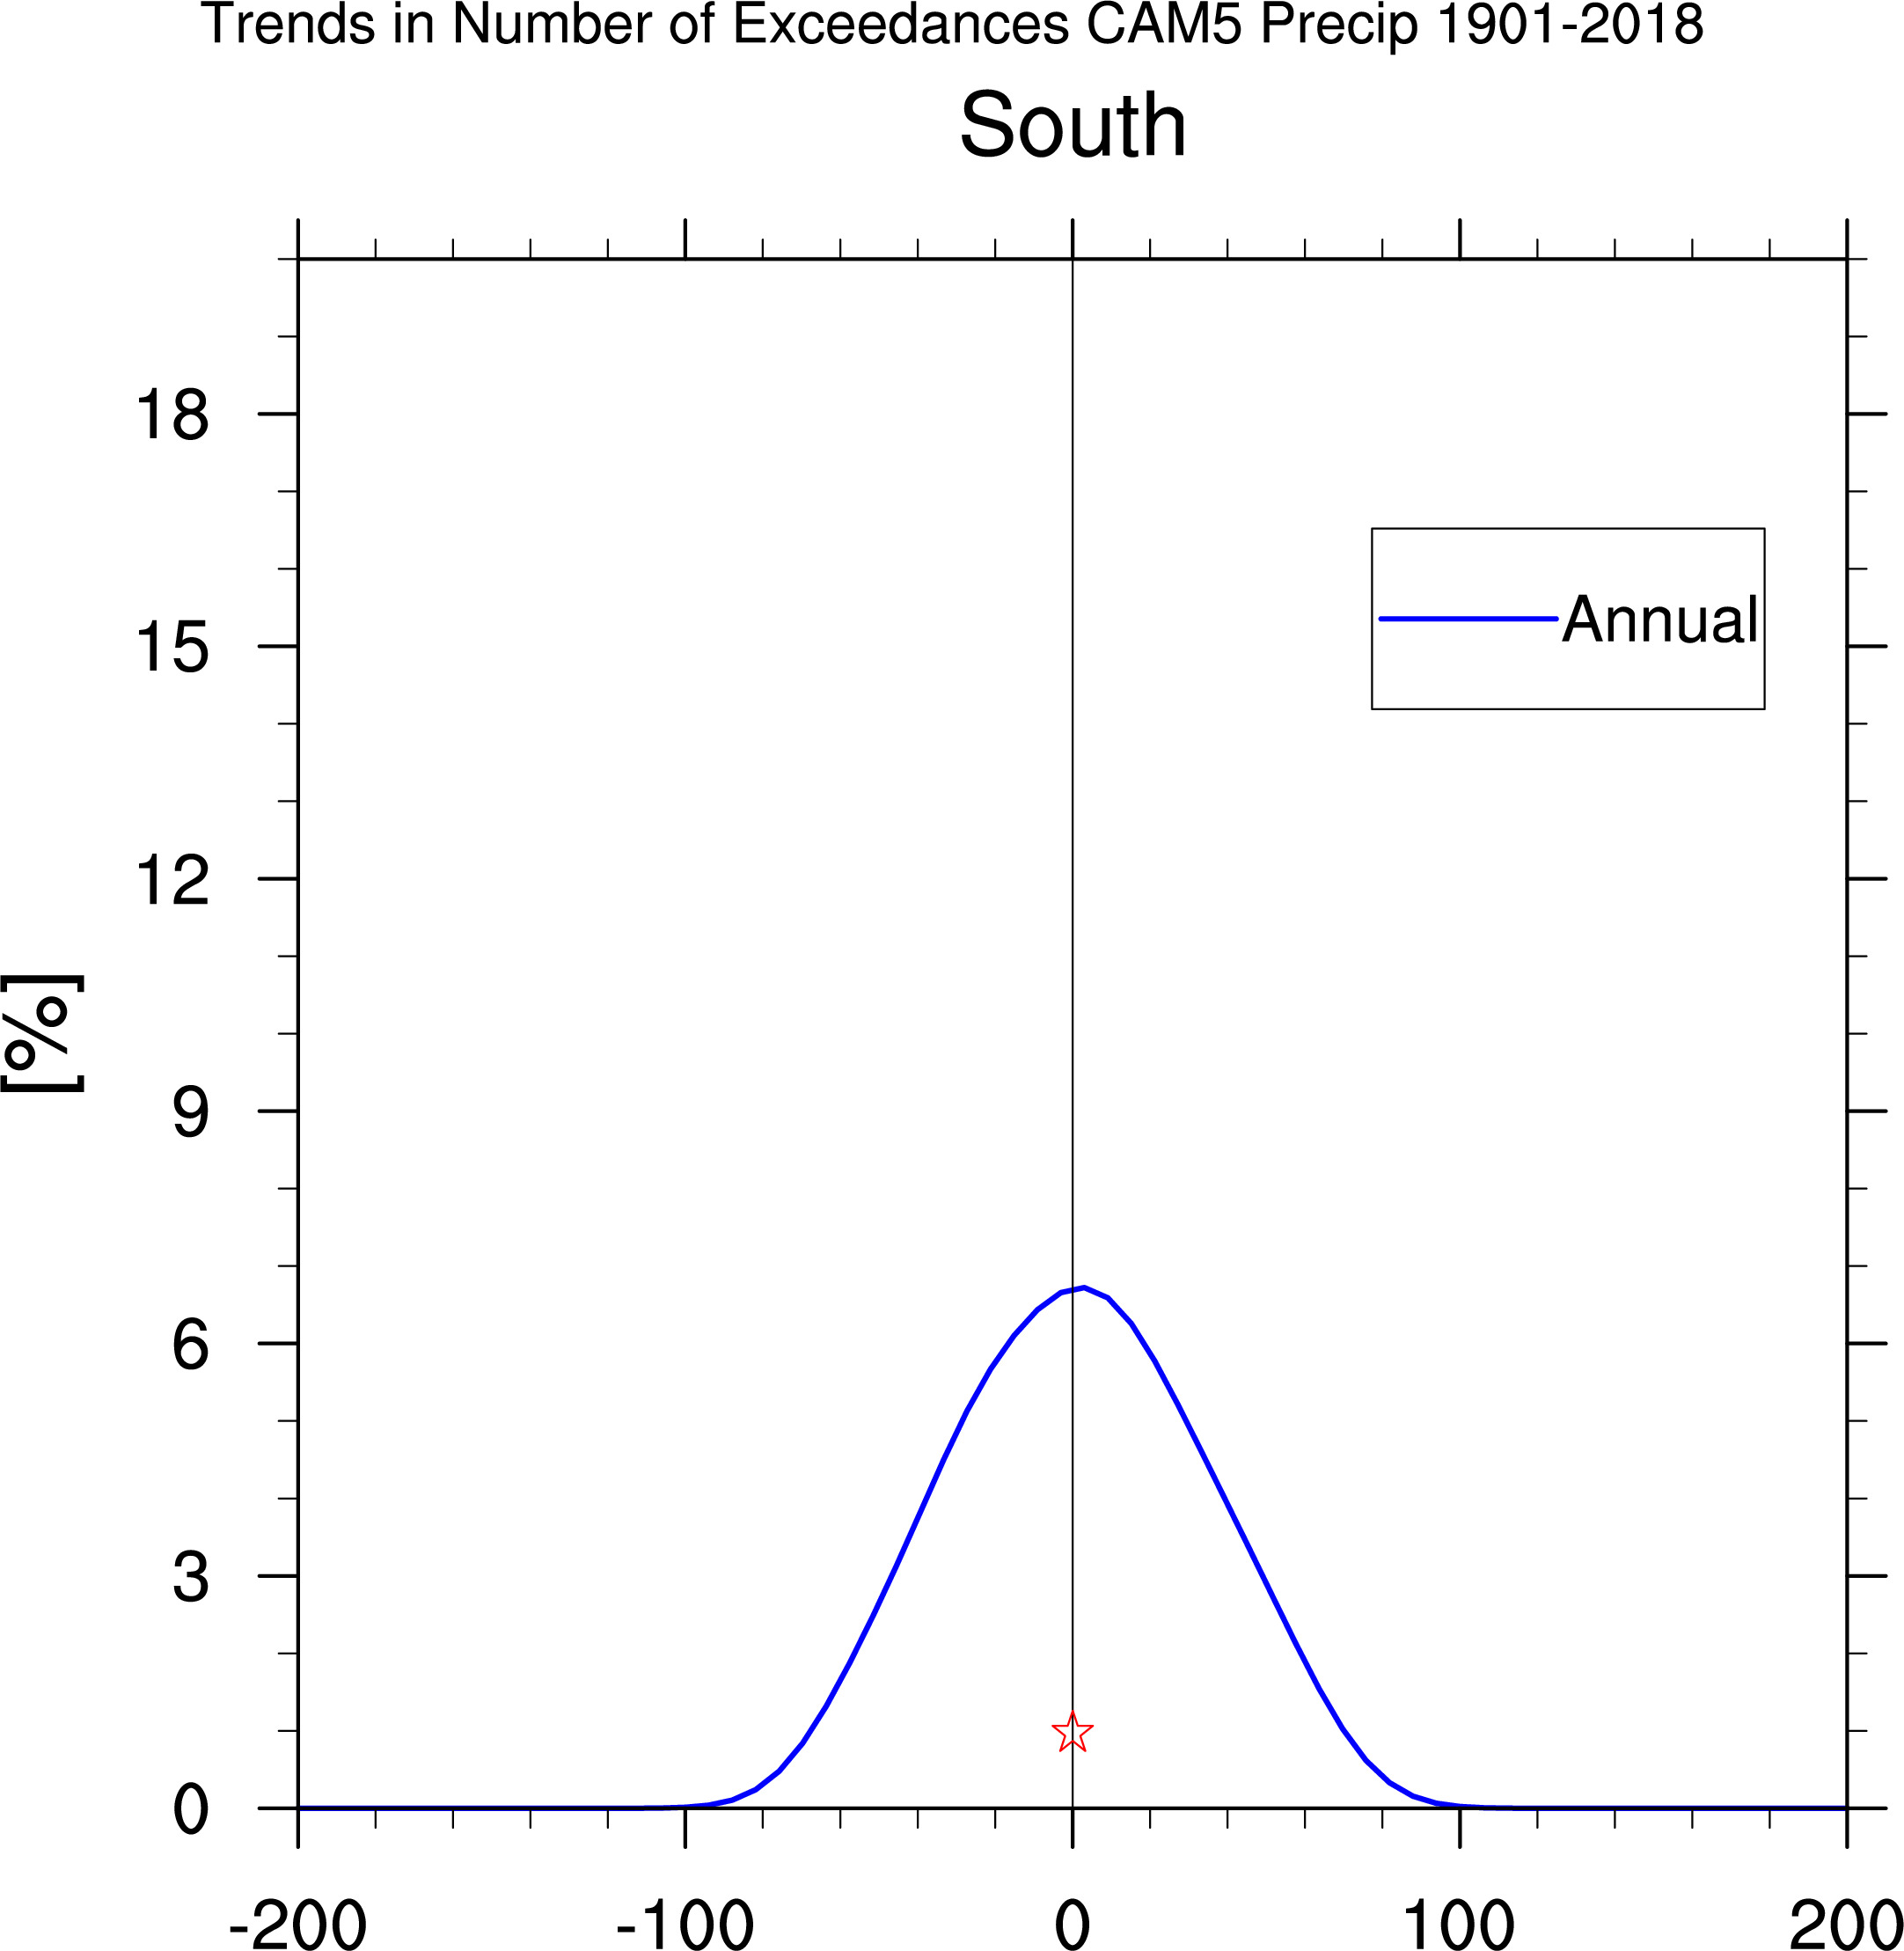
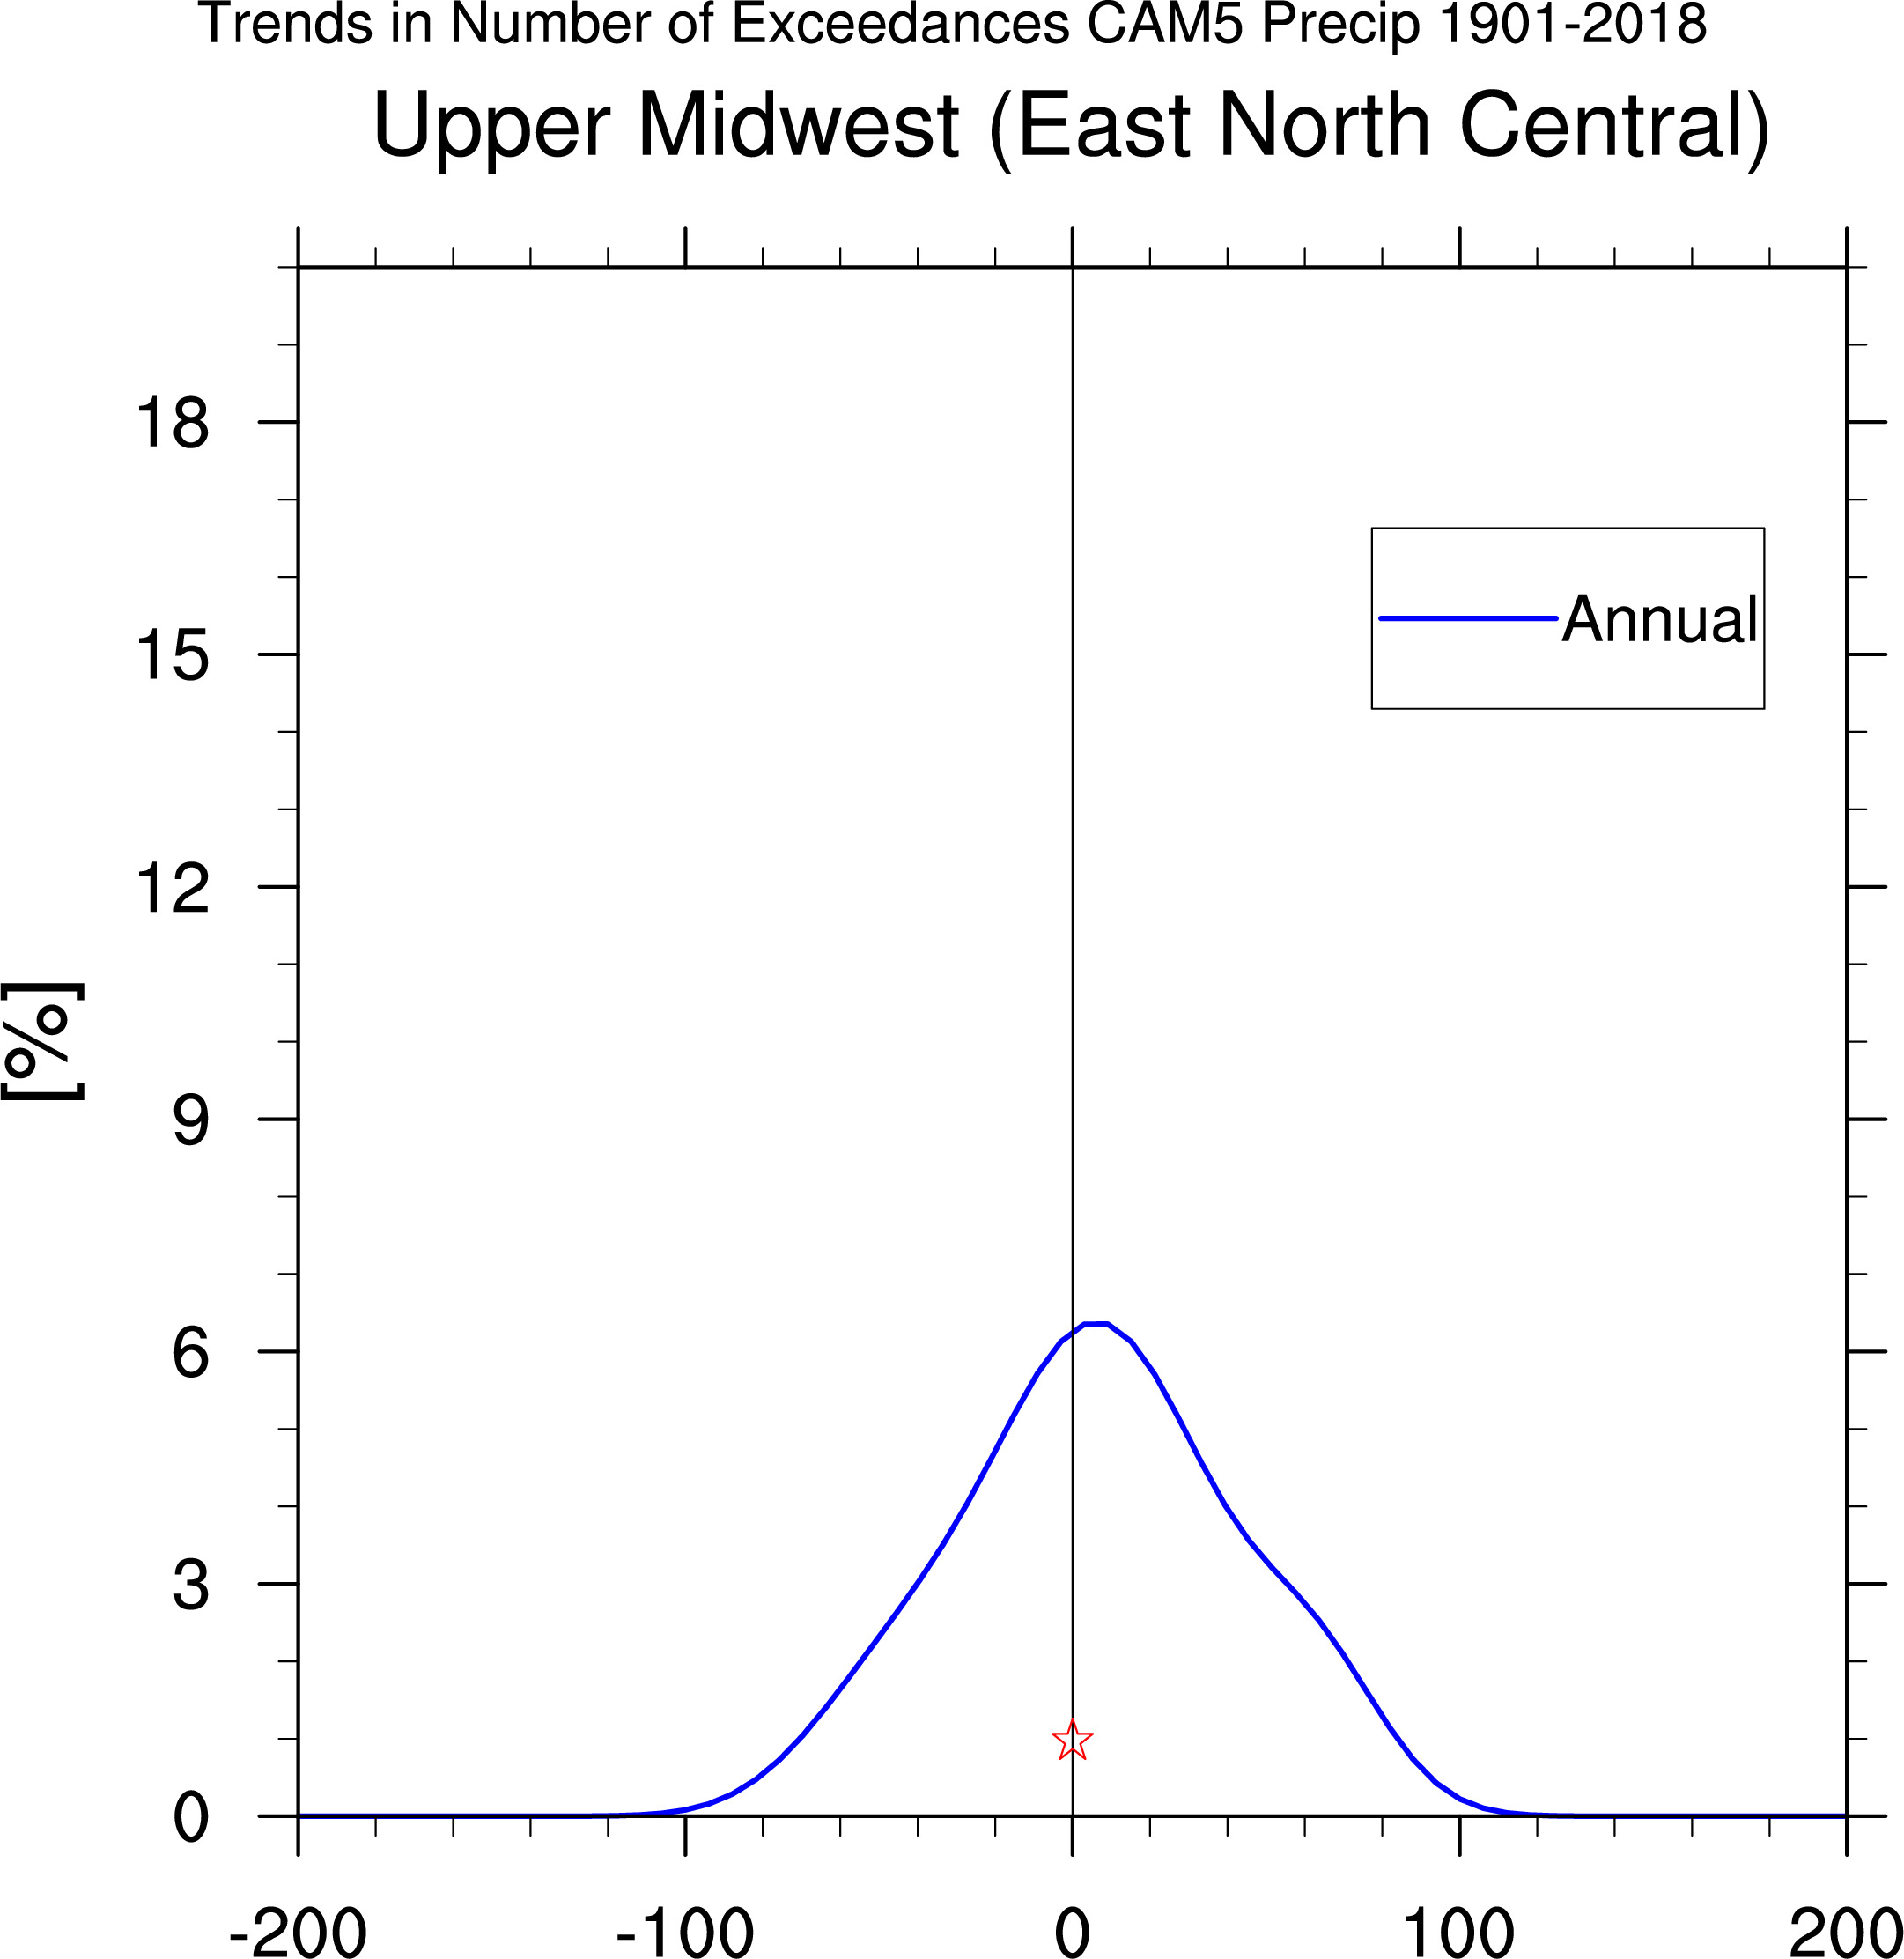
Trends of exceedances computed for each run (1o x 1o lat-lon grid) , 1901-2018:
heavy blue line are 40 CAM5 trends, red star is station data