3.2 Subseasonal variations in tropical convection and predictability of California rainfall
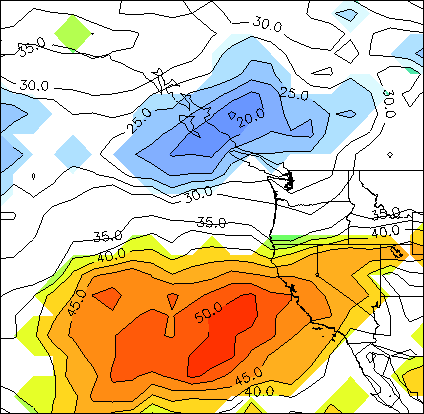
Figure 3.2 demonstrates that much of the LIM skill in the extratropics arises from its ability to predict tropical heating variations. Operational models are notoriously poor at this. This has implications for predictions of extratropical rainfall: for example, rainfall along the west coast of North America is known to be influenced by subseasonal tropical heating. This suggests that operational precipitation forecasts over North America could be improved, particularly in Week 2-3 range, by using statistical methods to augment the numerical product. CDC scientists have obtained a conservative lower bound on the potential improvement through a statistical prediction model of weekly precipitation over western North America in winter.
The model is based on Canonical Correlation Analysis (CCA), with tropical Outgoing Longwave Radiation (OLR) anomalies as the predictor and NCEP Reanalysis precipitation over the eastern Pacific and western North America as the predictand. A single CCA mode accounts for most of the predictable signal. The rank correlation of this mode and observed rainfall anomalies over Southern California over a 25-winter period is 0.2 for a two-week lag, which is comparable to the correlation between a weekly ENSO index and weekly rainfall in this region. Figure 3.5 shows that this corresponds to a 50% increase above the climatological risk (33%) of above-normal rainfall in California when the projection of tropical OLR on the leading CCA mode two weeks earlier is high, i.e. in the upper quintile of its distribution.

The leading CCA mode represents suppressed convection over the equatorial Indian Ocean and enhanced convection east of the dateline (Fig 3.6). Associated with this canonical tropical OLR anomaly pattern is the development of upper tropospheric westerly wind anomalies near 30N in the eastern Pacific (not shown). Synoptic-scale weather systems are steered farther east toward California by these enhanced westerlies.

An analysis of four years of operational Week 2 ensemble forecasts indicates that the skill of this statistical model is comparable to that of the operational ensemble mean, just like the LIM forecasts discussed earlier (see Fig. 3.4). Since by Week 2 the operational forecast model has lost its ability to represent subseasonal tropical heating variability, the statistical model provides essentially independent guidance to the forecaster. The fact that the skill of the two models is comparable suggests a significant potential for improvement of the operational Week 2 precipitation forecasts. We are investigating ways of optimally combining the numerical and statistical forecasts. This requires estimating the covariances of the ensemble mean forecast errors and observed tropical heating variability. Since the tropical convective events associated with predictability on this scale occur only about once or twice a season, a long (20+ year) record of numerical forecasts with a frozen model is needed to estimate the required forecast error statistics. Work is underway at CDC to create such a retrospective forecast database.