5.2 Modeling studies of fundamental ocean processes
From the various atmospheric GCM experiments described above, two aspects of tropical ocean change in the 20th Century have been implicated as forcing observed atmospheric change; i) the warming of the warm pool region and ii) the nonstationarity of the ENSO time series. Our research on fundamental ocean processes leads to the hypothesis that these two oceanic changes are themselves coupled, and in particular that the recent increase in El Niño amplitude is consistent with the increase in warm pool temperature.
5.2.1 Decadal ENSO variability and the role of warm pool SST
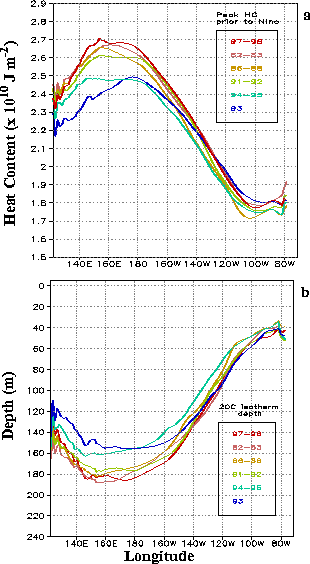
From detailed analysis of the 1986-87 El Niño event, we find that El Niño represents a mechanism by which the equatorial Pacific transports heat poleward, a result subsequently confirmed from a more extended study using NCEP data for the last 20 years. In particular, a systematic relationship between the ocean heat content in the western Pacific and the magnitude of El Niño warming was diagnosed for six events since 1980-the higher the heat content in the western Pacific, the stronger the subsequent El Niño warming (Fig. 5.7, top). The occurrence of warm pool heat content maxima, at which time the zonal cross sections of Fig. 5.7 were made, precede the maxima in Niño 3 SST anomalies by 12-24 months.

Our interpretation is that higher heat content in the western Pacific is achieved through a deepening of the local thermocline, thus linking the heat content in the western Pacific to the potential energy of the ocean and thereby with the stability of the coupled ocean-atmosphere system (Fig. 5.7, bottom). As warm-pool SST initially increases, the zonal SST contrast also increases, strengthening the trade winds. The stronger Walker circulation then interacts with clouds and water vapor, allowing more solar radiation to reach the ocean's surface over the east Pacific equatorial cold-tongue, and at the same time, reducing the surface evaporative cooling over that region. This is so because the impact of change in the gradient term of the latent heat flux formula exceeds the impact of increased wind speed. Through non-local ocean wave dynamics and transports, heat content increases in the equatorial upper ocean of the western Pacific warm pool. The resulting steeper tilt of the equatorial thermocline is hypothesized to destabilize the coupled system which is followed by energy release through a stronger El Niño.
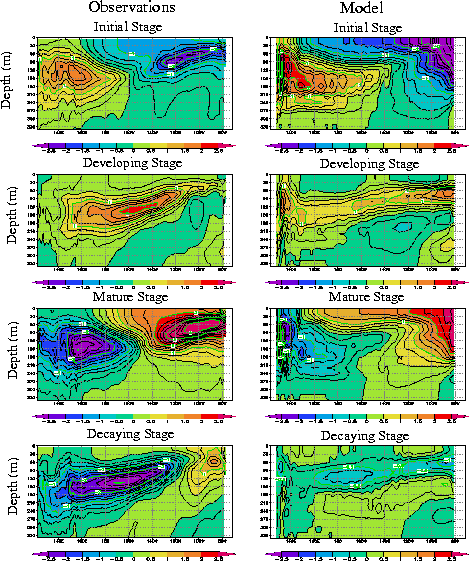
To test this hypothesis, we constructed a coupled model. The atmospheric model is statistical, with the equatorial surface winds proportional to the zonal SST gradients. The ocean component is a primitive equation model and therefore explicitly calculates the heat budget of the entire equatorial upper ocean. The model produces ENSO-like variations. The evolution of the subsurface ocean temperature over the life cycle of the model El Niño resembles that of observations (Fig. 5.8). In response to an increase in warm pool SST, the model has a stronger El Niño. Similar to the observational results, this simple model shows that an increase in warm pool SST strengthens the zonal SST contrast during ENSO's cold phase, which leads to an effective increase in the upper ocean heat content in the warm pool. Stronger El Niño warming then follows, which acts as a poleward heat pump. Of course, other processes can operate to increase warm pool SSTs. In regard to the observed recent climate change (see Fig. 5.1), it is reasonable that the warm pool has increased due to local radiative forcing related to the increase in anthropogenic gases. It is hypothesized that this externally forced change may be influencing the statistics of ENSO through the mechanisms described above.

5.2.2 North Pacific decadal ocean variability and the role of the tropics
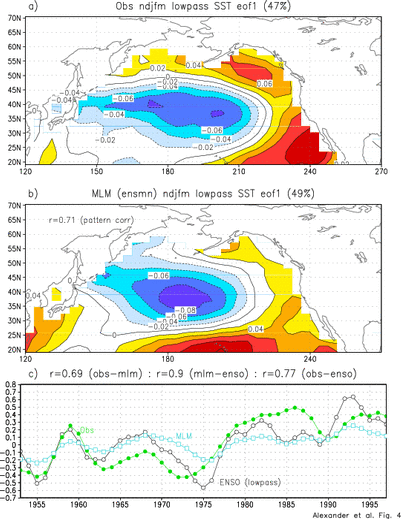
As mentioned earlier, the time series of the ENSO index is correlated with that of North Pacific SSTs (see Fig. 5.1), despite their different time scales of variation. This reflects in part the well-known fact that ENSO influences the North Pacific circulation, which in turn forces North Pacific SSTs, on interannual time scales. The question we have pursued is to what extent this atmospheric bridge between the tropics and extratropics contributes to the decadal variability over the North Pacific, including the Pacific Decadal Oscillation? We have addressed this question by comparing the observed and simulated leading pattern (EOF 1) and associated principal component time series (PC) of wintertime North Pacific decadal SST variability (Fig. 5.9). The model results are obtained from the ensemble average of 16 50-year GFDL R30 AGCM simulations in which observed SSTs are specified in the tropical Pacific over the period 1950-1999 and a mixed layer model (MLM) is coupled to the AGCM elsewhere over the global oceans. The EOFs are based on the monthly SST anomalies that were first low-pass filtered to retain periods greater than ~10 years and then the filtered values from November to March were averaged together. The observed and MLM EOFs resemble each other in several respects: they both explain about half of the variance, and they are relatively well correlated in space and time, with a spatial (temporal) correlation of 0.71 (0.69). The patterns in Fig. 5.9 are very similar to those based on unfiltered data which has conventionally been used to define the PDO. The observed and simulated PCs are well correlated with the filtered ENSO index time series, with correlation values of 0.77 and 0.90, respectively. In addition, maps of SST differences centered on 1976 (e.g., 1977-1988 minus 1970-1976, and 1977-1998 minus 1951-1976; not shown) indicate that the "abrupt climate transition" in the model and observations are similar and resemble the leading EOF but the amplitude of the differences is approximately half as large in the MLM. Overall, our model results suggest that a significant fraction of the variance of the dominant pattern of low frequency SST variability in the North Pacific is associated with the atmospheric bridge.

5.2.3 Subduction and Rossby wave dynamics: mechanisms for decadal ocean variability
Dynamic ocean processes likely play a fundamental role in climate variability on decadal timescales. Rossby wave propagation can introduce multi-year delays in the oceanic response to changes in the atmospheric forcing. Subduction, where surface waters enter and flow within the permanent pycnocline, provide a link between the extratropical and tropical oceans over an ~8 year period. It has been conjectured that when the subducted anomalies reach the equator, they alter the equatorial SSTs and affect the North Pacific Ocean via the atmospheric bridge, completing a circuit that enables decadal oscillations. CDC has been involved in observational and modeling studies that examine subduction and Rossby waves in the Pacific Ocean.
The standard deviation of the depth of the 25.5  isopycnal
surface, obtained from a global OGCM forced by observed surface
fluxes, indicates that there are three major centers of variability,
including: i) the Kuroshio region (30N, 160E), ii) along
the outcrop line at 35N between 180-140W, and iii) the tropics
between 10N-15N. The variability in the Kuroshio region reflects
changes in the ocean thermal structure resulting from the basin-wide
changes in the strength of the westerly winds that occurred in the
late 1970s and late 1980s. The thermocline changes lag changes in the
basin-wide wind stress curl forcing by 4-5 years, consistent with the
timescale of oceanic adjustment through Rossby wave propagation. The
second center of variability is associated with subduction, where it
has been proposed that thermal anomalies produced at the surface
primarily by anomalous heat fluxes, propagate equatorward along
isopycnals by the mean currents. Analyses of the OGCM and observations
has allowed us to track thermal anomalies from their source region
25N-35N, 140W-170W southwestward to ~18N over a period of ~8
years. South of this latitude thermocline variability appears to be
driven by local wind forcing.
isopycnal
surface, obtained from a global OGCM forced by observed surface
fluxes, indicates that there are three major centers of variability,
including: i) the Kuroshio region (30N, 160E), ii) along
the outcrop line at 35N between 180-140W, and iii) the tropics
between 10N-15N. The variability in the Kuroshio region reflects
changes in the ocean thermal structure resulting from the basin-wide
changes in the strength of the westerly winds that occurred in the
late 1970s and late 1980s. The thermocline changes lag changes in the
basin-wide wind stress curl forcing by 4-5 years, consistent with the
timescale of oceanic adjustment through Rossby wave propagation. The
second center of variability is associated with subduction, where it
has been proposed that thermal anomalies produced at the surface
primarily by anomalous heat fluxes, propagate equatorward along
isopycnals by the mean currents. Analyses of the OGCM and observations
has allowed us to track thermal anomalies from their source region
25N-35N, 140W-170W southwestward to ~18N over a period of ~8
years. South of this latitude thermocline variability appears to be
driven by local wind forcing.
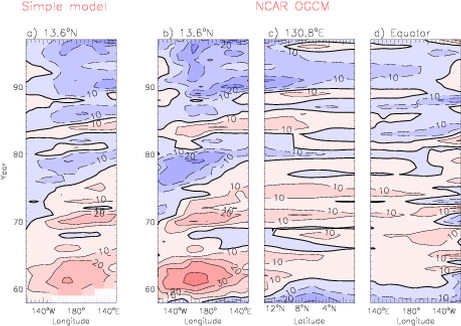
The isopycnal depth changes in the subtropics of both hemispheres are associated with large thermocline temperature variations in both the OGCM and observations. We have examined the variability at 10N-15N by comparing the OGCM results with those obtained from a simple Rossby wave model forced by the same winds used in the OGCM simulation. The evolution of thermocline depth is remarkably similar in the simple model and OGCM (Fig. 5.10), indicating that a substantial portion of the variability in the 10-15N latitude band results from wind-forced baroclinic Rossby waves. Spectra and Hövmoller diagrams based on low-pass filtered OGCM output indicate that most of the thermocline variability occurs at periods longer than ~7 years. East of the dateline, subtropical Ekman pumping anomalies exhibit variability over decadal periods and propagate westward at speeds close to the phase speed of first baroclinic mode Rossby waves. Thus, the spectral characteristics of the forcing may be responsible for the enhanced oceanic response at low frequencies. The thermocline signal that propagates across the basin at 13N, moves southward along the western boundary and then eastward along the equator (see Fig. 5.10). The low-frequency variations of the thermocline depth along the equator may modulate the amplitude and period of ENSO events on decadal timescales, an outcome we plan to explore in the near future.
