5.3 Empirical studies of decadal variability and climate change
5.3.1 Observed change in the global hydrologic system
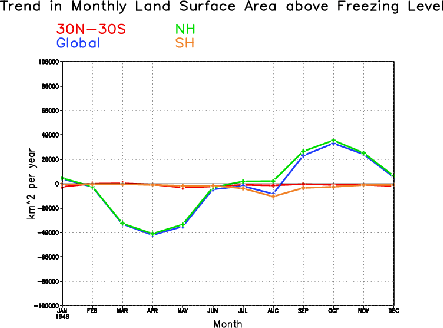
Interest in the potential impacts of climatic change in high elevation regions has grown in the past decade, as information from glacial monitoring sites and from fieldwork has demonstrated that significant melting and glacial recession has been occurring. Fifty-year trends in near-surface temperature (1948-2000) averaged over 5 different mountainous regions are similar in magnitude to global temperature trends (+0.4-0.6 C/50 yrs). We have been studying the relation between such behavior and changes in the land surface area located above the freezing level. The freezing level surface (FLS) is defined to be the 0C isotherm, and the land area inside the roughly 2.5 lat/lon grid boxes of the NCEP/NCAR Reanalysis data that exceeds the FLS height was calculated monthly during 1948-2000. The most striking result is the strong seasonal dependency of trend in the land surface area above the freezing level, with largest decreases in spring consistent with a warming, but nearly equal increases in fall indicative of cooling (Fig. 5.11). Overall, the annual change reveals a small net decrease.

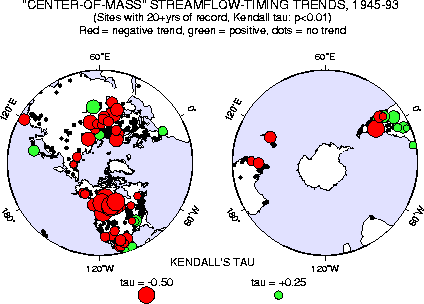
We are studying the impacts of climate change on a number of natural systems, including alpine hydrology and ecology, and the relevance for water resources management. A prominent feature of low frequency variability in streamflow has been the systematic change in timing of peak runoff over most of the globe since 1945 (Fig. 5.12). Peak flows are occurring earlier now than a half-century ago. This is particularly pronounced in river basins with a high fraction of their streamflow supplied by snowmelt, and reflects the springtime warming trend in these regions.

5.3.2 Secular change in North Pacific cyclone activity
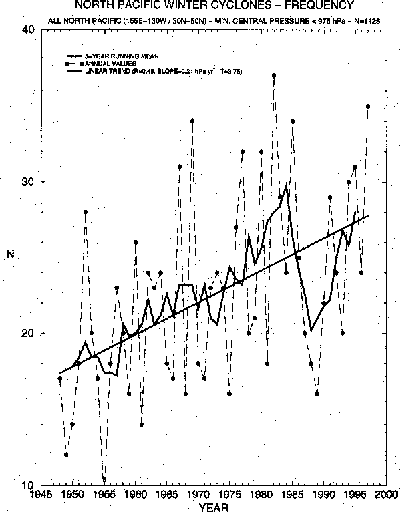
The picture emerging from our GCM analyses of wintertime atmospheric trends since 1950 is of a relationship between changes in tropical SSTs and trend patterns in zonally averaged flow and planetary waves, in the sense that the former is forcing the latter. Given that the large scale circulation controls the statistics of sub-seasonal variations, such phenomena as the storm tracks and the transients that define them should also exhibit secular change. As one example, we have documented an increase in the frequency and strength of intense winter cyclones (minimum central pressure lower than 975 hPa) in the North Pacific Ocean since 1948 (Fig. 5.13). The time series of December-March averaged counts of cyclones having a minimum pressure below 975 mb shows a substantial increase since 1948.

Associated with these changes are upward trends in extreme surface wind speeds between 25-40N, and an increase in significant wave heights. It is surmised that the cooling trend of North Pacific SSTs since 1950 (see Fig. 5.1) has in part been driven by the anomalous latent heat fluxes associated with this enhanced storminess. We also postulate that increasing sea surface temperatures in the western Pacific warm pool region (see Fig. 5.1) is a cause of the observed cyclone changes. The NCAR CCM3 simulations give some support for this premise, insofar as changes in the western Pacific warm pool and ENSO amplitude on decadal-scales impact the midlatitude stationary waves via teleconnection processes.
5.3.3 Decadal variations in summertime monsoons
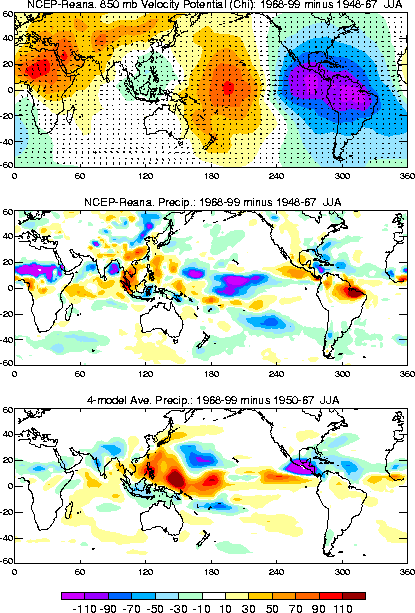
Large summertime changes have occurred in tropical monsoon circulations since 1948 that are no less dramatic than the aforementioned low frequency variations in the wintertime ocean/atmosphere system. We already alluded to the secular change in ENSO's interannual impacts on Indian summertime monsoon rainfall. We have examined the mean change in the summertime monsoons since 1948 using the NCAR/NCEP re-analysis circulation data, together with station rainfall data where available. A prominent change has occurred in the divergent mass circulation describing the summer monsoons of both western and eastern hemispheres (Fig. 5.14, top). The maxima in the change map represent roughly 20 percent of the climatological mean. Station rainfall data allow us to verify that drying has indeed occurred over the Sahel in recent decades, consistent with the trend toward strong low level divergence (red shading) and implied sinking motion in the re-analysis data. We have yet to establish the realism of the re-analysis changes in the other summertime monsoons of Asia and the Americas, and a key hurdle in making sense of this picture is determining the fidelity in the re-analysis data itself, which is known to be biased by some spurious trends during 1948-2000.

To be sure, the re-analysis mass circulation changes are consistent with the re-analysis rainfall changes (compare top and middle panels of Fig. 5.14, and it is the origin of the latter which requires an explanation. We have begun to pursue the possibility that such apparent tropical-wide, low frequency changes in the atmosphere are reacting to a lower boundary SST change, perhaps akin to the wintertime change in tropical forcing discussed in earlier sections. The lower panel of Fig. 5.14 shows the change in rainfall as derived from a multi-GCM ensemble of AMIP-style simulations of 1950-1999. Rainfall has increased in the simulations over oceanic regions (red shading), especially the warm pool of the western Pacific and the Indian Ocean. This is in broad agreement with the re-analysis. Note also that the general drying (blue shading) over North Africa, Indonesia, and the Caribbean in re-analysis data emerges as a response pattern to SST. Our assessment is not complete, and we are pursuing various hypotheses motivated from our empirical study.